department of conservation, conservation services
TRANSCRIPT

Department of Conservation, Conservation Services
Programme project BCBC2020-08: Fish shoal
dynamics in North-Eastern New Zealand
Final report on fish shoal sampling conducted October
2020- April 2021
1 | P a g e
This report has been prepared by Chris Gaskin and Kerry Lukies (both Northern NZ Seabird Trust)
and with Prof. Andrew Jeffs (Institute of Marine Science, University of Auckland) for the
Department of Conservation (DOC), Conservation Services Programme (CSP) and managed by
DOC marine science advisor Dr. Karen Middlemiss.
The Addendum: Nutritional Analysis of Seabird Prey Species from the Hauraki Gulf to this report
has been prepared by Dr Stefan Spreitzenbarth with Prof. Andrew Jeffs (Institute of Marine
Science, University of Auckland) and Lily Kozmian-Ledward (Sea Lily Ltd.)
August 2021
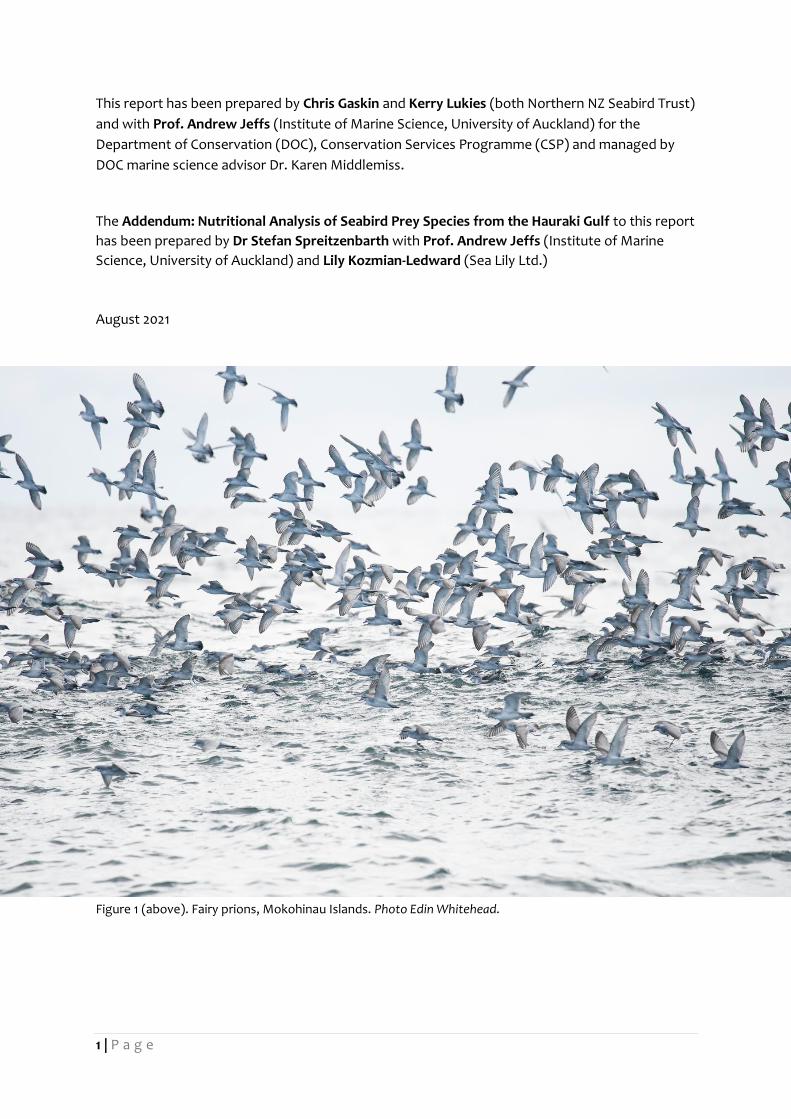
Cover image. Trevally school at the surface with fairy prions. Photo Edin Whitehead.
Figure 1 (above). Fairy prions, Mokohinau Islands. Photo Edin Whitehead.
2 | P a g e
SUMMARY The aim of this and earlier projects is to better understand the relationship between the diet of
surface-foraging seabirds, and what prey items are being made available from fish shoal events
(workups) so that we can understand the mechanisms changing the distribution and/or
abundance of workups and how that might affect seabird populations.
Survey trips within the Hauraki Gulf area for this contract (DOC CSP BCBC2020-08) are being
conducted at locations within the general area of Marsden Point/Whangarei Heads >
Marotere/Chickens Islands > Mokohinau Islands > Hauturu/Little Barrier > Bream Tail > Marsden
Point during the period October 2020 - April 2021 qualified as spring (Oct-Nov), early summer
(Dec), late summer (Jan-Feb) and autumn (Mar-Apr).
After locating a fish shoal, variables recorded included the GPS location, sea-surface temperature,
weather conditions and bird species seen foraging. Prey samples were collected using surface
trawls (<2m) and preserved where the fish shoals were encountered, and control samples in
similar regions where fish shoals were not visible were being collected. It is accepted that
presence/absence of shoals is one of the most challenging aspects of sample collection and while
preferred, repeat sampling is not always possible. In a selection of fish shoals, individual fish were
caught for stomach analysis. Using underwater videography and visual observations of fish at the
sea-surface species involved in shoal formation (mixed and/or single species) were identified.
Six field trips (all single day) were made October 2020 to April 2021. COVID-19 restrictions, vessel
unavailability and weather conditions meant that no trip was undertaken in March 2021. Two trips
were made in April.
Please note: The zooplankton and fish samples collected under this contract are being stored at
the Leigh Marine Laboratory, University of Auckland in and at 3°C (zooplankton in 100% ethanol)
and -18°C (fish tissue samples) for future analysis (e.g., quantifying species richness and
abundance of seabird prey specimens (% mass per sampling period) and will be undertaken
together with a review of video footage, as funding permits. This report covers sample
collection details and behavioural observations only.
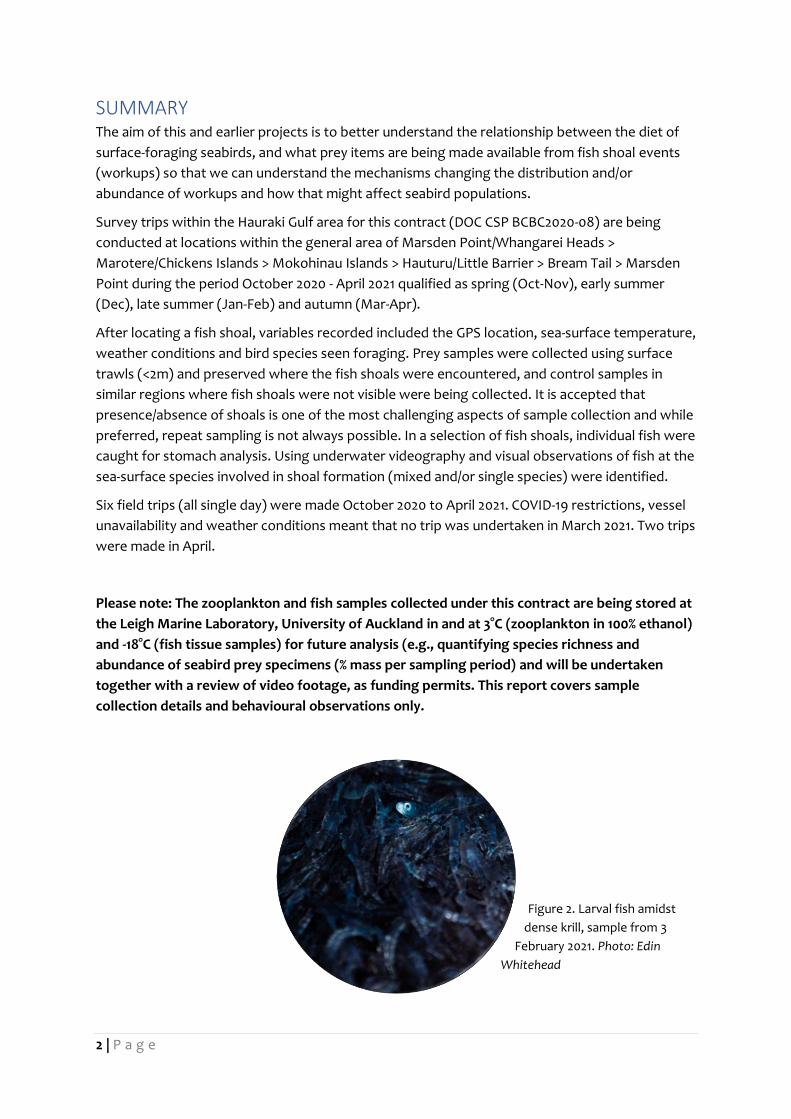
Figure 2. Larval fish amidst
dense krill, sample from 3
February 2021. Photo: Edin
Whitehead

3 | P a g e
CONTENTS
1 INTRODUCTION 4
1.1 Background 4
1.2 Seabird Feeding Associations 4
1.3 Study Area 4
1.4 COVID-19 restrictions 5
2 METHODS 5
2.1 Field Methods 5
3 RESULTS 8
3.1 Zooplankton Sampling 8
3.2 Fish Sampling 11
3.3 Fish School Observations
3.4 Seabird Observations 15
3.5 Marine Megafauna Observations 19
3.6 Use of Floating/Drop Camera Rigs 20
4 DISCUSSION 22
4.1 The Change to a Set Route 22
4.2 Tarapunga Red-billed Gull 23
4.3 Prospect of scaling back the Marsden Point Oil Refinery 23
4.4 Sea Change and Marine Protection Proposals 23
4.4 Looking Ahead - Recommendation 25
5 ACKNOWLEDGEMENTS 26
6 REFERENCES 26
Addendum: Nutritional Analysis of Seabird Prey Species from
the Hauraki Gulf
30
4 | P a g e
1 INTRODUCTION
1.1 Background
A notable feature of north-eastern North Island waters are the large numbers of seabirds feeding
in “workups” – multi-species feeding aggregations containing zooplankton and fish. There is a
need to understand the processes that drive workup formation and dynamics as many seabird
species, predominantly red-billed gull (Larus novaehollandiae scopulinus), white-fronted tern
(Sterna striata), Australasian gannet (Morus serrator), fairy prion (Pachyptila turtur), Buller’s
shearwater (Ardenna (Puffinus) bulleri), and fluttering shearwater (Puffinus gavia), are potentially
dependent on shoaling fish to drive smaller prey to the sea surface, making them more accessible
to seabirds as a food source. There is poor knowledge of both the relationship between the diet
of surface-foraging seabirds, and what prey items are being made available to seabirds from
workups. This is limiting our understanding of the mechanisms through which any changes in the
distribution and/or abundance of workups may be driving seabird population changes
(population status and annual breeding success). For some seabird species that interact with
workups, recent population abundance data is incomplete or unknown which limits our
assessment of population trends over time (Gaskin et al 2019).
North-eastern North Island waters also support extensive purse-seine fisheries, due to the
presence of the large surface shoals of fish, which are also an important part of the food web for
seabirds. Fish species targeted by these fisheries predominantly include kahawai (Arripis trutta),
trevally (Pseudocaranx georgianus), skipjack tuna (Katsuwonus pelamis), jack mackerel (Trachurus
declivis), blue mackerel (Scomber australasicus), saury (Scomberesox saurus), pilchard (Sardinops
sagax) and anchovy (Engraulis australis). By targeting fish species which are also part of workups
utilised by various seabird species; purse-seine fisheries potentially negatively impact these
seabird populations. However, the degree to which this may occur is unknown, therefore it is
important that we better understand the relationship between seabird population trends and
changes in abundance and distribution of fish shoals. Note that in this report, fish ‘shoal’ and
‘school’ are used somewhat interchangeably. Technically, the term ‘shoal’ refers to a loose
aggregation of fish, sometimes comprising different species, whereas a ‘school’ is typically a
group of fish of the same species swimming together in synchrony (Delcourt & Poncin, 2012).
1.2 Seabird Feeding Associations
Zooplankton occupy a key position in the pelagic food web, transferring the organic energy
produced by phytoplankton to higher trophic levels such as fish, seabirds, and baleen whales
(Harris et al., 2000; Frederiksen et. al., 2006). Zooplankton abundance and diversity are
determined predominantly by oceanographic (e.g., temperature, upwelling zones) and biological
factors (e.g., predation) which result in a large amount of spatial and temporal variability (Zeldis
& Willis, 2015). The wider Hauraki Gulf area is a highly productive marine ecosystem whose
primary productivity is influenced by both wind and current driven circulation. A summary of
oceanography of the region is provided in the earlier report for this contract (Taylor & Gaskin
2020).
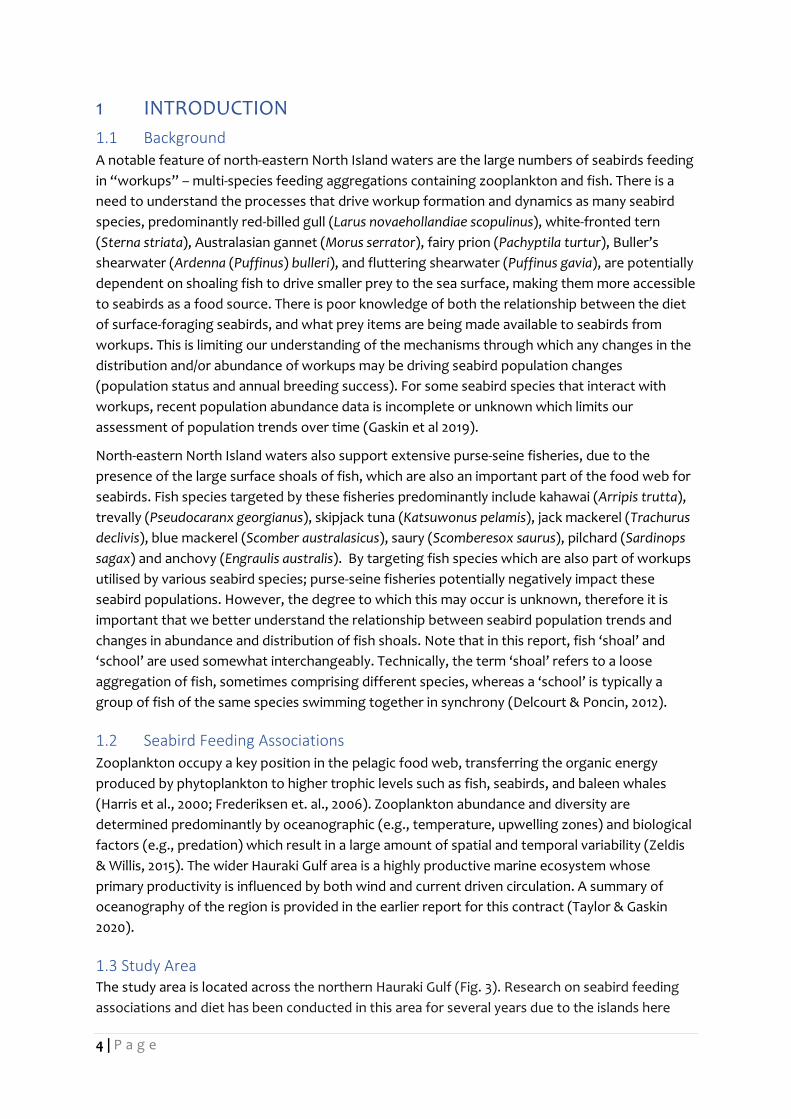
1.3 Study Area The study area is located across the northern Hauraki Gulf (Fig. 3). Research on seabird feeding
associations and diet has been conducted in this area for several years due to the islands here
5 | P a g e
being important seabird breeding areas for 27 species which breed and forage in the surrounding
waters (Gaskin & Rayner 2013; Forest & Bird 2014). Sampling locations in the current project
include several of the sites where research work was conducted in previous seasons (POP2017-
06, POP2019-02).
Figure 3. Outer (northern) Hauraki Gulf study area for 2020-2021 season with key locations.
1.4 Covid-19 restrictions Auckland shifting to Alert Level 3 on 28 February 2021 meant a proposed early March trip was cancelled due to the requirement for people on non-essential duties to ‘lock-down’ in their homes. By the time Alert Levels were dropped in March the boat charter we had been using was either unavailable or weather conditions discounted getting out on the water. Trips resumed in April 2021.
2 METHODS In general, the methodology adopted for this sampling season is based on that previously described in POP2019-02. However, some changes were adopted based on some of the recommended changes outlined in Kozmian-Ledward et al (2020). A major change has been to move from a general search for seabird activity over a wide area to following the same basic route with sampling stations determined by activity encountered while vessel cruising. This aimed to provide greater consistency in sampling methods and improve statistical rigour.
2.1 Field Methods To date, four fieldwork days have been conducted between 6 October 2020 and 3 February 2021.
Sampling, videography, and observations were conducted as follows:
6 | P a g e
• In general, a full suite of data for biological variables (zooplankton, fish, seabirds) was
made at each event to allow for full comparisons of all variables.
• The floating camera rig was deployed at sampling locations to ground-truth topside
observations of fishes.
• We also trialled a new rig with multiple cameras that could either be set to various depths
down the water column or dropped through the water column to record fish and other
activity beneath work up activity or at sampling locations.
• Oceanographic data recording – measurements of SST, salinity and water clarity were
taken at all sampling events.
• A flowmeter was used to for standardise the zooplankton sampling.
• Seabird data collection included primary species, secondary species, abundance, and
behaviours.
• Where possible multiple replicate zooplankton tows at each event were conducted to
greater account for characteristic zooplankton patchiness. However, working within a
single day and reasonable hours (0800-1800 hrs) the distances covered meant a limited
number of tows can be done.
• Control zooplankton tows were undertaken where possible within time constraints.
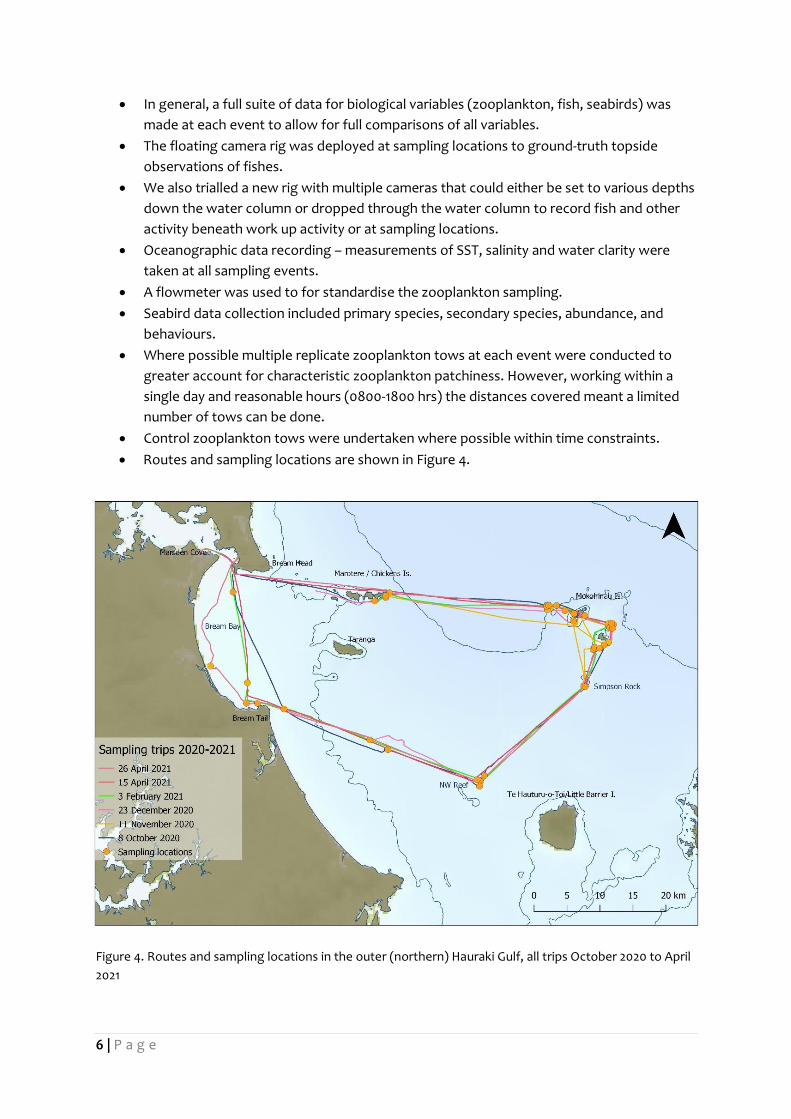
• Routes and sampling locations are shown in Figure 4.
Figure 4. Routes and sampling locations in the outer (northern) Hauraki Gulf, all trips October 2020 to April
2021

7 | P a g e
Figure 5-10. On-deck activity. Readying the plankton net for towing, and fishing for trevally or kahawai fr0m
school; record keeping; reading flowmeter; and topside photography; sieving sample; euphausiid extracted
from sample. Photos: Chris Gaskin and Edin Whitehead.

8 | P a g e
3 RESULTS
3.1 Zooplankton Sampling
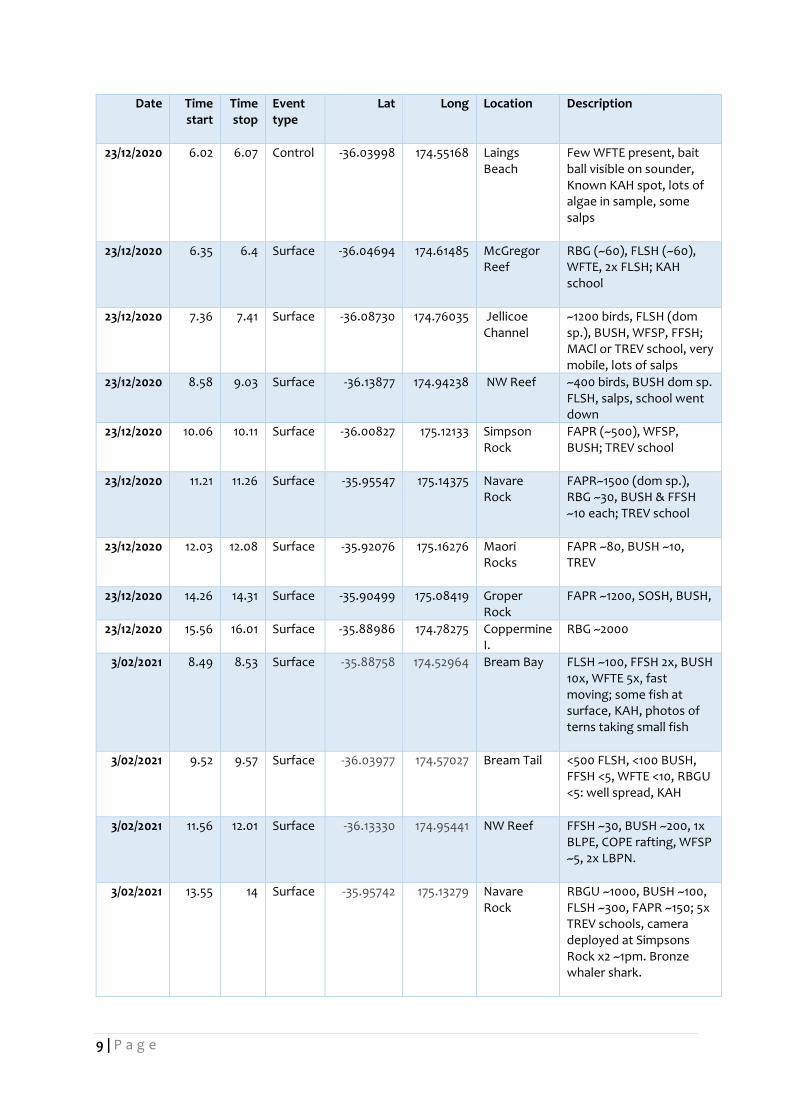
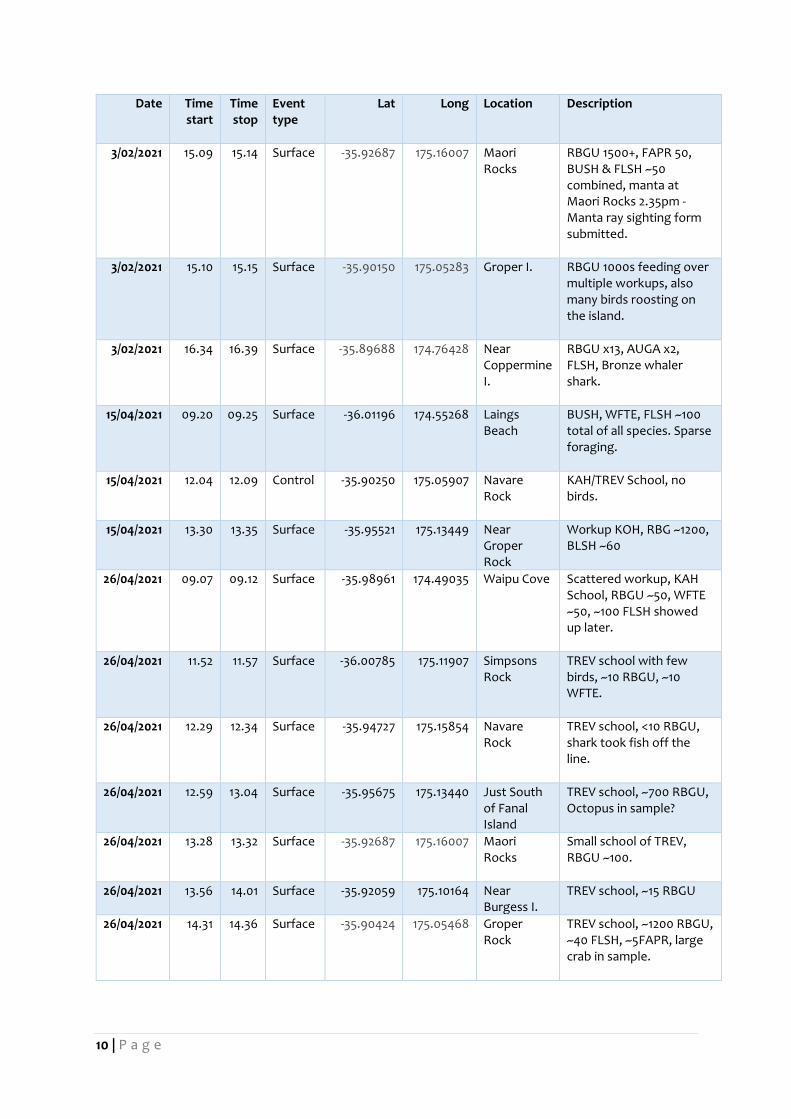
Table 1. Locations where sampling was conducted. Event type relates to fish/seabird activity and the nature
of the sampling procedure (either surface tow or control).
Date Time start
Time stop
Event type
Lat Long Location Description
6/10/2020 9.37 9.43 Current line
-35.88553 174.78914 E. of Coppermine I.
Fish - trevally, kahawai, humpback in vicinity, birds - BUSH, FAPR (dom sp.), RBGU, FLSH
6/10/2020 10.51 10.56 Surface -35.89826 175.06977 E of Groper I.
Birds only - FAPR 1000s (dom sp.), BUSH 100s, RBGU 50-100, WFTE <10, BBGU 1
6/10/2020 11.30 11.35 Surface -35.91125 175.11767 Sphinx Rocks
Fish - trevally, kahawai, humpback in vicinity, birds – 200-300 RBGU (dom sp.), c. 100 FAPR, BUSH, FLSH
6/10/2020 12.15 12.20 Surface -35.92242 175.16630 Maori Rocks
Birds only
6/10/2020 12.50 12.55 Surface -35.95067 175.15162 S. Fanal I. Fish - trevally, birds – , 100s FAPR (dom sp.), 10s BUSH, BBGU 1
6/10/2020 14.38 14.43 Control -36.14134 174.94788 NW Reef Nothing working, control sample
6/10/2020 15.00 15.05 Surface -36.14779 174.94655 NW Reef Fish - trevally, birds – 50-100 RBGU, WFSP, FAPR, FLSH
6/10/2020 15.55 6.00 Surface -36.10004 174.79118 Jellicoe Channel
Common dolphins, Birds – 100s Gannets (dom sp.), FFSH, SOSH, BUSH, FLSH
20/11/2020 14.07 14.12 Current line
-35.89178 174.7828 Coppermine I.
~500 RBGU (dom sp.) were foraging on arrival, sporadic foraging during sampling, 500m off Coppermine I.
20/11/2020 16.05 16.1 Surface -35.92751 175.16473 Maori Rocks
~1000 birds, FAPR (dom sp.), RBGU, Maori Rocks, Trevally, Kahawai, Koheru
21/11/2020 11.4 11.45 Surface -35.89835 175.05696 Groper I. Intermittent workup. ~1000 FAPR, FLSH, likely mackerel school
21/11/2020 14.14 14.19 Surface -35.91892 175.09888 S. Atihau I. FAPR (dom sp.), RBGU, Trevally school. Net cam not working
21/11/2020 15.04 15.09 Control -36.00776 175.11835 Simpson Rock
Simpsons Rock, no birds or fish present
21/11/2020 15.34 15.39 Surface -35.95419 175.13509 Navare Rock
FAPR (~1000), FFSH (<10)
9 | P a g e
Date Time start
Time stop
Event type
Lat Long Location Description
23/12/2020 6.02 6.07 Control -36.03998 174.55168 Laings Beach
Few WFTE present, bait ball visible on sounder, Known KAH spot, lots of algae in sample, some salps
23/12/2020 6.35 6.4 Surface -36.04694 174.61485 McGregor Reef
RBG (~60), FLSH (~60), WFTE, 2x FLSH; KAH school
23/12/2020 7.36 7.41 Surface -36.08730 174.76035 Jellicoe Channel
~1200 birds, FLSH (dom sp.), BUSH, WFSP, FFSH; MACl or TREV school, very mobile, lots of salps
23/12/2020 8.58 9.03 Surface -36.13877 174.94238 NW Reef ~400 birds, BUSH dom sp. FLSH, salps, school went down
23/12/2020 10.06 10.11 Surface -36.00827 175.12133 Simpson Rock
FAPR (~500), WFSP, BUSH; TREV school
23/12/2020 11.21 11.26 Surface -35.95547 175.14375 Navare Rock
FAPR~1500 (dom sp.), RBG ~30, BUSH & FFSH ~10 each; TREV school
23/12/2020 12.03 12.08 Surface -35.92076 175.16276 Maori Rocks
FAPR ~80, BUSH ~10, TREV
23/12/2020 14.26 14.31 Surface -35.90499 175.08419 Groper Rock
FAPR ~1200, SOSH, BUSH,
23/12/2020 15.56 16.01 Surface -35.88986 174.78275 Coppermine I.
RBG ~2000
3/02/2021 8.49 8.53 Surface -35.88758 174.52964 Bream Bay FLSH ~100, FFSH 2x, BUSH 10x, WFTE 5x, fast moving; some fish at surface, KAH, photos of terns taking small fish
3/02/2021 9.52 9.57 Surface -36.03977 174.57027 Bream Tail <500 FLSH, <100 BUSH, FFSH <5, WFTE <10, RBGU <5: well spread, KAH
3/02/2021 11.56 12.01 Surface -36.13330 174.95441 NW Reef FFSH ~30, BUSH ~200, 1x BLPE, COPE rafting, WFSP ~5, 2x LBPN.
3/02/2021 13.55 14 Surface -35.95742 175.13279 Navare Rock
RBGU ~1000, BUSH ~100, FLSH ~300, FAPR ~150; 5x TREV schools, camera deployed at Simpsons Rock x2 ~1pm. Bronze whaler shark.
10 | P a g e
Date Time start
Time stop
Event type
Lat Long Location Description
3/02/2021 15.09 15.14 Surface -35.92687 175.16007 Maori Rocks
RBGU 1500+, FAPR 50, BUSH & FLSH ~50 combined, manta at Maori Rocks 2.35pm - Manta ray sighting form submitted.
3/02/2021 15.10 15.15 Surface -35.90150 175.05283 Groper I. RBGU 1000s feeding over multiple workups, also many birds roosting on the island.
3/02/2021 16.34 16.39 Surface -35.89688 174.76428 Near Coppermine I.
RBGU x13, AUGA x2, FLSH, Bronze whaler shark.
15/04/2021 09.20 09.25 Surface -36.01196 174.55268 Laings Beach
BUSH, WFTE, FLSH ~100 total of all species. Sparse foraging.
15/04/2021 12.04 12.09 Control -35.90250 175.05907 Navare Rock
KAH/TREV School, no birds.
15/04/2021 13.30 13.35 Surface -35.95521 175.13449 Near Groper Rock
Workup KOH, RBG ~1200, BLSH ~60
26/04/2021 09.07 09.12 Surface -35.98961 174.49035 Waipu Cove Scattered workup, KAH School, RBGU ~50, WFTE ~50, ~100 FLSH showed up later.
26/04/2021 11.52 11.57 Surface -36.00785 175.11907 Simpsons Rock
TREV school with few birds, ~10 RBGU, ~10 WFTE.
26/04/2021 12.29 12.34 Surface -35.94727 175.15854 Navare Rock
TREV school, <10 RBGU, shark took fish off the line.
26/04/2021 12.59 13.04 Surface -35.95675 175.13440 Just South of Fanal Island
TREV school, ~700 RBGU, Octopus in sample?
26/04/2021 13.28 13.32 Surface -35.92687 175.16007 Maori Rocks
Small school of TREV, RBGU ~100.
26/04/2021 13.56 14.01 Surface -35.92059 175.10164 Near Burgess I.
TREV school, ~15 RBGU
26/04/2021 14.31 14.36 Surface -35.90424 175.05468 Groper Rock
TREV school, ~1200 RBGU, ~40 FLSH, ~5FAPR, large crab in sample.
11 | P a g e
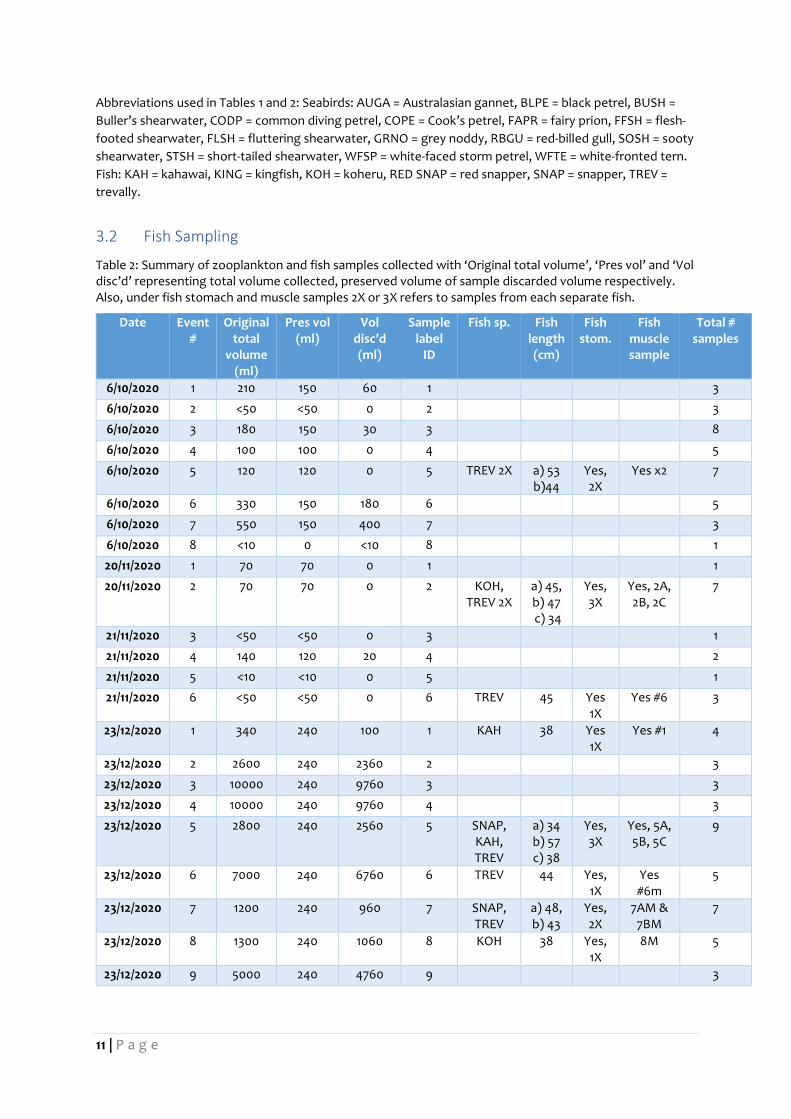
Abbreviations used in Tables 1 and 2: Seabirds: AUGA = Australasian gannet, BLPE = black petrel, BUSH =
Buller’s shearwater, CODP = common diving petrel, COPE = Cook’s petrel, FAPR = fairy prion, FFSH = flesh-
footed shearwater, FLSH = fluttering shearwater, GRNO = grey noddy, RBGU = red-billed gull, SOSH = sooty
shearwater, STSH = short-tailed shearwater, WFSP = white-faced storm petrel, WFTE = white-fronted tern.
Fish: KAH = kahawai, KING = kingfish, KOH = koheru, RED SNAP = red snapper, SNAP = snapper, TREV =
trevally.
3.2 Fish Sampling
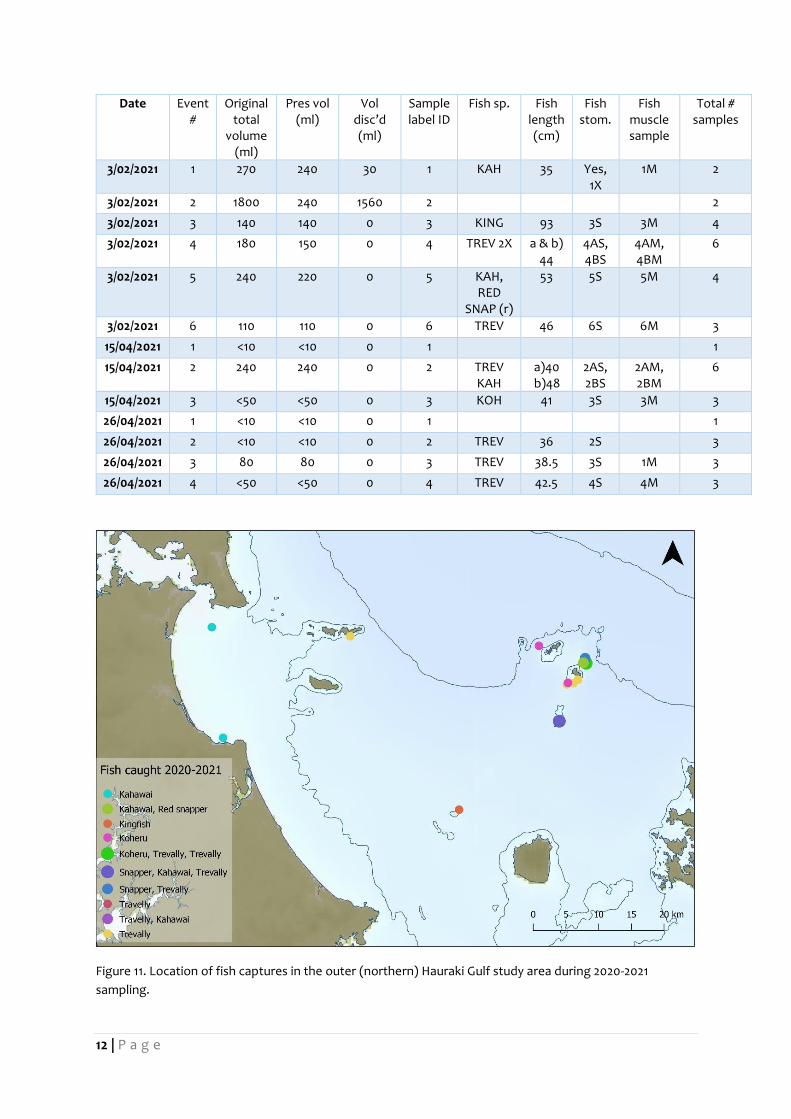
Table 2: Summary of zooplankton and fish samples collected with ‘Original total volume’, ‘Pres vol’ and ‘Vol disc’d’ representing total volume collected, preserved volume of sample discarded volume respectively. Also, under fish stomach and muscle samples 2X or 3X refers to samples from each separate fish.
Date Event #
Original total
volume (ml)
Pres vol (ml)
Vol disc’d (ml)
Sample label
ID
Fish sp. Fish length (cm)
Fish stom.
Fish muscle sample
Total # samples
6/10/2020 1 210 150 60 1
3
6/10/2020 2 <50 <50 0 2
3
6/10/2020 3 180 150 30 3
8
6/10/2020 4 100 100 0 4
5
6/10/2020 5 120 120 0 5 TREV 2X a) 53 b)44
Yes, 2X
Yes x2 7
6/10/2020 6 330 150 180 6
5
6/10/2020 7 550 150 400 7
3
6/10/2020 8 <10 0 <10 8
1
20/11/2020 1 70 70 0 1
1
20/11/2020 2 70 70 0 2 KOH, TREV 2X
a) 45, b) 47 c) 34
Yes, 3X
Yes, 2A, 2B, 2C
7
21/11/2020 3 <50 <50 0 3
1
21/11/2020 4 140 120 20 4
2
21/11/2020 5 <10 <10 0 5
1
21/11/2020 6 <50 <50 0 6 TREV 45 Yes 1X
Yes #6 3
23/12/2020 1 340 240 100 1 KAH 38 Yes 1X
Yes #1 4
23/12/2020 2 2600 240 2360 2
3
23/12/2020 3 10000 240 9760 3
3
23/12/2020 4 10000 240 9760 4
3
23/12/2020 5 2800 240 2560 5 SNAP, KAH, TREV
a) 34 b) 57 c) 38
Yes, 3X
Yes, 5A, 5B, 5C
9
23/12/2020 6 7000 240 6760 6 TREV 44 Yes, 1X
Yes #6m
5
23/12/2020 7 1200 240 960 7 SNAP, TREV
a) 48, b) 43
Yes, 2X
7AM & 7BM
7
23/12/2020 8 1300 240 1060 8 KOH 38 Yes, 1X
8M 5
23/12/2020 9 5000 240 4760 9
3
12 | P a g e
Date Event #
Original total
volume (ml)
Pres vol (ml)
Vol disc’d (ml)
Sample label ID
Fish sp. Fish length (cm)
Fish stom.
Fish muscle sample
Total # samples
3/02/2021 1 270 240 30 1 KAH 35 Yes, 1X
1M 2
3/02/2021 2 1800 240 1560 2
2
3/02/2021 3 140 140 0 3 KING 93 3S 3M 4
3/02/2021 4 180 150 0 4 TREV 2X a & b) 44
4AS, 4BS
4AM, 4BM
6
3/02/2021 5 240 220 0 5 KAH, RED
SNAP (r)
53 5S 5M 4
3/02/2021 6 110 110 0 6 TREV 46 6S 6M 3
15/04/2021 1 <10 <10 0 1 1
15/04/2021 2 240 240 0 2 TREV KAH
a)40 b)48
2AS, 2BS
2AM, 2BM
6
15/04/2021 3 <50 <50 0 3 KOH 41 3S 3M 3
26/04/2021 1 <10 <10 0 1 1
26/04/2021 2 <10 <10 0 2 TREV 36 2S 3
26/04/2021 3 80 80 0 3 TREV 38.5 3S 1M 3
26/04/2021 4 <50 <50 0 4 TREV 42.5 4S 4M 3
Figure 11. Location of fish captures in the outer (northern) Hauraki Gulf study area during 2020-2021
sampling.

13 | P a g e
Figure 12. Kingfish, 3 February 2021. Photo: Kerry Lukies.
3.3 Fish school dynamics The sampling sites frequented during this season’s fieldwork include seven near islands or over
reefs that we have identified as known areas for regular fish shoaling activity and seabird
aggregations. At these sites mixed schools of trevally and kahawai prevailed, although on
occasion with mackerel spp. joined the schools. In April schools of koheru (Decapterus koheru)
were encountered (Fig. 14).
In addition, the sites in Bream Bay, varied depending on the seabird/fish activity we encountered.
These events added further variety in that they were off a river mouth and long sandy beaches
and frequented by large flocks of shearwaters throughout the year. We also encountered activity
in the Jellicoe Channel, an open water location between Bream Tail/McGregor Reef and NW Reef
on two occasions.
Sites visited:
1. Coppermine Island (Marotere/Chickens Group)
2. Groper Island (Mokohinau Group)
3. Māori Rocks (Mokohinau Group)
4. Navare Rock (Mokohinau Group)
5. Simpson Rock (Mokohinau Group)
6. NW Reef (within Submarine Cable Zone)
7. Jellicoe Channel
8. McGregor Rock (off Bream Tail and Mangawhai)
9. Laings Cove (Bream Bay)
10. Waipu Cove (Bream Bay)
11. Bream Bay

14 | P a g e
Figure 13. School of kahawai, Groper Rock, 3 February 2021. Videography screenshot: NNZST
Figure 14. School of koheru, Groper Rock, 15 April 2021. Videography screenshot: NNZST

15 | P a g e
3.4 Seabird Observations
Seabird foraging activity observed this season generally followed the same pattern as previous
with most activity relating to birds feeding in association with fish schools (and feeding on prey
that the fish were feeding on – predominantly krill) (Fig. 19), and with cetaceans, common
dolphins (Figs. 15 & 16). One noticeable difference this season was the lack of tuna schools
encountered. Buller’s shearwaters make the noticeable shift during the season from feeding in
association with tightly packed shoals of trevally, kahawai, and mackerel to following the very
mobile tuna schools. This is discussed further below – see Discussion.
Table 1 lists seabirds present at each sampling event.
Figures 15 (top) & 16
(lower). Gannets and
flesh-footed
shearwaters feeding in
association with
common dolphins,
Jellicoe Channel, 6
October 2020. Photos:
Edin Whitehead.
16 | P a g e
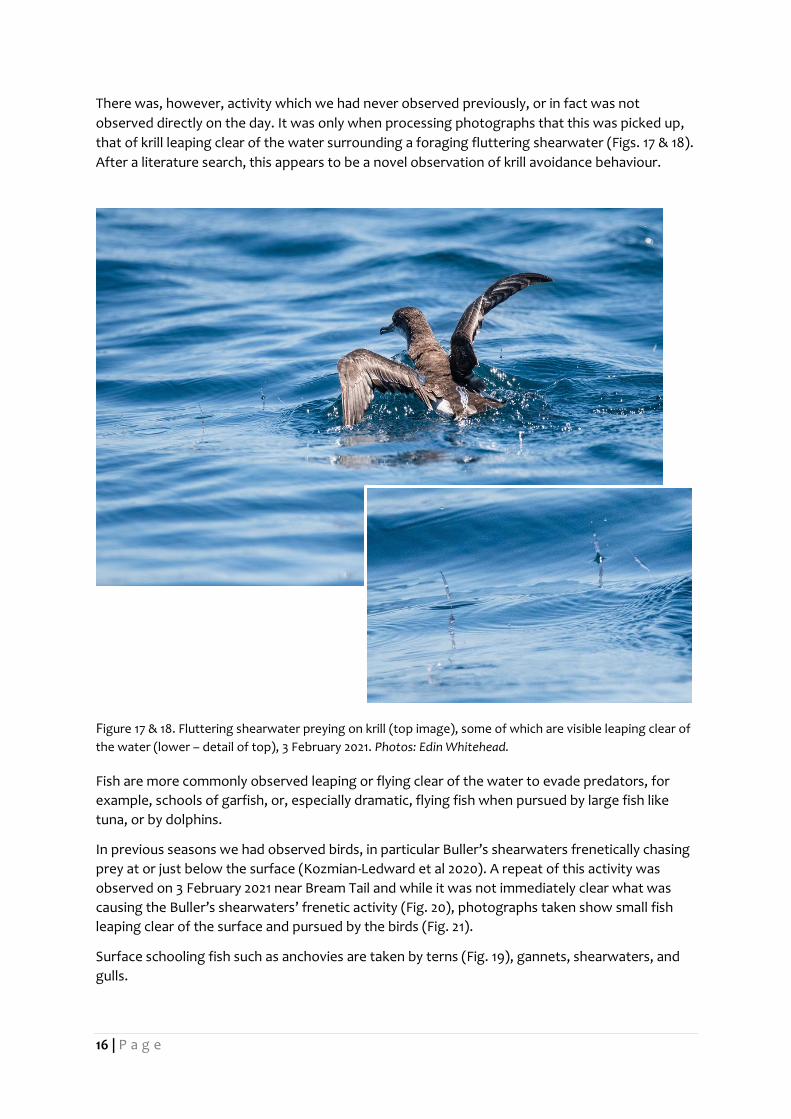
There was, however, activity which we had never observed previously, or in fact was not
observed directly on the day. It was only when processing photographs that this was picked up,
that of krill leaping clear of the water surrounding a foraging fluttering shearwater (Figs. 17 & 18).
After a literature search, this appears to be a novel observation of krill avoidance behaviour.
Figure 17 & 18. Fluttering shearwater preying on krill (top image), some of which are visible leaping clear of
the water (lower – detail of top), 3 February 2021. Photos: Edin Whitehead.
Fish are more commonly observed leaping or flying clear of the water to evade predators, for
example, schools of garfish, or, especially dramatic, flying fish when pursued by large fish like
tuna, or by dolphins.
In previous seasons we had observed birds, in particular Buller’s shearwaters frenetically chasing
prey at or just below the surface (Kozmian-Ledward et al 2020). A repeat of this activity was
observed on 3 February 2021 near Bream Tail and while it was not immediately clear what was
causing the Buller’s shearwaters’ frenetic activity (Fig. 20), photographs taken show small fish
leaping clear of the surface and pursued by the birds (Fig. 21).
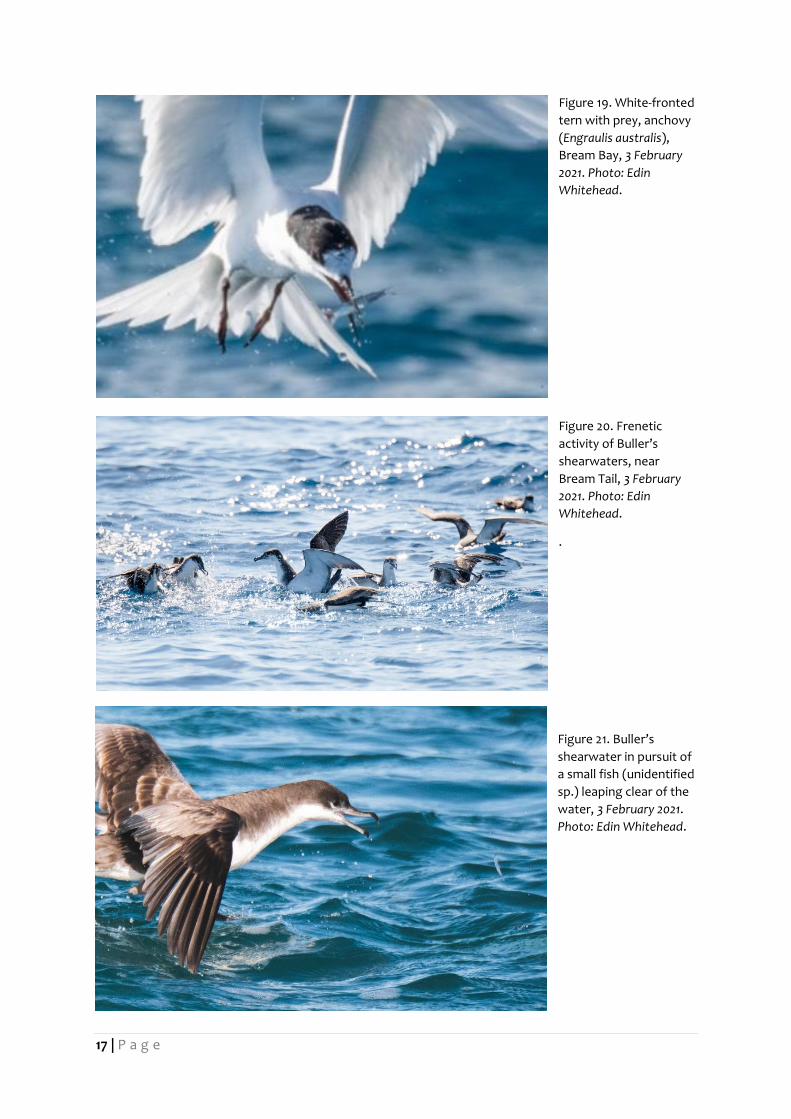
Surface schooling fish such as anchovies are taken by terns (Fig. 19), gannets, shearwaters, and
gulls.
17 | P a g e
Figure 19. White-fronted
tern with prey, anchovy
(Engraulis australis),
Bream Bay, 3 February
2021. Photo: Edin
Whitehead.
Figure 20. Frenetic
activity of Buller’s
shearwaters, near
Bream Tail, 3 February
2021. Photo: Edin
Whitehead.
.
Figure 21. Buller’s
shearwater in pursuit of
a small fish (unidentified
sp.) leaping clear of the
water, 3 February 2021.
Photo: Edin Whitehead.

18 | P a g e
Figures 22-23. Large
numbers of red-billed
gulls at Groper Island,
Mokohinau Group 3
February 2021. Birds
were both roosting en
masse on the island and
feeding in association
with fish schools (mixed
trevally and kahawai).
Photos: Chris Gaskin and
Edin Whitehead.

19 | P a g e
3.5 Marine Megafauna Observations
During the October trip we were treated to a spectacular close encounter with a humpback
whale (Megaptera novaeangliae) which breached several times (Fig. 24) close to a fish school we
had approached, near Sphinx Rocks, stacks adjacent to Burgess and Lizard Islands, Mokohinau
Group.
Common and bottlenose dolphins were observed, with one notable occasion of hundreds of Australasian gannets feeding in association with a pod of the former (Figs. 15 & 16). A single manta ray (Mobula birostris) was seen close to Māori Rocks, Mokohinau Group during the 3 February 2021 trip. One notable feature extracted from underwater videography were bronze whaler sharks (Carcharhinus brachyurus) in amongst the schools of fish that we were targeting (Fig. 26).
Figure 24. Humpback
whale breaching close
to Sphinx Rocks and
Burgess Island,
Mokohinau Islands, 6
October 2020. Photo:
Edin Whitehead.
Figure 25. Pod of
bottlenose dolphins,
Maori Rocks,
Mokohinau Islands 6
October 2020. Videography screenshot:
NNZST

20 | P a g e
Figure 26. Mature
bronze whaler shark
moving through a
mixed school of trevally
and kahawai, Navare
Rock, Mokohinau
Islands, 23 December
2020. Videography
screenshot: NNZST
3.6 Use of the floating/drop camera rig The first floating camera rig we devised was a set of six GoPro cameras mounted on a circular
acrylic platform near base end of a 2.2m carbon fibre shaft. A float is fixed to the top end. This
continues to be used with fish shoals to identify species.
This season, we designed, built, and deployed a second floating camera rig with a suspended
camera platform that could be set at depths <35m and left floating, or the suspended camera
platform dropped from the side of the boat to video through the water column, in some cases to
the seafloor.
We tested the rig’s effectiveness at several of the bathymetric features where we have
consistently observed seabird foraging and fish shoal activity, i.e., the Mokohinau Islands (Māori
Rocks and Navare Rock), Simpson Rock (Fig. 34) and NW Reef (Figs. 33 & 35).
These trials gave us snapshots of the fish not evident at the surface. In some cases, fish deeper in
the water column were showing up on the boat’s depth sounder.
The design of the second rig will be refined for future work, and likely two further camera rigs
will be developed – i.e., refinement of the one we tested this year, and a third rig (to be built)
that is essentially a weighted drop camera rig that can be lowered down through the water
column to the seabed, then hauled back up again.
While more sophisticated rigs can be employed to monitor pelagic, midwater and benthic
communities, as undertaken in some of the areas visited during these surveys (see Howarth &
Smith 2020), these rigs have been developed to be deployed quickly during or between
conducting surface zooplankton tows, other sampling, and seabird foraging observations. The
aim is to provide as complete a picture of activity as possible within the sampling period at a
particular location, including identification of fish species and sub-surface activity not readily
recorded at the surface (Figs. 27-31).

21 | P a g e
Down the water column
Figure 27. Fairy prions and a Buller’s shearwater
feeding in association with shoaling trevally and
kahawai, Groper Island, 3 February 2021. Photo: Edin
Whitehead
Figure 28. Mixed school of trevally and kahawai,
Coppermine Island, 3 February 2021. Screenshot from
videography: NNZST
Figure 29. Kingfish Seriola ladandi encountered mid-
column (c. 15m) at NW Reef, 3 February 2021.
Screenshots from videography: NNZST
Figure 30. Blue maomao Scorpis violaceus and
demoiselles Chromis dispilus near surface, Simpson
Rock, 3 February 2021. Screenshot from videography:
NNZST
Figure 31. Sweep Scorpis lineolate at 30m depth, NW
Reef (top of reef visible at bottom of image), 3
February 2021. Screenshot from videography: NNZST

22 | P a g e
4 DISCUSSION In general, seabird activity observed during this study followed a similar pattern to previous
seasons, with Buller’s and fluttering shearwaters, fairy prions, red-billed gulls, and to a lesser
extent white-fronted terns, and sooty and flesh-footed shearwaters associating strongly with
shoaling fish – principally mixed schools of trevally, kahawai, and mackerel spp. Fluttering
shearwaters are the dominant species inshore, i.e., in Bream Bay and the Parry Channel
(immediately offshore from Bream Head, Whangarei Heads), and from early February (post-
breeding) following kahawai schools.
A major difference from earlier seasons is that we did not encounter tuna schools during our trips
within the Hauraki Gulf, neither skipjack nor albacore tuna. Usually these enter the outer Gulf in
the second half of January as offshore conditions change, SST rising through the summer, water
clarity improving, and colour shifting from green/khaki or blue green to deep blue. In Gaskin
(2017) it was first noted that Buller’s shearwaters make the noticeable shift from feeding in
association with tightly packed shoals trevally, kahawai, and mackerel to following the very
mobile tuna schools, activity that coincides with the start of raising chicks, also referred to in
Gaskin et al (2019) and Kozmian-Ledward et al (2020). It should be noted that on a separate
research trip later in the month (19 February 2021) unrelated to this study, large numbers of
Buller’s shearwaters were seen active over a tuna school outside the study area at the Bay of
Islands (author, pers. obs.).
4.1 The shift to a set route As noted above, in previous seasons (2019-2020) we conducted general searches to locate
seabird and fish shoal activity over sometimes very wide areas (Fig. 32). This season we made the
change to a series of day trips following similar routes (Fig. 33). Sampling stations were largely
determined by activity encountered along that route. This change provided a more structured
approach to the sampling programme, i.e., within the constraints of budget, which determined
the number of trips, distance travelled, and time spent at each station. In the event, the most
consistent seabird foraging and fish shoal activity was close to islands and prominent reefs.
Figures 32 & 33. Vessel track-lines for each fieldwork day conducted in 2019-2020 and 2020-2021.
4.2 Significance of aggregations The aim of this and earlier projects is to better understand the relationship between the diet of
surface-foraging seabirds, and what prey items are being made available from fish shoal events

23 | P a g e
(workups) so that we can understand the mechanisms that drive changes in the distribution
and/or abundance of workups and how that might affect seabird populations.
Findings from this and previous DOC CSP contracts investigating seabirds associating with fish
shoals and fish school dynamics (INT 2016-04 and POP2019-02) have highlighted the importance
of the Gulf itself for seabirds breeding in the wider Hauraki Gulf region, species such as Buller’s
shearwaters, fairy prions and flesh-footed shearwaters on Northland offshore islands (e.g., the
Poor Knights Islands) (Gaskin & Rayner 2013, Gaskin 2017). It also serves to highlight that, despite
significant and obvious ecological values at the locations surveyed during this and previous
studies, there is much to learn about the dynamics that trigger and sustain major aggregations of
marine activity. The findings from those studies also serve to highlight that major aggregations of
marine activity are not confined to areas around islands or over major reef systems – i.e., seabirds
feeding in association with cetaceans and highly mobile tuna, mackerel and kahawai schools, and
krill swarms. These can be highly ephemeral in nature across pelagic areas and the outer Hauraki
Gulf, and driven by processes that remain largely unknown.
4.2.1 Shifting seabird populations
A significant feature of this season’s observations with respect to occurrence of seabirds across
the study site has been the changing distribution pattern of red-billed gulls.
During 2014-2016 Birds New Zealand, in conjunction with DOC, carried out a national survey to
establish the current size of the red-billed gull breeding population (Frost & Taylor 2016). The
authors’ suggested, together with Birds New Zealand, DOC and others, there was the need to
identify several representative colonies around the country, for future monitoring over many
years using comparable and consistent methods. One of the key sites is the Mokohinau Islands,
formerly one of New Zealand’s largest breeding sites for this species at an estimated 13,000 birds
on Burgess Island in 1945 (Fleming 1946, Buddle 1947, Gurr & Kinsky 1965).
Gaskin (2017) referred to concerns raised about the potential impact of the purse-seine fishery
noting marine ecology including seabirds’ foraging. Anecdotal historical accounts reported
diminishing fish school size and frequency, particularly of the formerly ‘vast’ trevally schools from
northern waters (R. Walter, W. Doak, R. Grace pers. comms.). The cause of the decline in red-
billed gulls on the Mokohinau Islands had potentially been attributed to the diminishing fish
schools and their reliance on feeding in association with these schools (Frost & Taylor 2018).
Since 2005 researchers visiting the islands have kept track on gulls nesting there, in fluctuating
numbers and moving from site to site. From 2013 to 2018 numbers remained steady at around 250
pairs, although during winter months red-billed gull numbers would escalate to the low
thousands with flocks of birds seen feeding over fish schools active around the islands. In 2018-
2019 red-billed gulls were found to be breeding in greater numbers on Māori Rocks (now absent
on Burgess Island itself), approximately 500 pairs. While the breeding population at the
Mokohinau Islands appears to be remaining steady at the 2018-2019 estimate, the numbers of
birds congregating around the Mokohinau Islands post-breeding appear to be increasing. The
Marotere (Chickens) Islands is another hotspot for this species through this period.
Our records of red-billed gulls through this season reflect this. On the 3 February trip thousands
of gulls were seen feeding at three sampling locations in the Mokohinau Group (Navare Rock,
Māori Rocks and Groper Island), and off Lady Alice Island (Figs. 23-25). Red-billed gulls where
24 | P a g e
again encountered in large numbers at the Mokohinau Islands and off the Marotere (Chickens)
Islands during the 15 and 24 April trips.
4.2.2 Fragmentation
The question these observations raise is where these large numbers of red-billed gulls are coming
from, given the relatively small breeding population at the Mokohinau Islands. Has there been a
fragmentation of the original colony on Burgess Island, estimated at 5,000-10,000 birds by
Fleming (1946) and 13,000 birds by Buddle (1947)? However, the only recorded colony of
significant size in the region is at the Marsden Point Oil Refinery, one of Aotearoa New Zealand’s
largest colonies of red-billed gulls (1,190 pairs, 2014-2106) (Frost & Taylor 2018). While more
accurate counts over multiple years of the both colonies (breeding birds) and non-breeding
congregations across the region would shed light on this, the presence of high numbers at the
Mokohinau Islands from late January through to September-October highlights the importance
of the islands and surrounding waters for this species.
4.2.3 Colony displacement
As noted above, the Marsden Point Oil Refinery has a major colony of red-billed gulls within its
confines. During breeding these gulls are regularly seen flying out beyond Bream Head to forage
around the Bream Islands, and likely the Marotere/Chicken Islands) and possibly beyond (CG,
pers. obs). Post-breeding, it is likely many red-billed gulls regularly congregating around both the
Marotere (Chickens) and Mokohinau Islands are from the oil refinery colony. Although, it should
be noted, that during autumn and winter months flocks of gulls are also regularly seen feeding in
paddocks in the Ruakaka area inland from Marsden Point. A consequence of the proposed
scaling back of the Marsden Point Oil Refinery to an import-only terminal (RNZ Checkpoint
programme 16 June 2021) could be the disruption of this population.
4.3 Facing a decline – Sea Change and the Hauraki Gulf Tai Timu Tai Pari – Sea Change – Hauraki Gulf Marine Spatial Plan was released in April 2017 after
several years of consultations aiming to improve the health of the Hauraki Gulf Marine Park for
future generations and included proposals for marine protection and fisheries management.
Following the Government commitment in 2020 to continue working on the Sea Change project,
Revitalising the Gulf – Government Action on the Sea Change Plan was released (DOC and FNZ,
2021a). To support the recovery of species and habitats, new marine protected areas have been
proposed in what are considered some of the most biodiverse regions in the Gulf, with
complementary sustainable fisheries management measures, including harvesting controls and
restrictions on trawling.
In highlighting priority research on protected species in the Gulf the Strategy identifies that
various research and monitoring that is required to improve understanding of protected marine
species in the Gulf, their threats, and the effectiveness of our interventions. New research and
monitoring initiatives must consider the ecosystem effects of changes in the distribution,
behaviour, and abundance of protected species, as well as changes in the food webs of which
they are a component, thus, enhancing understanding of the waiora of the Gulf ecosystem (DOC
and FNZ 2021a).

25 | P a g e
Priority research for protected species identified in the Strategy includes:
• The influence of long-term trends in pelagic primary and secondary productivity on the
behaviour, distribution and reproductive success of seabirds and cetaceans inhabiting the
Gulf,
• The biology and ecology of bait fishes (particularly anchovy, pilchard, sprats and mullet),
• The terrestrial habitats of shorebirds and seabirds (for example, burrow-nesting seabirds,
such as petrels, shearwaters, and little penguins) and improving our understanding of
these habitats, including whether changes in vegetation at breeding sites are adversely
affecting shorebird species,
• The effects of suspended sediments on foraging behaviour,
• The establishment of population trends of seabirds and shorebirds, and sustainable levels
of harvest (DOC and FNZ 2021a).
Figure 34.
Preferred option
for the
Mokohinau
Islands (DOC and
MPI 2021b).
Figure 35.
Preferred option
for Te Hauturu-o-
Toi/Little Barrier
Island high
protection area.
Proposed Type 2
MPA at Cradock
Channel (DOC
and MPI 2021b).
26 | P a g e
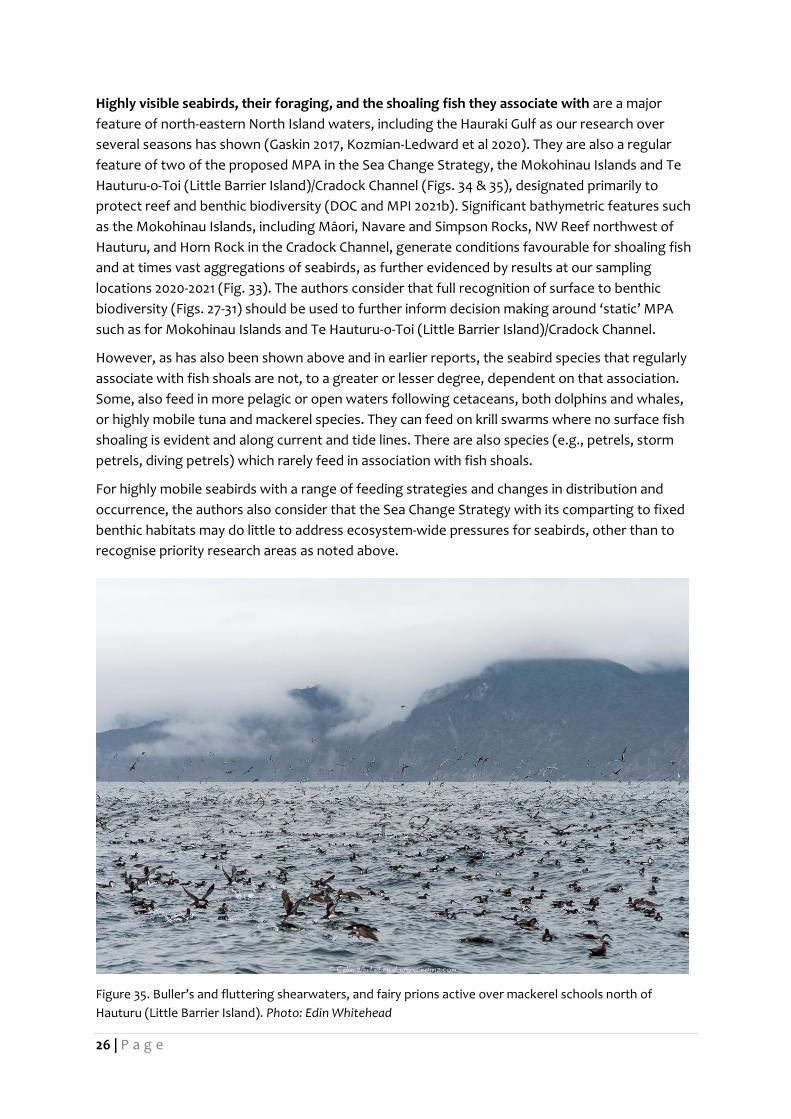
Highly visible seabirds, their foraging, and the shoaling fish they associate with are a major
feature of north-eastern North Island waters, including the Hauraki Gulf as our research over
several seasons has shown (Gaskin 2017, Kozmian-Ledward et al 2020). They are also a regular
feature of two of the proposed MPA in the Sea Change Strategy, the Mokohinau Islands and Te
Hauturu-o-Toi (Little Barrier Island)/Cradock Channel (Figs. 34 & 35), designated primarily to
protect reef and benthic biodiversity (DOC and MPI 2021b). Significant bathymetric features such
as the Mokohinau Islands, including Māori, Navare and Simpson Rocks, NW Reef northwest of
Hauturu, and Horn Rock in the Cradock Channel, generate conditions favourable for shoaling fish
and at times vast aggregations of seabirds, as further evidenced by results at our sampling
locations 2020-2021 (Fig. 33). The authors consider that full recognition of surface to benthic
biodiversity (Figs. 27-31) should be used to further inform decision making around ‘static’ MPA
such as for Mokohinau Islands and Te Hauturu-o-Toi (Little Barrier Island)/Cradock Channel.
However, as has also been shown above and in earlier reports, the seabird species that regularly
associate with fish shoals are not, to a greater or lesser degree, dependent on that association.
Some, also feed in more pelagic or open waters following cetaceans, both dolphins and whales,
or highly mobile tuna and mackerel species. They can feed on krill swarms where no surface fish
shoaling is evident and along current and tide lines. There are also species (e.g., petrels, storm
petrels, diving petrels) which rarely feed in association with fish shoals.
For highly mobile seabirds with a range of feeding strategies and changes in distribution and
occurrence, the authors also consider that the Sea Change Strategy with its comparting to fixed
benthic habitats may do little to address ecosystem-wide pressures for seabirds, other than to
recognise priority research areas as noted above.
Figure 35. Buller’s and fluttering shearwaters, and fairy prions active over mackerel schools north of
Hauturu (Little Barrier Island). Photo: Edin Whitehead

27 | P a g e
Our study area extends beyond the Hauraki Gulf Marine Park, the region covered by the Sea
Change Strategy. Unlike the original Hauraki Gulf Maritime Park which extended from the Poor
Knights Islands to the Te Ruamāhua (Aldermen Islands), the Marine Park established in 1992 does
not include the East Northland offshore islands, coast, and catchments. While definitions of what
geographically constitutes the ‘Hauraki Gulf’ vary, there is one certainty, seabirds know no
geographical boundaries, whether they breed within the Marine Park or on islands adjacent.
For many of the seabirds of the Hauraki Gulf, including those breeding on Northland Islands (i.e.,
Poor Knights, Taranga (Hen) and Marotere (Chickens) Islands, the productivity of the outer
Hauraki Gulf and east Northland waters helps sustain their populations. Currently, with our
‘snapshot’ approach to monitoring, while providing us with a wealth of observational
information about seabird foraging and shoaling fish, and zooplankton sampling data, does not
enable us to account for trends in productivity across this critical area.
4.4 Looking Ahead and recommendation for future research An update of this report will be released in August 2021 and will include:
• Energy analysis for both POP2019-02 and this contract (BCBC2020-08)
• Investigation of the relationship between historical fish school formation and oceanography.
The aer-sight (spotter plane) database will be used to characterise changes in schooling
aggregations over time (i.e., size of schools, tonnage of sightings, number of schools)
analyses.
Subject to funding under a separate contract, zooplankton samples collected will be identified,
counted, and a complete analysis will be undertaken.
Long-term monitoring for the wider Hauraki Gulf region is essential to guide future management
of this region’s marine environment. To adequately assess the condition of the ecosystem, we
must establish a set of long-term monitoring stations across the wider Hauraki Gulf with seabirds
as our indicators for marine health, a maritime take on the ‘canary in the coalmine’ scenario1,
together with research conducted on the islands (examples – population surveys, health
assessments etc) would inform future marine management. Such a proposal would draw on the
findings from previous recent research, both at-sea and on islands, to create a structured
programme and develop a viable and cost-effective tool for assessing long term changes with the
Gulf’s marine ecosystem. While such a network would be across the whole Hauraki Gulf, from
Northland through to the east Coromandel islands, there is particular emphasis on the outer
reaches of the Gulf to provide balance to the ongoing debate about marine protection and
management issues.
5 ACKNOWLEDGMENTS This project was funded by the Marine Species Team, Department of Conservation project BCBC.
The authors would like to thank Dr Karen Middlemiss, Graeme Taylor and Ian Angus (Department
of Conservation); Pete Mitchell for fish captures, Edin Whitehead for topside photography; and
skipper Trevor Jackson for his manoeuvring skills, thoughtful assistance and maintaining one of
1 An allusion to caged canaries (birds) that miners would carry down into the mine tunnels with them. If dangerous gases such as carbon monoxide collected in the mine, the gases would kill the canary before killing the miners, thus providing a warning to exit the tunnels immediately.
28 | P a g e
the cleanest charter vessels around; and to Trevor’s wife Leanne for the wonderful supply of
freshly baked date loaf on every trip.
6 REFERENCES Buddle, G.A. (1947). Breeding of red-billed gull. New Zealand Bird Notes 2: 71–72.
Delcourt, J., Poncin, P. (2012). Shoals and schools: back to the heuristic definitions and
quantitative references. Reviews in Fish Biology and Fisheries 22: 595-619.
Fleming, C.A. (1946). Breeding of red-billed gull: a preliminary census of Mokohinau colony. New
Zealand Bird Notes 2: 27–29.
Frederiksen, M., Edwards, M., Richardson, A. J., Halliday, N. C. & Wanless, S. (2006). From
plankton to top predators: bottom-up control of a marine food web across four trophic levels.
Journal of Animal Ecology, 75, 1259-1268.
Frost, P.G.H., Taylor, G.A. (2018). The status of the red-billed gull (Larus novaehollandiae
scopulinus) in New Zealand, 2014–2016. Notornis 65: 1–13
Gaskin, C.P. (2017). Procellariiformes associating with shoaling fish schools – Northern New
Zealand. Report for INT 2016-04 Conservation Services Programme. Department of Conservation,
Wellington.
Gaskin, C.P., Frost, P.G.H., Friesen, M.R. (2018). Summary of activities carried out to collect
population estimates of priority seabirds in 2017-2018 (Milestone 4). Report prepared for the
Conservation Services Programme POP2017-06. Department of Conservation, Wellington.
Gurr, L., Kinsky, F. (1965). The distribution of breeding colonies and status of the red-billed gull in
New Zealand and its outlying islands. Notornis 12: 223–240.
Harris, R. P., Wiebe, P. H., Lenz, J., Skjoldal, H. R. & Huntley, M. (2000). Zooplankton Methodology
Manual. Academic Press.
Howarth, O.; Smith, A.N.H. 2020: Monitoring the Hauraki Gulf using baited remote underwater
video systems (BRUVs). Report commissioned by Department of Conservation. School of Natural
and Computational Sciences, Massey University, Auckland. Unpublished report.
Kozmian-Ledward, L., Jeffs, A., Gaskin, C.P. (2020). Final report summarising analysis of
zooplankton samples collected 2019 – 2020. Report for POP2019-02 Conservation Services
Programme. Department of Conservation, Wellington.
Taylor, P. & Gaskin, C. (2020). Milestone 2: Interim report on oceanographic features in the study
area. Fish shoal dynamics in north-eastern North Island. Report prepared for the CSP POP2019-02.
Department of Conservation, Wellington.
Zeldis, J. R., Willis, K. J. (2015). Biogeography and tropic drivers of mesoplankton distribution on
the northeast continental shelf and in Hauraki Gulf, New Zealand. New Zealand Journal of Marine
and Freshwater Research, 49(1), 60-86.

29 | P a g e
Addendum: Nutritional Analysis of Seabird Prey Species
from the Hauraki Gulf
This report has been prepared by Dr Stefan Spreitzenbarth with Prof. Andrew Jeffs (Institute of
Marine Science, University of Auckland) and Lily Kozmian-Ledward (Sea Lily Ltd.) for the
Department of Conservation (DOC), Conservation Services Programme (CSP) and managed by
DOC marine science advisor Dr. Karen Middlemiss.
August 2021
SUMMARY
Surveys of fish shoals were undertaken for the contract (DOC CSP BCBC2020-08) conducted at
locations within the general area of Marsden Point/Whangarei Heads > Marotere/Chickens
Islands > Mokohinau Islands > Hauturu/Little Barrier > Bream Tail > Marsden Point during the
period October 2020 - April 2021 qualified as spring (Oct-Nov), early summer (Dec), late summer
(Jan-Feb) and autumn (Mar-Apr). Zooplankton nets and line fishing methods were deployed in
fish shoals to identify the dominant composition of marine species contributing to the fish
shoaling, and potentially providing prey species for seabirds that were frequently feeding in
association with the fish shoals. In addition, a preliminary study was undertaken to determine the
nutritional composition of samples of krill, small pelagic fish and squid by analysing their ash,
protein, lipid and overall calorific (energy) content.
1 INTRODUCTION
Globally seabirds are a highly threatened group which mostly rely on mix of prey species,
frequently foraged from large areas of the sea. Seabirds typically feed on abundant and highly
nutritious prey species because of the high energy requirements of their lifestyle (Kooijman
2020). For example, seabirds frequently prey on krill because they form dense aggregations at
the surface of the sea, and have a high lipid and protein content compared to many other
zooplankton. Despite the importance of feeding to the success for seabirds the foraging ecology
of most species of seabird remains poorly understood. This is of importance because changes in
ocean ecosystems due to human impacts can detrimentally impact the prey availability and
quality for seabirds, which in turn can place seabird populations under nutritional stress.
The Hauraki Gulf is an important feeding habitat for a variety of seabirds, a significant proportion
of which are under some conservation threat. The marine ecosystem of the Hauraki Gulf has
been considerably impacted by human activities, especially through extensive fishing activity
(MacDiarmid et al. 2012, 2015, 2016). There is a priority for research to better understand the
feeding ecology of seabirds in the Hauraki Gulf, to provide a stronger basis for managing
potential trophic stress for seabirds.
To this end, over the past two years the Conservation Services Programme has funded some
initial surveys of fish shoaling events that are often associated with active seabird feeding in the
wider Hauraki Gulf. The surveys have identified the major marine species associated with fish

30 | P a g e
shoaling and bird feeding events, and generated some initial indication of potential diet of some
seabird species.
This report outlines the results of some preliminary laboratory analyses to determine the
nutritional composition (ash, protein, lipid and energy content) of important prey species for
seabirds in the Hauraki Gulf. Analyses were conducted on two types of samples: 1) krill from
zooplankton tows conducted in the 2019-2020 and 2020-2021 survey seasons, and 2) samples of
whole prey species recovered intact from Australasian gannet regurgitations collected in 2018-
2019.
2 METHODS
2.1 Krill samples
Besides describing the overall nutritional composition of the content of krill from the surveys, a
secondary aim was to attempt to assess whether there was variation in the nutritional content of
krill collected in the vicinity of the Mokohinau Islands area over the two survey seasons to look at
potential differences in energy and macronutrient content between months and years. Whilst
extensive studies have been conducted on energy and chemical composition of krill in other
parts of the world, such as the Southern Ocean, to our knowledge there are no reports of the
nutritional composition of krill from the temperate waters of New Zealand.
Zooplankton sampling tows were conducted as described in Lukies et al. (2021) for the 2020-2021
season and in Kozmian-Ledward et al. (2020) for the 2019-2020 season. Unless the resulting
zooplankton sample was very small (< 20 ml), a small representative portion of each sample
(approx. 20 ml) was stored in a container without ethanol and kept frozen at -18 oC for
subsequent energy and proximate analysis. Krill were subsequently sorted from a selection of the
frozen samples from zooplankton tows taken around the Mokohinau Islands for nutritional
analyses.
From each frozen zooplankton sample that contained sufficient krill for analyses, the sample was
defrosted and individual krill were picked out using forceps to make a total of ~1 g wet weight.
The number of krill were recorded and a digital photograph was taken to enable length
measurements of krill to be taken using Image J. Approximately 40 krill from each sample were
measured from the anterior of the eye to the end of the telson (Standard 1 method, Mauchline
1980). Each krill sample was then stored in a small labelled vial in a -80 oC freezer.
A smaller total number of krill samples (13) than hoped for were obtained from the Mokohinau
Islands (Table 1). In the 2019-2020 season, fieldwork was only conducted at the Mokohinau
Islands in January and February, with the February zooplankton samples being either too small to
retain a portion for energy and proximate analysis or where the zooplankton samples were
frozen, the samples did not contain enough krill for analyses. In the 2020-2021 season, no
fieldwork was conducted in January or March, while zooplankton tow samples obtained from the
Mokohinau Islands in April were too small to retain a portion for energy and proximate analysis.

31 | P a g e
Table 1. Details of krill samples.
Sample date Sample ID Sample location Wet
weight (g)
Number of
krill
Average
length (mm)
20 Jan 2020 K9 Navire Rock 0.912 119 12.863
20 Jan 2020 K10 Groper Island 1.985 106 10.417
20 Jan 2020 K11 Maori Rocks 1.058 60 13.275
20 Jan 2020 K12 Maori Rocks 0.715 400 5.763
21 Jan 2020 K13 Sth side Flax Islands 1.218 54 12.396
6 Oct 2020 K1 Groper Island 1.041 177 8.777
6 Oct 2020 K2 Sth side Flax Islands 0.702 81 9.477
6 Oct 2020 K3 Sth side Fanal Island 0.575 72 9.917
21 Nov 2020 K4 Sth side Flax Islands 1.374 106 10.273
23 Dec 2020 K5 Maori Rocks 1.045 49 13.452
23 Dec 2020 K6 Groper Island 1.219 60 13.835
3 Feb 2021 K7 Navire Rock 1.101 60 13.716
3 Feb 2021 K8 Maori Rocks 1.086 75 11.146
2.2 Gannet regurgitation samples
Regurgitations were collected from gannets at Mahuki Island in the outer Hauraki Gulf and
Horuhoru Rock in the inner Hauraki Gulf during the 2019-2019 breeding season (Adams 2019). One
whole specimen of each of four prey species that had recently been ingested and was still intact
was selected for the energy and proximate analysis (Table 2). Total length of the prey items (fish -
nose to fork; squid – top of head to end of outstretched tentacles) was measured with a ruler
and wet weight was measured with a scale. A ~1 g sample of tissue was excised with a scalpel
from the body of each sample.
Table 2. Details of gannet regurgitation samples.
Sample date Species Length
(mm)
Wet
weight (g)
Sample
location
Sampled
bird status
29 Jan 2018 Anchovy
Engraulis australis
80 3.0 Horuhoru Chick
27 Nov 2019 Pilchard
Sardinops sagax
170 45.8 Mahuki Adult
6 Dec 2019 Jack mackerel
Trachurus spp.
175 51.6 Mahuki Adult
32 | P a g e
7 Dec 2019 Arrow squid
Nototodarus gouldi
105 10.0 Mahuki Adult
2.3 Laboratory analyses
The ~1 g samples of all prey material were lyophilised (freeze dried) and then dry weight of the
samples determined with scales to allow the calculation of the proportion of moisture in the
sampled. The lyophilised samples were then ground to a fine powder for subsequent sub-
sampling for further analyses.
Total lipid content of a measured single subsample of krill and three replicate subsamples of the
larger prey items were measured gravimetrically using a modified Bligh & Dyer (1959) extraction.
In short, methanol, chloroform and deionised water were added to the lyophilized powdered
prey, vortexed and centrifuged for 10 min at 1000 g. The chloroform/lipid mixture was removed
and transferred to a tared vial in a thermal block (36 °C), where nitrogen gas (BOC, 100%) was
gently blown onto the lipid and solvent mixture to remove chloroform leaving the only residual
lipid in the vial, which was then weighed.
Total protein content of a measured single subsample of krill and three replicate subsamples of
the larger prey items were incubated in 0.1 M NaOH for 16 h at 50 °C. The incubated samples were
then centrifuged at 10,000 rpm at 4 °C for 10 min. Protein was quantified by BCA (bicinchoninic
acid) method (Smith et al. 1985) using a micro BCA protein assay kit (ThermoFisher Scientific,
USA) and read against bovine serum albumin (BSA) standard at 562 nm.
The total ash content of a measured single subsample of krill and three replicate subsamples of
the larger prey items were determined by burning off the organic content in a muffle furnace
(Nabertherm LT15/11 B410, Germany) at 450 °C for 4 h. The remaining ash from the sample was
then weighed to establish the quantity of inorganic material (ash) and this was used to calculate
the proportion of ash free dry weight (AFDW) to total dry weight, i.e., organic content of the
sample. One krill sample (K9) had insufficient sample material to determine ash content.
The energy content of a measured three replicate subsamples of krill and three replicate
subsamples of the larger prey items were determined with a semi-micro calorimeter (Parr 6725,
Parr Instrument Company, USA). The calorific value per gram of dry mass of each prey subsample
was then calculated. Krill samples K1-3 and K12 could not be analysed because of insufficient
sample material.
33 | P a g e
3 RESULTS
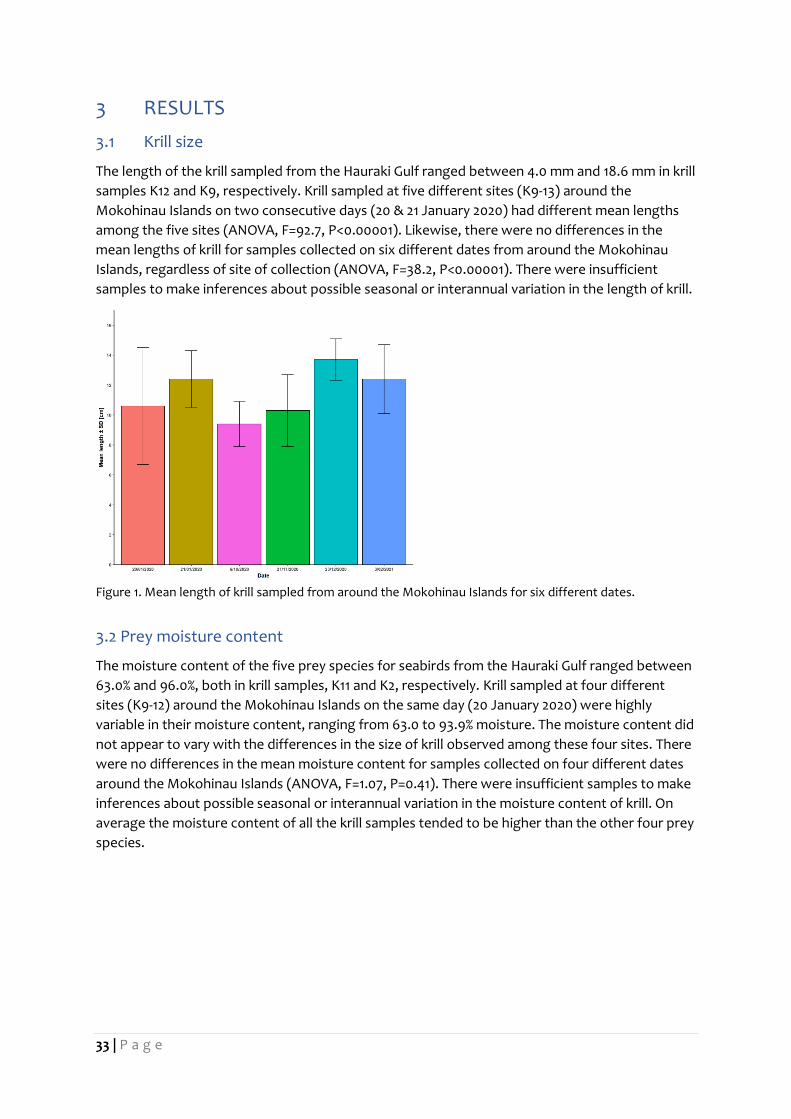
3.1 Krill size
The length of the krill sampled from the Hauraki Gulf ranged between 4.0 mm and 18.6 mm in krill
samples K12 and K9, respectively. Krill sampled at five different sites (K9-13) around the
Mokohinau Islands on two consecutive days (20 & 21 January 2020) had different mean lengths
among the five sites (ANOVA, F=92.7, P<0.00001). Likewise, there were no differences in the
mean lengths of krill for samples collected on six different dates from around the Mokohinau
Islands, regardless of site of collection (ANOVA, F=38.2, P<0.00001). There were insufficient
samples to make inferences about possible seasonal or interannual variation in the length of krill.
Figure 1. Mean length of krill sampled from around the Mokohinau Islands for six different dates.
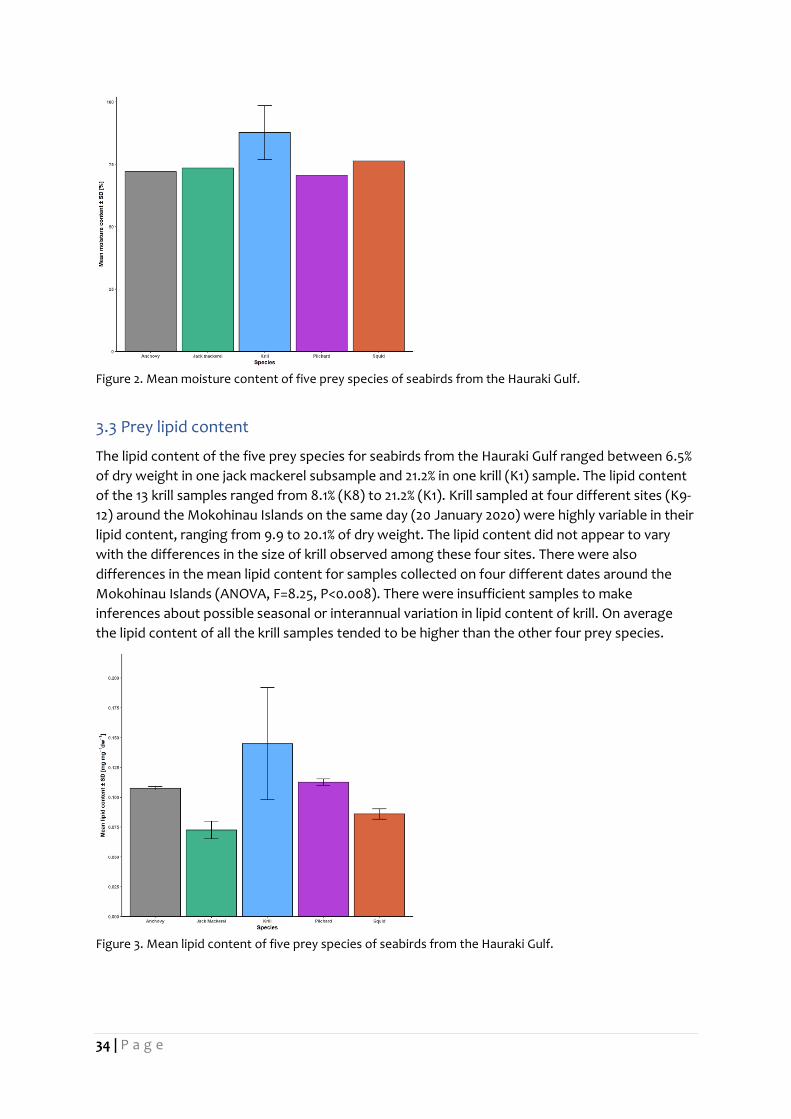
3.2 Prey moisture content
The moisture content of the five prey species for seabirds from the Hauraki Gulf ranged between
63.0% and 96.0%, both in krill samples, K11 and K2, respectively. Krill sampled at four different
sites (K9-12) around the Mokohinau Islands on the same day (20 January 2020) were highly
variable in their moisture content, ranging from 63.0 to 93.9% moisture. The moisture content did
not appear to vary with the differences in the size of krill observed among these four sites. There
were no differences in the mean moisture content for samples collected on four different dates
around the Mokohinau Islands (ANOVA, F=1.07, P=0.41). There were insufficient samples to make
inferences about possible seasonal or interannual variation in the moisture content of krill. On
average the moisture content of all the krill samples tended to be higher than the other four prey
species.
34 | P a g e
Figure 2. Mean moisture content of five prey species of seabirds from the Hauraki Gulf.
3.3 Prey lipid content
The lipid content of the five prey species for seabirds from the Hauraki Gulf ranged between 6.5%
of dry weight in one jack mackerel subsample and 21.2% in one krill (K1) sample. The lipid content
of the 13 krill samples ranged from 8.1% (K8) to 21.2% (K1). Krill sampled at four different sites (K9-
12) around the Mokohinau Islands on the same day (20 January 2020) were highly variable in their
lipid content, ranging from 9.9 to 20.1% of dry weight. The lipid content did not appear to vary
with the differences in the size of krill observed among these four sites. There were also
differences in the mean lipid content for samples collected on four different dates around the
Mokohinau Islands (ANOVA, F=8.25, P<0.008). There were insufficient samples to make
inferences about possible seasonal or interannual variation in lipid content of krill. On average
the lipid content of all the krill samples tended to be higher than the other four prey species.
Figure 3. Mean lipid content of five prey species of seabirds from the Hauraki Gulf.

35 | P a g e
3.4 Prey protein content
The protein content of the five prey species for seabirds from the Hauraki Gulf ranged between
25% of dry weight in one krill sample (K10) and 85% in one jack mackerel subsample. The protein
content of the 13 krill samples ranged from 25% (K10) to 80% (K4). Krill sampled at four different
sites (K9-12) around the Mokohinau Islands on the same day (20 January 2020) were highly
variable in their protein content, ranging from 25 to 52% of dry weight. The protein content
tended to be lower in samples with the smaller sized krill observed among these four sites. There
were also differences in the mean protein content for samples collected on four different dates
around the Mokohinau Islands (ANOVA, F=5.76, P<0.03). There were insufficient samples to make
inferences about possible seasonal or interannual variation in protein content of krill. On average
the protein content of all the krill samples tended to be lower than the other four prey species.
Figure 4. Mean protein content of five prey species of seabirds from the Hauraki Gulf.
3.5 Prey energy content
The energy content of the five prey species for seabirds from the Hauraki Gulf ranged between
1054.2 calories per g of dry weight in one krill sample (K10) and 3061.8 in one jack mackerel
subsample. The energy content of the 8 krill samples ranged from 1054.2 calories per g of dry
weight (K10) to 2252.1 (K4). Krill sampled at three different sites (K9-11) around the Mokohinau
Islands on the same day (20 January 2020) were highly variable in their measures of energy
content, ranging from 1054.2 calories per g of dry weight to 1886.4. The energy content tended
to be lower in samples with the smaller sized krill observed among these three sites. There were
insufficient samples to make reliable comparisons or inferences about possible spatial, seasonal
or interannual variation in the energy content of krill. On average the energy content of all the
krill samples tended to be considerably lower than the other four prey species.
36 | P a g e
Figure 5. Mean energy content of five prey species of seabirds from the Hauraki Gulf.
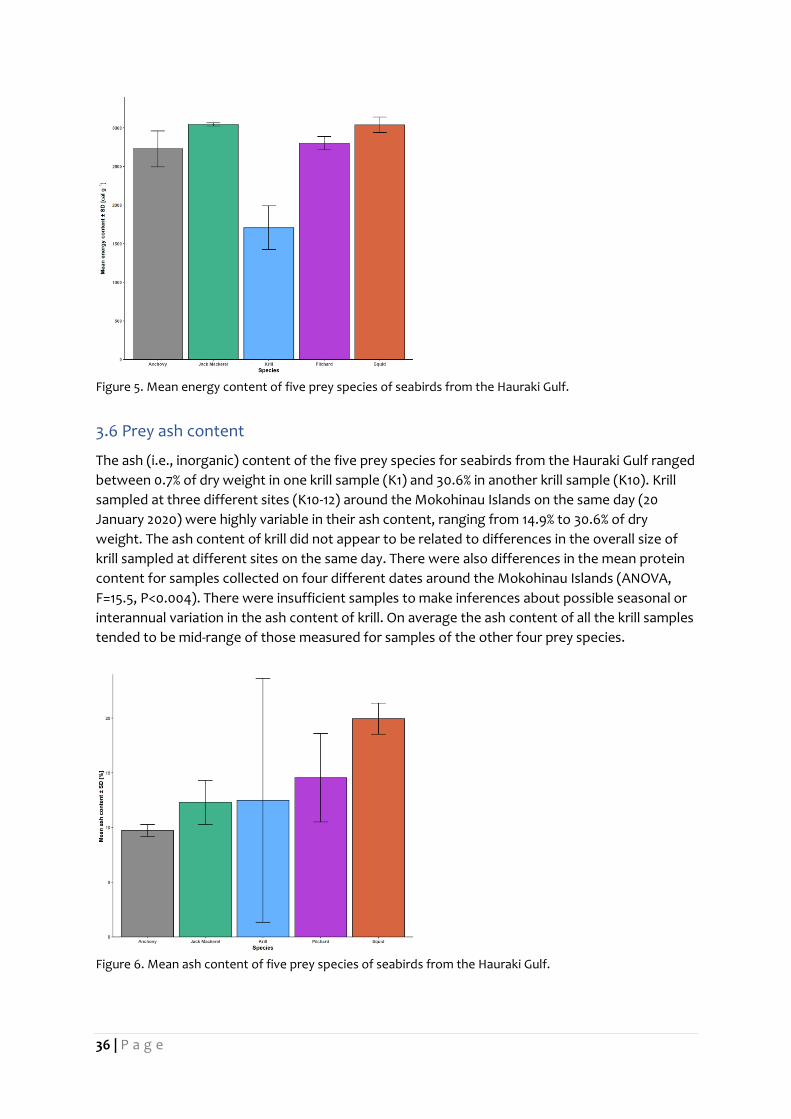
3.6 Prey ash content
The ash (i.e., inorganic) content of the five prey species for seabirds from the Hauraki Gulf ranged
between 0.7% of dry weight in one krill sample (K1) and 30.6% in another krill sample (K10). Krill
sampled at three different sites (K10-12) around the Mokohinau Islands on the same day (20
January 2020) were highly variable in their ash content, ranging from 14.9% to 30.6% of dry
weight. The ash content of krill did not appear to be related to differences in the overall size of
krill sampled at different sites on the same day. There were also differences in the mean protein
content for samples collected on four different dates around the Mokohinau Islands (ANOVA,
F=15.5, P<0.004). There were insufficient samples to make inferences about possible seasonal or
interannual variation in the ash content of krill. On average the ash content of all the krill samples
tended to be mid-range of those measured for samples of the other four prey species.
Figure 6. Mean ash content of five prey species of seabirds from the Hauraki Gulf.

37 | P a g e
4 DISCUSSION
The nutritional analyses of the five prey species from seabirds in the Hauraki Gulf all have
moderate moisture content (63.0 - 96.0%), high lipid (6.5 – 21.2%) and protein content (25 - 85%),
mostly low ash content (0.7 – 30.6%), and consequently relatively high energy content (1054 –
3062 calories g-1). The relatively high nutritional value of these species, as well as their availability
in the Hauraki Gulf, is likely to be the major reasons why these species are targeted as prey. In
contrast, 54 samples of 30 species of macrozooplankton caught off the east coast of New
Zealand had comparative ranges of 79.2 – 98.1% of moisture content, 0.1 – 27.9% for lipid, 1.9 –
54.2% for protein, and 3.9–76.4% for ash (Wang et al. 2013). A wider review of the nutritional
composition of macrozooplankton species found that crustacean species protein on average was
higher than in most other groups of zooplankton (i.e., 46.7 ± 6.0% mean ± SE) and so too was
average lipid content higher than for other zooplankton groups (i.e., 23.8 ± 4.5%) (Wang and Jeffs
2014).
The fish and squid prey species of seabirds (6.5 - 11.5%) also had characteristically high lipid
content. In comparison an analysis of 142 fish species from Australian waters found an average of
1% of wet weight as lipid (~3.5% of dry weight) in their tissues (Nichols et al. 1998; Brown et al.
1989). Only a relatively small number of pelagic fish species in these Australian studies had higher
lipid content. Likewise, adult arrow squid in Australian study were found to have relatively low
lipid content unlike in the present study, i.e., ~3.5% of dry weight (Nichols et al. 1998).
Fish flesh protein content is typically between 10 and 30% of wet weight, i.e., ~25 – 80% by dry
weight (Lozano & Hardisson 2003). In comparison, the fish and squid prey species of seabirds (64
- 76%) had characteristically high protein content.
Krill are a group of small crustacean species belonging to the order Euphausiaceae, which are an
important component of zooplankton communities, particularly in the pelagic ecosystem of the
Southern Ocean. Krill are effective grazers on phytoplankton, often forming large aggregations,
which make them important prey for many species, including commercially important fish,
seabirds and whales, (Smith 1991; Byrd et al. 1997; Shuntov et al. 2000). Studies of the nutritional
composition of different species of krill show they can differ among males, females and juveniles,
and with their overall size (Färber-Lorda et al. 2009). Lipid content of krill also ranges widely from
12 to 50% of dry weight due to seasonality (Saether et al. 1986). There is a simulated seasonal
cycle of lipid variation in adult krill, with low lipid concentrations in spring and a strong increase in
lipid values until autumn (Falk-Petersen et al. 2000).
For all reported analyses of different species of krill the lipid content is highly variable ranging
from 5.2 - 46.6% of dry weight, with a mean (±S.E.) of 22.2 ± 2.8% (Wang & Jeffs 2014), which was
comparable to the results in the current study (8.1 - 21.2%). Krill also have consistently been found
to have a high protein content, which is 36.1 – 62.4% of dry mass and mean (±S.E.) of 49.0 ± 2.1%
(Wang & Jeffs 2014), which is also comparable to the current study (25 – 80%). The overall mean
energy content of krill reported in previous studies is 5616 calories g−1 of dry mass (Wang & Jeffs
2014) which is higher than for the current study (1054.2 – 2252.1 calories g−1).
In the current study, the size and nutritional quality of krill sampled from the zooplankton around
the Mokohinau Islands varied markedly with sampling event and sampling location. Such high
variability in the nutritional condition of krill would be likely to affect seabirds with a high reliance
of foraging for krill. Unfortunately, there is very little information about krill ecology in the
Hauraki Gulf from which to draw any other conclusions. Further research into krill biology in the

38 | P a g e
Hauraki Gulf is therefore warranted given a number of studies overseas have found that fishing
pressure and natural variability in krill populations can have a significant effect on the
performance of seabird populations with a high reliance on them as a food resource (Santora et
al., 2017; Scopel & Diamond 2018; Krüger et al., 2021).
5 REFERENCES Adams, N. 2019. Diet and trophic interactions of Australian gannet Morus serrator – samples
collected 2018-2019. (appendix 2 in Gaskin 2019 Indirect effects on seabirds in northern North Island POP2017-06. Identification of diet samples collected from seabirds).
Bligh, E.G., Dyer, W.J. (1959). A rapid method of total lipid extraction and purification. Canadian Journal of Biochemistry and Physiology, 37, 911-917.
Brown, A.J., Roberts, D.C.K., Tuswell, A.S. (1989) Fatty acid composition of Australian marine finfish: a review. Food Australia 41, 655-666.
Byrd, G.V., Williams, J.C., Artukhin, Y.B., Vyatkin, P.S. (1997) Trends in populations of red-legged kittiwake Rissa brevirostris, a Bering Sea endemic. Bird Conservation International 7, 167– 180.
Falk-Petersen, S., Hagen, W., Kattner, G., Clarke, A., Sargent, J. (2000) Lipids, trophic relationships, and biodiversity in Arctic and Antarctic krill. Canadian Journal of Fisheries and Aquatic Sciences 57, 178– 191.
Färber-Lorda, J., Gaudy, R., Mayzaud, P. (2009) Elemental composition, biochemical composition and caloric value of Antarctic krill. Implications in energetics and carbon balances. Journal of Marine Systems 78, 518– 524.
Kooijman, S. A.L.M. (2020). The comparative energetics of petrels and penguins. Ecological Modelling 427, 109052.
Kozmian-Ledward, L., Jeffs, A., Gaskin, C. (2020). POP2019-02: Fish shoal dynamics in north-eastern New Zealand. Final report summarising analysis of zooplankton samples collected 2019-2020. Department of Conservation, Wellington.
Krüger, L., Huerta, M.F., Santa Cruz, F., Cárdenas, C.A. (2021). Antarctic krill fishery effects over penguin populations under adverse climate conditions: Implications for the management of fishing practices. Ambio 50 (3), 560-571.
Lozano, G., Hardisson, A. (2003). Fish as food. in Encyclopedia of Food Sciences and Nutrition (Second Edition), Eds, Luiz Trugo and Paul M. Finglas, Elsevier Science Ltd. pp. 2417-2423
MacDiarmid, A., Cleaver, P., Stirling, B. (2015). Historical evidence for the state and exploitation of marine fish and invertebrate resources in the Hauraki Gulf and along the Otago-Catlins shelf 1769 – 1950. Draft New Zealand Aquatic Environment and Biodiversity Report held by Ministry for Primary Industries. 615 p.
MacDiarmid, A., Smith, I., Paul, L., Francis, M., McKenzie, A., Parsons, D., Hartill, B., Stirling, B., Cleaver, P. (2012). A complete history of the exploitation of an ecologically important inshore finfish species in the Hauraki Gulf, New Zealand: a synthesis of archaeological, historical and fisheries data. Draft New Zealand Aquatic Environment and Biodiversity Report held by Ministry for Primary Industries, 38 p.
MacDiarmid, A.B., Abraham, E., Baker, C.S., Carroll, E., Chagué-Goff, C., Cleaver, P., Francis, M.P., Goff, J., Horn, P., Jackson, J.A., Lalas, C., Lorrey, A., Marriot, P., Maxwell, K., McFadgen, B., McKenzie, A., Neil, H., Parsons, D., Patenaude, N., Paton, D., Paul, L.J., Pitcher, T., Pinkerton, M.H., Smith, I., Smith, T.D., Stirling B. (2016). Taking Stock – the changes to New Zealand marine ecosystems since first human settlement: synthesis of major findings, and policy and management implications. New Zealand Aquatic Environment and Biodiversity Report No. 170. 48 p.

39 | P a g e
Mauchline, J. (1980). Measurement of the length of Euphausia superba Dana. BIOMASS Handb. 4, 1-9.
Nichols, P., Mooney, B., Virtue, P., Elliot, N. (1998). Nutritional value of Australian fish: Oil, fatty acid and cholesterol of edible species. Fisheries Research and Development Corporation, Project 95/122.
Saether, O., Ellingsen, T.E., Mohr, V. (1986). Lipids of North Atlantic krill. Journal of Lipid Research 27: 274– 285.
Santora, J.A., Dorman, J.G., Sydeman, W.J. (2017). Modeling spatiotemporal dynamics of krill aggregations: size, intensity, persistence, and coherence with seabirds. Ecography 40 (11), 1300-1314.
Scopel, L.C., Diamond, A.W. (2018). Predation and food–weather interactions drive colony collapse in a managed metapopulation of arctic terns (Sterna paradisaea). Canadian Journal of Zoology 96 (1), 13-22.
Shuntov, V.P., Dulepova, E.P., Gorbatenko, K.M., Slabinskii, A.M., Efimkin, A.Y. (2000). Feeding of the walleye pollack Theragra chalcogramma in the Anadyr–Navarin Region of the Bering Sea. Journal of Ichthyology 40, 370– 377.
Smith S.L. (1991). Growth, development and distribution of the euphausiids Thysanoessa raschi (M. Sars) and Thysanoessa inermis (Krøyer) in the southeastern Bering Sea. Polar Research 10, 461– 478.
Smith, P.K., Krohn, R.I., Hermanson, G.T., Mallia, A.K., Gartner, F.H., Provenzano, M.D., Fujimoto, E.K., Goeke, N.M., Olson, B.J., Klenk, D.C. (1985). Measurement of protein using bicinchoninic acid. Analytical Biochemistry, 150, 76-85.
Wang, M., Jeffs, A. G. (2014). Nutritional composition of potential zooplankton prey of spiny lobster larvae: a review. Reviews in Aquaculture 6, 1753-5123.
Wang, M., O’Rorke, R., Nodder, S.D., Jeffs, A.G. (2013). Nutritional composition of potential zooplankton prey of the spiny lobster phyllosoma (Jasus edwardsii). Marine and Freshwater Research 65, 337-349.

40 | P a g e
Plankton net during tow showing flowmeter, krill entering the net, and a fish school in the lower
background. Videography screenshot: NNZST