department of defense legacy resource management program · pdf filedepartment of defense...
TRANSCRIPT

1
Department of Defense Legacy Resource Management Program
PROJECT 08-346
Document Status: Final
Status of Utah Bats
Joel M. Diamond1, Robert N. Knight2, Lauren B. Wilson3, Kimberly Asmus-
Hersey4, and Ben Sutter5
1 General Dynamics, Inc.
2 Natural Resources Program Manager, U.S. Army Dugway Proving Ground 3 Biologist, U.S. Army Dugway Proving Ground
4Sensitive Species Biologist, Utah division of Wildlife Resources 5 Database Zoologist, Utah Natural Heritage Program
January 27, 2009
2
Table of Contents Page
EXECUTIVE SUMMARY.………………………………………………………3 LIST OF TABLES………………………………………………………………...4 LIST OF FIGURES………………………………………………………………..5 INTRODUCTION .................................................................................................10 METHODS ............................................................................................................17 RESULTS ..............................................................................................................21 Data Summary ..................................................................................................21 Survey Effort/Area............................................................................................21 Occurrence ........................................................................................................32 Diversity............................................................................................................40 Abundance ........................................................................................................73 Breeding/Roosting Habitat................................................................................81 Environmental Associations .............................................................................83 DISCUSSION........................................................................................................85 IMPLICATIONS .................................................................................................100 LITERATURE CITED ........................................................................................101 Appendix I ...........................................................................................................104 Appendix II ..........................................................................................................107

3
Executive Summary
Bat populations and communities have been monitored in Utah for over 100 years, on 12 land owner types including department of defense (DoD) lands. The Legacy Resource Management Program (Phase I) funding enabled a consolidation of all known bat data in the State of Utah. This data base until the Legacy II funding award had not been analyzed across space and time within the state. DoD land managers use Integrated Natural Resources Management Plans (INRMPs) to guide sustainable management practices to ensure that testing and training areas continue to function without restrictions. This regional approach to managing bats within Utah and specifically understanding regional trends and patterns on DoD land directly supports stewardship objectives and goals fundamental to sound land management policies within the DoD. These data were analyzed within 6 objectives (survey effort, occurrence, diversity, abundance, roosting and breeding locations and environmental associations), across 6 scales (ecoregion, physiographic province, land cover, Utah Division of Wildlife Resources (UDWR) regions, land owner type, and county). Analysis was conducted with frequency distributions across bat events and associated objectives and scales. Survey effort was lowest in Utah’s West Desert, the Uinta Basin, and extreme southeastern Utah. The Colorado Plateau ecoregion had the highest survey effort, occupancy, diversity and abundance. Bureau of Land Management (BLM) lands had the highest occupancy and diversity followed closely by National Park Service and DoD lands. Utah’s 6 tier II sensitive bat species were most common in the Southern and Southeastern UDWR regions. The highest diversity land cover for bats in Utah was sagebrush grasslands. These grasslands are/were the primary land cover type on DoD lands in the State. The lowest bat diversity land cover type was annual forb dominated communities, which are often the state of degraded sagebrush grasslands. This analysis indicates that there is a need to develop statewide monitoring protocols as completed with Legacy II funding and risk assessment and threat evaluation and management as is proposed in the Legacy III project.

4
List of Tables Table Page
1 Number of individual bats and events recorded by each of 16 collection entity types. ....................................................................................................14
2 DoD needs stated in the DoD Legacy Program Phase II Proposal ................16 3 UDWR needs stated in the DoD Legacy Program Phase II Proposal.............16 4 Combined needs for the DoD and UDWR expressed in six objectives..........16

5
List of Figures Figure Page
1 Number of individual bats captured across years for Utah’s 19 bat species. .............................................................................................................22
2 Percentage of capture events across months for Utah’s 19 bat species ...........24 3 Percent of area and events recorded in each of 5 ecoregions ..........................25 4 Percent of area and events recorded in each of 5 physiographic provinces.....26 5 Percent of area and events recorded in each of Utah’s land cover types.........27 6 Percent of area and events recorded in each of 5 UDWR Regions. ................28 7 Percent of area and events recorded in each of 5 UDWR Regions .................29 8 Percent of area and events recorded in each of 29 counties ............................30 9 Density of data collection events in the State of Utah. Each data point
has a 5 km radius of activity zone....................................................................31 10 Bat presence across Utah’s 5 ecoregions for 19 bat species............................33 11 Bat presence across Utah’s 5 physiographic provinces for 19 bat species ......34 12 Number of cover types that each of 19 bat species was recorded in,
across 61 (SW Re-GAP) land cover types.......................................................36 13 Presence of 19 bat species across 12 land owner types ..................................37 14 Presence of 19 bat species across the 5 UDWR Regions ...............................38 15 Presence of 19 bat species across 29 Utah counties .......................................39 16a Bat diversity in the Colorado Plateau shrublands, proportional abundance
of 19 bat species.............................................................................................. 40 16b Bat diversity in the Great Basin shrub steppe, proportional abundance
of 19 bat species...............................................................................................41 16c Bat diversity in the Mojave Desert, proportional abundance of 19 bat species ............................................................................................................41

6
16d Bat diversity in the Wasatch and Uinta montane forests, proportional abundance of 19 bat species...........................................................................42
16e Bat diversity in the Wasatch and Uinta montane forests, proportional
abundance of 19 bat species...........................................................................42 17 Shannon-Weiner diversity indices, based on the diversity and evenness of
species across ecoregions...............................................................................43 18a Bat diversity for the Basin and Range physiographic provinces, proportional
bat abundance in Utah....................................................................................44 18b Bat diversity for the Colorado Plateau physiographic provinces, proportional
bat abundance in Utah....................................................................................45 18c Bat diversity for the Columbia Plateau physiographic provinces, proportional
bat abundance in Utah....................................................................................45 18d Bat diversity for the Middle Rocky Mountains physiographic provinces,
proportional bat abundance in Utah...............................................................46 18e Bat diversity for the Basin and Range physiographic provinces, proportional
bat abundance in Utah....................................................................................46 19 Shannon-Weiner diversity indices, based on the diversity and evenness of
species across physiographic provinces...........................................................47 20 Proportion of total bat inventory events for each of Utah’s 19 bat species
across 61 SW Re-GAP vegetation types..........................................................49 21 Shannon-Weiner diversity index, based on the diversity and evenness of
species across 61 cover types...........................................................................50 22a Proportion of total bat inventory events for each of Utah’s 19 bat species on
the BLM landowner type ................................................................................51 22b Proportion of total bat inventory events for each of Utah’s 19 bat species
on the DoD landowner type .............................................................................52 22c Proportion of total bat inventory events for each of Utah’s 19 bat species
on the NPS landowner type.............................................................................52 22d Proportion of total bat inventory events for each of Utah’s 19 bat species
on the Private landowner type........................................................................53

7
22e Proportion of total bat inventory events for each of Utah’s 19 bat species on the SITLA landowner type........................................................................53
22f Proportion of total bat inventory events for each of Utah’s 19 bat species
on the SL&F landowner type.........................................................................54 22g Proportion of total bat inventory events for each of Utah’s 19 bat species
on the Tribal landowner .................................................................................54 22h Proportion of total bat inventory events for each of Utah’s 19 bat species
on the UDWR landowner type ......................................................................55 22i Proportion of total bat inventory events for each of Utah’s 19 bat species
on the USFS landowner type .........................................................................55 22j Proportion of total bat inventory events for each of Utah’s 19 bat species
on the UFWS landowner type........................................................................56 22k Proportion of total bat inventory events for each of Utah’s 19 bat species
on the USP landowner type............................................................................56 22l Proportion of total bat inventory events for each of Utah’s 19 bat species
on the Water landowner type .........................................................................57 23 Shannon-Weiner diversity indices, based on the diversity and evenness of
species across land owner types.....................................................................58 24a Proportion of total bat inventory events for each of Utah’s 19 bat species
within the Southern UDWR region................................................................59 24b Proportion of total bat inventory events for each of Utah’s 19 bat species
within the Southeastern UDWR region .........................................................59 24c Proportion of total bat inventory events for each of Utah’s 19 bat species
within the Northern UDWR region................................................................60 24d Proportion of total bat inventory events for each of Utah’s 19 bat species
within the Northeastern UDWR region .........................................................60 24e Proportion of total bat inventory events for each of Utah’s 19 bat species
within the Central UDWR .............................................................................61 25 Shannon-Weiner diversity indices, based on the diversity and evenness of
species across UDWR Regions......................................................................62 26a Proportion of pallid bat events for each of Utah’s 29 Utah counties .............63

8
26b Proportion of Townsend’s big-eared bat events for each of Utah’s 29 Utah counties .................................................................................................63
26c Proportion of big brown bat events for each of Utah’s 29 Utah
counties ..........................................................................................................64 26d Proportion of spotted bat events for each of Utah’s 29 Utah counties ..........64 26e Proportion of Allen’s big-eared bat events for Utah’s counties in which it
occurs .............................................................................................................65 26f Proportion of western red bat events for Utah’s counties in which it occurs 65 26g Proportion of hoary bat events for each of Utah’s 29 Utah counties.............66 26h Proportion of silver-haired bat events for each of Utah’s 29 Utah counties..66 26i Proportion of California myotis events for each of Utah’s 29 Utah counties67 26j Proportion of western small-footed myotis events for each of Utah’s 29
Utah counties. ................................................................................................67 26k Proportion of long-eared myotis events for each of Utah’s 29 Utah
counties ..........................................................................................................68 26l Proportion of little brown myotis events for each of Utah’s 29 Utah
counties ..........................................................................................................68 26m Proportion of Arizona myotis events for Utah’s counties in which it occurs 69 26n Proportion of fringed myotis events for each of Utah’s 29 Utah counties ....69 26o Proportion of long-legged myotis events for each of Utah’s 29 Utah
counties ..........................................................................................................70 26p Proportion of Yuma myotis events for each of Utah’s 29 Utah counties ......70 26q Proportion of big free-tailed bat events for each of Utah’s counties in
which it occurs ...............................................................................................71 26r Proportion of western pipistrelle events for each of Utah’s counties in
which it occurs ...............................................................................................71 26s Proportion of Brazilian free-tailed bat events for each of Utah’s 29 Utah
counties in which it occurs.............................................................................72

9
27. Shannon-Weiner diversity index, based on the diversity and evenness of species across Utah’s 29 counties...............................................................................72
28 Density of Townsend’s big-eared bat data collection events in the State of
Utah ................................................................................................................74 29 Density of spotted bat data collection events in the State of Utah.................75 30 Density of Allen’s big-eared bat data collection events in the State of Utah 76 31 Density of western red bat data collection events in the State of Utah..........77 32 Density of Arizona myotis data collection events in the State of Utah. ........78 33 Density of fringed myotis data collection events in the State of Utah...........79 34 Density of big-free tailed bat data collection events in the State of Utah......80 35 Utah bat species activity allocation between day and night roosting,
hibernation, maternity roosting and foraging behaviors ................................82 36 Utah bat species elevational distribution .......................................................84 37 Location precision for the data set from high to low for 13,893 total bat
events. ........................................................................................................... 85

10
INTRODUCTION
Many bat populations in North America are thought to be declining (Stebbings 1980,
McCracken 1988, Richter et al.1993, Tudge 1994, Altingham 1996). The International Union for
Conservation of Nature (IUCN) lists 10% of microchiroptera species as threatened (Mickleburgh
et al. 2002). The combination of slow reproduction, natural rarity and genetic isolation make bats
susceptible to population and range declines (Racey and Entwistle 2003). Of 45 bat species in the
United States, six are listed as federally endangered and 19 are former candidates for listing
(Code of Federal Regulations 1991; USFWS 2008). Of Utah’s 18 species, 6 are tier II species of
concern in the Utah comprehensive wildlife conservation strategy (WAP) (UDWR 2005).
Apparent declines in bat species may be attributed, in part, to loss of suitable habitat due to
increased human recreational activity (caving and climbing), mine closure programs, and
urbanization (Humphrey and Kunz 1976).
Eighteen bat species have been documented in Utah (Oliver 2000). A nineteenth species,
the Arizona myotis (Myotis occultus) has been categorized as a subspecies of little brown myotis
(Myotis lucifugus) and as an independent species (Oliver 2000). In this document, we treat the
Arizona myotis as an independent species. The WAP and the draft Utah Bat Conservation Plan
identify specific threats to each tier II species and general action required to mitigate these
threats (UDWR 2005; Oliver et al. draft).
Townsend’s big-eared bat (Corynorhinus townsendii) is threatened by human disturbance
(maternity roosts), habitat loss (mine closures), and a general lack of information. In order to
mitigate these threats, the Utah Division of Wildlife Resources (UDWR) recommends control
and monitoring of disturbance, restoration of degraded habitats, population level monitoring, and
increased research.

11
Spotted bats (Euderma maculatum) are threatened by human activities. Direct and
indirect human disturbances are the primary threats to this species. Rock climbing has the
potential to disturb this crevice roosting species (Adams 2003). Scientific collecting and
harvesting via mist nets is related to mortality. Environmental contamination and
bioaccumulation via pesticides may also be linked to this species conservation status (Oliver et
al. draft 2008). To mitigate these threats, the UDWR recommends habitat monitoring and
research, control and monitoring of disturbance, and population monitoring and research.
Human activities threaten Allen’s big-eared bat (Idionycteris phyllotis) populations.
Direct human disturbances via mine closures and roost disturbances, along with environmental
contamination and pesticide use and highway development (Oliver et al. draft 2008). The lack of
information about this species also threatens populations. The UDWR recommends control and
monitoring of disturbance, population monitoring and research, and habitat conservation.
Western red bats (Lasiurus blossevillii) are threatened by human disturbance. The
development and alteration of riparian roosting habitats is a significant threat to populations of
this species (UDWR 2005; Oliver et al. draft 2008). The lack of information on the taxonomy of
this species also impacts management. These threats can be mitigated by control and monitoring
of disturbance, population monitoring and research, as well as the protection and restoration of
significant areas.
The fringed myotis (Myotis thysanodes) is threatened by roost disturbance, habitat loss in
riparian zones, the general lack of information about population trends, and the impacts of
habitat alteration. The UDWR recommends control and monitoring of disturbance, population
monitoring and research, and habitat monitoring and research (UDWR 2005; Oliver et al. draft
2008).

12
The big free-tailed bat (Nyctinomops macrotis) is threatened by many of the same sources
described above. Threats to this species include environmental contamination via pesticides,
scientific collecting, and the limited distribution of this species (UDWR 2005; Oliver et al. draft
2008). To mitigate these threats the UDWR recommends population monitoring and research
and investigations to determine and address factors limiting recovery.
Although the Arizona myotis (Myotis occultus) is not addressed independently in the
above action plans, the threats and general recommendations likely align with mitigating direct
and indirect human activities. The taxonomic uncertainty concerning this species is also a threat.
The 12 bat species in the state that are not of direct conservation concern are also threatened by
the above mentioned factors (Oliver et al. draft 2008).
Common among the above listed threats and actions are the lack of information on basic
ecology and population trends and the need for more research. Therefore, in order to address bat
declines and sensitive species management more fully, it is necessary to evaluate the current
status, recognize ecological associations, identify potential threats, and avoid or mitigate those
threats to bats (Racey and Entwistle 2003). Historical data collections provide a measure of
species distribution and can be used to establish the current status of bats. The status of bats can
then be used to discover ecological associations and to mitigate threats.
Bat species in Utah have been sampled by federal and state agencies, universities, local
contractors, private researchers, and non-profit groups for 103 years. Although some of these
data have been analyzed independently, there has been no comprehensive analysis of survey
effort, occurrence, diversity, abundance, breeding and roosting habitat, environmental
associations or (Pers. Comm. Oliver). Additionally, the existing data were scattered among
federal, state, private, and university information holdings making large-scale questions of bat
13
ecology and management difficult to address. To deal with that issue, biologists at Dugway
Proving Ground in cooperation with members of the Utah Bat Conservation Cooperative
(UBBC), an organization comprised of members from 14 land and resource management
agencies, received DoD funded Legacy Resource funding to consolidate and organize all existing
bat data in Utah into a centralized geodatabase (BATBASE). To date, the BATBASE data set is
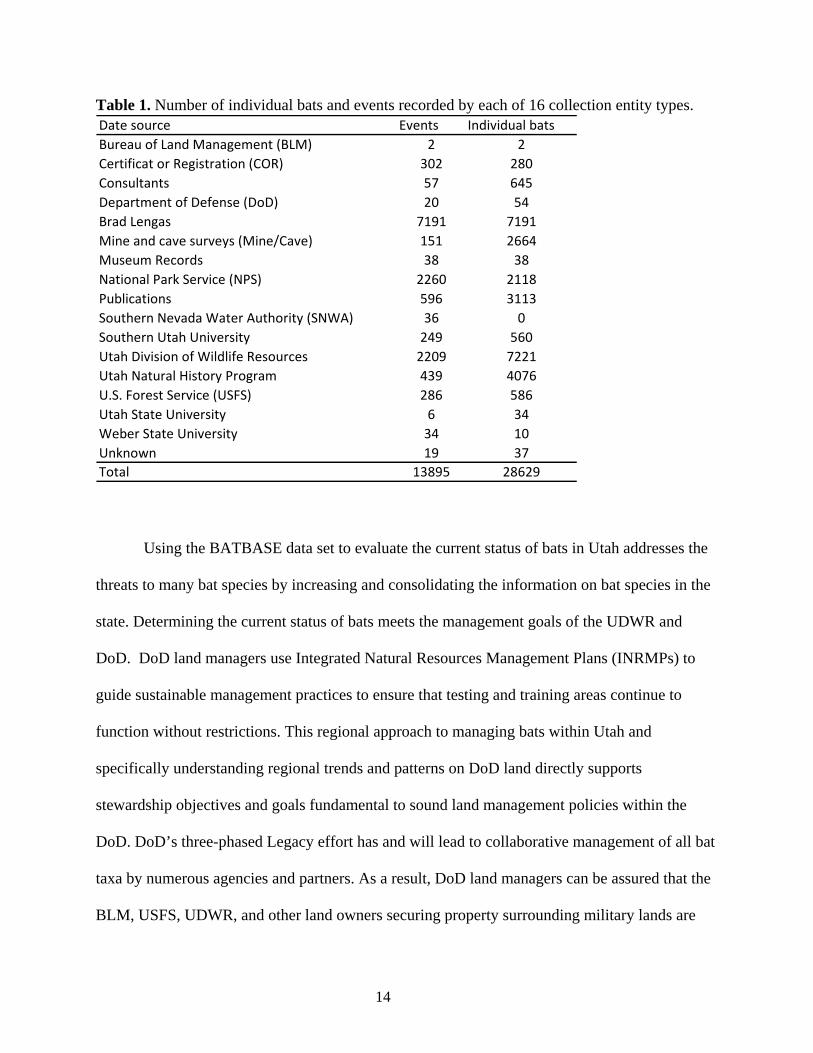
the result of 16 types of contributors, over 150 observers, 13,876 events (records), and 28,629
individual bat records (Table 1). These data provide a location and presence for species and
number of individuals. The wide scale of contributors to the BATBASE dataset and the UBCC
provide a level of collaboration that is rare in wildlife management. Using the BATBASE data
set to evaluate the current status of bats in Utah addresses the threats to many bat species by
increasing and consolidating the information on bats in the state. Determining the current status
of bats meets the management goals of the DoD, UDWR, and partners within the UBCC.
14
Table 1. Number of individual bats and events recorded by each of 16 collection entity types. Date source Events Individual batsBureau of Land Management (BLM) 2 2Certificat or Registration (COR) 302 280Consultants 57 645Department of Defense (DoD) 20 54Brad Lengas 7191 7191Mine and cave surveys (Mine/Cave) 151 2664Museum Records 38 38National Park Service (NPS) 2260 2118Publications 596 3113Southern Nevada Water Authority (SNWA) 36 0Southern Utah University 249 560Utah Division of Wildlife Resources 2209 7221Utah Natural History Program 439 4076U.S. Forest Service (USFS) 286 586Utah State University 6 34Weber State University 34 10Unknown 19 37Total 13895 28629
Using the BATBASE data set to evaluate the current status of bats in Utah addresses the
threats to many bat species by increasing and consolidating the information on bat species in the
state. Determining the current status of bats meets the management goals of the UDWR and
DoD. DoD land managers use Integrated Natural Resources Management Plans (INRMPs) to
guide sustainable management practices to ensure that testing and training areas continue to
function without restrictions. This regional approach to managing bats within Utah and
specifically understanding regional trends and patterns on DoD land directly supports
stewardship objectives and goals fundamental to sound land management policies within the
DoD. DoD’s three-phased Legacy effort has and will lead to collaborative management of all bat
taxa by numerous agencies and partners. As a result, DoD land managers can be assured that the
BLM, USFS, UDWR, and other land owners securing property surrounding military lands are

15
doing their part to manage for species that could affect mission and essential testing and training
activities on DoD lands. If all agencies are utilizing sufficient management practices for species
that could affect mission readiness then military land managers can be assured that at some point
in the future, DoD property will not be the sole location for federally listed threatened and
endangered species that so many DoD installations throughout the United States have become.
Only through active state-wide bat management can population decline be detected in
meaningful timeframes.
In order to meet Mission sustainment objectives of the Department of Defense (DoD), a
DoD Legacy Program Proposal was developed and coordinated with several federal and state
agencies as well as the state bat working group (UBCC), targeting implementation of the
UDWR’s CWCS (WAP) and DoD’s INRMPs. To meet the goals of the Legacy II proposal and
UDWR, 6 objectives were created by synthesizing the goals of the 2 agencies (Tables 2, 3, and
4). The following objectives provided an estimation of the status of bats in Utah: (Objective 1)
evaluate the survey effort across spatial scales in Utah, (Objective 2) determine the occurrence of
bat species across the state on multiple scales, (Objective 3) estimate the bat species diversity
across scales within the state, (Objective 4) create a measure of species abundance across space,
(Objective 5) identify roosting and breeding habitat, and (Objective 6) identify broad-scale
environmental associations.

16
Table 2. DoD needs stated in the DoD Legacy Program Phase II Proposal. DoD Needs
A Diversity indices X Habitat ModelB Occurrence X Elev. GradientsC Abundance X SiteD Maternity and hibernaculum X Roost LocationsE Survey effort / Time; species saturation curves/ CountyF Breeding season status and breeding range by speciesG Bat Activity X TemperatureH Gap Analysis; Ecology and BiologyI Measurable Conservation objectives
Table 3. UDWR needs stated in the DoD Legacy Program Phase II Proposal. UWDR Needs
1 Ecological quality by site (Presence data only)2 Ecological value of a site via model3 Increase habitat suitablility / Avoid Degradation4 ID translocation and reintroduction 5 Ecologically and biologically informed Restoration of habitat
Table 4 . Combined needs for the DoD and UDWR expressed in six objectives. Objectives DoD needs UDWR NeedsSurvey effort/area E, H, I 4, 5Occurrence B, C, I 1,5Diversity A, C, I 3, 5Abundance indices A, C, I 2, 3, 5Roosting / Breeding habitat D, F, I 1, 2, 3, 4, 5Environmental associations A, G, I 1, 2, 3, 4, 5

17
METHODS
All data were analyzed on 3 ecological scales: ecoregion (World Wildlife Fund global
Ecoregions), physiographic province (Utah Geological Survey) and land-cover classification
(SWGAP). This allowed for analysis of bat use and distribution at varying scales to address
specific needs. The ecoregion scale provided us with a broad view of ecological associations
while the physiographic provinces allowed for an evaluation of broad scale land-form
relationships. Land cover was evaluated with southwestern Re-GAP (SW Re-GAP) data at a 30m
pixel scale for interpretation of species and environmental associations. These three ecological
scales provided an estimate of species and habitat associations in specific cover types.
We also analyzed all data on three managerial scales: landowner type, UDWR region,
and county. The landowner analysis provided species occurrences under classes of management.
UDWR’s regions were used to establish a listing of species presence and magnitude. By
analyzing these data on a county scale, we obtained a finer assessment by management scale. We
used a frequency analysis (PROC FREQ) comparing the number of events by species in each of
the 6 management scales in SAS®. This analysis serves as a descriptive data layout providing an
overview of the entire data set (pers comm. S. Durham) with such a diverse (temporal, spatial,
and methodological) data set.
The ecoregion scale had a total of 5 classes (Colorado Plateau shrublands, Great Basin
shrub steppe, Mojave desert, Wasatch and Uinta montane forest, and Wyoming Basin shrub
steppe) as did the physiographic province (Basin and Range, Colorado Plateau, Columbia
Plateau, Middle Rocky Mountains, and Wyoming Basin). The land cover scale (SW Re-GAP)
had 61 classes (Appendix I). We categorized landowner into 12 classes (Bureau of Land
Management (BLM), DoD, National Park Service (NPS), Private, State Institutional Trust Land

18
Administration (SITLA), State Sovereign Land (SL& F), Tribal, UDWR, Parks and Recreation
(USP), U.S. Fish and Wildlife Service (USFWS), U.S. Forest Service (USFS), and Open Water),
as well as 5 UDWR regions (Central, Northern, Northeastern, Southern, and Southeastern), and
29 counties (Appendix II).
Objective 1: Analysis of bat use was affected by total survey effort differences
throughout Utah. Given that the data were collected by more than 150 separate observers, across
103 years and 16 management entities, survey effort is difficult to define and thus to evaluate.
This entire data set was analyzed for the survey effort at each of the 6 scales and associated 116
classes. The resulting data set was then visually assessed for variation. Those locations with no
event cover were considered to have had no survey effort, while those with a dark cover were
assumed to have had high survey intensity. We also used a Chi-squared test to compare the
percent of total events (observed) within each of the 6 analysis scales and the percent of Utah
land cover within each scale (expected). Data collection methods were also compared across
scales and classes with the use of a frequency analysis (PROCFREQ) in SAS®.
Objective 2: Evaluate overall bat occurrence, we used the number of capture events
recorded in Utah by species and then created a frequency distribution across species and
analyzed for each scale (i.e., ecoregion, physiographic province, land cover classification, land
owner, UDWR region, and county). Analysis was conducted using PROCFREQ in SAS® and
visual analysis in Excel®. The occurrence data were then used to create a diversity analysis.
Objective 3: Diversity was measured in two ways: number of species events and a
diversity and evenness index in each of the 6 scales and associated 116 classes. Events were
defined as number times a species was captured within each of the scales and associated classes.
Events were used rather than number of individuals captured per event to reduce the influence of
19
high magnitude capture events on species evenness. The six scales were analyzed via a
frequency distribution across classes within scales. The Shannon-Weiner diversity index was
used with each class across all scales, a total of 116 classes. These classes were then compared
within each of the six scales. Both of these measures were used to evaluate diversity. Analysis
was conducted with PROCFREQ in SAS® and Excel®.
In order to evaluate Objective 4, the overall relative abundance, we used a frequency
analysis. The density of events was evaluated by comparing scale layers and event frequency.
We buffered each point with a 5-km radius. This assumes that the bat event was detectable at this
scale and this radius is a hedged estimate of the area of habitat represented by each event. This
analysis was carried with ARCMAP GIS®, SAS® and Excel®.
Objective 5: distribution of breeding and roosting sites, provides an estimate of the
distribution of breeding populations and associated roosts. Maternity roosts provide a secure
location for females to give birth and rear their young throughout the summer season (Kunz
1982, Humphrey 1975). Hibernacula provide a winter refuge for bats (Johnson et al. 1998,
Kuenzi et al. 1999, Raesly et al. 1986). Day roosts are used by non-reproductive individuals of
both sexes while night roosts are utilized by all bats, regardless of reproductive status as a place
to rest and to digest their prey between foraging bouts (Kerth et al. 2001, Lacki 1994). Night
roosts are generally in different locations than day roosts and are used primarily at dawn and
dusk (Anthony et al. 1981). Interim roosts are used in the spring before the young are born and
again in the fall before retreating to the hibernation roosts (Dobkin et al. 1995, Twente 1955). To
evaluate bat reproduction throughout the state we analyzed reproductive status records. Although
the entire data set was categorized into common scales, only a subset (1247 of 13,847 events) of
data recorded individual reproductive status. We categorized all events with reproductive data

20
into reproductive or non-reproductive categories. Reproductive individuals were those reporting
one or more of the following: gravid, lactating, post-lactating, or testes scrotal. We analyzed the
number of reproductive events for each of the six scales and associated 116 classes. We used a
frequency analysis (PROCFREQ) in SAS® and Excel®. To interpret bat roost use in Utah, we
evaluated roost type records in the database. A small subset (less than 5%) of the total bat data
set recorded roost type. We categorized roost data into 3 types: maternity, day, night or
hibernation roost. A frequency analysis was used within scales across classes. This analysis was
conducted with SAS® and Excel®.
Objective 6 addressed bat distribution throughout the state, the association between
elevation and species occurrence. We evaluated elevation as a total model across all scales and
within the ecoregion scale across classes. Each event was categorized into one of six elevation
classes: <1000 m, 1001-1500 m, 1501-2000 m, 2001-2500 m, 2501-3000 m and >3000 m to
represent variation on the landscape. A frequency analysis (PROCFREQ) was conducted in
SAS® and Excel®. We used the habitat suitability scale developed for Legacy I and the density
estimates created via the density measures from objective four to create a percent agreement
between habitat suitability and density of events. The percent area for each of the suitable habitat
models from suitable for 0 species to suitable for up to 15 species was calculated. We created a
10 level event density scale and calculated the percent of total events within each. The habitat
suitability model was then used as the expected and the density measures the observed. Data
were evaluated with a Chi-squared test.

21
RESULTS
Data Summary
A total of 19 species were recorded within the BATBASE data set. Silver-haired bat
(Lasionycteris noctivagans) accounted for 1827 events, western pipistrelle (Pipistrellus
hesperus) 1825, Townsend’s big-eared bat 1309, big brown bat (Eptesicus fuscus) 1281, little
brown myotis (Myotis lucifugus) 1131, long-legged myotis (Myotis volans) 1052, long-eared
myotis (Myotis evotis) 946, pallid bat (Antrozous pallidus) 833, California myotis (Myotis
californicus) 780, Brazilian free-tailed bat (Tadarida brasiliensis) 724, hoary bat (Lasiurus
cinereus) 501, fringed myotis 416, western small-footed myotis (Myotis ciliolabrum) 378, Yuma
myotis (Myotis yumanensis) 355, Allen’s big-eared bat 166, big free-tailed bat 141, spotted bat
120, western red bat 19, and Arizona myotis 16.
Survey Effort (Objective 1)
Year
The majority of the data collected in the state of Utah over the last 103 years was
concentrated between 1986 and 2004 (Fig. 1). It is important to note that 3290 of 13,847 total
events lacked a date category, therefore many of the patterns observed in the data set across
years are due to data absence not bat absence. The first bat capture events were recorded in 1905
for 11 species (pallid bat, Townsend’s big-eared bat, big-brown bat, hoary bat, California myotis,
western small-footed myotis, long-eared myotis, fringed myotis, long-legged myotis, western
pipistrelle and Brazilian free-tailed bat). The silver-haired bat was first observed by 1914. While,
Allen’s big-eared bat was recorded in the data set by 1916 literature does not support records of

22
this species until 1969 (Black 1970). Western red bats were first observed in the data set by
1994; however, Presnell and Hall recorded this species in Utah as early as 1937. The little brown
myotis was first recorded in the literature in 1941 (Hardy), but does not appear in the data set
until 1992. Woodbury recorded big free-tailed bats as early as 1937, but they do not appear in the
data set until 1992. Spotted bats were not recorded in Utah in the data set until 1994 (Lengas),
however, Durrant observed them as early as 1935. The highest diversity (number of species) was
recorded from 1994 to 2008 and in 1903, 1941, 1942, and 1947. The lowest diversity was
recorded from 1948 to 1986.
1
10
100
1000
10000
1905
1915
1925
1935
1945
1955
1965
1975
1985
1995
2005
Number of individual bats captured across years
Figure 1. Number of individual bats captured across years for Utah’s 19 bat species. Data is represented on a log base 10 scale to allow for comparison of data across magnitude. The sum of all species was used to control for the 24% of events that lacked a date variable.

23
Month
Most of Utah’s bat species were only observed in a limited number of months (Fig. 2). As
mentioned above, many of the patterns observed in the data set across months are due to data
absence and not bat absence. The Townsend’s big-eared bat and the fringed myotis were
recorded from April to September in the data set. The spotted bat was only recorded from June to
August. Allen’s big-eared bat was observed from April to October. The western red bat was only
observed in June and July. Arizona myotis records exist from February to July. The big free-
tailed bat had records from all months except December. Big-brown bats, western pipistrelles
and the Brazilian free-tailed bat had observations from all 12 months. Total observations were
skewed heavily toward June, July, and August (7950 of 10,633 events). Cold season (Jan., Feb.,
Mar., Oct., Nov., and Dec.) data consisted of only 384 of the 10,633 events. Highest diversity
(number of species) was recorded June to August.

24
0%
50%
100%
pallid bat
Townsend’s B
ig-eared bat
big brown bat
spotted bat
Allen’s big-eared bat
western red bat
hoary bat
silver-haired bat
California m
yotis
western sm
all-footed myotis
long-eared myotis
little brown m
yotis
Arizona m
yotis
fringed myotis
long-legged myotis
Yum
a myotis
big free-tailed bat
western pipistrelle
Brazilian free-tailed bat
Percent total
Jan. Feb. Mar. A pr. May June July A ug. S ept.Oct. Nov. D ec.
Figure 2. Percentage of capture events across months for Utah’s 19 bat species.
Ecoregion
The total bat data set was dominated by capture events in the Colorado Plateau
shrublands, accounting for 48% of all data, Wasatch and Uinta montane forests 31%, the Great
Basin shrub steppe 19%, the Mojave Desert 1.6%, and the Wyoming Basin shrub steppe 0.4%.
The Great Basin shrub steppe covers 35% of Utah, Colorado Plateau 33%, Wyoming Basin
shrub steppe 14%, Mojave Desert 13%, and the Wasatch and Uinta montane forest 4% (Fig. 3).
The expected event distribution based on percent area was significantly (P < 0.001) different
from the actual distribution of events across ecoregions.
25
0%
25%
50%
Colorado Plateau
shrublands
Great Basin shrub steppe
Mojave desert Wasatch and Uinta montane
forests
Wyoming Basin shrub steppe
Area
Event
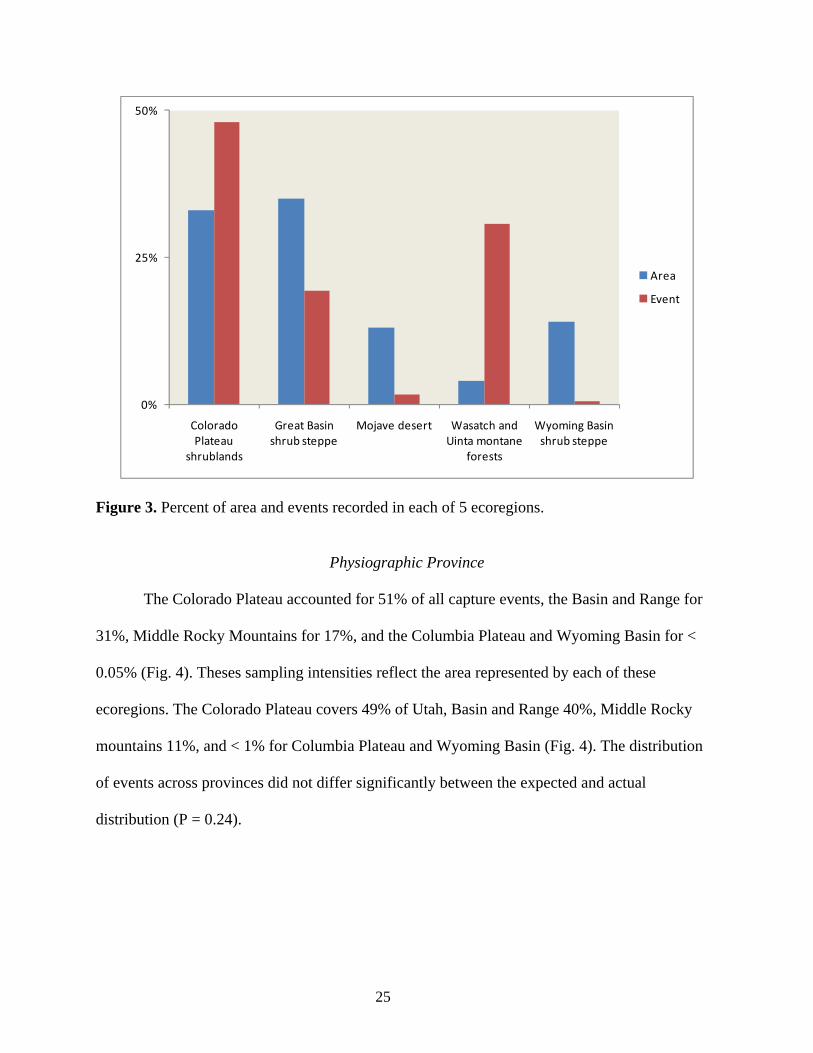
Figure 3. Percent of area and events recorded in each of 5 ecoregions.
Physiographic Province
The Colorado Plateau accounted for 51% of all capture events, the Basin and Range for
31%, Middle Rocky Mountains for 17%, and the Columbia Plateau and Wyoming Basin for <
0.05% (Fig. 4). Theses sampling intensities reflect the area represented by each of these
ecoregions. The Colorado Plateau covers 49% of Utah, Basin and Range 40%, Middle Rocky
mountains 11%, and < 1% for Columbia Plateau and Wyoming Basin (Fig. 4). The distribution
of events across provinces did not differ significantly between the expected and actual
distribution (P = 0.24).

26
0%
25%
50%
MIDDLE ROCKY MOUNTAINS
COLUMBIA PLATEAU
WYOMING BASIN
BASIN AND RANGE
COLORADO PLATEAU
Area
Event
Figure 4. Percent of area and events recorded in each of 5 physiographic provinces.
Land Cover
Number of events varied across land cover types. Of the 13,876 events used in this
analysis 10% (the largest single event cover) occurred in Colorado Plateau Mixed Bedrock
Canyon and Tableland (9), 9% in Colorado Plateau Pinyon-Juniper Woodland each (36), 7% in
Rocky Mountain Lower Montane Riparian Woodland and Shrubland (79), 6% in Colorado
Plateau Blackbrush-Mormon-tea Shrubland (53), Inter-Mountain Basins Montane Sagebrush
Steppe (62) and Developed, Open Space Low Intensity (111). Land cover types varied in area
covered. Thirteen land cover types (9, 14, 36, 37, 46, 48, 53, 58, 62, 67, 82, 110 and 114)
accounted for over 72% of total land area (Fig. 5) (Appendix I). Twenty land cover types made
up a total of < 1% of land area and had no event records. Five cover types had a lower
percentage of events than predicted by land area percentage (14, 48, 58, 67 and 114). Four cover

27
types had an equal percentage of events and land area (36, 37, 46 and 62). Seven cover types had
a higher percentage of events than percent area (9, 23, 34, 53, 60, 79 and 111) (Fig. 5) (Appendix
I). The distribution of events across land cover area differed significantly from the expected (P <
0.001).
0.0%
2.0%
4.0%
6.0%
8.0%
10.0%
12.0%
1 4 8 10
12
14
18
21
23
25
28
30
34
37
39
41
44
47
49
51
54
60
62
66
69
71
77
79
82
84
86
98
108
111
113
115
117
119
122
124
Area
Events
Figure 5. Percent of area and events recorded in each of Utah’s land cover types (Appendix I).
UDWR Regions
Number of total events varied across UDWR Regions. The southern Region had 43% of
all events, Southeastern 24%, Northern 16%, Central 11% and the Northeastern 6%. The total
area varied across Regions. The Southern Region encompasses 32% of Utah, Southeastern 24%,
Central 18%, Northern 15% and Northeastern 11% (Fig. 6). The expected event distribution
based on percent area was not significantly different from the actual event distribution
(P=0.065).

28
0%
25%
50%
NORTHERN REGION
CENTRAL REGION
NORTHEASTERN REGION
SOUTHEASTERN REGION
SOUTHERN REGION
Area
Events
Figure 6. Percent of area and events recorded in each of 5 UDWR Regions.
Landowner
The expected survey based on the area of each landowner type differed from the actual (P
= 0.001) (Fig. 7). DoD lands account for 3% of total land area and only 1% of events. BLM
administered lands accounted for 42% of land cover and only 23% of events. Private lands were
represented as expected by area (21%) making up 20% of events. USFS covers 15% of the land
area and accounts for 23% of events. NPS lands account for only 4% of area yet, 19% of events
occurred in these lands. SITLA, SL&F, and Tribal lands were all underrepresented. USFWS and
USP lands cover a small area of Utah and account for a similar percentage of data.

29
0%
10%
20%
30%
40%
Event
Area
Figure 7. Percent of area and events recorded in each of 11 landowner types.
County
Number of events varied across Utah counties (Fig. 8). Thirteen percent of all event were
recorded in Cache County, 12% in Washington, 9% in Garfield and Kane, and < 1% of total
events were recorded in Box Elder, Carbon, Davis, Emery, Morgan, Rich and Wasatch counties.
Total land area is dominated by Box Elder, Tooele, Millard, and San Juan counties (Fig. 8). The
expected distribution of events based on land area of counties varied significantly from the
expected (P<0.001).

30
0%
2%
4%
6%
8%
10%
12%
14%
16%
18%
BEAVER
BOX ELDER
CACH
E
CARB
ON
DAGGETT
DAVIS
DUCH
ESNE
EMERY
GARFIELD
GRA
ND
IRON
JUAB
KANE
MILLA
RD
MORG
AN
PIUTE
RICH
SALT LAKE
SAN JU
AN
SANPETE
SEVIER
SUMMIT
TOOELE
UINTA
H
UTA
H
WASA
TCH
WASH
INGTO
N
WAYN
E
WEBER
Events
Area
Figure 8. Percent of area and events recorded in each of 29 counties.
Data Gaps
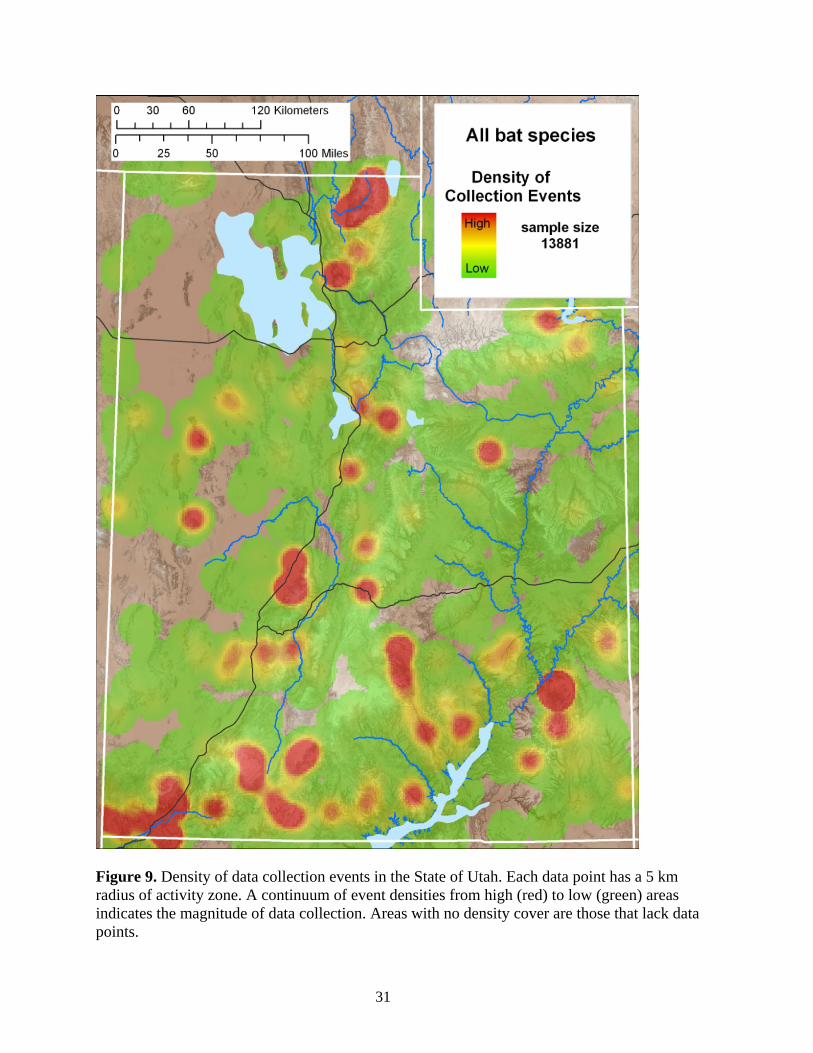
Data gaps exist across months and areas within Utah (Fig. 9). Cold season records only
account for 3% of the total data. Utah’s West Desert has large areas that have not been monitored
(Fig. 9). Data are also lacking for the north-slope of the Uinta Mountains, north of Fish Lake,
areas adjacent to Desolation Canyon, the confluence of the San Juan and Colorado Rivers, the
Uinta Basin and the southeastern corner of Utah.
31
Figure 9. Density of data collection events in the State of Utah. Each data point has a 5 km radius of activity zone. A continuum of event densities from high (red) to low (green) areas indicates the magnitude of data collection. Areas with no density cover are those that lack data points.

32
Occurrence: Ecological Scales (Objective 2)
Ecoregions
While bat capture data exist for all five of Utah’s ecoregions, there is considerable
variation across ecoregions both within species and across species (Fig. 10). Eight species
occurred in 5 ecoregions (pallid bat, big-brown bat, hoary bat, silver-haired bat, western small-
footed myotis, long-eared myotis, little brown myotis, and long-legged myotis). Seven species
occurred in all ecoregions except the Wyoming Basin shrub steppe (Townsend’s big-eared bat,
California myotis, fringed myotis, Yuma myotis, big free-tailed bat, western pipistrelle and
Brazilian free-tailed bat). The spotted bat and the western red bat occurred in three, Colorado
Plateau shrublands, Great Basin shrub steppe and Wasatch and Uintah montane forests. Allen’s
big-eared bat was recorded only in Colorado Plateau shrublands and the Mojave Desert
ecoregions. The Arizona myotis was only observed in Colorado Plateau shrublands (Fig. 10). All
19 species occurred in Colorado Plateau shrublands; 17 in the Great Basin shrub steppe, and
Wasatch and Uinta montane forests (Allen’s big-eared bat and the Arizona myotis were absent);
14 in the Mojave Desert (spotted bat, western red bat, western small-footed myotis, long-eared
myotis and Arizona myotis were absent); and only 8 (pallid bat, big-brown bat, hoary bat, silver-
haired bat, western small-footed myotis, long-eared myotis, little brown myotis, and long-legged
myotis) in the Wyoming Basin shrub steppe.

33
0
1
2
3
4
5
pallid bat
Townsend’s Big‐eared bat
big brown bat
spotted bat
Allen’s big‐eared bat
western red bat
hoary bat
silver‐haired bat
California myotis
western sm
all‐footed myotis
long‐eared myotis
little brown m
yotis
Arizona m
yotis
fringed myotis
long‐legged myotis
Yuma m
yotis
big free‐tailed bat
western pipistrelle
Brazilian free‐tailed batWyoming Basin shrub steppe
Wasatch and Uinta montane forests
Mojave desert
Great Basin shrub steppe
Colorado Plateau shrublands
Figure 10. Bat presence across Utah’s 5 ecoregions for 19 bat species. The lack of a bar indicates species absence from that ecoregion. These data do not measure magnitude, simply presence or absence.
Physiographic Provinces
Bat species occurrence varied across and within Utah’s 5 physiographic provinces (Fig.
11). Only the long-legged myotis was detected in all five provinces. Four species (pallid bat,
silver-haired bat, hoary bat, and little brown myotis) were observed in all provinces except the
Columbia Plateau. Townsend’s big-eared bats were observed in all provinces, with the exception
of the Wyoming Basin. Ten species (big brown bat, spotted bat, western red bat, California
myotis, western small-footed myotis, long-eared myotis, fringed myotis, Yuma myotis, western
pipistrelle, and Brazilian free-tailed bat) occurred in the Basin and Range, Colorado Plateau, and

34
Middle Rocky Mountains. Allen’s big-eared bat and the big free-tailed bat only occurred in the
Basin and Range and Colorado Plateau. And the Arizona myotis was observed only in the
Colorado Plateau. All 19 species occurred in the Colorado Plateau, 18 in the Basin and Range
(Arizona myotis was absent), 16 in the Middle Rocky Mountains (Allen’s big-eared bat, Arizona
myotis, and big free-tailed bats were absent), 5 in the Wyoming Basin (pallid bat, hoary bat,
silver-haired bat, little brown myotis, and long-legged myotis), and only two species in the
Columbia Basin (Townsend’s big-eared bat and long legged-myotis).
0
1
2
3
4
5
pallid bat
Townsend’s Big‐eared bat
big brown bat
spotted bat
Allen’s big‐eared bat
western red bat
hoary bat
silver‐haired bat
California myotis
western sm
all‐footed myotis
long‐eared myotis
little brown m
yotis
Arizona m
yotis
fringed myotis
long‐legged myotis
Yuma m
yotis
big free‐tailed bat
western pipistrelle
Brazilian free‐tailed bat
Total data
WYOMING BASIN
MIDDLE ROCKY MOUNTAINS
COLUMBIA PLATEAU
COLORADO PLATEAU
BASIN AND RANGE
Figure 11. Bat presence across Utah’s 5 physiographic provinces for 19 bat species. The lack of a bar for a given physiographic province indicates species absence. These data do not measure magnitude, simply presence or absence.

35
Land Cover
Bat species occurrences varied across and within land cover type. Bats were observed in
61 land cover types (Fig. 12) (Appendix I). Townsend’s big-eared bat occurred in 44 cover types,
spotted bat 23, Allen’s big-eared bat 18, western red bat 4, Arizona myotis 3, fringed myotis 35,
and the big free-tailed bat 26. Big-brown bats were observed in more cover types than any other
species (49). All 19 species were recorded in the Colorado Plateau Pinyon-Juniper woodland
(36), 18 species (western red bat was absent) in the Inter-Mountain Basins Big Sagebrush
shrubland (48), 5 cover types, (Colorado Plateau Mixed Bedrock Canyon and Tableland (9), The
Great Basin Pinyon-Juniper (37), Inter-Mountain Basins Mixed Salt Desert Scrub (58),
Developed, Open Space - Low Intensity (111), and Developed, Medium - High Intensity) had 17
species.

36
0
10
20
30
40
50
pallid bat
Townsend’s Big‐eared bat
big brown bat
spotted bat
Allen’s big‐eared bat
western red bat
hoary bat
silver‐haired bat
California myotis
western sm
all‐footed myotis
long‐eared myotis
little brown m
yotis
Arizona m
yotis
fringed myotis
long‐legged myotis
Yuma m
yotis
big free‐tailed bat
western pipistrelle
Brazilian free‐tailed bat
Figure 12. Number of cover types that each of 19 bat species was recorded in, across 61 (SW Re-GAP) land cover types.
Occurrence: Management Scales
Land Owner
Bat species occurrence varied across landowner and landowner varied across species
(Fig. 13). Bats were observed in all 12 landowner types. Seven species (pallid bat, Townsend’s
big-eared bat, hoary bat, silver-haired bat, western small-footed myotis, Yuma myotis, and
western pipistrelle) were observed in 12 land owner types. Two species (little brown myotis and
Brazilian free-tailed bat) were absent in Tribal and USP, and SL&F, and USFWS, respectively,
but occurred in 10 land owner types. Spotted bats were recorded in 6 landowner types (DoD,
BLM, NPS, private, SITLA, and USFS). Allen’s big-eared bat occurred on 5 types (BLM, NPS,

37
private, SITLA, and USFS). Western red bats and Arizona myotis were only observed on two
landowner types (private and UDWR, and BLM and private, respectively). Fringed myotis were
detected on 9 landowner types (SL&F, Tribal, and water ownership types were absent). The big
free-tailed bat was found on 8 landowner types (SITLA, SL&F, USFWS and water were absent).
Only the private landowner type had records for all 19 bat species, BLM had 18 (western red bat
was absent), NPS and USFS 17 (western red bat and Arizona myotis were absent), DoD had 16
(Allen’s big-eared bat, western red bat, and Arizona myotis were absent).
0
2
4
6
8
10
12
pallid bat
Townsend’s Big‐eared bat
big brown bat
spotted bat
Allen’s big‐eared bat
western red bat
hoary bat
silver‐haired bat
California myotis
western sm
all‐footed myotis
long‐eared myotis
little brown m
yotis
Arizona m
yotis
fringed myotis
long‐legged myotis
Yuma m
yotis
big free‐tailed bat
western pipistrelle
Brazilian free‐tailed bat
WATER
USP
USFWS
USFS
UDWR
TRIBAL
SL&F
SITLA
PRIVATE
NPS
DOD
BLM
Figure 13. Presence of 19 bat species across 12 land owner types. The lack of a bar for a given landowner type indicates species absence. These data do not measure magnitude, simply presence or absence.
UDWR Regions
Bat species occurrence varied across and within UDWR Regions (Fig. 14). Fourteen
species were observed in all five regions (spotted bat, Allen’s big-eared bat, western red bat,

38
Arizona myotis and the big free-tailed bat were absent). The spotted bat and big free-tailed bat
were observed in all regions except the Northern Region. The western red bat was recorded in
four regions, absent in the Northeastern Region. Allen’s big-eared bat data were from the
Southeastern and Southern Regions only. The Arizona myotis was only detected in the Southern
Region. All 19 species occurred in the Southern Region, 17 in the Southeastern and Central
regions (Allen’s big-eared bat and Arizona myotis were absent), 16 in the Northeastern Region
(Allen’s big-eared bat, western red bat and Arizona myotis were absent), and 15 in the Northern
(spotted bat, Allen’s big-eared bat, Arizona myotis and big free-tailed bat were absent).
0
1
2
3
4
5
pallid bat
Townsend’s Big‐eared bat
big brown bat
spotted bat
Allen’s big‐eared bat
western red bat
hoary bat
silver‐haired bat
California myotis
western sm
all‐footed myotis
long‐eared myotis
little brown m
yotis
Arizona m
yotis
fringed myotis
long‐legged myotis
Yuma m
yotis
big free‐tailed bat
western pipistrelle
Brazilian free‐tailed bat
SOUTHERN REGION
SOUTHEASTERN REGION
NORTHERN REGION
NORTHEASTERN REGION
CENTRAL REGION
Figure 14. Presence of 19 bat species across the 5 UDWR Regions. The lack of a bar for a given Region indicates species absence. These data do not measure magnitude, simply presence or absence.

39
County
Bat species occurrence varied across counties and species (Fig. 15). Bats were observed
in all of Utah’s 29 counties. The long-legged myotis was the only species that occurred in all 29
counties. The silver-haired bat was recorded in 28 counties (Morgan was absent), Townsend’s
big-eared bats in all counties except Morgan and Rich, fringed myotis in 16, spotted bats 12, big
free-tailed bat in 9 counties, Allen’s big-eared bat and western red bat 6, and the Arizona myotis
in 1. Kane (western red bat was absent), Washington and Wayne (Arizona myotis was absent)
counties had 18 species, Garfield, Grand and San Juan had 17 species (western red bat and
Arizona myotis were absent), Morgan, Rich and Summit counties only recorded 2, 5 and 4
species, respectively.
0
5
10
15
20
25
30
pallid bat
Townsend’s Big‐eared bat
big brown bat
spotted bat
Allen’s big‐eared bat
western red bat
hoary bat
silver‐haired bat
California myotis
western sm
all‐footed myotis
long‐eared myotis
little brown m
yotis
Arizona m
yotis
fringed myotis
long‐legged myotis
Yuma m
yotis
big free‐tailed bat
western pipistrelle
Brazilian free‐tailed bat
BEAVER BOX ELDER CACHE CARBON DAGGETT DAVIS DUCHESNE EMERY
GARFIELD GRAND IRON JUAB KANE MILLARD MORGAN PIUTE
RICH SALT LAKE SAN JUAN SANPETE SEVIER SUMMIT TOOELE UINTAH
UTAH WASATCH WASHINGTON WAYNE WEBER
Figure 15. Presence of 19 bat species across 29 Utah counties. The lack of a bar for a given county indicates species absence. These data do not measure magnitude, simply presence or absence.

40
Diversity: Ecological Scales (Objective 3)
Ecoregions
Bat species diversity varied both across ecoregions (Fig. 16a-e). The Colorado Plateau
accounted for more than 70% of capture events for 9 species (pallid bat, spotted bat, Allen’s big-
eared bat, western red bat, California myotis, Arizona myotis, fringed myotis, Yuma myotis, big
free-tailed bat, and western pipistrelle). Over 35% of all Townsend’s big-eared bat and Brazilian
free-tailed bat capture events occurred in the Great Basin. Wasatch and Uinta montane forests
accounted for over 45% of all events for the hoary bat, silver-haired bat, and little brown myotis.
Fourteen species were recorded in the Mojave Desert making up from 11% (Brazilian free-tailed
bat) to 0.02% (little brown myotis) of total records for each species. Eight species were observed
in the Wyoming Basin shrub steppe, making up from 3 to < 0.001% (little brown myotis and
silver-haired bat) of total species observations.
pallid bat, 719 Townsend’s Big‐eared bat , 509
big brown bat , 572 spotted bat, 97
Allen’s big‐eared bat, 162
western red bat, 15
hoary bat , 94
silver‐haired bat, 407
California myotis, 559
western small‐footed myotis, 156long‐eared myotis , 289little brown myotis, 38
Arizona myotis, 16
fringed myotis, 301
long‐legged myotis, 373
Yuma myotis, 288
big free‐tailed bat, 119
western pipistrelle, 1690
Brazilian free‐tailed bat, 237
Colorado Plateau shrublands
Figure 16a. Bat diversity in the Colorado Plateau shrublands, proportional abundance of 19 bat species.

41
pallid bat, 83
Townsend’s Big‐eared bat , 502
big brown bat , 324
spotted bat, 10
western red bat, 3hoary bat , 88
silver‐haired bat, 195
California myotis, 187western small‐footed myotis, 116
long‐eared myotis , 205
little brown myotis, 211
fringed myotis, 28
long‐legged myotis, 278
Yuma myotis, 18
big free‐tailed bat, 7
western pipistrelle, 106
Brazilian free‐tailed bat, 313
Great Basin shrub steppe
Figure 16b. Bat diversity in the Great Basin shrub steppe, proportional abundance of 19 bat species.
pallid bat, 23
Townsend’s Big‐eared bat , 2
big brown bat , 19 Allen’s big‐eared bat, 4
hoary bat , 25
silver‐haired bat, 5
California myotis, 8
little brown myotis, 2
fringed myotis, 13
long‐legged myotis, 3
Yuma myotis, 8big free‐tailed bat, 1
western pipistrelle, 31
Brazilian free‐tailed bat, 82
Mojave desert
Figure 16c. Bat diversity in the Mojave Desert, proportional abundance of 19 bat species.

42
pallid bat, 16
Townsend’s Big‐eared bat , 295
big brown bat , 368
spotted bat, 13
western red bat, 1
hoary bat , 294
silver‐haired bat, 1220
California myotis, 26
western small‐footed myotis, 106
long‐eared myotis , 430
little brown myotis, 844
fringed myotis, 74long‐legged myotis, 394
Yuma myotis, 41
big free‐tailed bat, 14 western pipistrelle, 10Brazilian free‐tailed bat, 93
Wasatch and Uinta montane forests
Figure 16d. Bat diversity in the Wasatch and Uinta montane forests, proportional abundance of 19 bat species.
pallid bat, 1 big brown bat , 1
hoary bat , 1
silver‐haired bat, 1
western small‐footed myotis, 1
long‐eared myotis , 22
little brown myotis, 36
long‐legged myotis, 4
Wyoming Basin shrub steppe
Figure 16e. Bat diversity in the Wasatch and Uinta montane forests, proportional abundance of 19 bat species

43
Shannon-Wiener Diversity
Diversity indices showed differing species evenness and diversity across ecoregions (Fig.
17). The Colorado Plateau shrublands had the highest diversity based on the index, followed by
the Great Basin Shrub steppe, Wasatch and Uinta montane forests, Mojave Desert, and Wyoming
Basin.
0
5
10
15
C o lo radoPla teau
s h rub lands
Grea t Bas ins h rub
s teppe
Mo javedes e rt
Was a tch andU in ta
m on tanefo res ts
Wyom ingBas in s h rub
s teppe
Inde
x va
lue
Figure 17. Shannon-Weiner diversity indices, based on the diversity and evenness of species across ecoregions.
Physiographic Provinces
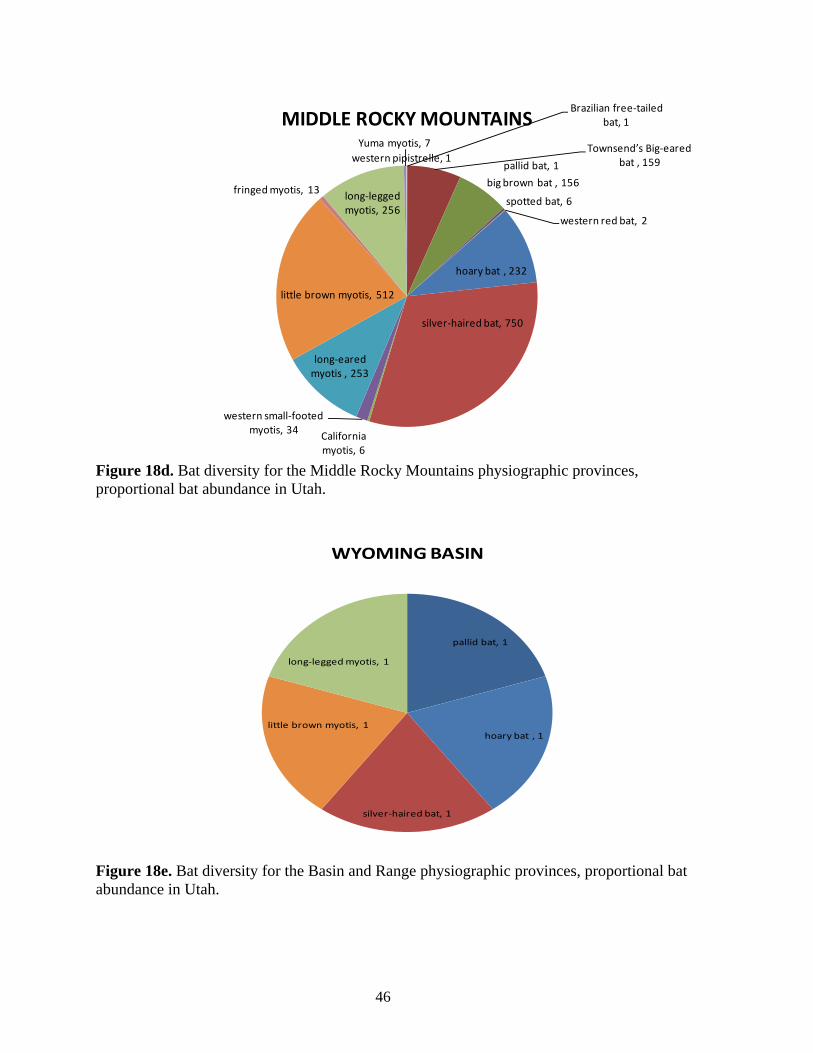
Diversity was variable across Utah’s 5 physiographic provinces (Fig. 18a-e). The
Colorado Plateau accounted for more than 45% of the capture events for 13 species (pallid bat,
big brown bat, spotted bat, Allen’s big-eared bat, California myotis, western small-footed
myotis, long-eared myotis, Arizona myotis, fringed myotis, long-legged myotis, Yuma myotis,
big free-tailed bat and the western pipistrelle). The Basin and Range made up over 50% of
observations for three species (Townsend’s big-eared bat, western red bat and Brazilian free-
tailed bat). The Middle Rocky Mountains accounted for over 40% of the capture events for three
species (hoary bat, silver-haired bat and little brown myotis). In the Wyoming Basin, the five

44
species recorded made <0.01% of the total observations for each of these species. The Columbia
Plateau had two species recorded; the capture events for each represent <0.01% of species
accounts.
pallid bat, 171
Townsend’s Big‐eared bat , 719
big brown bat , 508spotted bat, 47
Allen’s big‐eared bat, 4
western red bat, 14
hoary bat , 155
silver‐haired bat, 285
California myotis, 236western small‐
footed myotis, 138
long‐eared myotis , 235
little brown myotis, 400
fringed myotis, 98
long‐legged myotis, 280
Yuma myotis, 88
big free‐tailed bat, 56
western pipistrelle, 323
Brazilian free‐tailed bat, 577
BASIN AND RANGE
Figure 18a. Bat diversity for the Basin and Range physiographic provinces, proportional bat abundance in Utah.

45
pallid bat, 669
Townsend’s Big‐eared bat , 426
big brown bat , 620
spotted bat, 67
Allen’s big‐eared bat, 162
western red bat, 3
hoary bat , 114silver‐haired bat, 792
California myotis, 538western small‐
footed myotis, 207long‐eared myotis , 458little brown myotis, 218
Arizona myotis, 16
fringed myotis, 305
long‐legged myotis, 514
Yuma myotis, 260
big free‐tailed bat, 85
western pipistrelle, 1513
Brazilian free‐tailed bat, 147
COLORADO PLATEAU
Figure 18b. Bat diversity for the Colorado Plateau physiographic provinces, proportional bat abundance in Utah.
Townsend’s Big‐eared bat , 4
long‐legged myotis, 1
COLUMBIA PLATEAU
Figure 18c. Bat diversity for the Columbia Plateau physiographic provinces, proportional bat abundance in Utah.
46
pallid bat, 1
Townsend’s Big‐eared bat , 159
big brown bat , 156
spotted bat, 6
western red bat, 2
hoary bat , 232
silver‐haired bat, 750
California myotis, 6
western small‐footed myotis, 34
long‐eared myotis , 253
little brown myotis, 512
fringed myotis, 13 long‐legged myotis, 256
Yuma myotis, 7western pipistrelle, 1
Brazilian free‐tailed bat, 1MIDDLE ROCKY MOUNTAINS
Figure 18d. Bat diversity for the Middle Rocky Mountains physiographic provinces, proportional bat abundance in Utah.
pallid bat, 1
hoary bat , 1
silver‐haired bat, 1
little brown myotis, 1
long‐legged myotis, 1
WYOMING BASIN
Figure 18e. Bat diversity for the Basin and Range physiographic provinces, proportional bat abundance in Utah.

47
Shannon-Wiener Diversity
The Shannon-Weiner index showed differences in species diversity and evenness across
physiographic provinces (Fig. 19). The Colorado Plateau had the highest diversity followed
closely by the Basin and Range, and the Middle Rocky Mountains and Wyoming Basin. The
lowest diversity was in the Columbia Plateau.
0
5
10
BASIN
AN
D
RAN
GE
CO
LOR
AD
O
PLA
TEAU
CO
LUM
BIA
PLA
TEAU
MID
DLE
RO
CKY
MO
UN
TAIN
S
WYO
MIN
G
BASIN
Inde
x Va
lue
Figure 19. Shannon-Weiner diversity indices, based on the diversity and evenness of species across physiographic provinces.
Land Cover
Bat diversity varied across vegetation types (Fig. 20; Appendix II). Colorado Plateau
Mixed Bedrock Canyon and Tableland (9) accounted for more than 5% of total capture events
for 15 species (pallid bat, Townsend’s big-eared, big brown bat, spotted bat, Allen’s big-eared
bat, California myotis, western small-footed myotis, long-eared myotis, Arizona myotis, fringed
myotis, long-legged myotis, Yuma myotis, big free-tailed bat, western pipistrelle, and Brazilian
free-tailed bat). Over 5% of total records for 16 species (Townsend’s big-eared bat, big brown
bat, spotted bat, Allen’s big-eared bat, western red bat, hoary bat, silver-haired bat, western
small-footed myotis, long-eared myotis, little brown myotis, Arizona myotis, fringed myotis,
long-legged myotis, Yuma myotis, big free-tailed bat, and Brazilian free-tailed bat) were in

48
Colorado Plateau Pinyon-Juniper Woodlands (36). Developed, Open Space - Low Intensity (111)
habitats had 5 species with greater than 5% of their total capture events (big brown bat, spotted
bat, western red bat, California myotis, and Brazilian free-tailed bat). Rocky Mountain Lower
Montane Riparian Woodland and Shrublands (79) had 9 species (pallid bat, big brown bat,
Allen’s big-eared bat, hoary bat, silver-haired bat, California myotis, little brown myotis, big
free-tailed bat, and western pipistrelle) with more than 5% of their total capture events in this
habitat. Over 5% of capture events for 5 species (pallid bat, spotted bat, hoary bat, big free-tailed
bat, western pipistrelle, and Brazilian free-tailed bat,) were in Sonora-Mojave Creosotebush-
White Bursage Desert Scrub (60). Other vegetation types which accounted for a high percentage
of multiple species capture events were Colorado Plateau Blackbrush-Mormon-tea Shrubland
(53), Inter-Mountain Basins Montane Sagebrush Steppe (62), and Inter-Mountain Basins Big
Sagebrush Shrubland (48). Twenty six vegetation types did not account for over 5% of any one
species.

49
0%
50%
100%
pallid bat
Townsend’s Big-eared bat
big brown bat
spotted bat
Allen’s big-eared bat
western red bat
hoary bat
silver-haired bat
California m
yotis
western sm
all-footed myotis
long-eared myotis
little brown m
yotis
Arizona myotis
fringed myotis
long-legged myotis
Yuma m
yotis
big free-tailed bat
western pipistrelle
Brazilian free-tailed bat
Total eventsVegetation Type (SW Re-GAP)
0 5 8 9 10 11 12 14 15 19 22 23 26 28 29 30 32 34 36 37 38
40 41 42 44 46 48 49 50 51 53 54 58 60 61 62 67 69 70 71 76 77
79 80 82 83 85 86 98 108 110 111 112 114 117 118 119 121 122 123 124
Figure 20. Proportion of total bat inventory events for each of Utah’s 19 bat species across 61 SW Re-GAP vegetation types.
Shannon-Wiener Diversity
The Shannon-Weiner index showed differences in species diversity and evenness across
community types (Fig. 21). The highest diversity was recorded in Inter-Mountain Basins Big
Sagebrush Shrubland (48) followed by; North American Arid West Emergent Marsh (85), Open
Water (110), Colorado Plateau Pinyon-Juniper Woodland (36), Great Basin Pinyon-Juniper
Woodland (37), Mogollon Chaparral (51) and Inter-Mountain Basins Semi-Desert Shrub Steppe
(67). The lowest diversity was in the Inter-Mountain Basins Cliff and Canyon (8), North

50
American Warm Desert Wash (19), Sonora-Mojave Mixed Salt Desert Scrub (61), Rocky
Mountain Dry Tundra (69) and Invasive Annual and Biennial Forbland (122).
0
5
10
15
0 5 8 9 10 11 12 14 15 19 22 23 26 28 29 30 32 34 36 37 38 40 41 42 44 46 48 49 50 51 53 54 58 60 61 62 67 69 70 71 76 77 79 80 82 83 85 86 98 108110111112114117118119121122123124
Figure 21. Shannon-Weiner diversity index, based on the diversity and evenness of species across 61 cover types.
Diversity: Management Scales
Land Owner
Bat species diversity varied across and within land owner types (Fig. 22a-l). DoD
managed lands accounted for over 10% of total records for 5 species (Townsend’s big-eared bat,
California myotis, western small-footed myotis, little brown myotis, and Brazilian free-tailed
bat). Twenty percent of total records for 12 species (pallid bat, Townsend’s big-eared bat,
spotted bat, Allen’s big-eared bat, California myotis, Arizona myotis, fringed myotis, long-
legged myotis, Yuma myotis, big free-tailed bat, western pipistrelle, and Brazilian free-tailed bat
were on BLM managed lands. Private lands accounted for more than 20% of total capture events
for 9 species (Townsend’s big-eared bat, big brown bat, spotted bat, western red bat, hoary bat,
silver-haired bat, little brown bat, Arizona myotis, and Brazilian free-tailed bat). USFS managed
lands accounted for over 20% of total records for 8 species (big brown bat, spotted bat, hoary

51
bat, silver-haired bat, western small-footed myotis, long-eared myotis, little brown myotis, and
long-legged myotis). NPS administered lands accounted for more than 20% of the total data set
for 6 species (pallid bat, Allen’s big-eared bat, California myotis, fringed myotis, Yuma myotis,
and western pipistrelle). Land s administered by USFWS, USP, STILA, SL&F, Tribal, UDWR,
and open water did not account for over 10% of records for any one species.
pallid bat, 263
Townsend’s Big‐eared bat , 563
big brown bat , 253
spotted bat, 34
Allen’s big‐eared bat, 65
hoary bat , 42
silver‐haired bat, 126
California myotis, 287
western small‐footed myotis, 74long‐eared myotis , 200
little brown myotis, 40
Arizona myotis, 8
fringed myotis, 163
long‐legged myotis, 223
Yuma myotis, 109
big free‐tailed bat, 516
western pipistrelle, 516
Brazilian free‐tailed bat, 165
BLM
Figure 22a. Proportion of total bat inventory events for each of Utah’s 19 bat species on the BLM landowner type.

52
pallid bat, 50
Townsend’s Big‐eared bat , 218
big brown bat , 78
spotted bat, 1
hoary bat , 44silver‐haired bat, 123
California myotis, 100
western small‐footed myotis, 64
long‐eared myotis , 62
little brown myotis, 250
fringed myotis, 14
long‐legged myotis, 46
Yuma myotis, 17
big free‐tailed bat, 2
western pipistrelle, 89
Brazilian free‐tailed bat, 79
DOD
Figure 22b. Proportion of total bat inventory events for each of Utah’s 19 bat species on the DoD landowner type.
pallid bat, 427 Townsend’s Big‐eared bat , 78
big brown bat , 198 spotted bat, 21
Allen’s big‐eared bat, 63
hoary bat , 26
silver‐haired bat, 152
California myotis, 332
western small‐footed
myotis, 72long‐eared myotis , 62little brown myotis, 21fringed myotis, 102
long‐legged myotis, 105
Yuma myotis, 107
big free‐tailed bat, 43
western pipistrelle, 1090
Brazilian free‐tailed bat, 46
NPS
Figure 22c. Proportion of total bat inventory events for each of Utah’s 19 bat species on the NPS landowner type.

53
pallid bat, 86
Townsend’s Big‐eared bat
, 315
big brown bat , 350
spotted bat, 26
Allen’s big‐eared bat, 12
western red bat, 18hoary bat , 247
silver‐haired bat, 605
California myotis, 53western small‐footed
myotis, 73
long‐eared myotis , 104
little brown myotis, 466Arizona myotis, 8
fringed myotis, 54
long‐legged myotis, 125
Yuma myotis, 68
big free‐tailed bat, 32
western pipistrelle, 137Brazilian free‐tailed
bat, 446
PRIVATE
Figure 22d. Proportion of total bat inventory events for each of Utah’s 19 bat species on the Private landowner type.
pallid bat, 11
Townsend’s Big‐eared bat , 28
big brown bat , 11
spotted bat, 4
Allen’s big‐eared bat, 1
hoary bat , 29
silver‐haired bat, 89
California myotis, 12
western small‐footed myotis, 5
long‐eared myotis , 20
little brown myotis, 47
fringed myotis, 10
long‐legged myotis, 22
Yuma myotis, 10
western pipistrelle, 15
Brazilian free‐tailed bat, 13
SITLA
Figure 22e. Proportion of total bat inventory events for each of Utah’s 19 bat species on the SITLA landowner type.
54
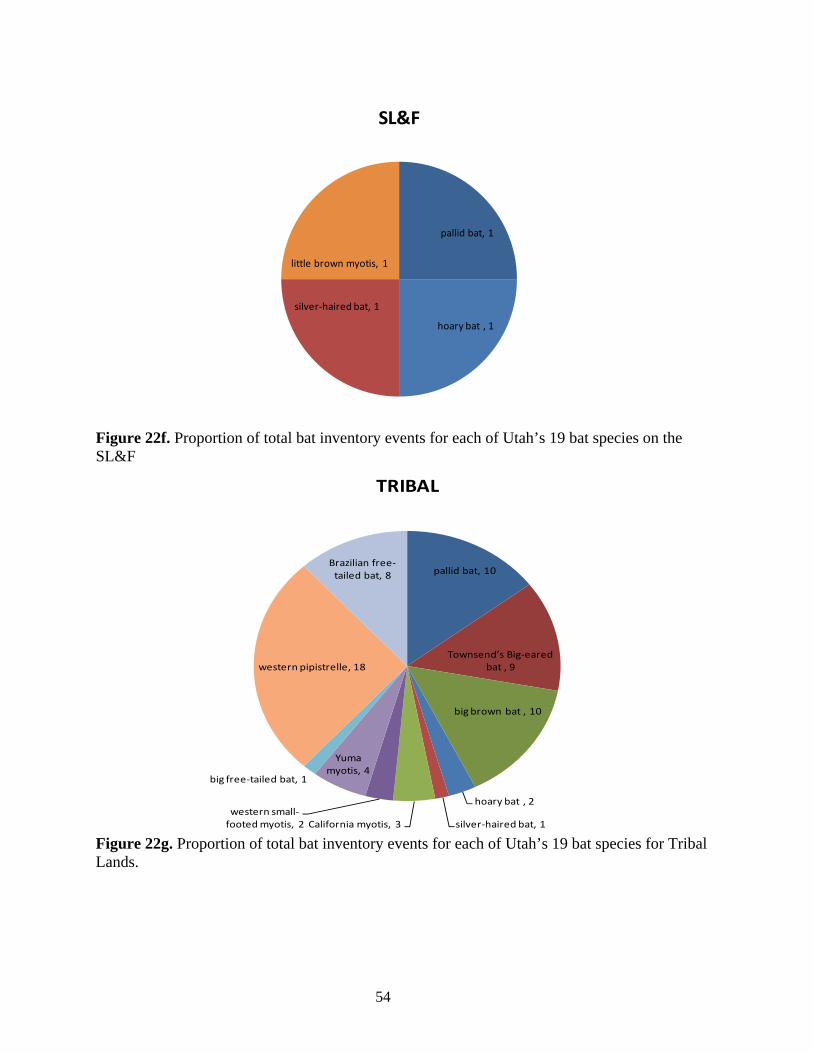
pallid bat, 1
hoary bat , 1
silver‐haired bat, 1
little brown myotis, 1
SL&F
Figure 22f. Proportion of total bat inventory events for each of Utah’s 19 bat species on the SL&F
pallid bat, 10
Townsend’s Big‐eared bat , 9
big brown bat , 10
hoary bat , 2
silver‐haired bat, 1California myotis, 3western small‐footed myotis, 2
Yuma myotis, 4
big free‐tailed bat, 1
western pipistrelle, 18
Brazilian free‐tailed bat, 8
TRIBAL
Figure 22g. Proportion of total bat inventory events for each of Utah’s 19 bat species for Tribal Lands.

55
Townsend’s Big‐eared bat , 3
big brown bat , 29western red bat, 1
hoary bat , 1
silver‐haired bat, 42
western small‐footed myotis, 10long‐eared myotis , 6
little brown myotis, 27
Arizona myotis, 0
fringed myotis, 4
long‐legged myotis, 42
Yuma myotis, 6
big free‐tailed bat, 3
western pipistrelle, 6Brazilian free‐tailed bat, 2
UDWR
Figure 22h. Proportion of total bat inventory events for each of Utah’s 19 bat species on the UDWR landowner type.
pallid bat, 14
Townsend’s Big‐eared bat
, 275
big brown bat , 427
spotted bat, 34
Allen’s big‐eared bat, 25
hoary bat , 148
silver‐haired bat, 803
California myotis, 34
western small‐footed myotis, 117
long‐eared myotis , 547
little brown myotis, 504
fringed myotis, 78
long‐legged myotis, 519
Yuma myotis, 36
big free‐tailed bat, 18
western pipistrelle, 11
Brazilian free‐tailed bat, 24 USFS
Figure 22i. Proportion of total bat inventory events for each of Utah’s 19 bat species on the USFS landowner type.

56
pallid bat, 5Townsend’s Big‐eared
bat , 2
silver‐haired bat, 1
western small‐footed myotis, 6
long‐eared myotis , 2
little brown myotis, 22
fringed myotis, 3
Yuma myotis, 1
western pipistrelle, 7
USFWS
Figure 22j. Proportion of total bat inventory events for each of Utah’s 19 bat species on the USFWS landowner type.
pallid bat, 2
Townsend’s Big‐eared bat , 14
hoary bat , 1
California myotis, 3
western small‐footed myotis, 1
fringed myotis, 2
long‐legged myotis, 1
Yuma myotis, 1
big free‐tailed bat, 2
western pipistrelle, 4
Brazilian free‐tailed bat, 5
USP
Figure 22k. Proportion of total bat inventory events for each of Utah’s 19 bat species on the USP landowner type.

57
pallid bat, 3
Townsend’s Big‐eared bat , 5
big brown bat , 1
hoary bat , 1
silver‐haired bat, 1
California myotis, 6
western small‐footed myotis, 1
long‐eared myotis , 1little brown myotis, 2
long‐legged myotis, 3
Yuma myotis, 13
western pipistrelle, 3Brazilian free‐tailed
bat, 1
WATER
Figure 22l. Proportion of total bat inventory events for each of Utah’s 19 bat species on the Water landowner type.
Shannon-Wiener Diversity
An index of diversity showed differences in species diversity and evenness across
landowner types (Fig. 23). BLM managed lands had the highest diversity index value, followed
by private, DoD, STILA, USFS, NPS, open water, UDWR, Tribal, USP, USFWS, and SL&F.

58
S hannon-W einer Index B y land ow ner
0
5
10
15
BLM
DO
D buffer
NPS
PRIV
ATE
SITLA
SL&
F
TRIB
AL
UDW
R
USFS
USFW
S
USP
WATE
R
La nd Ow ne r
Inde
x va
lue
Figure 23. Shannon-Weiner diversity indices, based on the diversity and evenness of species across land owner types.
UDWR Regions
Bat species diversity varied within and across UDWR Regions (Fig. 24a-e). The Southern
Region accounted for more than 50% of the total data for 9 species (Townsend’s big-eared bat,
big brown bat, spotted bat, western red bat, Arizona myotis, fringed myotis, Yuma myotis, big
free-tailed bat, and Brazilian free-tailed bat). The Southeastern Region accounted for more than
50% of total bat capture events for 2 species (Allen’s big-eared bat and western pipistrelle).
Sixty-three percent of little brown bat capture events were in the Northern Region (Fig. 24c).
Data within the Northeastern Region accounted for over 10% of events for 3 species (western
small-footed myotis, long-eared myotis, and long-legged myotis) (Fig. 24d). The Central Region
accounted for over 10% of events for 10 species (Townsend’s big-eared bat, big brown bat,
western red bat, hoary bat, silver-haired bat, California myotis, western small-footed myotis,
long-eared myotis, little brown myotis, long-legged myotis, and Brazilian free-tailed bat) (Fig.
24e).

59
pallid bat, 367
Townsend’s Big‐eared bat , 779
big brown bat , 660
spotted bat, 73Allen’s big‐
eared bat, 72western red bat, 12
hoary bat , 118silver‐haired bat, 663
California myotis, 275western small‐
footed myotis, 181long‐eared myotis , 397
little brown myotis, 193
Arizona myotis, 16
fringed myotis, 238
long‐legged myotis, 480
Yuma myotis, 195
big free‐tailed bat, 95
western pipistrelle, 563
Brazilian free‐tailed bat, 532
SOUTHERN REGION
Figure 24a. Proportion of total bat inventory events for each of Utah’s 19 bat species within the Southern UDWR region.
pallid bat, 408
Townsend’s Big‐eared bat , 96
big brown bat , 210
spotted bat, 33
Allen’s big‐eared bat, 94
western red bat, 3
hoary bat , 50
silver‐haired bat, 190California myotis, 380
western small‐footed myotis, 49long‐eared
myotis , 115little brown myotis, 20Arizona myotis, 0fringed myotis, 140
long‐legged myotis, 175
Yuma myotis, 120
big free‐tailed bat, 40
western pipistrelle, 1162
Brazilian free‐tailed bat, 36
SOUTHEASTERN REGION
Figure 24b. Proportion of total bat inventory events for each of Utah’s 19 bat species within the Southeastern UDWR region.

60
pallid bat, 2
Townsend’s Big‐eared bat , 100
big brown bat , 193
spotted bat, 0
Allen’s big‐eared bat, 0
western red bat, 2
hoary bat , 212
silver‐haired bat, 627
California myotis, 4western small‐
footed myotis, 33
long‐eared myotis , 149
little brown myotis, 718
Arizona myotis, 0fringed myotis, 12
long‐legged myotis, 150
Yuma myotis, 5big free‐tailed bat, 0
western pipistrelle, 6
Brazilian free‐tailed bat, 61 NORTHERN REGION
Figure 24c. Proportion of total bat inventory events for each of Utah’s 19 bat species within the Northern UDWR region.
pallid bat, 14 Townsend’s Big‐
eared bat , 69
big brown bat , 76
spotted bat, 9
Allen’s big‐eared bat, 0
western red bat, 0
hoary bat , 33silver‐haired bat, 155
California myotis, 21western small‐footed myotis, 49
long‐eared myotis , 138
little brown myotis, 79
Arizona myotis, 0
fringed myotis, 10
long‐legged myotis, 140
Yuma myotis, 23
big free‐tailed bat, 3
western pipistrelle, 18
Brazilian free‐tailed bat, 9
NORTHEASTERN REGION
Figure 24d. Proportion of total bat inventory events for each of Utah’s 19 bat species within the Northeastern UDWR region.

61
pallid bat, 42
Townsend’s Big‐eared bat , 264
big brown bat , 142
spotted bat, 4
A llen’s big‐eared bat, 0
western red bat, 2
hoary bat , 88
silver‐haired bat, 192
California myotis, 100
western small‐footed myotis, 66
long‐eared myotis , 147
little brown myotis, 121
Arizona myotis, 0
fringed myotis, 16
long‐legged myotis, 107
Yuma myotis, 12
big free ‐tailed bat, 2
western pipistre lle , 76Brazilian free ‐tailed bat, 86
CENTRAL REGION
Figure 24e. Proportion of total bat inventory events for each of Utah’s 19 bat species within the Central UDWR.
Shannon-Wiener Diversity
An index of diversity showed differences in species diversity and evenness across
UDWR Regions (Fig. 25). The Southern Region had the highest diversity score, followed by the
Central, Northeastern, Southeastern and Northern Regions.
0
5
10
15
CE
NTR
AL
RE
GIO
N
NO
RTH
EA
STE
RN
RE
GIO
N
NO
RTH
ER
N
RE
GIO
N
SO
UTH
EA
STE
RN
RE
GIO
N
SO
UTH
ER
N
RE
GIO
N
Inde
x va
lue
Figure 25. Shannon-Weiner diversity indices, based on the diversity and evenness of species across UDWR Regions.

62
County
Bat species diversity varied within and across Utah’s 29 counties (Fig. 26a-s).
Washington County accounts for over 10% of total data for 9 species (pallid bat, Townsend’s
big-eared bat, big brown bat, spotted bat, western red, fringed myotis, Yuma myotis, big free-
tailed bat, western pipistrelle, and Brazilian free-tailed bat). San Juan County contained over
10% of the total data for 8 species (pallid bat, big brown bat, spotted bat, Allen’s big-eared bat,
California myotis, fringed myotis, Yuma myotis, and western pipistrelle). Kane County
accounted for over 10% of the total data for 7 species (Pallid bat, big brown bat, Allen’s big-
eared bat, long-eared myotis, Arizona myotis, fringed myotis, and Yuma myotis). Garfield
county recorded over 10% of the total data for 9 species (big brown bat, Allen’s big-eared bat,
California myotis, western small-footed myotis, long-eared myotis, fringed myotis, long-legged
myotis, Yuma myotis, and big free-tailed bat). Cache County accounted for over 10% of the total
data set for 6 species (big brown bat, hoary bat, silver-haired bat, long-eared myotis, little brown
myotis, and long-legged myotis). Millard County accounted for over 10% of the total data set for
3 species (California myotis, long-eared myotis, and Brazilian free-tailed bat). Emery, Morgan,
Rich, Summit and Wasatch Counties did not account for over 5% of any species data.
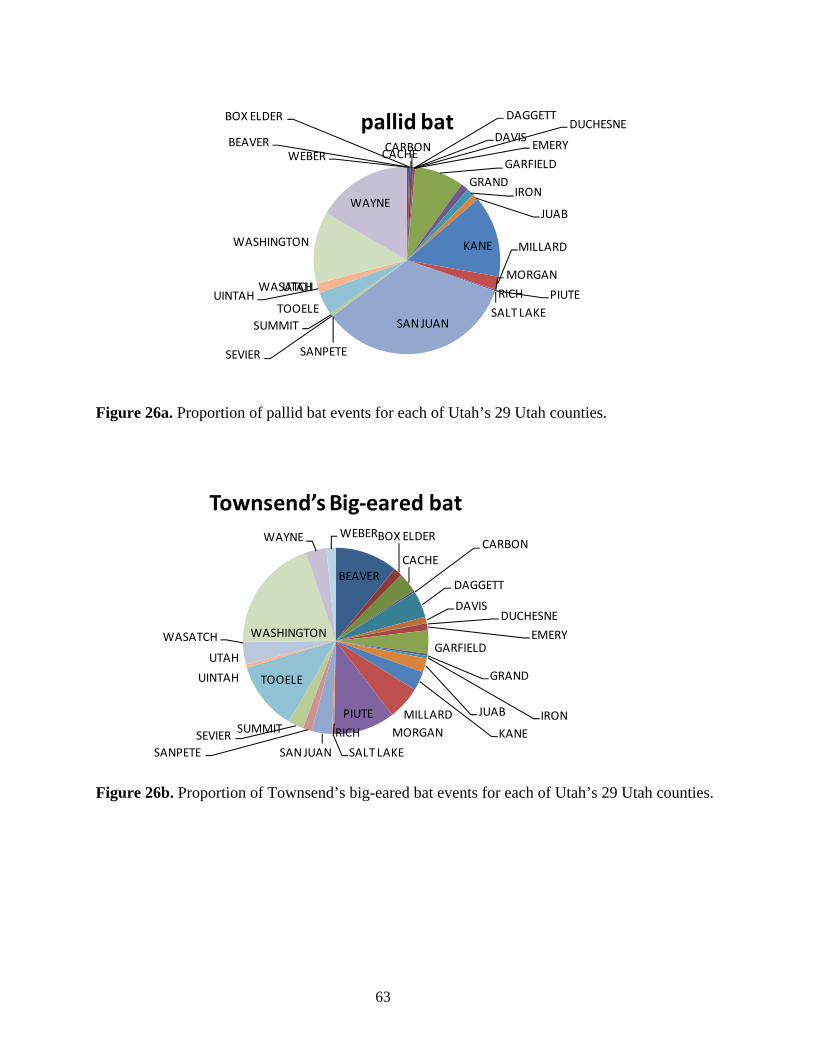
63
BEAVER
BOX ELDER
CACHECARBON
DAGGETT
DAVISDUCHESNE
EMERY
GARFIELDGRAND
IRON
JUAB
KANE MILLARD
MORGAN
PIUTERICH
SALT LAKESAN JUAN
SANPETESEVIER
SUMMITTOOELE
UINTAHUTAHWASATCH
WASHINGTON
WAYNE
WEBER
pallid bat
Figure 26a. Proportion of pallid bat events for each of Utah’s 29 Utah counties.
BEAVER
BOX ELDER
CACHECARBON
DAGGETT
DAVISDUCHESNE
EMERYGARFIELD
GRAND
IRONJUAB
KANE
MILLARDMORGAN
PIUTE
RICH
SALT LAKESAN JUANSANPETESEVIER SUMMIT
TOOELEUINTAH
UTAH
WASATCH WASHINGTON
WAYNE WEBER
Townsend’s Big‐eared bat
Figure 26b. Proportion of Townsend’s big-eared bat events for each of Utah’s 29 Utah counties.

64
BEAVER BOX ELDER
CACHE
CARBON
DAGGETT
DAVISDUCHESNE
EMERYGARFIELD
GRAND
IRON
JUAB
KANE
MILLARDMORGAN
PIUTERICH
SALT LAKE
SAN JUAN
SANPETE
SEVIER
SUMMIT
TOOELE
UINTAH
UTAH
WASATCH
WASHINGTON
WAYNE
WEBER
big brown bat
Figure 26c. Proportion of big brown bat events for each of Utah’s 29 Utah counties.
BEAVERBOX ELDER
CACHE
CARBONDAGGETT
DAVISDUCHESNE
EMERYGARFIELD
GRAND
IRON
JUABKANE
MILLARD
MORGAN
PIUTERICH
SALT LAKE
SAN JUAN
SANPETESEVIER
SUMMIT
TOOELE UINTAH
UTAH
WASATCH
WASHINGTON
WAYNE
WEBER
spotted bat
Figure 26d. Proportion of spotted bat events for each of Utah’s 29 Utah counties.

65
GARFIELD
GRAND
KANE
SAN JUAN
WASHINGTONWAYNE
Allen’s big‐eared bat
Figure 26e. Proportion of Allen’s big-eared bat events for Utah’s counties in which it occurs.
CACHE CARBON
UTAH
WASHINGTON
WAYNE WEBER
western red bat
Figure 26f. Proportion of western red bat events for Utah’s counties in which it occurs.

66
BEAVER
BOX ELDER
CACHE
CARBON DAGGETTDAVIS
DUCHESNEEMERYGARFIELDGRANDIRONJUABKANE
MILLARDMORGAN
PIUTERICH
SALT LAKE
SAN JUAN
SANPETESEVIER
SUMMIT
TOOELE
UINTAH
UTAH
WASATCH
WASHINGTON WAYNE
WEBERhoary bat
Figure 26g. Proportion of hoary bat events for each of Utah’s 29 Utah counties.
BEAVER
BOX ELDER
CACHE
CARBON
DAGGETT
DAVIS
DUCHESNEEMERYGARFIELD
GRANDIRONJUAB
KANEMILLARD
MORGAN
PIUTE
RICH SALT LAKE
SAN JUAN
SANPETE
SEVIER SUMMITTOOELE
UINTAH
UTAHWASATCH
WASHINGTON
WAYNE WEBER
silver‐haired bat
Figure 26h. Proportion of silver-haired bat events for each of Utah’s 29 Utah counties.

67
BEAVER
BOX ELDER
CACHECARBON
DAGGETT
DAVISDUCHESNE
EMERY
GARFIELD
GRAND
IRONJUAB
KANE
MILLARD MORGAN
PIUTE
RICHSALT LAKESAN JUAN
SANPETE
SEVIER
SUMMIT
TOOELEUINTAH
UTAH
WASATCH
WASHINGTON WAYNE
WEBER
California myotis
Figure 26i. Proportion of California myotis events for each of Utah’s 29 Utah counties.
BEAVER BOX ELDER
CACHECARBON
DAGGETTDAVIS
DUCHESNE
EMERY
GARFIELD
GRAND
IRONJUABKANEMILLARDMORGAN
PIUTE
RICH SALT LAKE
SAN JUAN
SANPETESEVIER
SUMMIT
TOOELE
UINTAHUTAH
WASATCH
WASHINGTONWAYNE WEBER
western small‐footed myotis
Figure 26j. Proportion of western small-footed myotis events for each of Utah’s 29 Utah counties.

68
BEAVER
BOX ELDER
CACHE
CARBON
DAGGETT
DAVIS
DUCHESNE
EMERYGARFIELD
GRAND
IRONJUAB
KANE
MILLARD
MORGAN
PIUTERICH
SALT LAKE
SAN JUAN
SANPETE
SEVIER
SUMMIT
TOOELE
UINTAHUTAH
WASATCH
WASHINGTON WAYNE WEBER
long‐eared myotis
Figure 26k. Proportion of long-eared myotis events for each of Utah’s 29 Utah counties.
BEAVER BOX ELDER
CACHE
CARBON
DAGGETTDAVISDUCHESNEEMERYGARFIELDGRANDIRON
JUABKANEMILLARDMORGANPIUTE RICH
SALT LAKE SAN JUAN
SANPETESEVIER
SUMMIT
TOOELE UINTAH
UTAH
WASATCH
WASHINGTONWAYNE
WEBER
little brown myotis
Figure 26l. Proportion of little brown myotis events for each of Utah’s 29 Utah counties.
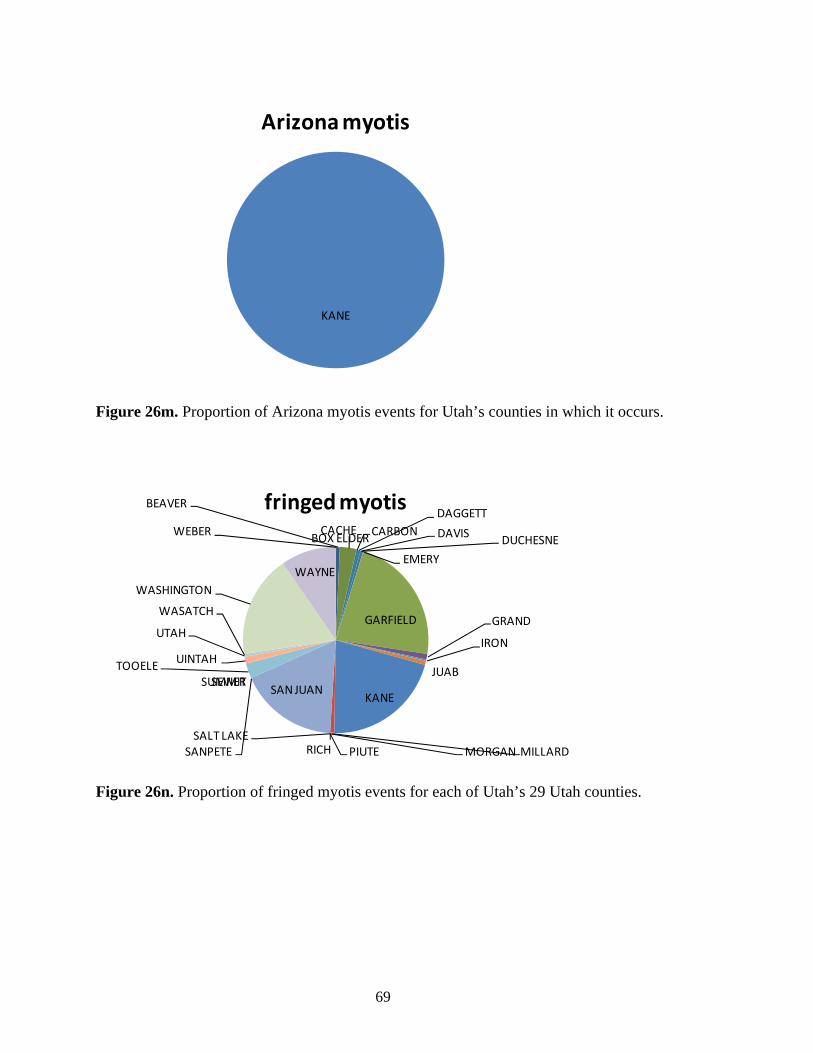
69
KANE
Arizona myotis
Figure 26m. Proportion of Arizona myotis events for Utah’s counties in which it occurs.
BEAVER
BOX ELDERCACHE CARBON
DAGGETT
DAVIS DUCHESNE
EMERY
GARFIELD GRAND
IRON
JUAB
KANE
MILLARDMORGANPIUTERICHSALT LAKE
SAN JUAN
SANPETE
SEVIERSUMMITTOOELE UINTAH
UTAH
WASATCH
WASHINGTONWAYNE
WEBER
fringed myotis
Figure 26n. Proportion of fringed myotis events for each of Utah’s 29 Utah counties.

70
BEAVER
BOX ELDER
CACHE CARBONDAGGETT
DAVIS
DUCHESNE
EMERY
GARFIELD
GRANDIRONJUAB
KANEMILLARD
MORGAN
PIUTERICH
SALT LAKESAN JUAN
SANPETE
SEVIER
SUMMIT
TOOELEUINTAH UTAH
WASATCH
WASHINGTON WAYNE WEBER
long‐legged myotis
Figure 26o. Proportion of long-legged myotis events for each of Utah’s 29 Utah counties.
BEAVER BOX ELDER
CACHECARBONDAGGETT
DAVIS
DUCHESNEEMERY
GARFIELD
GRAND
IRON
JUABKANE
MILLARDMORGANPIUTERICH
SALT LAKE
SAN JUAN
SANPETESEVIER
SUMMITTOOELE
UINTAHUTAH
WASATCH
WASHINGTON
WAYNEWEBER
Yuma myotis
Figure 26p. Proportion of Yuma myotis events for each of Utah’s 29 Utah counties.

71
GARFIELD
GRAND
KANE
MILLARDSAN JUAN
SEVIERUTAH
WASHINGTON
WAYNE
big free‐tailed bat
Figure 26q. Proportion of big free-tailed bat events for each of Utah’s counties in which it occurs.
BOX ELDER
DAGGETT EMERY GARFIELD
GRANDIRON
JUABKANE MILLARD
SAN JUAN
SEVIERTOOELE
UINTAH
UTAH
WASHINGTON WAYNE
WEBER
western pipistrelle
Figure 26r. Proportion of western pipistrelle events for each of Utah’s counties in which it occurs.

72
BEAVER
BOX ELDER
CARBON DAVIS DUCHESNE
GARFIELD
GRAND IRON
JUAB
KANE
MILLARD
PIUTESALT LAKE
SAN JUANSEVIER
TOOELE UINTAH
UTAH
WASATCH
WASHINGTON
WAYNEWEBER
Brazilian free‐tailed bat
Figure 26s. Proportion of Brazilian free-tailed bat events for each of Utah’s 29 Utah counties in which it occurs.
Shannon-Wiener Diversity
An index of diversity showed differences in species diversity and evenness across
Counties (Fig. 27). Garfield had the highest diversity index value followed by, Kane,
Washington, Grand, Iron, Millard, Juab and Utah. The lowest diversity scores were for Rich,
Piute, Wasatch and Morgan.
0
5
10
15
BE
AV
ER
BO
X E
LDE
R
CA
CH
E
CA
RB
ON
DA
GG
ETT
DA
VIS
DU
CH
ES
NE
EM
ER
Y
GA
RFIE
LD
GR
AN
D
IRO
N
JUA
B
KA
NE
MILLA
RD
MO
RG
AN
PIU
TE
RIC
H
UTA
H
WA
SA
TCH
WA
SH
ING
TON
WA
YN
E
WE
BE
R

73
Figure 27. Shannon-Weiner diversity index, based on the diversity and evenness of species across Utah’s 29 counties.
Abundance Indices (Objective 4)
Abundance indices provide some estimation the intensity of bat species use across the
state. Townsend’s big-eared bat abundance is highest in the west desert mountain ranges, the
mountainous areas along the Interstate 15 corridor and the north slope of the Uinta Mountains
(Fig. 28). The highest density of spotted bat events were in the Virgin River watershed in the
Mojave Desert and southeast of the confluence of the Colorado and Dolores rivers in eastern
Utah (Fig. 29). Spotted bat events were primarily in eastern Utah. Allen’s big-eared bats were
recorded in the Colorado Plateau and Mojave Desert in southern and southeastern Utah (Fig. 30).
Most events occurred near Lake Powell. Western red bats were observed across the state the
highest density in the Virgin River watershed in southwestern Utah (Fig. 31). All Western Red
bat events were associated with riparian zones. The Arizona myotis was only recorded in south
central Utah in Kane County (Fig. 32). Fringed myotis were at high densities in southwestern
and eastern Utah. Density for this species was highest east of Interstate 15 and south of Interstate
70 (Fig. 33). The big free-tailed bat occurred in low densities in the same area described for the
fringed myotis (Fig. 34). The other 12 species that are not designated as tier II and will not be
discussed here for figure space limitations see Appendix III.

74
Figure 28. Density of Townsend’s big-eared bat data collection events in the State of Utah. Each data point has a 5 km radius of activity zone. A continuum of event densities from high (red) to low (green) areas indicates the magnitude of data collection. Areas with no density cover lack data points.

75
Figure 29. Density of spotted bat data collection events in the State of Utah. Each data point has a 5 km radius of activity zone. A continuum of event densities from high (red) to low (green) areas indicates the magnitude of data collection. Areas with no density cover lack data points.

76
Figure 30. Density of Allen’s big-eared bat data collection events in the State of Utah. Each data point has a 5 km radius of activity zone. A continuum of event densities from high (red) to low (green) areas indicates the magnitude of data collection. Areas with no density cover lack data points.

77
Figure 31. Density of western red bat data collection events in the State of Utah. Each data point has a 5 km radius of activity zone. A continuum of event densities from high (red) to low (green) areas indicates the magnitude of data collection. Areas with no density cover lack data points.

78
Figure 32. Density of Arizona myotis data collection events in the State of Utah. Each data point has a 5 km radius of activity zone. A continuum of event densities from high (red) to low (green) areas indicates the magnitude of data collection. Areas with no density cover lack data points.

79
Figure 33. Density of fringed myotis data collection events in the State of Utah. Each data point has a 5 km radius of activity zone. A continuum of event densities from high (red) to low (green) areas indicates the magnitude of data collection. Areas with no density cover lack data points.

80
Figure 34. Density of big-free tailed bat data collection events in the State of Utah. Each data point has a 5 km radius of activity zone. A continuum of event densities from high (red) to low (green) areas indicates the magnitude of data collection. Areas with no density cover lack data points.

81
Breeding Habitat (Objective 5)
Reproductive individuals were observed for all 19 of Utah’s bat species. While these data
do indicate broad scale patterns they are by no means complete. A total of 1,249 reproductive
individuals were observed of 28,393 total bat individuals. The combination of this low sample
size and missing reproductive data limits any analysis of this portion of the data set.
Roosting and Foraging Habitat
Roosting and foraging habitat events varied across species (Fig. 35). Ten species were
observed day roosting. Four species were observed at hibernacula, 3 species at night roosts, 2 at
maternity roosts. The majority of data events were recorded during foraging bouts for 17 species.
least reports Townsend’s big-eared bats were observed hibernating, in 35%, foraging and day
roosting in 30% each, and maternity and night roosts 2.5% of events. All spotted bat, Allen’s
big-eared bat and Arizona myotis events were during foraging bouts. Fringed myotis were
observed foraging in 60% of events, and 20% in day roosting and hibernaculum events. Big free-
tailed bats were observed foraging in 85% of events and day roosts in 15% of events. However,
antidotal reports indicate that these patterns are a severe underestimation of roosting and
foraging habitat.
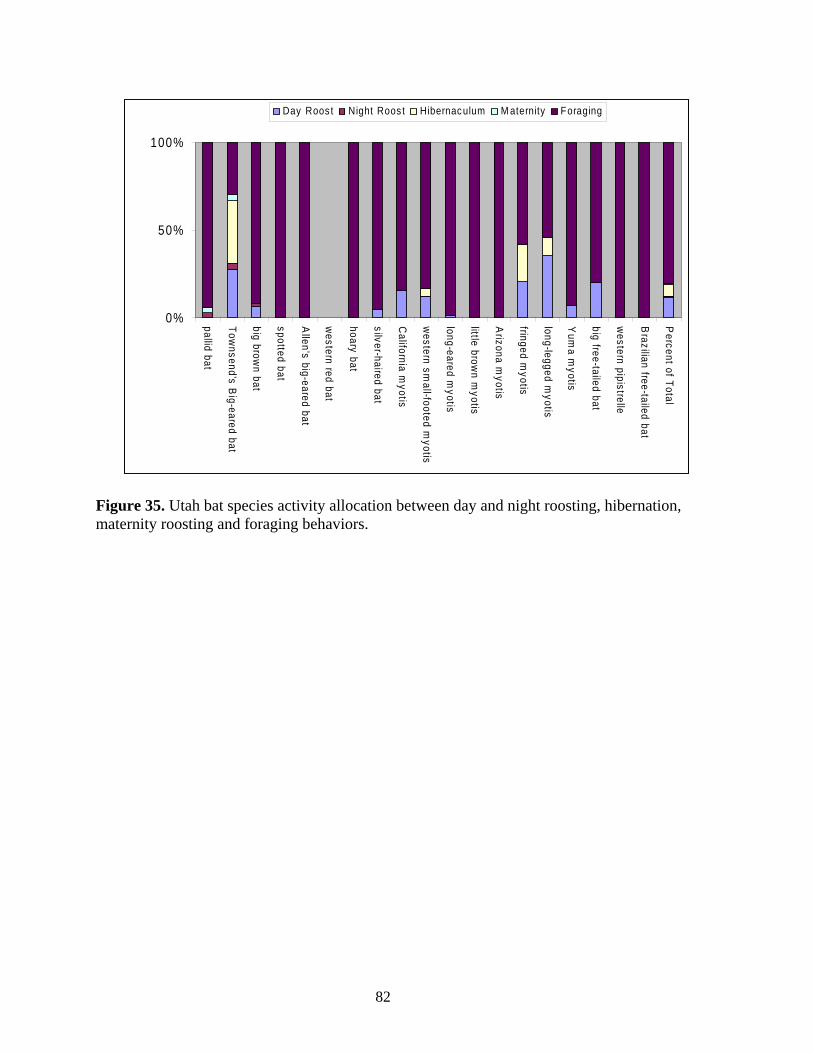
82
0%
50%
100%
pallid bat
Townsend’s B
ig-eared bat
big brown bat
spotted bat
Allen’s big-eared bat
western red bat
hoary bat
silver-haired bat
California m
yotis
western sm
all-footed myotis
long-eared myotis
little brown m
yotis
Arizona m
yotis
fringed myotis
long-legged myotis
Yum
a myotis
big free-tailed bat
western pipistrelle
Brazilian free-tailed bat
Percent of Total
Day Roos t Night Roos t Hibernaculum M aternity Foraging
Figure 35. Utah bat species activity allocation between day and night roosting, hibernation, maternity roosting and foraging behaviors.

83
Environmental Associations (Objective 6)
Elevation
Species varied within and across elevation (Fig. 36). All species were observed at 1501-
2000 m elevation, 18 species at 2001-2500 m and 1001-1500 (Arizona myotis was absent), 14
species at <1000 m (silver-haired bat, long-eared myotis, little brown myotis, Arizona myotis
and long-legged myotis were absent), and 2501-3000m (pallid bat, western red bat, Arizona
myotis, western pipistrelle and Brazilian free-tailed bat were absent), and 6 species were
observed at >3000 m (spotted bat, Allen’s big-eared bat, hoary bat, western small-footed myotis,
long-eared myotis and long-legged myotis). Townsend’s big-eared bats were observed at 1501-
2000 m in 50% of events, 2001-2500 m and 1001-1500 m in 20%. Spotted bat events were
distributed across elevations, 30% at <1000 m, 15% at Allen’s big-eared bat was observed at
1501-2000 m in 70% of events. Western red bat events occurred <1000 m for 60% of events. All
Arizona myotis events occurred at 1501-2000 m. Fringed myotis was observed across middle
elevations. Big free-tailed bat events generally occurred below 2000 m. It is important to note
that these are Geographic Position System (GPS) derived elevations and are thus, directly
impacted by the precision of the data. The majority of the data set is of above moderate precision
and indicates that these association are due to elevational relationships

84
0%
50%
100%
pallid bat
Townsend’s B
ig-eared bat
big brown bat
spotted bat
Allen’s big-eared bat
western red bat
hoary bat
silver-haired bat
California m
yotis
western sm
all-footed myotis
long-eared myotis
little brown m
yotis
Arizona m
yotis
fringed myotis
long-legged myotis
Yum
a myotis
big free-tailed bat
western pipistrelle
Brazilian free-tailed bat
Total events
< 1000m 1001-1500m 1501-2000m 2001-2500m 2501-3000m > 3000M
Figure 36. Utah bat species elevational distribution.
0
3000
6000
High Moderate Low
Precision
Figure 37. Location precision for the data set from high to low for 13,893 total bat events.

85
DISCUSSION
The consolidation, evaluation and analysis of bat data in the state of Utah were facilitated
by Legacy I (project number 07-346) and Legacy II (project number 08-346). The health of
Utah’s bat populations could not have been accessed without the foresight of the Legacy
program. This analysis indicates that Department of Defense lands support a variety of bat
populations including 4 sensitive species; Townsend’s big-eared bat, spotted bat, fringed myotis
and big free-tailed bat. Military lands in Utah provide a refuge from urban development, and
human recreational activities, and provide a baseline that will allow for a more proactive
management and monitoring of bat populations. The analysis of spatially explicit bat data in the
state of Utah has increased our understanding of survey needs, occurrence, diversity, abundance,
and roosting and breeding habitat.
Department of Defense
Department of Defense lands accounted for a high percentage of bat record events for 5
species and had diversity index values higher than all other ownership types except, BLM and
privately held land; even though DoD lands in Utah are 1/14 and 1/7 the land area of the BLM
and private lands. DoD in Utah also lacks open water coverage such as that scattered across
BLM lands and prominent on privately held lands. This high bat diversity is related to the unique
DoD land holdings in Utah. The land cover type that supports the most diverse bat fauna in Utah
is the Inter-Mountain Basins Big Sagebrush Grasslands was the dominate cover type on DoD
holdings in the state. Most DoD lands are within the Great Basin Shrub steppe ecoregion, which
also supports a very diverse bat fauna. While sagebrush grasslands have declined precipitously
over the last 103 years (Knapp 1996), many intact stands exist across DoD lands in the western

86
North America. These land holdings provide a refuge for bat populations and communities.
However, degraded sagebrush grasslands are often characterized by non-native invasive
forblands. This land cover type has increased on DoD lands over the last 103 years. Management
of DoD bat populations should be focused on habitat manipulations that promote the recovery of
sagebrush grasslands. An Analysis and Risk/Management Plan (Legacy III proposal) should
focus on monitoring and on increasing sagebrush grasslands on DoD lands.
Year
Sampling of bat populations began in 1905 and number of records (events) per year
peaked between 1986 and 1994. This peak in events relates directly to survey effort which
increased profoundly during this period (Oliver 2000). This portion of the analysis is limited by
record completeness. Many records from existing databases were imported into the data set but
had yet to be totally integrated. This leads to appearance of several species in the literature prior
to bat event records. A subset of historical data has yet to be formatted into the BATBASE data
set. We consolidated bat event data from many sources; however, the older data sets are unclear
or incomplete with regard to specific species capture events and thus have not been added to
BATBASE. The high diversity of species reported in the 1940s, 1900s and 2000s are the result
of increased survey effort rather than changes in diversity across time.
Month
Typically, field work for most bat species in Utah occurs after the first of April and
concludes at the end of September. The BATBASE data set consists of 97% warm season (April-
September) data and 3% cold season (October-March) data. Not only did this data set reflect the

87
survey effort, but possibly the actual pattern of bat activity. Four of Utah’s sensitive bat species
hibernate during the cold season, as does the Arizona myotis. The western red bat and big free-
tailed bat are migratory (Adams 2003). Thus, bat activity drops off drastically during the cold
season. Another source of variation in the cold to warm season bat data is the roosting ecology of
bats. Our winter data consist primarily of cave and mine survey data that precludes the detection
of vegetation and crevice roosting species. Other forms of winter data come from mortality, bats
captured in torpor in urban areas and bats that are active during the cold season. Monthly
diversity patterns are both a result of survey effort and actual diversity. The high diversity in
mid-summer (June, July, and August) is related to the presence of migratory species and high
activity levels of resident species.
Ecoregion
Survey effort across ecoregions was not equivalent to the percentage of area covered by
each. In the Colorado Plateau shrubland, the percentage of total events was higher than the
percent area of the ecoregion. This high percentage of events is likely a result of the number of
agencies collecting data (NPS, BLM, UDWR, and USFS) in this ecoregion. The Wasatch and
Uinta montane forest ecoregion is adjacent to urban areas and offices of management agencies.
The high percentage of records (events) compared to area in the Wasatch and Uinta montane
forests is likely the result of density of agencies and water sources in adjacent urban areas. Bat
records in the Great Basin shrub steppe, Wyoming Basin shrub steppe and Mojave Desert
shrubland are related to number of water sources which facilitate bat capture. The arid
characteristics of these ecoregions limit capture opportunity due to low density of water sources.

88
More species capture records were documented in the Colorado Plateau shrubland
ecoregion than all others. All 19 species were recorded in this ecoregion, with > 50% of the total
data for 9 species being from this single ecoregion. Diversity indices also show that the most
diverse and evenly represented ecoregion is the Colorado Plateau shrublands. The Great Basin
shrub steppe also had a high diversity score and included data events for 17 species. Wasatch and
Uinta montane forests had diversity measures only slightly above the Mojave Desert. The
Wyoming Basin was the least diverse.
Physiographic province
The pattern observed between the percentage of total records and percentage of total area
for 5 physiographic provinces is the result of survey effort and species diversity. The Colorado
Plateau had equivalent percentage of events and area. The Colorado Plateau again has a high
density of data collectors as well as high percent of total area. The Middle Rocky Mountains was
overrepresented in percentage of events. This is likely related to the water source density and
proximity to urban areas. The Basin and Range province has lower percent of total records than
expected from the area of the province. This is related to the scarcity of water sources in this
province, and the large distance from most population centers. The majority of military lands lie
in this area. The Columbia Plateau and Wyoming Basin make up less than 1% of land area in
Utah, and each had a low representation of events.
Diversity trends across physiographic provinces mirror that of the ecoregion diversity.
The Colorado Plateau supports all 19 species and accounts for > 45% of the total events for 13 of
those species. The Shannon-Weiner diversity index indicates that the Colorado Plateau is the
most diverse and even of the 5 physiographic provinces in terms of bat fauna. Of the 18 species

89
recorded in the Basin and Range more than 50% of total events for 3 species were within this
province. Twelve species were observed in the Wasatch and Uinta montane forest. This province
accounted for over 40% of events for 3 species. The small area and low sampling effort in both
the Wyoming Basin and the Columbia Plateau are causes of the seemingly low diversity and
evenness in these provinces.
Land cover type
Aerial extension of particular land cover types and percentages of bat capture events were
related to ecoregion, landowner type, and proximity to urban areas. Seven land cover types had a
higher percentage of events than expected based on land area. The Colorado Plateau had 2 over-
represented land cover types (9, 53) (Appendix 1), Wasatch and Uinta montane forests had 3 (23,
34, 79), Urban areas 1 (111) as did the Mojave Desert (60). The densities of events for the
Colorado Plateau and Wasatch and Uinta montane forest have been discussed above. The high
density of events in Sonora-Mojave Creosotebush-White Bursage Desert Scrub (60) was the
result of extensive work conducted by UDWR, BLM and Southern Utah University.
Patterns of bat diversity are related to vegetative cover. As in the ecoregion and
physiographic province analysis, the Colorado Plateau Mixed Bedrock canyon and Tableland
accounted for a higher percentage of records for more species than any other cover type.
Colorado Plateau Pinyon-Juniper woodlands also had high bat species diversity and accounted
for a high percentage of total events for 16 species. Low Intensity Developed open space also
had a high diversity of species, as did the multiple riparian land cover types and Mojave Desert
land cover types. Diversity indices indicated that the Inter-Mountain Basins Big Sagebrush
Grasslands have the highest diversity and evenness. This is the cover type that characterizes most
90
Department of Defense lands in the west. Colorado Plateau and Great Basin Woodlands also had
high diversity and evenness scores, as did North American Arid West Emergent Marsh.
Chaparral and shrub steppe land cover types also appear to have a relatively high diversity. The
lowest diversity was found in Inter-Mountain Cliff and Canyon, warm desert washes, salt desert
scrub, tundra, and invasive annual dominated cover types. The highest diversity land cover types
are characterized by southern distribution or proximity to water or prey resources. Bat diversity
appears to decrease with increasing latitude in the northern hemisphere (Kauffman 1995) as we
observed here.
Landowner
More species at a higher number of events were observed on BLM lands than any other
type. BLM managed lands account for more area than all other types and these lands are
characterized by the high diversity land cover types discussed above. BLM land holdings are
primarily within the Great Basin shrub steppe and Colorado Plateau shrublands. These 2
ecoregions are composed of shrublands and woodlands the most diverse of the land cover types.
DoD lands also had a high species diversity and bat density. DoD lands are located almost
exclusively in the Great Basin shrub steppe, which as mentioned above has the highest diversity
land cover types. USFS lands were also fairly diverse, likely a result of forested habitat. All but
the western red bat and the Arizona myotis were observed on USFS lands. The Wasatch and
Uinta montane forest ecoregion is primarily administered by the USFS. The same values which
promote diversity and high population density for multiple species in this ecoregion account for
bat event patterns on USFS lands. Private lands are often characterized by higher available

91
surface waters than adjacent lands. STILA lands were also very diverse likely due to the
statewide distribution of this land owner type across ecological boundaries.
UDWR region
The Southern and Southeastern UDWR Regions accounted for >50% of 11 species
events. These two regions are dominated by the most diverse land cover types and ecoregions.
The Southern Region had the highest diversity index score followed by the Central,
Northeastern, Southeastern and Northern Regions. Measures of diversity and evenness are
hindered by high events for a few species and low events for the others as in the Southeastern
Region. The Central Region had a low number of total events but those events were spread
evenly across species. The Northeastern Region incorporates the northern end of the most
diverse ecoregion (Colorado Plateau shrubland) and has more open water than all UDWR
Regions except the Southeastern.
County
Six counties accounted for a greater percentage of total events for more species than all
others. Garfield County had the highest diversity score, the location of this county in Montane
and Colorado Plateau ecoregions and the high diversity of land cover type in this county account
for the high diversity. Kane County also had high diversity scores this is likely due to the
southern location in the Colorado Plateau which facilitates mixing of northern and southern
species and the high diversity of land cover types. Washington County was also very diverse.
This county is the primary location of the Mojave Desert ecoregion in Utah. The southern
location of this county and the combination of 3 ecoregions (Mojave Desert, Colorado Plateau

92
shrubland and Montane forests) and high diversity land cover types explain the high diversity
here. Grand and Iron Counties are also characterized by multiple ecoregions and associated
diverse land cover types. Some central Utah Counties (Millard, Utah, and Juab) also showed
high diversity scores. These three counties are primarily characterized the most diverse land
cover type (Inter-Mountain Basins Big Sagebrush Grasslands) and a central location which
facilitates southern and northern species mixing. Tooele County had 14 species and accounted
for 4% of all events. Rich, Piute, Wasatch and Morgan had very low diversity scores and number
of species. While the two northern counties (Rich and Morgan) only contain a single ecoregion
and have a comparatively simple land cover Wasatch and Piute counties have a more diverse
landscape. The low diversity for Morgan and Rich Counties may be due to actual diversity
patterns. In contrast, diversity of adjacent counties indicates that Wasatch and Piute diversity
scores are a result of low sampling density rather than actual diversity
Elevation
More species (19) were observed between 1501-2000 m elevation than all other
elevations. This elevational band corresponds to the base of the Wasatch Uinta montane forest,
the location of much of Utah’s open water. All species were observed at 1501-2000 m elevation,
18 species at 2001-2500 m and 1001-1500 m (Arizona myotis was absent), 14 species at <1000
m (silver-haired bat, long-eared myotis, little brown myotis, Arizona myotis and long-legged
myotis were absent), and 2501-3000 m (pallid bat, western red bat, Arizona myotis, western
pipistrelle and Brazilian free-tailed bat were absent), and 6 species were observed at >3000 m
(spotted bat, Allen’s big-eared bat, hoary bat, western small-footed myotis, long-eared myotis
and long-legged myotis).

93
Townsend’s big-eared bat
Townsend’s big-eared bat was detected in all ecoregions except the Wyoming Basin
shrub steppe. The Wyoming Basin shrub steppe covers a much smaller portion of Utah than the
other 4 ecoregions. This smaller size resulted in less of the total data in this ecoregion. Along
with data collection, the roosting ecology of Townsend’s big-eared bat may explain the lack of
records in the Wyoming Basin. This species is a cavern-roosting specialist. The lack of cavern
habitat in the Wyoming Basin may account for this species distribution. Records of Townsend’s
big-eared bats were also absent from the Wyoming Basin physiographic province, likely for the
same reasons discussed above. This species was observed in 44 of 61 land cover types, the
majority of these land cover types were characterized by rocky outcrops or montane systems.
The cavern habitat requirements of this species for maternity and hibernacula roosts indicate that
it is associated with natural caves and abandoned mines (Oliver 2000). These caves and mines
are located in parent material, thus land cover for this species is dependent on cavern or mineral
bearing rock types. Townsend’s big-eared bat was recorded on all land owner types except State
Sovereign Lands (SL&F). Once again this species is associated with a variety of land owner
types and is located within all 5 UDWR Regions and all counties except Morgan and Rich. The
common theme of these data, again, is that cavern locations transcend management boundaries.
Townsend’s big-eared bat is strongly associated with cavern habitat (Sherwin et al. 2000). The
density of events for this species reflected that affinity. The highest density of records for this
species were in mountainous terrain, which is characterized by caves and abandoned mines, the
roosting habitat specificity of this species dictates density.

94
Townsend’s big-eared bat as mentioned above is a cavern roosting obligate species. Cave
and mine density is highest in the Colorado Plateau shrublands (uranium mines), Great Basin
shrub steppe (hard rock mines) and Wasatch and Uinta montane forest where breeders for this
species were observed. Townsend’s big-eared bats were observed primarily between 1001 to
2500 m. Once again, this is likely due to the relationship between cavern habitat at these
elevations and this species.
Spotted Bat
Spotted bats were only recorded in Colorado Plateau shrublands and the Great Basin
shrub steppe. This species is associated with arid systems and roosts in crevices high on rock
walls (Watkins 1977). These two ecoregions are both arid and contain a large number of
available crevice roosts. Physiographically, this species occupied the Basin and Range, Colorado
Plateau and Middle Rocky Mountains. While the first 2 provinces overlap the ecoregions
described above, the Middle Rocky Mountains supplies the open ponderosa habitat this species is
strongly associated with (Watkins 1977). The spotted bat was recorded in 23 land cover types.
These land cover types are characterized by cliffs, canyons and tablelands, and woody
vegetation. This species was observed in 6 land owner types including DoD lands. Spotted bats
were observed in all UDWR Regions except the Northern, and in 12 Utah counties. This
distribution was also noted by Black 1970; Armstrong 1974; Foster et al. 1997; and Oliver 2000.
The distribution of spotted bat occurrence indicates a statewide distribution as hypothesized by
Oliver (2000). Data points in Duchesne and Uintah counties indicate spotted bat use multiple loci
in northern Utah. Although data from extreme western locations is still lacking, the common
theme behind spotted bat occurrence is the presence of crevice roosting habitat, riparian
95
woodlands and forested foraging habitat (Wilson and Ruff 1999). The habitat specificity of this
species likely limits distribution and population density (Pierson and Rainey 1998). Spotted bats
are generally associated with desert and crevice habitats (Watkins 1977). Ruffner et al. (1979)
noted spotted bats in the Virgin River Drainage and Jackson and Herder (1997) observed a
higher density of capture events in riparian zones.
The spotted bat is a crevice roosting species associated with exposed parent material as in
the Great Basin shrub steppe and Colorado Plateau shrublands. Spotted bat events were
distributed across elevations, but most prominent at lower elevations. Findley et al. (1975) also
noted that this species was associated with lower elevations in Colorado.
Allen’s big-eared bat
Allen’s big-eared bats were recorded in 3 ecoregions: Colorado plateau shrublands,
Mojave Desert and Wasatch and Uinta montane forests, and 2 physiographic provinces (Basin
and Range and Colorado Plateau). This big-eared bat was recorded in 5 land owner types, but
only in the Southern and Southeastern UDWR Regions and 6 counties. This county level
distribution was also noted by Black (1970), Armstrong (1974), Foster et al. (1997) and Oliver
(2002). While the ecology of this rare species is poorly understood, some habitat associations
have been noted (Rabe et al. 1998; Adams 2003). Allen’s big-eared bat observations generally
occurred in patchy forested habitat such as ponderosa pine forest, pinyon-juniper, riparian, and
oak woodlands, and fir forest (Wilson and Ruff 1999). Of the 18 land cover types this species
was detected in the above habitats were occupied as well as a variety of shrublands, grasslands,
and developed cover types.

96
Allen’s big eared bat is generally associated with canyon habitat (Adams 2003). The high
density of activity in southern and southeastern Utah was likely associated with canyon habitat
density. Allen’s big-eared bat breeders were only observed in the Colorado Plateau shrublands.
Allen’s big-eared bat was observed more often at 1501-2000 m elevation. While this
species is associated with lower elevation (Adams 2003), the majority of the Colorado
shrublands ecoregion is within this elevational range.
Western red bat
Western red bats were only detected in 19 events. The limited records for this species
does however, indicate a distributional pattern. This species was detected in 3 ecoregions,
primarily Colorado Plateau shrublands, but events also exist in the Great Basin shrub steppe and
a single record from Wasatch and Uinta montane forest. This pattern is also reflected in
physiographic provinces, with detection in the Colorado plateau, Basin and Range and the
Middle Rocky Mountains. Red bats were only observed in 2 land cover types: Rocky Mountain
Bigtooth Maple Ravine and Colorado Plateau Pinyon-Juniper Woodlands. This species is a
foliage rooster and is associated with edge habitat near riparian land cover (Barbour and Davis
1969; Kunz 1982). It is likely that this species occurrence is a function of vegetation structure
and the proximity to perennial water sources (Wilson and Ruff 1999). All capture events
occurred within 10 km of a perennial water source. Western red bats were recorded in 6 Utah
counties, including Cache, Carbon, Utah and Washington counties as noted by Bogan (1997),
and Wayne and Weber counties yet to be mentioned in the literature. This species was recorded
primarily on private lands with a single observation from UDWR lands. The western red bat was
recorded in all UDWR Regions except the Northeastern. The association of this species with

97
deciduous foliage and riparian zones likely dictates its occurrence in Utah. While the records of
this species are distributed across the State, the habitat in which they were recorded in is rare on
the landscape. The western red bat is likely a migratory visitor to the state. Western red bats are
solitary foliage roosters and are associated with riparian habitats (Adams 2003). The density of
activity in Utah is the result of this species affinity for riparian habitats. No western red bat
breeders were observed, likely due missing reproductive data rather than the ecology of this
species. Western red bat events occurred at less than 1000 m for 60% of events. Others have also
noted that this species occurs at lower elevation riparian zones (Wilson and Ruff 1999).
Arizona myotis
Arizona myotis was observed on a limited spatial and temporal scale. Records for this
species were dominated by capture events in June and July. This species was only observed in
the Colorado Plateau shrublands ecoregion and Colorado Plateau physiographic province. This
species was recorded in 3 Colorado Plateau land cover types, characterized by woodlands,
shrublands, and tablelands. Arizona myotis occurred only on BLM and privately held lands in
the UDWR Southern Region in Kane County. While the taxonomy of this species is yet to be
resolved (Oliver 2000) the occurrence pattern in the State augments Adams’ (2003) distribution
in Arizona. Records of this species exist over a long time frame but are clustered in mid-summer.
These patterns indicate that this species, or sub-species, is at its northern most distribution in
Utah.
The density of the Arizona myotis is likely the result of taxonomic confusion with this
species (Oliver 2000). The data events that recorded this species only exist in a single county.
Until the taxonomic uncertainties can be addressed, the distribution and density of this species or

98
subspecies cannot be determined. Arizona myotis breeders were only observed in the Colorado
Plateau shrublands. All Arizona myotis events all occurred between 1501 2000 m. This trend is
likely due to the limited distribution records for this species in Utah.
Fringed myotis
The fringed myotis was recorded in all ecoregions except the Wyoming Basin shrub
steppe, 3 physiographic provinces; Basin and Range, Colorado Plateau and Middle Rocky
Mountains and 35 land cover types. Managerially, this species was detected on 9 land owner
types including DoD, all UDWR regions, and 16 Utah counties. This species is associated with
middle elevations in grassland, desert, woodland and montane habitats (Reduker et al. 1983).
This species appears to behave as a foliage gleaner (Wilson and Ruff 1999). The magnitude of
observations for this species was greater in the Southern and Southeastern UDWR Regions. This
skewed distribution was hypothesized by (Adams 2003). The occurrence of this species is
dependent on land cover type and associated cavern roosting habitat.
The fringed myotis is often associated with pinion and oak woodlands however this
species has been captured in a wide variety of habitats (Foster et al. 1997). The highest density of
fringed myotis events were recorded in southern Utah. This trend was mentioned by Adams
(2003). The medium density records of the species on DoD lands in the west desert may indicate
an extension in range (Adams 2003).
The fringed myotis as mentioned above is a cavern roosting obligate species. Cave and
mine density is highest in the Colorado Plateau shrublands (Uranium mines), Great Basin shrub
steppe (hard rock mines) and Wasatch and Uinta montane forest where breeders for this species

99
were observed. Fringed myotis was observed across middle elevations, again, this likely the
result of the distribution of cavern habitat in Utah.
Big free-tailed bat
Big free-tailed bats occurred across scales at a low density. There were records for this
species in all but the Wyoming Basin ecoregion. Big free-tailed bats were observed in the Basin
and Range and the Colorado Plateau physiographic provinces and in 26 land cover types. Cover
types varied from high intensity developed lands to Mojave Desert scrub and montane riparian
areas. The majority of data for this species was concentrated in Sonora-Mojave Creosotebush-
White Bursage Desert Scrub and Colorado Plateau Mixed Bedrock Canyon and Tableland.
While the highest density of collection events is in the Colorado Plateau records from Basin and
Range and montane forests indicate a range extension into southern Utah. Schmidly (1991) and
Adams (2003) hypothesized a range limited to extreme southern and Eastern Utah. The mobility
and migratory nature of this species likely account for this broader scale of distribution in Utah.
The big free-tailed bat is migratory and roosts high on cliff walls (Adams 2003). This
accounts for the southerly distribution in the Colorado Plateau. Records of this species from the
west desert and Wasatch montane forests are likely the result of migratory behavior; the lack of
any high density activity is related to the rarity and solitarily of this species. Big free-tailed bat
breeders were only observed in the Colorado Plateau shrublands. Big free-tailed bat events
generally occurred below 2000m. Jones (1965) recorded this species as high as 2400 m,
however, this species appears to be associated with lower elevations as recorded with this data
set (Adams 2003).

100
IMPLICATIONS
By defining the current status of bat distributions in Utah we have begun a new stage in
bat monitoring and research. This data set provides a base for protocol development, species
habitat modeling and sensitive species monitoring. The patterns observed in the data set indicate
that a protocol for monitoring bat populations should be fitted to the distribution of the bat
species of interest. The data set also shows that a monitoring protocol needs to take into account
underrepresented locations and cover types. These data allude to associations of bat species and
environmental factors. The data set provides the basis of understanding needed to implement an
occupancy based model. These results provide a list of managerial monitoring needs via un-
surveyed areas and recorded location of sensitive species or communities. These findings also
indicate that there is a need to manage risks and identify threats to bat species as detailed in the
Legacy III project proposal.

101
LITERATURE CITED
Adams. R.A. 2003. Bats of the Rocky Mountain West: natural history, ecology, and conservation. University Press of Colorado, Boulder Colorado. Altenbach, J.S. and R.E. Sherwin. 2002. Importance of protecting mines. Presented at the Bat Gate Design Forum, March 4-6, Austin Texas. Altingham, J.D. 1996. Bats Biology and Behavior. Oxford University Press.
Armstrong, D.M. 1974. Second record of the Mexican big-eared bat in Utah. Southwestern Naturalist 19: 114-115. Barbour, R.W. and W.H. Davis. 1969. Bats of America. University Press of Kentucky, Lexington. p.286. Benson, S.B. 1954. Records of the spotted bat (Euderma maculatum) from California and Utah. Journal of Mammalogy 35:117. Black, H.L. 1970. Occurrence of the Mexican big-eared bat in Utah. Journal of Mammalogy 51:190. Bogan, M.A. 2000. Western bats and mining. Proceedings of bat conservation and mining: a technical interactive forum, November 16-16, St. Louis, Missouri. Brown, P. E., and R.D. Berry. 1991. Bats: habitat, impacts and mitigation. Pages 26-30 in [eds.] D. Comer, P.R. Davis, S.Q. Foster, C.V. Grant, S. Rush, O. Thorne II. J. Todd, editors. Proceedings of the Thorne Ecological Institute: issues and technology in the management of impacted wildlife. Thorne Ecological Institute, Snowmass, Colorado, USA. Code of Federal Regulations, Volume 50-Monday, July 15, 1991. Dobkin, D.S., R.D. Gettinger, and M.G. Gerdes. 1995. Springtime movements, roost use and foraging activity of Townsend’s Big-Eared Bat (Plecotus Townsendii) in Central Oregon. Great Basin Naturalist 55(4):315-321 Federal Register, Volume 59, No. 219-Tuesday, November 15, 1994.
Durrant, S.D. 1952. Mammals of Utah: taxonomy and distribution. University of Kansas Publications. Museum of Natural History 6:1-549 Foster, D.A., L. Grignon, E. Hammer, and B. Warren. 1997. Inventory of bats in high plateau forests of central and southern Utah. In the Proceedings of the Third Biennial Conference of Research on the Colorado Plateau. Transactions and Proceedings Series NPS/NRNAU/NRTP-97/12, USDI National Park Service.

102
Hardy, R. 1941. Some notes on Utah bats. Journal of Mammalogy 22: 289-295.
Jackson, J.G., and M.J. Herder. 1997. Baseline bat inventory of southern Utah using mist nets and ultrasonic detectors. Utah Division of Wildlife Resources. Cedar City, UT. Publication number 97-110. Knapp, P.A. 1996. Cheatgrass (B. tectorum L.) dominance in the Great Basin Desert: History, persistence and influences to human activities. Global environmental change 6: 37-52. Humphrey, S.R. and T.H. Kunz. 1976. Ecology of a Pleistoscene relict, the Western Big-eared bat (Plecotus townsendii), in the southern Great Plains. Journal of Mammalogy 57:470-494. Kunz, T.H. 1982. Ecology of bats. Plenum Press New York: New York, U.S.A.
McCracken, G. F. 1988. Who’s endangered and what can we do? Bats 6(3): 5-9. Mickleburgh et al. 2002 Oliver, G.V. 2000. The bats of Utah: a literature review. Department of Natural Resources publication number 00-14. Oliver, G. V., A. D. Kozlowski, K. Day, and K. Bunnell, Kevin. Draft 11-3-2008. Utah Bat Conservation Plan. Version 1.0. Utah Division of Wildlife Resources, Salt Lake City, UT. Peirson, E.D. and W.E. Rainey. 1998. Distribution of the spotted (Euderma maculatum) in California. Journal of Mammalogy 79:1296-1305. Presnell C.C. and E.R. Hall. 1936. Ranges and relationships of certain mammals in southwestern Utah. Proceedings of the Utah Academy of Sciences, Arts and Letters 13:211-213. Rabe, M.J. , T.E. Morrell, H. Green, J.C. DeVos, and C.R. Miller. 1998. Characteristics of ponderosa pine snag roosts used by reproductive bats in northern Arizona. Journal of Wildlife Management 62:612-621. Racey, P.A. and A.E. Entwistle. 2000. Life history and reproductive strategies of bats. p.363-414 in: Reproductive Biology of Bats [eds.] E.G. Crighton and P.H. Krutzsch. Academic Press. New York. Racey, P.A., and A.C. Entwistle. 2003. Conservation Ecology of Bats. In Bat Ecology. Eds. T.H. Kunz and M.B. Fenton. The University of Chicago. Chicago and London. P. 681 Reduker, D.W., T.L. Yates, and I.F. Greenbaum. 1983. Evolutionary affinities among southwestern long-eared myotis. Journal of Mammalogy. 64:666-677.

103
Richter, A.R., S.R. Humphrey, J.B. Cope, and V. Brock. 1993. Modified cave entrances: thermal effects on body mass and resulting decline of endangered Indiana bats (Myotis sodalis). Conservation Biology 7:407-415. Sherwin, R.E., D. Stricklan, and D.S. Rogers. 2000. Roosting affinities of Townsend’s big-eared bat (Corynorhinus townsendii) in northern Utah. Journal of Mammalogy 81(4):993-947 Schmidly, D.J. 1991. The Bats of Texas. Texas A & M University press, College Station. p. 224.
Stebbings, R. E. 1980. An outline global strategy for the conservation of bats. Pages 173-178 in D. E. Wilson and A.L. Gardner, editors. Proceedings of the Fifth International Bat Research Conference. Publication of Texas Tech. University Press, Lubbock, Texas, USA. Tudge, C. 1994. Going bats over conservation. New Scientist 141(1916): 27-31.
Tuttle, M.D. and A.R. Taylor. 1994. Bats and mines. Bat Conservation International Resource Publication No. 3., Bat Conservation International Inc., Austin, Texas, USA. Twente, John W Jr. 1955. Some aspects of habitat selection and other behavior of cavern-dwelling bats. Ecology 36(4):706-732. Utah Division of Wildlife Resources. Utah comprehensive wildlife conservation strategy. 2005-2015. Publication number 05-19. Table 6.1. P. 6-54 to 65. Utah Division of Wildlife Resources. 2006. Utah Sensitive Species List. Available at: http://dwrcdc.nr.utah.gov/ucdc/ViewReports/SSL101706.pdf United States Fish and Wildlife Service 2008. The Endangered Species Program. Available at: http://www.fws.gov/Endangered/bats/bats.html Walsh, A.L and S.Harris. 1996. Factors influencing the abundance of vespertilionid bats in Britain: geographical, land class and local habitat relationships. Journal of Applied Ecology. 33:519-529. Watkins, L.C. 1977. Euderma maculatum. Mammalian Species 77:1-4.
Wilson, D.E. and s. Ruff. 1999. The Smithsonian Book of North American Mammals. Smithsonian Institution Press. Washington and London. p. 749.

104
Appendix I. Identifier for each land cover type used in the above analysis.
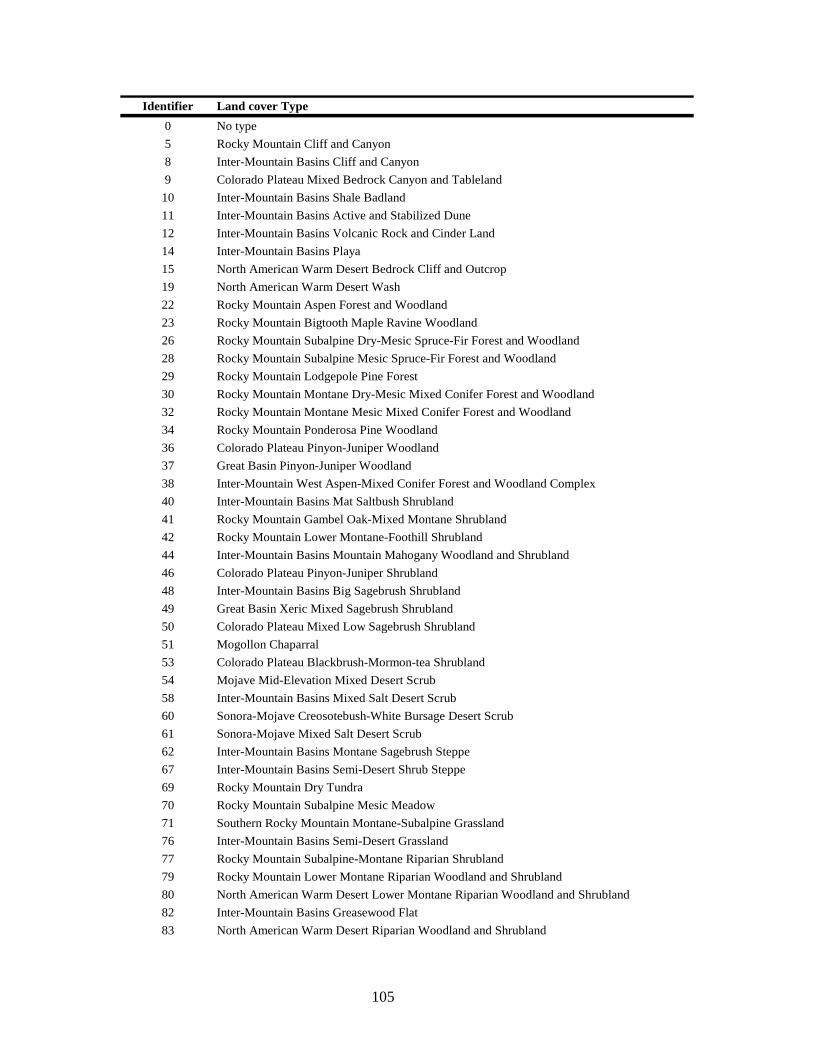
105
Identifier Land cover Type0 No type5 Rocky Mountain Cliff and Canyon8 Inter-Mountain Basins Cliff and Canyon9 Colorado Plateau Mixed Bedrock Canyon and Tableland10 Inter-Mountain Basins Shale Badland11 Inter-Mountain Basins Active and Stabilized Dune12 Inter-Mountain Basins Volcanic Rock and Cinder Land14 Inter-Mountain Basins Playa15 North American Warm Desert Bedrock Cliff and Outcrop19 North American Warm Desert Wash22 Rocky Mountain Aspen Forest and Woodland23 Rocky Mountain Bigtooth Maple Ravine Woodland26 Rocky Mountain Subalpine Dry-Mesic Spruce-Fir Forest and Woodland28 Rocky Mountain Subalpine Mesic Spruce-Fir Forest and Woodland29 Rocky Mountain Lodgepole Pine Forest30 Rocky Mountain Montane Dry-Mesic Mixed Conifer Forest and Woodland32 Rocky Mountain Montane Mesic Mixed Conifer Forest and Woodland34 Rocky Mountain Ponderosa Pine Woodland36 Colorado Plateau Pinyon-Juniper Woodland37 Great Basin Pinyon-Juniper Woodland38 Inter-Mountain West Aspen-Mixed Conifer Forest and Woodland Complex40 Inter-Mountain Basins Mat Saltbush Shrubland41 Rocky Mountain Gambel Oak-Mixed Montane Shrubland42 Rocky Mountain Lower Montane-Foothill Shrubland44 Inter-Mountain Basins Mountain Mahogany Woodland and Shrubland46 Colorado Plateau Pinyon-Juniper Shrubland48 Inter-Mountain Basins Big Sagebrush Shrubland49 Great Basin Xeric Mixed Sagebrush Shrubland50 Colorado Plateau Mixed Low Sagebrush Shrubland51 Mogollon Chaparral53 Colorado Plateau Blackbrush-Mormon-tea Shrubland54 Mojave Mid-Elevation Mixed Desert Scrub58 Inter-Mountain Basins Mixed Salt Desert Scrub60 Sonora-Mojave Creosotebush-White Bursage Desert Scrub61 Sonora-Mojave Mixed Salt Desert Scrub62 Inter-Mountain Basins Montane Sagebrush Steppe67 Inter-Mountain Basins Semi-Desert Shrub Steppe69 Rocky Mountain Dry Tundra70 Rocky Mountain Subalpine Mesic Meadow71 Southern Rocky Mountain Montane-Subalpine Grassland76 Inter-Mountain Basins Semi-Desert Grassland77 Rocky Mountain Subalpine-Montane Riparian Shrubland79 Rocky Mountain Lower Montane Riparian Woodland and Shrubland80 North American Warm Desert Lower Montane Riparian Woodland and Shrubland82 Inter-Mountain Basins Greasewood Flat83 North American Warm Desert Riparian Woodland and Shrubland

106
85 North American Arid West Emergent Marsh86 Rocky Mountain Alpine-Montane Wet Meadow98 Great Basin Foothill and Lower Montane Riparian Woodland and Shrubland
108 Southern Colorado Plateau Sand Shrubland110 Open Water111 Developed, Open Space - Low Intensity112 Developed, Medium - High Intensity114 Agriculture117 Recently Mined or Quarried118 Invasive Southwest Riparian Woodland and Shrubland119 Invasive Perennial Grassland121 Invasive Annual Grassland122 Invasive Annual and Biennial Forbland123 Recently Logged Areas124 Recently Chained Pinyon-Juniper Areas

107
Appendix II. Density of events for the 12 non-sensitive species.

108

109

110
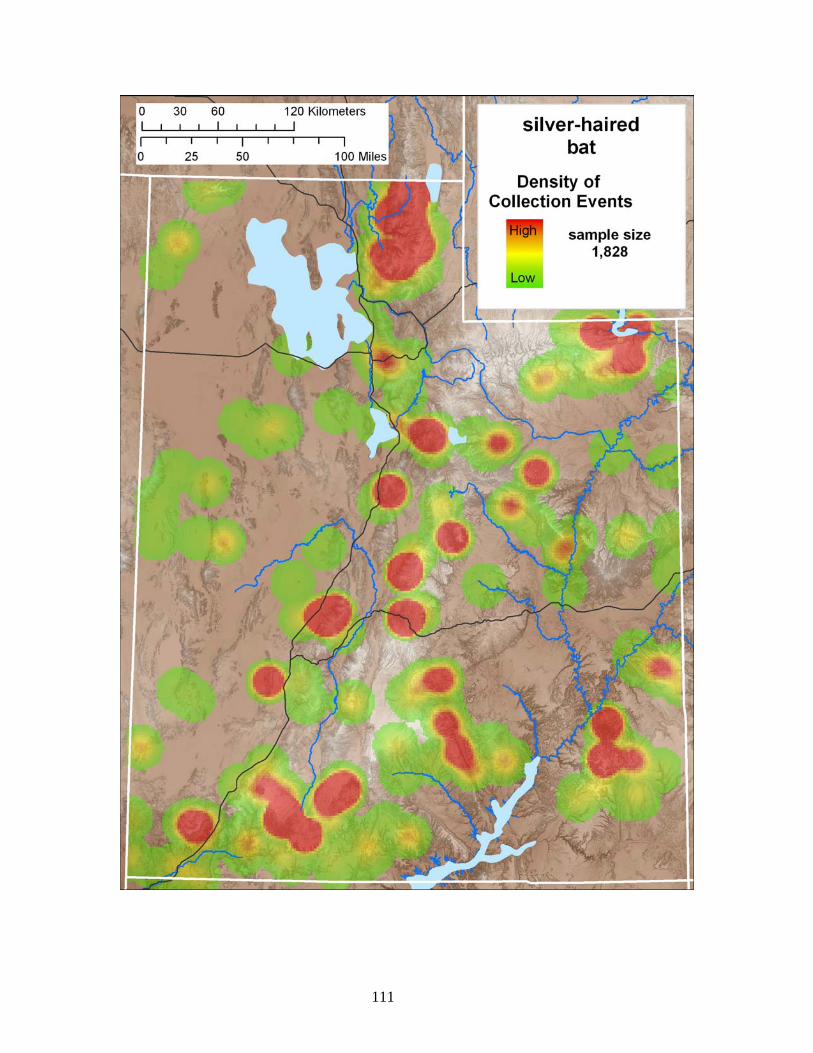
111

112

113

114
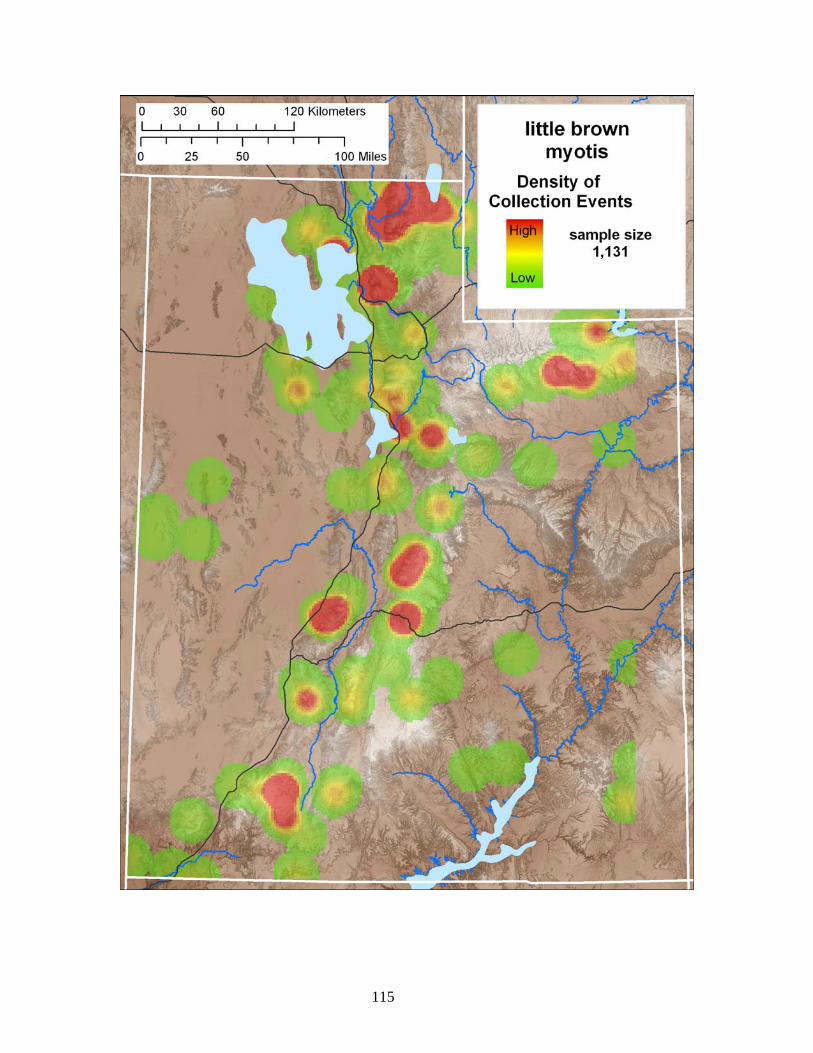
115

116
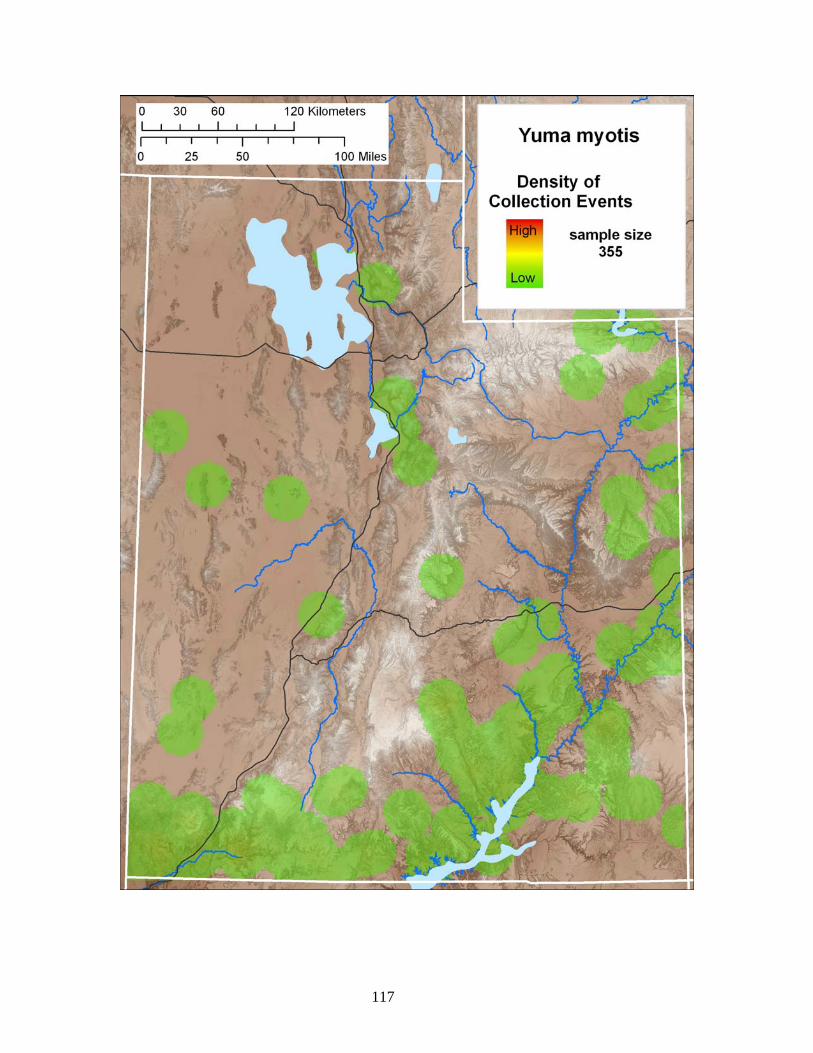
117

118
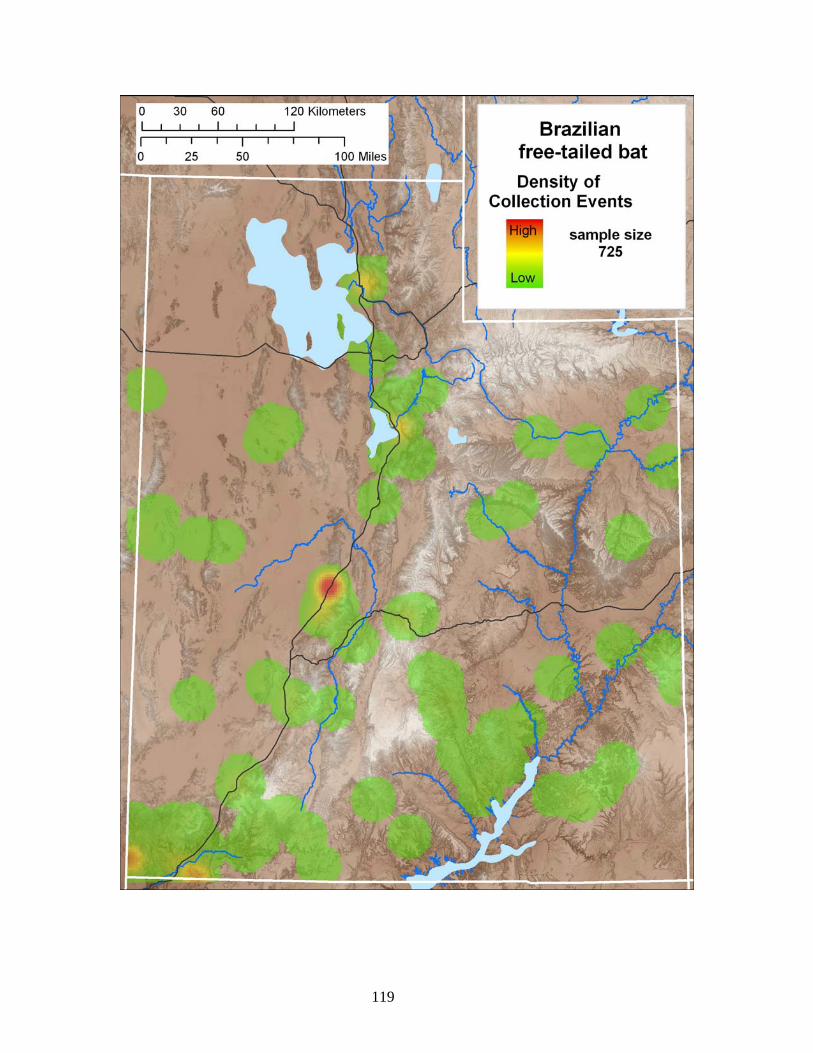
119