department of environmental quality water quality...
TRANSCRIPT
DEPARTMENT OF ENVIRONMENTAL QUALITY WATER QUALITY DIVISION
MONTANA POLLUTANT DISCHARGE ELIMINATION SYSTEM (MPDES)
Fact Sheet
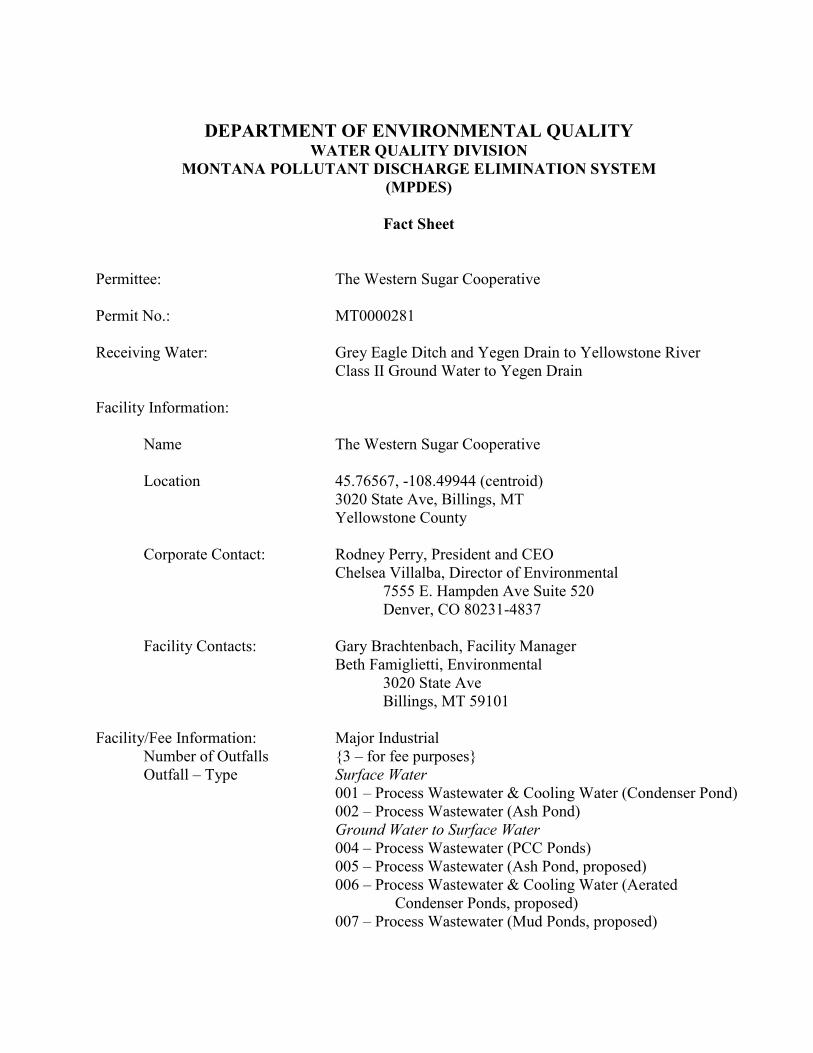
Permittee: The Western Sugar Cooperative Permit No.: MT0000281 Receiving Water: Grey Eagle Ditch and Yegen Drain to Yellowstone River Class II Ground Water to Yegen Drain Facility Information:
Name The Western Sugar Cooperative Location 45.76567, -108.49944 (centroid)
3020 State Ave, Billings, MT Yellowstone County
Corporate Contact: Rodney Perry, President and CEO
Chelsea Villalba, Director of Environmental 7555 E. Hampden Ave Suite 520
Denver, CO 80231-4837
Facility Contacts: Gary Brachtenbach, Facility Manager Beth Famiglietti, Environmental 3020 State Ave
Billings, MT 59101 Facility/Fee Information: Major Industrial
Number of Outfalls {3 – for fee purposes} Outfall – Type Surface Water
001 – Process Wastewater & Cooling Water (Condenser Pond) 002 – Process Wastewater (Ash Pond) Ground Water to Surface Water
004 – Process Wastewater (PCC Ponds) 005 – Process Wastewater (Ash Pond, proposed) 006 – Process Wastewater & Cooling Water (Aerated
Condenser Ponds, proposed) 007 – Process Wastewater (Mud Ponds, proposed)

Fact Sheet Permit No. MT0000281 July 2019 Page 2 of 48
I. Permit Status
A. Permitting History This is an MPDES permit renewal for The Western Sugar Cooperative (WSC) sugar beet processing factory located in Billings. The existing permit became effective December 1, 2009, and expired November 30, 2014 (2009-issued permit). The permit was modified on December 8, 2009 (minor modification to correct typographical errors) and July 2, 2014 (major modification to designate a new monitoring location for Outfall 002).
Renewal application forms (DEQ 1 and EPA 2C), supplemental material, and $5,000 of the $15,000 fee payment were received by DEQ on May 21, 2014. The remaining $10,000 fee was transferred from fees previously collected. The renewal application materials and forms were determined by the Department of Environmental Quality (DEQ) to be complete on July 7, 2014, and the current permit was administratively extended. Subsequently, updated and clarifying information (both written and verbal) was provided by WSC to DEQ between July 2018 and July_2019.
Previous Discharge Permits: • 1974 – first MPDES permit issued.
• 1981 – MPDES permit renewal issued. o 1987 – Montana Ground Water Pollution Control System (MGWPCS) permit
initially issued to WSC for its discharges to ground water through spray irrigation (MTX000033).
• 1991 – MPDES permit renewal issued. o 1992 – MGWPCS permit MTX000033 renewal issued (modified in 1994 and 1995).
• 1998 – MPDES permit renewal issued; ground water discharges were incorporated as Outfall 004. The individual MGWPCS permit MTX000033 was terminated.
• 2009 –MPDES permit renewal issued (subsequent minor modification to correct typos).
• 2014 – major permit modification to remove four ground water monitoring wells as monitoring points and designate a new monitoring location for Outfall 002 at the ash pond return water inlet.
B. Proposed Changes There are several permit changes proposed with this MPDES permit renewal:
1. Since 1998, the MPDES permit included discharge to ground water from four types of wastewater treatment ponds that were collectively permitted as Outfall 004. With this permit, DEQ is proposing to separate Outfall 004 into four distinct outfalls:
• Outfall 004 - Precipitated Calcium Carbonate (PCC) ponds (decanted mud pond wastewater pumped to historic PCC ponds for infiltration has been the only point source discharge in this location since PCC filter presses fully operational)
• Outfall 005 - Ash Pond

Fact Sheet Permit No. MT0000281 July 2019 Page 3 of 48
• Outfall 006 - Aerated Condenser Ponds • Outfall 007 - Aerated and Non-aerated Mud Ponds and Mud Finger Ponds
2. Compliance with facility-wide load-based 5-Day Biochemical Oxygen Demand (BOD5) and Total Suspended Solids (TSS) Technology-based Effluent Limits (TBELs) will be based on the sum of the loads from all outfalls, including discharge to ground water from the four wastewater ponds.
3. The collective facility-wide ground water mixing zone is removed. DEQ regulates ground water discharge from a wastewater infiltration area as an individual point source; review of potential impacts, limits, and compliance monitoring for the WSC wastewater pond discharges to ground water need to be applied at each of the four pond areas individually. Monitoring will be required at either each pond or in representative samples of each ponds’ discharge water (i.e. return pipes, sumps, etc.).
4. DEQ has proposed new effluent limits for ammonia, seasonal nutrients (total nitrogen and total phosphorus), and ground water specific conductance effective {58 months from the effective date of the permit}. WSC will be subject to a compliance schedule for addressing these limits.
5. Overall compliance monitoring frequency has decreased.
C. Other DEQ Program Permits
WSC also maintains the following other DEQ permits: 1. Storm Water Authorization #MTR000103 under the Multi-Sector General Permit for
Storm Water Discharges Associated with Industrial Activity. 2. Air Pollution Facility #OP2912-07 - major facility. 3. Class III Landfill #530 - annual license for processing more than 1,000 tons of
byproducts annually: 3,791 tons/year coal bottom ash; 22,336 tons/year of beet flume solids; and 43,489 tons/year of PCC filtered waste. DEQ finds WSC is not subject to the Coal Combustion Residual (CCR) Rule because the facility is not an electric utility or independent power producer.

Fact Sheet Permit No. MT0000281 July 2019 Page 4 of 48
II. Facility Information
A. Facility Description The WSC-Billings facility has been operating at this location since the early 1900’s. The facility occupies approximately 160 acres in Billings (Figures 1 and 2). As a result of the facility’s longevity, there are extremely complex water and wastewater handling challenges, complicated by residential and industrial encroachment on the facility.
WSC is classified under Standard Industrial Classification Code 2063 beet sugar, and produces granulated sugar, molasses, beet pulp, and byproducts including limestone byproducts of precipitated calcium carbonate (PCC) and slacked lime. Sugar beets are processed seasonally, approximately from September through February/March; these times are referred to as “campaigns.” WSC has a maximum slicing rate of 5,600 tons of beets/day (11.2 million pounds / day (MM lbs/day)). The facility produced 1.67 MM lb/day sugar (maximum monthly average) between the 2014 and 2018, as well as molasses and beet pulp pellet byproducts.
Process and Water Handling Description: The following summarizes the process and water handling for the WSC beet process (Figure 3).
• Transport and cleaning of beets. The beet flume water transports the beets from receipt through the cleaning process. Incidental amounts of chlorine may enter the flume water from floor sanitation. The dirty beet flume water is directed to a large clarifier which separates the solids from the water, which is handled as follows: o Clarifier underflow. Solids collected from the bottom of the clarifier are pumped to the
south side of the mud finger ponds. The decanted mud wastewater from the mud finger ponds is directed through the northern mud ditches before either: - collecting in the sump and being pumped to the mud aerated pond for treatment
followed by either returning to the clarifier for re-use or to the non-aerated pond for infiltration/ evaporation; or
- being pumped from the mud ditch to one of two or three areas on the south side of the PCC piles for infiltration. Pumping to the PCC pile area occurs when the aerated mud pond is at maximum capacity, which is estimated to be periodically on approximately 180 days per year.
o Clarifier overflow. The decanted clarifier water is returned for use in the beet flume. There is no discharge.
• Beet slicing. No discharge; this step slices the beets into thin strips (cossettes) in preparation for juice extraction.
• Diffusion. The cossettes are conveyed to a large mixing tank. Hot juice is introduced to the tank, and then the heated cossettes are pumped to a tower diffuser. Both fresh water and heated juice are introduced to the tower diffuser in a countercurrent flow opposite of the cossettes flow to extract the juice from the cossettes. About 150 gallons per day (gpd) of ammonium bisulfate is added to the tower as a biocide. The beet juice extracted from the cossets in the diffuser is the raw juice, composed primarily of water, sugar, and various non-

Fact Sheet Permit No. MT0000281 July 2019 Page 5 of 48
sugars present in the beets, primarily organic acids and mineral salts. The raw juice will ultimately be processed into granulated sugar.
• Pressing and Drying. The fiber part of the beet (the pulp) remaining after juice extraction is removed from the tower diffuser and conveyed to presses, where much of the remaining juice and water in the pulp is extracted and returned to the tower. The pressed pulp is either sold as is for livestock feed, or conveyed to dryers where it is dried and formed into pellets and solid commercially as livestock feed. The dryers have wet scrubbers on the exhaust stacks to remove fine particulates generated in the drying process. The water used to scrub the dryer exhaust is piped to the clarifier for re-use. There is no wastewater discharge from the cossette mixer, tower diffuser, pulp presses, or pulp dryers.
• Purification – Liming. Limerock (calcium carbonate, CaCO3) is burned in the lime kiln, producing calcium oxide (CaO), and carbon dioxide gas (CO2). o The CaO is dissolved in sweetwater (water containing a small percentage of dissolved
sugar). The resulting liquid, calcium hydroxide (CaOH), also known as “milk of lime,” is added to the raw juice extracted from the cossettes, forming a limed beet juice slurry. The lime coagulates the removable non-sugars in solution in the raw juice.
o The CO2 gas from the lime kiln is bubbled through the limed beet juice slurry after first being passed through a wet scrubber to remove particulates from the gas. Yellowstone River water is used in the scrubber. After use, the wastewater from the scrubber is reused in the process when possible; the excess returns to the cooling tower (with bleed-off to Outfall 001). No treatment chemicals are added to the cooling tower.
A chemical reaction between the CaOH in the juice and the CO2 gas forms a precipitate of CaCO3 in the juice, which settles out as a sludge waste material. The sludge is made up of the precipitated calcium carbonate (PCC) and the removable non-sugars in the juice that adhere to the CaCO3 as it precipitates. The settled CaCO3 sludge is separated from the juice, washed to remove any remaining juice, and filtered to separate the CaCO3 solids and adhering non-sugars from any remaining juice in the sludge. Rotary vacuum filters had historically been used to separate the PCC solids from the thin juice. The PCC removed by these filters was slurried with water and pumped into ponds on top of the PCC pile. After the PCC pile collapse in 2011, WSC installed two filter presses; since that time WSC has filtered the PCC sludge. The PCC from the filter presses is around 35% - 40% moisture, allowing for dry handling of the material. It is trucked to the top of the PCC pile for storage. Over half (25,312 tons) of the 2018 PCC production was trucked to western Montana and beneficially used for soil remediation in mining. A smaller amount is used by area farmers as a soil amendment on their fields. The filtrate separated from the PCC sludge is returned from the PCC presses to the thin juice clarifier.
The purified ‘thin juice’ resulting from the purification step is treated with ammonium bisulfate to inhibit oxidization of the thin juice sucrose and then processed into sugar in the following steps.
• Evaporators. After purification, the juice is heated, filtered, and pumped through a series of evaporators. In the evaporators, steam is used to boil water from the juice, concentrating the sugar content in the remaining juice. The last two evaporators are under vacuum generated

Fact Sheet Permit No. MT0000281 July 2019 Page 6 of 48
by a barometric condenser. The vacuum allows the juice in the final evaporators to be boiled at lower temperatures, thus avoiding burning the sugar in the thickened juice.
Yellowstone River water is used in the barometric condenser to cool the hot water vapors from the evaporators and thus generate the vacuum. The barometric condenser water is pumped to the cooling tower (with bleed-off to Outfall 001). Ammonia generated from the ammonium bisulfite added to the juice prior to the evaporators, or generated from nitrogen compounds in the beet juice, may be dissolved in the water going through the barometric condenser and to the cooling tower.
Crystalized sugar remains in the pans for the final processing steps.
• Boilers: Three large coal-fired boilers (148 MM BTU/hr each) generate steam to drive the turbine generator and for use in the evaporators. Phosphate may be added to the water in the boilers to help prevent scaling of the boiler tubes, thus maintaining good boiler operations. There are two sources of wastewater from the boiler systems:
o The boiler’s air emission (gas) scrubbers use Yellowstone River water and the scrubber wastewater is discharged to the ash pond.
o Coal ash is removed from the boiler by a traveling grate and falls into the ash flume that uses Yellowstone River water to transport the ash to the ash pond.
Historically, most of the ash pond wastewater (~75%) was discharged through Outfall 002 although some (~25%) was routed to the aeration treatment system and discharged through Outfall 001. As of September 2018, WSC began to recycle water from the Ash Pond to reduce Yellowstone River intake and eliminate discharge through Outfall 002.
• Crystallizer/Centrifuge, Drier/Granulation. The final steps to produce dry sugar do not entail any wastewater handling other than the reuse of the crystallizer cooling wastewater.
Based on the current renewal application, the permittee has recently used approximately 3.35 million gallons per day (mgd) water from the Yellowstone River for its factory processes and 0.05 mgd City Water for various uses (laboratory, turbine cooling, PCC filter, and the pulp drier gas scrubber). In addition, beets are comprised of 75% water -- the facility generates approximately 0.92 mgd of wastewater from beet processing.
Wastewater Handling Description: All of the raw water (a total of ~ 4.3 mgd) is either evaporated or is discharged through the following permitted outfalls:
Surface Water Discharges
(1) Outfall 001 -- an intermittent, controlled discharge (~ 5 days/week during production) of treated aeration pond wastewater discharged to the Yegen Drain. Prior to discharge, this wastewater is treated by two lagoon cells that have minimal mechanical aeration. The lagoon cells have three days of retention time and were calculated to remove 9,053 lb/day of BOD5 (2014 Application). This is approximately 14% of the expected amount of BOD5 generated by WSC.
Outfall 001 has two main sources of wastewater:

Fact Sheet Permit No. MT0000281 July 2019 Page 7 of 48
• Bleed-off from the cooling tower system, which goes to aeration condenser pond #1, then condenser pond #2, then is discharged. Specific sources contributing to this discharge are:
o Barometric condenser water/surge tank (primary flow); o Barometric condenser seal tank discharge; o Evaporators and pans (evaporator and crystallizer steps); o Compressor cooling waters, pump cooling and gland waters (minor amounts); and o Lime kiln particulate scrubber wastewater.
• Boiler ash pond discharge (historically 25% of the total ash pond discharge). Outfall 001 discharge samples are taken by an automatic sampler and flow is monitored using a sonar flow meter on a Parshall Flume in a shed near the outfall. The discharge flow rate is recorded daily for each day with discharge.
(2) Outfall 002 -- this outfall historically discharged continuously during the campaign to the city storm drain (Grey Eagle Ditch) and east into the Yegen Drain. During the period of record (POR) (September 2014 – March 2018), the only source of wastewater to Outfall 002 was the ash pond, which receives the boiler ash flume and the boiler scrubber wastewater.
Effluent samples for Outfall 002 are taken in a shed; BOD5 and TSS are taken by an automatic sampler, fecal coliform is taken via grab, temperature and pH are monitored and recorded, and flow is monitored using a sonar flow meter and weir. The discharge flow rate is recorded daily.
In September 2018, WSC began to recycle the ash pond water to reduce or eliminate discharge through Outfall 002. However, DEQ is proposing to develop any necessary effluent limits assuming that WSC may discharge through this outfall.
Ground Water Discharges
WSC discharges to ground water from wastewater ponds as well as from the historic and current placement of byproduct and wastes on the site that are not regulated under MPDES, such as the PCC pile and coal ash pile. WSC’s discharge to site ground water is of concern due to the proximity of potential individual water supply wells.
The site ground water flows northeasterly toward the Grey Eagle Ditch and the Yegen Drain (Figures 4A- 4D). In 1991, LSE reported that “Ultimately, all the natural alluvial aquifer water is discharged to the Yellowstone River or one of its tributary streams.”
The 1998-issued permit incorporated the discharge to ground water from four sources (the PCC ponds, ash pond, aerated condenser ponds, and mud ponds) as Outfall 004. This was maintained with the 2009-issued permit. With this permit renewal, DEQ is proposing to separate the “facility-wide” Outfall 004 into four distinct outfalls in recognition of the four unique point source discharges:
(1) Outfall 004 - PCC Ponds: The PCC ponds were historically the primary source of infiltration at WSC. Based on the information provided in the 2014 application, the PCC pond areas were estimated to infiltrate approximately 0.15 mgd. Although WSC installed PCC filter presses and the PCC sludge has
Fact Sheet Permit No. MT0000281 July 2019 Page 8 of 48
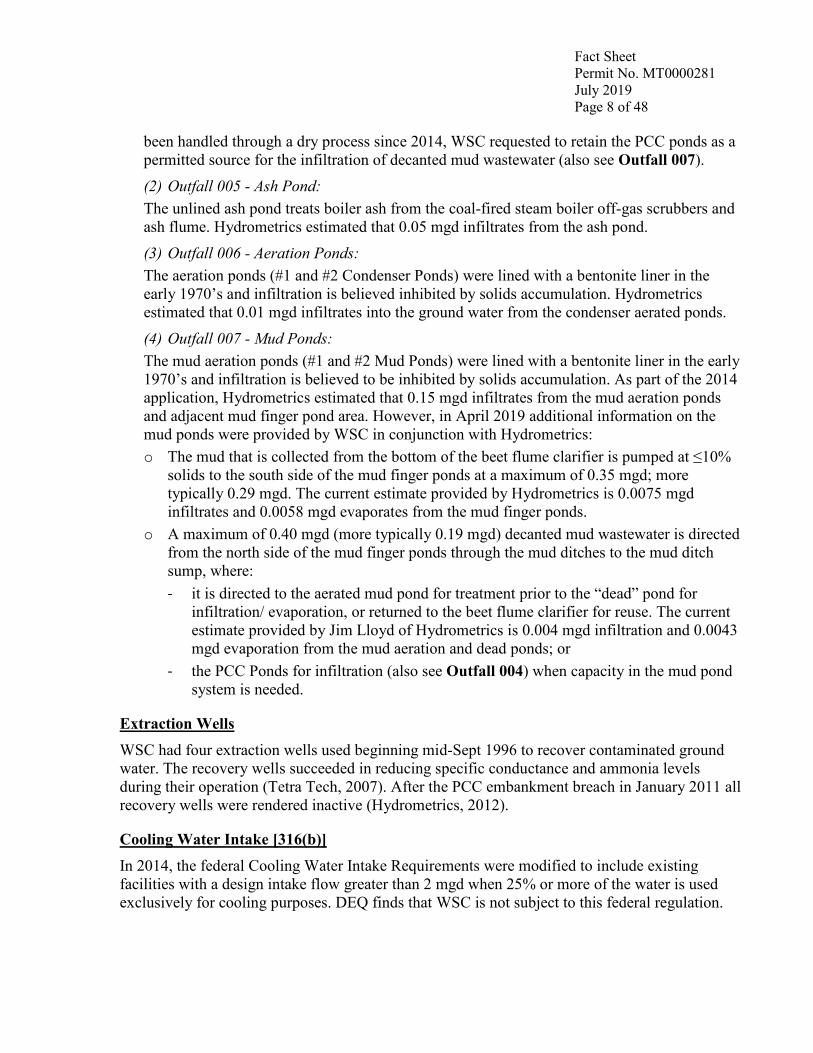
been handled through a dry process since 2014, WSC requested to retain the PCC ponds as a permitted source for the infiltration of decanted mud wastewater (also see Outfall 007).
(2) Outfall 005 - Ash Pond: The unlined ash pond treats boiler ash from the coal-fired steam boiler off-gas scrubbers and ash flume. Hydrometrics estimated that 0.05 mgd infiltrates from the ash pond.
(3) Outfall 006 - Aeration Ponds: The aeration ponds (#1 and #2 Condenser Ponds) were lined with a bentonite liner in the early 1970’s and infiltration is believed inhibited by solids accumulation. Hydrometrics estimated that 0.01 mgd infiltrates into the ground water from the condenser aerated ponds.
(4) Outfall 007 - Mud Ponds: The mud aeration ponds (#1 and #2 Mud Ponds) were lined with a bentonite liner in the early 1970’s and infiltration is believed to be inhibited by solids accumulation. As part of the 2014 application, Hydrometrics estimated that 0.15 mgd infiltrates from the mud aeration ponds and adjacent mud finger pond area. However, in April 2019 additional information on the mud ponds were provided by WSC in conjunction with Hydrometrics: o The mud that is collected from the bottom of the beet flume clarifier is pumped at ≤10%
solids to the south side of the mud finger ponds at a maximum of 0.35 mgd; more typically 0.29 mgd. The current estimate provided by Hydrometrics is 0.0075 mgd infiltrates and 0.0058 mgd evaporates from the mud finger ponds.
o A maximum of 0.40 mgd (more typically 0.19 mgd) decanted mud wastewater is directed from the north side of the mud finger ponds through the mud ditches to the mud ditch sump, where: - it is directed to the aerated mud pond for treatment prior to the “dead” pond for
infiltration/ evaporation, or returned to the beet flume clarifier for reuse. The current estimate provided by Jim Lloyd of Hydrometrics is 0.004 mgd infiltration and 0.0043 mgd evaporation from the mud aeration and dead ponds; or
- the PCC Ponds for infiltration (also see Outfall 004) when capacity in the mud pond system is needed.
Extraction Wells WSC had four extraction wells used beginning mid-Sept 1996 to recover contaminated ground water. The recovery wells succeeded in reducing specific conductance and ammonia levels during their operation (Tetra Tech, 2007). After the PCC embankment breach in January 2011 all recovery wells were rendered inactive (Hydrometrics, 2012).
Cooling Water Intake [316(b)] In 2014, the federal Cooling Water Intake Requirements were modified to include existing facilities with a design intake flow greater than 2 mgd when 25% or more of the water is used exclusively for cooling purposes. DEQ finds that WSC is not subject to this federal regulation.

Fact Sheet Permit No. MT0000281 July 2019 Page 9 of 48
B. Effluent Characteristics Outfall 001 Table 1 is a summary of self-reported effluent quality from discharge monitoring reports (DMR) submitted by the permittee for Outfall 001. The POR is September 1, 2014 through August 31, 2018 (four campaigns).
Table 1: Outfall 001 DMR Effluent Characteristics September 1, 2014 – August 31, 2018
Parameter Units 2009-issued Permit Limit
Minimum Value
Maximum Value
Average Value
Number of
Samples (1) Flow, Daily Average mgd (2) 1.0 3.4 1.6 26 5-Day Biochemical Oxygen Demand (BOD5) mg/L 45 / 30 (3) 21 / 16 735 / 582 291 / 190 26
Total Suspended Solids (TSS) mg/L (2,3) 22 / 13 250 / 68 59 / 30 26 lb/day 3,960 / 2,640 (3) 145 / 100 2,524 / 725 840 / 395 26
pH s.u. 6.0-9.0 6.0 8.2 -- 26 Temperature ºF 77 (4) 30 72 47 26
Total Residual Chlorine mg/L 0.019 / 0.011 (3) ND 0.012 / 0.005
0.001 / 0.0004 26
Fecal Coliform Bacteria MPN/100 mL 400 9 5,500 527 26 E. coli Bacteria – summer (5) cfu/100 mL 126 (5) 20 1975 759 7 Total Ammonia as N mg/L 7.08 / 2.80 (3) 19 / 14 64 / 58 36 / 30 26 Nitrate + Nitrite, as N mg/L 10 (4) 0.02 2.0 0.18 26 Total Kjeldahl Nitrogen (TKN) mg/L (2) 18 62 33 26 Total Phosphorus, as P mg/L (2) 0.02 1.3 0.046 26 Oil & Grease Visual Y/N No No No 26 Arsenic, Total Recoverable µg/L (2) 2.0 5.0 3.8 4 Iron, Total Recoverable mg/L (2) 0.34 0.60 0.49 4 Lead, Total Recoverable µg/L (2) 0.4 1.4 0.8 4 Mercury, Total Recoverable µg/L (2) 0.038 0.050 0.044 4 Selenium, Total Recoverable µg/L (2) ND 3.0 ND 4 WET - Acute Pass/Fail (2) All Pass 11
Footnotes: ND = Nondetect (1) Number of Samples is number of months with discharge data. Most sampling is daily or weekly. (2) Monitoring only, no limit. (3) Daily Maximum Value/Monthly Average Value. (4) Maximum daily limit. (5) Non-campaign limit, applies April 1st through October 31st. Geometric mean.
The 2009-issued permit required that “no acute toxicity” be present in the effluent and required quarterly acute Whole Effluent Toxicity (WET) monitoring. WET tests were conducted on alternative test species, Ceriodaphnia dubia and Pimephales promelas (fathead minnow). During the POR, WSC passed all 11 WET tests on Outfall 001.
Fact Sheet Permit No. MT0000281 July 2019 Page 10 of 48
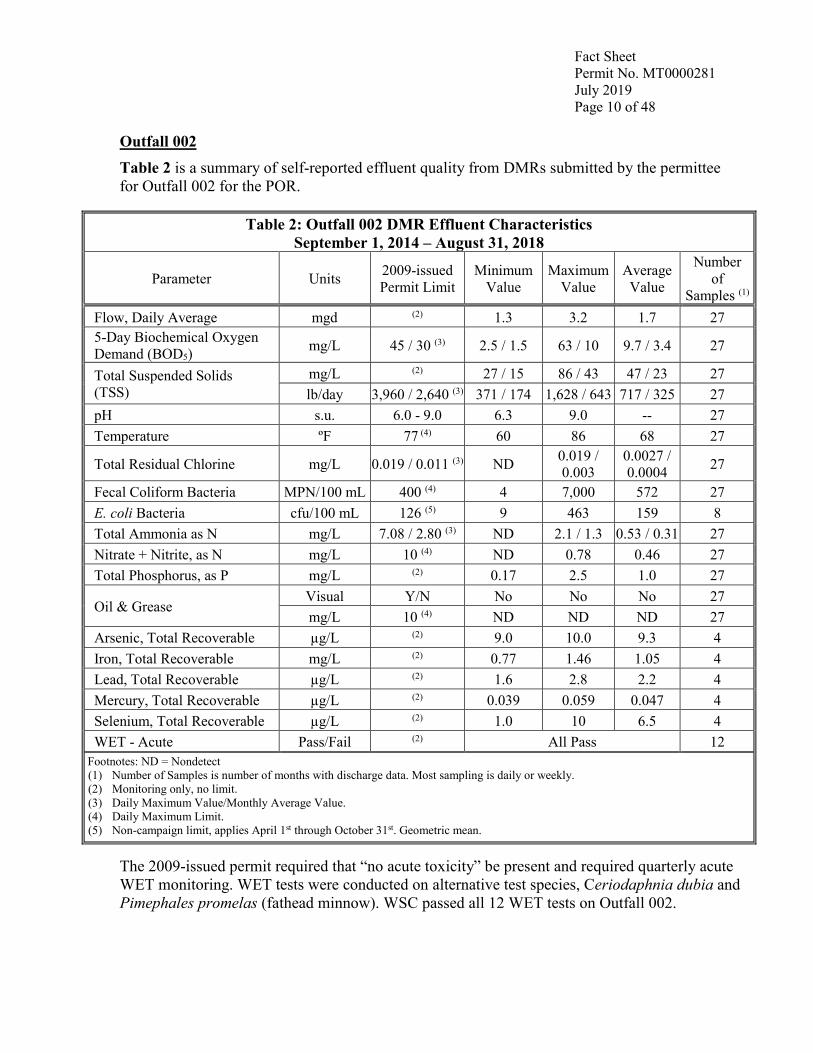
Outfall 002 Table 2 is a summary of self-reported effluent quality from DMRs submitted by the permittee for Outfall 002 for the POR.
Table 2: Outfall 002 DMR Effluent Characteristics September 1, 2014 – August 31, 2018
Parameter Units 2009-issued Permit Limit
Minimum Value
Maximum Value
Average Value
Number of
Samples (1) Flow, Daily Average mgd (2) 1.3 3.2 1.7 27 5-Day Biochemical Oxygen Demand (BOD5) mg/L 45 / 30 (3) 2.5 / 1.5 63 / 10 9.7 / 3.4 27
Total Suspended Solids (TSS)
mg/L (2) 27 / 15 86 / 43 47 / 23 27 lb/day 3,960 / 2,640 (3) 371 / 174 1,628 / 643 717 / 325 27
pH s.u. 6.0 - 9.0 6.3 9.0 -- 27 Temperature ºF 77 (4) 60 86 68 27
Total Residual Chlorine mg/L 0.019 / 0.011 (3) ND 0.019 / 0.003
0.0027 / 0.0004 27
Fecal Coliform Bacteria MPN/100 mL 400 (4) 4 7,000 572 27 E. coli Bacteria cfu/100 mL 126 (5) 9 463 159 8 Total Ammonia as N mg/L 7.08 / 2.80 (3) ND 2.1 / 1.3 0.53 / 0.31 27 Nitrate + Nitrite, as N mg/L 10 (4) ND 0.78 0.46 27 Total Phosphorus, as P mg/L (2) 0.17 2.5 1.0 27
Oil & Grease Visual Y/N No No No 27 mg/L 10 (4) ND ND ND 27
Arsenic, Total Recoverable µg/L (2) 9.0 10.0 9.3 4 Iron, Total Recoverable mg/L (2) 0.77 1.46 1.05 4 Lead, Total Recoverable µg/L (2) 1.6 2.8 2.2 4 Mercury, Total Recoverable µg/L (2) 0.039 0.059 0.047 4 Selenium, Total Recoverable µg/L (2) 1.0 10 6.5 4 WET - Acute Pass/Fail (2) All Pass 12
Footnotes: ND = Nondetect (1) Number of Samples is number of months with discharge data. Most sampling is daily or weekly. (2) Monitoring only, no limit. (3) Daily Maximum Value/Monthly Average Value. (4) Daily Maximum Limit. (5) Non-campaign limit, applies April 1st through October 31st. Geometric mean.
The 2009-issued permit required that “no acute toxicity” be present and required quarterly acute WET monitoring. WET tests were conducted on alternative test species, Ceriodaphnia dubia and Pimephales promelas (fathead minnow). WSC passed all 12 WET tests on Outfall 002.

Fact Sheet Permit No. MT0000281 July 2019 Page 11 of 48
Outfall 004 – The current compliance monitoring location for Outfall 004 in the 2009-issued permit is monitoring well MW-9, located on the northern boundary with State Avenue at ~ 45.76968, -108.4987. Table 3 presents a summary of self-reported DMR data.
Table 3: Outfall 004 DMR Effluent Characteristics (MW-9) September 1, 2014 through June 30, 2018
Parameter Units 2009-Issued Permit Limits
Minimum Value
Maximum Value
Average Value
No. of Samples (1)
Static water level Feet (2) 3.8 10.7 6.4 23
Water temperature °C (2) 4.2 16 10.4 23 °F 40 61 51 pH s.u. (2) 6.1 7.3 -- 23 Specific Conductivity µS/cm (3) 2,500 2,160 4,430 3,750 32 Oxidation-Reduction Potential mV (2) -308 -140 -223 23 Total Ammonia as N mg/L 35 25 45 36 31 Total Kjeldahl Nitrogen mg/L (2) 32 50 39 15 Iron, Dissolved mg/L (2) 9.5 14.7 11.6 15 Footnotes:
(1) Number of samples are number of months with monitoring results. (2) No effluent limit in previous permit, monitoring requirement only. (3) Units for permit limits and monitoring are µS/cm, which are equivalent to umho/cm.
In addition, the following are active monitoring wells at WSC (Figure 2).
Ambient Ground water (Note: PCC pile & historic land disposal practices may influence the “ambient” ground water monitoring wells; therefore DEQ cannot ascertain whether they are representative of ambient conditions): • MW-2: upgradient – SW corner of property (45.76278, -108.50275). • MW-3: upgradient – SE corner of property at southern boundary of historic land-application
field (45.762745, -108.496416).
Downgradient Ground water • MW-4: located east of southeastern aerated pond near Sugar Ave. and northeast of the
previous land application field (45.76471, -108.49487). • MW-5: located E/NE part of property (45.76788, -108.49516). It is unclear which point
source(s) may influence the ground water quality at this location; in addition, MW-5 is located immediately downgradient from the ash storage pile which is not covered as an MPDES point source discharge.
• MW-6: located NE corner of property at Sugar & State Ave (45.76950, -108.49493). • MW-8: located north-central part of property, in railyard area (45.76863, -108.50013). • MW-9 (see Outfall 004, above). • MW-12: located west-central part of property, in middle of lime pile (45.76638, -108.50116). • OBS-1: located north-central part of property immediately northeast of lime pile, south of
MW-8 (45.76770, -108.50051). Tables 4 & 5 summarize the ground water monitoring results for 2014 – 2018:

Fact Sheet Permit No. MT0000281 July 2019 Page 12 of 48
Table 4: Monitoring Wells MW-2 through MW-6, MW-8, MW-12, and OBS-1 September 1, 2014 through September 30, 2018 (17 monitoring dates)
Parameter Units MW-2 (upgradient)
MW-3 (upgradient) MW-4 MW-5 MW-6 MW-8 MW-12A OBS-1
Static water level Feet Minimum 3.6 4.7 2.2 6.8 6.3 8.2 36.6 8.9 Maximum 6.6 8.0 5.0 8.8 7.2 10.6 44.8 13.8
Average 5.6 6.1 3.8 7.8 6.8 9.2 41.7 12.5
Water temperature ° C Minimum 4.9 4.0 3.2 7.2 5.7 4.5 7.1 5.6 Maximum 14.4 12.9 18.4 25.4 22.1 20.7 27.8 19.7
Average 11.2 10.6 9.5 15.8 12.7 12.5 12.8 12.4
pH s.u. Minimum 6.8 6.6 6.6 6.6 6.7 6.5 6.4 6.5 Maximum 7.6 7.9 7.9 8.1 8.2 8.0 8.1 7.9
Average 7.2 7.2 7.1 7.0 7.2 7.0 7.0 7.0
Specific Conductivity µS/cm Minimum 892 1,177 1,700 814 993 3,190 2,730 3,000 Maximum 1,631 1,951 4,290 1,854 1,710 6,850 7,170 6,690
Average 1,277 1,642 2,629 1,269 1,296 4,455 4,482 4,369
Oxidation-Reduction Potential mV
Minimum -402 -286 -429 -447 -400 -289 -281 -287 Maximum -73 122 -75 -70 -106 -139 -130 -101
Average -202 -83.5 -218 -194 -217 -225 -195 -221
Total Ammonia as N mg/L Minimum 0.05 0.01 0.05 5.2 12.1 50 9.2 34.7 Maximum 9.8 0.15 0.35 17.4 17.5 77 110 75.9
Average 1.8 0.05 0.23 10.3 14.0 67.3 69.0 60.7
Total Kjeldahl Nitrogen mg/L
Minimum 0.05 0.01 0.6 5.6 12.5 60.8 69.2 54.0 Maximum 11.2 0.60 1.4 26.8 19.6 147 121 81.6
Average 2.7 0.34 1.0 12.0 15.0 80.3 86.7 66.8
Iron, Dissolved mg/L Minimum 0.08 0.01 0.08 1.1 0.6 19.5 0.3 10.6 Maximum 0.78 0.15 9.7 8.3 4.2 28.3 25.4 30.1
Average 0.20 0.03 6.1 3.9 2.5 24.2 5.7 23.6
Fact Sheet Permit No. MT0000281 July 2019 Page 13 of 48
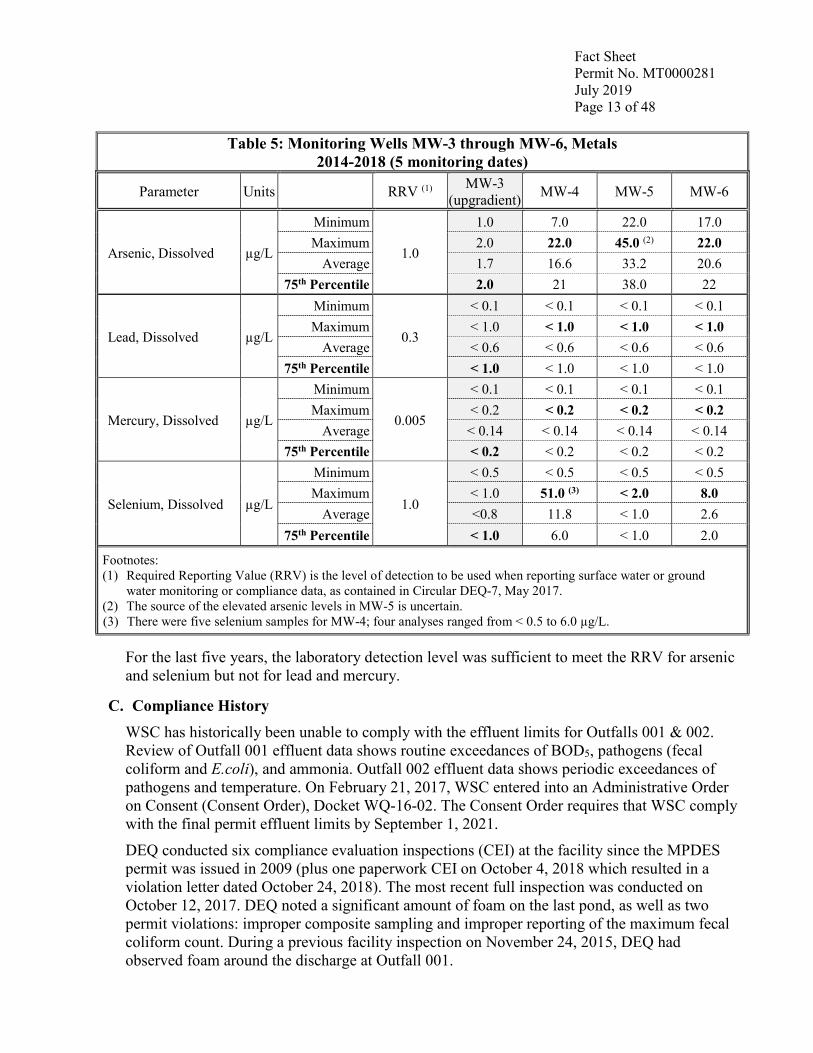
Table 5: Monitoring Wells MW-3 through MW-6, Metals 2014-2018 (5 monitoring dates)
Parameter Units RRV (1) MW-3 (upgradient) MW-4 MW-5 MW-6
Arsenic, Dissolved µg/L
Minimum
1.0
1.0 7.0 22.0 17.0 Maximum 2.0 22.0 45.0 (2) 22.0
Average 1.7 16.6 33.2 20.6 75th Percentile 2.0 21 38.0 22
Lead, Dissolved µg/L
Minimum
0.3
< 0.1 < 0.1 < 0.1 < 0.1 Maximum < 1.0 < 1.0 < 1.0 < 1.0
Average < 0.6 < 0.6 < 0.6 < 0.6 75th Percentile < 1.0 < 1.0 < 1.0 < 1.0
Mercury, Dissolved µg/L
Minimum
0.005
< 0.1 < 0.1 < 0.1 < 0.1 Maximum < 0.2 < 0.2 < 0.2 < 0.2
Average < 0.14 < 0.14 < 0.14 < 0.14 75th Percentile < 0.2 < 0.2 < 0.2 < 0.2
Selenium, Dissolved µg/L
Minimum
1.0
< 0.5 < 0.5 < 0.5 < 0.5 Maximum < 1.0 51.0 (3) < 2.0 8.0
Average <0.8 11.8 < 1.0 2.6 75th Percentile < 1.0 6.0 < 1.0 2.0
Footnotes: (1) Required Reporting Value (RRV) is the level of detection to be used when reporting surface water or ground
water monitoring or compliance data, as contained in Circular DEQ-7, May 2017. (2) The source of the elevated arsenic levels in MW-5 is uncertain. (3) There were five selenium samples for MW-4; four analyses ranged from < 0.5 to 6.0 µg/L.
For the last five years, the laboratory detection level was sufficient to meet the RRV for arsenic and selenium but not for lead and mercury.
C. Compliance History WSC has historically been unable to comply with the effluent limits for Outfalls 001 & 002. Review of Outfall 001 effluent data shows routine exceedances of BOD5, pathogens (fecal coliform and E.coli), and ammonia. Outfall 002 effluent data shows periodic exceedances of pathogens and temperature. On February 21, 2017, WSC entered into an Administrative Order on Consent (Consent Order), Docket WQ-16-02. The Consent Order requires that WSC comply with the final permit effluent limits by September 1, 2021.
DEQ conducted six compliance evaluation inspections (CEI) at the facility since the MPDES permit was issued in 2009 (plus one paperwork CEI on October 4, 2018 which resulted in a violation letter dated October 24, 2018). The most recent full inspection was conducted on October 12, 2017. DEQ noted a significant amount of foam on the last pond, as well as two permit violations: improper composite sampling and improper reporting of the maximum fecal coliform count. During a previous facility inspection on November 24, 2015, DEQ had observed foam around the discharge at Outfall 001.

Fact Sheet Permit No. MT0000281 July 2019 Page 14 of 48
III. Technology-Based Effluent Limits
A. Applicability Technology-based effluent limits (TBELs) represent the minimum level of control required for a surface water discharge. TBELs may be imposed through: application of EPA-promulgated effluent limitations guidelines (ELGs) for dischargers by category or subcategory; on a case-by-case basis using Best Professional Judgement (BPJ) to the extent that EPA-promulgated ELGs are inapplicable; or through a combination of these methods. Where promulgated ELGs only apply to certain aspects of the discharger's operation, or to certain pollutants, other aspects or activities are subject to regulation on a case-by-case basis.
National ELGs for sugar processing subcategory were promulgated on January 31, 1974 and are given in 40 CFR 409. The EPA development document was the Beet Sugar Processing, Subcategory of the Sugar Processing Point Source Category, January 1974, EPA-440/1-74-002-b.
40 CFR 409 Subpart A defines the federal ELG for Beet Sugar Processing. This subpart is “applicable to discharges resulting from any operation attendant to the processing of sugar beets for the production of sugar.” The relevant limits for beet sugar processing are: • Best Practicable Control Technology (BPT): applies to process wastewater discharges of
pollutants when the process wastewater discharge, in whole or in part, is from barometric condensing operations and any other beet sugar processing operations.
• Best Available Technology economically achievable (BAT): Based on 40 CFR 409.13, BAT only applies to facilities that slice less than 2,300 tons of beets per day; therefore, BAT does not apply to WSC since the average beet slicing rate is 5,600 tons per day.
• Best Conventional Pollutant Control Technology (BCT): BCT is the same as BPT. The ELG 40 CFR 409 regulates sugar beet process wastewater defined as including any water which, during manufacturing or processing, comes into direct contact with or results from the production or use of any raw material, intermediate product, finished product, by-product, or waste product [40 CFR 401.11(q)]. There is no exception for MPDES permitted discharges that first go through ground water prior to reaching surface water.
Table 6 summarizes the applicability of the various wastewater sources at WSC to the ELG:

Fact Sheet Permit No. MT0000281 July 2019 Page 15 of 48
Table 6: Summary of ELG-applicability to WSC Discharges (40 CFR 409 Subpart A)
Pollutant Source Treatment Outfall(s)(1) Subject to ELG?
Coal boiler gas (air emissions) scrubber Ash Pond 001, 002 &
005 Yes. All parameters. Coal boiler ash removal
Barometric condenser
Cooling Tower to Aerated Condenser Ponds 001 & 006 Yes. All parameters.
Barometric seal tank Purification/liming - kiln CO2 gas scrubbing Noncontact Cooling Water – compressor and pump (2) Noncontact Cooling Water – turbine (2) Beet flume clarifier to
Mud Ponds. Overage to PCC Ponds.
007 & 004 Yes. All parameters.
Beet flume Footnote: (1) For description of Outfalls see Part II.A of this Fact Sheet. (2) Noncontact cooling water is re-used as process make-up water and becomes a regulated waste stream.
B. TBEL Calculations and Monitoring Requirements TBEL Calculations – BOD5 and TSS The BOD5 and TSS effluent limits in the 40 CFR 409 beet sugar ELG are production-based. DEQ incorporates production-based ELGs into MPDES permits as mass-based limits by using a ‘reasonable measure of actual long-term production,’ which for WSC translates into the maximum of the monthly average sugar production for monthly average and anticipated daily operation rates for daily maximum sugar production.
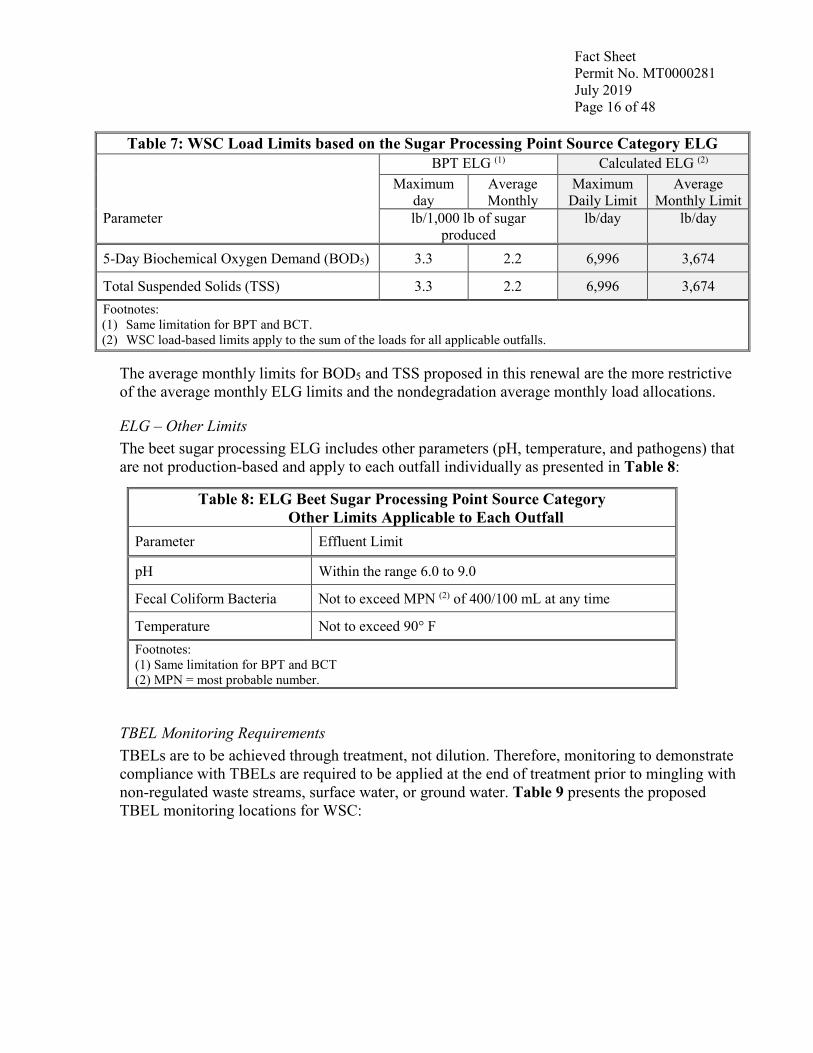
The highest monthly average sugar production rate for the POR (September 2014 – March 2018) was 1.67 MM lbs/day (email from Tina Hansen, WSC 8/27/2018). WSC did not supply actual daily production figures for this POR; therefore, DEQ set the maximum daily sugar production at the maximum expected daily production based on the current equipment capacity of 2.12 MM lb/day (WSC, July 2, 2019). The facility-wide BOD5 and TSS ELG limits were calculated based on these production figures and 3.3 lb/1,000 lb sugar for the Maximum Daily Limit (MDL) factor and 2.2 lb/1000 lb sugar for the Average Monthly Limit (AML) as contained in 40 CFR 409.12(b): • MDL = (2.12 MM lb sugar/day) x 3.3 lb pollutant/1000 lb sugar x 1000 = 6,996 lb/day • AML = (1.67 MM lb sugar/day) x 2.2 lb pollutant/1000 lb sugar x 1000 = 3,674 lb/day WSC must comply with the calculated facility-wide load-based limits (Table 7). Both the BOD5 and TSS load limits apply as the sum of the loads for all outfalls.
Fact Sheet Permit No. MT0000281 July 2019 Page 16 of 48
Table 7: WSC Load Limits based on the Sugar Processing Point Source Category ELG
Parameter
BPT ELG (1) Calculated ELG (2) Maximum
day Average Monthly
Maximum Daily Limit
Average Monthly Limit
lb/1,000 lb of sugar produced
lb/day lb/day
5-Day Biochemical Oxygen Demand (BOD5) 3.3 2.2 6,996 3,674
Total Suspended Solids (TSS) 3.3 2.2 6,996 3,674 Footnotes: (1) Same limitation for BPT and BCT. (2) WSC load-based limits apply to the sum of the loads for all applicable outfalls.
The average monthly limits for BOD5 and TSS proposed in this renewal are the more restrictive of the average monthly ELG limits and the nondegradation average monthly load allocations.
ELG – Other Limits The beet sugar processing ELG includes other parameters (pH, temperature, and pathogens) that are not production-based and apply to each outfall individually as presented in Table 8:
Table 8: ELG Beet Sugar Processing Point Source Category Other Limits Applicable to Each Outfall
Parameter Effluent Limit
pH Within the range 6.0 to 9.0
Fecal Coliform Bacteria Not to exceed MPN (2) of 400/100 mL at any time
Temperature Not to exceed 90° F Footnotes: (1) Same limitation for BPT and BCT (2) MPN = most probable number.
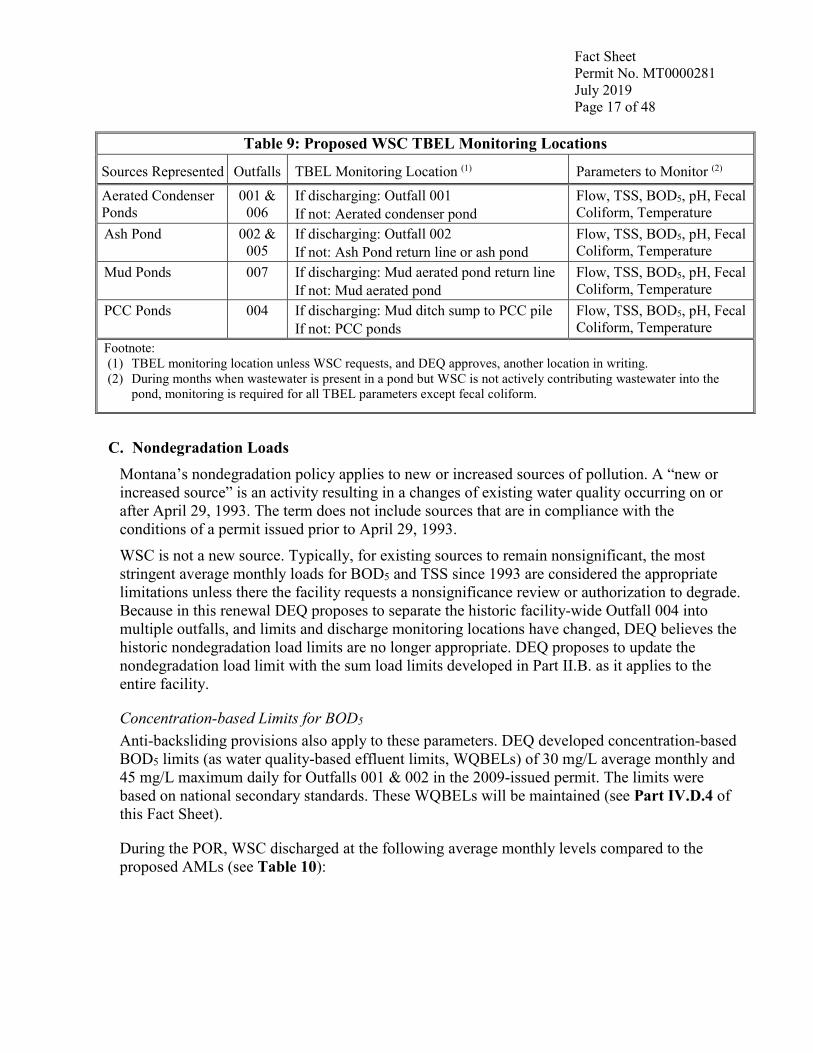
TBEL Monitoring Requirements TBELs are to be achieved through treatment, not dilution. Therefore, monitoring to demonstrate compliance with TBELs are required to be applied at the end of treatment prior to mingling with non-regulated waste streams, surface water, or ground water. Table 9 presents the proposed TBEL monitoring locations for WSC:
Fact Sheet Permit No. MT0000281 July 2019 Page 17 of 48
Table 9: Proposed WSC TBEL Monitoring Locations
Sources Represented Outfalls TBEL Monitoring Location (1) Parameters to Monitor (2) Aerated Condenser Ponds
001 & 006
If discharging: Outfall 001 If not: Aerated condenser pond
Flow, TSS, BOD5, pH, Fecal Coliform, Temperature
Ash Pond 002 & 005
If discharging: Outfall 002 If not: Ash Pond return line or ash pond
Flow, TSS, BOD5, pH, Fecal Coliform, Temperature
Mud Ponds 007 If discharging: Mud aerated pond return line If not: Mud aerated pond
Flow, TSS, BOD5, pH, Fecal Coliform, Temperature
PCC Ponds 004 If discharging: Mud ditch sump to PCC pile If not: PCC ponds
Flow, TSS, BOD5, pH, Fecal Coliform, Temperature
Footnote: (1) TBEL monitoring location unless WSC requests, and DEQ approves, another location in writing. (2) During months when wastewater is present in a pond but WSC is not actively contributing wastewater into the
pond, monitoring is required for all TBEL parameters except fecal coliform.
C. Nondegradation Loads Montana’s nondegradation policy applies to new or increased sources of pollution. A “new or increased source” is an activity resulting in a changes of existing water quality occurring on or after April 29, 1993. The term does not include sources that are in compliance with the conditions of a permit issued prior to April 29, 1993.
WSC is not a new source. Typically, for existing sources to remain nonsignificant, the most stringent average monthly loads for BOD5 and TSS since 1993 are considered the appropriate limitations unless there the facility requests a nonsignificance review or authorization to degrade. Because in this renewal DEQ proposes to separate the historic facility-wide Outfall 004 into multiple outfalls, and limits and discharge monitoring locations have changed, DEQ believes the historic nondegradation load limits are no longer appropriate. DEQ proposes to update the nondegradation load limit with the sum load limits developed in Part II.B. as it applies to the entire facility.
Concentration-based Limits for BOD5 Anti-backsliding provisions also apply to these parameters. DEQ developed concentration-based BOD5 limits (as water quality-based effluent limits, WQBELs) of 30 mg/L average monthly and 45 mg/L maximum daily for Outfalls 001 & 002 in the 2009-issued permit. The limits were based on national secondary standards. These WQBELs will be maintained (see Part IV.D.4 of this Fact Sheet).
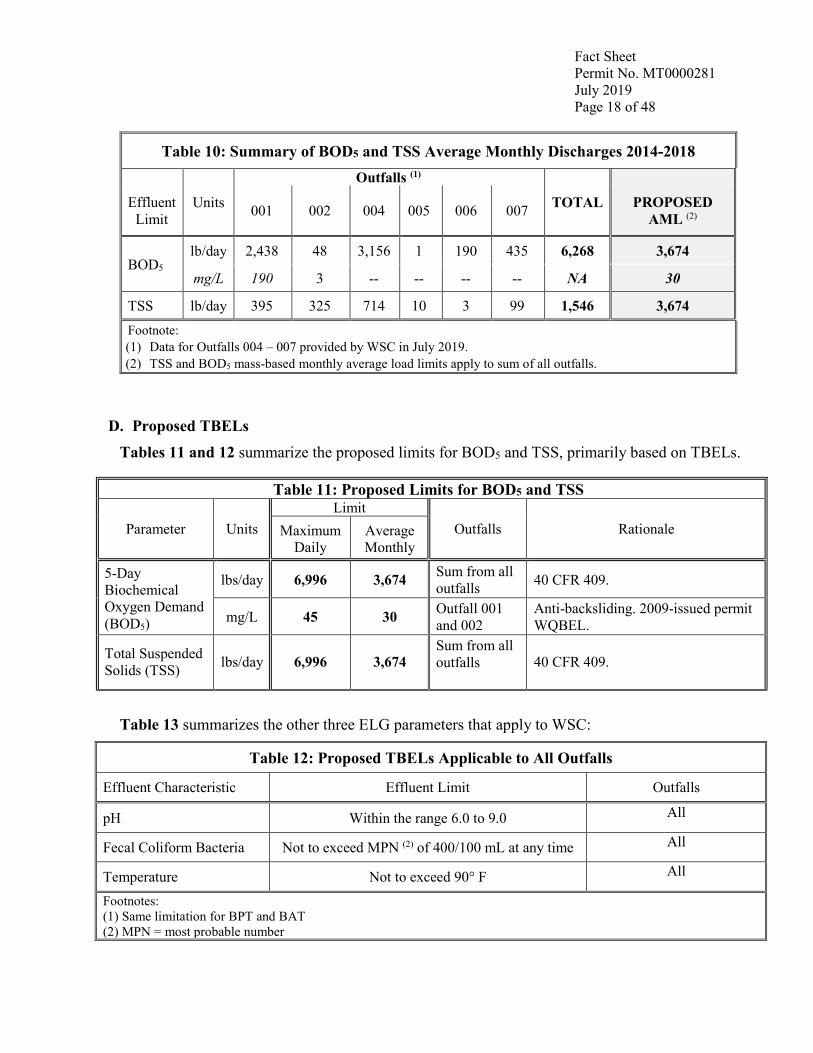
During the POR, WSC discharged at the following average monthly levels compared to the proposed AMLs (see Table 10):
Fact Sheet Permit No. MT0000281 July 2019 Page 18 of 48
Table 10: Summary of BOD5 and TSS Average Monthly Discharges 2014-2018 Outfalls (1)
Effluent Limit
Units 001 002 004 005 006 007 TOTAL PROPOSED AML (2)
BOD5 lb/day 2,438 48 3,156 1 190 435 6,268 3,674
mg/L 190 3 -- -- -- -- NA 30
TSS lb/day 395 325 714 10 3 99 1,546 3,674 Footnote: (1) Data for Outfalls 004 – 007 provided by WSC in July 2019. (2) TSS and BOD5 mass-based monthly average load limits apply to sum of all outfalls.
D. Proposed TBELs Tables 11 and 12 summarize the proposed limits for BOD5 and TSS, primarily based on TBELs.
Table 11: Proposed Limits for BOD5 and TSS
Parameter Units Limit
Outfalls Rationale Maximum Daily
Average Monthly
5-Day Biochemical Oxygen Demand (BOD5)
lbs/day 6,996 3,674 Sum from all outfalls 40 CFR 409.
mg/L 45 30 Outfall 001 and 002
Anti-backsliding. 2009-issued permit WQBEL.
Total Suspended Solids (TSS) lbs/day 6,996 3,674
Sum from all outfalls 40 CFR 409.
Table 13 summarizes the other three ELG parameters that apply to WSC:
Table 12: Proposed TBELs Applicable to All Outfalls
Effluent Characteristic Effluent Limit Outfalls
pH Within the range 6.0 to 9.0 All
Fecal Coliform Bacteria Not to exceed MPN (2) of 400/100 mL at any time All
Temperature Not to exceed 90° F All
Footnotes: (1) Same limitation for BPT and BAT (2) MPN = most probable number

Fact Sheet Permit No. MT0000281 July 2019 Page 19 of 48
IV. Water-Quality-Based Effluent Limits Permits are required to include water quality-based effluent limits (WQBELs) when TBELs are not adequate to protect state water quality standards. No wastes may be discharged that can reasonably be expected to violate any state water quality standards. Montana water quality standards define both water use classifications and their designated beneficial uses as well as numeric and narrative standards that protect those designated uses. Degradation that will impact established beneficial uses will not be allowed.
A. Receiving Water Outfall 001 Outfall 001 discharges treated aeration pond wastewater to the Yegen Drain. The Yegen Drain is the initial receiving waterbody and is a state surface water, ultimately discharging to the Yellowstone River approximately 2.5 miles downstream (immediately upstream of the railroad bridge). The Yegen Drain was built sometime between 1905 and 1915 as part of a complex water delivery system, which includes both irrigation ditches and drainage canals (LSE, 1991).
The Yegen Drain is classified as “C-3.” Waters classified C-3 are to be maintained suitable for bathing, swimming, and recreation, and growth and propagation of non-salmonid fishes and associated aquatic life, waterfowl, and furbearers. The quality of these waters is naturally marginal for drinking, culinary, and food processing purposes and agriculture and industrial water supply.
The Yegen Drain discharge into the Yellowstone River is located within the Upper Yellowstone River – Pompey’s Pillar watershed as identified on USGS Hydrological Unit Code (HUC) 10070007. The drain does not have a Montana stream segment ID, nor has it ever been included on a 303(d) list of impaired streams.
The segment of the Yellowstone River (MT43F001_010) which receives ground water and discharge from the Yegen Drain is listed as impaired for nutrients (algae, benthic macro-invertebrates, dissolved oxygen, eutrophication, and periphyton indicator bioassessments); arsenic; oil & grease; and sediment. A Total Maximum Daily Load (TMDL) has not been written.
Outfall 002 Outfall 002 discharges treated ash pond wastewater to the City of Billings storm water drainage system called Grey Eagle Ditch. Wastewater flows east in a constructed, subsurface drainage way for approximately two city blocks (1,000 feet) where it empties into the Yegen Drain.
The receiving water is classified as “C-3.” Beneficial uses are the same as Outfall 001. The storm water drainage system is not 303(d) listed. The city storm drain is a state surface water and is considered intermittent due to the historic discharge from Outfall 002. Specific numeric water quality standards apply to discharges at Outfall 002 to protect the downgradient water quality of the Yegen Drain and the Yellowstone River.
Ground Water Outfalls 004 - 007 Ground water Outfalls 004 to 007 are the infiltration areas for four wastewater pond areas located on the factory site which were historically grouped together as Outfall 004 (see Part
Fact Sheet Permit No. MT0000281 July 2019 Page 20 of 48
II.A. for a description). Ground water flow at the site is northeasterly. See Figure 4. The site’s ground water is the initial receiving waterbody for these point source discharges, which is projected to reach surface water (the Yegen Drain, Grey Eagle Ditch, or Yellowstone River) and therefore these discharges are included under this MPDES permit (LSE, 1991).
Soils underlying the Billings facility are predominantly Alluvial Land, Wet consisting of loam and gravelly loam with loamy sand (USDA, NRSC, 2014). The Yellowstone River Valley shallow alluvial aquifer underlies the factory site. Ground water is four to eight feet below ground surface and the saturated thickness is 10 to 30 feet thick. Well logs indicate that a shale unit underlies the site at approximately 21 to 30 feet (LSE, 1991).
Montana ground water is classified based on ambient Specific Conductance (SC); typically, DEQ uses the average or median SC for this determination. With this renewal, the ground water classification for the facility has changed from Class I to Class II based on the average ambient SC data for MW-2 and MW-3:
• Class I - ground water that has an ambient SC less than 1,000 microSiemens/cm @ 25ºC (µS/cm). The 2009-issued permit classified the ground water as Class I: o 1990 – 1997 a median SC of 960 µS/cm from MW-2 (29 samples); and o 2007 TetraTech report showed average SC of 876 µS/cm from MW-2 and MW-3. It is worth noting that the extraction wells were in operation between 1996 and 2011, which may have reduced potential influence from the PCC ponds on MW-2 and MW-3 during that time.
• Class II - ground water that has an average ambient SC between 1,000 and 2,500 µS/cm. Review of the current data indicates that the ground water should be classified as Class II. o 2014 to 2018 NetDMR data, reported as umho/cm (equivalent to µS/cm):
o MW-2: the 17 quarterly monitoring results ranged from 892 – 1,631 µS/cm with an average of 1,277 µS/cm; and
o MW-3: the 16 quarterly monitoring results ranged from 1,177 – 1,951 µS/cm with an average of 1,642 µS/cm.
o 2014 application data stated that the upgradient SC averaged 1,904 µS/cm (range 958 – 4770 µS/cm), in monitoring wells MW-2, MW-3, and MW-4 (2010 – 2013). Only two out of 15 samples were below 1,000 µS/cm for MW-2 and none were below for MW-3 or MW-4.
• Class III - ground water that has an ambient SC between 2,500 and 15,000 µS/cm.
B. Applicable Water Quality Standards Surface Water - Discharges to surface waters classified C-3 are subject to the specific water quality standards of ARM 17.30.629, Department Circulars DEQ-7 Aquatic Life Standards (Acute and Chronic) and Surface Water Human Health Standards, DEQ-12A Base Numeric Nutrient Standards, and DEQ-12B Nutrient Standards Variances, as well as the general provision of ARM 17.30.635 through 637. In addition to these standards, dischargers are also subject to mixing zones and nondegradation requirements.

Fact Sheet Permit No. MT0000281 July 2019 Page 21 of 48
Ground Water - Discharges to Class II ground water must comply with the Montana Numeric Water Quality Standards included in Circular DEQ-7 and protection of current and anticipated beneficial uses. Ground water quality standards may be exceeded within a DEQ- authorized mixing zone, provided that all existing and future beneficial uses of state waters are protected. WSC has submitted past fate and transport studies that demonstrated a direct connection from the receiving ground water to state surface waters.
C. Mixing Zone A mixing zone is an area where effluent mixes with the receiving water and certain water quality standards may be exceeded. DEQ must determine the applicability of currently granted mixing zones.
The discharge must comply with general prohibitions, which require that state waters, including mixing zones, must be free from substances which will:
(a) settle to form objectionable sludge deposits or emulsions beneath the surface of the water or upon adjoining shorelines;
(b) create floating debris, scum, a visible oil film (or be present in concentrations at or in excess of 10 milligrams per liter) or globules of grease or other floating materials;
(c) produce odors, colors or other conditions as to which create a nuisance or render undesirable tastes to fish flesh or make fish inedible;
(d) create concentrations or combinations of materials which are toxic or harmful to human, animal, plant or aquatic life; and
(e) create conditions which produce undesirable aquatic life.
No mixing zone will be granted that will impair beneficial uses. Aquatic life chronic, aquatic life acute and human health standards may not be exceeded outside of the mixing zone.
Surface Water Mixing Zones The initial receiving waterbody for Outfall 001 is the Yegen Drain, and the initial receiving waterbody for Outfall 002 is the City of Billings storm water drainage system (Grey Eagle Ditch) which discharges into the Yegen Drain. The 7-day, l0-year low flow (7Q10) and seasonal 14-day, 5-year low flow (14Q5) for both waterbodies are presumed to be “0” and no dilution is available to meet applicable standards. Since mixing zones are not granted for these outfalls, effluent limits will be based on ensuring the discharges meet water quality standards at the last point of control (‘end-of-pipe’).
Ground Water Mixing Zones A ground water mixing zone is a portion of ground water to which pollutants are discharged and in which otherwise applicable ground water standards may be exceeded. In the 1998-issued MPDES permit, the ground water discharge that had previously been permitted under the facility’s ground water permit was incorporated as Outfall 004, with the same mixing zone that had been granted in the 1992-issued ground water permit.
In the 2009-issued MPDES permit, DEQ reviewed the specific conductance levels downgradient of the facility and concluded that the ground water classification’s beneficial uses were not being maintained. The determination that beneficial use was not being maintained was supported by downgradient neighbor complaints of iron staining and high ammonia levels. Based on these
Fact Sheet Permit No. MT0000281 July 2019 Page 22 of 48
facts, the source-specific mixing zone was shortened to 1,000 feet as represented by monitoring well MW-9 located along the northern property boundary.
In the 2014 renewal application, WSC requested to maintain the facility-wide ground water mixing zone for specific conductance, nitrate-nitrite, and ammonia (if necessary) from infiltration from the four sources previously permitted as Outfall 004 (saturated PCC ponds and stock piles; ash pond; aeration ponds; and mud ponds). However, in this permitting action DEQ has determined that those four infiltration sources are correctly permitted as four discrete point source discharges (Outfalls 004 - 007). Therefore, the mixing zones need to be considered independently of each other.
Stockpiles or waste piles are not authorized under this MPDES permit. Ground water infiltration from the four outfalls potentially overlap each other as well as overlap nonpoint infiltration from stockpiles. There is insufficient data to demonstrate assimilative capacity for each parameter at each outfall, and the potential for cumulative effects. Therefore, DEQ is not granting ground water dilution, or a ground water mixing zone, for any of the four sources.
Regardless of an approved mixing zone, the quality of the ground water must be maintained so that downstream wells remain at least marginally suitable for:
(i) public and private water supplies; (ii) culinary and food processing purposes; (iii) irrigation of some agricultural crops; (iv) drinking water for livestock and wildlife; and (v) most commercial and industrial purposes.
For this renewal, WSC supplied current seasonal ground water potentiometric maps (ground water elevation in May 2018, August 2018, November 2018, and March 2019 -- see Figures 4A- 4D). These figures demonstrate that the ground water flow is consistently northeast. Based on a discussion with Boris Krizek, PE, City of Billings (December 21, 2018), the properties to the west and north of WSC are on public water. In addition, residences and businesses east of Sugar Ave along Nall Avenue are on public water. However, businesses along Sugar Avenue – directly east of WSC – do not have public water and rely on individual ground water wells. The ground water use of drinking water must be protected for all the properties along Sugar Avenue between the five or six buildings abutting the rail spur to the north, all the way south to the WSC southern property line.
D. Reasonable Potential Analysis and Water Quality-based Effluent Limit Development 1. Pollutants of Concern
Limits must be established in permits to control all pollutants or parameters that are or may be discharged at a level that will cause, have the reasonable potential to cause, or contribute to an excursion above any state water quality standard.
Pollutants and parameters are identified as pollutants of concern (POC) for one or more of the following reasons: because they have listed TBELs; were identified as needing WQBELs in the previous permit; are identified as present in the effluent through monitoring or otherwise expected present in the discharge; or are pollutants associated with impairment which may or may not have a Wasteload Allocation (WLA) in a TMDL. DEQ evaluated pollutants regulated

Fact Sheet Permit No. MT0000281 July 2019 Page 23 of 48
under the Sugar Beet ELG, listed as impaired, previous permit limits or monitoring, or identified as known/expected present in the renewal applications or through knowledge of the process. Table 13 lists the basis for listing each parameter.
Table 13. Identification of WSC Parameters of Concern Parameter Basis for Identifying as a POC
TSS
Sugar Beet ELG BOD5 pH Temperature Fecal Coliform E. coli Bacteria Previous Limit Dissolved Oxygen Knowledge of Process Oil & Grease Previous Limit Ammonia, Nitrate+Nitrite Previous Limits Total Nitrogen, Total Phosphorus Previous Required Monitoring Arsenic, Iron, Lead, Mercury, Selenium Previous Required Monitoring Possible Coal Ash Metals: Aluminum, Antimony, Barium, Beryllium, Cadmium, Chromium, Copper, Nickel, Thallium, Zinc
Knowledge of Process/Suspected Present (1)
Possible Coal Ash Pollutants: Fluoride, Sulfate Knowledge of Process/Suspected Present (1) Total Residual Chlorine (TRC) Previous Limit Specific Conductance (SC) Previous Required Monitoring Footnotes: (1) Steam Electric Power Generating Point Source Category: Final Detailed Study Report,” October 2009, EPA
821-R-09-008.
Specific pollutant considerations and conclusions are discussed in Part IV.D.4.
2. Reasonable Potential Analysis Basis DEQ typically uses the EPA’s Technical Support Document for Water Quality-based Toxic Control (TSD) (EPA/505/2-90-001, March 1991) method when evaluating reasonable potential (RP) to exceed surface water standards and developing WQBELs for those parameters with RP. The determination is parameter-by-parameter for specific point discharges. DEQ conducted an RP analysis for each POC that has an applicable water quality standard, to evaluate whether the discharge has RP to exceed the standard. The RP analysis uses the following mass-balance equation (Equation 2):
Cr = QdCd + QsCs (Equation 2) Qd + Qs

Fact Sheet Permit No. MT0000281 July 2019 Page 24 of 48
Given: Cr = the resulting receiving water concentration
Qs = critical stream flow (7Q10 x available dilution, 14Q5, or ground water flux) Qd = critical discharge flow rate Cs = critical background receiving water pollutant concentration (75th percentile) Cd = critical discharge pollutant concentration
[ = maximum concentration during the POR x TSD multiplier (C95)]
Where the projected receiving water concentration (Cr) exceeds the lowest applicable numeric standard for the pollutant of concern, there is RP and WQBELs must be calculated.
RP Summary The RP analyses for Outfalls 001 & 002 are provided in Appendix Tables A and B. The RP analyses for the ground water outfalls are described below. The following assumptions were made:
Critical Receiving Water Flow (Qs) Outfalls 001 & 002: the 7Q10 and 14Q5 for each outfall is 0 cfs and there is no available dilution (Qs = 0).
Outfalls 004 - 007: DEQ determined the data is not adequate to accurately predict the ground water flux for each outfall, and the ground water Qs = 0.
Critical Discharge Flow (Qd) For industrial sources, the critical discharge flow rate is based on a reasonable measure of actual production. However, as there is no dilution available for these surface water discharges (Qs = 0), the critical discharge flow rates are not relevant for the RP evaluation or WQBEL development.
Critical Receiving Water Background Pollutant Concentration (Cs) For purposes of determining assimilative capacity, the critical background receiving water concentration (Cs) for any waterbody with available dilution flow is defined to be the 75th percentile or upper bound estimate of the interquartile range of the data. However, for this renewal the background water quality was not considered because DEQ did not grant a mixing zone or any dilution for surface water or ground water.
Critical Discharge Pollutant Concentration (Cd) The critical discharge concentration is based on the 95th percentile of the expected effluent concentration observed or predicted in the discharge. Due to the low frequency of samples and the non-normal distribution of most discharges, DEQ follows the estimation procedures described in EPA’s TSD to estimate the 95th percentile of the daily values, by multiplying the maximum discharge concentration observed during the POR by a TSD multiplier, calculated using the number of effluent samples and corresponding coefficient of variation (CV). For Outfalls 001 & 002, Cd is provided in Appendix Tables A-1 and B-1 for those parameters listed in Table 13 that have quantified discharge data. However, DEQ determined that there is insufficient data for five metals (arsenic, iron, lead, mercury, and selenium) to determine if there is RP.
Fact Sheet Permit No. MT0000281 July 2019 Page 25 of 48
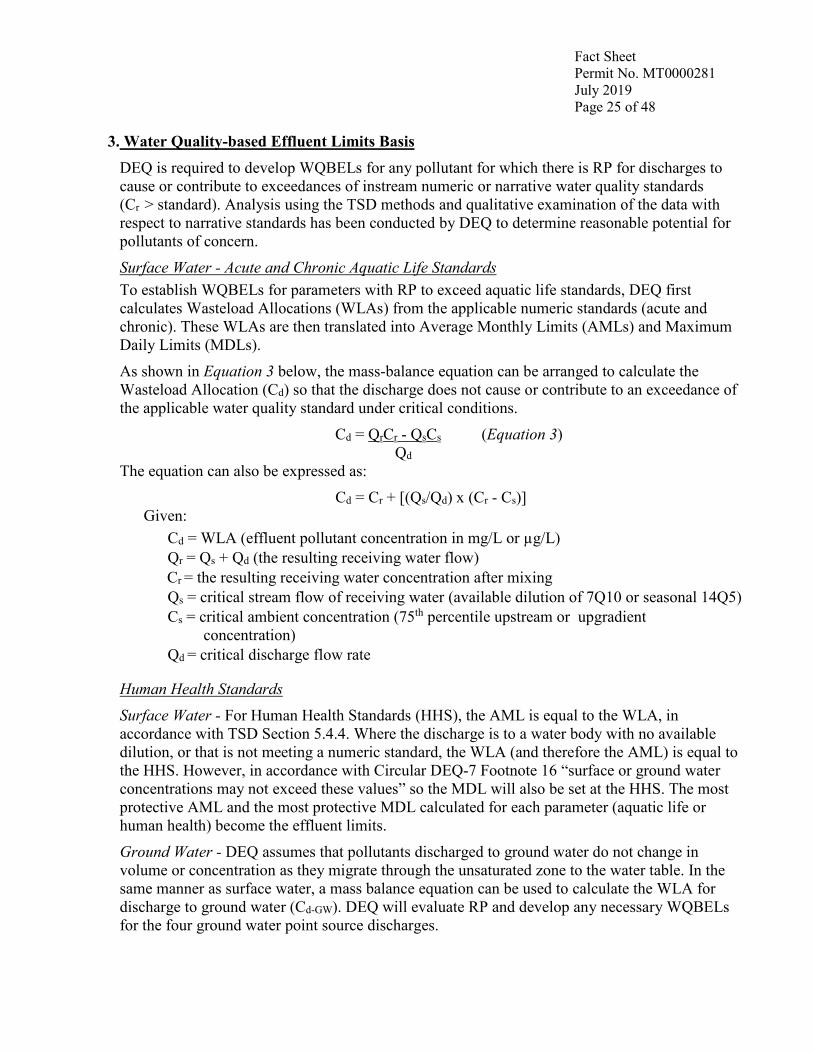
3. Water Quality-based Effluent Limits Basis DEQ is required to develop WQBELs for any pollutant for which there is RP for discharges to cause or contribute to exceedances of instream numeric or narrative water quality standards (Cr > standard). Analysis using the TSD methods and qualitative examination of the data with respect to narrative standards has been conducted by DEQ to determine reasonable potential for pollutants of concern.
Surface Water - Acute and Chronic Aquatic Life Standards To establish WQBELs for parameters with RP to exceed aquatic life standards, DEQ first calculates Wasteload Allocations (WLAs) from the applicable numeric standards (acute and chronic). These WLAs are then translated into Average Monthly Limits (AMLs) and Maximum Daily Limits (MDLs).
As shown in Equation 3 below, the mass-balance equation can be arranged to calculate the Wasteload Allocation (Cd) so that the discharge does not cause or contribute to an exceedance of the applicable water quality standard under critical conditions.
Cd = QrCr - QsCs (Equation 3) Qd
The equation can also be expressed as:
Cd = Cr + [(Qs/Qd) x (Cr - Cs)] Given:
Cd = WLA (effluent pollutant concentration in mg/L or µg/L) Qr = Qs + Qd (the resulting receiving water flow) Cr = the resulting receiving water concentration after mixing Qs = critical stream flow of receiving water (available dilution of 7Q10 or seasonal 14Q5) Cs = critical ambient concentration (75th percentile upstream or upgradient
concentration) Qd = critical discharge flow rate
Human Health Standards Surface Water - For Human Health Standards (HHS), the AML is equal to the WLA, in accordance with TSD Section 5.4.4. Where the discharge is to a water body with no available dilution, or that is not meeting a numeric standard, the WLA (and therefore the AML) is equal to the HHS. However, in accordance with Circular DEQ-7 Footnote 16 “surface or ground water concentrations may not exceed these values” so the MDL will also be set at the HHS. The most protective AML and the most protective MDL calculated for each parameter (aquatic life or human health) become the effluent limits.
Ground Water - DEQ assumes that pollutants discharged to ground water do not change in volume or concentration as they migrate through the unsaturated zone to the water table. In the same manner as surface water, a mass balance equation can be used to calculate the WLA for discharge to ground water (Cd-GW). DEQ will evaluate RP and develop any necessary WQBELs for the four ground water point source discharges.
Fact Sheet Permit No. MT0000281 July 2019 Page 26 of 48
4. Parameter-Specific Reasonable Potential and Water Quality-based Effluent Limits
a. Total Suspended Solids (TSS) –Montana does not have a numeric water quality standard for TSS. Narrative standards protect Montana surface water from high TSS by prohibiting discharge from an industrial facility that will create objectionable sludge deposits or cause floating debris or floating materials. In addition, the standards prohibit increases above naturally occurring floating or settleable solids, and the maximum allowable increase above naturally occurring turbidity is 10 nephelometric turbidity units.
As discussed in Part III of this Fact Sheet, DEQ is proposing the load-based TSS TBELs apply to the sum total of the TSS loads for all outfalls. This will be sufficient to protect water quality for this parameter.
TSS monitoring will be reduced to 3/week for Outfalls 001 & 002. In addition, WSC will be required to monitor TSS at representative discharge locations for ground water outfalls.
b. Biochemical Oxygen Demand (BOD5) – Montana does not have a numeric water quality standard for BOD5. Narrative standards are designed to protect Montana surface water from high BOD5 by prohibiting discharge from an industrial facility that will create objectionable sludge deposits, cause floating debris or floating materials, be harmful or create toxic conditions, or create conditions which produce undesirable aquatic life.
Sugar beet effluent is high in organic matter. Impacts to receiving water from degradation of high-strength organic matter (or high BOD5) include depleted oxygen supply and undesirable aquatic life. The 2009-issued Permit Fact Sheet reported that bacterial masses (“sewage fungus”) were prevalent in the Yegen Drain downgradient of WSC and attributable to the presence of sugars (short chain organic compounds) that are present. The presence of these bacterial masses demonstrates RP for exceeding the narrative standards.
During the POR 2014 to 2018, the reported BOD5 effluent concentrations were: • Outfall 001 average concentration was 190 mg/L and maximum was 735 mg/L. • Outfall 002 average concentration was 3.4 mg/L and maximum was 63 mg/L.
Where a TBEL is not protective enough, DEQ is required to develop a WQBEL. DEQ developed BOD5 WQBELs as part of the 2009-issued permit. DEQ is proposing to maintain the BOD5 limits of 30 mg/L average monthly and 45 mg/L daily maximum for Outfalls 001 and 002. (This is in addition to applying the load-based BOD5 TBELs facility-wide).
The concentration- and mass-based BOD5 limits will be sufficient to protect water quality for this parameter, and these permit limits are effective immediately.
BOD5 monitoring will be reduced to 3/week for Outfalls 001 & 002. In addition, WSC will be required to monitor BOD5 at representative discharge locations for ground water outfalls.
c. Dissolved Oxygen (DO) – DO standards are given in DEQ-7. Freshwater aquatic life standards are characterized by the fishery (WSC discharges to a C-3 waterbody which is a warm-water fishery) and by the presence or absence of fish in early life stages (lacking specific information, early life stages are assumed present). See Table 14 for the DO standards that apply to WSC.

Fact Sheet Permit No. MT0000281 July 2019 Page 27 of 48
Table 14: DO standards for a C-3 classified stream
Condition 30-Day Mean (mg/L)
7-Day Mean (mg/L)
7-Day Mean Min. (mg/L)
1-Day Minimum (1)
(mg/L) Early Life Stages (2) NA 6.0 NA 5.0 Other Life Stages 5.5 NA 4.0 3.0 Footnotes: NA = “Not Applicable” (1) All minima should be considered as instantaneous concentrations to be achieved at all times. (2) Includes all embryonic and larval stages and all juvenile forms of fish to 30-days following hatching.
Sugar beet effluent is high in organic matter which can exert a high oxygen demand (BOD5), resulting in depletion of dissolved oxygen in the receiving water. DO monitoring was not required by the previous permit. The facility is required to address high BOD5 concentrations in their discharge from the aerated condenser ponds; wastewater treatment DO limits or monitoring is redundant.
d. pH –The applicable surface water quality standard for pH is “Induced variation of hydrogen ion concentration (pH) within the range of 6.5 to 9.0 must be less than 0.5 pH unit. Natural pH outside this range must be maintained without change. Natural pH above 7.0 must be maintained above 7.0.” During the period of record: • Outfall 001 ranged from 6.0 – 8.2 s.u., • Outfall 002 ranged from 6.3 – 9.0 s.u., and • Ground water monitoring wells ranged from 6.1 – 8.2 s.u.
DEQ finds that the TBEL pH requirement for discharges to remain between 6.0 – 9.0 su is sufficient to protect this standard. Monitoring for all outfalls will be required.
e. Temperature – The TBEL temperature limit of 90°F (32.2°C) applies to all WSC outfalls. In addition, the water quality standards for a C-3 surface water specify that a discharge cannot increase the naturally occurring temperature by the following:
(1) By 3°F when the naturally occurring receiving water is 32 - 77°F; (2) Above 80°F, when the range is 77 - 79.5°F; or (3) More than 0.5°F when the naturally occurring receiving water is 79.5°F.
The TBEL temperature limit of 90ºF was found to be insufficient for the surface water discharges in the 2009-issued permit; therefore, a WQBEL temperature limit of 77°F was included for both Outfalls 001 and 002. The resulting WQBEL temperature limit of 77°F will be maintained for both surface water outfalls. Temperature readings will be required. In addition, the 2009-issued permit required ground water temperature monitoring. During the POR 2014 to 2018, the reported effluent temperatures were: • Outfall 001: 30°F to 72°F (average 47°F). • Outfall 002: 60°F (minimum monthly average) to 86°F (four exceedances above 77°F). • Ground water monitoring wells (MW-4, -5, -6, and -9) along the northern and eastern
property lines ranged from 38ºF to 78ºF.
DEQ finds that more restrictive temperature limits for ground water discharges are not needed to protect surface waters. The TBEL temperature limit of 90°F will be incorporated into the ground water discharges and monitoring will be required.
Fact Sheet Permit No. MT0000281 July 2019 Page 28 of 48
f. Pathogens – The TBEL pathogen limit of 400 most probable number (mpn)/100 mL fecal coliform applies to all WSC outfalls, including the ground water discharges.
In addition, DEQ has water quality standards for pathogens based on the indicator bacteria, Escherichia coli (E. coli). E. coli standards are defined for summer (April 1 through October 31) and winter (November 1 through March 31). The standards for E. coli are expressed as #_organisms/100 mL (expressed as either colony forming units (cfu)/100 mL or most probable number (mpn)/100 mL), as follows: • from April 1 through October 31, the geometric mean number of E. coli may not exceed
126 organisms/100 mL and 10 percent of the total samples may not exceed 252 organisms/100 mL during any 30-day period; and
• from November 1 through March 31, the geometric mean number of E. coli may not exceed 630 organisms/100 mL and 10 percent of the samples may not exceed 1,260 organisms/100 mL during any 30-day period.
In the 2009-issued permit, DEQ concluded the fecal coliform limit was as, or more, restrictive than the E. coli standards except for the summer E. coli standard (April 1 through October 31st). As a result, DEQ required WSC to meet an additional summertime pathogen limit of 126 organisms/100 mL as a monthly E.coli geometric mean. WSC has consistently exceeded these standards during the POR (see Tables 1 & 2). DEQ will maintain the existing pathogen limits for Outfalls 001 & 002. Monitoring will remain once per week. There were no pathogen monitoring results for ground water. The TBEL limit of 400 mpn per 100 mL fecal coliform will apply to the four ground water outfalls, and the permit will include ground water fecal coliform compliance monitoring.
g. Oil & Grease – DEQ will maintain the oil & grease 10 mg/L daily maximum limit for Outfalls 001 & 002. Monthly visual monitoring was conducted with no oil and grease observed during the POR. Monitoring will remain at monthly visual with sample analysis required upon observation of an oil sheen.
h. Total Ammonia as N –
Ammonia in Surface Water - The surface water quality standards for total ammonia as N (ammonia) are calculated following the procedures outlined in Circular DEQ-7, and are dependent on pH, temperature, type of fishery present, and associated life stages. For WSC, effluent pH and temperature data are used in deriving the ammonia standard because there are no available ambient data, and the WSC discharges comprise most of the receiving water volume. The Yegen Drain is protected for non-salmonid production and propagation and, lacking specific data, early life stages are presumed present. The municipal storm drain is assumed to have no salmonids and no early life stages present.
The 2009-issued permit included surface water discharge ammonia limits of 7.08 mg/L maximum daily and 2.80 mg/L average monthly, which were equivalent to the calculated water quality standards. These standards were based on the effluent pH of 8.1 su (annual 95th percentile) and 7.9 (seasonal 75th percentile) and temperature of 10 deg C.
Table 15 presents the derivation of the proposed ammonia water quality standards.

Fact Sheet Permit No. MT0000281 July 2019 Page 29 of 48
Table 15: Ammonia Surface Water Standard Calculations - 2019
Condition Salmonids Present
Early Life Stages Present
Ambient Condition (1) Water Quality Standard (2)
mg/L pH
(s.u.) Temperature
°C Acute -001 No NA 7.8 NA 12.1
Chronic - 001 NA Yes 7.8 11.8 3.2 Acute -002 No NA 7.8 NA 12.1
Chronic - 002 NA No 7.8 23.9 1.7 Footnotes: NA – Not Applicable (1) Based on 75th percentile of annual effluent data. (2) Based on Department Circular DEQ-7.
The proposed total ammonia standards for this renewal changed slightly from the 2009-issued permit due to a change in methodology (75th percentile of annual data, only) and effluent pH and temperature. Comparison of the DMR data for the POR 2014- 2018 with the proposed standards shows the following: • Outfall 001 - monitoring results during the POR of 14 mg/L to 64 mg/L ammonia, which
exceed the acute and chronic ammonia standards in Table 15 (12.1 and 3.2 mg/L, respectively). There is RP and effluent limits are necessary. DEQ calculates WQBELs based on the TSD method. The new ammonia limits for Outfall 001 are calculated to be 4.4 mg/L MDL and 2.9 mg/L AML (see Appendix Table A-3). Ammonia monitoring will remain weekly.
• Outfall 002 - monitoring results during the POR of 0.07 mg/L to 2.1 mg/L ammonia, which exceed the updated chronic ammonia standard in Table 15 (1.7 mg/L). There is RP and effluent limits are necessary. DEQ calculates WQBELs based on the TSD method. The new ammonia limits for Outfall 002 are calculated to be 2.9 mg/L MDL and 1.4_mg/L AML (see Appendix Table B-3). Ammonia monitoring will remain weekly.
Ammonia in Ground Water - Montana does not have a numeric ammonia ground water quality standard. DEQ may use any pertinent credible information to determine a level for parameters that do not have a specific numeric water quality standard. No increase of a parameter to a level that renders the waters harmful, detrimental, or injurious to a beneficial use listed for a Class II water may occur. DEQ will maintain the ground water total ammonia as N limit of 35 mg/L as initially included in the 2009-issued permit. However, the ammonia limit and/or compliance monitoring will be conducted at the four sources of discharge as follows: • Outfall 004 - The 2009-issued permit included an ammonia limit of 35 mg/L at MW-9;
the maximum ammonia concentration was 45 mg/L and the average was 36 mg/L. Although the ammonia concentration in the decanted mud pond water now disposed in the PCC ponds is unknown, the limit will remain applicable and monitoring will be required from the discharge source -- mud pond sump (if actively pumping) or PCC ponds (if not actively pumping) during all months with ground water discharge.
• Outfall 005 – The maximum ammonia concentration from the ash pond discharge between 2014 - 2018 was 2.1 mg/L. The ash pond does not have RP to cause or contribute to an exceedance of the 35 mg/L ammonia ground water limit and no additional monitoring or limit is necessary.
Fact Sheet Permit No. MT0000281 July 2019 Page 30 of 48
• Outfall 006 – The maximum ammonia concentration in the condenser ponds was 64 mg/L and the average was 30 mg/L. WSC will be required to control the ammonia concentration for Outfall 001 to below 3 mg/L; there will be no RP to exceed the ground water ammonia limit of 35 mg/L. Furthermore, the maximum ammonia concentration near the property boundary at MW-4 was 0.4 mg/L and MW-5 was 17.4 mg/L, both well below 35 mg/L. In addition to monitoring the condenser pond ammonia concentration at Outfall 001, monitoring at MW-4 and MW-5 will be required.
• Outfall 007 – There is no ammonia data from the mud ponds. Ammonia monitoring will be required from the mud pond recirculation (return) line.
i. Nitrate plus Nitrite as N (N+N) – Both the surface water and ground water human health standards for N+N are 10 mg/L (Circular DEQ-7). Surface Water – The 2009-issued permit included an N+N permit limit of 10 mg/L for Outfalls 001 and 002. The maximum observed effluent concentration during the POR was 2.0 mg/L for Outfall 001 and 0.8 mg/L for Outfall 002. Although DEQ found there is currently not RP for WSC to exceed 10 mg/L N+N, the limit will be maintained due to the requirement that the facility implement wastewater treatment for ammonia, which nitrifies the ammonia resulting in higher N+N concentrations. Ground Water – There is no N+N ground water data. Monitoring will be required at the four ground water outfalls as well as monitoring wells along the property boundary.
j. Total Kjeldahl Nitrogen (TKN) – Montana does not have TKN standards, but TKN is a component of Total Nitrogen. Therefore, monitoring for this parameter will be required for Outfalls 001 & 002 during the applicable nutrient season during times with discharge.
k. Nutrients – Total Nitrogen (TN) and Total Phosphorus (TP) – The 2009-issued permit did not contain nutrient effluent limits. On July 25, 2014, DEQ adopted Circular DEQ-12A (Base Numeric Nutrient Standards) and Circular DEQ-12B (Nutrient Standard Variances, July 2014, updated May 2018). EPA approved these standards on February 26, 2015.
The Yegen Drain and the municipal storm drain are located within the Northwestern Great Plains (ecoregion 43), specifically West-Central Semi-Arid Prairies (ecoregion 43n), and are subject to the Circular DEQ-12A standards effective July 1st through September 30th. Since the 14Q5 for the Yegen Drain and the municipal storm sewer system is 0 mgd there is no available dilution.
TN Discharges from WSC are subject to a TN standard of 1.3 mg/L (average monthly) for the Yegen Drain and the municipal storm drain, effective July 1st through September 30th. DEQ performed RP analyses for TN discharged from Outfalls 001 and 002, based on the data available in the DMRs for the four September months between 2014 – 2018 (see Appendix Tables A-2 and B-2): o Outfall 001 –The highest average monthly TN concentration for the POR during
September was 25 mg/L. Based on the TSD method, the critical TN discharge was calculated to be 33 mg/L and WSC has RP to exceed the standard of 1.3 mg/L. WSC will have a final limit of 1.3 mg/L TN, applicable July 1 – September 30th.
o Outfall 002 – the daily maximum Total Inorganic Nitrogen (TIN) concentration for the POR during September was 1.1 mg/L based on the sum of daily maximum ammonia
Fact Sheet Permit No. MT0000281 July 2019 Page 31 of 48
and N+N concentrations (neither TKN nor TN were reported for Outfall 002 and monthly averages are not available). Although the exact Cd cannot be calculated, it is estimated at 2.9 mg/L TN which shows RP to exceed the 1.3 mg/L TN standard at Outfall 002. WSC will have a final limit of 1.3 mg/L TN, applicable July 1 – September 30th.
TP Discharges from WSC are subject to a TP standard of 0.15 mg/L effective July 1st to September 30th. DEQ performed RP analyses for TP discharged from Outfalls 001 and 002, based on the data available in the DMRs for the four September months between 2014 – 2018 (see Appendix Tables A-2 and B-2): o Outfall 001 –The highest monthly average TP concentration for the POR during
September was 0.44 mg/L, which results in Cd of 0.90 mg/L. WSC has RP to exceed the ecoregion TP standard of 0.15 mg/L. WSC will have a final limit of 0.15 mg/L TP applicable July 1 – September 30th.
o Outfall 002 – The highest monthly average TP concentration for the POR during September was 1.2 mg/L, which results in Cd of 3.9 mg/L. WSC has RP to exceed the ecoregion TP standard of 0.15 mg/L. WSC will have a final limit of 0.15 mg/L TP applicable July 1 – September 30th.
WSC cannot immediately meet the TN and TP limits. There is currently no nutrient general variance available for industrial dischargers. DEQ will provide a compliance schedule until July 1, 2024 to provide time for WSC to either obtain a TN and/or TP individual variance or meet the limits. Weekly monitoring during times of discharge between July 1 – September 30th for TN and TP at both Outfall 001 & 002 will be required.
l. Metals – the Circular DEQ-7 standards for metals either potentially expected from beet processing or as identified in the EPA document “Steam Electric Power Generating Point Source Category: Final Detailed Study Report,” October 2009 are summarized in Table 16.
Metals in Surface Water - For the aquatic life hardness-based metal standards, DEQ used the 25th percentile of the effluent quality hardness as the discharge makes up a majority of the flow in both receiving waterbodies. All metals standards for surface water are expressed as total recoverable except for aluminum which is expressed as dissolved.
The 2009-issued permit required annual monitoring at Outfalls 001 & 002 for five metals: total recoverable arsenic, iron, lead, mercury, and selenium.
Outfall 001 - None of the aerated condenser pond effluent’s four metal samples exceeded standards between 2014 - 2017. During the 2018/2019 campaign, WSC re-routed the settled ash pond wastewater for process re-use; correspondingly, metals concentrations in the one metal sample taken during this campaign showed increased arsenic, iron, lead, and selenium concentrations (iron and selenium exceeding their respective standards). Because DEQ is including a Special Condition that requires WSC to pursue wastewater reduction and pollutant minimization options, DEQ has determined that no effluent limits are required. Additional monitoring will be required.
Outfall 002 - The ash pond discharge metals concentrations between 2014 - 2017 exceeded metals standards as follows: two of four iron samples exceeded 1,000 µg/L
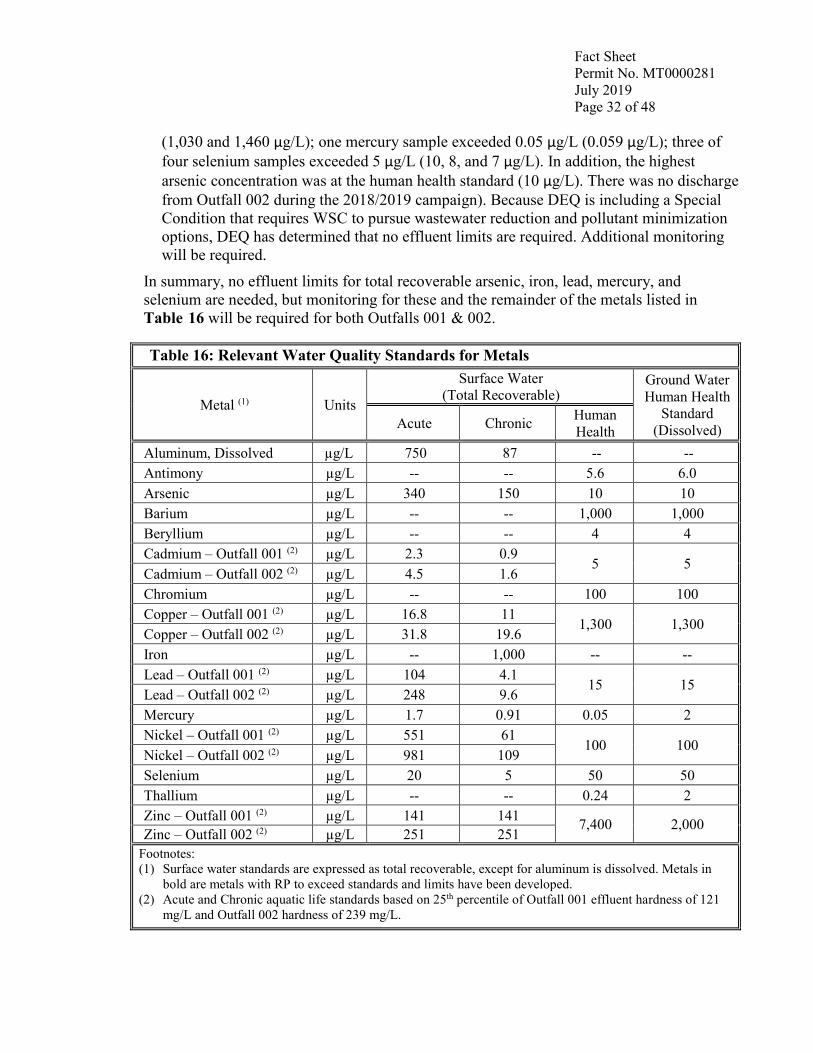
Fact Sheet Permit No. MT0000281 July 2019 Page 32 of 48
(1,030 and 1,460 µg/L); one mercury sample exceeded 0.05 µg/L (0.059 µg/L); three of four selenium samples exceeded 5 µg/L (10, 8, and 7 µg/L). In addition, the highest arsenic concentration was at the human health standard (10 µg/L). There was no discharge from Outfall 002 during the 2018/2019 campaign). Because DEQ is including a Special Condition that requires WSC to pursue wastewater reduction and pollutant minimization options, DEQ has determined that no effluent limits are required. Additional monitoring will be required.
In summary, no effluent limits for total recoverable arsenic, iron, lead, mercury, and selenium are needed, but monitoring for these and the remainder of the metals listed in Table_16 will be required for both Outfalls 001 & 002.
Table 16: Relevant Water Quality Standards for Metals
Metal (1) Units
Surface Water (Total Recoverable)
Ground Water Human Health
Standard (Dissolved) Acute Chronic Human
Health Aluminum, Dissolved µg/L 750 87 -- -- Antimony µg/L -- -- 5.6 6.0 Arsenic µg/L 340 150 10 10 Barium µg/L -- -- 1,000 1,000 Beryllium µg/L -- -- 4 4 Cadmium – Outfall 001 (2) µg/L 2.3 0.9
5 5 Cadmium – Outfall 002 (2) µg/L 4.5 1.6 Chromium µg/L -- -- 100 100 Copper – Outfall 001 (2) µg/L 16.8 11
1,300 1,300 Copper – Outfall 002 (2) µg/L 31.8 19.6 Iron µg/L -- 1,000 -- -- Lead – Outfall 001 (2) µg/L 104 4.1
15 15 Lead – Outfall 002 (2) µg/L 248 9.6 Mercury µg/L 1.7 0.91 0.05 2 Nickel – Outfall 001 (2) µg/L 551 61
100 100 Nickel – Outfall 002 (2) µg/L 981 109 Selenium µg/L 20 5 50 50 Thallium µg/L -- -- 0.24 2 Zinc – Outfall 001 (2) µg/L 141 141 7,400 2,000 Zinc – Outfall 002 (2) µg/L 251 251
Footnotes: (1) Surface water standards are expressed as total recoverable, except for aluminum is dissolved. Metals in
bold are metals with RP to exceed standards and limits have been developed. (2) Acute and Chronic aquatic life standards based on 25th percentile of Outfall 001 effluent hardness of 121
mg/L and Outfall 002 hardness of 239 mg/L.
Fact Sheet Permit No. MT0000281 July 2019 Page 33 of 48
Metals in Ground Water - All discussion of metals standards and limits in ground water refers to the parameter in the dissolved fraction. DEQ conducted RP analysis as follows:
Arsenic: Arsenic is a carcinogenic pollutant. WSC must not cause or contribute to an exceedance of the ground water HHS of 10 µg/L dissolved arsenic beyond the boundaries of an approved mixing zone.
Outfall 004 - PCC Ponds. WSC did not provide arsenic data for the PCC ponds, the mud pond decant wastewater that is applied to them, or downgradient monitoring wells (MW-12A, OBS-1, MW-8, or MW-9). There is no known arsenic contribution from this discharge source. Monitoring for dissolved arsenic will be required for the mud decant wastewater as well as at MW-9.
Outfall 005 - Ash Pond. Based on the DMR data, effluent samples from the ash pond ranged from 9 to 10 µg/L total recoverable arsenic; dissolved arsenic levels in the ash pond are not known. Although the concentration of dissolved arsenic for the five downgradient MW-5 samples ranged from 22 to 45 µg/L and the five MW-6 samples ranged from 17 to 22 µg/L, it is unknown whether the arsenic comes from the ash pond or if it derives from an unregulated source (either leaching of stockpiles or the unregulated coal combustion residual (CCR) pile). Monitoring of the ash pond and of monitoring wells MW-5 and MW-6 for dissolved arsenic will be required.
Outfall 006 - Aerated Condenser Ponds. Based on DMR data for 2014 - 2017, the aerated condenser pond effluent samples ranged from 2.0 to 5.0 µg/L total recoverable arsenic; dissolved arsenic levels in the ponds are not known. However, although the five ground water samples at MW-4 ranged from 7 to 22 µg/L dissolved arsenic, it is unknown whether the arsenic comes from the aerated condenser ponds or if it derives from an unregulated source. Monitoring for dissolved arsenic in the aerated condenser ponds and monitoring well MW-4 will be required.
Outfall 007 - Mud Ponds. There is no data on dissolved arsenic concentrations in the mud ponds. Monitoring of dissolved arsenic in the mud pond sump will be required.
Iron: Montana does not have a dissolved iron standard for ground water, although DEQ has recently initiated rulemaking for a ground water HHS of 4.0 mg/L (4,000 µg/L).
Outfall 004 - PCC Pond. WSC did not provide iron data for the PCC ponds. Monitoring for dissolved iron in the decanted mud pond sump wastewater that is discharged through the PCC ponds and MW-9 will be required.
Outfall 005 - Ash Pond. Based on the DMR data, effluent samples from the ash pond ranged from 0.8 to 1.5 mg/L (800 to 1,500 µg/L) total recoverable iron; dissolved iron levels are not known. Although the concentration of dissolved iron for MW-5 ranged from 1.1 to 8.3 mg/L (1,100 to 8,300 µg/L) and MW-6 ranged from 0.6 to 4.2 mg/L (600 to 4,200 µg/L), it is unknown whether the iron comes from the ash pond or if it derives from an unregulated source. Monitoring for dissolved iron in the ash pond and monitoring wells MW-5 and MW-6 will be required.
Outfall 006 - Aerated Condenser Ponds. Based on DMR data for 2014 - 2017, the aerated condenser pond effluent samples ranged from 0.3 to 0.6 mg/L (300 to 600 µg/L) total recoverable iron; dissolved iron levels are not known. Although MW-4
Fact Sheet Permit No. MT0000281 July 2019 Page 34 of 48
ranged from 0.1 to 9.7 mg/L (100 to 9,700 µg/L) dissolved iron, it is unknown whether the iron comes from the ash pond or if it derives from an unregulated source. Monitoring of dissolved iron in the aerated condenser ponds and monitoring well MW-4 will be required.
Outfall 007 - Mud Ponds. There is no data on dissolved iron concentrations in the mud ponds. Monitoring of dissolved iron in the mud pond sump will be required.
Lead: Coal is a potential source of lead, which is a toxic pollutant. The ground water HHS is 15 µg/L as dissolved lead.
Outfall 004 - PCC Ponds. WSC did not provide lead data for the PCC ponds or downgradient monitoring wells (MW-12A, OBS-1, MW-8, or MW-9). There is no known lead contribution from this discharge source. No limit or monitoring for dissolved lead is required.
Outfall 005 - Ash Pond. Based on the DMR data, effluent samples from the ash pond ranged from 1.6 to 2.8 µg/L total recoverable lead; the concentration of dissolved lead is unknown. The monitoring results at MW-5 and MW-6 were all nondetect, with detection limits ranging from 0.1 to 1.0 µg/L dissolved lead. No limit or monitoring for dissolved lead is required.
Outfall 006 - Aerated Condenser Ponds. Based on DMR data for 2014 - 2017, the aerated condenser pond effluent samples ranged from 0.4 to 1.4 µg/L total recoverable lead; the dissolved lead concentration is not known. MW-4 was non-detect with the detection ranging from 0.1 to 1.0 µg/L dissolved lead. No limit or monitoring for dissolved lead is required.
Outfall 007 - Mud Ponds. There is no data on dissolved lead concentrations in the mud ponds but there is no known source of lead. No limit or monitoring for dissolved lead is required.
DEQ finds there is no RP to exceed the ground water dissolved lead HHS of 15 µg/L; no further ground water monitoring will be required.
Mercury: Coal is a source of mercury, which is a toxic pollutant with a bioconcentrating factor > 300 (BCF = 5,500). The ground water human health standard is 2 µg/L as dissolved mercury.
Outfall 004 - PCC Ponds. WSC did not provide mercury data for the mud pond decant wastewater or downgradient monitoring wells (MW-12A, OBS-1, MW-8, or MW-9). There is no known mercury contribution from this discharge source. No limit or monitoring for dissolved mercury is required.
Outfall 005 - Ash Pond. The total recoverable mercury concentrations for the four Outfall 002 samples from the ash pond ranged from 0.04 – 0.06 µg/L; the concentration of dissolved mercury is unknown. The monitoring results at MW-5 and MW-6 were all nondetect, with detection ranging from 0.1 to 0.2 µg/L. No limit or monitoring for dissolved mercury is required.
Outfall 006 - Aerated Condenser Ponds. Based on DMR data for 2014 - 2017, the aerated condenser pond effluent samples ranged from 0.04 to 0.05 µg/L total

Fact Sheet Permit No. MT0000281 July 2019 Page 35 of 48
recoverable mercury; the concentration of dissolved mercury is unknown. MW-4 was non-detect with the detection ranging from 0.1 to 0.2 µg/L dissolved mercury. No limit or monitoring for dissolved mercury is required.
Outfall 007 - Mud Ponds. There is no data on dissolved mercury concentrations in the mud ponds but there is no known source of mercury.
DEQ finds there is no RP to exceed the ground water dissolved mercury HHS of 2 µg/L; no further ground water monitoring will be required.
Selenium: Coal is a potential source of selenium, which is a toxic pollutant. The ground water HHS is 50 µg/L dissolved selenium.
Outfall 004 - PCC Ponds. WSC did not provide selenium data for the mud pond decant wastewater or downgradient monitoring wells (MW-12A, OBS-1, MW-8, or MW-9). There is no known selenium contribution from this discharge source.
Outfall 005 - Ash Pond. The total recoverable selenium concentrations for four Outfall 002 samples ranged from 1 to 10 µg/L; the concentration of dissolved selenium is unknown. The monitoring results at MW-5 and MW-6 ranged from nondetect (with detection limits between 0.5 and 2.0 µg/L) to detection at 8.0 µg/L. These data show no RP to cause or contribute to an exceedance of the dissolved selenium ground water HHS.
Outfall 006 - Aerated Condenser Ponds. Based on DMR data for 2014 - 2017, the aerated condenser pond effluent samples ranged from nondetect to 3 µg/L; the dissolved concentration is unknown. The dissolved selenium concentrations for four MW-4 samples ranged from <0.5 to 6 µg/L, with the remaining sample at 51 µg/L. Because the one elevated result seems to be an outlier, DEQ has determined that semi-annual monitoring for dissolved selenium at approved downgradient wells in addition to monthly monitoring in the aerated condenser ponds is sufficient.
Outfall 007 - Mud Ponds. There is no data on dissolved selenium concentrations in the mud ponds but there is no known source of selenium other than trace amounts in the soil.
DEQ finds no RP to exceed the dissolved selenium HHS of 50 µg/L; however, further ground water monitoring will be required at Outfall 006 and downgradient monitoring well MW-4.
m. Fluoride - Coal ash contains various concentrations of fluoride. Circular DEQ-7 contains surface- and ground water human health standards of 4.0 mg/L fluoride. WSC has not conducted any monitoring for fluoride. Monitoring will be required for all outfalls.
n. Sulfate - Coal ash contains sulfate. In addition, WSC adds ammonium bisulfate to the process, although it is unknown how much is discharged (see Part II.A of this Fact Sheet). DEQ does not have a numeric water quality standard for sulfate in Circular DEQ-7. However, DEQ issued the “Translation and Guidance on Application of the Montana Narrative Water Quality Criterion for Sulfate,” in September 2014 which provides guidance on developing numeric standards for sulfate.
Fact Sheet Permit No. MT0000281 July 2019 Page 36 of 48
As the discharges from Outfall 001 and 002 are believed to be the majority of the flow in the municipal storm sewer system (Grey Eagle ditch) and the Yegen Drain for much of the year, DEQ developed the sulfate water quality criteria based on the discharge characteristics; specifically, hardness is between 100 mg/L and 500 mg/L. o Acute aquatic life: 2,000 mg/L sulfate (hardness is between 100 – 500 mg/L, chloride
concentration unknown). o Chronic aquatic life: None because the ambient hardness is > 50 mg/L. o Human health: None for surface water because it is not used as drinking water, and 500
mg/L sulfate for ground water at the end of the mixing zone. WSC has not conducted any monitoring for sulfate; monitoring for sulfate, hardness, and chloride will be required for all outfalls and monitoring wells MW-4, -5, -6, and -9.
o. Total Residual Chlorine - The total residual chlorine (TRC) standards are: 19 µg/L (acute) and 11 µg/L (chronic). WSC uses chlorine to sanitize floor drains and the beet flume; this water is recirculated and discharges should not reach Outfalls 001 or 002. However, the DMR data indicates that TRC has been detected in low levels for both Outfalls 001 and 002, with the maximum results of 12 and 19 µg/L, respectively.
Manganese is known to interfere with the TRC test methods. However, because WSC did not provide analytical data that shows that the ’hits’ resulted from manganese or other oxidizing agents’ interference, the TRC standards applied as limits in the 2009-issued permit will be maintained, but applied as “net.”
Since the TRC concentrations have historically been so low monitoring will be reduced to monthly. In addition, WSC will be required to use a method for eliminating manganese (and other oxidizers) interference either using a pretreatment procedure with and sodium arsenate (see Standard Methods 4500-Cl G, DPD Colorimetric) or other approved lab method contained within 40 CFR 136. Compliance with the TRC limits will be based on the net TRC after removing the interference.
WSC must notify DEQ if the facility changes use of chlorine so that it becomes possible that it would reach any of the outfalls.
p. Specific Conductivity (SC) – In order to ensure the Class II quality is maintained, DEQ is requiring WSC to control the discharges so that the average SC is below 2,500 µS/cm. The quality of the site’s ground water must be maintained so that downstream wells remain at least marginally suitable for: water supplies; food processing purposes; irrigation of some agricultural crops; drinking water for livestock and wildlife; and most commercial and industrial purposes. To this end, DEQ notes the following SC characteristics in the discharges;
Outfall 004 - PCC Ponds. The ground water at the northern end of the property (MW-9) exceeds 2,500 µS/cm (average is above 3,200 µS/cm). Historically this was attributed to the PCC ponds discharge. However, since 2014 WSC has not discharged PCC wastewater and has only discharged decanted mud pond wastewater. The SC of the decanted mud pond wastewater is unknown.

Fact Sheet Permit No. MT0000281 July 2019 Page 37 of 48
Outfall 005 - Ash Pond. The ground water at MW-5 and MW-6 does not exceed 2,500 µS/cm (in fact the maximum SC was below 2,000 µS/cm). There is no SC data for the ash pond. Outfall 006 - Aerated Condenser Ponds. The average SC is approximately 2,500 µS/cm at MW-4. There is no SC data from the aerated condenser ponds. Outfall 007 - Mud Ponds. The average SC is approximately 2,500 µS/cm at MW-4. There is no SC data from the mud ponds.
DEQ is not granting ground water dilution for WQBEL development. Without credible information on fate and transport of pollutants from the four ground water sources an SC average monthly limit of 2,500 µS/cm will apply at the points of discharge. SC monitoring representative of each pond and monitoring wells MW-4, MW-5, MW-6, and MW-9 will be required.
q. Acute Toxicity - State waters must be free from substances attributable to industrial waste that create conditions which are harmful or toxic to human, animal, plant or aquatic life. The previous permit included the narrative limitation that the effluent shall be free of any acute toxicity. Quarterly Whole Effluent Toxicity (WET) monitoring on alternating species (fathead minnows (Pimephales promelas) and Ceriodaphnia sp.) was required by the previous permit. The permittee reported “Pass” for all WET monitoring during the POR. Quarterly effluent monitoring for acute WET is required in the renewed permit. In a WET test, acute toxicity occurs when 50 percent or more mortality is observed for a test species at any effluent concentration.
Acute toxicity tests shall be conducted on discharges from Outfall 001 and 002 in accordance with the requirements of Part I.C. of the permit. Two aquatic species must be used each batch. The permittee shall conduct an acute static replacement toxicity test on a composite sample of the effluent on two species, fathead minnows (Pimephales promelas) and Ceriodaphnia dubia. If no acute toxicity is observed for four consecutive quarters, WET testing may be reduced to semi-annual WET testing. This change in monitoring requirements must be requested in writing and approved by DEQ. Standard WET testing language will be included in the permit.

Fact Sheet Permit No. MT0000281 July 2019 Page 38 of 48
V. Proposed Effluent Limits
A. Interim Limits
Outfalls 001 & 002 - Interim WSC cannot meet the new nutrient (TN and TP), and ammonia limits. Therefore, beginning on the effective date and lasting through {58 months after the permit effective date}, the effluent discharged by the facility through Outfalls 001 & 002 shall, at a minimum, meet the following interim limits:
Table 17. Outfall 001 and 002 – Interim Effluent Limits
Parameter Units
Effluent Limits
Maximum Daily Limit
Average Monthly Limit
Biochemical Oxygen Demand (BOD5) mg/L 45 30 lb/day 6,996 (1) 3,674 (1)
Total Suspended Solids (TSS) lb/day 6,996 (1) 3,674 (1) Fecal Coliform Bacteria MPN/100mL 400 -- E. coli Bacteria, summer (2) #/100 mL -- 126 pH s.u. 6.0 – 9.0 Temperature ° F 77.0 Oil & Grease mg/L 10 -- Total Residual Chlorine (TRC), net (3) µg/L 19 11 Nitrate plus Nitrite as N mg/L 10 -- Total Ammonia as N – Outfall 001 mg/L 7.08 2.8 Footnotes: (1) TSS and BOD5 load limits are the sum total of loads from all outfalls (surface water
Outfalls 001 & 002 and ground water Outfalls 004 - 007). (2) E. coli limit applicable only during the summer, defined as April 1 through October 31. (3) WSC must use an approved method under 40 CFR 136 and follow the method’s
procedure for determining interference. For instance, Standard Methods 4500-Cl G, DPD Colorimetric Method includes a method for analyzing for manganese and other oxidizer interferes and removing the interference to calculate the net TRC concentration.
There shall be no discharge which causes visible oil sheen in the receiving stream. There shall be no acute toxicity in the effluent.
Outfalls 004 – 007 - Interim WSC cannot meet the new specific conductance limits. Therefore, beginning on the effective date and lasting through {58 months after the permit effective date}, the effluent discharged by the facility through Outfalls 004 - 007 shall, at a minimum, meet the following interim limits:
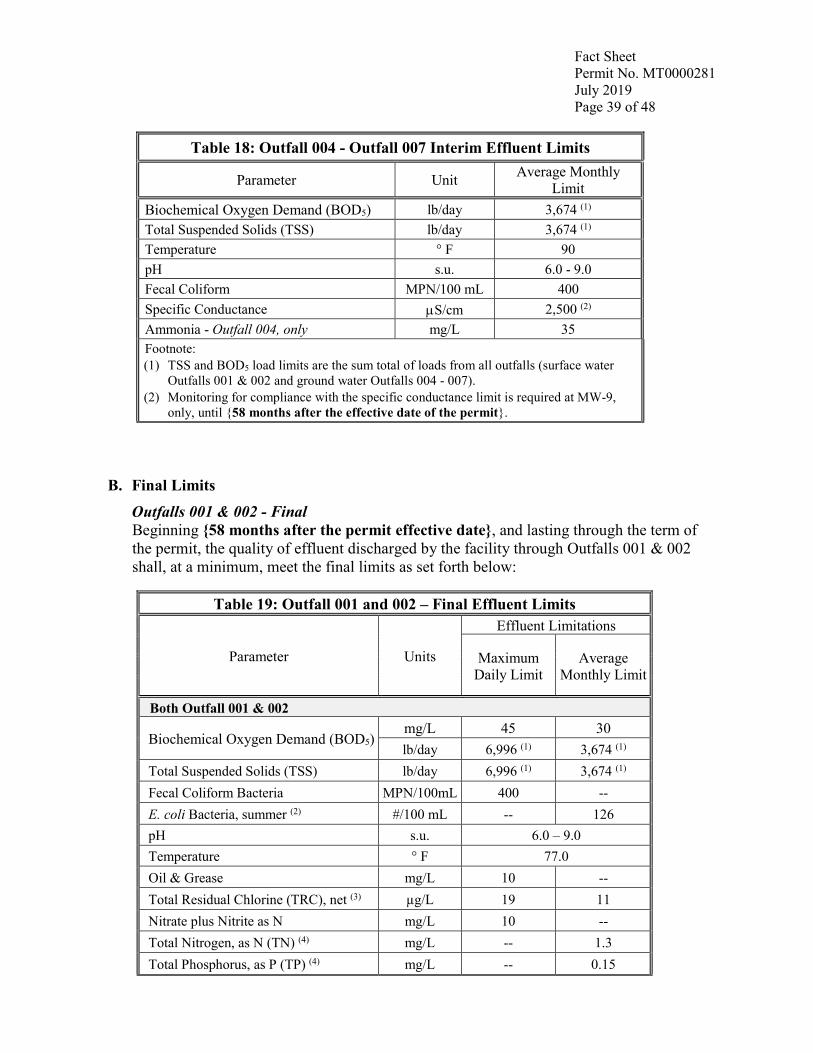
Fact Sheet Permit No. MT0000281 July 2019 Page 39 of 48
Table 18: Outfall 004 - Outfall 007 Interim Effluent Limits
Parameter Unit Average Monthly Limit
Biochemical Oxygen Demand (BOD5) lb/day 3,674 (1) Total Suspended Solids (TSS) lb/day 3,674 (1) Temperature ° F 90 pH s.u. 6.0 - 9.0 Fecal Coliform MPN/100 mL 400 Specific Conductance µS/cm 2,500 (2) Ammonia - Outfall 004, only mg/L 35 Footnote: (1) TSS and BOD5 load limits are the sum total of loads from all outfalls (surface water
Outfalls 001 & 002 and ground water Outfalls 004 - 007). (2) Monitoring for compliance with the specific conductance limit is required at MW-9,
only, until {58 months after the effective date of the permit}.
B. Final Limits Outfalls 001 & 002 - Final Beginning {58 months after the permit effective date}, and lasting through the term of the permit, the quality of effluent discharged by the facility through Outfalls 001 & 002 shall, at a minimum, meet the final limits as set forth below:
Table 19: Outfall 001 and 002 – Final Effluent Limits
Parameter Units
Effluent Limitations
Maximum Daily Limit
Average Monthly Limit
Both Outfall 001 & 002
Biochemical Oxygen Demand (BOD5) mg/L 45 30 lb/day 6,996 (1) 3,674 (1)
Total Suspended Solids (TSS) lb/day 6,996 (1) 3,674 (1) Fecal Coliform Bacteria MPN/100mL 400 -- E. coli Bacteria, summer (2) #/100 mL -- 126 pH s.u. 6.0 – 9.0 Temperature ° F 77.0 Oil & Grease mg/L 10 -- Total Residual Chlorine (TRC), net (3) µg/L 19 11 Nitrate plus Nitrite as N mg/L 10 -- Total Nitrogen, as N (TN) (4) mg/L -- 1.3 Total Phosphorus, as P (TP) (4) mg/L -- 0.15

Fact Sheet Permit No. MT0000281 July 2019 Page 40 of 48
Table 19: Outfall 001 and 002 – Final Effluent Limits
Parameter Units
Effluent Limitations
Maximum Daily Limit
Average Monthly Limit
Outfall 001 Total Ammonia as N – Outfall 001 mg/L 4.4 2.9 Outfall 002 Total Ammonia as N – Outfall 002 mg/L 2.9 1.4
Footnotes: (1) TSS and BOD5 load limits are the sum total of daily loads from all outfalls (surface water
Outfalls 001 & 002 and ground water Outfalls 004 - 007). (2) E. coli limit applicable only during the summer, defined as April 1 through October 31. (3) Nutrient limits (TN and TP) applicable during July 1 – September 30th. (4) WSC must use an approved method under 40 CFR 136 and follow the method’s
procedure for determining interference. For instance, Standard Methods 4500-Cl G, DPD Colorimetric Method includes a method for analyzing for manganese and other oxidizer interferes and removing the interference to calculate the net TRC concentration.
There shall be no discharge which causes a visible oil sheen in the receiving stream.
There shall be no acute toxicity in the effluent.
Beginning {58 months after the permit effective date}, and lasting through the term of the permit, the quality of effluent discharged by the facility through Outfalls 004 - 007 shall, at a minimum, meet the final limits as set forth below:
Table 20: Outfall 004 - Outfall 007 Final Effluent Limits
Parameter Unit Average Monthly Limit
Biochemical Oxygen Demand (BOD5) lb/day 3,674 (1) Total Suspended Solids (TSS) lb/day 3,674 (1) Temperature ° F 90 pH s.u. 6.0 - 9.0 Fecal Coliform MPN/100 mL 400 Specific Conductance µS/cm 2,500
Footnote: (1) TSS and BOD5 load limits are the sum total of loads from all outfalls (surface water
Outfalls 001 & 002 and ground water Outfalls 004 - 007).
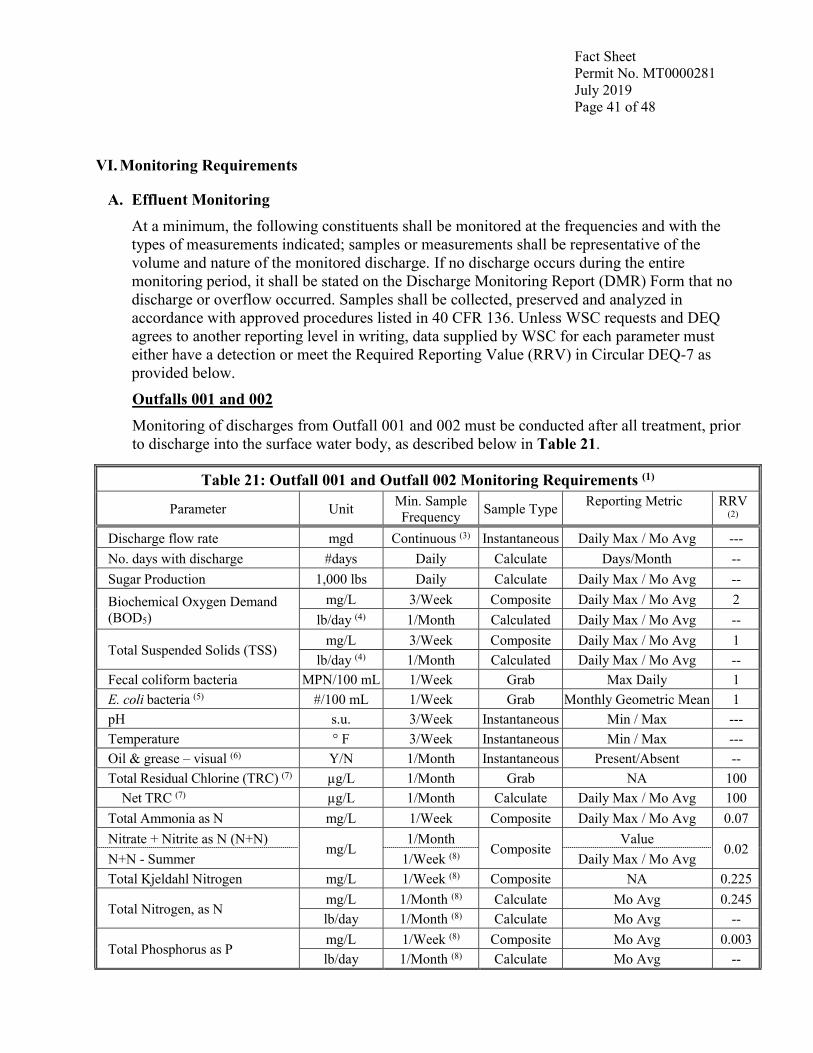
Fact Sheet Permit No. MT0000281 July 2019 Page 41 of 48
VI. Monitoring Requirements
A. Effluent Monitoring At a minimum, the following constituents shall be monitored at the frequencies and with the types of measurements indicated; samples or measurements shall be representative of the volume and nature of the monitored discharge. If no discharge occurs during the entire monitoring period, it shall be stated on the Discharge Monitoring Report (DMR) Form that no discharge or overflow occurred. Samples shall be collected, preserved and analyzed in accordance with approved procedures listed in 40 CFR 136. Unless WSC requests and DEQ agrees to another reporting level in writing, data supplied by WSC for each parameter must either have a detection or meet the Required Reporting Value (RRV) in Circular DEQ-7 as provided below.
Outfalls 001 and 002 Monitoring of discharges from Outfall 001 and 002 must be conducted after all treatment, prior to discharge into the surface water body, as described below in Table 21.
Table 21: Outfall 001 and Outfall 002 Monitoring Requirements (1)
Parameter Unit Min. Sample Frequency Sample Type Reporting Metric RRV
(2)
Discharge flow rate mgd Continuous (3) Instantaneous Daily Max / Mo Avg --- No. days with discharge #days Daily Calculate Days/Month -- Sugar Production 1,000 lbs Daily Calculate Daily Max / Mo Avg -- Biochemical Oxygen Demand (BOD5)
mg/L 3/Week Composite Daily Max / Mo Avg 2 lb/day (4) 1/Month Calculated Daily Max / Mo Avg --
Total Suspended Solids (TSS) mg/L 3/Week Composite Daily Max / Mo Avg 1
lb/day (4) 1/Month Calculated Daily Max / Mo Avg -- Fecal coliform bacteria MPN/100 mL 1/Week Grab Max Daily 1 E. coli bacteria (5) #/100 mL 1/Week Grab Monthly Geometric Mean 1 pH s.u. 3/Week Instantaneous Min / Max --- Temperature ° F 3/Week Instantaneous Min / Max --- Oil & grease – visual (6) Y/N 1/Month Instantaneous Present/Absent -- Total Residual Chlorine (TRC) (7) µg/L 1/Month Grab NA 100 Net TRC (7) µg/L 1/Month Calculate Daily Max / Mo Avg 100 Total Ammonia as N mg/L 1/Week Composite Daily Max / Mo Avg 0.07 Nitrate + Nitrite as N (N+N)
mg/L 1/Month
Composite Value
0.02 N+N - Summer 1/Week (8) Daily Max / Mo Avg Total Kjeldahl Nitrogen mg/L 1/Week (8) Composite NA 0.225
Total Nitrogen, as N mg/L 1/Month (8) Calculate Mo Avg 0.245 lb/day 1/Month (8) Calculate Mo Avg --
Total Phosphorus as P mg/L 1/Week (8) Composite Mo Avg 0.003 lb/day 1/Month (8) Calculate Mo Avg --

Fact Sheet Permit No. MT0000281 July 2019 Page 42 of 48
Table 21: Outfall 001 and Outfall 002 Monitoring Requirements (1)
Parameter Unit Min. Sample Frequency Sample Type Reporting Metric RRV
(2)
Arsenic, Total Recoverable (TR) μg/L 1/Month Composite Value 1 Iron, TR μg/L 1/Month Composite Value 20 Lead, TR μg/L 1/Month Composite Value 0.3 Mercury, TR μg/L 1/Month Composite Value Value Selenium, TR μg/L 1/Month Composite Value 1 Aluminum, Dissolved μg/L Semi-Annual Composite Value 9 Antimony, TR μg/L Semi-Annual Composite Value 0.5 Barium, TR μg/L Semi-Annual Composite Value 3 Beryllium, TR μg/L Semi-Annual Composite Value 0.8 Cadmium, TR μg/L Semi-Annual Composite Value 0.03 Chromium, TR μg/L Semi-Annual Composite Value 10 Copper, TR μg/L Semi-Annual Composite Value 2 Nickel, TR μg/L Semi-Annual Composite Value 2 Thallium, TR μg/L Semi-Annual Composite Value 0.2 Zinc, TR μg/L Semi-Annual Composite Value 8 Fluoride mg/L Semi-Annual Composite Value 0.2 Sulfate mg/L Semi-Annual Composite Value 100 Chloride mg/L Semi-Annual Composite Value 1 Hardness (as CaCO3) mg/L Semi-Annual Composite Value 10 Specific Conductivity µS/cm Semi-Annual Instantaneous Value -- Whole Effluent Toxicity, Acute % Effluent 1/Quarter (9) Composite Pass/Fail --
Footnotes: (1) See Definition section at end of permit for explanation of terms. Monitoring is required for any period that has a discharge. (2) Based on Circular DEQ-7 or DEQ-12A. For any results with nondetect, the analysis must achieve these, or lower, reporting
limits. Flow must be measured +/- 10% of actual discharge rates. (3) Requires recording device or totalizer; for flow, permittee shall report maximum daily and average monthly flow rates on DMR. (4) Each outfalls’ daily load is calculated by the discharge flow rate (mgd) x discharge concentration (mg/L) x 8.34. Daily loads
from all outfalls shall be added together to demonstrate compliance with the facility-wide load based limits. (5) Effluent monitoring for E. coli is only required for discharges during the summer season (April 1 through October 31). Report
geometric mean if more than one sample is collected during the reporting period. (6) Oil & Grease visual monitoring – a grab sample must be taken and analyzed in conformance with 40 CFR 136 whenever there
are visual signs of oil and grease in the effluent. (7) It is known that manganese and other oxidizers can interfere and cause elevated TRC readings. In order to account for this,
monthly correlated samples must be taken in accordance with Standard Methods 4500-Cl G or other applicable method in order to document the net TRC concentration. Demonstration of nondetect at the RRV or below for the net TRC concentration is a demonstration of compliance with the limits.
(8) Total Nitrogen is calculated as the sum of TKN and N+N. Monitoring for nutrients is weekly during the applicable nutrient criteria period of July 1 – September 30th. Monitoring for N+N for the non-nutrient season is monthly.
(9) Quarterly two-species acute WET tests are required in conformance with the Permit. After passing four consecutive WET tests, WSC can request to decrease to semi-annual two-species test.
Facility-wide TBEL-SUM
WSC is required to calculate the average and maximum of the BOD5 and TSS daily loads for each outfall and report the sum to demonstrate compliance with the facility-wide load-based limits (see Table 21):
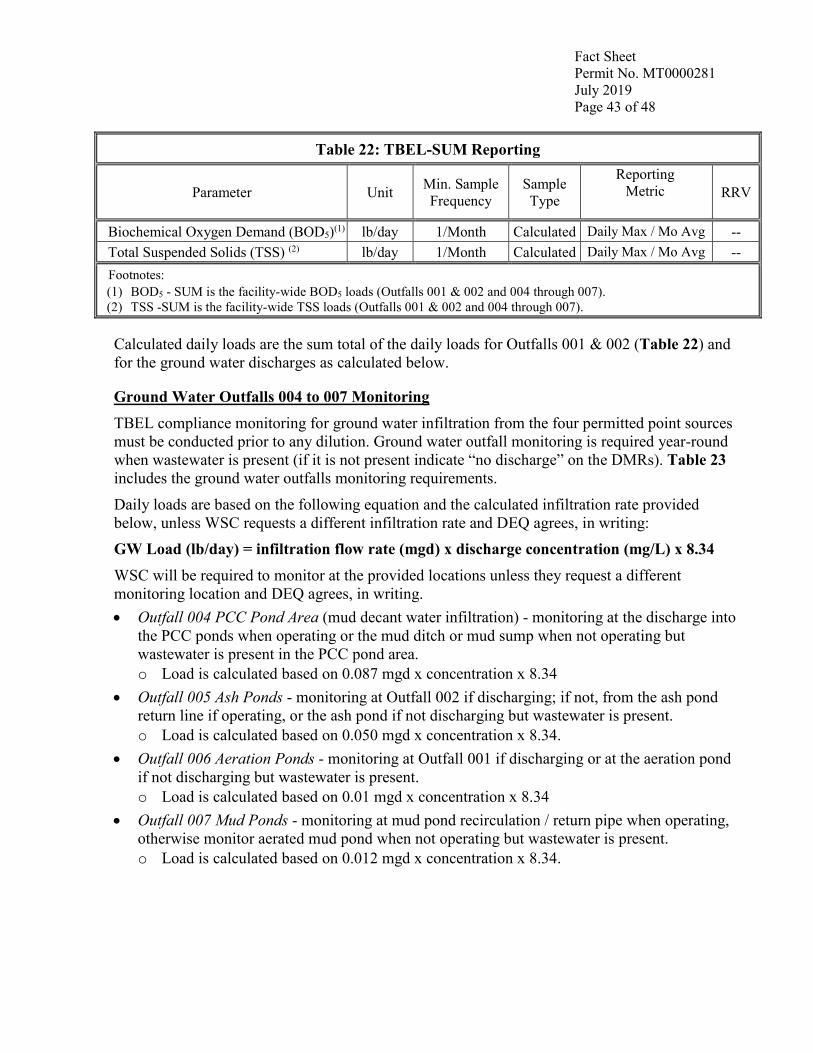
Fact Sheet Permit No. MT0000281 July 2019 Page 43 of 48
Table 22: TBEL-SUM Reporting
Parameter Unit Min. Sample Frequency
Sample Type
Reporting Metric RRV
Biochemical Oxygen Demand (BOD5)(1) lb/day 1/Month Calculated Daily Max / Mo Avg -- Total Suspended Solids (TSS) (2) lb/day 1/Month Calculated Daily Max / Mo Avg -- Footnotes: (1) BOD5 - SUM is the facility-wide BOD5 loads (Outfalls 001 & 002 and 004 through 007). (2) TSS -SUM is the facility-wide TSS loads (Outfalls 001 & 002 and 004 through 007).
Calculated daily loads are the sum total of the daily loads for Outfalls 001 & 002 (Table 22) and for the ground water discharges as calculated below.
Ground Water Outfalls 004 to 007 Monitoring TBEL compliance monitoring for ground water infiltration from the four permitted point sources must be conducted prior to any dilution. Ground water outfall monitoring is required year-round when wastewater is present (if it is not present indicate “no discharge” on the DMRs). Table 23 includes the ground water outfalls monitoring requirements.
Daily loads are based on the following equation and the calculated infiltration rate provided below, unless WSC requests a different infiltration rate and DEQ agrees, in writing: GW Load (lb/day) = infiltration flow rate (mgd) x discharge concentration (mg/L) x 8.34 WSC will be required to monitor at the provided locations unless they request a different monitoring location and DEQ agrees, in writing. • Outfall 004 PCC Pond Area (mud decant water infiltration) - monitoring at the discharge into
the PCC ponds when operating or the mud ditch or mud sump when not operating but wastewater is present in the PCC pond area. o Load is calculated based on 0.087 mgd x concentration x 8.34
• Outfall 005 Ash Ponds - monitoring at Outfall 002 if discharging; if not, from the ash pond return line if operating, or the ash pond if not discharging but wastewater is present. o Load is calculated based on 0.050 mgd x concentration x 8.34.
• Outfall 006 Aeration Ponds - monitoring at Outfall 001 if discharging or at the aeration pond if not discharging but wastewater is present. o Load is calculated based on 0.01 mgd x concentration x 8.34
• Outfall 007 Mud Ponds - monitoring at mud pond recirculation / return pipe when operating, otherwise monitor aerated mud pond when not operating but wastewater is present. o Load is calculated based on 0.012 mgd x concentration x 8.34.

Fact Sheet Permit No. MT0000281 July 2019 Page 44 of 48
Table 23: Monitoring for Discharges from Ground Water Outfalls (1)
Parameter Unit Minimum Sample
Frequency Sample Type RRV
Biochemical Oxygen Demand (BOD5) mg/L 1/Month Grab 2
lb/day (2) 1/Month Calculated --
Total Suspended Solids (TSS) mg/L 1/Month Grab 1
lb/day (2) 1/Month Calculated -- Temperature ° F 1/Month Instantaneous --- pH s.u. 1/Month Instantaneous --- Fecal coliform bacteria MPN/100 mL 1/Month Grab 1 Specific Conductivity µS/cm Quarterly Instantaneous -- Ammonia, Total as N [Outfall 004, 006, and 007] mg/L Quarterly Grab 0.07
Arsenic, Dissolved µg/L Quarterly Grab 1 Iron, Dissolved µg/L Quarterly Grab 20 Selenium, Dissolved µg/L Quarterly Grab 1 Fluoride mg/L Semi-Annual Grab 0.2 Sulfate mg/L Semi-Annual Grab 100 Nitrate + Nitrite mg/L Semi-Annual Grab 0.02 Footnote: (1) These ground water monitoring requirements are for Outfalls 004 through 007 unless otherwise described above, and apply year-round if there is water infiltration. During months when wastewater is present in a pond but WSC is not actively contributing wastewater into the pond, monitoring is required for all TBEL parameters except fecal coliform. (2) BOD5 and TSS loads calculated based on the calculated infiltration rate x pollutant concentration x 8.34, as shown above. These daily loads are included in facility-wide daily load calculations to demonstrate compliance with these load-based TBELs.
Ground Water Property Boundary Monitoring Additional monitoring at the property boundary will be required to ensure that ground water standards are protected outside the property boundary. Unless other monitoring wells are requested and approved by DEQ in writing, WSC shall conduct ground water monitoring at: MW-4, MW-5, MW-6, and MW-9, as presented in Table 24:
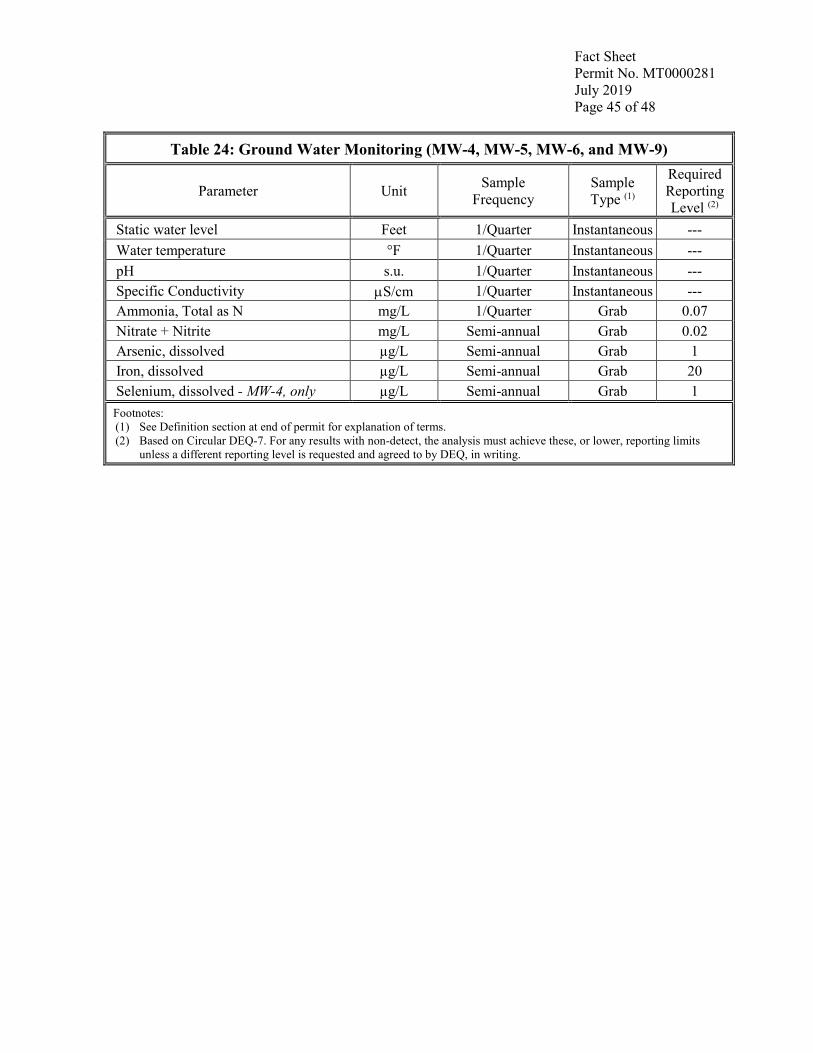
Fact Sheet Permit No. MT0000281 July 2019 Page 45 of 48
Table 24: Ground Water Monitoring (MW-4, MW-5, MW-6, and MW-9)
Parameter Unit Sample Frequency
Sample Type (1)
Required Reporting Level (2)
Static water level Feet 1/Quarter Instantaneous --- Water temperature °F 1/Quarter Instantaneous --- pH s.u. 1/Quarter Instantaneous --- Specific Conductivity µS/cm 1/Quarter Instantaneous --- Ammonia, Total as N mg/L 1/Quarter Grab 0.07 Nitrate + Nitrite mg/L Semi-annual Grab 0.02 Arsenic, dissolved µg/L Semi-annual Grab 1 Iron, dissolved µg/L Semi-annual Grab 20 Selenium, dissolved - MW-4, only µg/L Semi-annual Grab 1
Footnotes: (1) See Definition section at end of permit for explanation of terms. (2) Based on Circular DEQ-7. For any results with non-detect, the analysis must achieve these, or lower, reporting limits
unless a different reporting level is requested and agreed to by DEQ, in writing.

Fact Sheet Permit No. MT0000281 July 2019 Page 46 of 48
VII. Special Conditions/Compliance Schedule
A. Special Conditions: 1. Strategy Implementation for Reducing Discharges of Pollutants of Concern
WSC identified water use and pollutant reduction as part of their overall facility compliance strategy, which would include reduction in metals. WSC shall submit by {12 months of the effective date of this permit} a comprehensive strategy to ensure reductions in discharge of all pollutants of concern. This strategy shall include a commitment to complete specific projects within specific deadlines. WSC is encouraged to meet with DEQ to discuss the submittal.
WSC uses over three mgd of raw water from the Yellowstone River and has an average surface water discharge rate of approximately 3.5 mgd (with spikes up to 5.5 mgd). Examples of considerations to be included in this water and pollutant reduction study are:
• Dry ash handling. • Dry boiler stack air pollution control or switch to a recirculated water supply for
the boiler scrubber. • Additional cooling tower capacity. • Recirculated water for the gas scrubbers. • Initial dry handling of beets to remove dirt and debris prior to the cleaning steps. • Alternate clarifier underflow (collected mud solids) handling. • Discharge of some wastewater streams to the City of Billings municipal
wastewater system for treatment. • Waste management improvements.
If any projects are proposed, WSC must complete construction and/or fully implement such projects by {48-months of the effective date of this permit}.
Table 25: Special Conditions Due Dates
Action Scheduled Completion Date of Action Report Due Date
Facility-wide Water and Pollutant Reduction Strategy Plan for implementing water & pollutant reduction, if any
12 months after effective Date of Permit
14 days after Completion Date
Complete Projects 48 months after effective Date of Permit
14 days after Completion Date
Annual Report Annual January 28th until completion

Fact Sheet Permit No. MT0000281 July 2019 Page 47 of 48
B. Compliance Schedule WSC cannot currently meet the new effluent limits for ground water specific conductance and surface water ammonia and seasonal total nitrogen (TN) and total phosphorus (TP) limits. WSC is an old plant with an average surface water discharge rate of approximately 3.5 mgd (with spikes up to 5.5 mgd); any treatment technology will be large-scale and capital-intensive. WSC needs time to evaluate options, complete engineering designs, assemble the capital, and procure the equipment and contractors. DEQ proposes that 58 months is an appropriate timeframe to complete the steps and achieve the final limits.
Therefore, WSC shall meet these new effluent limits by {58 months from the effective date of the permit} in accordance with the following schedule:
• By {12 months after the effective date of this permit}, WSC shall submit the proposed actions the facility commits to take to ensure compliance with new limits possibly including: water and pollutant reduction strategies; discharge of specific wastewater streams to the City of Billings municipal wastewater treatment system; installation of appropriate wastewater treatment technologies including lining of the treatment ponds; coverage under the nutrient variance for TN and/or TP, if available; and/or requesting defensible mixing zones..
• By {48 months after the effective date of the permit}, WSC shall complete construction of all projects.
• By {58 months after the effective date of the permit}, WSC shall comply with the new limits.
WSC shall submit an annual report documenting what progress has been made during the previous year and what actions are planned for the upcoming year by January 28th of each year until WSC complies with these limits.
Table 26: Compliance Schedule
Action Frequency Scheduled Completion Date of Action (1)
Report Due Date (2)
Submit proposed actions for compliance once 12 months after effective
Date of Permit 14 days after
Completion Date
Complete construction once 48 months after effective Date of Permit
14 days after Completion Date
Comply with limits once 58 months after effective Date of Permit
14 days after Completion Date
Annual Report Annually until January 2024 January 28th January 28th
Footnotes: NA = Not Applicable (1) The actions must be completed on or before the scheduled completion dates. (2) This notification must be received by the DEQ on or before the scheduled due date.

Fact Sheet Permit No. MT0000281 July 2019 Page 48 of 48
VIII. Information Source
Code of Federal Regulations at 40 CFR, Parts 122, 133, 136, and 409. Montana Water Quality Act, Title 75-5-101, et sec, Montana Code Annotated (MCA). Administrative Rule of Montana (ARM) at:
• Subchapter 5: Mixing Zones in Surface and Ground Water • Subchapter 6: Montana Surface Water Quality Standards • Subchapter 7: Nondegradation of Water Quality • Subchapter 10: Montana Ground water Pollution Control System • Subchapters 12 and 13: Montana Pollutant Discharge Elimination System
(MPDES). DEQ. Circular DEQ-7 Montana Numeric Water Quality Standards. May 2017. DEQ. Circular DEQ-12A Montana Base Numeric Nutrient Standards, July 2014. DEQ. Translation and Guidance on Application of the Montana Narrative Water Quality Criterion for Sulfate,” September 2014. EPA. Development Document for Effluent Limitations Guidelines and Standards of Performance for New Sources – Beet Sugar Processing Subcategory of the Sugar Processing Point Source Category. EPA-440/1-74/002-b. January 1974. EPA. Steam Electric Power Generating Point Source Category: Final Detailed Study Report, EPA 821-R-09-008, October 2009. https://www.epa.gov/sites/production/files/2015-06/documents/steam-electric_detailed_study_report_2009.pdf EPA. NPDES Permit Writers Manual. 2010. EPA. Technical Support Document for Water Quality-Based Toxics Control (TSD), EPA/505/2-30-001. March 1991. Western Sugar Cooperative, MPDES Permit MT0000281 Administrative Record: • 2014 MPDES permit renewal application, including 2018 & 2019 updates • 2009-issued permit • Historic ground water studies WHO (World Health Organization). Guidelines for Drinking-water quality, 4th edition, 2017. Chapter 10 Acceptability aspects: Taste, odour and appearance. Accessed November 27, 2018 at https://www.who.int/water_sanitation_health/publications/gdwq4-with-add1-chap10.pdf?ua=1
Prepared by: Christine Weaver Date: July 2019