department of labor: 02-03-204-03-390
TRANSCRIPT

8/14/2019 Department of Labor: 02-03-204-03-390
http://slidepdf.com/reader/full/department-of-labor-02-03-204-03-390 1/48
AUDIT OF SERVICES PROVIDED
AND OUTCOMES OBTAINED
FOR PARTICIPANTS ENROLLED IN THE
WIA DISLOCATED WORKERS PROGRAM
DURING PY 2000
U.S. DEPARTMENT OF LABOROFFICE OF INSPECTOR GENERAL
REPORT NO: 02-03-204-03-390ISSUE DATE: SEPTEMBER 30, 2003

8/14/2019 Department of Labor: 02-03-204-03-390
http://slidepdf.com/reader/full/department-of-labor-02-03-204-03-390 2/48
TABLE OF CONTENTS
ACRONYMS ................................................................................................................................... i
EXECUTIVE SUMMARY............................................................................................................. 1
INTRODUCTION
BACKGROUND..................................................................................................................... 5
AUDIT OBJECTIVE............................................................................................................. .6
AUDIT SCOPE AND METHODOLOGY ............................................................................. 7
FINDINGS AND RECOMMENDATIONS
I. WAS THERE SUFFICIENT EVIDENCE TO SUPPORT PARTICIPANTELIGIBILITY? ................................................................................................................... 9
II. WHAT OUTCOMES WERE OBTAINED AND WAS THERE A RELATIONSHIPBETWEEN TRAINING AND OUTCOMES?..................................................................... 13
III. WHAT DO WE KNOW ABOUT PARTICIPANTS THAT DID NOT EXIT
THE PROGRAM?................................................................................................................ 20
IV. WERE PARTICIPANTS SATISFIED WITH THE PROGRAM? ...................................... 24
V. IS CREDENTIAL ATTAINMENT A MEANINGFULPERFORMANCE MEASURE? ........................................................................................... 31
VI. WHAT WAS THE PARTICIPANT PROFILE? .................................................................. 33
APPENDICES:
APPENDIX A – GLOSSARY .............................................................................................. 37
APPENDIX B – PARTICIPANT PROFILE STATISTICS................................................. 40
APPENDIX C – ETA’S RESPONSE TO DRAFT REPORT ............................................. 42

8/14/2019 Department of Labor: 02-03-204-03-390
http://slidepdf.com/reader/full/department-of-labor-02-03-204-03-390 3/48
-i-
ACRONYMS
BLS Bureau of Labor Statistics
CFR Code of Federal Regulations
ETA Employment and Training Administration
JTPA Job Training Partnership Act
OIG Office of Inspector General
PY Program Year
TEGL Training and Employment Guidance Letter
UI Unemployment Insurance
WIA Workforce Investment Act of 1998

8/14/2019 Department of Labor: 02-03-204-03-390
http://slidepdf.com/reader/full/department-of-labor-02-03-204-03-390 4/48
1
EXECUTIVE SUMMARY
This report summarizes the results of a nationwide audit of 360 participants enrolled in theWorkforce Investment Act of 1998 (WIA) Dislocated Worker program during Program Year
(PY) 2000. PY 2000 was the first year of WIA operation and was considered a transition yearfrom the Job Training Partnership Act (JTPA) program. The audit provides a snapshot of individuals served, services provided, program performance and participant satisfaction.
Overall, participants obtained employment, retained a large percentage of their layoff earnings,kept their post-layoff jobs, and were satisfied with most of the services provided. Nevertheless,additional focus is needed to ensure the program serves only eligible individuals, participantsreturn to the workforce as quickly as possible, and reported outcomes are complete andmeaningful. Also, participants were not as positive about the program as they were under JTPA,nor about job finding assistance, which is a primary function of WIA.
KEY FINDINGS
Was There Sufficient Evidence To Support Participant Eligibility? (Finding I)
WIA Title 1, Subtitle A, Section 101(9) stipulates that a dislocated worker is in-part defined asan individual “unlikely to return to a previous industry or occupation.” While sufficientevidence existed documenting other required criteria for eligibility, one-stop career centers wereunable to demonstrate that participants were unlikely to return to their previous industries oroccupations. Documentation to fulfill this eligibility requirement was not present in 65 percentof the participant files we sampled. In evaluating participants with outcomes, 42 percent of those
who were not profiled by the Unemployment Insurance (UI) program and 53 percent of thosewho were profiled by the UI program, did in fact, return to their previous industries oroccupations. As a result, the program may be serving individuals it was not intended to serveunder WIA. This issue was identified in a prior OIG report on the Dislocated Worker programunder JTPA.
We recommend that ETA provide additional guidance, or ensure that states and localboards develop guidance, regarding documentation of the likelihood a participant will returnto a previous industry or occupation.
What Outcomes Were Obtained? (Finding II)
On the whole, sample participants obtained employment, earned a large portion of their layoff wage, and retained their jobs for at least six months. Using the official performance measures of the program, which were only based on participants who exited the program, the OIG auditsample met ETA’s performance levels regarding the entered employment rate, job retention rate,and earnings replacement rate.
To present a more comprehensive picture of the status of all sampled participants, wesupplemented the official performance measures with an analysis of the employment status at

8/14/2019 Department of Labor: 02-03-204-03-390
http://slidepdf.com/reader/full/department-of-labor-02-03-204-03-390 5/48
2
various points in time for all participants in the sample regardless of their exit status. At anypoint between 12 and 18 months after registering in the program or being laid off, two thirds of participants were employed, which is lower than the reported entered employment rate of nearly80 percent. The lower rate resulted because one out of every four participants was still enrolledin the program at the end of audit fieldwork and, therefore, unaccounted for in official
performance measures.Participants Employed Since Layoff and Registration
66%65% 65%
67% 66%67%
60%
62%
64%
66%
68%
70%
12 15 18
Months Since Layoff and Registration
P e r e c n t E m p l o y e d
Layoff
Registration
We recommend that, to more fully represent outcomes obtained by individuals irrespectiveof their enrollment status, ETA require the states to supplement their Annual Reports,mandated by WIA Section 136(d), with information on all participants’ employment statusat a designated point following registration.
What Do We Know About Participants That Did Not Exit The Program? (Finding III)
One out of every four sampled participants were still enrolled in the program as of the end of audit fieldwork. These participants had exhausted their unemployment compensation and spent
an average of at least 514 days in the program with some participants exceeding 700 days in theprogram. In contrast, participants who exited spent an average of 236 days in the program.Total time from layoff to the end of audit fieldwork for non-exiters was 629 days, whereas thetotal time from layoff to exit for exiters was 336 days.
Time After Layoff
100 236
115 514
0 100 200 300 400 500 600 700
Non-Exiters
Exiters
Days from Layoff to Registration Days in Program
Twelve non-exiters were still enrolled in training. However, some non-exiters had found jobspaying wages that ranged from 65 percent to over 100 percent of their layoff wages. Non-exiterswho completed training received minimal assistance and spent an average of 245 days in theprogram after completing training. Possible reasons for one-stop career centers not exitingparticipants include the lack of clear exit definition and guidance, and human error in not

8/14/2019 Department of Labor: 02-03-204-03-390
http://slidepdf.com/reader/full/department-of-labor-02-03-204-03-390 6/48
3
terminating individuals who were no longer receiving services. As a result, non-exiters fall shortof achieving the Secretary’s goal of quickly returning the unemployed to the workforce, andremain unaccounted for in the official performance measures.
We recommend that ETA clarify the exit definition, conduct a study of participants
enrolled in the program for over one year to determine why participants were in theprogram for an extended period, and explore the possibility for one-stop career centers toprovide intensive job services to these participants to facilitate their exit from theprogram.
Were Participants Satisfied With The Program And Reemployment? (Finding IV)
In response to our survey approximately half of the participants responded that they wereextremely or quite satisfied with the program, training, and employment. Of respondents whoreceived training, 60 percent answered that the program was extremely or quite helpful, whileonly 28 percent of respondents who did not receive training answered that the program was
extremely or quite helpful.
We also benchmarked responses in this against those obtained in our PY 1991 dislocated workeraudit. Generally, there was a greater percentage of positive comments concerning program staff (65 percent), resources (69 percent), and training (71 percent), but only 39 percent of commentswere positive regarding job-finding assistance, which is the primary function of the DislocatedWorker program. Responses in this audit regarding participant satisfaction with the program andthe current job were not as positive as in the PY 1991 dislocated worker audit, yet satisfactionwith training to obtain employment was higher in the current audit.
65% 56%69%
59%51%
58%47% 55%
0%
20%
40%
60%
80%
100%
Helpful
Overall
Current job Current vs.
Layoff Job
Training for
Employment
Customer Satisfaction: PY 1991 vs. PY 2000 PY 1991
PY 2000
We recommend that ETA examine and address why participants are relatively less satisfied
with job search assistance, which plays a key role in successful reemployment.

8/14/2019 Department of Labor: 02-03-204-03-390
http://slidepdf.com/reader/full/department-of-labor-02-03-204-03-390 7/48
4
This report also contains additional findings and recommendations addressing the need toprovide a uniform definition for credential attainment, which should entail more than merelycompleting any training course (Finding V) and participant profile in terms of services providedand time spent in the program (Finding VI).
AGENCY’S RESPONSE
The Assistant Secretary for Employment and Training responded to the draft report onSeptember 30, 2003. The response did not address recommendations but included specificlanguage to provide context and clarity to the report. These language changes were consideredand included where appropriate.
Excerpts of ETA’s response to the draft report have been incorporated into appropriate sectionsof the report with our comments. The response is included in its entirety in Appendix C.

8/14/2019 Department of Labor: 02-03-204-03-390
http://slidepdf.com/reader/full/department-of-labor-02-03-204-03-390 8/48
5
INTRODUCTION
BACKGROUND
Public Law 105-220, the Workforce Investment Act of 1998, reformed Federal job trainingprograms and created a new, comprehensive workforce investment system. The reformedsystem is customer-focused: helping individuals access information through high qualityservices, providing tools needed to manage their careers, and helping businesses find skilledworkers. WIA repealed the Job Training Partnership Act and required that states implementworkforce investment systems, effective July 1, 2000. PY 2000 was the first year of WIAoperation and was considered a transition year from the JTPA program which preceded it.
The purpose of Title I of WIA is to provide workforce investment activities that increase
participant employment, retention, earnings, and occupational skill attainment, which willimprove the quality of the workforce, reduce welfare dependency, and enhance the productivityand competitiveness of the Nation’s economy.
Title I-B, Chapter 5 of WIA requires the Secretary of Labor to make allotments to each state forthe purpose of providing workforce investment activities for dislocated workers. For FiscalYears 1999 through 2003, appropriations for each year ranged from $1.4 to $1.6 billion.
1,200
1,300
1,400
1,5001,600
1,700
1999 2000 2001 2002 2003
Fiscal Year
D o l l a r s i n M i l l i o n s
The Dislocated Worker program serves individuals who have been terminated or laid off, certainself-employed individuals who are no longer working, and displaced homemakers. TheDislocated Worker program provides a variety of core, intensive and training employmentservices primarily through one-stop career centers. Core services include job-search and job-placement assistance and useful labor market information. Intensive services include careercounseling, and a comprehensive assessment of an individual employment plan for dislocatedworkers who are unable to find jobs through core services. Training services are linked tooccupations that are in demand in the local area. In addition, a participant can receive supportiveservices, such as transportation and needs-related payments. These services, which are funded

8/14/2019 Department of Labor: 02-03-204-03-390
http://slidepdf.com/reader/full/department-of-labor-02-03-204-03-390 9/48
6
by grants awarded to states on the basis of need, are intended to help dislocated workers reenterthe workforce, with benefits, and develop a more secure future.
WIA established and defined four performance measures for the Dislocated Worker program:entered employment, retention, earnings replacement, and employment and credential. Reported
and targeted performance measures for PY 2000 are shown below:
Performance Measure
Reported
Performance Targeted
Entered Employment Rate 76% 71%
Retention Rate 86% 82%
Earnings Replacement Rate 102% 90%
Employment and Credential Rate 41% 47%
AUDIT OBJECTIVE
The audit objective was to determine what services were provided and what outcomes wereobtained, at any point, for sampled participants. The subobjectives were to determine thefollowing:
• Was there sufficient evidence to support participant eligibility?
• What outcomes were obtained, and was there a relationship between training andoutcomes?
•
What do we know about participants that did not exit the program?
• Were participants satisfied with the program and reemployment?
• Is credential attainment a meaningful performance measure of the program?
• What was the profile of the sampled PY 2000 enrolled participant in terms of servicesreceived and time spent in the program?

8/14/2019 Department of Labor: 02-03-204-03-390
http://slidepdf.com/reader/full/department-of-labor-02-03-204-03-390 10/48
7
AUDIT SCOPE AND
METHODOLOGY
The audit was performed using a sample of 360 participants enrolled in the Dislocated Workerprogram during PY 2000, which covers July 1, 2000 through June 30, 2001. We judgmentallyselected 12 one-stop career centers to audit. States were selected to represent the variousgeographic sections of the continental United States and cities were selected to include a mix of large, medium, and small cities based on population size. At each one-stop career center, westatistically selected 30 participants. JTPA participant carryovers were excluded from theuniverse of dislocated participants.
State Location City Size One-Stop Career CenterConnecticut Northeast New Haven Small Connecticut Works New HavenMaine Northeast Portland Small CareerCenter PortlandNew York Northeast New York Large QueensGeorgia Southeast Atlanta Medium Career Resource Center- NorcrossSouth Carolina Southeast Spartanburg Small Spartanburg Technical CollegeIllinois Midwest Evanston Small Evanston Employment and TrainingMichigan Midwest Detroit Medium Detroit Work Place SouthMissouri Midwest Kansas City Medium Full Employment Council – Kansas CityTexas Southwest San Antonio Large Texas Workforce Center – Hillcrest DriveWashington Northwest Seattle Medium WorkSource RentonCalifornia West Los Angles Large Marina Del Rey-Mar VistaColorado West Littleton Small Arapahoe/Douglas Works Littleton
We reviewed participant files to determine if there was adequate documentation to support
eligibility, e.g., eligibility for unemployment benefits, notice of mass layoffs or plant closing,and the likelihood of returning to one’s prior industry or occupation. In cases where UI profilingwas used to establish eligibility, we examined profiling methodology to ensure that itincorporated factors relating to the likelihood of returning to one’s prior occupation or industry.
We also reviewed participant files to obtain data on services received, layoff employment, andoutcomes obtained. To determine the types of services received we used Attachment E of Training and Employment Guidance Letter 14-00, which capture core, intensive, and trainingservices for Workforce Investment Act Standardized Record Data. We did not attempt todetermine whether a participant was most in need of training or supportive services. Wedetermined the time span in which a service was provided; however, the number of days thatservices were actually received could vary greatly within that time span; thus, the actual numberof days a service was received could not be determined.
We obtained UI wage information1 from January 1999 through June 2002, to review data onlayoff employers and outcomes. We did not audit UI wages to determine accuracy orcompleteness. We did not obtain UI wages for participants who obtained employment out of state. Further, we excluded quarterly wages less than $1,000 from our analyses.
1 Self-employed individuals, the Federal government, and other entities do not report wage information to the states.

8/14/2019 Department of Labor: 02-03-204-03-390
http://slidepdf.com/reader/full/department-of-labor-02-03-204-03-390 11/48
8
We sent questionnaires to each sampled participant to verify specific information and determinethe participant’s level of satisfaction with services received and outcomes obtained. If we did not receive a response, we followed up with a second request and attempted to contact theparticipant by telephone. Sixty-one percent of participants responded to our questionnaire. Wecompared the results of this audit with OIG Audit Report Number 02-95-232-03-340 entitled
Audit of JTPA Title III Retraining Services for PY 1991, dated March 31,1995, which had similarcustomer satisfaction questions.
We did not test internal controls at one-stop career centers. We did consider guidance providedby ETA, states, and local boards as it relates to eligibility, services provided, and outcomes. Ouraudit was limited to documentation supporting eligibility, services provided, and outcomesobtained for sampled participants. Therefore, we do not provide any assurances over the internalcontrols of the program or operators.
Grantee management is responsible for ensuring compliance with laws, regulations, and grantagreement provisions. We did not perform tests of compliance to evaluate if the grantees were
meeting the requirements of the grants except for participant eligibility under WIA Title I,Subtitle A, Section 101(9). Our objective was not to provide an opinion on overall compliancewith such provisions, and accordingly, we do not express such an opinion.
We conducted our audits in accordance with Government Auditing Standards, issued by theComptroller General of the United States, and included such tests, as we considered necessary tosatisfy the objectives of the audit. We conducted audit fieldwork from May 14, 2002 throughOctober 25, 2002. We held exit conferences with one-stop career center management, issuedStatement of Facts to each center, and solicited their comments. The individual on-site dateswere as follows:
State One-Stop Career Center
Start
Date
End
DateCalifornia Marina Del Rey-Mar Vista 7/9/02 7/17/02Colorado Arapahoe/Douglas Works Littleton 7/15/02 7/29/02Connecticut Connecticut Works New Haven 5/14/02 5/31/02Georgia Career Resource Center- Norcross 10/21/02 10/25/02Illinois Evanston Employment and Training 8/19/02 8/23/02Maine CareerCenter Portland 10/7/02 10/10/02Michigan Detroit Work Place South 8/19/02 8/23/02Missouri Full Employment Council – Kansas City 10/7/02 10/10/02New York Queens 9/16/02 9/20/02South Carolina Spartanburg Technical College 8/19/02 8/23/02Texas Texas Workforce Center – Hillcrest Drive 7/8/02 7/16/02Washington WorkSource Renton 7/15/02 7/26/02

8/14/2019 Department of Labor: 02-03-204-03-390
http://slidepdf.com/reader/full/department-of-labor-02-03-204-03-390 12/48
9
FINDINGS AND RECOMMENDATIONS
I. WAS THERE SUFFICIENT EVIDENCE TO SUPPORT PARTICIPANT
ELIGIBILITY?
WIA Title I, Subtitle A, Section 101(9) defines category one dislocated workers, as follows:
The term “dislocated worker” means an individual who-- (A)(i) has beenterminated or laid off, or who has received a notice of termination or layoff, fromemployment; (ii)(I) is eligible for or has exhausted entitlement to unemploymentcompensation; or (II) has been employed for a duration sufficient to demonstrate,to the appropriate entity at a one-stop center referred to in section 134(c),attachment to the workforce, but is not eligible for unemployment compensationdue to insufficient earnings or having performed services for an employer that
were not covered under a State unemployment compensation law; and (iii) isunlikely to return to a previous industry or occupation. [Emphasis added.]
While sufficient evidence existed documenting that participants were laid-off, received a noticeof termination from employment, or were eligible for unemployment compensation, one-stopcareer centers were unable to demonstrate that participants were unlikely to return to theirprevious industries or occupations for category one participants, which comprised 83 percent of our sample, as depicted in Figure 1.1 below. The primary cause for this condition was the lack of state and local board guidance on documentation needed by one-stop operators to establishthat a participant was unlikely to return to his or her previous industry or occupation. As a result,the program may be serving individuals it was not intended to serve under WIA. This issue was
also reported in an OIG audit report2
, which addressed the dislocated workers program underJTPA.
2 The Dislocated Worker program in a Growing Economy, OIG Audit Report Number 04-00-002-03-340, datedJune 29, 2000

8/14/2019 Department of Labor: 02-03-204-03-390
http://slidepdf.com/reader/full/department-of-labor-02-03-204-03-390 13/48
10
F i g u r e 1 . 1 - D i s t r ib u t i o n o f P a r t i c i p a n t E l i g i b i l ty
C a t e g o r y t h r e e
S e l f - E m p l o y e d
2 ( 1 % )
C a t e g o r y f o u r
D i s p l a c e d
H o m e m a k e r
1 1 ( 3% )
C a t e g o r y o n e
T e r m i n a t e d o r
L a i d O f f
3 0 0 ( 8 3% )
C a t e g o r y t w o
P l a n t C l o s u r e
4 7 ( 1 3% )
Documentation was not present in 65 percent or 195 participant files to establish that categoryone participants were unlikely to return to their previous industries or occupations. In addition,we found that many participants, who were deemed unlikely to return to their prior industries oroccupations, did, in fact, return to their previous industries or occupations, or were trained inskills related to their prior jobs. Of 196 participants with outcomes who were not UI profiled, wefound that:
!"34 percent or 67 participants returned to the same industries or occupations as at the timeof their layoffs, and
!"8 percent or 15 participants were recalled to their layoff employer.
While we recognize that no system can forecast every individual’s employment future with 100percent accuracy, we would still expect the incidence of an individual returning to his or heroccupation after screening for eligibility would be significantly lower than 42 percent. Wewould also expect that participants would be trained in new fields if they were deemed unlikelyto return to their prior occupations.
Moreover, of 175 category one participants who received training, 29 percent or 51 participantsreceived training related to their layoff occupation. In addition, 34 of the 51 participants whoreceived training related to their layoff occupation, also returned to their prior industries oroccupations.3
According to CFR Section 663.115 (b), governors and local boards may establish policies andprocedures for one-stop operators to use to determine an individual’s eligibility as a dislocatedworker. However, state and local boards did not provide additional guidance to 9 of the 12 one-stop career centers selected for audit regarding the documentation needed to establish whether aparticipant was unlikely to return to his or her previous industry or occupation. Without
3 Of the 34 participants who returned to their prior industries or occupations, the one-stop operators did not havedocumentation to establish that 22 participants were unlikely to return to previous industries or occupations.

8/14/2019 Department of Labor: 02-03-204-03-390
http://slidepdf.com/reader/full/department-of-labor-02-03-204-03-390 14/48
11
sufficient guidance, one-stop career centers used their own discretion to document this aspect of participant eligibility. As a result, documentation in participant files ranged from outdatedoccupational supply and demand data to forms checked by counselors merely stating that anoccupation or industry was in decline, neither of which adequately documented the “unlikely toreturn” provision.
Three one-stop operators utilized UI profiling to assist counselors in determining eligibility for77 participants. The purpose of UI profiling is to predict the probability of an individualexperiencing prolonged unemployment. UI profiling is allowed as long as the policies andprocedures established by governors and local boards are consistent with the definition of WIASection 101(9). In such instances, no further documentation is needed to establish the unlikely toreturn criteria. However, even profiled participants returned to their previous industries oroccupations, or were trained in skills related to their prior jobs. Of 60 participants with outcomeswho were UI profiled, we found that:
!"48 percent or 29 participants returned to the same industries or occupations as at the time
of their layoffs, and
!"Five percent or three participants were recalled to their layoff employer.
Further, of the 33 profiled participants who received training, 36 percent or 12 participantsreceived training related to their layoff occupation. In addition, 7 of the 12 participants whoreceived training related to their layoff occupation, also returned to their prior industries oroccupations.
Recommendations
We recommend that the Assistant Secretary for Employment and Training:
• Provide additional guidance or ensure that states and local boards develop guidance toaddress the documentation needed to establish that a participant is unlikely to return tohis or her previous industry or occupation; and
• Evaluate the effectiveness of UI profiling in identifying participants unlikely to return totheir prior industries or occupations; or
• Evaluate the need for the provision requiring that a participant be “unlikely to return to aprevious industry or occupation.”

8/14/2019 Department of Labor: 02-03-204-03-390
http://slidepdf.com/reader/full/department-of-labor-02-03-204-03-390 15/48
12
Agency’s Response
In its response to the draft report, ETA suggested some editorial changes to provide context andclarity to the report. These changes were considered and included where appropriate.
OIG’s Comments
ETA’s response did not address our recommendations; consequently, these recommendations areconsidered to be unresolved.
8/14/2019 Department of Labor: 02-03-204-03-390
http://slidepdf.com/reader/full/department-of-labor-02-03-204-03-390 16/48
13
II. WHAT OUTCOMES WERE OBTAINED AND WAS THERE A
RELATIONSHIP BETWEEN TRAINING AND OUTCOMES?
WIA Title I, Subtitle B, Section 106 states:
The purpose of this subtitle is to provide workforce investment activities, throughstatewide and local workforce investment systems, that increase the employment,retention, and earnings of participants, and increase occupational skill attainmentby participants, and, as a result, improve the quality of the workforce. . . .
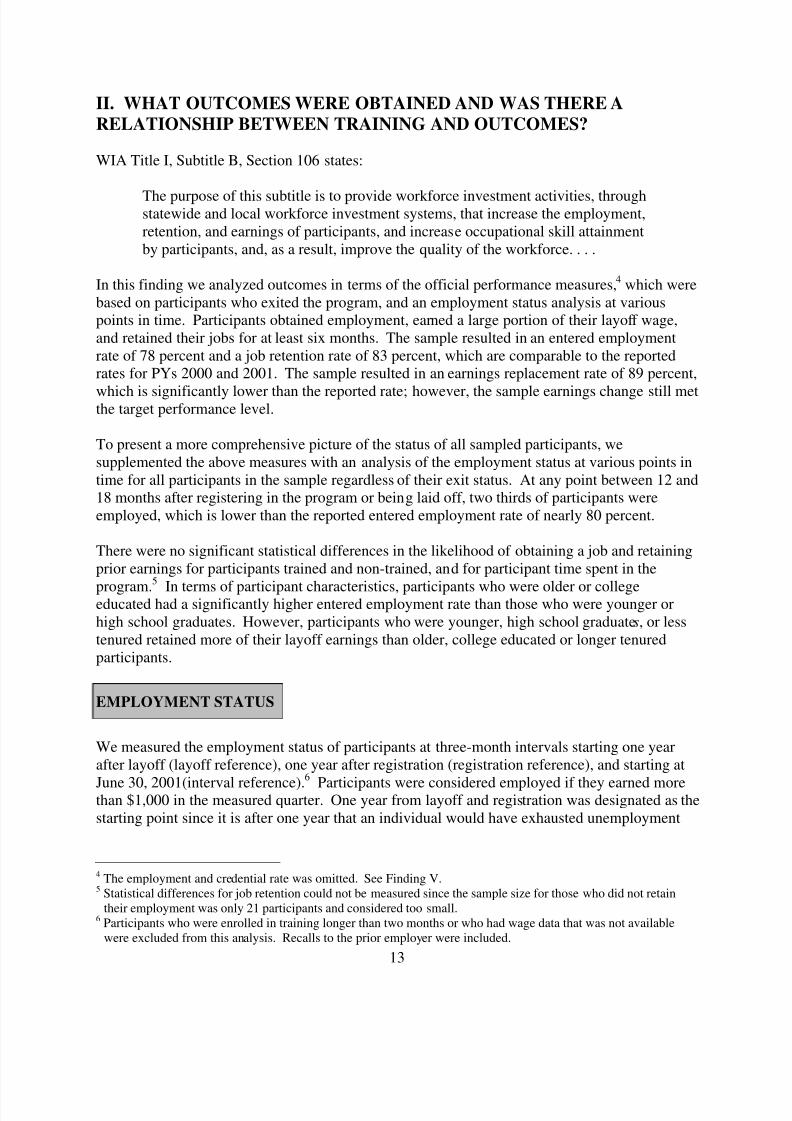
In this finding we analyzed outcomes in terms of the official performance measures,4 which werebased on participants who exited the program, and an employment status analysis at variouspoints in time. Participants obtained employment, earned a large portion of their layoff wage,and retained their jobs for at least six months. The sample resulted in an entered employmentrate of 78 percent and a job retention rate of 83 percent, which are comparable to the reportedrates for PYs 2000 and 2001. The sample resulted in an earnings replacement rate of 89 percent,
which is significantly lower than the reported rate; however, the sample earnings change still metthe target performance level.
To present a more comprehensive picture of the status of all sampled participants, wesupplemented the above measures with an analysis of the employment status at various points intime for all participants in the sample regardless of their exit status. At any point between 12 and18 months after registering in the program or being laid off, two thirds of participants wereemployed, which is lower than the reported entered employment rate of nearly 80 percent.
There were no significant statistical differences in the likelihood of obtaining a job and retainingprior earnings for participants trained and non-trained, and for participant time spent in the
program.5
In terms of participant characteristics, participants who were older or collegeeducated had a significantly higher entered employment rate than those who were younger orhigh school graduates. However, participants who were younger, high school graduates, or lesstenured retained more of their layoff earnings than older, college educated or longer tenuredparticipants.
EMPLOYMENT STATUS
We measured the employment status of participants at three-month intervals starting one yearafter layoff (layoff reference), one year after registration (registration reference), and starting at
June 30, 2001(interval reference).6
Participants were considered employed if they earned morethan $1,000 in the measured quarter. One year from layoff and registration was designated as thestarting point since it is after one year that an individual would have exhausted unemployment
4 The employment and credential rate was omitted. See Finding V.5 Statistical differences for job retention could not be measured since the sample size for those who did not retain
their employment was only 21 participants and considered too small.6 Participants who were enrolled in training longer than two months or who had wage data that was not available
were excluded from this analysis. Recalls to the prior employer were included.

8/14/2019 Department of Labor: 02-03-204-03-390
http://slidepdf.com/reader/full/department-of-labor-02-03-204-03-390 17/48
14
insurance benefits. Under the interval approach, employment is measured at the same point intime for all participants.
The employment status at a given point in time provides a more complete representation of program accomplishment since it accounts for most participants. The official performance
measures only account for exiters. For example, one year after registration, a total of 91 percent
7
of the sample is included in the employment status analysis, whereas ETA reported on 64 percentof the enrolled universe for PY 2000, and excluded participants who received services for up totwo years.
Generally, at any measured point in time after registration or layoff, two thirds of participantswere employed, as shown below in Figure 2.1. Similar results are shown for the interval method,as shown in Figure 2.2. The Bureau of Labor Statistics (BLS) reported that 64 percent of theworkers displaced between January 1999 and December 2001 were employed when surveyed inJanuary 2002.8 The BLS study provides a measure of comparison to assess the validity of sample analysis and gauge program performance even though the BLS study covered a different
time frame.
Figure 2.1 - Participants Employed Since Layoff and Registration
66% 65% 65%67% 66%67%
50%
55%
60%
65%
70%
75%
80%
12 15 18
Months Since Layoff and Registration
P e r
c e n t E m p l o y e d
Layoff
Registration
7 Remaining 9 percent were in training or wage data was unavailable.8 Bureau of Labor Statistics’ Worker Displacement, 1999-2001 Report, dated August 21, 2002.

8/14/2019 Department of Labor: 02-03-204-03-390
http://slidepdf.com/reader/full/department-of-labor-02-03-204-03-390 18/48
15
Figure 2.2 – Interval Reference9
61%
68%
73%
66%65%
50%
55%
60%
65%
70%
75%
80%
2/2001 3/2001 4/2001 1/2002 2/2002
Quarter
P e r c e n t E m p l o y e d
ENTERED
EMPLOYMENT RATE
The sample resulted in an entered employment rate of 78 percent. This result is comparable toreported entered employment rates of 76 percent and 79 percent for PYs 2000 and 2001,respectively.
There were no significant differences whether a participant entered employment by the firstquarter after exit based on training, time in program, gender, and tenure at layoff employment.
However, participants who were older or college educated had a significantly higher enteredemployment rate than those who were younger or high school graduates. College educatedparticipants had an entered employment rate of 83 percent compared to 71 percent for highschool graduates with no college education. Further, there was a substantial difference amongparticipants of different age groups. As participants got older, the entered employment ratesincreased as shown in Figure 2.3.
9 Fourth quarter 2001 results appear to be seasonal upward spike in employment since quarterly wages beforeand/or after were negligible.

8/14/2019 Department of Labor: 02-03-204-03-390
http://slidepdf.com/reader/full/department-of-labor-02-03-204-03-390 19/48
16
Figure 2.3 - Entered Employment Rates By Age
66%
73%81%
85%
0%
10%
20%
30%
40%
50%
60%
70%
80%
90%
100%
<= 30 31 to 40 41 to 50 > 50
AGE
EARNINGS CHANGE
The sample resulted in an earnings replacement rate of 89 percent or an average decrease inquarterly wages of $915. This is significantly lower than the reported earnings replacement rateof 102 percent or an average increase in quarterly wages of $2,596 for PY 2000. InPY 2001, ETA reported an earnings replacement rate of 101 percent. However, the sampleearnings change still met the official target.
For analytical purposes, we also compared the first quarter wages prior to layoff with first
quarter wages after exit.10 The earnings replacement rate was 86 percent for this analysis. Of those reemployed, 35 percent earned more in their new jobs compared to what they had earnedfrom their layoff employers. There were significant differences in earnings change foreducation, age, and tenure at layoff employment. Participants who were high school graduateswith no college education, who were younger, or had lay off tenure of less than three years,retained most of their layoff earnings. Training, time in program and gender had insignificanteffects on earnings change.
Education
College educated participants earned more than high school graduates prior to the program.
However, participants who finished high school retained a larger percentage of their layoff wages than college educated participants. While high school graduates retained 98 percent of their wages, college educated participants retained 82 percent of their layoff wages.
10 We used first quarter prior to dislocation wages and first quarter after exit wages to ensure sufficient sample sizeswithin sub-sample cohorts.

8/14/2019 Department of Labor: 02-03-204-03-390
http://slidepdf.com/reader/full/department-of-labor-02-03-204-03-390 20/48
17
Earnings Change by Education Level
WagesHigh SchoolGraduates College Educated
First Quarter Prior to Dislocation $6,485 $10,421First Quarter After Exit $6,379 $8,517Earnings Replacement 98% 82%
Similarly, training was more beneficial to less-educated participants. Trained participants whofinished high school had an increase in wages after exit. High school graduates without anycollege credits earned 103 percent of their prior dislocation wage while trained participants withcollege education retained 77 percent of their prior dislocation wages.
Trained Participant Earnings Change by Education Level
Wages
High SchoolGraduates
With Training College Educated
With TrainingFirst Quarter Prior to Dislocation $6,210 $10,908First Quarter After Exit $6,380 $8,418
Earnings Replacement 103% 77%
Age
Earnings replacement rates steadily declined, as participants got older. The rates dropped from93 percent for participants aged 31 to 40, to 76 percent for participants over 50 years old.
Figure 2.4 - Earnings Replacement By Age Groups
7,790
9,393 9,344
7,1427,2188,108
93% 86% 76%0
2,000
4,000
6,000
8,000
10,000
31 to 40 41 to 50 Over 50
Age
Q u a r t e r l y W a g e s
Layoff Wage
Exit Wage
Percent Retained
Tenure at Layoff Employment
Although average layoff quarterly wages for participants with tenure at layoff employment of less than three years and three years or more were approximately the same, earnings replacementrates were substantially different. Participants with a tenure at layoff employment of less thanthree years retained 95 percent of their layoff wages while participants with tenure at layoff employment of three years or more retained 77 percent of their layoff wage.

8/14/2019 Department of Labor: 02-03-204-03-390
http://slidepdf.com/reader/full/department-of-labor-02-03-204-03-390 21/48
18
JOB RETENTION RATE
The sample resulted in a job retention rate of 83 percent, which is comparable to the reportedrates of 86 percent and 87 percent for PYs 2000 and 2001, respectively. Of the 124 participants
who earned first quarter wages after exiting the program, only 21 participants did not retainemployment at the third quarter after exit.11 Although the sample size of participants who didnot retain jobs was too small to analyze for statistical differences, we observed that they wereyounger, less educated, or had less training than participants who kept their jobs.
Recommendations
We recommend that the Assistant Secretary for Employment and Training:
• More fully represent outcomes obtained by individuals irrespective of their enrollmentstatus by requiring the states to supplement their Annual Reports, mandated by WIA
Section 136(d), with information on all participants’ employment status at a designatedpoint following registration.
• Explore methods to target and provide additional intensive services to those cohortswho were less successful in returning to the workforce and retaining their layoff wages.
Agency’s Response
“Regarding finding II on outcomes, we believe that both the Executive Summaryand the body of the report as currently worded improperly stray from and exceed
the specific audit sub-objective which was “What Outcomes Were Obtained inTerms of the Program’s Official Performance Measures Regarding EnteredEmployment, Earnings Change and Job Retention?” [emphasis added] Wesuggest that the finding read simply that:
All outcomes specified by official program performance standards
under the law were met.
“The reviewers are most certainly entitled to the opinion that official WIAperformance measures can be improved and on the ways by which that might beaccomplished, but judging on the adequacy of the measures was not part of the
objective of the review as stated by the IG itself (see quote and emphasis addedabove). If the report must contain such an opinion, it should be clearly identifiedas an opinion about the need to change official program measures and should notbe included in a finding or in recommendation to address the finding. Given theobjective of the audit, we believe that it is rather unfair to claim as a finding that
11 Participants who exited prior to fourth quarter 2001 were used to ensure sufficient wage data was available tocalculate job retention.

8/14/2019 Department of Labor: 02-03-204-03-390
http://slidepdf.com/reader/full/department-of-labor-02-03-204-03-390 22/48
19
“by limiting performance measures to exited participants, the reported enteredemployment rate is incomplete and misleading.”
“Again, to be clear about our concern, we suggest that the opinion does notbelong in the report at all, given the stated objectives. But if included, it should
be clearly identified as an opinion outside the scope of the report objectives.”
OIG’s Comments
The employment status analysis supplements the audit subobjective, which was to determineoutcomes obtained for sampled participants. Furthermore, the overall objective was to accountfor all 360 sampled participants in terms of outcomes obtained and services received. Consistentwith both objectives, the employment status analysis accounts for all participants, provides amore complete picture of outcomes, and adds necessary context to the official performancemeasures that focus only on exited participants.
ETA’s response did not address our recommendations; consequently, the recommendations areconsidered to be unresolved.

8/14/2019 Department of Labor: 02-03-204-03-390
http://slidepdf.com/reader/full/department-of-labor-02-03-204-03-390 23/48
20
III. WHAT DO WE KNOW ABOUT PARTICIPANTS THAT DID NOT
EXIT THE PROGRAM?
One of the Secretary’s goals is to help the unemployed return quickly to the workforce so they
can be productive members of society.
One out of every four sampled participants (86 of 360) was still enrolled in the program by theend of audit fieldwork. These participants had exhausted their unemployment compensation andspent an average of at least 514 days in the program with some participants exceeding 700 daysin the program. Some of these participants who remained in the program had found jobs. Non-exiters who completed training received minimal assistance and spent an average of 245 days inthe program after completing training. Possible reasons for one-stop career centers not exitingparticipants include the lack of clear exit definition and guidance, and human error in notterminating individuals who were no longer receiving services. As a result, non-exiters fall shortof achieving the Secretary’s goal of quickly returning the unemployed to the workforce, and
remain unaccounted for in the official performance measures.
PROFILE
A total of 86 participants were still enrolled in the program by the end of our audit fieldwork.Twelve non-exiters were still enrolled in training. Generally, non-exited participants were lesseducated than exited participants. Non-exiters had a larger percentage of individuals who onlycompleted high school, but had a smaller percentage of post-secondary education as compared toexiters.
As one would expect, there was a substantial difference in time spent in the program betweenparticipants who were still in the program as compared to those that exited the program. Allparticipants who did not exit the program were enrolled in the program more than a year.Whether a participant received training or not, non-exiters spent, on average, twice as long in theprogram as compared to exiters. On average, each non-exiter spent at least 514 days in theprogram, with a low of 393 days and a high of 725 days.12 In contrast, participants who exitedspent an average of 236 days in the program. Total time from layoff to the end of auditfieldwork for non-exiters was 629 days, whereas the total time from layoff to exit for exiters was336 days. Figure 3.1 illustrates the disparity of time after layoff between exiters and non-exiters.
12 For non-exiters, we computed length of time in the program as of the last day of audit fieldwork.

8/14/2019 Department of Labor: 02-03-204-03-390
http://slidepdf.com/reader/full/department-of-labor-02-03-204-03-390 24/48
21
Figure 3.1 - Time After Layoff
514
100
115
236
0 100 200 300 400 500 600 700
Non-Exiters
Exiters
Days
Dislocation date to registration Time in program
As illustrated in Figure 3.2, trained non-exiters averaged twice as long in each aspect of theprogram as compared to trained exiters, even though it took both groups three months to register
in the program after dislocation. Total time from layoff to the end of audit fieldwork for non-exiters was 656 days, whereas the total time for exiters was 341 days.
Figure 3.2 - Trained Participants Time After Layoff
93
90
63
36
255
124
245
91
0 100 200 300 400 500 600 700
Non-Exiters
Exiters
Dislocation Date to Registration Core/Intensive Services
Training Post Training - Includes Core and Intensive
341 Da s
656 Days
336 days
629 da s

8/14/2019 Department of Labor: 02-03-204-03-390
http://slidepdf.com/reader/full/department-of-labor-02-03-204-03-390 25/48
22
SOME NON-EXITERS
WERE EMPLOYED
Some non-exiters had jobs. Of the 86 non-exiters, 51 participants were paid quarterly wageswhile participating in the program. Fifteen participants were paid wages that ranged from 65percent to over 100 percent of their layoff wages. Thirty-six participants received wages, butthese wages were significantly less than their layoff wages and varied greatly from quarter toquarter.
SERVICES PROVIDED
AFTER TRAINING
Of the 86 non-exiters, 63 attended a training service. Of the 63 who were trained, 34 participantsfinished training. After completing training, participants only received minimal services, as onlyfive participants received an intensive service. The remaining 29 participants only received acore service. After completing training, participants spent an average time of 245 days in theprogram.
EXIT DEFINITION
There is a need to clarify the point of exit for counting participant outcomes. According to ETAguidance, a participant exit occurs, in part, when the participant’s case is either closed,
completed or a participant leaves the program. When to recognize or under what conditions acase should be closed and completed is not clearly defined; thus, providing one-stop careercenters wide latitude in determining when to exit a participant. Training and EmploymentGuidance Letter (TEGL) No. 7-99 part D states:13
“Point of Exit for Counting Outcomes. For all of the core measures. . .comparability across States is only possible if a single point in time is used tobegin measurement. . . . There are two ways to determine exit during a quarter:
1. a participant who has a date of case closure, completion or known exitfrom WIA-funded or non-WIA funded partner service within the
quarter (hard exit) or
2. a participant who does not receive any WIA-funded or non-WIAfunded partner service for 90 days and is not scheduled for futureservices except follow-up services (soft exit).
. . . . The exit date is the last date of WIA funded or partner service received(except follow-up services). . . .”
13 Similar guidance was also found in TEGL No. 14-00, Change 1, Attachment E

8/14/2019 Department of Labor: 02-03-204-03-390
http://slidepdf.com/reader/full/department-of-labor-02-03-204-03-390 26/48
23
Recommendations
We recommend that the Assistant Secretary for Employment and Training:
• Provide additional guidance and clarify the program’s exit definition to ensure the
consistent application of exit criteria at one-stop career centers.
• Explore the possibility for one-stop career centers to provide intensive job search or otherintensive services to participants enrolled in the program for over a year to facilitate theirexit from the program and return to the workforce.
• Conduct a study of participants enrolled in the program for over one year to determinewhy participants were in the program for an extended period, and what benefits, if any,were obtained.
Agency’s Response
ETA’s response to the draft report did not address this finding or the related recommendations.
OIG’s Comments
ETA’s response did not address our recommendations; consequently, these recommendations areconsidered to be unresolved.

8/14/2019 Department of Labor: 02-03-204-03-390
http://slidepdf.com/reader/full/department-of-labor-02-03-204-03-390 27/48
24
IV. WERE PARTICIPANTS SATISFIED WITH THE PROGRAM?
A measure of success for any program is the opinion participants have of the program and theextent to which they feel the program was helpful. We surveyed sampled participants todetermine the extent that the program and training were helpful, the level of satisfaction with
their current job, and what they liked and disliked about the program. Where possible, wecompared these results with the results of an audit of PY 1991 dislocated workers.14
Approximately half of the participants responded that they were extremely or quite satisfied withthe program, training, and employment. Generally, there were a greater percentage of positivecomments about program staff, resources, and training, but there were a greater percentage of negative comments about job finding assistance, which is a primary function of the DislocatedWorker program. Participants who received training were significantly more positive with theoverall program than those without training. Also, participants over 50 years of age were lesspositive about the program and their current job than those under 50 years of age.
Responses in this audit regarding satisfaction with the program and current job were not aspositive as in the PY 1991 dislocated worker audit, yet, satisfaction with training to obtainemployment was higher in the current audit. 15
65% 56%69%
59%
51%
58%
47% 55%
0%
20%
40%
60%
80%
100%
Helpful Overall Current job Current vs.
Layoff Job
Training for
Employment
PY 1991
PY 2000
14 Audit of JTPA Title III Retraining Services program Year 1991, OIG Audit Report Number 02-95-232-03-340,dated March 31, 1995.
15 In comparing this audit and PY 1991 results, we only included individuals that were trained and exited, since thatwas the population composition of the PY 1991 audit. Percentages in the chart were the extent participants foundthe program extremely or quite helpful, or satisfied with their current job.
Figure 4.1 – Customer Satisfaction: PY 1991 vs. PY 2000

8/14/2019 Department of Labor: 02-03-204-03-390
http://slidepdf.com/reader/full/department-of-labor-02-03-204-03-390 28/48
25
HOW HELPFUL WAS
THE PROGRAM?
We asked participants: “Overall, how helpful was the program to you?” Forty-eight
percent of respondents answered that they thought the program was extremely or quitehelpful.
Quite Helpful
19%
Somewhat
Helpful
34%
Extremely
Helpful
29%Not at All Helpful
18%
There was a significant difference in the response to this question between those whoreceived training and those that did not. Of respondents who received training, 60percent answered that the program was extremely or quite helpful, while only 28 percentof respondents who did not receive training answered that the program was extremely or
quite helpful.
38%
14%
22%
14%
27%
45%
13%
27%
0%
10%
20%
30%
40%
50%
60%
Extremely
Helpful
Quite
Helpful
Somewhat
Helpful
Not at All
Helpful
With Training
Without Training
Figure 4.2 - Satisfaction with Overall Program
Figure 4.3 – Satisfaction with Overall Program: Trained vs. Non-Trained Participants

8/14/2019 Department of Labor: 02-03-204-03-390
http://slidepdf.com/reader/full/department-of-labor-02-03-204-03-390 29/48
26
Participants over 50 years of age were less positive than younger groups when responding thatthe overall program was extremely or quite helpful.
40 years or less 41-50 years old Over 50 years old49% 57% 37%
We also compared the results of this audit with the audit of PY 1991 dislocated workers. Fifty-six percent of respondents who exited and received training answered that the program wasextremely or quite helpful, compared to the 65 percent result reported in the PY 1991 audit.
ASPECTS LIKED AND
DISLIKED ABOUT THE
PROGRAM?
Participants were asked: “What aspect(s) did you like about the program?” and “What aspect(s)did you not like about the program?” Generally, there were a greater percentage of positivecomments regarding resources, staff, and training. Job finding assistance, which is a primaryfunction of this program, was the only category where negative comments exceeded positivecomments. Participant positive and negative responses are summarized below and examples of their comments follow:
Category Positive Negative
Job Finding 39% 61%Resources (computer, fax machines etc.) 69% 31%Staff 65% 35%Training 71% 29%

8/14/2019 Department of Labor: 02-03-204-03-390
http://slidepdf.com/reader/full/department-of-labor-02-03-204-03-390 30/48
27
Category Positive comments Negative comments
Job Finding Job counselors, personal attentionby caseworker. I was made to feel
that they cared about me/my jobsearch. They encouraged me toanswer ads in L.A. Times and that ishow I found my job.
Job search was not helpful. Icould have done the same thing
at home. I could not find a jobin the area in which I wastrained.
Resources(computer, faxmachines etc.)
Full use of expensive equipmentwithout charge (it would cost afortune if used at Kinko’s; etc.). Iam so appreciative of this program.It must never be discontinued!
My one complaint was that the OneStop Career Center was only open oneday past 5:00 pm. Therefore I hadproblems getting there from my part-time jobs.
Staff Ability to talk with
someone. Knowing thatthere was a place to go foradvice.
I kept hearing all these great stories
about getting people great jobs -Nothing ever arose from the workforcecenter. - I got my job on my own - thecounselors were full of great stories, butnever followed through.
Training Just getting the opportunity tochange my career into somethingthat will always be around(Healthcare).
- Once my unemployment ran out, Icouldn’t take classes because I had nomoney to go to school.- Training was too basic and not inenough depth.
HOW HELPFUL WASTRAINING?
We asked participants: “How helpful was the training in teaching you skills that you needed foryour current job?” Forty-nine percent of respondents answered that training was extremely orquite helpful.
Not at All Helpful
18%
Extremely Helpful
23%
Somewhat Helpful
33%
Quite Helpful
26%
Figure 4.4 - How Helpful Training was in Teaching the Skills Needed for Current Job

8/14/2019 Department of Labor: 02-03-204-03-390
http://slidepdf.com/reader/full/department-of-labor-02-03-204-03-390 31/48
28
We also asked participants: “If you received training, how helpful was the training in teachingyou the skills needed for the job you received when exiting the program?” Sixty percent of respondents answered that training was extremely or quite helpful.
Quite Helpful
29%
Somewhat Helpful
31%
Extremely Helpful
31%
Not at All Helpful
9%
When the results of the above two questions were combined, 54 percent of participants who weretrained and exited responded that training was extremely or quite helpful. This comparesfavorably to the 47 percent result reported in the PY 1991 audit for respondents who answered thequestion, “How helpful was the JTPA training in affording skills needed for their job?”
HOW SATISFIED WITHCURRENT JOB?
We asked participants: “Considering all aspects of the job, how satisfied are you with yourcurrent job?” Fifty-six percent of respondents answered that they were extremely or quitesatisfied with their current job.
omewhat Satisfied
23%
Not at All Satisfied
21%
Quite Satisfied
35%
Extremely Satisfied
21%
Figure 4.5 - How Helpful was Training in Teaching the Skills Needed for Job
Figure 4.6 - Satisfaction with Current Job

8/14/2019 Department of Labor: 02-03-204-03-390
http://slidepdf.com/reader/full/department-of-labor-02-03-204-03-390 32/48
29
Fifty-nine percent of respondents who exited and received training answered that they wereextremely or quite satisfied with their current jobs. This compares to the 69 percent resultreported in the PY 1991 audit.
HOW SATISFIED WITH
CURRENT JOB ASCOMPARED TO LAYOFF
JOB?
We asked participants: “All things considered, when comparing your current with your last jobprior to this program, are you much better off, somewhat better off, about the same, not as welloff?”
Forty-nine percent of the respondents, who found employment, answered that they were much orsomewhat better off with their current job compared to their layoff job.
About the Same
20%
Not as Well Off
31%
Somewhat Better
Off
21%
Much Better Off
28%
Participants over 50 years of age were less positive than younger groups when indicating thatthey were much or somewhat better off with their current job as compared to their layoff job.
40 years or less 41-50 years old Over 50 years old53% 55% 40%
Fifty-one percent of respondents who exited and received training felt they were much orsomewhat better off with their current job. This compares to the 58 percent result reported in the
PY 1991 audit.
Recommendation
We recommend that ETA examine and address why participants are relatively less satisfied with job search assistance, which plays a key role in successful reemployment.
Figure 4.7 - Current Job vs. Layoff Job

8/14/2019 Department of Labor: 02-03-204-03-390
http://slidepdf.com/reader/full/department-of-labor-02-03-204-03-390 33/48
30
Agency’s Response
. . . It is important to note that the review looked at participant satisfaction duringthe transition year from JTPA to WIA as the new program was getting off theground and that economy under JTPA in PY 1991 (to which the new WIA
experience is compared) was quite different. Even so, the results of the WIAcustomer satisfaction survey during PY 2000 exceeded the negotiated levels. Theparticipant satisfaction level was 77.9% and the employer level was 70%. Thenegotiated levels were 67.2% and 64.8% respectively.
OIG’s Comments
ETA’s response did not address our recommendation; consequently, the recommendation isconsidered to be unresolved.
8/14/2019 Department of Labor: 02-03-204-03-390
http://slidepdf.com/reader/full/department-of-labor-02-03-204-03-390 34/48
31
V. IS CREDENTIAL ATTAINMENT A MEANINGFUL PERFORMANCE
MEASURE?
Credential attainment is described in 20 CFR 666.100(a)(2)(iv) as follows:
Attainment of a recognized credential related to achievement of educational skills(such as a secondary school diploma or its recognized equivalent), or occupationalskills, by participants who enter unsubsidized employment.
Further guidance in defining credential attainment is contained in the Revised WorkforceInvestment Act Title 1-B Standardized Record Data, dated October 1, 2001, that states:
A credential is defined as any nationally recognized degree or certificate or aState/locally recognized credential. Credentials will include, but are not limitedto a high school diploma, GED or other recognized equivalents, postsecondarydegrees, recognized skills standards, licensure, apprenticeship or industry
recognized certificates. States should include all State Education Agencyrecognized credentials. In addition, States should work with local WorkforceInvestment Boards to encourage certificates to recognize successful completion of the training services listed above that are designed to equip individuals to enter orre-enter employment, retain employment, or advance into better employment.(Underscoring added.)
States compete for incentive money based on their employment and credential rate and otherperformance measures. However, in developing the employment and credential rate, key termsand definitions, which impact reporting, were left to each state’s discretion. Depending on statepolicies, credentials could encompass anything from a two-week word processing course to a
four-year bachelor’s degree. As a result, incentive funds may be awarded to states based on theircredential rates rather than the quality of their accomplishment.
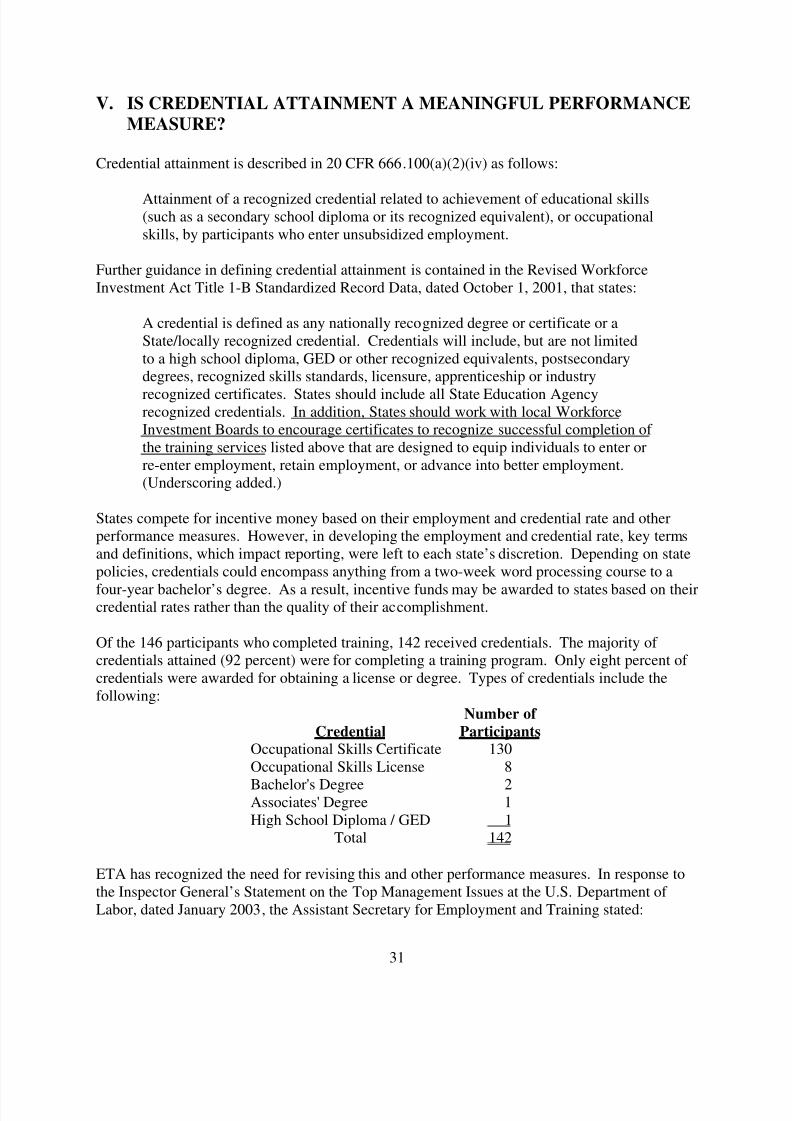
Of the 146 participants who completed training, 142 received credentials. The majority of credentials attained (92 percent) were for completing a training program. Only eight percent of credentials were awarded for obtaining a license or degree. Types of credentials include thefollowing:
Credential
Number of
Participants Occupational Skills Certificate 130Occupational Skills License 8
Bachelor's Degree 2Associates' Degree 1High School Diploma / GED 1
Total 142
ETA has recognized the need for revising this and other performance measures. In response tothe Inspector General’s Statement on the Top Management Issues at the U.S. Department of Labor, dated January 2003, the Assistant Secretary for Employment and Training stated:

8/14/2019 Department of Labor: 02-03-204-03-390
http://slidepdf.com/reader/full/department-of-labor-02-03-204-03-390 35/48
32
DOL and several other Federal agencies are working with the Office of Management and Budget (OMB) to develop a core set of performance measuresthat would apply to all Federally-funded job training programs, including WIATitle I formula programs. Under this proposal, which is scheduled to take effectin FY 2004, the credential attainment measure for adult and dislocated workers
would be eliminated. . . .
Recommendation
If credential attainment continues to be an official performance measure, we recommend that theAssistant Secretary for Employment and Training provide a uniform definition for credentialattainment, which should entail more than merely completing any training course.
Agency’s Response
ETA’s response to the draft report did not address this finding or the related recommendation.
OIG’s Comments
ETA’s response did not address our recommendation; consequently, the recommendation isconsidered to be unresolved.

8/14/2019 Department of Labor: 02-03-204-03-390
http://slidepdf.com/reader/full/department-of-labor-02-03-204-03-390 36/48
33
VI. WHAT WAS THE PARTICIPANT PROFILE?
In this finding, we address services provided to participants and time spent in the program. One-stop operators provided various core, intensive, training, and supportive services. Practically allparticipants received at least one core and intensive service. Fifty-seven percent of participants
received training, and supportive services were provided to only eight percent of participants.
Time spent in the program ranged from a minimum of one day to a maximum of 725 days. Theaverage time in the program was 300 days. The average time in the program was 338 days fortrained participants and 255 days for non-trained participants. Four out of every ten participantswere in the program for over a year. The average time spent in the program for theseparticipants was 492 days and the average time from layoff to exiting the program was 597days.
2
BACKGROUND
INFORMATION
On average, participants were 44 years old, with at least a high school education, worked sixyears for their layoff employer, and earned an average of $8,500 per quarter prior to dislocation.The sample included an equal number of males and females. Trained and non-trainedparticipants were similar in terms of gender, age, education, and layoff wages.
SERVICES PROVIDED
Training
Fifty-seven percent of participants received training. As shown below, occupational skillstraining was provided to 95 percent of trained participants with an average cost of $2,527 perparticipant. Training courses ranged from a two-week word processing class to a four-yearbachelor’s degree. Typical occupational skills training included subjects such as clerical,computer, and truck driving. Computer courses were given to 65 percent of those trained.
2 For non-exiters, we computed length of time in the program as of the last day of audit fieldwork.
Training Types
Number of
Participants Percent
Average Cost
Per Participant
Occupational Skills 194 95 $2,527On-the Job Training 5 3 1,017
Adult Education and Literacy 3 1 NAOther (College Credits) 3 1 3,823205 100
8/14/2019 Department of Labor: 02-03-204-03-390
http://slidepdf.com/reader/full/department-of-labor-02-03-204-03-390 37/48
34
Core and Intensive Services
One-Stop operators provided various core, intensive, and supportive services to dislocatedworkers. Ninety-nine percent of participants received at least one core service and 96 percentreceived at least one intensive service. Of the participants who received an intensive service,
92 percent received an intensive service during the first month of registration. The predominantcore services provided to participants were job search and placement assistance. The primaryintensive services provided were individual counseling and career planning.
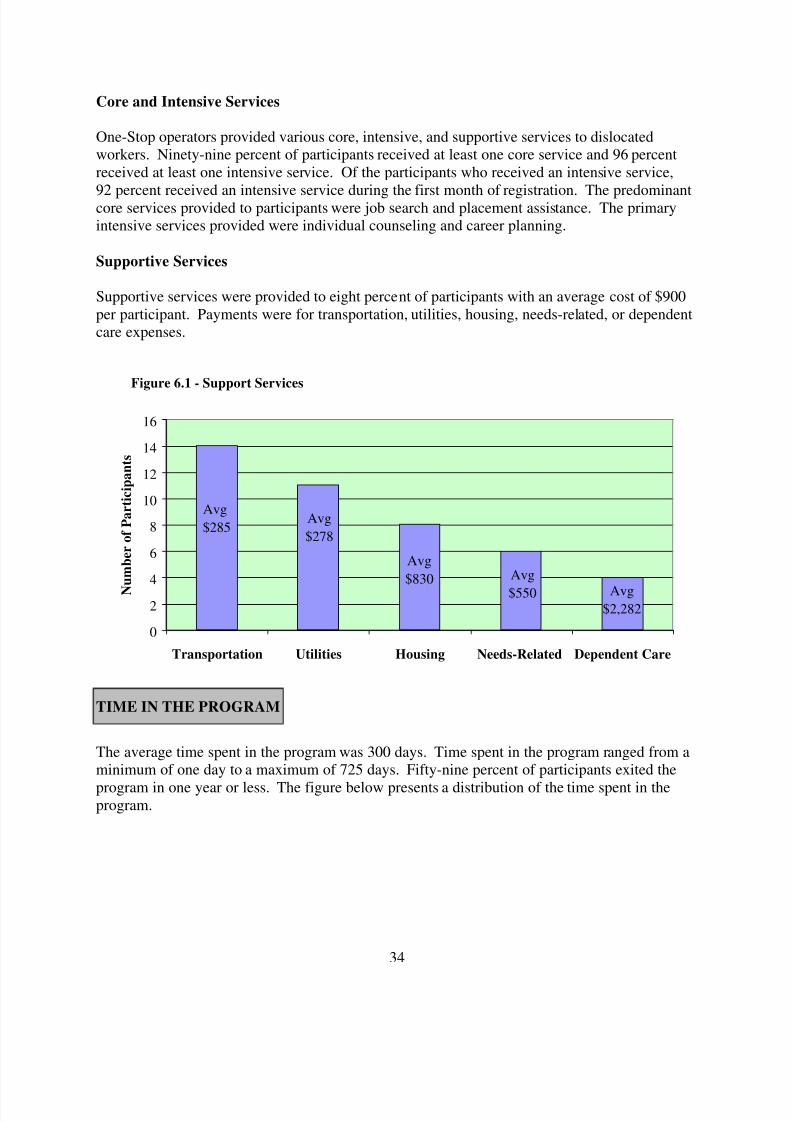
Supportive Services
Supportive services were provided to eight percent of participants with an average cost of $900per participant. Payments were for transportation, utilities, housing, needs-related, or dependentcare expenses.
Figure 6.1 - Support Services
0
2
4
6
8
10
12
14
16
Transportation Utilities Housing Needs-Related Dependent Care
N
u m b e r o f P a r t i c i p a n t s
Avg
$285Avg
$278
Avg
$830 Avg
$550 Avg$2,282
TIME IN THE PROGRAM
The average time spent in the program was 300 days. Time spent in the program ranged from aminimum of one day to a maximum of 725 days. Fifty-nine percent of participants exited the
program in one year or less. The figure below presents a distribution of the time spent in theprogram.

8/14/2019 Department of Labor: 02-03-204-03-390
http://slidepdf.com/reader/full/department-of-labor-02-03-204-03-390 38/48
35
Figure 6.2 - Time In Program
51
71
50
40
56 54
38
0
20
40
60
80
100
Under 3 6 9 12 15 18 Over 18Months in program
N o . o f P a r t i c i p a
n t s
Training and Non-Training
The average time in the program for trained participants was 338 days, including approximatelyone half year in training. Comparatively, non-trained participants spent on average 255 days inthe program, receiving only core and intensive services. The total time from layoff to exiting theprogram was 425 days for trained and 365 days for non-trained participants, as shown below.
Figure 6.3 - Time After Layoff: Trained vs. Non-Trained Participants
110
46
255
172 87 120
0 50 100 150 200
Days250 300 350 400 450
Trained
Non-Trained
Dislocation to Registration Core/Intensive
Training Post Training - Includes Core and Intensive
365 Da s
425 Da s

8/14/2019 Department of Labor: 02-03-204-03-390
http://slidepdf.com/reader/full/department-of-labor-02-03-204-03-390 39/48
36
Participants in program Over a Year
Forty-one percent or 146 participants were in the program for over a year. Of the 146participants, 60 were exiters and 86 were non-exiters. Thirty-five of these participants wereenrolled in a training program and 39 were receiving intensive services at the one-year
benchmark.
In terms of age, gender, education, and layoff wages, there were no statistical differencesbetween participants in the program over and under one year. However, participants in theprogram over a year had more tenure at their layoff employer than participants in the programunder a year.
A distribution of participants in the program over a year is shown below. The average time spentin the program for these participants was 492 days, ranging from 365 days to 724 days. Theaverage time from layoff to exiting the program was 597 days.
Figure 6.4 - Time in Program Greater Than 1 Year
32
19
7
2 0
22
35
22
4 3
0
10
20
30
40
50
366 - 450 450 - 540 540 - 630 630 - 720 Over 720
Days
N o . o f P a r t i c i p a n t s
Exiters
Non-exiters

8/14/2019 Department of Labor: 02-03-204-03-390
http://slidepdf.com/reader/full/department-of-labor-02-03-204-03-390 40/48
37
APPENDIX A
GLOSSARY
Core Service - Core services shall at a minimum include determination of eligibility forprogram, assessment of skill levels, job search placement assistance, job vacancy listings, filingclaims for UI, and follow-up services. Additionally, follow-up services must be made availablefor not less than 12 months after the first day of employment.
Credential - Nationally recognized degree, certificate, or State/locally recognized credential.Credentials include, but are not limited to a high school diploma, GED or other recognizedequivalents, post-secondary degrees/certificates, recognized skill standards, and licensure orindustry-recognized certificates. States should include all State Education Agency recognizedcredentials. In addition, States should work with local Workforce Investment Boards to
encourage certificates to recognize successful completion of training services listed above thatare designed to equip individuals to enter or re-enter employment, retain employment, oradvance into better employment.
Dislocated Worker Categories – To be eligible for the Dislocated Worker program, anindividual must fit into one of the categories below:
Category one - (i) has been terminated or laid off, or who has received a notice of termination or layoff, from employment; (ii)(I) is eligible for or has exhaustedentitlement to unemployment compensation; or (II) has been employed for a durationsufficient to demonstrate, to the appropriate entity at a one-stop center attachment to the
workforce, but is not eligible for unemployment compensation due to insufficientearnings or having performed services for an employer that were not covered under aState unemployment compensation law; and (iii) is unlikely to return to a previousindustry or occupation.
Category two - (i) has been terminated or laid off, or has received a notice of terminationor layoff, from employment as a result of any permanent closure of, or any substantiallayoff at, a plant, facility, or enterprise; (ii) is employed at a facility at which theemployer has made a general announcement that such facility will close within 180 days;or (iii) for purposes of eligibility to receive services other than training services describedin section 134(d)(4), intensive services described in section 134(d)(3), or supportive
services, is employed at a facility at which the employer has made a generalannouncement that such facility will close.
Category three - was self-employed (including employment as a farmer, a rancher, or afisherman) but is unemployed as a result of general economic conditions in thecommunity in which the individual resides or because of natural disasters.
Category four - is a displaced homemaker.

8/14/2019 Department of Labor: 02-03-204-03-390
http://slidepdf.com/reader/full/department-of-labor-02-03-204-03-390 41/48
38
Dislocation Date - The last day of employment at the dislocation job. If there is no date of dislocation, date of registration will be used instead.
Displaced Homemaker - An individual who has been dependent on the income of anotherfamily member but is no longer supported by that income, and is unemployed or underemployed
and is experiencing difficulty in obtaining or upgrading employment.
Earnings Replacement - Of those who are employed in the first quarter after exit: Total post-program earnings (earnings in quarter 2 + quarter 3 after exit) divided by the pre-dislocationearnings (earnings in quarter 2 + quarter 3 prior to dislocation). To ensure comparability of thismeasure on a national level, the UI wage records will be the only data source for this measure.
Employment and Credential Rate - Of those dislocated workers who received trainingservices: Number of dislocated workers who were employed in the first quarter after exit andreceived a credential by the end of the third quarter after exit divided by the number of dislocatedworkers who exited services during the quarter.
Employed in Quarter After Exit Quarter - The individual is considered employed if UI wagerecords for the quarter after exit show earnings. UI Wage records will be the primary data sourcefor tracking employment in the quarter after exit. When supplemental data sources are used,individuals should be counted as employed if, in the calendar quarter after exit, they did anywork at all as paid employees (i.e., received at least some earnings), worked in their ownbusiness, profession, or worked on their own farm.
Entered Employment Rate - Number of dislocated workers who have entered employment bythe end of the first quarter after exit divided by the number of dislocated workers who exit duringthe quarter.
Exit Date - The exit date is the last date of WIA funded or partner service received (exceptfollow-up services). It is used to determine when to count an individual in a specified reportingperiod.
Exiter - Each individual becomes part of an exit cohort, a group who are determined to be“exiters” within a particular quarter and is looked at together for measurement purposes. Thereare two ways to determine exit during a quarter:
1. A participant who has a date of case closure, completion or known exit from WIA-funded or non-WIA funded partner service within the quarter (hard exit) or
2. A participant who does not receive any WIA-funded or non-WIA funded partnerservice for 90 days and is not scheduled for future services except follow-up services(soft exit).
Intensive Service - WIA Section 134(d)(3)(C) states intensive services may include thefollowing: comprehensive and specialized assessment of skill levels, in-depth interviewing andevaluation, development of individual employment plan, group counseling, and short termprevocational services.

8/14/2019 Department of Labor: 02-03-204-03-390
http://slidepdf.com/reader/full/department-of-labor-02-03-204-03-390 42/48
39
Layoff Employer – The last employer the dislocated worker worked for.
Non-Exiter – A participant still enrolled in the Dislocated Worker program as of the end of auditfieldwork.
Retention Rate – Of those who are employed in the first quarter after exit: Number of dislocated workers who are employed in the third quarter after exit divided by the number of dislocated workers who exit during the quarter.
Supportive Service - WIA Section 134(d)(4)(G)(e) 2 states funds allocated to local areas may beused to provide supportive services to dislocated workers who are participating in the program,and are unable to obtain such supportive services through other programs providing suchservices. Supportive services include transportation, utilities, housing assistance, needs relatedor dependent care expenses.
Tenure – Length of time a participant spent working at their layoff employer.
Time in program - Period of time from date participant enrolled and was registered in theDislocated Worker program to exit date. If participant did not exit, by end of audit fieldwork,last day of audit fieldwork was used to calculate time in program.
Training Service - WIA Section 134(d)(4) states training services are to be provided todislocated workers who (1) are unable to obtain or retain employment, (2) are in need of trainingservices to successfully participate in the selected program of training, (3) select training directlylinked to employment opportunities, and (4) who are eligible in accordance with the prioritysystem, if any, in effect. Training services may include occupational skills training, on-the-jobtraining, workplace training, skill upgrading, and entrepreneurial training.

8/14/2019 Department of Labor: 02-03-204-03-390
http://slidepdf.com/reader/full/department-of-labor-02-03-204-03-390 43/48
40
APPENDIX B
PARTICIPANT PROFILE STATISTICS
Gender and Age
Age Males Females Combined Percent
0-20 1 5 6 221-30 22 18 40 1131-40 43 46 89 2541-50 58 64 122 3451-60 40 45 85 23
61-70 8 10 18 5Total 172 188 360 100
Education Level
Education Level Number Percent
Some Grade School 5 1
Completed Grade School 1 0Some High School 24 7High School Diploma 150 42Some College 92 25Bachelor Degree 64 18Post College 24 7
Total 360 100

8/14/2019 Department of Labor: 02-03-204-03-390
http://slidepdf.com/reader/full/department-of-labor-02-03-204-03-390 44/48
41
APPENDIX B CONT’D
Tenure at Layoff Employment
Tenure Number PercentUnder 6 months 45 126 months to 1 year 53 151 year to 3 years 94 26Over 3 years 157 44Displaced Homemaker 11 3
Total 360 100
Layoff Industry
Industry Number PercentService 71 20Manufacturing 53 15Retail 29 8Textiles 24 7Transportation 25 7Hospitals 17 4Finance 17 4Displaced Homemakers 11 3Public Administration 7 2Construction 4 1
Agriculture 2 1Unknown 100 28
Total 360 100
Layoff Occupation
Occupation Number Percent
Technical 115 32Professional 75 21Clerical 48 13
Managerial 41 11Services 31 9Blue Collar 25 7Sales 12 3Displaced Homemaker 11 3Unknown 2 1
Total 360 100

8/14/2019 Department of Labor: 02-03-204-03-390
http://slidepdf.com/reader/full/department-of-labor-02-03-204-03-390 45/48
42
APPENDIX C
ETA’S RESPONSE TO THE DRAFT REPORT

8/14/2019 Department of Labor: 02-03-204-03-390
http://slidepdf.com/reader/full/department-of-labor-02-03-204-03-390 46/48

8/14/2019 Department of Labor: 02-03-204-03-390
http://slidepdf.com/reader/full/department-of-labor-02-03-204-03-390 47/48

8/14/2019 Department of Labor: 02-03-204-03-390
http://slidepdf.com/reader/full/department-of-labor-02-03-204-03-390 48/48