department of labor: 2001pensionplanbulletin
TRANSCRIPT

8/14/2019 Department of Labor: 2001pensionplanbulletin
http://slidepdf.com/reader/full/department-of-labor-2001pensionplanbulletin 1/26
Private Pension Plan Bulletin
Abstract of 2001 Form 5500 Annual Reports
U. S. Department of LaborEmployee Benefits Security
Administration
February 2006

8/14/2019 Department of Labor: 2001pensionplanbulletin
http://slidepdf.com/reader/full/department-of-labor-2001pensionplanbulletin 2/26
TABLE OF CONTENTSHighlights………………………………………………………..1
SECTION A: SUMMARY
Tables
A1 Number of Pension Plans, Total Participants, ActiveParticipants’ Assets, Contributions, and Benefits
by type of plan, 2001..........................................................2
A2 Number of Participants in Pension Plans
by type of plan entity, type of plan, and type of
participant ..........................................................................3
A3 Balance Sheet of Pension Plans
by type of plan, 2001……………………………………..4
A4 Income Statement of Pension Plans
by type of plan, 2001………………………….……….....5
A5 Amount of Assets in Pension Plans
by type of plan and method of funding, 2001…………….6
A6 Collective Bargaining Status of Pension Plans, Participants,
And Assets
by type of plan, 2001….………………………………….7
SECTION B: PLANS AND PARTICIPANTS
Tables
B1. Distribution of Pension Plans
by number of participants, 2001..……………………………..8
B2. Distribution of Pension Plans
by amount of assets, 2001………..……………………………9
B3. Distribution of Pension Plans
by industry, 2001………………….………………………….10
SECTION C: FINANCIAL
Tables
C1. Distribution of Assets
by number of participants, 2001……………………………..11
C2. Distribution of Assets
by asset size, 2001……………………………………………12
C3. Distribution of Assetsby industry, 2001......................................................................13
C4. Balance Sheet of Pension Plans with 100 or More Participants
By type of plan, 2001..........................................................14-15
i

8/14/2019 Department of Labor: 2001pensionplanbulletin
http://slidepdf.com/reader/full/department-of-labor-2001pensionplanbulletin 3/26
C7. Percentage Distribution of Assets in Defined Benefit Plans
with 100 or More Participantsby type of asset and size of plan, 2001………………………..16
C8. Percentage Distribution of Assets in Defined Contribution
Plans with 100 or More Participants
by type of asset and size of plan, 2001………………………..17
C9. Income Statement of Pension Plans with 100 or More
Participants
by type of plan, 2001………………………………………18-19
SECTION D: DEFINED CONTRIBUTION PLANS
Tables
D1. Balance Sheet of Defined Contribution Plans with 100 orMore Participants
by type of plan, 2001………………………………………….20
D2. Income Statement of Defined Contribution Plans with 100 or
More Participants
by type of plan, 2001……………………………………...21-22
D3. Number of 401(k) Type Plans, Participants, ActiveParticipants, Assets, Contributions, and Benefitsby type of plan, 2000…………………………………………23
ii

8/14/2019 Department of Labor: 2001pensionplanbulletin
http://slidepdf.com/reader/full/department-of-labor-2001pensionplanbulletin 4/26

8/14/2019 Department of Labor: 2001pensionplanbulletin
http://slidepdf.com/reader/full/department-of-labor-2001pensionplanbulletin 5/26
Table A1. Number of Pension Plans, Total Participants, Active Participants,Assets, Contributions, and Benefits
by type of plan, 2001
Type of PlanNumber of
Plans 1/
Total
Participants
(thousands) 2/
Active
Participants
(thousands) 3/
Total Assets
(millions) 4/
Total
Contributions
(millions) 5/
Total Benefits
(millions) 6/
Total 733,470 106,579 74,430 $3,940,991 $253,791 $311,627
Defined Benefit 46,859 42,067 22,089 1,825,290 49,743 129,417
Cash balance 1,477 7,820 4,188 416,848 9,729 34,244
Other defined benefit 45,382 34,248 17,901 1,408,442 40,014 95,173
Defined Contribution 686,611 64,511 52,340 2,115,702 204,048 182,210
Profit sharing and thrift-savings plans 569,493 57,350 46,613 1,885,050 186,823 163,425
Stock bonus plans 2,861 1,615 1,277 59,240 3,639 5,012
Target benefit plans 3,184 82 65 4,290 268 454
Money purchase plans 89,193 4,433 3,555 133,348 11,514 11,339
Annuity-403(b)(1) 14,558 106 98 651 97 54Custodial account-403(b)(7) 1,839 13 9 229 16 15
IRAs or annuities (Code 408) 495 6 6 88 4 4
Other defined contribution plans 4,989 906 717 32,805 1,686 1,907
1/ Excludes plans covering only one participant.
2/ Includes active, retired, and separated vested participants not yet in pay status. The number of participants also includes double
counting of workers in more than one plan.
3/ Active participants include any workers currently in employment covered by a plan and who are earning or retaining credited service
under a plan. Active participants also include nonvested former employees who have not yet incurred a break in service.
4/ Total asset amounts shown exclude funds held by life insurance companies under allocated group insurance contracts for payment of
retirement benefits. These excluded funds make up roughly 10 to 15 percent of total pension fund assets.
5/ Includes both employer and employee contributions.
6/ Amounts shown include both benefits paid directly from trust funds and premium payments made by plans to insurance carriers.
Amounts exclude benefits paid directly by insurance carriers.
SOURCE: Form 5500 filings for plan years beginning in 2001.
2

8/14/2019 Department of Labor: 2001pensionplanbulletin
http://slidepdf.com/reader/full/department-of-labor-2001pensionplanbulletin 6/26

8/14/2019 Department of Labor: 2001pensionplanbulletin
http://slidepdf.com/reader/full/department-of-labor-2001pensionplanbulletin 7/26
(amounts in millions)
Partnership/joint venture interests 19,878 17,247 2,631
Employer real property 882 43 839
Real estate (exc employer real prop.) 12,002 10,317 1,684Employer securities 281,905 7,906 273,999
Participant loans 32,956 315 32,642
Loans (other than to participants) 7,317 4,734 2,583
Other investments 1/ 3,586,051 1,784,728 1,801,323
TOTAL ASSETS 3,940,991 1,825,290 2,115,702
TOTAL LIABILITIES 80,833 49,846 30,987
NET ASSETS 3,860,158 1,775,443 2,084,715
1/ This table summarizes assets that appear on both the Schedule H (for plans with 100 or more participants) and Schedule I (for
plans with fewer than 100 participants). All asset items that appear on the more detailed Schedule H but not the Schedule I
are grouped under "Other investments".
NOTE: Total asset amounts shown exclude funds held by life insurance companies under group insurance contracts for
payment of retirement benefits. These excluded funds make up roughly 10 to 15 percent of total pension fund assets.
SOURCE: Form 5500 filings for plan years beginning in 2001.
TABLE A3. Balance Sheet of Pension Plans
by type of plan, 2001
Defined
Contribution
Defined
BenefitType of Asset or Liability Total
4

8/14/2019 Department of Labor: 2001pensionplanbulletin
http://slidepdf.com/reader/full/department-of-labor-2001pensionplanbulletin 8/26
(amounts in millions)
INCOME
Employer contributions 123,346 47,537 75,808
Participant contributions 115,872 644 115,228
Contributions from others (including rollovers) 12,665 439 12,226Noncash contributions 1,914 1,123 790
All other income 1/ -226,144 -83,409 -142,734
TOTAL INCOME 27,652 -33,666 61,318
EXPENSES
Total benefit payments 311,627 129,417 182,210
Corrective distributions 407 2 405
Deemed distrib. of partic. loans 582 9 573
Other expenses 12,728 7,490 5,238
TOTAL EXPENSES 325,345 136,918 188,426
NET INCOME -297,693 -170,585 -127,108
1/ This table summarizes income and expenses that appear on both the Schedule H (for plans with 100 or more participants) and
Schedule I (for plans with fewer than 100 participants). All income and expense items that appear on the more detailed Schedule H but not the Schedule I are grouped under "All other income" or "Other expenses".
SOURCE: Form 5500 filings for plan years beginning in 2001.
TABLE A4. Income Statement of Pension Plans
by type of plan, 2001
Defined
Contribution
Defined
BenefitIncome and Expenses Total
5

8/14/2019 Department of Labor: 2001pensionplanbulletin
http://slidepdf.com/reader/full/department-of-labor-2001pensionplanbulletin 9/26
Table A5. Amount of Assets in Pension Plans
by type of plan and method of funding, 2001(amounts in millions)
TotalDefined
Benefit
Defined
ContributionTotal
Defined
Benefit
Defined
ContributionTotal
Defined
Benefit
Defined
Contribution
Funding arrangement for investment of assets
Total $3,940,991 $1,825,290 $2,115,702 $3,546,166 $1,479,992 $2,066,174 $394,825 $345,298 $49,527Insurance 71,671 33,685 37,986 67,334 29,973 37,361 4,336 3,712 624
Section 412(i) ins. 2,028 1,484 544 693 224 469 1,335 1,260 75
Trust 2,667,431 1,211,041 1,456,390 2,468,681 1,040,411 1,428,269 198,750 170,630 28,120
Trust and insurance 1,198,959 579,070 619,889 1,008,555 409,375 599,181 190,403 169,696 20,708
Not determinable 903 9 893 903 9 893 0 0 -
Funding arrangement for payment of benefits
Total $3,940,991 $1,825,290 $2,115,702 $3,546,166 $1,479,992 $2,066,174 $394,825 $345,298 $49,527
Insurance 64,958 26,654 38,304 62,584 24,492 38,092 2,373 2,161 212
Section 412(i) ins. 2,028 857 1,171 1,521 426 1,095 507 431 76
Trust 3,089,670 1,397,899 1,691,771 2,795,251 1,142,673 1,652,577 294,419 255,225 39,194
Trust and insurance 783,433 399,871 383,562 685,907 312,391 373,516 97,526 87,480 10,046
Not determinable 903 9 893 903 9 893 0 0 -
1/ Includes single employer plans, plans of controlled groups of corporations and multiple-employer noncollectively bargained plans.
2/ Includes multiemployer plans and multiple-employer collectively bargained plans.
- Missing data.
SOURCE: Form 5500 series reports filed for plan years beginning in 2001.
Method of Funding
Total Plans Single Employer Plans 1/ Multiemployer Plans 2/
6

8/14/2019 Department of Labor: 2001pensionplanbulletin
http://slidepdf.com/reader/full/department-of-labor-2001pensionplanbulletin 10/26
Table A6. Collective Bargaining Status of Pension Plans, Participants, and Assets
by type of plan, 2001
Number
of Plans
Total
Participants
(thousands)
Total Assets
(millions) 1/
Number
of Plans
Total
Participants
(thousands)
Total Assets
(millions) 1/
Number
of Plans
Total
Participants
(thousands)
Total Assets
(millions) 1/TOTAL 733,470 106,579 $3,940,991 46,859 42,067 $1,825,290 686,611 64,511 $2,115,702
Collective bargaining
plans 19,413 27,509 1,177,726 6,059 18,146 833,919 13,353 9,363 343,807
Noncollectively
bargained plans 714,057 79,070 2,763,265 40,800 23,922 991,371 673,257 55,148 1,771,894
1/ Asset amounts shown exclude funds held by life insurance companies under allocated insurance contracts for payment of retirement benefits. These excluded funds make up roughly 10 to 15 percent of total pension fund assets.
NOTE: Some collectively bargained plans cover nonbargaining unit employees under a separate non-negotiated benefit structure.
SOURCE: Form 5500 series reports filed for plan years beginning in 2001.
Collective
Bargaining Status
Total Plans Defined Benefit Defined Contribution
7

8/14/2019 Department of Labor: 2001pensionplanbulletin
http://slidepdf.com/reader/full/department-of-labor-2001pensionplanbulletin 11/26
Table B1. Distribution of Pension Plans
by number of participants, 2001
Total Defined Defined Total Defined Defined Total Defined Defined
Benefit Contribution Benefit Contribution Benefit Contribution
Total 733,470 46,859 686,611 730,534 45,159 685,375 2,935 1,700 1,235
None or not reported 60,264 3,355 56,909 60,132 3,293 56,839 133 62 702-9 287,193 19,976 267,217 287,190 19,976 267,214 3 - 3
10-24 167,482 4,917 162,565 167,480 4,917 162,563 2 - 2
25-49 90,980 2,849 88,131 90,913 2,847 88,066 67 2 6550-99 56,073 2,894 53,179 56,011 2,887 53,124 62 7 55100-249 37,540 3,855 33,685 37,236 3,679 33,557 304 175 128
250-499 14,156 2,524 11,632 13,731 2,292 11,439 425 233 193500-999 8,227 2,110 6,116 7,690 1,788 5,902 536 322 214
1,000-2,499 6,055 2,043 4,012 5,394 1,645 3,749 661 398 2632,500-4,999 2,532 981 1,551 2,194 776 1,418 338 205 1335,000-9,999 1,464 632 832 1,263 499 763 202 133 6810,000-19,999 777 337 440 672 254 418 105 83 22
20,000-49,999 498 257 241 438 210 228 60 46 1350,000 or more 228 129 99 189 96 94 39 33 5
1/ Includes single employer plans, plans of controlled groups of corporations, and multiple-employer noncollectively bargained plans.
2/ Includes multiemployer plans and multiple-employer collectively bargained plans.
- Missing data.
NOTE: Excludes plans covering only one participant.
SOURCE: Form 5500 filings for plan years beginning in 2001.
Number of Participants
Total Plans Single Employer Plans 1/ Multiemployer Plans 2/
8

8/14/2019 Department of Labor: 2001pensionplanbulletin
http://slidepdf.com/reader/full/department-of-labor-2001pensionplanbulletin 12/26
Table B2. Distribution of Pension Plans
by amount of assets, 2001
TotalDefinedBenefit
DefinedContribution Total
DefinedBenefit
DefinedContribution Total
DefinedBenefit
DefinedContribution
Total 733,470 46,859 686,611 730,534 45,159 685,375 2,935 1,700 1,235
None or not reported 65,553 4,006 61,547 65,423 3,939 61,484 130 66 64$1-24K 32,978 375 32,603 32,967 372 32,595 11 3 8
25-49K 39,623 955 38,667 39,595 952 38,643 27 3 2450-99K 67,760 1,969 65,792 67,746 1,963 65,783 14 6 8100-249K 130,281 7,146 123,134 130,262 7,139 123,123 19 7 11250-499k 120,021 6,844 113,177 119,951 6,839 113,112 70 5 65500-999K 109,932 6,676 103,256 109,877 6,666 103,211 55 10 451-2.49M 93,100 6,391 86,708 92,908 6,336 86,572 191 55 1362.5-4.9M 34,098 3,253 30,845 33,891 3,165 30,726 207 88 1195-9.9M 17,311 2,382 14,929 16,974 2,234 14,740 337 148 189
10-24.9M 11,444 2,451 8,993 10,943 2,149 8,794 501 302 19925-49.9M 4,535 1,474 3,061 4,102 1,207 2,895 432 266 16650-74.9M 1,849 705 1,144 1,633 548 1,085 216 157 5975-99.9M 964 406 558 821 300 521 143 106 37100-149.9M 1,070 416 654 918 300 617 152 116 36150-199.9M 637 273 365 547 203 344 90 70 21200-249.9M 394 166 228 333 121 212 61 45 16250-499.9M 846 413 433 695 282 413 151 131 20
500-999.9M 486 238 249 439 196 243 47 42 51-2.49B 384 201 183 322 146 176 63 55 72.5B or more 204 118 86 187 101 86 17 17 -
1/ Includes single employer plans, plans of controlled groups of corporations and multiple-employer noncollectively bargained plans.
2/ Includes multiemployer plans and multiple-employer collectively bargained plans.
- Missing data.
NOTE: Excludes plans covering only one participant. The letters K, M, and B denote thousands, millions, and billions, respectively.
Amount of Assets
Total Plans Single Employer Plans 1/ Multiemployer Plans 2/
9

8/14/2019 Department of Labor: 2001pensionplanbulletin
http://slidepdf.com/reader/full/department-of-labor-2001pensionplanbulletin 13/26
Table B3. Distribution of Pension Plans
TotalDefinedBenefit
DefinedContribution Total
DefinedBenefit
DefinedContribution Total
DefinedBenefit
DefinedContribution
Total 733,470 46,859 686,611 730,534 45,159 685,375 2,935 1,700 1,235
Agriculture 9,279 586 8,692 9,264 572 8,691 15 14 1Mining 2,907 317 2,590 2,897 308 2,589 10 9 1Construction 58,488 2,829 55,660 57,043 2,130 54,913 1,446 699 747
Manufacturing 90,318 9,758 80,560 90,038 9,567 80,471 279 191 89Transportation 13,224 808 12,416 13,075 699 12,376 149 109 40Communications andinformation 13,354 970 12,384 13,310 936 12,374 44 34 10Utilities 2,364 420 1,944 2,357 417 1,939 7 3 4Wholesale trade 46,612 2,504 44,108 46,559 2,466 44,093 53 39 15Retail trade 52,461 2,052 50,409 52,355 1,979 50,376 105 73 33Finance, insurance &
real estate 66,622 6,669 59,953 66,182 6,391 59,791 440 279 162Services 361,838 18,557 343,281 361,580 18,371 343,210 258 187 71Misc. organizations 3/ 12,707 1,275 11,432 12,592 1,220 11,373 115 55 59Industry not reported 3,296 113 3,183 3,283 104 3,179 12 9 3
1/ Includes single employer plans, plans of controlled groups of corporations and multiple-employer noncollectively bargained plans.
2/ Includes multiemployer plans and multiple-employer collectively bargained plans.
3/ Religious, grantmaking, civic, professional, labor, and similar organizations.
Note: Industry classifications are now based on principal business activity code used in the North American Industry Classification System. Therefore, the results in this table may not be
directly comparable with previous years.
NOTE: Excludes plans covering only one participant.
Source: Form 5500 series reports filed with the U.S. Department of Labor for plan years beginning in 2001.
by industry, 2001
Industry
Total Plans Single Employer Plans 1/ Multiemployer plans 2/
10

8/14/2019 Department of Labor: 2001pensionplanbulletin
http://slidepdf.com/reader/full/department-of-labor-2001pensionplanbulletin 14/26
Table C1. Distribution of Assetsby number of participants, 2001
(amounts in millions)
Total Defined Defined Total Defined Defined Total Defined DefinedBenefit Contribution Benefit Contribution Benefit Contribution
Total $3,940,991 $1,825,290 $2,115,702 $3,546,166 $1,479,992 $2,066,174 $394,825 $345,298 $49,527
None or not reported 12,412 4,338 8,074 12,119 4,198 7,922 293 141 1522-9
117,071 10,854 106,217 117,071 10,854 106,217 3/ - 3/ 10-24 100,530 4,278 96,252 100,530 4,278 96,251 3/ - 3/
25-49 91,149 3,326 87,823 91,016 3,326 87,690 134 3/ 13450-99 91,087 5,563 85,525 90,987 5,543 85,444 101 20 81100-249 142,890 18,764 124,127 140,634 16,959 123,675 2,256 1,804 452250-499 120,492 24,467 96,025 115,296 20,913 94,383 5,196 3,554 1,643500-999 149,777 43,844 105,933 136,813 34,000 102,813 12,964 9,844 3,1201,000-2,499 271,564 105,472 166,092 234,266 77,058 157,208 37,298 28,414 8,8842,500-4,999 277,805 118,416 159,389 234,330 85,467 148,863 43,475 32,949 10,527
5,000-9,999 349,114 163,237 185,877 305,441 128,722 176,719 43,672 34,515 9,15710,000-19,999 434,180 198,746 235,433 382,931 151,084 231,847 51,249 47,662 3,58620,000-49,999 643,839 341,768 302,071 586,911 292,627 294,285 56,927 49,141 7,78650,000 or more 1,139,081 782,217 356,864 997,822 644,963 352,859 141,259 137,254 4,005
1/ Includes single employer plans, plans of controlled groups of corporations, and multiple-employer noncollectively bargained plans.
2/ Includes multiemployer plans and multiple-employer collectively bargained plans.
3/ Less than $500,000.
- Missing data.SOURCE: Form 5500 series reports filed with the U.S. Department of Labor for plan years beginning in 2001.
Number of Participants
Total Plans Single Employer Plans 1/ Multiemployer Plans 2/
11

8/14/2019 Department of Labor: 2001pensionplanbulletin
http://slidepdf.com/reader/full/department-of-labor-2001pensionplanbulletin 15/26
Table C2. Distribution of Assetsby asset size, 2001
(amounts in millions)
TotalDefinedBenefit
DefinedContribution Total
DefinedBenefit
DefinedContribution Total
DefinedBenefit
DefinedContribution
Total $3,940,991 $1,825,290 $2,115,702 $3,546,166 $1,479,992 $2,066,174 $394,825 $345,298 $49,527
$1-24K 435 4 431 435 4 431 3/ 3/ 3/
25-49K 1,485 37 1,448 1,484 37 1,447 1 3/ 150-99K 5,028 150 4,878 5,027 150 4,878 1 3/ 1100-249K 21,895 1,227 20,668 21,892 1,226 20,665 3 1 2250-499K 43,301 2,472 40,829 43,275 2,470 40,805 26 2 24500-999K 78,395 4,759 73,637 78,352 4,750 73,602 43 8 351-2.49M 145,145 9,945 135,200 144,809 9,846 134,963 336 99 2372.5-4.9M 119,144 11,783 107,361 118,360 11,443 106,916 784 340 4455-9.9M 119,812 16,844 102,968 117,383 15,742 101,641 2,429 1,101 1,32810-24.9M 176,562 38,915 137,647 168,332 33,860 134,472 8,230 5,054 3,17525-49.9M 159,178 52,512 106,667 143,671 42,872 100,799 15,508 9,640 5,868
50-74.9M 113,403 43,660 69,742 99,986 33,904 66,082 13,417 9,756 3,66175-99.9M 83,104 35,120 47,983 70,745 25,962 44,783 12,358 9,158 3,200100-149.9M 130,549 50,813 79,736 111,914 36,665 75,249 18,635 14,148 4,488150-199.9M 109,756 47,062 62,694 94,158 35,044 59,114 15,598 12,018 3,581200-249.9M 88,087 37,485 50,602 74,498 27,386 47,112 13,589 10,099 3,490250-499.9M 293,406 141,921 151,485 241,536 97,111 144,424 51,870 44,810 7,060500-999.9M 339,310 166,903 172,406 306,362 137,674 168,689 32,947 29,230 3,7181-2.49B 583,539 303,841 279,698 497,245 226,763 270,483 86,294 77,078 9,216
2.5B or more 1,329,458 859,838 469,620 1,206,703 737,083 469,620 122,755 122,755 -
1/ Includes single employer plans, plans of controlled groups of corporations and multiple-employer noncollectively bargained plans.
2/ Includes multiemployer plans and multiple-employer collectively bargained plans.
3/ Less than $500,000.
NOTE: Excludes plans covering only one participant. The letters K, M, and B denote thousands, millions, and billions, respectively.
Source: Form 5500 series reports filed with the U.S. Department of Labor for plan years beginning in 2001.
Amount of Assets
Total Plans Single Employer Plans 1/ Multiemployer plans 2/
12

8/14/2019 Department of Labor: 2001pensionplanbulletin
http://slidepdf.com/reader/full/department-of-labor-2001pensionplanbulletin 16/26
Table C3. Distribution of Assetsby industry, 2001
TotalDefinedBenefit
DefinedContribution Total
DefinedBenefit
DefinedContribution Total
DefinedBenefit
DefinedContribution
Total $3,940,991 $1,825,290 $2,115,702 $3,546,166 $1,479,992 $2,066,174 $394,825 $345,298 $49,527
Agriculture 12,442 4,373 8,069 11,047 3,214 7,833 1,395 1,159 236Mining 34,413 12,418 21,995 34,026 12,037 21,989 387 381 6Construction 215,805 125,500 90,305 63,127 6,086 57,042 152,678 119,415 33,263Manufacturing 1,565,782 817,162 748,619 1,535,789 787,663 748,126 29,992 29,499 493Transportation 192,194 122,352 69,842 119,481 52,497 66,984 72,713 69,855 2,858Communications andInformation 296,656 174,793 121,863 290,183 169,518 120,665 6,473 5,275 1198Utilities 165,621 98,852 66,770 165,463 98,717 66,746 159 135 24Wholesale trade 113,009 24,902 88,107 110,011 21,998 88,013 2,999 2,904 94Retail trade 161,960 47,914 114,047 135,466 22,054 113,412 26,494 25,860 634Finance, insurance &
real estate 435,039 188,072 246,967 369,689 131,089 238,600 65,350 56,982 8,368Services 703,666 184,413 519,253 674,332 156,754 517,578 29,334 27,659 1,675Tax-exemptorganizations 37,415 23,477 13,938 31,448 18,149 13,298 5,967 5,328 639Industry not reported 6,988 1,062 5,927 6,104 217 5,887 884 845 39
1/ Includes single employer plans, plans of controlled groups of corporations and multiple-employer noncollectively bargained plans.
2/ Includes multiemployer plans and multiple-employer collectively bargained plans.
Note: Industry classifications are now based on principal business activity code used in the North American Industry Classification System. Therefore, the results in this table may not be
directly comparable with previous years.
Source: Form 5500 series reports filed with the U.S. Department of Labor for plan years beginning in 2001.
(amounts in millions)
Industry
Total Plans Single Employer Plans 1/ Multiemployer plans 2/
13

8/14/2019 Department of Labor: 2001pensionplanbulletin
http://slidepdf.com/reader/full/department-of-labor-2001pensionplanbulletin 17/26
ASSETSTotal noninterest-bearing cash $4,346 $2,120 $2,226
Employer contrib. receivable 34,165 19,362 14,802
Participant contrib. receivable 1,868 39 1,829
Other receivables 26,468 20,839 5,629
Interest-bearing cash 72,470 30,137 42,333
U. S. Government securities 127,126 107,352 19,775
Corporate debt instruments: Preferred 35,585 30,264 5,321
Corporate debt instruments: All other 80,603 70,026 10,577
Preferred stock 3,234 1,723 1,511Common stock 344,864 284,229 60,635
Partnership/joint venture interests 18,054 17,082 972
Real estate (except employer real prop.) 10,706 10,224 482
Loans (other than to participants) 5,668 4,508 1,160
Participant loans 29,727 270 29,458
Assets in common/collective trusts 299,806 176,704 123,102
Assets in pooled separate accounts 96,437 35,366 61,071
(continued...)
Type of Asset or LiabilityBenefit Contribution
TABLE C4. Balance Sheet of Pension Plans with 100 or More Participants
by type of plan, 2001(amounts in millions)
Defined DefinedTotal
14

8/14/2019 Department of Labor: 2001pensionplanbulletin
http://slidepdf.com/reader/full/department-of-labor-2001pensionplanbulletin 18/26
Assets in master trusts 1,220,714 825,834 394,880
Assets in 103-12 investment entities 11,284 7,404 3,879
Assets in registered investment companies 656,283 97,908 558,376Assets in insurance co. general accounts 86,542 17,130 69,412
Other general investments 68,361 28,165 40,196
Employer securities 274,714 7,808 266,906
Employer real property 868 38 830
Buildings and other prop. used by plan 507 391 116
Other or unspecified assets 18,340 2,005 16,335
TOTAL ASSETS 3,528,741 1,796,930 1,731,811
LIABILITIESBenefit claims payable 2,567 755 1,811
Operating payables 14,957 12,982 1,975
Acquisition indebtedness 11,060 1,447 9,613
Other liabilities 47,079 33,173 13,906
TOTAL LIABILITIES 75,663 48,358 27,305
NET ASSETS 3,453,079 1,748,572 1,704,506
SOURCE: Form 5500 filings for plan years beginning in 2001.
TABLE C4. Balance Sheet of Pension Plans with 100 or More Participants
by type of plan, 2001(amounts in millions)
Type of Asset or Liability TotalDefined Defined
Benefit Contribution
15

8/14/2019 Department of Labor: 2001pensionplanbulletin
http://slidepdf.com/reader/full/department-of-labor-2001pensionplanbulletin 19/26
TOTAL ASSETS 100% 100% 100% 100% 100% 100%
Cash 2 8 4 3 2 1Receivables 2 8 4 3 2 2U. S. Government securities 6 2 5 8 7 5Corporate debt instruments: Preferred 2 1/ 1 2 2 2Corporate debt instruments: All other 4 1 3 5 5 3Corporate stocks 16 7 13 20 20 14Real estate (except employer real prop.) 1 1/ 1/ 1/ 1/ 1Loans 1/ 1/ 1/ 1/ 1/ 1/
Assets in common/collective trusts 10 5 8 9 7 11Assets in pooled separate accounts 2 7 9 3 1 2Assets in master trusts 46 14 16 29 41 52Assets in 103-12 investment entities 1/ 1/ 1/ 1 1 1/
Assets in registered investment companies 5 23 22 14 7 3Assets in ins. co. general account 1 6 6 2 1 1Employer securities 1/ 0 1/ 1/ 1/ 1Other or unspecified investments 3 19 6 2 3 3
1/ Less than 1 percent.
NOTES: The letters M and B in the column headings denote millions and billions respectively. Percentage distributions may not add up to 100 percent
because of rounding.
SOURCE: Form 5500 filings for plan years beginning in 2001.
249.9M 999.9M More
Table C7. Percentage Distribution of Assets in Defined Benefit Plans
with 100 or More Participants
by type of asset and size of plan, 2001
$10.0M-Total $1-0.99M $1.0M-9.9M
$250.0M- $1.0B orType of Asset
16
8/14/2019 Department of Labor: 2001pensionplanbulletin
http://slidepdf.com/reader/full/department-of-labor-2001pensionplanbulletin 20/26
with 100 or More Participants
by type of asset and size of plan, 2001
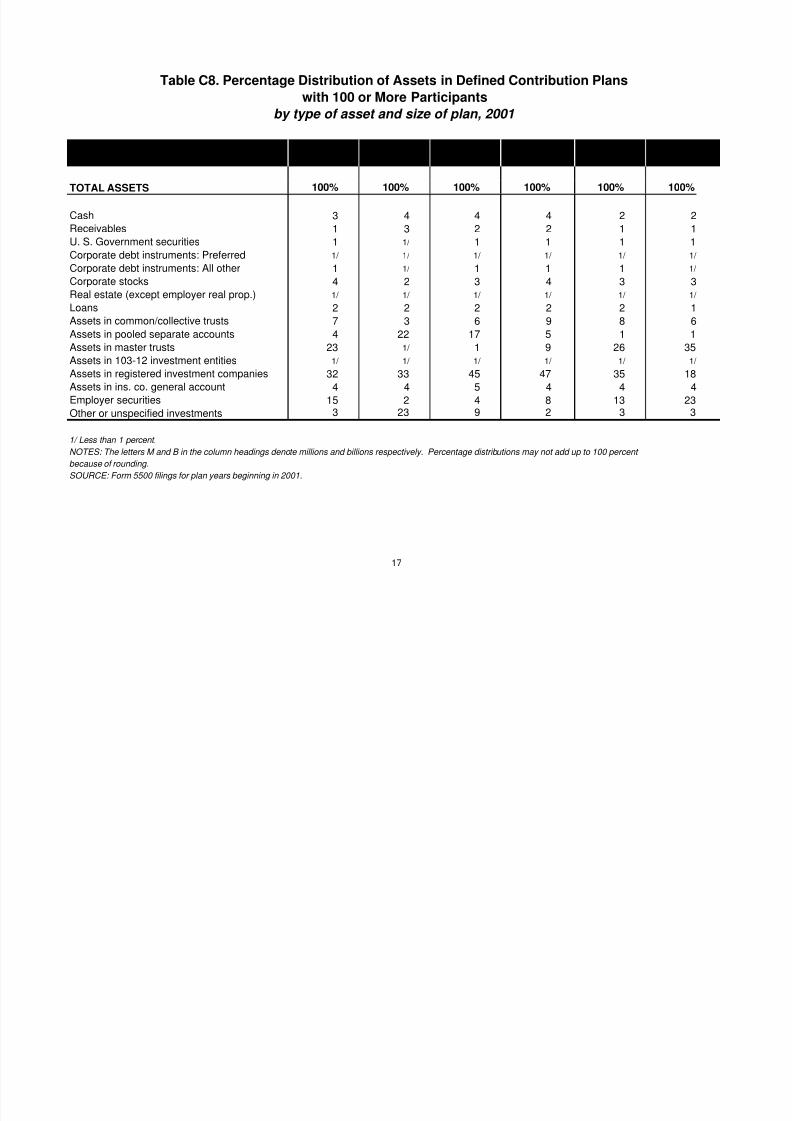
TOTAL ASSETS 100% 100% 100% 100% 100% 100%
Cash 3 4 4 4 2 2Receivables 1 3 2 2 1 1U. S. Government securities 1 1/ 1 1 1 1
Corporate debt instruments: Preferred 1/ 1/ 1/ 1/ 1/ 1/
Corporate debt instruments: All other 1 1/ 1 1 1 1/
Corporate stocks 4 2 3 4 3 3Real estate (except employer real prop.) 1/ 1/ 1/ 1/ 1/ 1/
Loans 2 2 2 2 2 1
Assets in common/collective trusts 7 3 6 9 8 6Assets in pooled separate accounts 4 22 17 5 1 1
Assets in master trusts 23 1/ 1 9 26 35
Assets in 103-12 investment entities 1/ 1/ 1/ 1/ 1/ 1/
Assets in registered investment companies 32 33 45 47 35 18Assets in ins. co. general account 4 4 5 4 4 4Employer securities 15 2 4 8 13 23
Other or unspecified investments 3 23 9 2 3 3
1/ Less than 1 percent.
NOTES: The letters M and B in the column headings denote millions and billions respectively. Percentage distributions may not add up to 100 percent
because of rounding.
SOURCE: Form 5500 filings for plan years beginning in 2001.
Type of Asset249.9M 999.9M More
Table C8. Percentage Distribution of Assets in Defined Contribution Plans
$10.0M- $250.0M- $1.0B orTotal $1-0.99M $1.0M-9.9M
17

8/14/2019 Department of Labor: 2001pensionplanbulletin
http://slidepdf.com/reader/full/department-of-labor-2001pensionplanbulletin 21/26
INCOMEContributions received or receivable from:
Employers $99,802 $44,420 $55,382
Participants 95,814 623 95,191
Others (including rollovers) 9,167 424 8,743
Noncash contributions 1,945 1,127 817
Total contributions 206,724 46,594 160,130
Interest earnings:Interest-bearing cash 4,404 1,722 2,682
U. S. Government securities 6,724 5,708 1,015
Corporate debt instruments 6,961 6,137 824
Non-participant loans 313 226 87
Participant loans 2,016 21 1,995
Other or unspecified interest 8,353 3,038 5,315
Total interest earnings 28,771 16,852 11,919Dividends:Preferred stock 698 143 555
Common stock 11,910 4,776 7,134
Total dividend income 12,609 4,919 7,690
Rents 460 417 43
Net gain (loss) on sale of assets -13,301 -12,927 -374
Unrealized appreciation:Unrealized appreciation of real estate -6,299 -2,455 -3,845
Other unrealized appreciation -59,800 -28,271 -31,530Total unrealized appreciation -66,097 -30,726 -35,371
Net invest. gain from common/col. trusts -13,261 -8,912 -4,349
Net invest. gain from pooled sep. accounts -8,398 -1,323 -7,075
Net invest. gain from master trusts -72,871 -46,396 -26,475
Net invest. gain from 103-12 investment entities -1,125 -676 -448
Net invest. gain from reg. investment companies -57,174 -3,034 -54,141
Other or unspecified income 1,940 1,418 522
TOTAL INCOME 18,277 -33,793 52,070
(continued...)
Table C9. Income Statement of Pension Plans With 100 or More Participants
by type of plan, 2001(amounts in millions)
Defined DefinedIncome and Expenses Total
Benefit Contribution
18

8/14/2019 Department of Labor: 2001pensionplanbulletin
http://slidepdf.com/reader/full/department-of-labor-2001pensionplanbulletin 22/26
EXPENSES
Benefit payments and payments to provide
benefits:
Direct benefit payments $254,884 $117,219 $137,664Payments to insurance carriers for benefits 2,456 2,176 280Other or unspecified benefits 3,386 1,465 1,921
Total benefit payments 260,726 120,860 139,865
Interest expense 1,523 16 1,507
Corrective distributions 200 2 198
Deemed distrib. of partic. loans 467 3 464Administrative expenses:
Professional fees 1,563 1,323 240Contract administrator fees 1059 720 339Investment advisory and management fees 3,648 3,102 545Other or unspecifed admin. expenses 2,595 1,939 657
Total administrative expenses 8,865 7,084 1,781
Unspecified expenses 99 10 89
TOTAL EXPENSES 271,880 127,976 143,904
NET INCOME -253,603 -161,769 -91,834
1/ Less than $500,000.
SOURCE: Form 5500 filings for plan years beginning in 2001.
Table C9. Income Statement of Pension Plans With 100 or More Participants
by type of plan, 2001(amounts in millions)
Defined DefinedIncome and Expenses Total
Benefit Contribution
19

8/14/2019 Department of Labor: 2001pensionplanbulletin
http://slidepdf.com/reader/full/department-of-labor-2001pensionplanbulletin 23/26
Table D1. Balance Sheet of Defined Contribution Plans with 100 or More Participants
by type of plan, 2001(amounts in millions)
Plans Plans
Total noninterest-bearing cash $2,226 $2,001 $80 $3 $105 $36
Employer contrib. receivable 14,802 12,555 457 34 1,567 188
Participant contrib. receivable 1,829 1,802 4 1/ 17 7
Other receivables 5,629 4,414 150 2 952 110
Interest-bearing cash 42,333 36,145 1,306 48 4,144 690U. S. Government securities 19,775 10,625 35 78 8,042 995
Corporate debt instruments: Preferred 5,321 2,724 5 14 2,452 125
Corporate debt instruments: All other 10,577 6,788 27 81 3,308 373
Preferred stock 1,511 1,428 1 9 64 9
Common stock 60,635 43,410 981 251 13,151 2,843
Partnership/joint venture interests 972 738 1 33 185 15
Real estate (except employer real prop.) 482 266 1 1/ 193 21
Loans (other than to participants) 1,160 1,051 4 1/ 104 1/
Participant loans 29,458 28,651 425 7 328 46Assets in common/collective trusts 123,102 115,425 843 53 6,092 689
Assets in pooled separate accounts 61,071 57,520 3 28 3,020 500
Assets in master trusts 394,880 378,955 4,912 921 6,764 3,328
Assets in 103-12 investment entities 3,879 3,600 1 1/ 278 1
Assets in registered investment comp. 558,376 521,125 8,226 553 24,829 3,643
Assets in ins. co. general account 69,412 62,746 204 37 6,042 384
Other general investments 40,196 36,637 780 23 2,178 576
Employer securities 266,906 215,271 38,159 58 3,290 10,127
Employer real property 830 825 0 0 3 2
Buildings and other prop. used by plan 116 83 4 1/ 25 3
Other or unspecified assets 16,335 14,677 67 39 1,489 63
TOTAL ASSETS 1,731,811 1,559,464 56,676 2,273 88,623 24,774
Benefit claims payable 1,811 1,405 100 66 144 95
Operating payables 1,975 912 269 1/ 747 45
Acquisition indebtedness 9,613 5,110 3,003 0 64 1,436
Other liabilities 13,906 7,594 4,500 17 997 797
TOTAL LIABILITIES 27,305 15,022 7,873 84 1,953 2,374NET ASSETS 1,704,506 1,544,443 48,804 2,189 86,670 22,400
1/ Less than $500,000.
SOURCE: Form 5500 filings for plan years beginning in 2001.
Type of Asset or Liability
Total
DefinedContribution
Plans
Other
DefinedContribution
Profit
Sharing andThrift Savings
Stock BonusPlans
TargetBenefit
Plans
MoneyPurchase
Plans
20

8/14/2019 Department of Labor: 2001pensionplanbulletin
http://slidepdf.com/reader/full/department-of-labor-2001pensionplanbulletin 24/26
Table D2. Income Statement of Defined Contribution Plans with 100 or More Participantsby type of plan, 2001
(amounts in millions)
Plans Plans
INCOMEContributions received or receivable from:
Employers $55,382 $44,956 $1,973 $119 $7,164 $1,170
Participants 95,191 93,484 1,197 3 286 221
Others (including rollovers) 8,743 8,573 75 2 72 22
Noncash contributions 817 604 184 0 1/ 30
Total contributions 160,130 147,614 3,428 124 7,521 1,443
Interest earnings:Interest-bearing cash 2,682 2,418 36 1 198 29
U. S. Government securities 1,015 464 1 4 481 65
Corporate debt instruments 824 476 1 4 313 30
Non-participant loans 87 78 3 0 5 1
Participant loans 1,995 1,922 49 1/ 23 2
Other or unspecified interest 5,315 4,902 31 3 346 33Total interest earnings 11,919 10,260 121 13 1,367 159
Dividends:Peferred stock 555 412 112 1/ 5 26
Common stock 7,134 5,884 733 5 333 180
Total dividend income 7,690 6,297 845 5 338 205
Rents 43 36 1/ 0 4 2
Net gain (loss) on sale of assets -374 -64 124 -7 -511 85
Unrealized appreciation:
Unrealized appreciation of real estate -3,845 -1,882 -1,731 -2 -270 40Other unrealized appreciation -31,530 -28,788 -1,611 -54 -1,109 32
Total unrealized appreciation -35,371 -30,667 -3,342 -55 -1,378 72
Net invest. gain from common/col. trusts -4,349 -4,208 -27 -1 -120 5
Net invest. gain from pooled sep. accounts -7,075 -6,767 1/ -1 -290 -17
Net invest. gain from master trusts -26,475 -25,599 -433 -49 -384 -11
Net invest. gain from 103-12 invest. entities -448 -402 1/ -6 -40 1/
Net invest. gain from reg. invest. companies -54,141 -50,521 -653 -13 -2760 -194
Other or unspecified income 522 491 95 10 -112 37
TOTAL INCOME 52,070 46,470 157 20 3,636 1,786
Income and Expenses
(continued...)
OtherDefined
Contribution
MoneyPurchase
Plans
TotalDefined
Contribution
Plans
Target
Benefit Plans
ProfitSharing and
Thrift Savings
Stock Bonus
Plans
21

8/14/2019 Department of Labor: 2001pensionplanbulletin
http://slidepdf.com/reader/full/department-of-labor-2001pensionplanbulletin 25/26
Table D2. Income Statement of Defined Contribution Plans with 100 or More Participants
by type of plan, 2001
(amounts in millions)
Plans Plans
EXPENSESBenefit payments and payments to provide
benefits:Direct benefit payments $137,664 $127,017 $4,017 $177 $5,050 $1,404
Payments to insurance carriers for benefits 280 151 1 1 112 14
Other or unspecified benefits 1,921 1,667 58 42 111 44
Total benefit payments 139,865 128,835 4,075 220 5,273 1,462
Corrective distributions 198 185 1/ 0 2 11
Deemed distrib. of partic. loans 464 432 1 0 12 18
Interest expense 1,507 786 581 0 7 133
Administrative expenses:
Professional fees 240 184 5 1 39 10Contract administrator fees 339 299 2 1/ 32 6
Investment advisory and management fees 545 393 3 4 127 17
Other or unspecifed admin. expenses 657 511 30 1 99 16
Total administrative expenses 1,781 1,387 41 6 298 50
Unpecified expenses 89 68 7 1/ 18 - 4
TOTAL EXPENSES 143,904 131,693 4,705 226 5,610 1,669
NET INCOME -91,834 -85,224 -4,548 -206 -1,973 117
1/ Less than $500,000.
SOURCE: Form 5500 filings for plan years beginning in 2001.
Income and ExpensesContribution
Plans
Contribution Thrift Savings
Other
DefinedMoney
Purchase
Plans
Total Profit
Defined Sharing and Stock Bonus
Plans
Target
Benefit Plans
22

8/14/2019 Department of Labor: 2001pensionplanbulletin
http://slidepdf.com/reader/full/department-of-labor-2001pensionplanbulletin 26/26
Table D3. Number of 401(k) Type Plans, Participants, Active Participants,
Assets, Contributions, and Benefitsby type of plan, 2001
Type of PlanNumber of Plans
1/
TotalParticipants
(thousands) 2/
ActiveParticipants
(thousands) 3/
Total Assets(millions)
TotalContributions(millions) 4/
Total Benefits(millions) 5/
TOTAL 366,568 51,814 41,962 $1,682,218 $174,389 $147,645
Profit sharing and thrift-savings 364,707 51,025 41,317 1,643,157 171,702 144,481Stock bonus 196 484 386 27,808 1,970 1,952Target benefit 2 */ */ 2 1 */
Money purchase 1,609 301 256 11,069 699 1197Annuity-403(b)(1) 49 3 2 72 9 8Custodial account-403(b)(7) 5 1 1 110 9 6
1/ Excludes plans covering only one participant.
2/ Includes active, retired and separated vested participants not yet in pay status. The number of participants also includes double
counting of workers in more than one plan.
3/ Active participants include any workers currently in employment covered by a plan and who are earning or retaining credited service
under a plan. Active participants also include nonvested former employees who have not yet incurred a break in service.
4/ Includes both employer and employee contributions.
5/ Amounts shown include both benefits paid directly from trust funds and premium payments made by plans to insurance carriers.
Amounts exclude benefits made directly by insurance carriers.
*/ Less than $500,000, or 500, in the case of participants.
SOURCE: Form 5500 series reports filed with the U.S. Department of Labor for plan years beginning in 2001.
23