department of revenue and taxation real property taxes
TRANSCRIPT

Department of Revenue and Taxation
Real Property Taxes
Performance Audit October 1, 2007 through September 30, 2012
OPA Report No. 13-03
August 2013

Department of Revenue and Taxation Real Property Tax
Performance Audit
October 1, 2007 through September 30, 2012
OPA Report No. 13-03 August 2013
Distribution: Governor of Guam Lt. Governor of Guam Speaker, 32nd Guam Legislature Senators, 32nd Guam Legislature Director, Department of Revenue and Taxation Director, Department of Land Management Director, Department of Public Works Guam Media via E-Mail

Table of Contents
Page Executive Summary ........................................................................................................................ 2 Introduction..................................................................................................................................... 4
Background................................................................................................................................. 4 Results of Audit .............................................................................................................................. 6
Current Market Values Not Being Used..................................................................................... 6 Market-Based Valuations 2008~2011 ........................................................................................ 8 Real Property Tax Assessments Adjusted Downward to 1993 Values ...................................... 8 Real Property Tax Exemptions and Reduced Tax Rates .......................................................... 11 Increase in Overall Assessments, Exemptions, Taxes & Collections....................................... 13 Questioned Costs from Results of Audit Tests ......................................................................... 14 Anomalies Found in Tax Roll Database Review...................................................................... 15 Request for Proposal for Appraisal and Revaluation Services ................................................. 16
Conclusion and Recommendations............................................................................................... 18 Management Response and OPA Reply ....................................................................................... 19 Appendices
1: Classification of Monetary Impact ..................................................................................... 20 2: Objectives, Scope, and Methodology ................................................................................. 21 3: Prior Audit Coverage .......................................................................................................... 23 4: 2011 Effective Property Tax Rates..................................................................................... 24 5: 2008 Real Property Values ................................................................................................. 25 6: 2010 Real Property Values ................................................................................................. 26 7: Real Property Exemptions .................................................................................................. 27 8: Summary of Estimated Lost Property Taxes 2010 ............................................................. 28 9: Summary of Estimated Lost Property Taxes 2009 ............................................................. 29 10: Summary of Estimated Lost Property Taxes 2008 ............................................................. 30 11: Exemptions by Category..................................................................................................... 31 12: Management Response ....................................................................................................... 32

2
Executive Summary EXECUTIVE SUMMARY
Department of Revenue and Taxation Real Property Taxes
OPA Report No. 13-03, August 2013 Our audit of the Department of Revenue and Taxation’s (DRT) real property taxes identified $15.7 million (M) in unrealized, lost and forgone tax revenues, comprised of $14M from the outdated valuation system, $1.6M in escaped assessments, and $57 thousand (K) due to a lack of interface between the Department of Public Works (DPW) and Department of Land Management (DLM). Additionally, there were $858K in questioned costs based on our testing and review. Specifically, we identified:
• Tax assessments were based on a valuation system completed in 1993, or 20 years ago, thus current market values are not used and instead were adjusted downward to reflect the 1993 values, resulting in unrealized and lost tax revenues estimated at $14M over the past five years;
• Guam’s property tax rates are among the lowest in the 50 United States and District of Columbia while property values are the lowest;
• Real property tax exemptions and reduced tax rates for senior citizens and home exemptions represent $2.6M annually of exempted tax revenues, or $13.2M in the past five years;
• 1,605 real properties accounted for 9,480 escape assessments, resulting in foregone property tax revenue totaling $1.6M;
• A lack of interface between the DPW Building Permits and Inspection Section and the DLM to recognize a change in real property values as well as sales of real property, updated renovations, and changes in lien resulting in $57K in unrealized and lost tax revenues;
• $858K in questioned costs based on our testing and review. The largest was the Board of Equalization’s approval of a major reduction in hotel value, resulting in $574K in questioned costs; and
• All real property tax division staff have the ability to input into DRT’s database, i.e. home values, exemptions, abatements, etc., without secondary controls and review
Real Property Tax Assessments Adjusted Downward to 1993 Values DRT is not using current market values to assess residential property values, resulting in an estimated loss of $14M in tax revenues between 2007 and 2011. Guam’s tax code mandates that all real property be reappraised every five years to ensure that values are current. However, it is commonly known that the last appraisal was completed in 1993. DRT does not update property records to reflect current market values, even when properties are transferred, newly constructed, or sold. Instead, current values are adjusted downwards to reflect 1993 valuations for assessment purposes. Guam has one of the Lowest Property Tax Rate and Among Lowest in Property Values Guam’s effective real property tax rate, which is the average annual property tax calculated as a percentage of the median property value per the 2011 Assessment Tax Roll, was 0.29%. When compared to the 50 United States’ effective tax rates, Guam has the second to the lowest real property tax rate followed by Alabama at 0.40%, then by Louisiana at 0.48%, and West Virginia at 0.51%. From 2007 to 2011, Guam was one of the lowest property-taxed locations.

3
Between 2007 and 2011, Guam’s property values ranked the lowest in the 50 United States and the District of Columbia. Specifically, Guam’s average median property value in 2008 was $91,145 and in 2010 was $92,792. The average assessed property value in Guam for 2011 was $137,250. Senior Citizen and Home Exemptions Comprise in Largest of Forgone Revenues We found real property tax exemptions and reduced tax rates have increased steadily over the last five years, rising from 20,435 exemptions totaling $3.3M in 2005 to 23,592 totaling $4.1M in 2011. The earliest data provided by DRT was from 1999, and has shown increases since then. Due to the various exemptions and reduced tax rates, foregone (exempted) revenues from 2007 through 2011 amounted to $20M. The two largest exemptions stem from senior citizens and home exemptions, which represent 66% of total exemptions, or $13.2M. The largest exemption was senior citizens, averaging 9,515 properties and $1.7M, or 43%. The second largest exemption was home exemptions, averaging 5,411 properties and $925K, or 23 %. Senior citizens, at age 55, are eligible for a reduction in real property tax rates. This was allowed by Public Law (P.L.) 24-267, which lowered the eligibility from age 60 to 55. Medicare and Medicaid eligibility is age 65. These exemptions amounted to an average of $181 for senior citizens and $171 for home exemptions for each eligible taxpayer. Foregone Revenue Due to Escape Assessments We identified 1,605 real properties that accounted for 9,480 escape assessments from tax years 1981 through 2010, resulting in forgone property tax revenues totaling $1.6M. Escape assessments are a correction in DRT’s tax rolls for taxable property that were not previously assessed. Based on DRT’s records, the earliest escape assessment was from 1981. Interface with Department of Public Works and Department of Land Management In a previous audit on DPW’s Building Permits & Inspection Section (OPA Report No. 11-05), we found that DRT and DPW do not compare existing values for new construction projects that require document submission to both entities. Taxpayers are not required to provide documentation to DLM for residential renovations or upgrades and with the exception of a change or acquirement of property, DLM does not provide additional information to DRT. DRT has no way of knowing when renovations occur or what effect they have on property values, since DRT does not conduct inspections. Recommendations To improve real property tax revenues, we recommend the DRT Director work with the Guam Legislature and Governor of Guam (1) enact legislation that allows DRT to utilize current market values for new construction, renovations, and current sales rather than adjusting downward to 1993 values, (2) place a moratorium on senior citizens and home exemptions until the reappraisal is updated, and (3) increase the eligibility for senior citizens for reduced tax rates from age 55 to 65. We also recommended the DRT Director issue the request for proposal for the valuation reappraisal, establish a communication protocol with DLM and DPW to include the updated assessment of real properties, and conduct reviews on exemptions.
Doris Flores Brooks, CPA, CGFM Public Auditor

4
Introduction This report presents the results of our audit of the Department of Revenue and Taxation’s (DRT) real property taxes. The audit was initiated as part of the Office of Public Accountability’s (OPA) Annual Audit Work Plan. Our objectives were to determine (1) Guam’s effective real property tax as a percentage of property value and where Guam ranks in comparison to the United States’ effective property tax rates, (2) whether real property taxes are accurately assessed, and (3) whether taxpayers afforded property tax exemptions are in fact eligible. The scope, methodology, and prior audit coverage are detailed in Appendices 2 and 3. Background DRT is responsible for enforcing the income and general tax laws of Guam and for collecting tax revenues, as well as revenues from other sources such as licensing and registration. DRT’s stated mission is to “promote quality service to all taxpayers, increase voluntary compliance by helping taxpayers understand and meet their responsibilities, and apply the tax law with integrity and fairness to all.” DRT consists of five divisions: Regulatory Division, Motor Vehicle Division, Real Property Tax Division, Tax Enforcement Division and the Taxpayer Service Division. The Real Property Tax Division is responsible for the administration and enforcement of the real property tax laws mandated by Title 11, Guam Code Annotated, Section 24101. Within the Real Property Tax Division, there are two branches, Appraisal and Assessment. Real Property Tax Appraisal Branch The Real Property Tax Appraisal Branch is responsible for the identification, appraisal and development of property record cards for all taxable improvements and land for the island of Guam. This Branch likewise, acts as the compliance arm of the Division and is staffed by the Branch Supervisor, Tax Appraisers II and Tax Appraisers I. Real Property Tax Assessment Branch The Real Property Tax Assessment Branch is obligated to the conservation and updating of all property tax records, the development of the annual tax assessment roll and delinquent list, issuing annual tax statements and arranging tax sales and tax deeds for recordation at the Department of Land Management. The Assessment Branch functions as the taxpayer service and collection arm of the Division and is staffed by the Branch Supervisor, Tax Technicians I, Tax Appraiser II and Tax Technician III support staff. As of September 30, 2012, DRT RPT’s Division had 15 employees, seven in the Appraisal Branch, seven in the Assessment Branch, and one Administrator. Real Property Taxes Property taxes are generally computed by applying a levy amount to a taxable base. Governmental legislative bodies must approve the levy rate. U.S. nationwide, real property is generally assessed on a continuing basis – every two or three years – which allows the government to collect increased total dollars without increasing the tax levy rate. Taxes levied

5
on real estate are a primary revenue source for many local governments. Guam’s tax code mandates that all real property be reappraised every five years. It is common knowledge that periodic reappraisals of all real property on Guam required by law have not been performed since 1993. Assessment of Real Property Taxes Guam’s real property taxes (RPT) are outlined in Chapter 24, Title 11 of the Guam Code Annotated. On or before September 1 of each tax year, the RPT Division is mandated to make available a tax roll listing identifying all taxable properties and corresponding tax assessments levied. By October 31 each year, the tax assessment roll is to be certified and real property taxes become due and payable on December 15. The tax levy is divided into two installments: the first installment is due February 20; the second installment is due April 20. Real property taxes become a lien on the property as of noon the first Monday in March each year. To secure the payment of all taxes, penalties and interest is ultimately imposed on the property. For example, an assessment done in October 2012 is due in two installments, one in February 2013 and the second and final installment in April 2013. The assessed value of the property is a percentage of the appraised value. Starting in 2007, several public laws increased the assessed value for real property taxes from 70% to 90% to 100%. Correspondingly, the property tax rates were reduced with each increase, resulting in no net increase in real property taxes. The increase in assessed value, however, did increase the debt ceiling limitation. Taxes for land and improvements have different rates. Debt Ceiling Calculation Real property values have a direct impact on the debt ceiling limitation for the Government of Guam. In accordance with Section 1423a of the Organic Act, the debt ceiling limitation or public indebtedness must not exceed 10% of the aggregate tax value (assessed value) of property in Guam, which was $1.1 billion (B) in FY 2011. Since 2007, the Guam Legislature has updated the assessed value of real property as follows:
• Public Law 29-19, increased the assessed value from thirty-five (35%) to seventy percent (70%) of the appraised value and decreased the tax rates from 1/4% to 1/8% or .00125 (for land) and from 1% to ½% or .005 (for improvements).
• Public Law 30-7 updated the value from seventy percent (70%) to ninety percent (90%) and reduced the tax rates to 7/72% or .00097222 (for land), and 7/18% or .00388889 (for improvements).
• Public Law 31-196 updated the value from ninety percent (90%) to one hundred percent (100%) and further reduced the tax rates to 7/80% or .000875(for land) and 7/20% or .0035 (for improvements) effective tax year 2012. The fixed tax rates apply to all types of building structures and land property, whether residential, commercial, agricultural or other.
6
Results of Audit
Our audit of the Department of Revenue and Taxation’s (DRT) real property taxes identified $15.7 million (M) in unrealized, lost, and forgone real property tax revenues comprised of $14M from the outdated valuation system, $1.6M from escape assessments, and $57 thousand (K) due to a lack of interface with the Department of Public Works (DPW) and Department of Land Management. Additionally, there were $858K in questioned costs based on our testing and review. Specifically, we identified:
• Tax assessments were based on a valuation system completed in 1993, or 20 years ago, thus current market values are not used and instead were adjusted downward to reflect the 1993 values, resulting in unrealized and lost tax revenues estimated at $14M over the past five years;
• Guam’s property tax rates are among the lowest in the 50 United States and District of Columbia and property values are the lowest;
• Real property tax exemptions and reduced tax rates for senior citizens and home exemptions represent $2.6M annually of forgone tax revenues, or $13.2M in the past five years;
• 1,605 real properties had 9,480 Escape Assessments (EA) resulting in foregone property taxes totaling $1.6M;
• A lack of interface between DPW Building Permits & Inspection Section and the DLM to recognize a change in real property values as well as sales of real property, updated renovations, and changes in lien resulting in $57K in unrealized and lost tax revenues;
• $858K in questioned costs based on our testing and review. The largest was the Board of Equalization’s approval of a major reduction in hotel value, resulting in $574K in questioned costs; and
• All real property tax division staff have the ability to input into DRT’s database, i.e. home values, exemptions, abatements, etc., without secondary controls or review.
We were unable to test tax rolls and tax exemptions provided by DRT for completeness and accuracy.
Current Market Values Not Being Used DRT is required to re-ascertain the value of all property on Guam every five years. DRT’s last comprehensive reappraisal was completed in March 1993 and updated valuations took effect in tax year 1995. DRT has acknowledged they have not reappraised the value of property as mandated by Guam’s tax code. As a result, DRT’s real property tax assessments are based on valuations that were last updated 20 years ago. Further, current market values based on actual sales, new constructions, and renovations are not being used to assess real property taxes resulting in unrealized revenues of approximately $14M for a four-year period. See Table 1 for a summary of estimated forgone property taxes and Appendix 2 for details on OPA’s methodology and calculation.

7
Table 1: Summary of Estimated Foregone Property Taxes Estimated Lost Property Taxes due to
Lack of Reappraisals FY 2011 $ 4,689,464 FY 2010 $ 3,541,734 FY 2009 $ 2,633,492 FY 2008 $ 3,222,923 FY 2007 Not Available TOTAL $ 14,087,613
According to Cornerstone Valuation Guam, Inc., a local real estate valuation and advisory services company, the average home sale values as of 2011 was $243K; a difference of $90K from the DRT listed value of $153K (see Table 2 below). If DRT assessed real property taxes based on market value, the appraised value on 57,083 properties would have been $13.9 billion (B), a difference of $5.2B. Tax assessments would have been $25M. When compared to DRT’s assessments of $16M, the difference is $9.5M. However, due to possible overstatement of market value, we provided a conservative 50% allowance resulting in an estimated difference of $ 4.7M See Table 2 below for 2011 and Appendices 8, 9, and 10 for 2008–2010.
Table 2: 2011 Summary of Estimated Lost Property Taxes
Per DRT Market Based Value Difference 50% AllowanceProperty Count-Residential 57,083 57,083Total Appraised Home Value $ 8,705,182,595 13,858,439,491$ 5,153,256,896$ 2,576,628,448$ Average Appraised Value $ 152,500 242,777$ 90,277$ 45,138$ Total Assessed HomeValue $ 7,834,664,329 12,472,595,542$ 4,637,931,213$ 2,318,965,603$ Average Assessed Value $ 137,250 218,499$ 81,249$ 40,624$ Land -Assessed Value $ 5,039,552,218 7,982,461,147$ 2,942,908,929$ 1,484,137,986$ Building -Assessed Value $ 2,795,112,110 4,490,134,395$ 1,695,022,285$ 834,827,617$ Land -Tax 4,899,542$ 7,760,724$ 2,861,182$ 1,442,912$ Building Tax 10,869,898$ 17,461,639$ 6,591,741$ 3,246,553$ Total Tax 15,769,440$ 25,222,363$ 9,452,923$ 4,689,464$
Tax Year 2011
DRT-Based Valuations 2007-2011 Based on the data obtained, the average appraised price on residential properties was $153K while the assessed price was $125K. The average assessed value was calculated by taking the total assessed value per year, then dividing it by the property count per year. On average, tax assessments between the years 2007 through 2011 were based on the value of $125K per residential property. See Table 3 below for DRT’s appraised and assessed values.

8
Table 3: DRT’s Appraised and Assessed Values
YearProperty
Count Land Building Total Land Building Total2011 57,083 5,599,502,472 3,105,680,123 8,705,182,595 152,500 5,039,552,218 2,795,112,110 7,834,664,328 137,2502010 55,346 5,589,617,322 2,918,596,662 8,508,213,984 153,728 5,030,655,590 2,626,736,995 7,657,392,585 138,3552009 54,709 5,511,133,330 2,859,491,376 8,370,624,706 153,003 4,960,019,997 2,573,542,238 7,533,562,235 137,7022008 54,012 5,445,027,051 2,764,544,779 8,209,571,830 151,995 3,811,518,935 1,935,181,345 5,746,700,280 106,3972007 53,379 5,439,892,693 2,684,470,862 8,124,363,556 152,201 3,807,924,885 1,879,129,603 5,687,054,488 106,541
Total: 274,529 27,585,172,869 14,332,783,802 41,917,956,670 22,649,671,625 11,809,702,292 34,459,373,917Average 54,906 5,517,034,574 2,866,556,760 8,383,591,334 152,686 4,529,934,325 2,361,940,458 6,891,874,783 125,249
Average per
Property Count
Appraised Values Average per
Property Count
Assessed Values
We confirmed that DRT-RPT is also utilizing the factor/formula used in 1993 re-appraisal of real properties even for new properties acquired, constructed and renovated and did not use the current appraised values utilized by financial institutions. DRT has cited budgetary constraint as the main factor for the non re-appraisal of real properties for 20 years.
Market-Based Valuations 2008~2011 Market-based home average values from 2008 to 2011 ranged from $207K to $243K for an average of $224K, $71K more than the average appraised value calculation used by DRT. Average market-based assessed values based on DRT’s property count per year ranged from $154K to $218K for an average of $191K per year, $65K more than the averaged assessment calculation used by DRT. Table 4 below summarizes market based appraised and assessed values with land and building calculations based on DRT’s calculation formulas and rates. See Appendix 2 for calculation and methodology.
Table 4: Market Based Average Home Values Calculated by OPA
Property Count x Average Value
Property Count x Average Value
Calendar Year
Property Count Land Building Total
Average Value Land Building Total
Average Value
2011 57,083 8,869,401,274 4,989,038,217 13,858,439,491 242,777 7,982,461,147 4,490,134,395 12,472,595,542 218,4992010 55,346 8,260,450,274 4,255,383,474 12,515,833,748 226,138 7,434,405,246 3,829,845,127 11,264,250,373 203,5242009 54,709 7,491,350,420 3,859,180,519 11,350,530,939 207,471 6,742,215,378 3,473,262,467 10,215,477,845 186,7242008 54,012 7,825,253,159 4,031,191,021 11,856,444,180 219,515 5,477,677,211 2,821,833,715 8,299,510,926 153,661
Total: 221,150 32,446,455,126 17,134,793,232 49,581,248,358 27,636,758,982 14,615,075,704 42,251,834,686Average 55,288 8,111,613,782 4,283,698,308 12,395,312,090 223,975 6,909,189,746 3,653,768,926 10,562,958,672 190,602
Appraised Values Assessed Values
Real Property Tax Assessments Adjusted Downward to 1993 Values The current assessment of real property taxes for new property sales, construction, and renovations are adjusted downward to reflect 1993 values. DRT stated that due to fairness and equal protection issues, they adjust new properties sold today downward to 1993 values. For example, if a taxpayer builds a house this year, DRT calculates the tax assessment based on the formulas provided in the 1993 valuation, not on current values. DRT is required by law to use the most recent valuation study to determine tax rates for all properties on Guam. To confirm this condition, OPA acquired information on two home purchases in 2011 as examples and compared and calculated the appraised value and assessed value.

9
Example 1: In November 2011, a home sold for $946K, but was adjusted downward by DRT to $549K, a difference of $397K in appraised value. DRT’s assessed value was $494K and the property taxes due was $1,662. If the property had been assessed at 90% of its sales value of $946K, the assessed value would have been $851K and taxes due would have been $2,864, a difference of $1,201 or 72% more.
Example 2: In April 2011, a home sold for $505K, but was adjusted downward by DRT to $232K, a difference of $273K in appraised value. DRT’s assessed value was $209K and the property taxes due was $716. If the property had been assessed at 90% of its sales value of $505K, the assessed value would have been $455K and taxes due would have been $1,556, a difference of $840, or 117% more.
Utilizing current market values based on current property sales could generate an approximate average of 95% more on property tax assessments which in turn would generate far more property tax revenue. See Table 5 for an illustration on the differences of tax assessments between current market values and the 1993 valuation.
Table 5: 2011 Sample Residential Home Sales
Sale Date Selling Price Appraised Value Assessed Value Total Tax Appraised Value Assessed Value Tax Assessment Appraised Value Assessed Value Tax Assessment Percentage11/3/2011 945,840$ 945,840$ 851,256$ 2,864$ 548,593$ 493,724$ 1,662$ 397,247$ 357,532$ 1,201$ 72%
4/4/2011 505,100$ 505,100$ 454,590$ 1,556$ 231,924$ 208,732$ 716$ 273,176$ 245,858$ 840$ 117%
2011 Property Sales DRT Formulated Calculation DRT Information Variances
Based on the data obtained from the Guam Statistical Yearbook 2011, for fiscal years 2007-2011, the permits issued to new residential constructions totaled 1,554 with total construction costs amounting $292M, which would represent $516K in total tax assessments. See Table 6 below.
Table 6: Residential New Construction Building Permits Issued FY 2007 ~ 20111
Guam Statistical Yearbook 2011 Data
Fiscal YearProperty
Count
Construction Cost/Appraised
ValueTotal Assessed
ValueAssessed Value-
LandAssessed Value-
Building Land Tax Building Tax Total Tax2011 199 40,455,000$ 36,409,500.0 23,302,080.00 13,107,420.00 22,654.79 50,973.31 73,628.11 2010 371 60,808,000$ 54,727,200.0 36,119,952.00 18,607,248.00 35,116.61 72,361.54 107,478.15 2009 287 42,404,000$ 38,163,600.0 25,187,976.00 12,975,624.00 24,488.30 50,460.77 74,949.08 2008 357 62,636,000$ 43,845,200.0 28,937,832.00 14,907,368.00 36,172.29 74,536.84 110,709.13 2007 340 85,863,000$ 60,104,100.0 40,269,747.00 19,834,353.00 50,337.18 99,171.77 149,508.95
1554 292,166,000$ 233,249,600.0 153,817,587.00 79,432,013.00 168,769.18 347,504.23 516,273.42
DRT Formula Calculations
The construction costs were used as the basis for OPA’s calculated assessment due to unavailability of data on appraised value. We believe that the construction cost is a conservative amount to use since an appraised value of a property is as an approximate market value established by independent & certified professionals. Presumptively, this data should be inclusive within DRT’s tax rolls but because of the lack of interface between DLM, DPW, and DRT, we could not confirm it. 1 Real property taxes are calculated on a tax year basis; however, the Guam Statistical Yearbook data we used to estimate taxes on new construction was presented on a fiscal year basis.

10
Guam Among Lowest in Property Tax Rates in the United States Guam’s effective real property tax rate, which is the average annual property tax as a percentage of the median property value per the 2011 Assessment Tax Roll, was 0.29%. When compared to the rest of the 50 States and District of Columbia’s average individual effective tax rates, Guam, has the second lowest real property tax rate followed by Alabama at .40% then Louisiana at 0.48% and West Virginia at 0.51%. From 2007 to 2011, Guam maintained being among the lowest property-taxed locations. See Table 7 for the top 10 lowest property tax rates in 2011. See Appendix 4 for a complete listing and ranking of 2011 property tax rates.
Table 7: Top 10 Lowest Property Tax Rate in 2011
State/Jurisdiction Effective Tax Rate Ranking
Hawaii 0.28% 1 Guam 0.29% 2 Alabama 0.40% 2 Louisiana 0.48% 4 West Virginia 0.51% 5 Delaware 0.52% 6 South Carolina 0.54% 7 District of Columbia 0.58% 8 Wyoming 0.58% 8 New Mexico 0.60% 10
Guam has the Lowest Property Values in the United States Between 2007 and 2011, Guam’s average median property values in which taxes were assessed amounted to $92,014. Based on the most recent data available, in 2010, Guam ranked the lowest with median property valued at $92,792. In 2008, Guam was again the lowest with a median property value of $91,145. See Table 8 below for the 15 lowest median home values in 2008 and 2010 in the 50 United States, District of Columbia, and Guam. See Appendix 5 and 6 for a complete list and rank of the lowest property values in 2008 and 2010 in the United States, District of Columbia, and Guam.
Table 8: 2008 and 2010 Lowest Property Values in US, District of Columbia, and Guam2 2008 2010
State Median
Home Value Rank State
Average Median Home
Value3 Rank Guam $ 91,145 1 Guam $ 92,792 1 West Virginia $ 95,900 2 West Virginia $ 118,686 2 Mississippi $ 99,700 3 Arkansas $ 122,618 3 Oklahoma $ 105,500 4 Oklahoma $ 122,982 4 Arkansas $ 105,700 5 Texas $ 125,513 5 North Dakota $ 112,500 6 Mississippi $ 125,850 6 Kentucky $ 118,400 7 Alabama $ 127,176 7 Iowa $ 120,700 8 Indiana $ 130,452 8 Alabama $ 121,500 9 Michigan $ 131,759 9
2 For 2010, the average median home value was derived for each state as the data from the tax foundation was based on a median value by county level.

11
2008 2010
State Median
Home Value Rank State
Average Median Home
Value3 Rank Indiana $ 125,200 10 Ohio $ 134,774 10 Kansas $ 125,700 11 Kentucky $ 135,338 11 South Dakota $ 126,200 12 Louisiana $ 140,012 12 Nebraska $ 126,500 13 South Carolina $ 140,138 13 Texas $ 126,800 14 Missouri $ 143,535 14 Louisiana $ 132,400 15 Iowa $ 145,440 15
Real Property Tax Exemptions and Reduced Tax Rates Exemptions and reduction in real property taxes with certain criteria are available for taxpayers who apply to receive these authorized benefits. Based on current laws, exempted properties include (1) all properties titled to the United States or Government of Guam, except lessees or licensees of Chamorro Land Trust properties, (2) public roads or easements, (3) educational, religious, or other eleemosynary purposes, (4) cemeteries, (5) active farms used at least eight months in any tax year, and (6) fallout shelters. Other properties that are eligible for credits or reduced tax rates include (1) senior citizens who are heads of household, (2) persons with disabilities and heads of households with dependents with disabilities, and (3) homeowners within their principal residence. See Appendix 7 for requirements for exemptions. Based on the data obtained, exemptions issued annually rose steadily from $3.7M for 21,760 properties in FY 2007 to $4.1M for 23,592 properties in FY 2011. This upward trend in the quantity and total property exemptions did not just begin in the last five years, but instead originated in 1999, the earliest data provided by DRT. The total amount of all exemptions from FY 2007 to FY 2011 is $20M. See Table 9 below for forgone taxes based on exemptions and reduction in taxes.
Table 9: Forgone Taxes Based on Exemptions and Reduction in Taxes Cost per Count
Assessment Year Count
Sum of Exemptions
Senior Citizen
Home Exemption Total
Count of Exemption
Types 2011 23,592 $ 4,148,560 $ 181 $ 171 $ 176 18 2010 24,180 $ 4,170,042 $ 181 $ 171 $ 172 18 2009 23,442 $ 4,046,304 $ 181 $ 171 $ 173 19 2008 22,732 $ 3,881,469 $ 180 $ 171 $ 171 19 2007 21,760 $ 3,652,445 $ 180 $ 171 $ 168 18 Total 115,706 $ 19,898,820
Total exemptions from 2007 to 2011 amounted to $20M. The largest exemption is the Senior Citizens exemption, totaling $8.6M or 43%, followed by the homeowner’s exemption totaling $4.6M or 23%. Government exemptions totaling $3.1M or 16% represents the third largest exemption category followed by farm exemptions for $1.8M or 9%; and church exemptions for $998K or 5%. See Appendix 11 for details of exemptions by fiscal year.

12
Senior citizens and home exemptions represented the largest exemptions, with average count of 14,926, at an average amount of $2.6M, or 66%. Senior citizen exemptions are given to taxpayers who have reached the age of 55. P.L. 24-267 lowered eligibility from the original age 60 to 55. Senior citizens are eligible for Medicare and Medicaid at age 65. Senior citizen exemptions have increased from 8,568 in 2007 to 10,195 in 2011, or an average of 9,515 in five years. The exemption amount also increased from $1.5M in 2007 to $1.8M in 2011, or an average amount of $1.7M. The amount of the senior citizen exemption is an 80% tax credit. The average senior citizen tax exemption amounted to $181 per eligible taxpayer. Home exemptions are granted to all property owners who are currently residing in their properties. The amount of the homeowner’s exemption is a tax credit of $175 per eligible taxpayer. The homeowner’s exemption has increased from 5,384 in 2007 to 5,469 in 2011, or an average of 5,411 in five years. The exemption amount has increased from $920K to $934K or an average of $925K per year. Until such time that a comprehensive reappraisal is completed, we recommend a moratorium be placed on senior citizen and home exemptions and the eligibility for senior citizens be raised to age 65. Foregone Revenue due to Escape Assessments The 2011 Tax Assessment Roll included 1,605 real properties accounting for 9,480 escape assessments ranging from tax years 1982 thru 2010. These escape assessments resulted in foregone revenue totaling to $1.6M. Escape Assessment (EA) is a correction made on a tax roll for a taxable property that should have been assessed but no assessment was previously made thus tax were not collected. According to DRT, the government has not conducted a public auction on any real property which had been in tax arrears for several years. No Interface Between the Department of Public Works and Department of Land Management In a previous audit on the Department of Public Works Building Permits & Inspection Section (OPA Report No. 11-05), we found that DRT and DPW do not compare appraisal values for new construction projects that are required to submit documents to both entities. Specifically, DPW does not communicate with DRT on new construction and renovations when building permits are issued and that construction cost estimates on building permit applications do not factor into property tax assessments. Thus, DRT has no way of knowing when renovations occur or what effect they have on property values, since they do not conduct inspections. Based on the data obtained from the Guam Statistical Yearbook 2011, there were 700 residential additions with total construction costs amounting $32.1M. See Table 10 for the building permits issued for residential additions/renovations.

13
Table 10: Residential Additions/Renovations Building Permits Issued 2007 ~ 20114
Tax YearProperty
CountConstruction
Cost Average Land Building Land TaxBuilding
Tax Total Tax2011 110 4,948,000$ 44,982$ 2,850,048$ 1,603,152$ 2,771$ 6,234$ 9,005$ 2010 127 6,239,000$ 49,126$ 3,705,966$ 1,909,134$ 3,603$ 7,424$ 11,027$ 2009 161 8,015,000$ 49,783$ 4,760,910$ 2,452,590$ 4,629$ 9,538$ 14,167$ 2008 167 7,054,000$ 42,240$ 3,258,948$ 1,678,852$ 4,074$ 8,394$ 12,468$ 2007 135 5,843,000$ 43,281$ 2,740,367$ 1,349,733$ 3,425$ 6,749$ 10,174$
700 32,099,000$ 17,316,239$ 8,993,461$ 18,502$ 38,340$ 56,841$
Assessed Value Tax Assessment
Guam Statistical Yearbook 2011 Data DRT Formula Calculated
Between 2007 and 2011, DPW issued 700 building permits, with a value of $32.1M, for residential additions and home upgrades. Had DRT used these current assessments, an additional $57K in real property taxes would have been assessed. Taxpayers are not required to provide documentation to DLM and DLM does not provide information to DRT. DPW has a requirement of obtaining clearance from DRT in order to issue an occupancy permit within the permit issuance process. However, DRT’s only process in completing this step is to ensure that there are no real property taxes delinquent and does not collect information on the renovation nor change the value of the property. Moreover, DPW does not require building permits for renovations with costs of less than 25% of the value of the structure. Establishing a communication protocol between DRT and DPW would provide DRT additional information to verify the validity of its existing values which then can be updated accordingly. OPA has previously recommended DPW establish a communication protocol with DRT to ensure proper assessment of real properties in OPA Report No. 11-05, issued in August 2011. As of this report date, this protocol has yet to be established. DLM’s Deputy Civil Registrar confirmed that DLM’s only role with respect to property is the recording of all pertinent documents such as ownership, land subdivision, transfers, and liens, and are not concerned with the valuation of properties. The documents that DLM forwards to DRT are properties involved with any kind of conveyances that result in an acquirement or change of ownership. DLM prepares documents for DRT to retrieve on a monthly basis but stated that the monthly pickup has been inconsistent. The land recordings at DLM are a means for DRT to verify updated sales, new construction and renovation. With interfaces at DPW and DLM, DRT could then conduct real property reviews based on this interface and then update the real property tax base accordingly.
Increase in Overall Assessments, Exemptions, Taxes & Collections There has been an overall steady increase in the number of real properties of 4,132 from 62,293 in 2007 to 66,425 in 2011 or 7%. This was followed by a corresponding increase in appraised values from $11.4B to $12.2B and assessed values from $8B to $11B. Additionally, tax
4 Real property taxes are calculated on a tax year basis. However, the Guam Statistical Yearbook data to estimate taxes on additions/renovations was presented on a fiscal year basis. The construction costs were used as the basis for OPA calculated assessment due to unavailability of data on appraised value. We believe that the construction cost is a conservative amount to uses since an appraised value of a property is as an approximate market value established by independent & certified professionals.

14
assessments rose from $23.1M to $25M or 8% with corresponding increase in exemptions from $3.7M to $4.2M or 13%. RPT collections have been averaging $20M annually in the past five fiscal years for an average of 64,090 properties. See Table 11 for more details of the RPT assessments, exemptions, taxes due, and revenues collected.
Table 11: RPT Assessments, Exemptions, Net Tax Due and Revenue Collection, Adjusted
Assessment/Collection
YearCount of
Properties Appraised Value Assessed ValueTotal Tax
Assessment Exemptions Net Tax Due Revenue Variance2011/2012 66,425 12,252,517,247$ 11,027,265,514$ 25,005,619$ 4,188,626$ 20,816,992$ 19,225,091$ (1,591,901)$ 2010/2011 64,701 12,053,176,473$ 10,847,858,824$ 24,403,750$ 4,208,689$ 20,195,060$ 20,577,294$ 382,234$ 2009/2010 63,906 11,818,604,606$ 10,636,744,143$ 23,963,993$ 4,096,137$ 19,867,856$ 19,452,108$ (415,748)$ 2008/2009 63,125 11,597,998,615$ 8,118,599,028$ 23,422,374$ 3,921,300$ 19,501,074$ 20,310,866$ 809,792$ 2007/2008 62,293 11,440,155,753$ 8,008,109,025$ 23,123,365$ 3,704,586$ 19,418,779$ 21,031,708$ 1,612,929$
Total 320,450 59,162,452,694$ 48,638,576,533$ 119,919,100$ 20,119,339$ 99,799,761$ 100,597,067$ 797,306$ Average 64,090 11,832,490,539$ 9,727,715,307$ 23,983,820 4,023,868$ 19,959,952$ 20,119,413$
Information provided by DRT was adjusted to exclude duplicated property assessments in prior years that remain unpaid.
Questioned Costs from Results of Audit Tests We tested 100 real property accounts which represented .15% of the total property count of 66,425 in 2011. We were unable to test the tax rolls and tax exemptions provided by DRT for completeness and accuracy. Based on our 100 testing samples, we found questioned costs of $93K as follows:
• Of the 37 properties with exemptions selected for review, 15 properties, totaling $88K in questioned costs from 2007 to 2011, did not have evidence to support eligibility. According to DRT-RPT, they did not have hard or soft copies of documents for exemptions granted prior to 1995. According to 11 GCA §24409, once a claim is filed, it shall have continuing effect as a new claim for the exemption for each subsequent year, unless it is disallowed or voided. We urge DRT to contact these taxpayers to provide proof of eligibility.
• A business owned hotel was misclassified as a Guam Economic Development Authority
(GEDA) qualified recipient for Qualifying Certificate, resulting in 100% exemption on their real property taxes totaling $5K from 2007 to 2011. DRT confirmed this business was not qualified to receive this exemption and stated they will look into the matter.
• We found the Affidavit for Tax Credit (for Senior Citizen Exemption) and Application
for Home Exemption were not reviewed and approved by management. Additionally, senior citizen and home exemptions were not reviewed periodically to determine if the taxpayer is still eligible for the exemptions presently availed. Although exemptions have a continuing effect for each subsequent year, we recommend DRT conduct random reviews of all exemptions to determine if there has been change in the claims. According to 11 GCA §24409, it is the duty of every person to report any change. Failure to do so is subject to legal sanctions.

15
• We found two privately owned properties with significant land areas that were appraised for only $1.00 each, resulting in no property taxes collected. According to DRT-RPT these properties are still under research to determine the appraisal. However, we were not able to quantify the financial impact of these findings.
DRT should follow up on these questioned cost items to correct its database.
Anomalies Found in Tax Roll Database Review In addition to our testing, we reviewed the 2011 tax roll data base provided. Based on our analytical review of the data, we found questioned costs totaling $765K as follows: • A hotel property which had a total appraised value of $117M (for three towers) in tax year
2007 reduced its appraised value to $76M during tax years 2008 to 2011. Due to the reduction of the appraised value, the tax assessment was reduced from $410K to $266K, or a total tax reduction of $574K for the four years reviewed. Although the reduction of appraised values had approval from the Board of Equalization (BOE), we could not verify with the documents provided what factors led to the significant reductions in the appraised value to warrant the approval. Because of the significant reduction, we question the Board’s due diligence in the approval of this reduction. Accordingly, the DRT Director should review this matter further.
• A hotel property which had a total appraised value of $26M in tax years 2007 to 2010
reduced its appraised value by $20M in tax year 2011. Due to the reduction of the appraised value, tax assessment was reduced by $70K. DRT has yet to provide the BOE letter of approval for the reduction of tax assessment for 2011. Accordingly, a questioned cost of $70K arises. We were informed that they have been unable to locate the document.
• In the 2011 tax roll, there were 7,506 real properties given 100% tax exemption or no
property tax was collected. These properties have a total appraised value of $1.2B and total assessed value of $1.1B. Tax assessments which were uncollected for these properties amounted to $1.5M. Based on the data provided by DRT-RPT, if we are to deduct qualified 100% exemptions such as government lands, farm, church, rights of way, non-profit, ponding basin and return of federal lands (ancestral lands) totaling $1.3M, there are still exemptions that cannot be identified amounting to $121K in questioned costs. Additionally, although, ancestral lands are subject to real property tax moratorium per Public Law 29-88, DRT needs verify if landowners have access to the property so taxes could be assessed retroactively.
• There are 5,353 real properties that are owned by taxpayers who do not have or have not
provided a mailing address to DRT. Ninety-two of these real properties had escape assessments from one to 14 years totaling $77K5. According to DRT, in the old system, to input a new data without mailing address is acceptable thus some taxpayers opted to pick up the statement instead of being mailed and DRT deleted its address on the system. According to RPT Administrator, the issue regarding mailing address will be corrected in the tax year 2013.
5 The calculation for this $77K was already included in the $1.6M foregone revenue due to escape assessment.
16
• The 2011 tax roll included 16 building properties with an appraised value of $1.00 each, which according to DRT-RPT were demolished/abated /abandoned since 1995. It also included four building properties of a business account with building areas of 5,800 sq m and 2,548 which according to DRT –RPT were duplicated records or incorrect assessment. DRT has not done an inspection to determine if in fact these 16 properties remain unimproved and have no real property tax values. DRT should conduct an inspection on these properties.
• We found several properties that were not classified in accordance with the classification
provided to OPA by DRT. According to DRT-RPT, real properties were classified and can be identified by the initial number of their account number or PIN as follows:
• Code 1 – Residential (1 to 4-plex) • Code 2 – Condominium • Code 3 – Hotel • Code 4 – Town homes • Code 5 – Multi-Family (5+unit apartments) • Code 6 – Commercial/Special Purpose • Code 7 – Agricultural/Farm Building • Code 8 – Churches • Code 9 – Government-Owned
As an example, several government and business properties were classified under residential. There were 502 properties included under hotel classifications, although there are only 47 hotels specifically identified. Banks and investment houses were classified as condominiums; and churches or religious organizations were classified as town homes. DRT should update its tax roll based on the anomalies found. Further, DRT should conduct periodic reviews of its tax rolls to ensure accuracy and current values. Access to DRT’s Database Based on our discussions with the Real Property Tax Division Administrator, Appraisal and Assessment staffs have the ability to update, change, or delete data in their database, also known as Manatron GRM /Proval System, without a secondary control, review, or approval. The system does generate a production report which summarizes daily transactions; however, there is no review by management to determine if the changes, additions, or subtractions are authorized. We recommend DRT place controls in their database to limit input access and ensure a secondary review by management.
Request for Proposal for Appraisal and Revaluation Services DRT did issue a request for proposal (RFP) in March 2013 for appraisal and revaluation services. The intent of the RFP was to enlist professional services to assist the Administrator of the Real Property Tax Division with the revaluation process. Specifically, the bidder was required to (1) conduct a valuation of all taxable and exempt land, improvements, building, residential, commercial, industrial, special use and leased land property parcels on the Guam Property Assessment System, (2) provide training for RPT division staff so that, at the end of the project, they will be knowledgeable in the development of new valuations, and (3) defend valuations and methodologies (if necessary). However, only one bidder submitted a proposal and negotiations were terminated because the bidder could not meet the delivery requirements established in the
17
RFP. We recognize that DRT has had challenges in issuing this RFP. However, we recommend that the RFP be issued forthwith. Lack of Technical Assistance on Computer Systems Between November 2012 and December 2012, RPT records were converted from the Legacy System (AS400) into the Manatron GRM/Proval System. There was no access to AS 400 during the one month period. RPT went live under Manatron effective January 2012 covering tax year 2012 for Fiscal Year 2013. Annual Tax Statements for tax year 2012 were generated under GRM/Proval system. The maintenance agreement for the Manatron GRM/Proval System which was implemented January 2012, had expired in January 2013, thus RPT is working on the system using the Help Center to troubleshoot. DRT has cited budgetary constraint as the main factor for the non renewal of maintenance agreement. DRT RPT staff has said that without the assistance of the contract, they will continue to have challenges in operating the system. Board of Equalization We found that 2012’s tax assessment roll has yet to be certified by BOE, which should have been done in October 2012. According to the DRT Director, the BOE lacked a quorum; however, tax statements were still mailed out even though the 2012 tax roll was not certified. According to the DRT-RPT Administrator, the Board last met in October 2011 to certify the 2011 Tax Roll.

18
Conclusion and Recommendations Guam’s property tax rates are among the lowest in the nation while property values are the lowest. Real property tax assessments are based on valuations that were last updated 20 years ago. Guam’s tax code mandates that all real property be reappraised every five years to ensure that values are current. As a result of noncompliance with our tax code, a significant revenue leakage of approximately $14M in unrealized revenues has occurred over the last five years. This is primarily due to GovGuam’s decision not to use current market values for the real property tax assessments and additional $1.6M in escaped assessments. An additional $57K in foregone revenues was due to a lack of interface between DPW and DLM. Additionally, we found $858K in questioned costs based on deficiencies identified in our audit. The largest questioned cost of $574K in real property taxes was from the Board of Equalization’s approval of a major reduction in hotel value. We questioned the Board’s due diligence in the approval of this reduction. An additional $191K in questioned costs arose from the reduction of appraised values/tax assessments without approval documents and undetermined 100% exemptions. Lastly, $93K in questioned costs was from a lack of exemption documentation. As a result, there are significant unrealized and lost tax revenues that could be returned in the form of vital services such as education for our children, fire and police protection, street maintenance and repair, and other public services. To reduce revenue leakage and enhance collections in real property taxes, we recommended that the DRT Director work with the Guam Legislature and the Governor of Guam to:
1. Amend 11 GCA §24306 to authorize DRT to utilize current values for real property tax assessment for new construction, renovations, and current sales rather than adjusting downward to 1993 values;
2. Place a moratorium on senior citizen and home exemptions until the 1993 valuation is
updated;
3. Amend 11 GCA §24110 by raising eligibility for senior citizens from age 55 to 65 to receive a reduction in real property taxes;
Director of the Department of Revenue and Taxation
4. Issue the request for proposal for appraisal and revaluation services; and 5. Establish a communication protocol with DPW and DLM to include the updated
assessment of real properties.
6. Conduct random reviews periodically of all exemptions to determine if there has been change in the claims.
7. Place controls on DRT’s database to limit input access and ensure a secondary review by
management.

19
Management Response and OPA Reply A draft of this report was transmitted to DRT’s in August 2013 for review and response to our recommendations. We met with the Director, Deputy Tax Commissioner, and RPT Administrator in August 2013 and briefed them on our report findings and recommendations. Based on DRT’s response, they generally agree with the findings and recommendations. See Appendix 12 for their response. The legislation creating OPA requires agencies to prepare a corrective action plan to implement audit recommendations, to document the progress in implementing the recommendations, and to endeavor to have implementation completed no later than the beginning of the next fiscal year. Accordingly, we will be contacting DRT to provide target dates and title of the official(s) responsible for implementing the recommendations. We appreciate the cooperation shown by the Department of Revenue and Taxation during the course of this audit.
OFFICE OF PUBLIC ACCOUNTABILITY
Doris Flores Brooks, CPA, CGFM Public Auditor

20
Appendix 1: Classification of Monetary Impact
Finding Description Foregone/Unrealized Revenues
Questioned Costs Total
Current Market Values Not Being Used $ 14,087,6136 $ - $ 14,087,613 DRT-Based Values 2007-2011 $ - $ - $ -
1
Market-Based Valuations 2008-2011 $ - $ - $ -
Real Property Tax Assessments Adjusted Downward to 1993 Values $ - $ - $ -
Foregone Revenues due to Escape Assessments $ 1,551,791 $ - $ 1,551,791 2
No Interface with Department of Public Works and Department of Land Management $ 56,841 $ - $ 56,841
3 Increase in Overall Assessments, Exemptions, Taxes & Collections $ - $ - $ -
4 Questioned Costs from Results of Audit Tests $ - $ 93,1957 $ 93,195
Anomalies Found in Tax Roll Database Review $ - $ 765,0458 $ 765,045 Access to DRT's Database $ - $ - $ -
Request for Proposal for Appraisal and Revaluation Services $ - $ - $ -
Lack of Technical Assistance on Computer Systems $ - $ - $ -
5
Board of Equalization $ - $ - $ - Total $ 15,696,245 $ 858,240 $ 16,554,485
6 Of the $14,087,613 in foregone/unrealized revenues, $4,689,464 was for FY 2011, $3,541,734 was for FY 2010, $2,633,492 was for FY 2009, and $3,222,923 was for FY 2008. 7 Of the $93,195, $88,471 was from senior citizen and home exemptions without documentation and $4,724 was from GEDA exemptions without documentation. 8 Of the $765,045, $574,456 was from the reduction in hotel appraised value, $69,585 was from the reduction of appraised values/tax assessments without approval documents and $121,004 was from undetermined 100% exemptions.

21
Appendix 2: Page 1 of 2 Objectives, Scope, and Methodology
Our audit objectives were to determine (1) Guam’s effective real property tax as a percentage of property value and where Guam ranks in comparison to the United States’ effective property tax rates, (2) whether real property taxes are accurately assessed, and (3) whether taxpayers afforded property tax exemptions are in fact eligible. The scope of this engagement is from October 1, 2007 to September 30, 2012 (FY 2008 to FY 2012). Scope Limitation We were unable to test the tax rolls and tax exemptions provided by DRT for completeness and accuracy. As a result, we relied DRT’s information provided for FY 2007 through FY 2011. Audit Methodology Our audit methodology included a review of pertinent Government of Guam laws, rules and regulations, policies, prior audit findings, and other relevant information pertaining to real property tax assessments and collections. We also performed the following:
• Assessed internal controls for the assessment of real property taxes and identified problems within the RPT Division related to the management of these taxes;
• Obtained reports from DRT RPT and analyzed data to determine the number of properties assessed real property taxes, number of exemptions and/or abatements issued, and the amount of taxes collected;
• Selected and tested a limited sample of transactions for compliance on whether real property tax exemptions were correctly applied;
• Selected and tested a limited sample of transactions to determine whether the taxes were accurately assessed based on the tax rates provided in law.
• Performed walkthroughs and physical observations to gain an understanding of the real property tax process at DRT’s RPT branch.
• Obtained from DRT RPT Tax Assessment Rolls and records of tax exemptions for tax years 2007 thru 2011.
• Analyzed the data in the rolls, summarized it and established trends of increase and decrease and variances.
• Adjusted the overstated tax roll amounts by deducting data corresponding to real properties with Escape Assessments (EA)
• Recalculated assessed values and tax assessments on all (100%) properties for tax years 2007 to 2011 to determine if assessed value percentage and tax rates prescribed law were correctly applied
• Using a judgmental random selection, we chose 100 real properties or .15% of the total 66,425 properties for tax year 2011. Out of the 100 samples, we chose 37 properties which were granted with exemptions or abatements to document approvals and determine if they are in fact eligible.
• We searched for the effective tax rate of the 50 US states and average median home values to determine Guam’s rank compared to the states.

22
Appendix 2: Page 2 of 2 Objectives, Scope, and Methodology
• We searched for market based average home value in Guam and compared it with DRT data to determine the foregone/lost revenue due to non-reappraisal of Guam properties to update current values
Methodology for determining assessments based on residential real properties average market values:
• We calculated the average appraised value of a residential property by taking the total appraised value and divided it by the total property count per year.
• We calculated the average assessed values of a residential property by taking the total assessed value and divided it by the total property count per year.
• We obtained the market value of residential properties by extracting the sales volume data from 2008 to 2011 provided by a local real estate advisor. Cornerstone Valuation Guam, Inc. The real estate advisor does not have available data for residential sales volume in 2007.
• Based on the total sales/market volume of each year, we calculated the market-based average value of residential properties by dividing the total sales by the total count of residential sales. Then we calculated the average market based total appraised value by multiplying the market based appraised average value by the total residential property count taken from DRT data.
• We took the sum and multiplied it by 90% for 2009, 2010, and 2011, and 70% for 2008, to determine the assessed value which is the basis for property tax assessment
• We took the assessed value and broke it into 64% for land and 36% for building (for tax year 2011), 66% (for land) and 34% (for building) for 2010, 2009, and 2008. Based on the actual ratio of land and building per DRT data.
• To obtain the amount of taxes for land, we multiplied the assessed value by the prevailing land tax rate of .000972222 (for 2009~2011) and .00125 (for 2008). To obtain the amount of taxes for building, we multiplied the assessed value by the prevailing building tax rate of .00388889 (for 2009~2011) and .005 (for 2008).
• We added the totals for the land taxes and building taxes to come up with the estimated tax assessments for market based appraised real property values.
• To arrive at a conservative estimate of foregone tax revenue, we provided a 50% allowance for possible overstatement of the average market value. Then, we multiplied the difference by property count. We computed the assessed value and applied the applicable tax rate.
We conducted this audit in accordance with the standards for performance audits contained in Government Auditing Standards, issued by the Comptroller General of the United States of America. These standards require that we plan our audit objectives and perform the audit to obtain sufficient, appropriate evidence to provide a reasonable basis for our findings and conclusions based on our audit objectives. Except for the scope limitation noted above, we believe that the evidence obtained provides a reasonable basis for our findings and conclusions based on our objectives.

23
Appendix 3: Prior Audit Coverage Office of Public Accountability Report No. 11-05, Department of Public Works (DPW) Building Permit and Inspection Section (2011) In August 2011, the OPA issued an audit report on DPW’s building permit and inspection section. This report identified no communication link between DPW and DRT in that DPW did not communicate with DRT on new construction and renovations and that construction cost estimates on building permit applications do not factor into property tax assessments. Department of Interior, Office of Inspector General – Guam’s Tax Collection Activities (2008) In November 2008, the DOI-OIG issued an audit report on Guam’s tax collection activities. This report identified the poor conditions at DRT for the past 20 years which include the agency not using current market values to develop tax assessments for privately owned real property, resulting in significant lost tax revenues. Guam’s tax code mandates that all real property be reappraised every five years to ensure that values are current. Periodic reappraisals of all real property on Guam required by law have not been performed since 1993, and Real Property does not update property records to reflect current value, even when the ownership of a piece of property is transferred or sold.

24
Appendix 4: 2011 Effective Property Tax Rates
State Effective Tax
Rate Rank State Effective Tax Rate Rank
N.J. 1.98% 1 Wash. 0.95% 27 Ill. 1.91% 2 Nev. 0.90% 28 N.H. 1.90% 3 Ind. 0.88% 29 Tex. 1.74% 4 Okla. 0.83% 30 Wis. 1.74% 5 Va. 0.82% 31 Nebr. 1.72% 6 Calif. 0.80% 32 Mich. 1.60% 7 N.C. 0.80% 33 Vt. 1.57% 8 Ariz. 0.77% 34 Ohio 1.52% 9 Idaho 0.77% 35 Conn. 1.49% 10 Ky. 0.76% 36 Pa. 1.41% 11 Tenn. 0.74% 37 R.I. 1.41% 12 Mont. 0.72% 38 N.Y. 1.38% 13 Utah 0.66% 39 Iowa 1.36% 14 Miss. 0.63% 40 Kans. 1.32% 15 Ark. 0.62% 41 N.D. 1.23% 16 Colo. 0.62% 42 S.D. 1.21% 17 N.M. 0.60% 43 Maine 1.11% 18 Wyo. 0.58% 44 Minn. 1.09% 19 D.C. 0.58% 45 Fla. 1.08% 20 S.C. 0.54% 46 Mass. 1.07% 21 Del. 0.52% 47 Alaska 1.01% 22 W.Va. 0.51% 48 Mo. 1.00% 23 La. 0.48% 49 Md. 0.99% 24 Ala. 0.40% 50 Ga. 0.97% 25 Guam 0.29% 51 Ore. 0.97% 26 Hawaii 0.28% 52 U.S.9 1.12% -
9 The U.S. effective tax rate does not factor in Guam’s rate.

25
Appendix 5: 2008 Real Property Values
2008
State
Average Median Home Value Rank State
Average Median Home Value Rank
Guam $ 91,145 1 Montana $ 180,300 27 West Virginia $ 95,900 2 Idaho $ 183,700 28 Mississippi $ 99,700 3 Wyoming $ 188,200 29 Oklahoma $ 105,500 4 Minnesota $ 213,800 30 Arkansas $ 105,700 5 Vermont $ 214,700 31 North Dakota $ 112,500 6 Illinois $ 214,900 32 Kentucky $ 118,400 7 Florida $ 218,700 33 Iowa $ 120,700 8 Arizona $ 229,200 34 Alabama $ 121,500 9 Utah $ 236,000 35 Indiana $ 125,200 10 Alaska $ 237,800 36 Kansas $ 125,700 11 Colorado $ 242,200 37 South Dakota $ 126,200 12 Delaware $ 250,900 38 Nebraska $ 126,500 13 New Hampshire $ 264,700 39 Texas $ 126,800 14 Virginia $ 269,600 40 Louisiana $ 132,400 15 Nevada $ 271,500 41 Tennessee $ 138,600 16 Oregon $ 273,300 42 South Carolina $ 138,700 17 Rhode Island $ 286,000 43 Ohio $ 140,200 18 Connecticut $ 306,000 44 Missouri $ 141,500 19 Washington $ 308,100 45 Michigan $ 151,300 20 New York $ 318,900 46 North Carolina $ 154,500 21 Maryland $ 341,200 47 Pennsylvania $ 164,700 22 Massachusetts $ 353,600 48 New Mexico $ 165,100 23 New Jersey $ 364,100 49 Georgia $ 169,100 24 California $ 467,000 50
Wisconsin $ 173,300 25 District of Columbia** $ 474,100 51
Maine $ 180,200 26 Hawaii $ 560,200 52
United States10 $ 197,600 -
10 The U.S. median value does not factor in Guam’s median value.

26
Appendix 6: 2010 Real Property Values 2010
State Average Median
Home Value11 State Average Median
Home Value 1 Guam $ 92,792 27 Idaho $ 164,467 2 West Virginia $ 118,686 28 Florida $ 167,768 3 Arkansas $ 122,618 29 Maine $ 170,167 4 Oklahoma $ 122,982 30 Wisconsin $ 173,774 5 Texas $ 125,513 31 Wyoming $ 177,500 6 Mississippi $ 125,850 32 Nevada $ 192,900 7 Alabama $ 127,176 33 Minnesota $ 211,033 8 Indiana $ 130,452 34 Montana $ 211,400 9 Michigan $ 131,759 35 Utah $ 212,200
10 Ohio $ 134,774 36 Oregon $ 225,540 11 Kentucky $ 135,338 37 Washington $ 234,532 12 Louisiana $ 140,012 38 Delaware $ 234,533 13 South Carolina $ 140,138 39 New York $ 234,636 14 Missouri $ 143,535 40 Alaska $ 234,667 15 Iowa $ 145,440 41 New Hampshire $ 235,883 16 Kansas $ 148,375 42 Colorado $ 237,709 17 North Carolina $ 149,141 43 Vermont $ 271,800 18 Arizona $ 150,330 44 Virginia $ 276,490 19 Nebraska $ 151,633 45 Connecticut $ 287,125 20 South Dakota $ 151,800 46 Rhode Island $ 288,825 21 Tennessee $ 153,985 47 Maryland $ 288,831 22 New Mexico $ 154,975 48 Massachusetts $ 305,883 23 Pennsylvania $ 154,995 49 New Jersey $ 320,871 24 Georgia $ 155,359 50 California $ 349,533
25 North Dakota $ 156,867 51District of Columbia $ 426,900
26 Illinois $ 162,630 52 Hawaii $ 495,925 United States12 $ 179,900
11 The average media was derived for each state as data from the Tax Foundation was based on median values by county-level. 12 The U.S. median value does not factor in Guam’s median value.

27
Appendix 7: Real Property Exemptions Tax exemptions afforded to tax payers are a form of credit that either reduce or entirely eliminate an obligation to pay real property taxes. DRT RPT’s division has four tax credits available for a taxpayer’s primary home and seven others. Property tax credit, if approved, applies only to that part of the building claimed as the primary home. The four tax credits are:
1. Home Exemption: The applicant must be the property owner and is currently residing on the property. The maximum amount of this credit is $175.
2. Senior Citizen Tax Credit: The applicant must be: a. Fifty-five (55) years of age by application due date of March 15, b. Lives in Guam for the five (5) preceding consecutive years, c. Is the property owner and currently residing on the property, d. Tax credit is 80%.
3. Citizen With Disability: The applicant must be a U.S. Citizen that is: a. Eighteen (18) years of age by application due date, b. Lives in Guam for the preceding five (5) consecutive years, c. Meets the definition of “Permanent Disability” established by the Department of
Integrated Services for Individuals with Disabilities (DISID) and, d. Letter of confirmation from DISID must be attached to the application for tax
credit. 4. Head of Household of Dependent with Disability:
a. Applicant must be a U.S. Citizen b. Eighteen (18) years of age by application due date, c. Lives in Guam for the preceding five (5) consecutive years, d. Property owner and dependent must both be currently residing on the property, e. Dependent must meet the definition of “Permanent Disability” established by
DISID and, f. Letter of confirmation from DISID must be attached to the application for tax
credit.

28
Appendix 8: Summary of Estimated Lost Property Taxes 2010
Tax Year 2010 Per DRT Market Based Value Difference 50% Allowance Property Count-Residential 55,346 55,346 Total Appraised Home Value $8,508,213,984 $ 12,515,833,748 $ 4,007,619,764 $ 2,003,809,882 Average Appraised Value $ 153,728 $ 226,138 $ 72,410 $ 36,205 Total Assessed Home Value $7,657,392,585 $ 11,264,250,373.20 $ 3,606,857,788 $ 1,803,428,894 Average Assessed Value $ 138,355 $ 203,524 $ 65,169 $ 32,585
Land -Assessed Value $5,030,655,590 $ 7,434,405,246 $ 2,403,749,656 $ 1,190,263,070
Building -Assessed Value $2,626,736,995 $ 3,829,845,127 $ 1,203,108,132 $ 613,165,824 Land -Tax $ 4,890,895 $ 7,227,892 $ 2,336,997 $ 1,157,200 Building Tax $ 10,215,104 $ 14,893,843 $4,678,742 $ 2,384,534 Total Tax $ 15,105,999 $ 22,121,735 $ 7,015,740 $ 3,541,734

29
Appendix 9: Summary of Estimated Lost Property Taxes 2009
Tax Year 2009 Per DRT Market Based Value Difference 50% Allowance Property Count-Residential 54,709 54,709 Total Appraised Home Value $8,370,624,706 $ 11,350,530,939 $ 2,979,906,233 $ 1,489,953,117 Average Appraised Value $ 153,003 $ 207,471 $ 54,468 $ 27,234 Total Assessed Home Value $7,533,562,235 $ 10,215,477,845 $ 2,681,915,610 $ 1,340,957,805 Average Assessed Value $ 137,702 $ 186,724 $ 49,021 $ 24,511 Land -Assessed Value $4,960,019,997 $ 6,742,215,378 $ 1,782,195,381 $ 885,032,151 Building -Assessed Value $2,573,542,238 $ 3,473,262,467 $ 899,720,229 $ 455,925,654 Land -Tax $ 4,822,222 $ 6,554,930 $ 1,732,708 $ 860,448 Building Tax $ 10,008,235 $ 13,507,136 $ 3,498,897 $ 1,773,045 Total Tax $ 14,830,457 $ 20,062,066 $ 5,231,605 $ 2,633,492
30
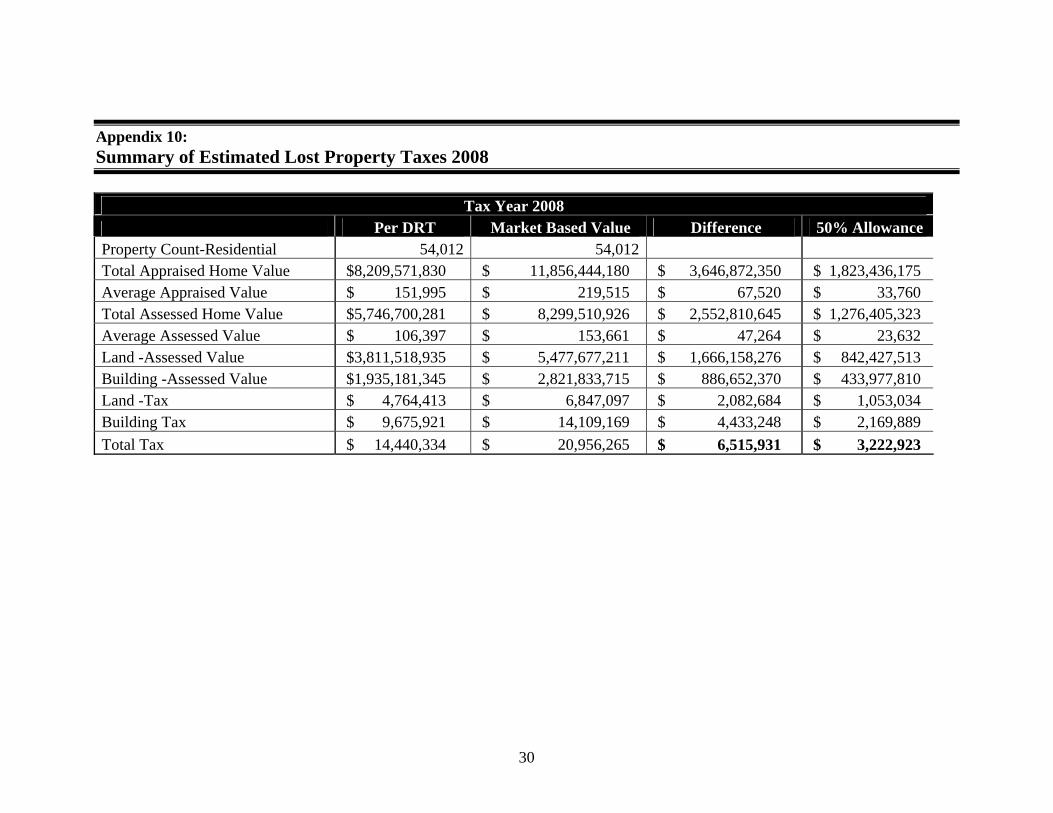
Appendix 10: Summary of Estimated Lost Property Taxes 2008
Tax Year 2008 Per DRT Market Based Value Difference 50% Allowance Property Count-Residential 54,012 54,012 Total Appraised Home Value $8,209,571,830 $ 11,856,444,180 $ 3,646,872,350 $ 1,823,436,175 Average Appraised Value $ 151,995 $ 219,515 $ 67,520 $ 33,760 Total Assessed Home Value $5,746,700,281 $ 8,299,510,926 $ 2,552,810,645 $ 1,276,405,323 Average Assessed Value $ 106,397 $ 153,661 $ 47,264 $ 23,632 Land -Assessed Value $3,811,518,935 $ 5,477,677,211 $ 1,666,158,276 $ 842,427,513 Building -Assessed Value $1,935,181,345 $ 2,821,833,715 $ 886,652,370 $ 433,977,810 Land -Tax $ 4,764,413 $ 6,847,097 $ 2,082,684 $ 1,053,034 Building Tax $ 9,675,921 $ 14,109,169 $ 4,433,248 $ 2,169,889 Total Tax $ 14,440,334 $ 20,956,265 $ 6,515,931 $ 3,222,923

31
Appendix 11: Exemptions by Category13
Type: Count Amount% to Total Count Amount
% to Total Count Amount
% to Total Count Amount
% to Total Count Amount
% to Total
Total Count
AverageCount
Total Amount Average Percentage
Senior Citizen 8,568 $1,541,547 42% 9,075 $1,631,498 42.03% 9,594 $1,735,289 42.89% 10,143 $1,833,897 43.98% 10,195 $1,846,187 44.50% 47,575 9,515 $8,588,418 $1,717,684 43%Home 5,384 $920,121 25% 5,401 $923,584 23.79% 5,394 $922,136 22.79% 5,405 $924,092 22.16% 5,469 $934,168 22.52% 27,053 5,411 $4,624,101 $924,820 23%
Sub-Total: 13,952 $2,461,668 67.40% 14,476 $2,555,082 65.83% 14,988 $2,657,425 65.68% 15,548 $2,757,989 66.14% 15,664 $2,780,355 67.02% 74,628 14,926 $13,212,519 $2,642,504 66%
Government 2,101 $599,786 16.42% 2,145 $614,756 15.84% 2,167 $628,183 15.52% 2,195 $654,959 15.71% 1,473 $625,847 15.09% 10,081 2,016 $3,123,531 $624,706 16%Farm 1,679 $314,281 8.60% 1,870 $351,840 9.06% 1,947 $368,372 9.10% 2,030 $381,868 9.16% 2,024 $383,336 9.24% 9,550 1,910 $1,799,697 $359,939 9%Church 275 $189,098 5.18% 298 $197,544 5.09% 309 $203,047 5.02% 309 $205,890 4.94% 302 $202,352 4.88% 1,493 299 $997,931 $199,586 5%
Public Law (Return of Federal Lands) - - 80 $90,406 2.33% 97 $114,609 2.83% 88 $96,064 2.30% 87 $85,692 2.07% 352 70 $386,771 $77,354 2%Disability 229 $39,124 1.07% 240 $40,774 1.05% 235 $40,809 1.01% 232 $40,193 0.96% 221 $38,840 0.94% 1,157 231 $199,740 $39,948 1%Rights of Way 3,499 $12,284 0.34% 3,602 $14,259 0.37% 3,678 $16,810 0.42% 3,756 $20,710 0.50% 3,797 $19,748 0.48% 18,332 3666 $83,812 $16,762 0%Non-Profit 23 $36,130 0.99% 17 $16,515 0.43% 18 $16,877 0.42% 14 $12,017 0.29% 14 $12,017 0.29% 86 17 $93,555 $18,711 0%Ponding Basin 2 $74 0.00% 4 $292 0.01% 3 $171 0.00% 8 $352 0.01% 10 $375 0.01% 27 5 $1,264 $253 0%Total 21,760 $3,652,445 100% 22,732 $3,881,469 100% 23,442 $4,046,304 100% 24,180 $4,170,042 100% 23,592 $4,148,560 100% 115,706 23,141 $19,898,820 $3,979,764 100%
20112007 2008 2009 2010
13 The information provided by DRT on the tax rolls is not the same as this table, where this information was provided directly by DRT personnel.

32
Appendix 12: Management Response

Independence Integrity Impartiality
Accountability Transparency
Department of Revenue and Taxation Real Property Taxes
Report No. 13-03, August 2013
To improve the public trust, we audit, assess, analyze, and make recommendations
for accountability, transparency, effectiveness, efficiency, and economy of the government of Guam
independently, impartially, and with integrity.
Guam is the model for good governance in the Pacific.
CORE VALUES
VISION
MISSION STATEMENT
ACKNOWLEDGEMENTS
Key contributions to this report were made by: Vincent Duenas, Audit Supervisor
Jocelyn Untalan, Auditor-in-Charge Maria Thyrza Bagana, Audit Staff
Doris Flores Brooks, CPA, CGFM, Public Auditor
REPORTING FRAUD, WASTE, AND ABUSE
Call our HOTLINE at 47AUDIT (472-8348) Visit out website at www.guamopa.org Call our office at 475-0390 Fax our office at 472-7951 Or visit us at Suite 401, DNA Building in Hagåtña;
All information will be held in strict confidence.