department of science and technology (dst) private … knowledge bases between south africa and the...
TRANSCRIPT
NATIONAL SURVEY OF RESEARCH AND EXPERIMENTAL DEVELOPMENT
MAIN ANALYSIS REPORT 2012/13
Department of Science and Technology (DST)Private Bag X894, Pretoria, 0001Republic of South Africawww.dst.gov.za
Centre for Science, Technology and Innovation Indicators (CeSTII)Human Sciences Research CouncilPrivate Bag X9182, Cape Town, 8000www.hsrc.ac.za
Dr Phil MjwaraDirector-General: [email protected]
Dr Temba MasilelaDeputy Chief Executive Officer: Research, [email protected]
Prof Gillian MarcelleExecutive Director: [email protected]
Mr Imraan PatelDeputy Director-General: Socio-Economic [email protected]
Mr Godfrey MashambaChief Director: Science and Technology [email protected]
Dr Nazeem Mustapha Chief Research [email protected]
Ms Tshidi MamogoboDirector: Science and Technology [email protected]
Dr Neo MolotjaSenior Research [email protected]
MAIN
REPORT
MAIN REPORT- 2012/13 cover.indd 1 2014/12/23 10:11 AM

i
ACKNOWLEDGEMENTSThe South African National Survey of Research and Experimental Development (R&D Survey) is conducted annually by the Human Sciences Research Council’s Centre for Science, Technology and Innovation Indicators (HSRC-CeSTII) on behalf of the Department of Science and Technology (DST).
The project team extends its appreciation to Dr Phil Mjwara, Director-General of the DST, Prof. Olive Shisana, Chief Executive Officer of the HSRC, Dr Temba Masilela, Deputy CEO: Research of the HSRC, and Mr Pali Lehohla, Statistician-General, for their support of the R&D survey. The support and contributions of Mr Imraan Patel, Mr Godfrey Mashamba, Ms Tshidi Mamogobo, Ms Rose Msiza, and Ms Kgomotso Matlapeng of the DST are much appreciated.
Technical inputs and advice by the Clearance Committee for Science, Technology and Innovation Statistical reports have helped improve the quality of this publication and are appreciated. The Clearance committee is composed of teams from the National Advisory Council on Innovation (NACI), Statistics South Africa (Stats SA), DST, and CeSTII. We further acknowledge the contributions of HSRC-CeSTII administrative staff, Valda West and Benelton Jumath, and ICT support by Noor Fakier and Siphamandla Bidli.
Interactions with the Organisation for Economic Co-operation and Development’s (OECD) Working Party of National Experts on Science and Technology Indicators (NESTI) have provided invaluable assistance in improving the standard of the South African R&D surveys and analysis of the results. We are also most grateful for and acknowledge the co-operation of the respondents to the questionnaire.
The core team of the R&D survey included the following persons in alphabetical order:
Thomson Batidzirai, Isabel Basson, Mario Clayford, Takura Kupamupindi, Demetre Labadarios, Vaughan Leiberum, Natalie le Roux, Gillian Marcelle, Zandile Matshaya, Neo Molotja, Precious Mudavanhu, Nazeem Mustapha, Nolitha Nkobole, Saahier Parker, Julien Rumbelow, Natasha Saunders, Ronel Sewpaul, Moses Sithole and Natalie Vlotman.

MAIN ANALYSIS REPORT: 2012/13
ii
FOREWORDThe Statistics Act (No. 6 of 1999) is the institutional machanism by which
the Statistican General (SG) leads and coordinates statistical production and use in the country. Statistics as a global lingua franca and currency through the Act, the Statistician-General leads and coordinates stastistical knowledge bases between South Africa and the world. This provision enables an arrangement whereby, for more than a decade, the
Department of Science and Technonlogy (DST) has been coordinating the production of Research and Experimental Development (R&D) survey as a
partner within the National Statistics System (NSS). The survey contributes to a body of statistics that on the contribution of R&D to development and change in South Africa as well as in the global context.
The survey is subject to an ongoing quality assessment process in terms of the South African Statistical Quality Assessment Framework (SASQAF) to ensure that the survey remains credible and fit for purpose. Through implementing the quality improvement plan, major strides have been made in improving the quality of the R&D survey processes and its output over time. The response rate of 67.6% achieved in the 2012/13 survey, for instance, is a 10.4 percentage point improvement from the 2011/12 survey. This still needs to be improved further, and can only be achieved with greater cooperation from organisations targeted by the survey in providing responses.
Recent revisions of international guidelines concerning R&D and economic measurement recognise R&D as an activity leading to the creation of intellectual asset, thus contributing to future economic activity. This requires that we change the way we treat R&D data when compiling national Gross Domestic Product (GDP) estimates so that it becomes part of the capital formation and not as an intermediate consumption expenditure, as has been done in the past. Accordingly, work to incorporate this requirement is already underway in South Africa.
Given my assessment of this survey, I endorse the 2012/13 Research and Development Survey results and urge institutions of the state to use it as an integral part of the information arsenal that informs development in South Africa and globally.
Pali J LehohlaStatistician-General

iii
PREFACEThe South African government’s Medium Term Strategic Framework
(2014-2019) includes a policy target for increasing research and development (R&D) expenditure – to 1,5% of GDP - in order to support growth and development. This is because our country relies on scientific research and technological advancements to maintain its competitive edge.
By giving estimates of the magnitude, supply and flows of resources devoted to R&D, the national R&D survey not only helps us monitor the
country’s performance against targets, but also helps us understand how the R&D system is changing over time.
The 2012/13 GERD results suggest that the decline in investment in Research and Development from 2009/10, has been arrested. South Africa has recorded increased investment in R&D during the period from 2011/12 to 2012/13. This trend has also been seen in other countries after the economic challenges from 2008. However, even with this increased investment and an improved outlook for the future years, South Africa’s Gross Expenditure on Research and Development has remained at 0,76% of GDP over the past three years. Increased investment in Research and Development must be encouraged in order to reap the benefits of our geographic advantages as well as to increase our competitiveness in a challenging global environment. Government’s focus on creating a climate for this investment has resulted in enabling policies in Human Capital development, research infrastructure, incentives for increased private sector investment, and international cooperation in science and technology. Over the next five years we will continue to encourage a significantly increased private and public sector investment in Research and Development.
I extend my appreciation, on behalf of the Department of Science and Technology, to the Centre for Science, Technology and Innovation Indicators for their efforts in conducting this survey each year, and to Statistics South Africa for facilitating the process to assess the quality of the R&D statistics.
A special word of thanks goes to all the survey respondents, in both the private and the public sector, who gave their time so readily to make this survey a success.
GNM Pandor, MPMinister of Science and Technology

MAIN ANALYSIS REPORT: 2012/13
iv
LIST OF ABBREVIATIONS
AIDS Acquired immune deficiency syndrome
AU African Union
BERD Business expenditure on R&D
BRICS Brazil, the Russian Federation, India, China and South Africa
CEO Chief Executive Officer
CeSTII Centre for Science, Technology and Innovation Indicators
DACST Department of Arts, Culture, Science and Technology
DST Department of Science and Technology
FTE Full-time equivalent
GDP Gross domestic product
GERD Gross domestic expenditure on R&D
HERD Higher education expenditure on R&D
HIV Human immunodeficiency virus
HSRC Human Sciences Research Council
ICT Information and communication technology
NEPAD New Partnership for Africa’s Development
NESTI National Experts on Science and Technology Indicators
NDP National Development Plan
NSS National Statistics System
OECD Organisation for Economic Co-operation and Development
PPP Purchasing power parity
QMP Quality Management Plan
R Rand (South African currency)
R&D Research and experimental development
SA South Africa
SASQAF South African Statistical Quality Assessment Framework
SEO Socio-economic objective
SIC Standard Industrial Classification
SOE State-owned enterprise
Stats SA Statistics South Africa
SVC Statistical Value Chain
TB Tuberculosis
UIS UNESCO Institute for Statistics
UNESCO United Nations Educational, Scientific and Cultural Organisation
USS User Satisfaction Survey
v
DEFINITION OF TERMSApplied research is original investigation undertaken in order to acquire new knowledge. It is, however, directed primarily towards a specific practical aim or objective.
Basic research is experimental or theoretical work undertaken primarily to acquire new knowledge of the underlying foundation of phenomena and observable facts, without any particular application or use in view.
BERD refers to business expenditure on research and experimental development.
Biotechnology is an application of science and technology to living organisms as well as parts, products and models thereof, to alter living or non-living materials for the production of knowledge, goods and services.
Capital expenditure is the annual gross expenditure on fixed assets used in the R&D programmes of statistical units. Such expenditure is reported in full in the period in which it took place and is registered as an element of depreciation. Capital expenditure includes expenditure on land, buildings, instruments and equipment.
Experimental development is systematic work, drawing on existing knowledge gained from research and/or practical experience, which is directed to producing new materials, products or devices, to installing new processes, systems and services, or to improving substantially those already produced or installed.
Full-time equivalent (FTE) refers to the number of hours (person years of effort) spent on R&D activities.
Gross domestic product (GDP) is the total market value of all final goods and services produced in a country in a given year, equal to total consumer, investment and government spending, plus the value of exports, minus the value of imports (Statistics South Africa)
Gross expenditure on research and experimental development (GERD) covers all expenditures for R&D performed on national territory in a given year. It thus includes domestically performed R&D which is financed from abroad but excludes R&D funds paid abroad, notably to international agencies.
Headcount refers to the actual number of people directly involved in or supporting R&D (i.e. the total number of R&D personnel).
HERD refers to higher education expenditure on research and experimental development.In-house or intramural R&D refers to R&D performed by the unit or entity itself (i.e. by the personnel of the unit or entity). This is R&D performed within the borders of South Africa, even if funded by foreign sources.
Labour costs comprise annual wages and salaries and all associated costs or fringe benefits, such as bonus payments, holiday pay, contributions to pension funds and other social security payments, and payroll taxes. The labour costs of persons providing indirect services that are not included in the personnel data (such as security and maintenance personnel or the staff of central libraries, computer departments or head offices) are excluded from labour costs and included in other current expenditure.

MAIN ANALYSIS REPORT: 2012/13
vi
New materials pertain to the technology and R&D activities of high-tech companies particularly in the aerospace, construction, electronic, biomedical, renewable energy, environmental remediation, food and packaging, manufacturing and motor car industries. New materials include multi-functional materials, advanced materials, nano-materials, nano-composites and nanotechnology.
Other current expenditure comprises non-capital purchases of materials, supplies and equipment to support R&D performed by the statistical unit in a given year
Other support staff include skilled and unskilled craftsmen, secretarial and clerical staff participating in R&D projects or directly associated with such projects.
Outsourced R&D refers to R&D done by another entity on behalf of the reporting unit and paid for by the reporting unit.
Research and experimental development (R&D) comprise creative work undertaken on a systematic basis in order to increase the stock of knowledge, including knowledge of man, culture and society, and the use of this stock of knowledge to devise new applications. Researchers are professionals engaged in the conception or creation of new knowledge, products, processes, methods and systems, and in the management of the projects concerned.
R&D intensity refers to gross expenditure on R&D as a percentage of GDP.
R&D personnel include all persons employed directly on R&D activities, as well as those providing direct services such as R&D managers, administrators and clerical staff.
R&D-performing sectors comprise the government, higher education, business and not-for-profit sectors.
Standard Industrial Classifications (SIC) are codes published by Statistics South Africa for classification of economic activities of industries. (Stats SA, 2004)Socio-economic objectives (SEO). The SEO classification provides an indication of the main beneficiary(ies) of R&D activities.
Technicians and equivalent staff are persons whose main tasks require technical knowledge and experience in one or more fields of engineering, physical and life sciences, or social sciences and humanities.
Total employment is the total employment in the economy. This statistic is obtained from Stats SA Labour Force Survey series P0211, where employed persons are those aged 15–64 years who, during the reference week, did any work for at least one hour, or had a job or business but were not at work (temporarily absent) . (Stats SA 2014)
Year-on-year changes are calculated as follows: Current year’s figure - previous year’s figure / previous year’s figure × 100%.

vii
TABLE OF CONTENTS ACKNOWLEDGEMENTS I
FOREWORD II
PREFACE III
LIST OF ABBREVIATIONS IV
DEFINITION OF TERMS V
TABLE OF CONTENTS VII
LIST OF FIGURES X
LIST OF TABLES XIII
EXECUTIVE SUMMARY XIV
INTRODUCTION 1
1. R&D INDICATORS IN CONTEXT 2
1.1. The importance of R&D statistics 2
1.2. Key indicators 3
2. R&D EXPENDITURE 4
2.1. Gross domestic expenditure on R&D 4
2.2. GERD as a percentage of GDP 5
2.3. GERD by sector 5
3. FUNDING FOR R&D 7
3.1. Major flows of R&D funding 7
3.2. GERD by sources of funds 8
3.3. Business-funded R&D 9
3.4. Government funding of local R&D 10
3.5. Foreign funding of local R&D 11
4. CATEGORIES OF GERD 13
4.1. GERD by type of research 13
4.2. GERD by type of research and sector of performance 14
4.3. GERD by major research field 15
4.4. GERD by division of research field and sector of performance 16
4.5. GERD by accounting category 17
4.6. Business sector R&D expenditure by Standard Industrial Classification 19
4.7. GERD by areas of special interest 22
4.7.1. R&D expenditure on tuberculosis, HIV/AIDS and malaria 22
4.7.2. Biotechnology-related R&D 23

MAIN ANALYSIS REPORT: 2012/13
viii
5. PEOPLE IN R&D 24
5.1. R&D personnel 24
5.1.1. R&D personnel headcount by sector of performance 25
5.1.2. R&D personnel full-time equivalents (FTEs) by sector of performance 26
5.1.3 R&D personnel by occupation 27
5.2. Researchers 28
5.2.1. Researcher headcount by sector of performance 28
5.2.2. Researcher full-time equivalent (FTEs) by sector of performance 29
5.2.3. Researcher headcount by gender 30
5.2.4. Researchers by population group 30
5.2.5. Researchers (excluding doctoral students and post-doctoral fellows) by 32 population group
5.2.6. Researchers (excluding doctoral students and post-doctoral fellows) by 33 qualification and population group
5.3. Higher education R&D personnel 34
5.3.1. Higher education R&D personnel: FTEs as a percentage of headcount 34
5.3.2. Post-doctoral fellow and postgraduate student headcount and full-time equivalents (FTEs) 36
5.3.3. Post-doctoral fellows and doctoral students by population group 37
5.3.4. Profile of South African and non-South African postgraduate students 38
5.3.5. South African and non-South African postgraduate students by qualification 38
6. GEOGRAPHIC DIMENSIONS OF R&D 40
6.1. R&D expenditure by province 40
6.2. Proportions of R&D expenditure by sector 45
7. INTERNATIONAL COMPARISONS 41
7.1. Gross domestic expenditure on R&D 43
7.1.1. GERD as a percentage of GDP 43
7.1.2. GERD for selected countries 44
7.1.3. GERD by source of funds 46
7.2. R&D personnel 48
7.2.1. Researchers: full-time equivalents (FTEs) per thousand in total employment 48
ix
7.2.2. Research and Researcher Intensity 49
7.2.3. Female researchers as a percentage of total researchers 51
8. BIBLIOGRAPHY 52
ANNEXURE I 53
Methodology 53
ANNEXURE II 54
Dissemination 54
Data extractions 54
Revisions 54
ANNEXURE III 55
User Satisfaction Survey 55

MAIN ANALYSIS REPORT: 2012/13
x
LIST OF FIGURES Figure 2.1: GERD in current and constant 2005 Rand value (R million), 4 South Africa, 1991/92 to 2012/13
Figure 2.2: GERD as a percentage of GDP, South Africa, 5 1991/92 to 2012/13
Figure 2.3: R&D expenditure by sector (R million), South Africa, 6
2008/09 to 2012/13
Figure 3.1: Major flows of funding, (R million), South Africa, 2012/13 7
Figure 3.2: GERD by source of funds (percentage), South Africa, 8
2001/02 to 2012/13
Figure 3.3: Business-funded R&D by sector of performance (R million), 10
South Africa, 2008/09 to 2012/13
Figure 3.4: Foreign-funded R&D by sector of performance (R million), 12 South Africa, 2008/09 to 2012/13
Figure 4.1: GERD by type of research (percentage), South Africa, 13 2008/09 to 2012/13
Figure 4.2: GERD by type of research and sector of performance 14 (percentage), South Africa, 2011/12 to 2012/13
Figure 4.3: GERD by research field (percentage), South Africa, 15 2010/11 to 2012/13
Figure 4.4: R&D expenditure by research field and sector of performance 16 (R million), South Africa, 2012/13
Figure 4.5: R&D expenditure by accounting category (percentage), 17 South Africa, 2008/09 and 2012/13
Figure 4.6: R&D expenditure by accounting category (R million), 18 South Africa, 2012/13
Figure 4.7: Business R&D expenditure by Standard Industrial Classification 19 (SIC) category (as a percentage of GERD), South Africa, 2008/09 and 2012/13
Figure 4.8: Business R&D expenditure by Manufacturing SIC category, 21 South Africa, 2008/09 and 2012/13
Figure 4.9: R&D expenditure on TB, HIV/AIDS and malaria (R million and as a percentage of GERD), South Africa, 22 2008/09 to 2012/13
Figure 4.10: R&D expenditure on biotechnology (R million and as a 23 percentage of GERD), South Africa, 2008/09 to 2012/13

xi
Figure 5.1: R&D personnel (headcount and FTEs), South Africa 24 2001/02 to 2012/13
Figure 5.2: R&D personnel by sector (headcount), South Africa, 25 2008/09 to 2012/13
Figure 5.3: R&D personnel by sector (FTEs), South Africa, 26 2008/09 to 2012/13
Figure 5.4: R&D personnel by occupation (headcount), South Africa, 27 2008/09 to 2012/13
Figure 5.5: Researchers by sector (headcount), South Africa, 28 2008/09 to 2012/13
Figure 5.6: Researchers by sector (FTEs), South Africa, 29 2008/09 to 2012/13
Figure 5.7: Researchers by gender (percentage), South Africa, 30 2008/09 to 2012/13
Figure 5.8: Researchers by population group (percentage), South Africa, 31 2008/09 to 2012/13
Figure 5.9: Researchers (excluding doctoral students and 32 post-doctoral fellows) by population group (percentage), South Africa, 2008/09 to 2012/13
Figure 5.10: Researchers (excluding doctoral students and 33 post-doctoral fellows) by qualification and population group (percentage), South Africa, 2012/13
Figure 5.11: Researchers (excluding doctoral students and 34 post-doctoral fellows) by qualification and population group (percentage), South Africa, 2008/09
Figure 5.12: Higher education R&D personnel and students 35 (FTE as a percentage of headcount), South Africa, 2008/09 to 2012/13
Figure 5.13: Higher education post-doctoral fellows and postgraduate 36 students (headcount and FTEs), South Africa, 2008/09 to 2012/13
Figure 5.14: Higher education post-doctoral fellows and doctoral 37 students by population group (percentage), South Africa, 2008/09 and 2012/13
Figure 5.15: Higher education post-doctoral fellows and doctoral 38 students by nationality (headcount), South Africa, 2012/13
Figure 5.16: Higher education postgraduates by qualification (percentage), 39 South Africa, 2012/13
Figure 6.1: R&D expenditure by province (R million and percentage), 42 2012/13

MAIN ANALYSIS REPORT: 2012/13
xii
Figure 7.1: GERD as a percentage of GDP for selected countries, 44 2012/13 or latest available year
Figure 7.2: GERD by source of funds in selected countries (percentage), 47 2012/13 or latest available year
Figure 7.3: Researchers (full time equivalent) per 1 000 in total employment 48 in selected countries, 2012/13 or latest available year
Figure 7.4: Research and researcher intensity (2012) or latest available year* 50
Figure 7.5: Female researchers as a percentage of total researchers 51 (headcount) in selected countries, 2012/13 or latest available year

xiii
LIST OF TABLES Table 1.1: Key R&D indicators, South Africa, 2012/13 with comparative 3 figures for 2011/12 and 2010/11
Table 3.1: Business-funded R&D by sector of performance (R million), 9 South Africa, 2008/09 to 2012/13
Table 3.2: Government-funded R&D (R’000), South Africa, 11 2008/09 to 2012/13
Table 4.1: Standard Industrial Classification (SIC) codes in the 80 000 group 20
Table 4.2: Standard Industrial Classification (SIC) codes in the 30 000 group 21
Table 5.1: Higher education postgraduates by qualification (headcount), 39 South African, 2011/12 and 2012/13
Table 6.1: R&D expenditure by province (R’000), South Africa, 2008/09 40
Table 6.2: R&D expenditure by province and sector of performance 41 (R’000 and percentage), South Africa, 2008/09
Table 7.1: GERD for selected countries (billion current PPP$), 2010/11 45 to 2012/13 or latest available year

MAIN ANALYSIS REPORT: 2012/13
xiv
EXECUTIVE SUMMARYThe National Survey of Research and Experimental Development (R&D survey) is undertaken annually to collect data that are used to produce statistics of R&D activities in South Africa. The statistics are used in the development of science policy to set government R&D priorities and funding levels, and for monitoring and benchmarking purposes.
The data are collected from the government, business, not-for-profit, science councils and higher education sectors. This report presents the findings of the 2012/13 R&D survey, which is the eleventh of the series conducted by the Centre for Science, Technology and Innovation (CeSTII) to date.
GERD INCREASED BETWEEN 2011/12 AND 2012/13 IN BOTH NOMINAL AND REAL TERMS
South Africa’s gross domestic expenditure on R&D (GERD) amounted to R23.871 billion at current Rand value in 2012/13. This represented a nominal increase of 7.5% from the R22.209 billion recorded in 2011/12. This is the second consecutive year that GERD has increased.At constant 2005 Rand value, GERD amounted to R14.878 billion in 2012/13, representing a real increase of 2.6% from 2011/12. The long-term trend shows that South Africa has almost treble its R&D expenditure in real terms since the 1990s.
GERD AS A PERCENTAGE OF GDP REMAINED AT 0.76% FOR THREE CONSECUTIVE YEARS
GERD as a percentage of gross domestic product (GDP) was 0.76% in 2012/13. This ratio remained constant between 2010/11 and 2012/13. The trend shows that GERD as a percentage of GDP increased from 0.60% in 1997/98, peaked at 0.95% in 2006/07, and declined until it reached 0.76%, where it has remained for three consecutive years from 2010/11 to 2012/13.
GOVERNMENT WAS THE LARGEST FUNDER OF R&D IN 2012/13
Government funded 45.4% while the business sector funded 38.3% of all R&D undertaken in 2012/13. R&D funding from government increased by 13.3% from R9.562 billion in 2011/12 to R10.832 billion in 2012/13. Higher education received 49.8% (R5.396 billion) of the total government funding for R&D, while government institutions including science councils received 42.8% (R4.638 billion). The business sector was the second-largest funder of R&D, contributing 38.3% (R9.152 billion) towards total R&D funding. Most of the R&D funding (91.8.0%) from business was spent in the business sector. The third-largest source of funding for R&D in 2012/13 was from abroad, amounting to 13.1% of total R&D funding, although funding from this source decreased by 6.4% from R3.330 billion in 2011/12 to R3.117 billion in 2012/13.

xv
THE BUSINESS SECTOR WAS THE LARGEST PERFORMER OF R&D IN 2012/13
The R&D expenditure of the business sector (BERD) amounted to R10.571 billion in 2012/13, equivalent to 44.3% of GERD. In real terms, this represented a decline of 3.6% between 2011/12 and 2012/13. R&D expenditure for the higher education sector amounted to R7.333 billion or 30.7% of GERD, making it the second-highest performer of R&D. The increase in the not-for-profit frame resulted in an increase in R&D expenditure from R171 million in 2011/12 to R504 million (2.1% of GERD) in 2012/13.
R&D IN THE BUSINESS SECTOR WAS MOSTLY PERFORMED IN THE FINANCIAL INTERMEDIATION, REAL ESTATE AND BUSINESS SERVICES DURING 2012/13
In 2012/13 expenditure on R&D in the financial intermediation, real estate and business services amounted to R3.915 billion. This was the second consecutive year in which expenditure in this sector was higher than expenditure on R&D in the manufacturing sector. R&D expenditure in the manufacturing sector amounted to R3.477 billion, followed by mining and quarrying at R1.554 billion.
LABOUR COSTS AND OTHER CURRENT EXPENDITURE ON R&D ACCOUNTED FOR THE LARGEST PORTION OF R&D EXPENDITURE
The labour costs of R&D personnel increased from R10.608 billion in 2011/12 to R13.109 billion in 2012/13. Labour costs together with other current expenditure accounted for 90.6% of total GERD. Expenditure on R&D infrastructure and general equipment amounted to R2.243 billion or 9.4% of GERD in 2012/13.
BASIC RESEARCH WAS MOSTLY CONDUCTED IN THE HIGHER EDUCATION SECTOR, WHILE APPLIED RESEARCH WAS DOMINANT IN THE BUSINESS, NOT-FOR-PROFIT, GOVERNMENT AND SCIENCE COUNCILS SECTORSApplied research accounted for the largest proportion of R&D expenditure in 2012/13, comprising 46.3%, followed by experimental development at 28.4% and basic research at 25.3%. Basic research was the main type of research performed in the higher education sector, accounting for 63.7% of all basic R&D in South Africa in 2012/13. The business sector performed 50.3% of all applied research and 62.0% of total experimental development in 2012/13. In nominal Rand terms, the business sector spent R5.569 billion on applied research and R4.199 billion on experimental development.
IMPROVEMENTS IN INDICATORS OF R&D PERSONNEL ARE LARGELY DRIVEN BY THE INCREASED NUMBER OF RESEARCHERS IN THE HIGHER EDUCATION SECTOR
The R&D personnel headcount increased by 9.1% from 59 487 in 2011/12 to 64 917 in 2012/13. The associated full-time equivalents (FTEs) increased by 13.1% between 2011/12 and 2012/13. Researchers accounted for 66.0% (42 828) of the total R&D workforce in 2012/13. The higher education sector employed the largest number of researchers, with a headcount of 32 955 in 2012/13; 15 514 of these researchers were post-doctoral fellows and doctoral students.
MAIN ANALYSIS REPORT: 2012/13
xvi
The number of researcher FTEs per 1 000 in total employment remained static at approximately 1.5 over the previous eight years. The number of female researchers was 18 724 in 2012/13 or 43.7% of the total researcher headcount, indicating an increase of 9.0% over the 17 184 recorded in 2011/12.
R&D PERFORMANCE GLOBALLY
Having increased GERD in both 2011/12 and 2012/13, South Africa seems to have followed the general pattern of recovering global R&D expenditure. International comparisons, however, indicate that South Africa’s R&D intensity for 2012/13 was below the world average of 1.77%, the European Union average of 1.97% and the OECD average of 2.40%. Among the BRICS countries, Brazil, China and the Russian Federation had an R&D share of GDP above 1.0%, while this figure was below 1% for South Africa and India (2011 data). Different economic contexts must be taken into account when interpreting international comparisons.

1
INTRODUCTIONThis report provides analysis and commentary on the results of the 2012/13 South African National Survey of Research and Experimental Development (R&D survey). This report is accompanied by the Metadata report as well as the Statistical Report that presents key findings and trend data. The survey covered the main institutional sectors that perform R&D in South Africa, namely the business, not-for-profit, government, science council and higher education sectors. The South African R&D survey is informed by the guidelines of the Organisation for Economic Co-operation and Development (OECD) for measuring R&D, as presented in The Measurement of Scientific and Technological Activities: Proposed Standard Practice for Surveys on Research and Experimental Development, commonly known as the Frascati Manual (OECD 2002).
The data in this report are presented in terms of the dimensions of research and experimental development (R&D) expenditure, sources of funding and human resources:• Gross domestic expenditure on research and experimental development (GERD);• R&D expenditure by R&D-performing sectors;• Sources and flows of funding for R&D;• R&D expenditure by field of research and socio-economic objectives, and by industrial sector
in the business sector;• R&D expenditure in selected areas of policy interest, namely biotechnology, nanotechnology,
environment related, open-source software, new materials, and tuberculosis (TB), HIV/AIDS and malaria research; and
• R&D personnel by occupation (researchers, technicians and support staff) and full-time equivalents (FTEs).
The description of the survey methodology is contained in Annexure I.

MAIN ANALYSIS REPORT: 2012/13
2
CHAPTER 1 1. R&D INDICATORS IN CONTEXT
1.1 The importance of R&D statistics
Research and experimental development (R&D) contributes to innovation, competitiveness and economic growth through the creation and diffusion of new knowledge. Countries that appreciate the importance of R&D and innovation acknowledge that increased investments in R&D and other activities such as education lead to technological progress, innovation and skilled human resources, which in turn lead to improved productivity, economic growth and employment.
The R&D survey provides statistics on R&D expenditure and human resources devoted to R&D. In South Africa, the overall objective of the survey is to provide an overview of the status of R&D activities in the country. The data serve as the basis for the development of science policy related to the setting of research priorities, government research funding levels, human capital development, and R&D and innovation incentive schemes. Comparisons are made with the R&D data of other countries, where available.Key R&D indicators have grown to become important instruments for policy makers. Gross expenditure on R&D (GERD) as a percentage of gross domestic product (GDP), or R&D intensity, has become the key indicator of R&D performance. It is now common practice for countries to adopt targets for this indicator to help focus policy decisions and public funding.
The second-most widely used R&D statistic is R&D personnel with a focus on researchers, who are critical to the creation of new knowledge. R&D intensity is used in conjunction with other indicators such as GERD per capita to benchmark the level of performance of countries, regions, sectors, R&D teams and individual researchers.
The indicators go beyond the expenditure and personnel statistics; lately statistical agencies around the world are seeking to incorporate R&D in the system of national accounts to measure its relation to productivity growth. Furthermore, the internationalisation of R&D activities has gained momentum during the past two decades, and the R&D activities of foreign affiliates are therefore tracked. The cross-border R&D expenditure of foreign affiliates is an indicator of the openness of the economy.
The South African R&D survey also provides information that can be used in addressing a range of socio-economic issues. Strategic policy documents such as the White Paper on Science and Technology (DACST 1996), the National Research and Development Strategy (DACST 2002), the Ten Year Innovation Plan for South Africa, 2008–2018 (DST, 2007) and the National Development Plan (The Presidency, 2011) make specific commitments with respect to the

3
country’s scientific and technological activities, including R&D, in order to attain national goals. The measurement and monitoring of R&D is therefore also linked to other mechanisms for understanding the output of R&D and its impact on the economy and society.
1.2. Key indicators
The R&D survey produces a number of indicators. The key indicators for 2012/13 are presented in Table 1.1 and compared with the equivalent indicators for 2011/12 and 2010/11.
TABLE 1.1: KEY R&D INDICATORS, SOUTH AFRICA, 2012/13 WITH COMPARATIVE FIGURES FOR 2011/12 AND 2010/11
KEY INDICATOR VALUE
2010/11 2011/12 2012/13
Gross domestic expenditure on R&D (GERD) (R million) 20 254 22 209 23 871
Gross domestic product (GDP) at current prices (R million) 2 664 269 2 917 539 3 138 980
GERD as a percentage of GDP (%) 0.76 0.76 0.76
Civil GERD as a percentage of GDP (%) 0.71 0.72 0.72
Basic research (R million) 4 848 5 440 6 031
Total R&D personnel (FTE*) 29 486.4 30 978.4 35 050.3
Total researchers (FTE*) 18 719.6 20 115.1 21 382.4
Total researchers (FTE*) per 1 000 in total employment 1.4 1.5 1.5
Total R&D personnel (FTE*) per 1 000 in total employment 2.2 2.3 2.4
Total researchers (headcount) 37 901 40 653 42 828
Female researchers (headcount) as a percentage of total researchers (%)# 41.7 42.3 43.7
Total employment 13 118 13 497 14 558
Data note * FTE = Full-time equivalent.# Following OECD practice, doctoral students and post-doctoral fellows are included as researchers.
Data sources South African National Survey of Research and Experimental Development, 2010/11 to 2012/13GDP values: Stats SA, P0441 series, GDP 3rd Quarter 2013 (Stats SA 2013)Total employment value: Stats SA, Labour Force Survey, P0211 series (Stats SA 2014)

MAIN ANALYSIS REPORT: 2012/13
4
CHAPTER 2 R&D EXPENDITURE2.1. Gross domestic expenditure on R&D
Gross domestic expenditure on research and experimental development (GERD) amounted to R23.871 billion in 2012/13. This represents a nominal increase of 7.5% from the R22.209 billion recorded in 2011/12. At constant 2005 Rand value, GERD amounted to R14.878 billion in 2012/13, which was an increase of R371 million from R14.507 billion in 2011/12.
R&D expenditure has been increasing nominally between 2001/02 and 2012/13, with the exception of 2008/09 and 2009/10. R&D expenditure at constant Rand values has yet to reach the highest value recorded in 2008/09.
All sectors registered an increase in nominal R&D expenditure in 2012/13, with noticeable increases particularly in the not-for-profit and higher education sectors.
FIGURE 2.1: GERD IN CURRENT AND CONSTANT 2005 RAND VALUE (R MILLION), SOUTH AFRICA, 1991/92 TO 2012/13
23 871
22 20920 254
20 95521 041
18 62416 521
14 149
12 010
10 082
7 488
4 1032 5942786
9 028
14 878
14 50713 945
15 59916 785
16 17615 508
14 14912 66411 309
9 8187 268
6 488
5 000
0
10 000
15 000
20 000
25 000
30 000
1991
/92
1992
/93
1993
/94
1994
/95
1995
/96
1996
/97
1997
/98
1998
/99
1999
/00
2000
/01
2001
/02
2003
/04
2004
/05
2005
/06
2006
/07
2007
/08
2008
/09
2009
/10
2010
/11
2011
/12
2012
/13
Current Rand values Constant 2005 Rand values
R (m
illion
)
2002
/03
Data note The GDP deflator value of 160.44313, derived from the Stats SA GDP series P0441 in November 2013 (Stats SA 2013), was used to calculate constant 2005 Rand values.The differences in figures between 2011/12 and 2012/13 are due to StatsSA revisions of GDP which were applied in 2011/12 but not in 2012/13.
Data sources South African National Survey of Research and Experimental Development, 1991/92 to 2012/13
GDP values: Stats SA, P0441 series, GDP 3rd Quarter 2013 (Stats SA 2013); South African Reserve Bank (2013) for 1991/92 GDP.
5
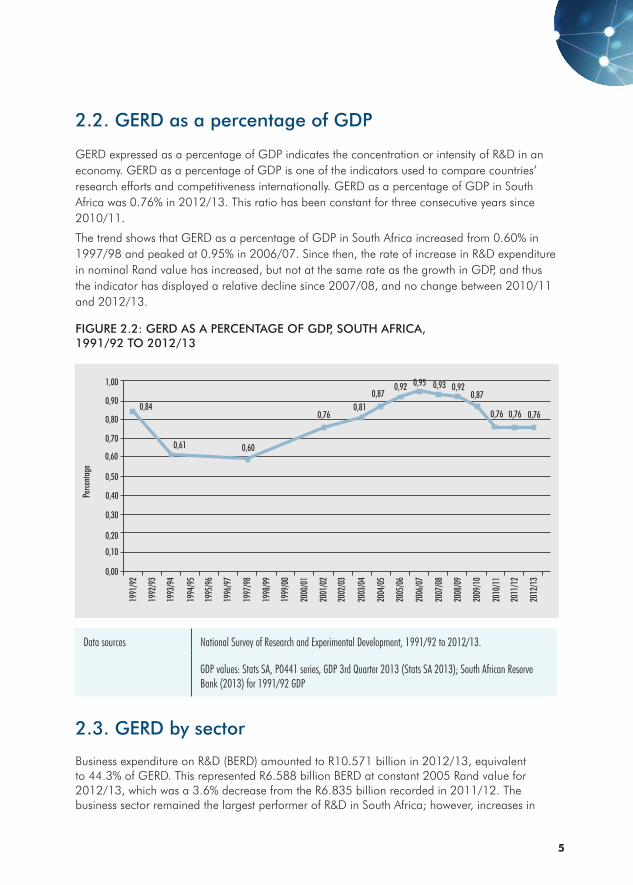
2.2. GERD as a percentage of GDP
GERD expressed as a percentage of GDP indicates the concentration or intensity of R&D in an economy. GERD as a percentage of GDP is one of the indicators used to compare countries’ research efforts and competitiveness internationally. GERD as a percentage of GDP in South Africa was 0.76% in 2012/13. This ratio has been constant for three consecutive years since 2010/11.
The trend shows that GERD as a percentage of GDP in South Africa increased from 0.60% in 1997/98 and peaked at 0.95% in 2006/07. Since then, the rate of increase in R&D expenditure in nominal Rand value has increased, but not at the same rate as the growth in GDP, and thus the indicator has displayed a relative decline since 2007/08, and no change between 2010/11 and 2012/13.
FIGURE 2.2: GERD AS A PERCENTAGE OF GDP, SOUTH AFRICA, 1991/92 TO 2012/13
0,00
1991
/92
1992
/93
1993
/94
1994
/95
1995
/96
1996
/97
1997
/98
1998
/99
1999
/00
2000
/01
2001
/02
2002
/03
2003
/04
2004
/05
2005
/06
2006
/07
2008
/09
2009
/10
2010
/11
2011
/12
2012
/13
Perce
ntag
e
2007
/08
0,10
0,20
1,00
0,90
0,30
0,40
0,50
0,60
0,70
0,800,84
0,61 0,60
0,760,81
0,870,92 0,95 0,93 0,92
0,87
0,76 0,76 0,76
Data sources National Survey of Research and Experimental Development, 1991/92 to 2012/13.
GDP values: Stats SA, P0441 series, GDP 3rd Quarter 2013 (Stats SA 2013); South African Reserve Bank (2013) for 1991/92 GDP
2.3. GERD by sector
Business expenditure on R&D (BERD) amounted to R10.571 billion in 2012/13, equivalent to 44.3% of GERD. This represented R6.588 billion BERD at constant 2005 Rand value for 2012/13, which was a 3.6% decrease from the R6.835 billion recorded in 2011/12. The business sector remained the largest performer of R&D in South Africa; however, increases in

MAIN ANALYSIS REPORT: 2012/13
6
FIGURE 2.3: R&D EXPENDITURE BY SECTOR (R MILLION), SOUTH AFRICA, 2008/09 TO 2012/13
0
2 000
4 000
6 000
8 000
10 000
12 000
14 000
2008/09 2009/10 2010/11 2011/12 2012/13
504
1 438
4 026
7 333
10 57
1
3 730
6 609
10 46
4
10 05
9
1 236
171
3 596
5 425
1 011
163
3 458
5 101
1 067
189
3 137
11 13
9
4 191
1 140
241
12 33
2
Business Not-for-profit Government Higher education Science councils
R (m
illion
)
expenditure in the higher education sector over the past four years have increased the share of GERD attributed to higher education.
Higher education expenditure on R&D (HERD) increased from R6.609 billion in 2011/12 to R7.333 billion in 2012/13 and accounted for 30.7% of GERD. At constant 2005 Rand value, this represented a 5.9% increase in R&D expenditure by higher education institutions from R4.317 billion in 2011/12 to R4.571 billion in 2012/13.
Government expenditure on R&D constituted 6.0% of GERD and increased from R1.236 billion in 2011/12 to R1.438 billion in 2012/13. At constant 2005 Rand value, this represented an increase of 11.0% from R807 million in 2011/12 to R896 million in 2012/13.
The science councils spent R4.026 billion on R&D in 2012/13, which accounted for 16.9% of GERD. This was an increase of R296 million from the R3.730 billion expenditure in 2011/12. At constant 2005 Rand value, this represented a 3.0% increase from R2.436 billion in 2011/12 to R2.509 billion in 2012/13.
Not-for-profit organisations recorded an increase in R&D expenditure from R171 million in 2011/12 to R504 million in 2012/13. At constant 2005 Rand value, this represented a 181.8% increase from R111 million in 2011/12 to R314 million in 2012/13.
Data source National Survey of Research and Experimental Development, 2008/09 to 2012/13

7
CHAPTER 3 FUNDING FOR R&D3.1. Major flows of R&D funding
Government funded the largest proportion of R&D in South Africa in 2012/13. The funding increased by 13.3% from R9.562 billion in 2011/12 to R10.832 billion in 2012/13. Higher education received 49.8% (R5.396 billion) of the total government R&D funding, while government institutions including science councils received 42.8% (R4.638 billion) from the same source. The business and not-for-profit sectors were the smallest recipients of R&D funding from government, receiving 6.3% (R684 million) and 1.1% (R114 million) respectively. The business sector was the second-largest funder of R&D, contributing 38.3% (R9.152 billion) towards total R&D funding. The third-largest source of funding for R&D in 2012/13 was from abroad, amounting to 13.1% (R3.117 billion). R&D funding from abroad decreased by 6.4% from R3.330 billion in 2011/12 to R3.117 billion in 2012/13.
FIGURE 3.1: MAJOR FLOWS OF FUNDING, (R MILLION), SOUTH AFRICA, 2012/13
ForeignR3 117SO
URCE
PERF
ORME
R
R262
R102 R350 R23 R295
R25 R578 R147 R8 402
R684R4 638R5 396R114
R1 010 R655 R 1 190
Other national sources*
R770Government**
R10 832
BusinessR9 152
BusinessR 10 571
Government**R 5 464
Higher education R7 333
NPO R504
*Other national sources includes contributions from higher education, not-for-profit organisations and individual donations**Government includes science councils
Data sources National Survey of Research and Experimental Development, 2012/13

MAIN ANALYSIS REPORT: 2012/13
8
3.2. GERD by sources of funds
Government-funded R&D included all public funding for R&D received by the higher education, science councils, business and government departments. Government and business enterprises have consistently funded the largest proportion of GERD in South Africa, with government funding exceeding business funding since 2007/08. The proportion of R&D funds from government and other national sources increased in 2012/13, while the proportion of funds from business and foreign sources decreased.
The proportion of GERD financed from abroad decreased to 13.1% of GERD in 2012/13 after increasing from 10.6% in 2006/07 to 15.0% in 2011/12. There was an increase in the percentage of GERD funded by other national sources from 2.9% in 2011/12 to 3.2% in 2012/13; this percentage has stayed relatively constant since 2010/11.
FIGURE 3.2: GERD BY SOURCE OF FUNDS (PERCENTAGE), SOUTH AFRICA, 2001/02 TO 2012/13
2001
/02
2002
/03
2003
/04
2004
/05
2005
/06
2006
/07
2007
/08
2008
/09
2009
/10
2010
/11
2011
/12
2012
/130,0
10,0
20,0
30,0
40,0
50,0
60,0
0,3 0,51,7
6,1 4,4 4,21,0 0,8 0,9
3,3 2,9 3,2
13,115,0
12,112,111,410,710,613,6
15,3
10,9
36,434,0
35,638,2
40,442,7
45,7 45,1 44,4 44,543,1
45,4
38,339,040,142,542,6
44,843,9
48,6
54,855,8
Financed by business Financed by government Financed by foreign sources Financed by other national sources
Perce
ntag
e
Data sources National Survey of Research and Experimental Development, 2001/02 to 2012/13
9
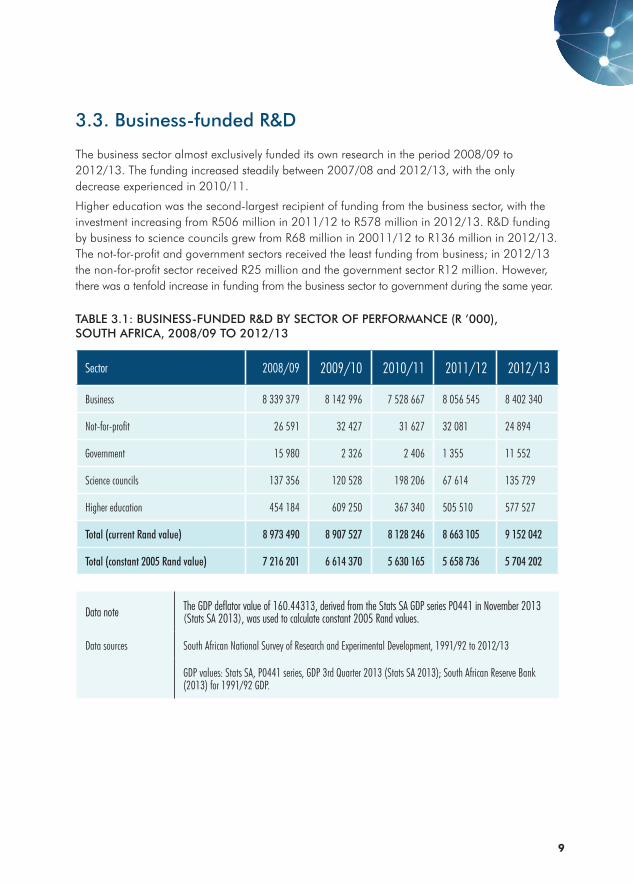
3.3. Business-funded R&D
The business sector almost exclusively funded its own research in the period 2008/09 to 2012/13. The funding increased steadily between 2007/08 and 2012/13, with the only decrease experienced in 2010/11.
Higher education was the second-largest recipient of funding from the business sector, with the investment increasing from R506 million in 2011/12 to R578 million in 2012/13. R&D funding by business to science councils grew from R68 million in 20011/12 to R136 million in 2012/13. The not-for-profit and government sectors received the least funding from business; in 2012/13 the non-for-profit sector received R25 million and the government sector R12 million. However, there was a tenfold increase in funding from the business sector to government during the same year.
Sector 2008/09 2009/10 2010/11 2011/12 2012/13
Business 8 339 379 8 142 996 7 528 667 8 056 545 8 402 340
Not-for-profit 26 591 32 427 31 627 32 081 24 894
Government 15 980 2 326 2 406 1 355 11 552
Science councils 137 356 120 528 198 206 67 614 135 729
Higher education 454 184 609 250 367 340 505 510 577 527
Total (current Rand value) 8 973 490 8 907 527 8 128 246 8 663 105 9 152 042
Total (constant 2005 Rand value) 7 216 201 6 614 370 5 630 165 5 658 736 5 704 202
TABLE 3.1: BUSINESS-FUNDED R&D BY SECTOR OF PERFORMANCE (R ’000), SOUTH AFRICA, 2008/09 TO 2012/13
Data note The GDP deflator value of 160.44313, derived from the Stats SA GDP series P0441 in November 2013 (Stats SA 2013), was used to calculate constant 2005 Rand values.
Data sources South African National Survey of Research and Experimental Development, 1991/92 to 2012/13
GDP values: Stats SA, P0441 series, GDP 3rd Quarter 2013 (Stats SA 2013); South African Reserve Bank (2013) for 1991/92 GDP.

MAIN ANALYSIS REPORT: 2012/13
10
3.4. Government funding of local R&D
Science councils and higher education institutions receive the most funding from government. This trend continued in 2012/13, with higher education institutions receiving R5.396 billion and science councils R3.369 billion from government for R&D performance. Government funding of R&D to the government sector (excluding science councils) increased from R1.112 billion in 2011/12 to R1.269 billion in 2012/13. The business sector received R684 million from government in 2012/13, while not-for-profit organisations received R114 million in funding over the same period.
FIGURE 3.3: BUSINESS-FUNDED R&D BY SECTOR OF PERFORMANCE (R MILLION), SOUTH AFRICA, 2008/09 TO 2012/13
Data sources National Survey of Research and Experimental Development, 2008/09 to 2012/13
2008/09 2009/10 2010/11 20011/12 2012/13
12
137121
198
68136
2532 32321627
454
609
367
506
578
0
100
200
300
400
500
600
700
6 000
7 000
8 000
9 000
8 339 8 143
7 5298 057
8 402
Business
Not-for-profit
Government
Higher education
Science councils
2 2 1
R (m
illion
)

11
Sector 2008/09 2009/10 2010/11 2011/12 2012/13
Business 2 567 140 1 429 766 832 173 499 298 683 669
Not-for-profit 32 711 38 484 41 830 40 992 114 461
Government 1 068 527 1 008 475 990 290 1 112 307 1 269 337
Science councils 2 602 458 2 917 683 2 932 489 3 310 894 3 368 555
Higher education 3 226 674 3 918 620 4 222 092 4 598 426 5 395 871
Total (current Rand value) 9 497 510 9 313 028 9 018 874 9 561 917 10 831 893
Total (constant 2005 Rand value) 7 637 601 6 915 479 6 247 073 6 245 839 6 751 302
Data note The GDP deflator value of 160.44313, derived from the Stats SA GDP series P0441 in November 2013 (Stats SA 2013), was used to calculate constant 2005 Rand values.
Data sources National Survey of Research and Experimental Development, 2008/09 to 2012/13
GDP values: Stats SA P0441 series, GDP third Quarter 2013 (Stats SA 2013)
3.5. Foreign funding of local R&D
The proportion of foreign-funded R&D was highest in the business sector, although it decreased from R1.562 billion in 2011/12 to R1.190 billion in 2012/13. Foreign funding of higher education R&D decreased from R1.272 in 2011/12 to R1.010 in 2012/13. The increase in 2011/12 was mainly due to one institution that received a large R&D project. Science councils received more foreign funding for R&D in 2012/13 than in 2011/12; the funding increased by 59.0% over that period, from R321 million to R511 million.
Not-for-profit organisations and government, which receive the smallest percentages of foreign funds, showed an increase in foreign funding in 2012/13. Not-for-profit organisations recorded R262 million in foreign funding (an increase of R205 million), and government recorded R144 million (an increase of R26 million).
TABLE 3.2: GOVERNMENT-FUNDED R&D (R’000), 2008/09 TO 2012/13

MAIN ANALYSIS REPORT: 2012/13
12
FIGURE 3.4: FOREIGN-FUNDED R&D BY SECTOR OF PERFORMANCE (R MILLION), SOUTH AFRICA, 2008/09 TO 2012/13
Data note Foreign sources include all funding from foreign sources from all sectors.
Data source National Survey of Research and Experimental Development, 2008/09 to 2012/13
2008/090
200
400
600
800
1 000
1 200
1 400
16 00
1 800
R (m
illion
)
1 396
1 5391 442
1 562
1 190
1 010
511
262
144
2009/10 2010/11 2011/12 2012/13
1 272
321
461
473443410
392 417
Business Not-for-profit Government Science councils Higher education
14353
86
54
53
16
118
57

13
CHAPTER 4 CATEGORIES OF GERD4.1. GERD by type of research
R&D expenditure on applied research continued to account for the largest proportion of R&D expenditure in 2012/13 at 46.3% of total GERD, compared to 42.3% in 2011/12. R&D expenditure on experimental development was 28.4% and basic research stood at 25.3% in 2012/13. The observed trend in R&D expenditure towards increased expenditure on applied research over the five-year period continued from 2008/09 to 2012/13, with a 4.0% nominal increase between 2011/12 and 2012/13. The share of GERD apportioned to basic research increased from 20.2% in 2008/09 to 25.3% in 2012/13, indicating sustained focus on areas of basic research in South Africa. The proportion of applied research increased nominally by 13.0% over the same period. The proportion of experimental development decreased from 46.5% in 2008/09 to 28.4% in 2012/13, with a nominal decrease of 4.8% between 2011/12 and 2012/13.
FIGURE 4.1: GERD BY TYPE OF RESEARCH (PERCENTAGE), SOUTH AFRICA, 2008/09 TO 2012/13
2008/090
20
Perce
ntag
e
2009/10 2010/11 2011/12 2012/13
40
60
80
100
Experimental development Applied Basic
20,2 26,5 23,9 24,5 25,3
33,3 31,4 39,8 42,3 46,3
46,5 42,1 36,3 33,2 28,4
Data source National Survey of Research and Experimental Development, 2008/09 to 2012/13

MAIN ANALYSIS REPORT: 2012/13
14
4.2. GERD by type of research and sector of performance
In 2012/13 R&D activities in the business sector shifted towards more applied research, with 52.7% of expenditure devoted to this type of research, an increase of 10.1% from 2011/12.
The not-for-profit sector showed a similar increase in expenditure on applied research, from 46.4% in 2011/12 to 68.7% in 2012/13, as a result of increased expenditure of R333 million by new R&D-performing units, from R171 million in 2011/12 to R504 million in 2012/13.
The higher education sector remained the largest performer of basic research, increasing its share of expenditure devoted to basic research from 49.8% in 2011/12 to 52.4% in 2012/13. In the government sector, there was growth in basic research and in experimental development, but applied research continued to account for the major share of R&D expenditure.
FIGURE 4.2: GERD BY TYPE OF RESEARCH AND SECTOR OF PERFORMANCE (PERCENTAGE), SOUTH AFRICA, 2011/12 AND 2012/13
Basic Applied Experimental Development
2011/120
2012/13 2011/12 2012/13 2011/12 2012/13 2011/12 2012/13 2011/12 2012/13Higher educationScience councilsGovernmentNot-for-profitBusiness
10,0
20,0
30,0
40,0
50,0
60,0
70,0
80,0
90,0
100,0
Perce
ntag
e
8,8 7,6
36,4
22,8 21,3 23,1 24,2 23,3
49,8 52,442,6 52,7
46,468,7 65,7 60,8 47,1 46,8
34,5 32,6
48,5 39,7
17,2
8,5 13,0 16,2
28,8 29,9 15,7 15,0
Data source National Survey of Research and Experimental Development, 2011/12 and 2012/13

15
4.3. GERD by major research field
The medical and health sciences continued to attract the largest share of GERD in 2012/13 at 17.2%, amounting to R4.108 billion. R&D expenditure in the social sciences amounted to R4 billion or 16.8% of GERD in 2012/13. R&D expenditure on the social sciences increased from R2.79 billion in 2011/12 to R4 billion in 2012/13, which was an increase of R1.2 billion. The increase in the social sciences was the result of one firm switching from performing R&D in the information, computer and communication technologies sector to R&D in finance.
After the social sciences, the next-largest research fields were the engineering sciences (which attracted 16.4% of GERD), applied sciences and technologies (9.4%) and information, computer and communication technologies (8.4%).
FIGURE 4.3: GERD BY RESEARCH FIELD (PERCENTAGE), SOUTH AFRICA, 2010/11 TO 2012/13
2010/11
Percentage
0 5 10 15 20
Main
rese
arch
field
0,20,2
0,3Marine sciences
Medical and health sciences
Social sciences
Engineering sciences
Applied sciences and technologies
Information, computer and communication
Agricultural sciences
Biological sciences
Chemical sciences
Mathematical sciences
Environmental sciences
Earth sciences
Humanities
Physical sciences
Material sciences 0,7 0,70,5
1,61,5
1,5
2,02,2 2,3
2,11,82,0
1,72,0
2,5
2,72,6 2,9
4,35,7
6,1
6,56,1
6,5
6,57,7
7,6
8,4 12,813,9
9,49,5
10,6
17,117,217,2
12,4 12,616,8
16,417,0
17,8
2011/12 2012/13
Data note GERD according to research field as measured in the R&D survey.
Data source National Survey of Research and Experimental Development, 2010/11 to 2012/13
MAIN ANALYSIS REPORT: 2012/13
16
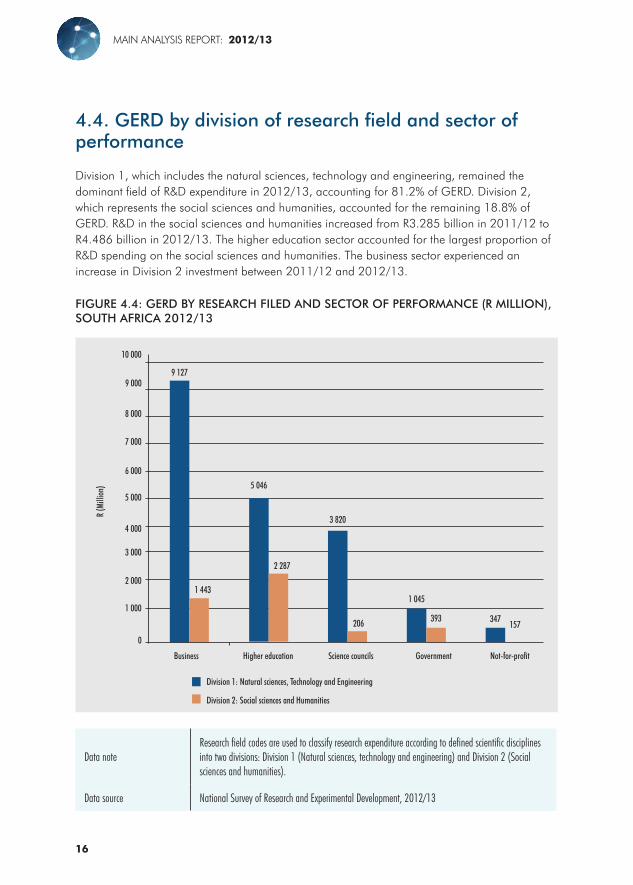
4.4. GERD by division of research field and sector of performance
Division 1, which includes the natural sciences, technology and engineering, remained the dominant field of R&D expenditure in 2012/13, accounting for 81.2% of GERD. Division 2, which represents the social sciences and humanities, accounted for the remaining 18.8% of GERD. R&D in the social sciences and humanities increased from R3.285 billion in 2011/12 to R4.486 billion in 2012/13. The higher education sector accounted for the largest proportion of R&D spending on the social sciences and humanities. The business sector experienced an increase in Division 2 investment between 2011/12 and 2012/13.
FIGURE 4.4: GERD BY RESEARCH FILED AND SECTOR OF PERFORMANCE (R MILLION), SOUTH AFRICA 2012/13
Data noteResearch field codes are used to classify research expenditure according to defined scientific disciplines into two divisions: Division 1 (Natural sciences, technology and engineering) and Division 2 (Social sciences and humanities).
Data source National Survey of Research and Experimental Development, 2012/13
Business
0
1 000
Higher education Science councils Government Not-for-profit
R (M
illion
)
2 000
3 000
4 000
5 000
6 000
7 000
8 000
9 000
10 000
9 127
5 046
1 443
2 287
3 820
206
1 045
393 347 157
Division 1: Natural sciences, Technology and Engineering
Division 2: Social sciences and Humanities

17
4.5. GERD by accounting category
The proportion of R&D expenditure allocated to labour costs increased from 43.7% in 2008/09 to 54.9% in 2012/13, while the percentage of R&D expenditure allocated to other current expenditure decreased from 40.1% in 2008/09 to 35.7% in 2012/13. The percentage of R&D expenditure on capital items similarly decreased from 16.2% in 2008/09 to 9.4% in 2012/13.
FIGURE 4.5: GERD BY ACCOUNTING CATEGORY (PERCENTAGE), SOUTH AFRICA, 2008/09 AND 2012/13
Capital expenditure
2008/09
Labour cost Other current expenditure
2012/13
40.1
16.2
43.7
35.7
9.4
54.9
Data source National Survey of Research and Experimental Development R&D, 2012/13
Labour costs and other current expenditure accounted for 90.6% of total R&D expenditure in 2012/13. In the business sector, labour costs accounted for 55.1% of BERD, totalling R5.822 billion. Capital expenditure in the government sector accounted for 17.7% of total government expenditure on R&D.

MAIN ANALYSIS REPORT: 2012/13
18
FIGURE 4.6: GERD BY ACCOUNTING CATEGORY (R MILLION), SOUTH AFRICA, 2012/13
Data source National Survey of Research and Experimental Development R&D, 2012/13
Capital expenditure
Business
0
R (M
illion
)
Higher educationScience councilsGovernmentNot-for-profit
1 000
2 000
3 000
4 000
5 000
6 000
1 073
5 822
3 676
38 244 222 255
806376 276
2 053
1 697
4 184
2 547
602
Labour costs Other current expenditure
19
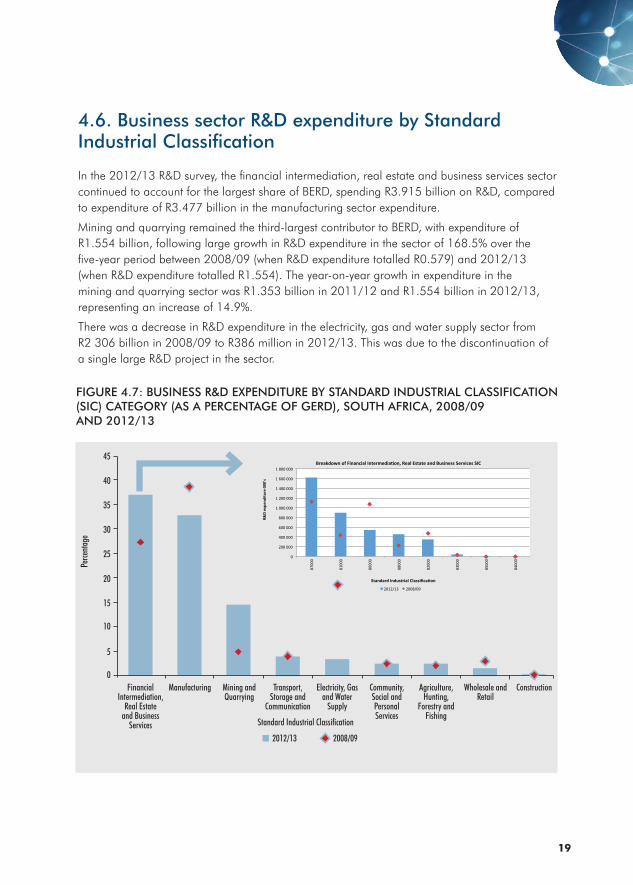
4.6. Business sector R&D expenditure by Standard Industrial Classification
In the 2012/13 R&D survey, the financial intermediation, real estate and business services sector continued to account for the largest share of BERD, spending R3.915 billion on R&D, compared to expenditure of R3.477 billion in the manufacturing sector expenditure.
Mining and quarrying remained the third-largest contributor to BERD, with expenditure of R1.554 billion, following large growth in R&D expenditure in the sector of 168.5% over the five-year period between 2008/09 (when R&D expenditure totalled R0.579) and 2012/13 (when R&D expenditure totalled R1.554). The year-on-year growth in expenditure in the mining and quarrying sector was R1.353 billion in 2011/12 and R1.554 billion in 2012/13, representing an increase of 14.9%.
There was a decrease in R&D expenditure in the electricity, gas and water supply sector from R2 306 billion in 2008/09 to R386 million in 2012/13. This was due to the discontinuation of a single large R&D project in the sector.
FIGURE 4.7: BUSINESS R&D EXPENDITURE BY STANDARD INDUSTRIAL CLASSIFICATION (SIC) CATEGORY (AS A PERCENTAGE OF GERD), SOUTH AFRICA, 2008/09 AND 2012/13
Standard Industrial Classification
Perce
ntag
e
2012/13 2008/09
Financial Intermediation,
Real Estate and Business
Services
Manufacturing Mining and Quarrying
Transport, Storage and
Communication
Electricity, Gas and Water
Supply
Community, Social and Personal Services
Agriculture, Hunting,
Forestry and Fishing
Wholesale andRetail
Construction0
5
10
15
20
25
30
35
40
45
0
200 000
400 000
600 000
800 000
1 000 000
1 200 000
1 400 000
1 600 000
1 800 000
8700
0
8100
0
8600
0
8800
0
8200
0
8300
0
8500
0
8400
0
R&D
expe
nditu
re 0
00's
Standard Industrial Classifica8on
Breakdown of Financial Intermedia8on, Real Estate and Business Services SIC
2012/13 2008/09

MAIN ANALYSIS REPORT: 2012/13
20
TABLE 4.1: STANDARD INDUSTRIAL CLASSIFICATION (SIC) CODES IN THE 80 000 GROUP
81000 Financial Intermediation, Except Insurance and Pension Funding
82000 Insurance and Pension Funding, Except Compulsory Social Security
83000 Activities Auxiliary to Financial Intermediation
84000 Real Estate Activities
85000 Renting of Machinery and Equipment, and of Personal and Household Goods
86000 Computer and related activities
87000 Research and Development
88000 Other Business Activities not elsewhere classified
Data note Industry classification is based on Stats SA’s five-digit Standard Industrial Classification (SIC) codes, which are used to classify businesses according to their economic activities.
While the manufacturing sector did not account for the largest share of BERD, it still remained a significant contributor to total GERD. In 2012/13, the manufacturing sector spent R3.477 billion on R&D, compared to R3.551 billion in 2011/12, a contraction of 2.1%. The largest manufacturing sub-sector remained the chemical and petroleum sector (SIC 33000), which contributed 10.8% towards BERD in 2012/13, totalling R1.140 billion; this was a decrease of R1.381 billion from expenditure in 2011/12. This sector recorded large decreases in R&D expenditure between 2008/09 and 2012/13.

21
FIGURE 4.8: BUSINESS R&D EXPENDITURE BY MANUFACTURING SIC CATEGORY, SOUTH AFRICA, 2008/09 AND 2012/13
Data source National Survey of Research and Experimental Development, 2008/09 and 2012/13
TABLE 4.2: STANDARD INDUSTRIAL CLASSIFICATION (SIC) CODES IN THE 30000 GROUP
30000 Manufacture of Food Products, Beverages and Tobacco Products
31000 Manufacture of Textiles, Clothing and Leather Goods
32000 Manufacture of Wood Products, except furniture , Paper Products, Publishing and Printing material
33000 Manufacture of Refined Petroleum ,Nuclear Fuel, Chemical Products (including Pharmaceuticals, Rubber and Plastic)
34000 Manufacture of Non-Metallic Mineral Products
35000 Manufacture of Basic and Fabricated Metal Products, Machinery and Equipment, Office, Accounting and Computing
36000 Manufacture of Electrical Machinery and Apparatus
37000 Manufacture of Communication Equipment and Apparatus, Medical, Precision and Optical Instruments
38000 Manufacture of Transport Equipment
39000 Manufacture of Furniture, Recycling, Manufacturing not elsewhere classified
2012/132008/09
0
Standard Industrial Classification
3300
0
3700
0
3500
0
3000
0
3600
0
3800
0
3900
0
3200
0
3400
0
3100
0
500
1 000
1 500
2 000
2 500
R (m
illion
)

MAIN ANALYSIS REPORT: 2012/13
22
4.7. GERD by areas of special interest
4.7.1. R&D expenditure on tuberculosis, HIV/AIDS and malaria
R&D expenditure on health-related areas of R&D, including tuberculosis (TB), HIV/AIDS and malaria, increased by R472 million from R2.007 billion in 2011/12 to R2.478 billion in 2012/13. This expenditure increased from 9.0% of GERD in 2011/12 to 10.4% in 2012/13, reaching its highest level since 2008/09.
FIGURE 4.9: GERD ON TB, HIV/AIDS AND MALARIA (R MILLION AND AS A PERCENTAGE OF GERD), SOUTH AFRICA, 2008/09 TO 2012/13
Expenditure as a percentage of GERD
500
R (m
illion
)
02008/09 2009/2010 2010/11 2011/12 2012/13
1 000
1500
2 000
2 500
3 000 12,0
10,0
8,0
6,0
4,0
2,0
0,0
1 616 1 8172 053 2 007 2 478
Expenditure
7,78,7
10,1
9,0
10,4
Percentage
Data source National Survey of Research and Experimental Development, 2008/09 to 2012/13

23
FIGURE 4.10: GERD ON BIOTECHNOLOGY (R MILLION AND AS A PERCENTAGE OF GERD), SOUTH AFRICA, 2008/09 TO 2012/13
4.7.2. Biotechnology-related R&D
Total R&D expenditure on biotechnology increased from R1.065 billion in 2011/12 to R1.179 billion in 2012/13, which represented an increase of 10.7%.
Expenditure as a percentage of GERD
200
R (m
illion
)
02008/09 2009/2010 2010/11 2011/12 2012/13
400
600
800
1 000
1 2005,0
4,0
3,0
2,0
1,0
0,0
802918
1 142
1 065
1 179
Expenditure
3,84,4
5,6
4,8 4,9
Percentage
1 400 6,0
Data source National Survey of Research and Experimental Development, 2008/09 to 2012/13

MAIN ANALYSIS REPORT: 2012/13
24
CHAPTER 5 PEOPLE IN R&D5.1. R&D personnel
R&D personnel headcount totalled 64 917 in 2012/13, which was 9.1% (5 430) more than in 2011/12. Of the additional personnel reported, about 37.7% (2 048) were in higher education, 34.4% (1 867) in the business sector, 16.7% (905) in the science councils, and the remaining 11.2% in the government (109) and not-for-profit (501) sectors. R&D personnel (FTEs) increased by 13.1% between 2011/12 and 2012/13, totalling 35 050.3 in 2012/13. There was a decrease in R&D personnel between 2009/10 and 2010/11, followed by increases in headcount and FTEs in 2011/12 and 2012/13.
FIGURE 5.1: R&D PERSONNEL (HEADCOUNT AND FTEs), SOUTH AFRICA 2001/02 TO 2012/13
64 91759 487
55 53159 344 58 89558 706
29 696
21 195
32 501 35 05030 97829 48630 89130 80231 354
57 27556 453
40 605
10 000
-
20 000
30 000
40 000
50 000
2001
/02
2003
/04
2004
/05
2005
/06
2006
/07
2007
/08
2008
/09
2009
/10
2010
/11
2011
/12
2012
/13
R&D personnel headcount R&D personnel FTEs
Num
ber o
f per
sonn
el
60 000
70 000
59 494
30 98528 79825 190
2002
/03
Data note Following OECD practice, doctoral students and post-doctoral fellows are counted as researchers.
Data source National Survey of Research and Experimental Development, 2001/02 to 2012/13
25
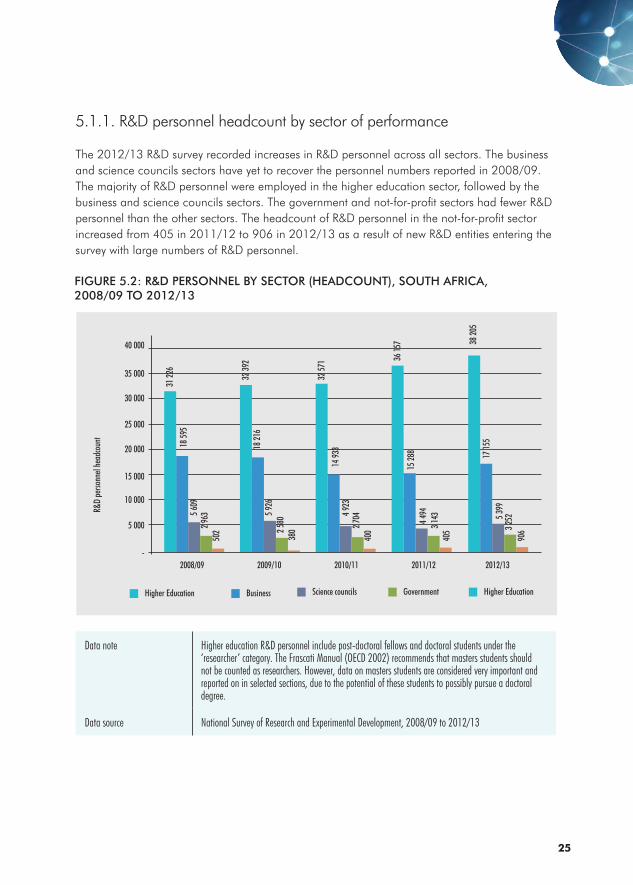
5.1.1. R&D personnel headcount by sector of performance
The 2012/13 R&D survey recorded increases in R&D personnel across all sectors. The business and science councils sectors have yet to recover the personnel numbers reported in 2008/09. The majority of R&D personnel were employed in the higher education sector, followed by the business and science councils sectors. The government and not-for-profit sectors had fewer R&D personnel than the other sectors. The headcount of R&D personnel in the not-for-profit sector increased from 405 in 2011/12 to 906 in 2012/13 as a result of new R&D entities entering the survey with large numbers of R&D personnel.
FIGURE 5.2: R&D PERSONNEL BY SECTOR (HEADCOUNT), SOUTH AFRICA, 2008/09 TO 2012/13
2008/09-
5 000
2009/10 2010/11 2011/12
31 22
618
595
5 609
2 963
502
32 39
218
216
5 926
2 580
380
14 93
3
32 57
1 36 15
715
288
4 923
2 704
400
4 494
3 143
405
17 15
55 3
993 2
52
38 20
5
906
10 000
15 000
20 000
25 000
30 000
35 000
40 000
R&D
perso
nnel
head
coun
t
Higher Education Business Science councils Government Higher Education
2012/13
Data note Higher education R&D personnel include post-doctoral fellows and doctoral students under the ‘researcher’ category. The Frascati Manual (OECD 2002) recommends that masters students should not be counted as researchers. However, data on masters students are considered very important and reported on in selected sections, due to the potential of these students to possibly pursue a doctoral degree.
Data source National Survey of Research and Experimental Development, 2008/09 to 2012/13

MAIN ANALYSIS REPORT: 2012/13
26
5.1.2. R&D personnel full-time equivalents (FTEs) by sector of performance
In the 2012/13 R&D survey, all sectors reported increases in FTE R&D personnel. The highest numbers of FTEs were in higher education (15 614.4) and the business sector (11 322.3).
The year-on-year increase in R&D personnel (FTEs) of 13.1% in 2012/13 was relatively high compared to previous years. The number of R&D personnel (FTEs) per thousand in total employment was 2.4 in 2012/13, which was a relatively small increase in the indicator of only 0.1% from 2011/12. The increase in R&D personnel (FTEs) was attributed to an increase in researchers, mainly postgraduate students.
FIGURE 5.3: R&D PERSONNEL BY SECTOR (FTEs), SOUTH AFRICA, 2008/09 TO 2012/13
15 614
0
2 000
4 000
6 000
8 000
10 000
12 000
14 000
16 000
18 000
R&D
perso
nnel
FTEs
11 322
14 563
12 49212 025
12 477
10 205 9 895
11 87011 169
4 700 4 783 4 312 3 8034 748
2 597
768312
2 405
313
2 179
310366
2 074 1 904
Government Not-for-profitScience councilScience councilHigher Education
2008/9 2009/10 2010/11 2011/12 2012/13
Data note Following OECD practice, doctoral students and post-doctoral fellows are counted as researchers.
Data source National Survey of Research and Experimental Development, 2008/09 to 2012/13

27
5.1.3 R&D personnel by occupation
The majority of R&D personnel consisted of researchers, who accounted for 66.0% of the total, followed by other support staff directly supporting R&D at 17.4% and technicians at 16.6%. The headcount of researchers increased from 40 653 in 2011/12 to 42 828 in 2012/13. The headcount of technicians increased from 9 260 in 2011/12 to 10 790 in 2012/13, while the headcount of other support staff directly supporting R&D increased from 9 574 to 11 299 over the same period.
FIGURE 5.4: R&D PERSONNEL BY OCCUPATION (HEADCOUNT), SOUTH AFRICA, 2008/09 TO 2012/13
2008/09-
5 000
2009/10
10 000
15 000
20 000
25 000
30 000
35 000
40 000
R&D
perso
nnel
head
coun
t
Researchers Technicians
45 000
2010/11 2011/12 2012/13
Other support stuff
39 95
5
40 79
7
37 90
1 40 65
3 42 82
8
11 29
9
10 79
0
9 574
9 260
9 071
8559
9 254
9 443
9 179
9 761
Data note Higher education R&D personnel include post-doctoral fellows and doctoral students under the ‘researcher’ category.
Data source National Survey of Research and Experimental Development, 2008/09 to 2012/13
MAIN ANALYSIS REPORT: 2012/13
28
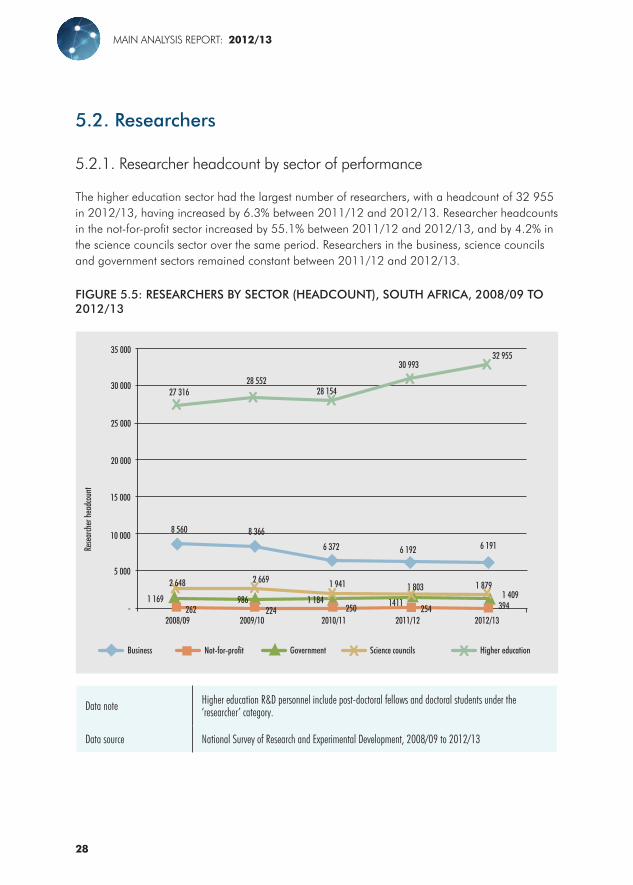
5.2. Researchers
5.2.1. Researcher headcount by sector of performance
The higher education sector had the largest number of researchers, with a headcount of 32 955 in 2012/13, having increased by 6.3% between 2011/12 and 2012/13. Researcher headcounts in the not-for-profit sector increased by 55.1% between 2011/12 and 2012/13, and by 4.2% in the science councils sector over the same period. Researchers in the business, science councils and government sectors remained constant between 2011/12 and 2012/13.
FIGURE 5.5: RESEARCHERS BY SECTOR (HEADCOUNT), SOUTH AFRICA, 2008/09 TO 2012/13
Data note Higher education R&D personnel include post-doctoral fellows and doctoral students under the ‘researcher’ category.
Data source National Survey of Research and Experimental Development, 2008/09 to 2012/13
-
5 000
15 000
10 000
394
2008/09
20 000
25 000
30 000
35 000
Rese
arch
er he
adco
unt
2009/10 2010/11 2011/12 2012/13
27 31628 552
28 154
30 99332 955
6 191
1 8791 409
1 8031 941
1 184
6 1926 372
8 3668 560
2 669
986
2 648
1 169
Higher educationScience councilsGovernmentNot-for-profitBusiness
2541411
224262 250
29
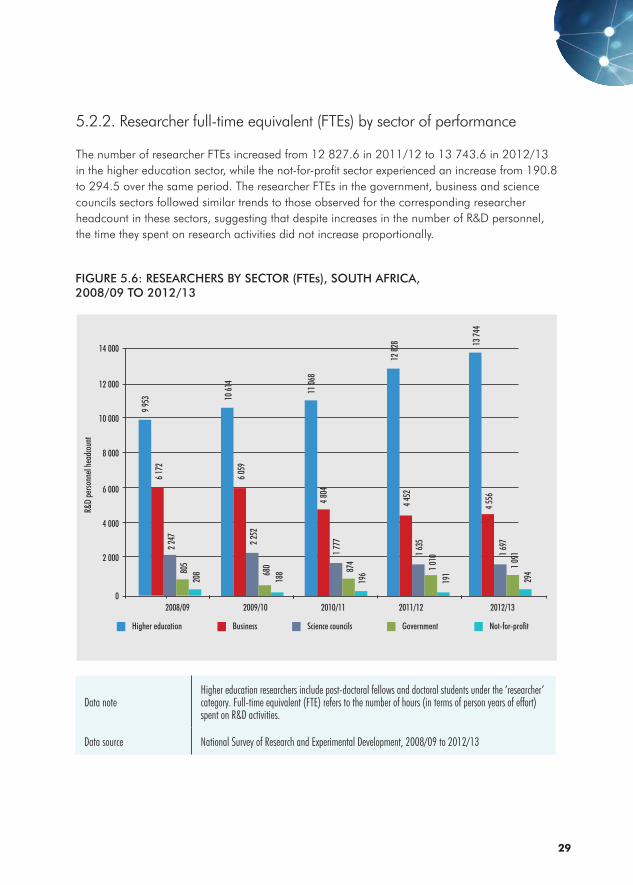
5.2.2. Researcher full-time equivalent (FTEs) by sector of performance
The number of researcher FTEs increased from 12 827.6 in 2011/12 to 13 743.6 in 2012/13 in the higher education sector, while the not-for-profit sector experienced an increase from 190.8 to 294.5 over the same period. The researcher FTEs in the government, business and science councils sectors followed similar trends to those observed for the corresponding researcher headcount in these sectors, suggesting that despite increases in the number of R&D personnel, the time they spent on research activities did not increase proportionally.
FIGURE 5.6: RESEARCHERS BY SECTOR (FTEs), SOUTH AFRICA, 2008/09 TO 2012/13
Data noteHigher education researchers include post-doctoral fellows and doctoral students under the ‘researcher’ category. Full-time equivalent (FTE) refers to the number of hours (in terms of person years of effort) spent on R&D activities.
Data source National Survey of Research and Experimental Development, 2008/09 to 2012/13
2008/09 2009/10
R&D
perso
nnel
head
coun
t
2010/11 2011/12
9 953
2 247
805
0
2 000
4 000
6 000
8 000
10 000
12 000
14 000
2012/13
208
6 172
6 059
2 252
680
188
4 804
294
1 0911 6
974 5
56
191
1 010
1 635
4 452
19687
41 7
77
Higher education
10 61
4
11 06
8
12 82
8 13 74
4
Business Science councils Government Not-for-profit

MAIN ANALYSIS REPORT: 2012/13
30
5.2.3. Researcher headcount by gender
Researchers, including post-doctoral fellows and doctoral students, remained predominantly male between 2008/09 and 2012/13 at 60.3% and 56.3% respectively. The percentage of female researchers increased steadily from 39.7% in 2008/09 to 43.7% in 2012/13.
FIGURE 5.7: RESEARCHERS BY GENDER (PERCENTAGE), SOUTH AFRICA, 2008/09 TO 2012/13
Data note Higher education R&D personnel include post-doctoral fellows and doctoral students under the ‘researcher’ category.
Data source National Survey of Research and Experimental Development, 2008/09 to 2012/13
Percentage
2012/13
0
2011/12
2010/11
2009/10
2008/09
10 20 30 40 50 60 70 80 90 100
60,3
59,2
58,3
57,7
56,3
39,7
43,7
42,3
41,7
40,8
Male Female
5.2.4. Researchers by population group
The proportion of African researchers increased from 26.8% in 2008/09 to 27.1% in 2012/13. The percentage of Coloured researchers increased from 5.3% to 7.9%, and Indian researchers from 8.7% to 12.1% over the same period. The majority of researchers were still from the White population group, although the percentage of White researchers declined from 59.2% to 47.3% between 2008/09 and 2012/13.

31
FIGURE 5.8: RESEARCHERS BY POPULATION GROUP (PERCENTAGE), SOUTH AFRICA, 2008/09 AND 2012/13
2008/09
2012/13
26,8
8,7
5,3
59,2
27,1
47,3
5,6
7,9
12,1
Total researchers = 42 828
Total researchers = 39 955
White
African
Indian
Coloured
White
African
Indian
Coloured
Non SA students
Data note Higher education researchers include post-doctoral fellows and doctoral students under the ‘researcher’ category. The 2008/09 data had non-South African postgraduate students spread across each race category and could not be separated as is the case in 2012/13.
Data source National Survey of Research and Experimental Development, 2008/09 and 2012/13

MAIN ANALYSIS REPORT: 2012/13
32
5.2.5. Researchers (excluding doctoral students and post-doctoral fellows) by population group
The workforce of researchers (excluding doctoral students and post-doctoral fellows) by population group consisted of 55.7% White researchers (headcount), 29.7% African researchers, 9.2% Indian researchers and 5.8% Coloured researchers. By excluding postgraduate students from the R&D personnel, the data revealed shifts in the overall racial composition of the researcher headcount over time. The proportion of African researchers increased from 22.8% in 2008/09 to 29.7% in 2012/13, Indian researchers increased from 3.9% to 9.2%, and Coloured researchers increased from 5.2% to 5.8%. The percentage of White researchers decreased from 63.1% to 55.3% over the same period.
FIGURE 5.9: RESEARCHERS (EXCLUDING DOCTORAL STUDENTS AND POST-DOCTORAL FELLOWS) BY POPULATION GROUP (PERCENTAGE), SOUTH AFRICA, 2008/09 TO 2012/13
2008/09
63,13,9
22,8
5,22012/13
29,7
55,75,8
9,2
Total number of researchers: 28 952
White
African
Coloured
Indian
Total number of researchers: 27 314
White
African
Indian
Coloured
Data note For the discussion under this section, higher education researchers do not include post-doctoral fellows and doctoral students under the ‘researcher’ category.
Data source National Survey of Research and Experimental Development, 2008/09 and 2012/13

33
5.2.6. Researchers (excluding doctoral students and post-doctoral fellows) by qualification and population group
In 2012/13, 29.7% of researchers (excluding doctoral students and post-doctoral fellows) were African and 6.4% held a doctoral qualification. African researchers with a doctoral degree increased from 4.2% of all researchers in 2008/09 to 6.4% in 2012/13. In 2012/13 the majority of researchers with a doctoral qualification were still in the White population group. The majority of South African researchers held a masters, honours, bachelor or equivalent degree in 2008/09 and 2012/13.
FIGURE 5.10: RESEARCHERS (EXCLUDING DOCTORAL STUDENTS AND POST-DOCTORAL FELLOWS) BY QUALIFICATION AND POPULATION GROUP (PERCENTAGE), SOUTH AFRICA, 2012/13
Coloured
0
Indian
African
White
Percentage
10 20 30 40 50 60
Doctoral degree or equivalent Masters, hounours, bachelor or equivalent Diploma
20,4 29,3 5,6
6,36,4 17,0
2,4 5,3 1,5
1,5 3,6 0,7
Data source National Survey of Research and Experimental Development, 2012/13

MAIN ANALYSIS REPORT: 2012/13
34
FIGURE 5.11: RESEARCHERS (EXCLUDING DOCTORAL STUDENTS AND POST-DOCTORAL FELLOWS) BY QUALIFICATION AND POPULATION GROUP (PERCENTAGE), SOUTH AFRICA, 2008/09
Coloured
0
Indian
African
White
Percentage
10 20 30 40 50 60
Doctoral degree or equivalent Masters, hounours, bachelor or equivalent Diploma
20,9 32,3 9,9
5,04,2 13,6
1,8 4,9 2,3
1,2 2,7 1,2
70
Data note For the discussion under this section, higher education researchers do not include post-doctoral fellows and doctoral students under the ‘researcher’ category.
Data source National Survey of Research and Experimental Development, 2008/09 and 2012/13
5.3. Higher education R&D personnel
5.3.1. Higher education R&D personnel: FTEs as a percentage of headcount
The higher education sector accounted for the largest proportion of R&D personnel. The 2012/13 R&D survey data reflected increases in FTEs in both the R&D personnel and researcher categories. Higher education researchers (excluding post-doctoral fellows and postgraduate students) spent 22.3% of their time on research in 2008/09, and this percentage increased to 27.0% in 2012/13. Doctoral students spent 55.6% of their time on research activities in 2008/09 and 54.8% in 2012/13, while masters students spent 43.4% of their time on research in 2008/09 and 49.3% in 2012/13. Post-doctoral fellows spent most of their time performing research, as indicated by the high ratio for FTEs as a percentage of headcount. In 2011/12 post-doctoral fellows reported that the time they spent on research had decreased to 83.2%, but this percentage improved to 93.7% in 2012/13.
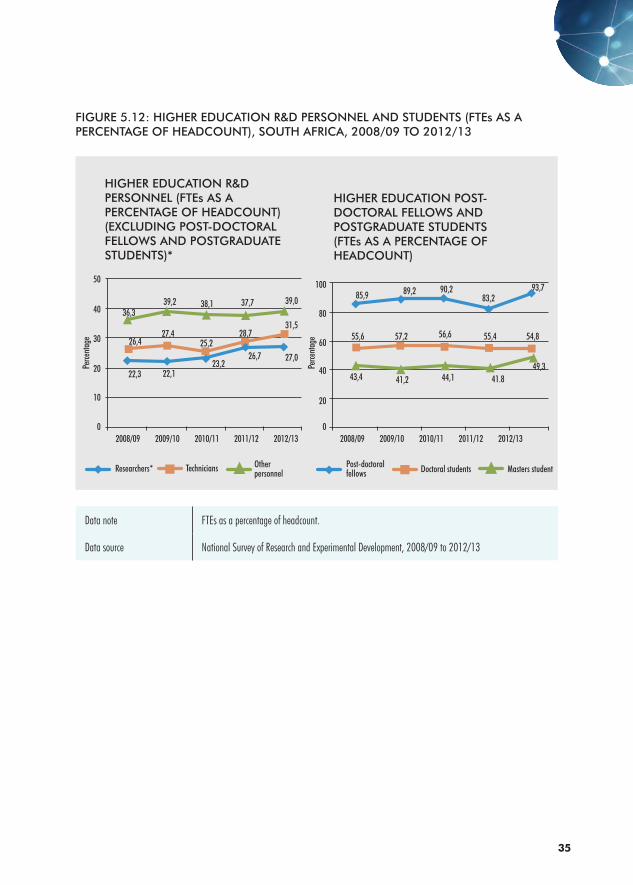
35
FIGURE 5.12: HIGHER EDUCATION R&D PERSONNEL AND STUDENTS (FTEs AS A PERCENTAGE OF HEADCOUNT), SOUTH AFRICA, 2008/09 TO 2012/13
Data note FTEs as a percentage of headcount.
Data source National Survey of Research and Experimental Development, 2008/09 to 2012/13
Masters studentPost-doctoral fellows Doctoral students
0
10
2008/09
20
30
40
50
2009/10 2010/11 2011/12 2012/13
Perce
ntag
e
22,3 22,123,2
26,7 27,0
26,427,4
25,228,7
31,5
39,037,738,139,236,3
0
20
2008/09
40
60
80
100
2009/10 2010/11 2011/12 2012/13
Perce
ntag
e
43,4 41,2 44,1 41.849,3
55,6 57,2 56,6 55,4 54,8
83,290,289,285,9
93,7
Researchers* Technicians
HIGHER EDUCATION R&D PERSONNEL (FTEs AS A PERCENTAGE OF HEADCOUNT) (EXCLUDING POST-DOCTORAL FELLOWS AND POSTGRADUATE STUDENTS)*
HIGHER EDUCATION POST-DOCTORAL FELLOWS AND POSTGRADUATE STUDENTS (FTEs AS A PERCENTAGE OF HEADCOUNT)
Other personnel

MAIN ANALYSIS REPORT: 2012/13
36
5.3.2. Post-doctoral fellow and postgraduate student headcount and full-time equivalents (FTEs)
There was an increase in headcounts and FTEs among post-doctoral fellows, doctoral and masters students between 2008/09 and 2012/13. The headcount of doctoral students exceeded 10 000 in 2008/09 and reached 14 130 in 2012/13, while the headcount of masters students increased from 25 524 in 2008/09 to 35 137 in 2012/13.
FIGURE 5.13: HIGHER EDUCATION POST-DOCTORAL FELLOWS AND POSTGRADUATE STUDENTS (HEADCOUNT AND FTEs), SOUTH AFRICA, 2008/09 TO 2012/13
Master students Doctoral students Postdoctoral fellows
0 5 000 10 000 15 000 20 000 25 000 30 000 35 000
2012/13
2011/12
2010/11
2009/10
2008/09
Head
coun
t
2012/13
2011/12
2010/11
2009/10
2008/09
FTEs
40 000
11 074,15 770,8
538,8
11 105,26 155,8
696,712 505,1
6 587,6866,6
14 912,47 490,2
982,017 310,3
7 7471 296
25 52410 376
62726 956
10 761781
28 373
35 637
35 137
11 640961
13 519
14 130
1 180
1 384
Data note Masters students are not counted as R&D personnel according to the Frascati Manual (OECD 2002).
Data source National Survey of Research and Experimental Development, 2008/09 to 2012/13
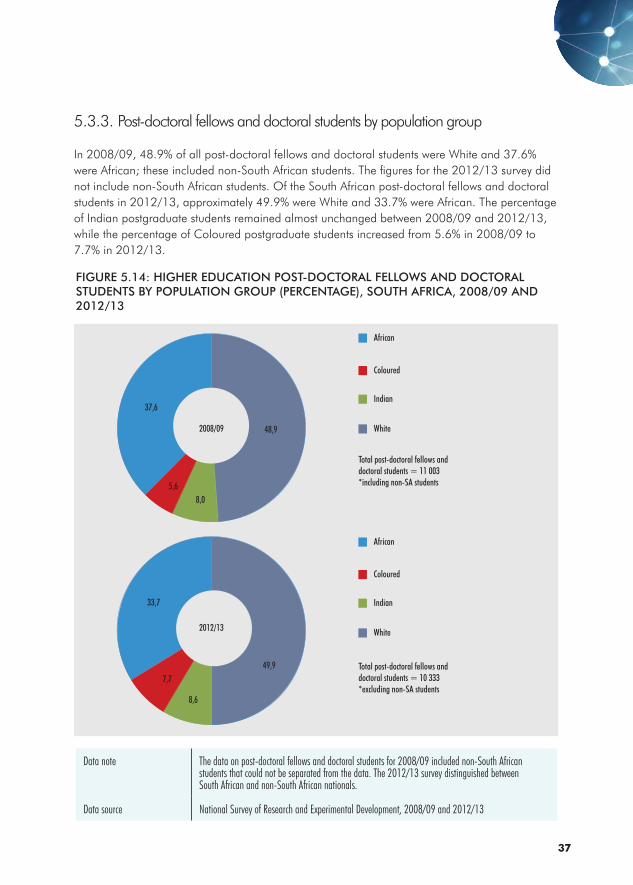
37
5.3.3. Post-doctoral fellows and doctoral students by population group
In 2008/09, 48.9% of all post-doctoral fellows and doctoral students were White and 37.6% were African; these included non-South African students. The figures for the 2012/13 survey did not include non-South African students. Of the South African post-doctoral fellows and doctoral students in 2012/13, approximately 49.9% were White and 33.7% were African. The percentage of Indian postgraduate students remained almost unchanged between 2008/09 and 2012/13, while the percentage of Coloured postgraduate students increased from 5.6% in 2008/09 to 7.7% in 2012/13.
FIGURE 5.14: HIGHER EDUCATION POST-DOCTORAL FELLOWS AND DOCTORAL STUDENTS BY POPULATION GROUP (PERCENTAGE), SOUTH AFRICA, 2008/09 AND 2012/13
2008/09
2012/13
48,9
8,05,6
37,6
49,9
33,7
8,6
7,7Total post-doctoral fellows and doctoral students = 10 333*excluding non-SA students
Total post-doctoral fellows and doctoral students = 11 003*including non-SA students
African
Coloured
Indian
White
African
Coloured
Indian
White
Data note The data on post-doctoral fellows and doctoral students for 2008/09 included non-South African students that could not be separated from the data. The 2012/13 survey distinguished between South African and non-South African nationals.
Data source National Survey of Research and Experimental Development, 2008/09 and 2012/13

MAIN ANALYSIS REPORT: 2012/13
38
5.3.4. Profile of South African and non-South African postgraduate students
The 2012/13 R&D survey captured data for postgraduate students according to race, gender and whether they were South African nationals or not. Of the total post-doctoral fellow and doctoral student headcount of 15 514, 66.6% were South African and 33.4% were non-South African.
FIGURE 5.15: HIGHER EDUCATION POST-DOCTORAL FELLOWS AND DOCTORAL STUDENTS BY NATIONALITY (HEADCOUNT), SOUTH AFRICA, 2012/13
Total post-doctoral fellows and doctoral students = 15 514
South African
Non South African
33.4
66.6
Data note The 2012/13 survey distinguished between South African and non-South African nationals.
Data source National Survey of Research and Experimental Development, 2012/13
5.3.5. South African and non-South African postgraduate students by qualification
The breakdown by qualification shows that the majority of masters and doctoral students were South African nationals, with the exception of post-doctoral fellows where non-South African nationals were in the majority (63.1%). The number of foreign post-doctoral fellows and PhD students increased between 2011/12 and 2012/13, while South African post-doctoral fellows and PhD students declined.

39
FIGURE 5.16: HIGHER EDUCATION POSTGRADUATE STUDENTS BY QUALIFICATION (PERCENTAGE), SOUTH AFRICA, 2012/13
TABLE 5.1: HIGHER EDUCATION POSTGRADUATES BY QUALIFICATION (HEADCOUNT), SOUTH AFRICAN, 2011/12 AND 2012/13
Higher education postgraduate students
2011/12 2012/13
South African Non-South African Total South African Non-South
African Total
Masters students 29 131 6 506 35 637 29 364 5 773 35 137
Doctoral students 10 135 3 384 13 519 9 822 4 308 14 130
Post-doctoral fellows 538 642 1 180 511 873 1 384
Total 39 804 10 532 50 336 39 697 10 954 50 651
Data note The 2012/13 survey captured postgraduate students according to race, gender and whether they were South African nationals or not.
Data source National Survey of Research and Experimental Development, 2011/12 and 2012/13
Masters Students
0
Post-doctoral fellows
QualificationSouth African Non-South African
Perce
ntag
e
10
20
30
40
50
60
70
80
90
100
83,6
69,5
36,9
16,4
30,5
63,1
Doctoral Students
Data note The 2012/13 survey distinguished between South African and non-South African nationals.
Data source National Survey of Research and Experimental Development, 2012/13

MAIN ANALYSIS REPORT: 2012/13
40
Province2008/09 2012/13
R’000 % R’000 %
Eastern Cape 889 081 4,2 1 463 590 6,1
Free State 1 562 720 7,4 1 714 472 7,2
Gauteng 10 981 587 52,2 10 602 434 44,4
KwaZulu-Natal 2 210 336 10,5 3 013 373 12,6
Limpopo 286 157 1,4 619 436 2,6
Mpumalanga 379 123 1,8 612 030 2,6
North West 487 376 2,3 890 363 3,7
Northern Cape 174 453 0,8 400 975 1,7
Western Cape 4 070 214 19,3 4 554 545 19,1
TOTAL 21 041 047 100,0 23 871 218 100,0
CHAPTER 6 GEOGRAPHIC DIMENSIONS OF R&D6.1. R&D expenditure by province
R&D in South Africa is concentrated in three provinces, namely Gauteng, Western Cape and KwaZulu-Natal. Gauteng was responsible for about R10.602 billion (44.4%) of total GERD, followed by the Western Cape with R4.555 billion (19.1%) and KwaZulu-Natal with R3.013 billion (12.6%). Together these three provinces accounted for 76.1% of total GERD in 2012/13. An increase of 5.9% in the proportion of GERD spent in the other provinces was observed; from 18.0% in 2008/09 to 23.9% in 2012/13.
Data source National Survey of Research and Experimental Development R&D, 2008/09 and 2012/13
TABLE 6.1: R&D EXPENDITURE BY PROVINCE (R’000), SOUTH AFRICA, 2008/09 AND 2012/13
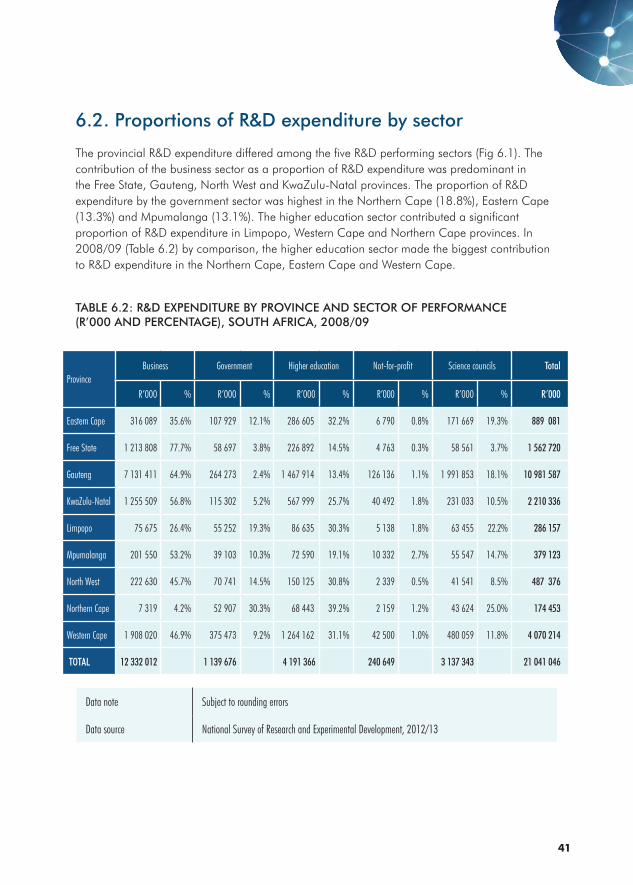
41
6.2. Proportions of R&D expenditure by sector
The provincial R&D expenditure differed among the five R&D performing sectors (Fig 6.1). The contribution of the business sector as a proportion of R&D expenditure was predominant in the Free State, Gauteng, North West and KwaZulu-Natal provinces. The proportion of R&D expenditure by the government sector was highest in the Northern Cape (18.8%), Eastern Cape (13.3%) and Mpumalanga (13.1%). The higher education sector contributed a significant proportion of R&D expenditure in Limpopo, Western Cape and Northern Cape provinces. In 2008/09 (Table 6.2) by comparison, the higher education sector made the biggest contribution to R&D expenditure in the Northern Cape, Eastern Cape and Western Cape.
TABLE 6.2: R&D EXPENDITURE BY PROVINCE AND SECTOR OF PERFORMANCE (R’000 AND PERCENTAGE), SOUTH AFRICA, 2008/09
ProvinceBusiness Government Higher education Not-for-profit Science councils Total
R’000 % R’000 % R’000 % R’000 % R’000 % R’000
Eastern Cape 316 089 35.6% 107 929 12.1% 286 605 32.2% 6 790 0.8% 171 669 19.3% 889 081
Free State 1 213 808 77.7% 58 697 3.8% 226 892 14.5% 4 763 0.3% 58 561 3.7% 1 562 720
Gauteng 7 131 411 64.9% 264 273 2.4% 1 467 914 13.4% 126 136 1.1% 1 991 853 18.1% 10 981 587
KwaZulu-Natal 1 255 509 56.8% 115 302 5.2% 567 999 25.7% 40 492 1.8% 231 033 10.5% 2 210 336
Limpopo 75 675 26.4% 55 252 19.3% 86 635 30.3% 5 138 1.8% 63 455 22.2% 286 157
Mpumalanga 201 550 53.2% 39 103 10.3% 72 590 19.1% 10 332 2.7% 55 547 14.7% 379 123
North West 222 630 45.7% 70 741 14.5% 150 125 30.8% 2 339 0.5% 41 541 8.5% 487 376
Northern Cape 7 319 4.2% 52 907 30.3% 68 443 39.2% 2 159 1.2% 43 624 25.0% 174 453
Western Cape 1 908 020 46.9% 375 473 9.2% 1 264 162 31.1% 42 500 1.0% 480 059 11.8% 4 070 214
TOTAL 12 332 012 1 139 676 4 191 366 240 649 3 137 343 21 041 046
Data note Subject to rounding errors
Data source National Survey of Research and Experimental Development, 2012/13
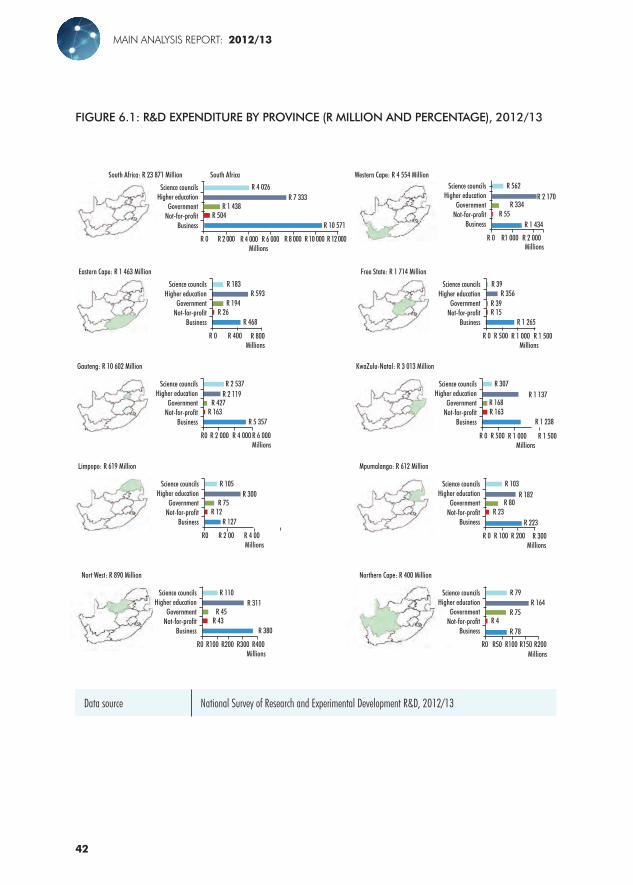
MAIN ANALYSIS REPORT: 2012/13
42
FIGURE 6.1: R&D EXPENDITURE BY PROVINCE (R MILLION AND PERCENTAGE), 2012/13
Data source National Survey of Research and Experimental Development R&D, 2012/13
South Africa: R 23 871 Million South Africa
R 4 026R 7 333
R 1 438R 504
R 10 571
R 0 R 2 000 R 4 000 R 6 000 R 8 000 R 10 000 R 12 000Millions
Science councilsHigher education
GovernmentNot-for-profit
Business
Eastern Cape: R 1 463 Million
R 183R 593
R 194R 26
R 468
R 0 R 400 R 800Millions
Science councilsHigher education
GovernmentNot-for-profit
Business
Free State: R 1 714 Million
R 39R 356
R 39R 15
R 1 265
R 0 R 500 R 1 000Millions
Science councilsHigher education
GovernmentNot-for-profit
Business
R 1 500
Gauteng: R 10 602 Million
R 2 537R 2 119
R 427R 163
R 5 357
R 0 R 2 000Millions
Science councilsHigher education
GovernmentNot-for-profit
Business
R 4 000 R 6 000
KwaZulu-Natal: R 3 013 Million
R 307R 1 137
R 168R 163
R 1 238
Science councilsHigher education
GovernmentNot-for-profit
Business
R 0 R 500 R 1 000Millions
R 1 500
Limpopo: R 619 Million
R 105R 300
R 75R 12
R 127
R 0 R 2 00Millions
Science councilsHigher education
GovernmentNot-for-profit
Business
R 4 00
Mpumalanga: R 612 Million
R 103R 182
R 80R 23
R 223
Science councilsHigher education
GovernmentNot-for-profit
Business
R 0 R 100 R 200Millions
R 300
Nort West: R 890 Million
R 110R 311
R 45R 43
R 380
R 0 R100Millions
Science councilsHigher education
GovernmentNot-for-profit
Business
R200
Northern Cape: R 400 Million
R 79R 164
R 75R 4
R 78
Science councilsHigher education
GovernmentNot-for-profit
Business
R0 R50 R100Millions
R150
Western Cape: R 4 554 Million
R300 R400 R200
R 562R 2 170
R 334R 55
R 1 434
R 0 R1 000 R 2 000Millions
Science councilsHigher education
GovernmentNot-for-profit
Business

43
CHAPTER 7 INTERNATIONAL COMPARISONS7.1. Gross domestic expenditure on R&D This section presents a selection of R&D indicators from various countries for comparison. The comparison takes into consideration the differences in economic structures between countries and the fact that R&D is concentrated in certain parts of the world; for example, ten countries account for almost 80% of total global R&D. These comparisons should be treated with caution due to differences between countries with respect to the availability of data. The country selection was a combination of African countries that had complete datasets during their respective survey periods, R&D statistics of upper middle income countries, the BRICS countries and other developing countries. Some of the top R&D-performing countries were also included for further international comparisons.
7.1.1. GERD as a percentage of GDP
For the third consecutive year, GERD as a percentage of GDP in South Africa remained constant at 0.76%.
The African Innovation Outlook (AIO) presents 2010/11 R&D data for some African countries, which makes it possible to determine the levels of research intensity in these countries (AU-NEPAD 2010). GERD as percentage of GDP varied among countries; Kenya, Senegal and Uganda reported their research intensity as 0.98%, 0.54% and 0.50% respectively. South Africa’s GERD as a percentage of GDP was comparable with upper middle-income countries such as Argentina (0.74%) and India (0.87%). GERD as percentage of GDP was above 1 for BRICS member countries other than India and South Africa: China recorded R&D intensity of 1.98%, followed by Brazil at 1.16% and the Russian Federation at 1.12%.
The most research-intensive countries in 2012/13 were in the high-income category and included Finland (3.55%), Japan (3,35%) and Germany (2.92). The European Union reported an average research intensity of 1.97% for its 28 members, which was an increase of 0.03% from 2011/12.

MAIN ANALYSIS REPORT: 2012/13
44
FIGURE 7.1: GERD AS A PERCENTAGE OF GDP FOR SELECTED COUNTRIES, 2012/13 OR LATEST AVAILABLE YEAR
Data notes Reported data are for the 2012/13 financial year or the latest available year as indicated in brackets. Calculations are based on current national currencies.
Data sources Country data: South Africa: National Survey of Research and Experimental Development, 2012/13 Argentina, Chile, China, EU 28, Finland, France, Germany, Italy, Japan, Mexico, OECD Total, Poland, Russian Federation, Spain, Turkey, United States, OECD 2014 Kenya, Senegal and Uganda: AU-NEPAD 2014 Brazil, Egypt, India, Turkey, Tunisia and World: UIS 2013 India: Ministry of Science and Technology 2012
3,55
0,00
0.50
1,00
1,50
2,00
2,50
3,00
3,50
4,00
GERD
as a
perce
ntag
e of G
DP
Finlan
d
Japa
n
Germ
any
Unite
d sta
tes
QECD
Tota
l
Fran
ce
China
EU 28
Wold
(201
0)
Spain Ita
ly
Braz
il (20
10)
Russi
an Fe
dera
tion
Tunis
ia (2
009)
Keny
a (20
10)
Turk
ey
Polan
d
India
(201
1)
Sout
h Af
rica
Arge
ntini
a
Sene
gal (
2010
)
Ugan
da (2
010)
Mexic
o (20
11)
Egyp
t (20
11)
Chile
3,35
2,92
2,79
2,40
2,26
1,98
1,97
1,77
1,30
1,27
1,16
1,12
1,10
0,98
0,92
0,90
0,87
0,76
0,74
0,54
0,50
0,43
0,43
0,35
Selected countries
7.1.2. GERD for selected countries
South Africa’s GERD in US dollar purchasing power parity (PPP$) increased from $4.158 billion in 2011/12 to $4.308 billion in 2012/13, which represented an increase of 3.6%.
All the selected countries, with the exception of Spain and Finland, reported a year-on-year increase in GERD between 2010/11 and 2012/13. It is encouraging that countries are increasing their investment in R&D after the decline in most countries in 2010/11.

45
TABLE 7.1: GERD FOR SELECTED COUNTRIES (BILLION CURRENT PPP$), 2010/11 TO 2012/13 OR LATEST AVAILABLE YEAR
Country 2010 2011 2012
Argentina 3 946 4 592 5 446
Mexico 7 883 8 058 *
Turkey 9 713 10 826 12 656
OECD total 994 566 b 1034 024 b 1107 397 b
United States 408 657 d 415 193 jp 453 544
China 178 167 208 171 293 549
Japan 140 656 148 389 b 151 837 b
Germany 87 831 96 971 c 102 238 c
France 50 735 a 53 310 p 55 352 p
Russian Federation 33 055 35 192 37 854
Italy 25 154 25 780 26 320 p
India 32 923 c 36 195 c *
Spain 20 338 20 106 19 556
Poland 5 723 6 409 7 899
Finland 7 563 7 897 7 530
Brazil 25 121 27 430 *
South Africa 4 009 4 158 4 308
Chile 1 035 1 173 1 312
Data notes *Data not availablea) Break in series with previous year for which data are available b) Secretariat estimate or projection based on national sources c) National estimate or projectiond) Excluding most or all defence expenditureg) Excluding R&D in the social sciences and humanitiesj) Excluding most
Data sources South Africa: National Survey of Research and Development 2012/13; OECD 2014
MAIN ANALYSIS REPORT: 2012/13
46
7.1.3. GERD by source of funds
R&D is financed by government, business, foreign sources, and other national sources including the higher education institutions and not-for-profit organisations The sources of funds for R&D, and the proportion of funding from the various sources, vary among countries. According to the OECD (2010), governments are the major sources of funding for R&D in developing countries, while the business sector is the largest funder of R&D in developed countries.
South Africa received 45.4% of its R&D funding from government in 2012/13 and 38.3% from the business sector. Argentina, the Russian Federation, Mexico, Senegal, Poland, Uganda, Spain and Italy reported that more than 40% their R&D funding came from government. The countries that received the largest share of R&D funding from the business sector were China (74.0%), Germany (65.6%), Finland (63.1%) and France (55.0%). Senegal, Kenya, Uganda and Chile reported that more than 15% of their GERD was financed by foreign sources.

47
FIGURE 7.2: GERD BY SOURCE OF FUNDS IN SELECTED COUNTRIES (PERCENTAGE), 2012/13 OR LATEST AVAILABLE YEAR
Argentina
Russian Federation
Mexico (2011)
Senegal (2008)
Brazil (2011)
Poland
Uganda (2009)
South Africa
Spain (2011)
Italy (2011)
Chile
France (2011)
Germany (2011)
Turkey
Kenya (2007)
Finland
China
0% 10% 20% 30% 40% 60%50% 70% 80% 90% 100%Percentage
Government Business Other national sources Abroad
Selec
ted co
untri
es
21,6
26,7
26,2
28,2
29,8
35,4
37,1
41,9
44,5
45,4
48,1
51,3
52,6
57,1
59,6
67,8
74,0
16,8
74,0
63,1
39,4
46,8
65,6
55,0
32,9
45,1
44,3
38,3
17,68,2
32,3
45,2
4,0 0,6
11,9
38,3
36,8
27,2
21,3
24,4
4,1 0,6
4,01,0
2,9 0,7
2,2 0,0
3,0 13,4
26,1
13,13,2
3,9 9,1
4,5 6,7
18,1
1,9 7,7
0,4 4,2
0,6
17,6
8,81,4
3,4 1,0
Data notes Data are for 2012/13 or the latest available year as indicated in brackets.Other national sources include the not-for-profit and higher education sectors.
Data sources Country data:South Africa: National Survey of Research and Experimental Development, 2012/13Argentina, Chile, China, Finland, France, Germany, Italy, Mexico, Poland, Russian Federation, and Spain: OECD 2014Kenya, Senegal, and Uganda: AU-NEPAD 2014Brazil, Turkey: UIS 2013
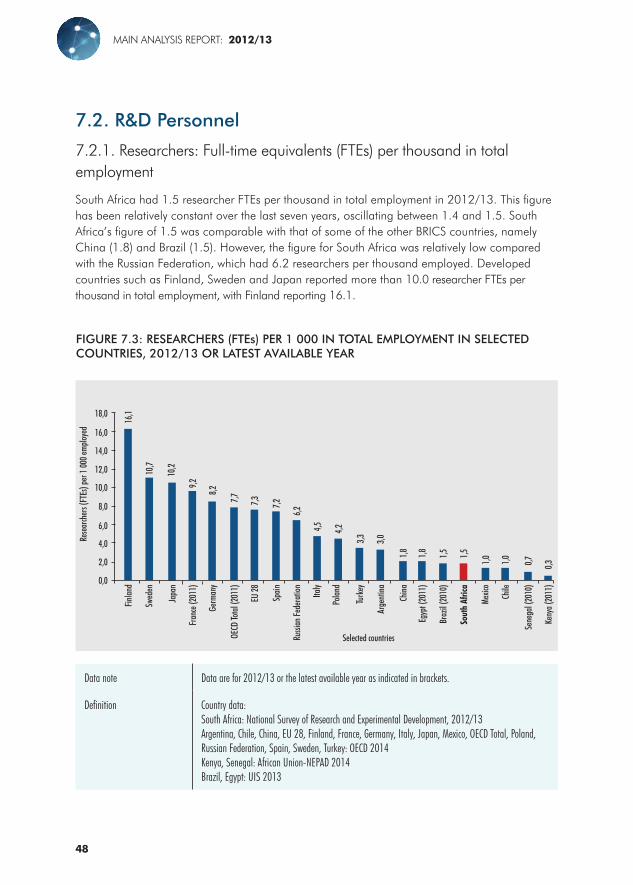
MAIN ANALYSIS REPORT: 2012/13
48
7.2. R&D Personnel
7.2.1. Researchers: Full-time equivalents (FTEs) per thousand in total employment
South Africa had 1.5 researcher FTEs per thousand in total employment in 2012/13. This figure has been relatively constant over the last seven years, oscillating between 1.4 and 1.5. South Africa’s figure of 1.5 was comparable with that of some of the other BRICS countries, namely China (1.8) and Brazil (1.5). However, the figure for South Africa was relatively low compared with the Russian Federation, which had 6.2 researchers per thousand employed. Developed countries such as Finland, Sweden and Japan reported more than 10.0 researcher FTEs per thousand in total employment, with Finland reporting 16.1.
FIGURE 7.3: RESEARCHERS (FTEs) PER 1 000 IN TOTAL EMPLOYMENT IN SELECTED COUNTRIES, 2012/13 OR LATEST AVAILABLE YEAR
Data note Data are for 2012/13 or the latest available year as indicated in brackets.
Definition Country data:South Africa: National Survey of Research and Experimental Development, 2012/13Argentina, Chile, China, EU 28, Finland, France, Germany, Italy, Japan, Mexico, OECD Total, Poland, Russian Federation, Spain, Sweden, Turkey: OECD 2014Kenya, Senegal: African Union-NEPAD 2014Brazil, Egypt: UIS 2013
0,0
2,0
4,0
6,0
10,0
12,0
16,0
18,0
Rese
arch
ers (
FTEs
) per
1 00
0 em
ploye
d
Finlan
d
Swed
en
Japa
n
Fran
ce (2
011)
Germ
any
OECD
Tota
l (20
11)
EU 28
Spain
Russi
an Fe
dera
tion
Italy
Polan
d
Turk
ey
Arge
ntina
China
Egyp
t (20
11)
Braz
il (20
10)
Sout
h Af
rica
Mexic
o
Chile
Sene
gal (
2010
)
Keny
a (20
11)
10,2
9,2
8,2
7,7 7,3 7,2
6,2
4,5 4,2
3,3 3,0
1,8
1,0 0,7 0,3
Selected countries
1,0
1,51,51,8
10,7
16,1
8,0
14,0

49
7.2.2. Research and researcher intensity
Researcher intensity is calculated as FTEs as a percentage of the labour force in the country. The number of people employed in South Africa was 13.497 million in 2011/12 and 14.524 million in 2012/13, which reflects growth of 7.6% in the labour force of the country.
Figure 7.4 shows GERD as a percentage of GDP (research intensity) and researcher intensity for selected countries in 2012/13 or the latest year for which data are available. The Russian Federation had more researcher FTEs per thousand in the labour force than any of the other selected countries. China, which had the highest GERD, had fewer than two researcher FTEs per thousand in its labour force. The selected African countries had fewer than one researcher FTE per thousand in the labour force.
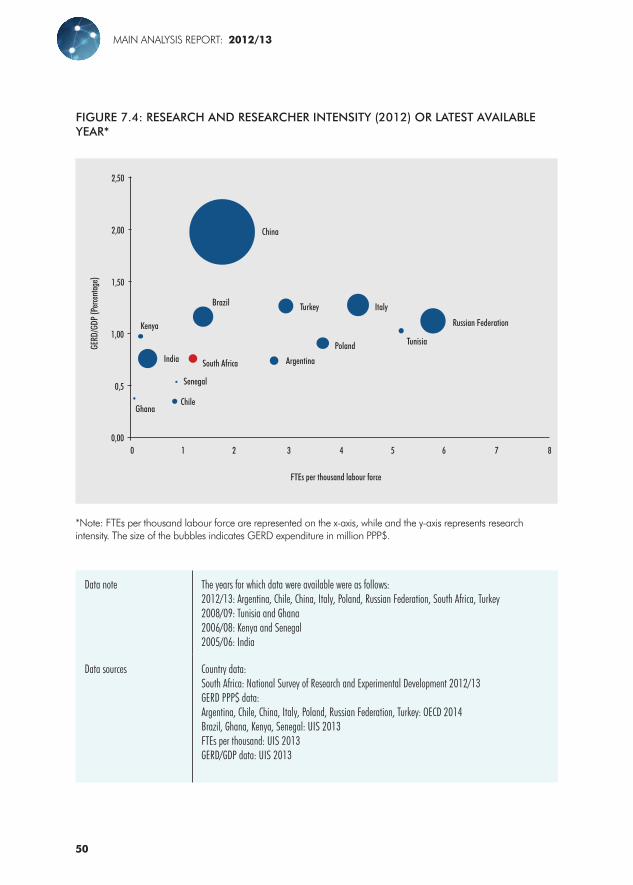
MAIN ANALYSIS REPORT: 2012/13
50
FIGURE 7.4: RESEARCH AND RESEARCHER INTENSITY (2012) OR LATEST AVAILABLE YEAR*
0,00
0,5
1,00
1,50
2,00
2,50
China
Turkey Italy
Tunisia
Russian Federation
10 2 3 4 5 6 7 8
Poland
Brazil
Kenya
India South Africa Argentina
FTEs per thousand labour force
Senegal
ChileGhana
GERD
/GDP
(Per
cent
age)
*Note: FTEs per thousand labour force are represented on the x-axis, while and the y-axis represents research intensity. The size of the bubbles indicates GERD expenditure in million PPP$.
Data note The years for which data were available were as follows:2012/13: Argentina, Chile, China, Italy, Poland, Russian Federation, South Africa, Turkey2008/09: Tunisia and Ghana2006/08: Kenya and Senegal2005/06: India
Data sources Country data:South Africa: National Survey of Research and Experimental Development 2012/13GERD PPP$ data: Argentina, Chile, China, Italy, Poland, Russian Federation, Turkey: OECD 2014 Brazil, Ghana, Kenya, Senegal: UIS 2013FTEs per thousand: UIS 2013GERD/GDP data: UIS 2013
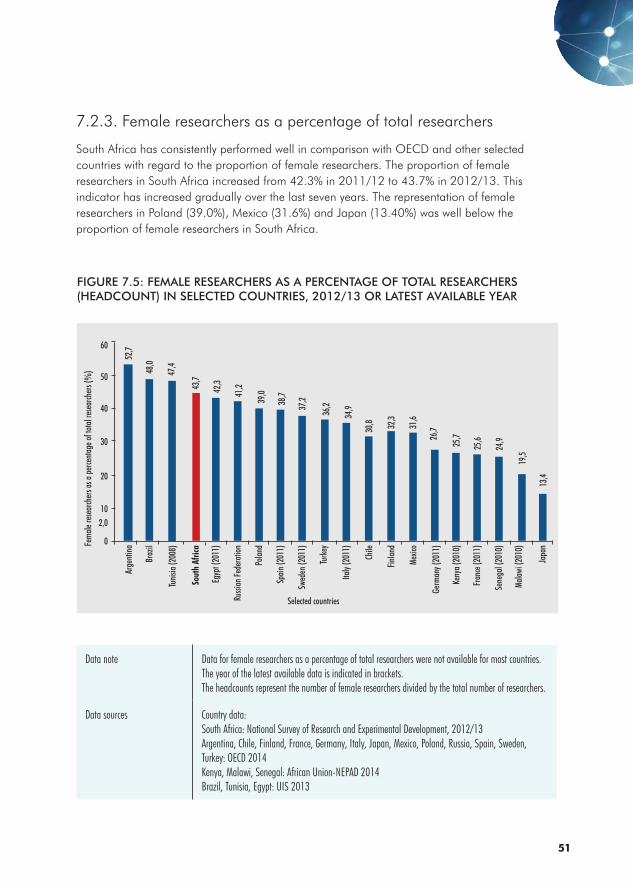
51
7.2.3. Female researchers as a percentage of total researchers
South Africa has consistently performed well in comparison with OECD and other selected countries with regard to the proportion of female researchers. The proportion of female researchers in South Africa increased from 42.3% in 2011/12 to 43.7% in 2012/13. This indicator has increased gradually over the last seven years. The representation of female researchers in Poland (39.0%), Mexico (31.6%) and Japan (13.40%) was well below the proportion of female researchers in South Africa.
FIGURE 7.5: FEMALE RESEARCHERS AS A PERCENTAGE OF TOTAL RESEARCHERS (HEADCOUNT) IN SELECTED COUNTRIES, 2012/13 OR LATEST AVAILABLE YEAR
Data note Data for female researchers as a percentage of total researchers were not available for most countries. The year of the latest available data is indicated in brackets.The headcounts represent the number of female researchers divided by the total number of researchers.
Data sources Country data:South Africa: National Survey of Research and Experimental Development, 2012/13Argentina, Chile, Finland, France, Germany, Italy, Japan, Mexico, Poland, Russia, Spain, Sweden, Turkey: OECD 2014Kenya, Malawi, Senegal: African Union-NEPAD 2014Brazil, Tunisia, Egypt: UIS 2013
0
2,010
30
50
60
Fem
ale re
sear
cher
s as a
perce
ntag
e of t
otal
rese
arch
ers (
%)
Arge
ntina
Braz
il
Tuni
sia (2
008)
Sout
h Af
rica
Egyp
t (20
11)
Polan
d
Spain
(201
1)
Russi
an Fe
dera
tion
Swed
en (2
011)
Turk
ey
Italy
(201
1)
Chile
Finlan
d
Germ
any (
2011
)
Keny
a (20
10)
Fran
ce (2
011)
Sene
gal (
2010
)
Malaw
i (20
10)
Japa
n
47,4
43,7
42,3
41,2
39,0
38,7
37,2
36,2
34,9
30,8 32
,3
26,7
24,9
19,5
13,4
Selected countries
25,625,7
31,6
48,0
52,7
20
40Me
xico

MAIN ANALYSIS REPORT: 2012/13
52
CHAPTER 8 BIBLIOGRAPHYAU-NEPAD (African Union–New Partnership for Africa’s Development). 2010. African Innovation Outlook 2010. Pretoria: AU-NEPAD.
DACST(1996). Preparing for the 21st Century, White Paper on Science and Technology. Pretoria: DACST.
DACST (2002). South Africa’s National Research and Development Strategy. Pretoria: DACST.
DACST (Department of Arts, Culture, Science and Technology). 1996. Resources for R&D, 1993/94, Results of Survey No. 18 in South Africa. Pretoria: DACST. DST ( 2007). Ten Year Innovation Plan for South Africa (2008–2018). Pretoria: DST.
DST-India (2012). R&D Statistics at a Glance. India: Department of Science and Technology.The Presidency (2011). National Development Plan 2030. Pretoria: NPC.
OECD (2002). The Measurement of Scientific and Technological Activities: Proposed Standard Practice for Surveys on Research and Experimental Development (Frascati Manual). Paris: OECD Publishing.
OECD 2014. OECD Main Science and Technology Indicators (MSTI), 2014/1. Paris: OECD Publishing.
Stats SA (2014). Gross Domestic Product: P0441, 3rd Quarter 2013. Pretoria: Stats SA. South African Reserve Bank. 2013. Online gross domestic product (GDP) data download to CeSTII. Constant 2005 GDP for South Africa for 1991. [Online] Available at: https://www.resbank.co.za/Research/Statistics/Pages/OnlideDownloadFacility.aspx. Accessed: 29 August 2013.
Stats SA (2014). Quarterly labour force survey. Quarter 1, 2014. Pretoria: Stats SA.
UIS (UNESCO Institute for Statistics). 2012a. Global Investments in R&D. Montreal: UIS.
UIS. 2013. Database. [Online] Available at: http://www.uis.unesco.org/Pages/default.aspx. Accessed: 2 May 2014.

53
ANNEXURE IMethodologyThe survey was conducted according to the OECD guidelines presented in the Frascati Manual. The Frascati Manual defines R&D as follows:
Research and experimental development (R&D) is creative work undertaken on a systematic basis in order to increase the stock of knowledge, including knowledge of humanity, culture and society, and the use of this stock of knowledge to devise new application. (OECD 2002)
The Frascati Manual proposes several approaches to surveying R&D-performing entities, including a census, a sample survey or a hybrid of the census and sample survey approaches, comprising a census of all large R&D performers and a stratified random sample survey of the remaining R&D-performing entities. In South Africa, the survey is currently conducted using the census approach in all the sectors except the business and not-for-profit (NPO) sectors, where in each case a purposive sample of the entities is surveyed. As with the previous R&D surveys, the 2012/13 survey followed this approach. In accordance with the Frascati Manual, the survey covered the following sectors: business, government, higher education, not-for-profit and science councils sectors.
The sectors were surveyed during the period October 2013 to June 2014.
For science councils and all government departments, the survey covered expenditure in the year beginning 1 April 2012 and ended 31 March 2013. The data collected for the business and NPO sectors were for the financial year ended 28 February 2013 (or the nearest complete financial year). Data for the higher education sector correspond to the 2013 academic (calendar) year. Therefore, the survey mainly recorded R&D activities that took place in the 2012/13 fiscal year.
In addition to following the guidelines in the Frascati Manual, the survey was conducted according to a project plan aligned with the phases of the Statistical Value Chain (SVC), as described in the South African Statistical Quality Assessment Framework (SASQAF). As with previous surveys, the survey was conducted so as to ensure that it is compliant with certain SASQAF criteria for data quality on official statistics, as detailed in the Quality Management Plan (QMP). The resultant reports were subjected to a data quality clearance process, managed by a clearance committee established by the DST especially for that purpose.
The full and detailed methodology is presented in section D of the Statistical Report.
54
MAIN ANALYSIS REPORT: 2012/13
ANNEXURE IIDisseminationThis report may be downloaded free of charge from:
http://www.dst.gov.za/index.php/resource-center/rad-reports
http://www.hsrc.ac.za/en/research-areas/Research_Areas_PHHSI/CeSTii/sa-national-survey-of-research-and-experimental-development
User Satisfaction SurveyA User Satisfaction Survey (USS) questionnaire is included as Annexure IV to this report. It would be very much appreciated if users could complete the questionnaire and return it by fax to +27 (0)21 461 1255. The feedback is analysed following each survey cycle to ensure the continued improvement of the R&D survey.
Data extractionsData extractions in response to users’ special data requests are generally provided free of charge, unless fairly substantial analytical work is required to meet any such request. Such data extractions are done in accordance with the approved data access protocol, and requests should be sent to [email protected].
RevisionsThe Department of Science and Technology (DST), Statistics South Africa (Stats SA) and the Human Sciences Research Council’s Centre for Science, Technology and Innovation Indicators (HSRC-CeSTII) jointly reserve the right to revise the data, indicators and analysis contained in this report. Such revisions may result from revisions by Stats SA of socio-economic indicators such as the gross domestic product (GDP) or population or employment numbers, or amendments in response to internal and external data quality and consistency monitoring such as that carried out by the Organisation for Economic Co-operation and Development (OECD), which conducts quality checks through global comparative analysis, time-series analyses and other methods. Explanations of any revisions will be made available and accessible on the DST and HSRC websites.

55
ANNEXURE IIIUser Satisfaction Survey
In order to improve the quality and relevance of the R&D statistics, it would be useful to receive the views of users of this publication. It would therefore be appreciated if you could complete the following questionnaire and return by fax to +27 (0)21 461 1255
1. Name and address of respondent:
Name and title
Designation/ occupation
Name and address of organisation or enterprise
2. Which of the following describes your area of work? Mark with ‘X’.
Government International organisation
Private enterprise Media
Public enterprise Not-for-profit organisation
Academic or research institution Other, specify
3. In which country do you work?
4. What is your assessment of the content of this publication?
Excellent Good Average Satisfactory Poor

MAIN ANALYSIS REPORT: 2012/13
56
6. How accurate is the picture of R&D in your sector or research field(s) as presented in this publication?
Very accurateFairly
accurateUnsure Not very accurate
Not at all accurate
5. How useful is this publication for your work?
Extremely useful Very useful Useful Partly usefulNot at all
useful
7. How easy was it to find specific information that you required in the publication?
Extremely easy Very easy Easy Not very easyNot at all
easy
8. What information (i.e. tables, text or figures) were of most interest to you? Please be as specific as possible (e.g. provide table, page or figure numbers).
9. What did you like best about the publication?
10. Provide any comments or recommendations for the improvement of the publication.

NATIONAL SURVEY OF RESEARCH AND EXPERIMENTAL DEVELOPMENT
MAIN ANALYSIS REPORT 2012/13
Department of Science and Technology (DST)Private Bag X894, Pretoria, 0001Republic of South Africawww.dst.gov.za
Centre for Science, Technology and Innovation Indicators (CeSTII)Human Sciences Research CouncilPrivate Bag X9182, Cape Town, 8000www.hsrc.ac.za
Dr Phil MjwaraDirector-General: [email protected]
Dr Temba MasilelaDeputy Chief Executive Officer: Research, [email protected]
Prof Gillian MarcelleExecutive Director: [email protected]
Mr Imraan PatelDeputy Director-General: Socio-Economic [email protected]
Mr Godfrey MashambaChief Director: Science and Technology [email protected]
Dr Nazeem Mustapha Chief Research [email protected]
Ms Tshidi MamogoboDirector: Science and Technology [email protected]
Dr Neo MolotjaSenior Research [email protected]
MAIN
REPORT
MAIN REPORT- 2012/13 cover.indd 1 2014/12/23 10:11 AM