department of the environment overview of water quality data used by mde and water quality...
TRANSCRIPT

Department of the Environment
Overview of Water Quality Data Used by MDE and Water Quality
Parameters
Timothy Fox
MDE, Science Service Administration
Wednesday
January 30th, 2013

2
Presentation Overview
• Describe MDE Water Quality Restoration Process.
• Overview of water quality parameters.
3
Clean Water Act Process
• Water Quality Standards
• Water Quality Monitoring
• Integrated Report
• TMDL
• NPDES permits
• WQ Restoration

4
Water Quality Standards
Designated UseCriteria
(numeric or narrative)Antidegradation
Policy
Water Quality Standards

5
Water Quality Standards Examples
• Designated Use
– Aquatic Life
– Fishing
– Swimming
– Secondary Contact
– Drinking water
• Criteria
– Lead concentration limit
– PCB fish tissue limit
– Biological Data
• Antidegradation Policy
– Based on Biological data
6
Integrated Report
• Section 130.7(B)(5) of the Clean Water Act requires that states “assemble and evaluate all readily available water quality-related data and information”
7
Integrated Report
• Documentation of the water quality status of surface waters in Maryland, compiled biennially.
– Includes a listing (i.e., the 303d list) of those waters not meeting State Water Quality Standards (WQS) as well as those water bodies that meet WQS.
• Documentation of the decision-making process by which water bodies are assessed and listed.

8
Classifying Waters according to Status
• Categories of the Integrated Report
• Categories 1 and 2 - waters attaining all standards or some standards
• Category 3 - waters with insufficient information to assess water quality standards. These areas deserve follow-up assessment.
• Category 4 - impaired waters that do NOT need a TMDL.
– 4a – TMDL completed
– 4b – Technological solution should bring water body back into attainment
– 4c – Impairment not caused by a pollutant (eg. Dam, habitat modification, etc)
• Category 5 - impaired waters that require a TMDL (Historically known as the 303(d) List).

9
Total Maximum Daily Load (TMDL)
• Category 5 waters – Are Impaired=not supporting the designated use
• Calculation of the maximum amount of a pollutant that a waterbody can receive and still safely meet water quality standards.
• TMDLs influence permiting, water quality monitoring, WIPs, and funding.
10
How does MDE use water quality data?
• Determine if surface water bodies are attaining Designated Uses based on water quality and biology data.
• The status of water bodies are published in the “Integrated Report”.

11
How is the Integrated Report Compiled?
• Conduct statewide data solicitation
• Review data with respect to QAQC plan, and use publicly reviewed listing methodologies to analyze data
• Define geographic scale of impairment
• Determine appropriate IR listing category
12
How is the Integrated Report Compiled?
• Tier 1 data– Used to determine impaired waters (Category 5).
– Should be accompanied by a Quality Assurance Project Plan (QAPP) consistent with EPA guidance and Maryland listing methodologies.
• Tier 2 data– Used to assess the general condition of surface
waters.
– Can be used to place water on Category 2 or 3.
– Volunteer data, land use data, visual observations.

13
CWA Background –
Unknown
Not Impaired
Integrated Report[303(d)305(b)]
DNRMBSS
Core/TrendEstuarine
MDE - SSAShellfishBeaches
Fish Tissue
MDE TMDLIntensive
Monitoring
TMDL (Category 4a)
Or TMDLReview
StateWater
MonitoringStrategy
& Data Analysis
Water Quality
Standards
Permit Adjustments
Implementation (319 Funding, Watershed Imp. Plan Development, etc.
ImplementationMonitoring
State Implementation Projects
Impaired
Permit Review and Compliance
Local Gov’t, Academia,
Volunteer Groups
MDE – WMA/LMAWWTPNPDES
Drinking WaterMining
Water Monitoring Data Sources
Implementation
Category 1, 2
Category3
Category 5
An Adaptive Management Process
Local ImplementationProjects

14
Parameters measured by BTW
• Dissolved Oxygen (numeric criteria)
• Temperature (numeric criteria)
• Nitrates (narrative criteria)
• Orthophosphates (narrative criteria)
• Turbidity (numeric criteria)
• TDS/conductivity (hope to have numeric criteria soon)
• pH (numeric criteria)
• Fecal Coliform (numeric criteria)
• Biochemical Oxygen Demand
• Flow
15
Parameters measured by BTW
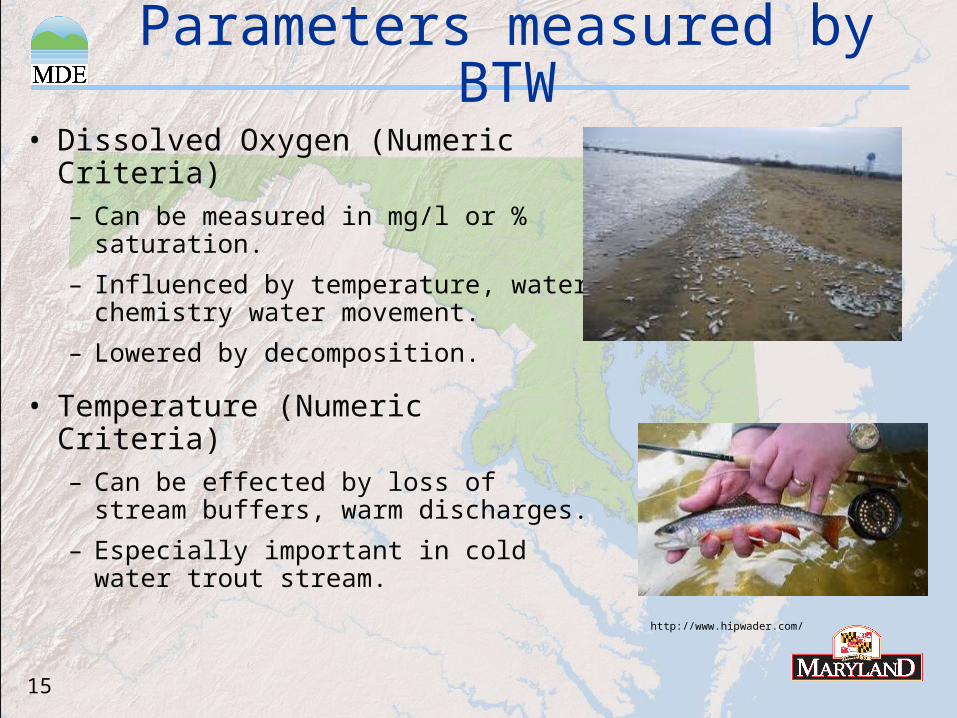
• Dissolved Oxygen (Numeric Criteria)– Can be measured in mg/l or %
saturation.
– Influenced by temperature, water chemistry water movement.
– Lowered by decomposition.
• Temperature (Numeric Criteria)– Can be effected by loss of stream
buffers, warm discharges.
– Especially important in cold water trout stream.
http://www.hipwader.com/
16
Parameters measured by BTW
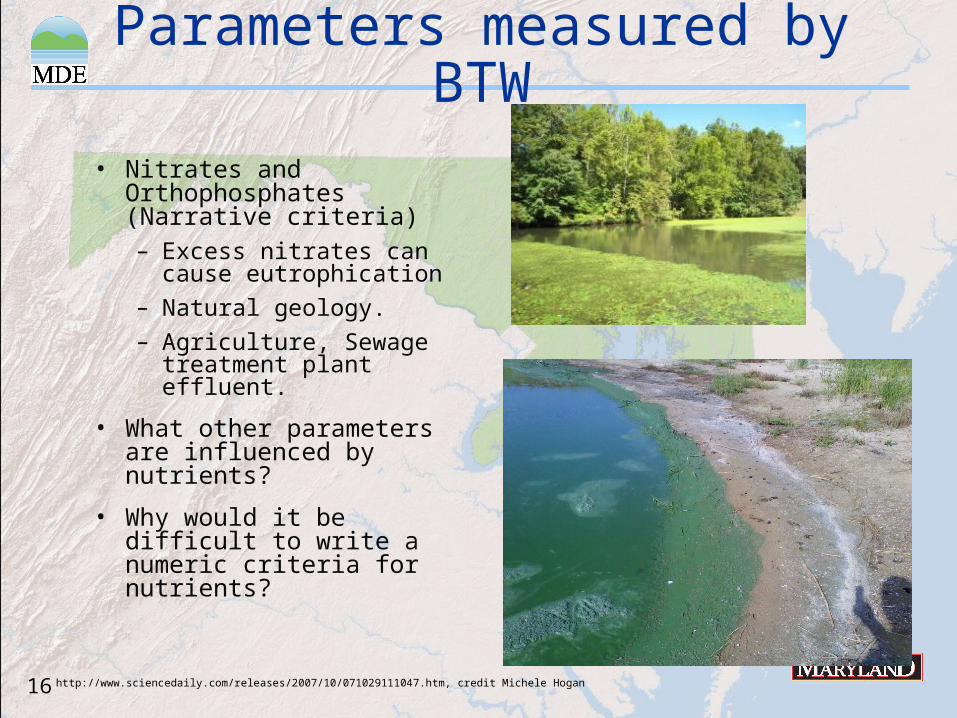
• Nitrates and Orthophosphates (Narrative criteria)– Excess nitrates can cause
eutrophication
– Natural geology.
– Agriculture, Sewage treatment plant effluent.
• What other parameters are influenced by nutrients?
• Why would it be difficult to write a numeric criteria for nutrients?
http://www.sciencedaily.com/releases/2007/10/071029111047.htm, credit Michele Hogan

17
Parameters measured by BTW
• Turbidity (numeric criteria)– Caused by CDOM,
suspended sediment, algae.
– Loss of forest cover and stream buffers.
• TDS/conductivity (hope to have numeric criteria soon)– Primarily caused by salt.
• Road salt, mining activities.
– Can effect osmotic balance in freshwater organisms.

18
Parameters measured by BTW• pH (numeric criteria)
– A measure of the acidity or basicity of the water.
– Can be affected by acid mine drainage, atmospheric deposition, or natural geology.
• Fecal Coliform (numeric criteria)– Type of bacteria in poop.
– Leaking septic systems, pet waste
http://www.peterscreek.org/PetersCreekWatershed/pcwaAMD1.html
19
Parameters measured by BTW
• Biochemical Oxygen Demand (BOD)
– Oxygen consumed by microbial decomposition of organic waste, and is measured by the change in DO in a sealed water sample.
– Increased by organic waste (WWTP, agriculture, fertilizer).
• Flow
– Influenced by impervious surface, dams, forest buffers.
– Can effect physical habitat.
20
Any Questions?
Main Mapping page - Links to Tier II and Impairment Maps
http://www.mde.state.md.us/programs/Water/TMDL/Integrated303dReports/Pages/WaterQualityMappingCenter.aspx
Impairment Maps
http://www.mde.state.md.us/programs/Water/TMDL/Integrated303dReports/Pages/ImpairmentMaps.aspx