department of youth and community development division briefing paper department of youth and...
TRANSCRIPT

New York City CouncilChristine C. Quinn, Speaker
Finance DivisionPreston Niblack, DirectorJeffrey Rodus, First Deputy Director
Hearing on the Mayor’s Fiscal Year 2011 Executive Budget
Department of Youth and Community DevelopmentMay 25, 2010
Committee on FinanceHon. Domenic M. Recchia, Jr., Chair
Committee on Youth ServicesHon. Lewis Fidler, Chair
Joint with Committee on Community DevelopmentHon. Albert Vann, Chair
Latonia McKinney, Deputy Director, Finance DivisionRocco D’Angelo, Assistant Director

Finance Division Briefing Paper Department of Youth and Community Development
Page 1
Summary and Highlights
Department of Youth and Community Development
Dollars in Thousands
2008Actual
2009Actual
2010Adopted
2010Executive
2011Executive
Difference,2010 – 2011*
Personal Services $25,392 $26,190 $25,747 $27,151 $27,435 $1,688
Other than Personal Services 358,669 356,515 362,099 388,961 266,219 (95,881)
Table Total $384,061 $382,705 $387,846 $416,112 $293,654 ($94,192)
*The difference of Fiscal 2010 Adopted compared to Fiscal 2011 Executive Plan funding.
The Department of Youth and Community Development (DYCD) Fiscal 2011 Preliminary operating budgetincludes $293.7 million in spending, of which $174.1 million is funded by City tax-levy. The Department’soverall operating budget for Fiscal 2011 would decrease by $94.2 million, or 24 percent, compared to theoperating budget at Adoption last year. This reduction is the result of a number of Programs to Eliminatethe Gap (PEGs) enacted by the Department to meet its spending targets offset by increases for collectivebargaining agreements and technical adjustments when the Preliminary and Executive Budgets arecombined.
Fiscal 2011 Executive Plan Highlights
Administrative Space Savings. The Department renegotiated the lease agreement of its WilliamStreet offices through the Department of Citywide Services (DCAS), which will save the Department$1.1 million in Fiscal 2011 and in the outyears. Page (14) for more details.
Adult Literacy Elimination (City Funding). The Department proposes the elimination of City fundingin the amount of $4.6 million in Fiscal 2011 and in the outyears to the Adult Literacy budget, whichprovides 10,000 participants annually with English for Speaker of Other Languages (ESOL), Adult BasicEducation and GED preparation programs. This proposed elimination leaves approximately $6.1million in federal funding in the Adult Literacy program area. At the time of this report, the Departmenthas not finalized how the remaining funding will be allocated.
In the Fiscal 2011 Preliminary Budget the Department proposed a reduction in City funding ofapproximately $449,000 in Fiscal 2010, $554,000 in Fiscal 2011 and in the outyears through a tenpercent reduction to City funding for the Adult Literacy program portfolio. The total City fundingeliminated in Fiscal 2011 and in the outyears to DYCD’s adult literacy programs is $5.2 million. Page(7) for more details.
Out of School Time Reduction (OST). The Department proposes restoring 1,943 summer slots at OSTmiddle school programs that were slated for elimination in the Fiscal 2011 Preliminary Budget. TheDepartment will restore $600,000 in Fiscal 2011 in City funding that will be matched with $700,000 inprivate funds from the New York Community Trust, for a total one-time allocation of $1.3 million.
However, the Department still proposes a reduction in City funding of approximately $2 million inFiscal 2010 and $6.2 million in Fiscal 2011 and in the outyears, which will eliminate 33 school-year-only OST programs that are located in what the Department considers lower priority zip codes. SeePage (19) for more details.
Finance Division Briefing Paper Department of Youth and Community Development
Page 2
Summer Youth Employment Program (SYEP) Restoration. The Department proposes restoringapproximately $1 million in Fiscal 2011 and in the outyears that it had cut from its Preliminary Budget,which will restore 662 summer jobs for young people ages 14-21. The Department will also restore$9.7 million in Fiscal 2011 and in the outyears of a prior-year City-funded reduction to SYEP, which willsupport an additional 6,430 summer jobs.
At the time of this report, the State’s budget proposal of eliminating state aid for summer youthemployment totaling $35 million (Statewide) still stands and will leave the City approximately $19.5million in less funding for Fiscal 2011 (Summer 2010). The total funding for SYEP as proposed in theFiscal 2011 Executive Budget is $35.6 million, which will support approximately 25,000 summer jobswhen combined with City and federal funding. Page (25) for more details.
Fiscal 2011 Preliminary Plan Highlights
Beacon Reductions. The Department proposed a reduction in City funding of approximately $1.6million in Fiscal 2010, $2.7 million in Fiscal 2011 and in the outyears which reduces 66 City-fundedBeacon contracts and eliminates enhancements at 11 consolidated Beacons/OST middle schoolprograms. See Page (9) for more details.
New York City Housing Authority (NYCHA) Cornerstone Reductions. The Department proposed areduction in City funding of approximately $1.2 million in Fiscal 2010, $980,000 in Fiscal 2011 and inthe outyears due to the delayed opening of four NYCHA centers and from lower than anticipated start-up costs in 2010. See Page (10) for more details.
Agency-wide Program Accruals. The Department proposed a reduction in City funding ofapproximately $2.6 million in Fiscal 2010 only to Council and Agency-funded contracts.
Reduction in Community Services Program. The Department proposed eliminating City funding ofapproximately $1.2 million for community services programs. See Page (12) for more details.
State Highlights
Summer Youth Employment Program. As the Department testified at the Council’s Youth CommitteeFebruary 2010 SYEP oversight hearing, the State completely eliminated funding to Summer YouthEmployment totaling $35 million Statewide and $19.5 million to the City. This is a devastatingdevelopment because when combined with the elimination of almost $20.8 million in stimulus funding(approximately only $7.2 million of stimulus funding will be rolled into Fiscal 2011 SYEP), the SYEPbudget for Fiscal 2011 (summer 2010) is $35.6 million, which will only support approximately 25,000slots. This is a total reduction of $20 million and 34,055 slots.
American Recovery and Reinvestment Act (ARRA) Funding Highlights
The agency enhanced or restored, and in one case created, a number of Youth and CommunityDevelopment programs using federal stimulus Workforce Investment Act (WIA) and Community ServicesBlock Grant (CSBG). At this time, the state of a federal job recovery plan has not been finalized nor is theredefinitive proof that there would be a second infusion of federal dollars, which leaves several programs injeopardy of being scaled back and in some instances eliminated. Please note that all WIA stimulus-funded

Finance Division Briefing Paper Department of Youth and Community Development
Page 3
programs will not have second fiscal year funding due to contract restrains which make it essential that thetotal allocated funding in the amount of $32.2 million will be spent by the Department by June 30, 2010.CSBG stimulus-funded programs have more flexibility due to a longer funding cycle, which will allow forcertain programs to be funded through Fiscal 2011. Approximately $18 million of the $50.5 million inCSBG stimulus funding will roll into Fiscal 2011. The amount of Fiscal 2011 funding for the followingprograms is not finalized and will be discussed at the Fiscal 2011 Executive Youth Services hearing.Further details on specific programs can be found on the following pages:
Adult Literacy/ESOL and Immigrant Employment Services ($4.6 million). See Page (7)
Adult Literacy Employment ($4 million). See Page (7)
Beacon Program Restoration ($2.3 million) See Page (10)
Fatherhood Program ($6.2 million) See Page (12)
Immigrant Services/Domestic Violence Program ($2 million) See Page (12)
“Go to School, Get a Job” ($5.5 million) See Page (15)
Out-of-School Time (OST) Option II & OST Summer Programming Restoration ($14.1 million) See Page (19)
Out-of-School Youth (OSY) Internships ($3 million) See Page (20)
Summer Youth Employment ($28.2 million) See Page (25)

Finance Division Briefing Paper Department of Youth and Community Development
Page 4
Department of Youth and Community Development
The Department of Youth and Community Development (DYCD) supports youth and community servicesthrough contracts with a broad network of community-based organizations throughout New York City. TheDepartment supports a variety of activities, including structured recreation, athletics, tutoring andremedial education, leadership development, delinquency prevention, cultural enrichment, counseling,adolescent health care, substance abuse prevention, and runaway and homeless programs. To assist thecommunities in which youth and their families live, the Department administers federal CommunityServices Block Grant funds to help low-income people become more self-sufficient; provides services toimmigrants; and performs outreach functions to non-public assistance applicants within the Home EnergyAssistance Program field offices.
Key Public Services Areas
Promote and support the development ofhealthy, educated youth who are involved intheir communities.
Prepare youth for economic independence.
Strengthen and revitalize the communities ofNew York City.
Perform efficient programmatic and fiscal
monitoring of service contracts.
Critical Objectives Implement and expand a citywide program of
educational, recreational and cultural activities tooperate during non-school hours.
Support youth development and communityengagement through school-based and community-based centers.
Help runaway and homeless youth to reunite withtheir families or to live independently.
Provide work-related education, skills training andemployment opportunities.
Enhance community development in low-incomeneighborhoods.
Foster increased literacy skills among adults,adolescents and families.
Support the attainment of citizenship and facilitateaccess to public services and participation in civic life.
Efficiently assess and/or audit agency serviceproviders.
SOURCE: Mayor’s Management Report
Finance Division Briefing Paper Department of Youth and Community Development
Page 5
*The difference of Fiscal 2010 Adopted compared to Fiscal 2011 Executive Plan funding.
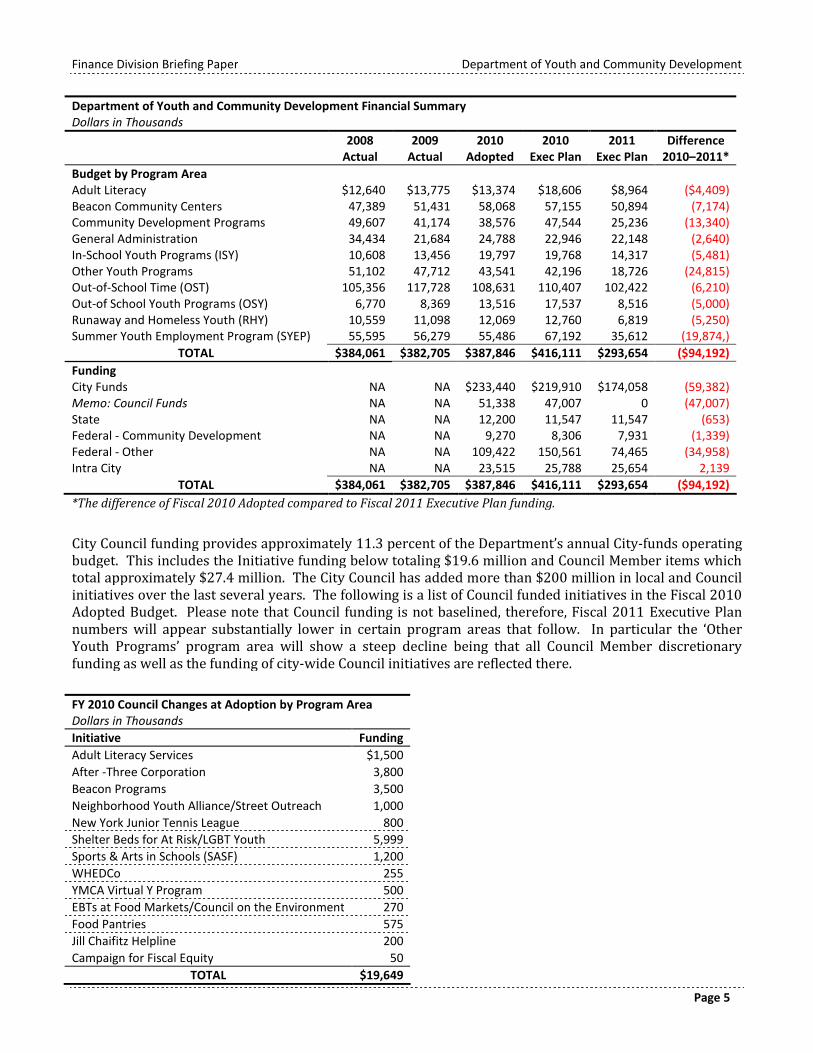
City Council funding provides approximately 11.3 percent of the Department’s annual City-funds operatingbudget. This includes the Initiative funding below totaling $19.6 million and Council Member items whichtotal approximately $27.4 million. The City Council has added more than $200 million in local and Councilinitiatives over the last several years. The following is a list of Council funded initiatives in the Fiscal 2010Adopted Budget. Please note that Council funding is not baselined, therefore, Fiscal 2011 Executive Plannumbers will appear substantially lower in certain program areas that follow. In particular the ‘OtherYouth Programs’ program area will show a steep decline being that all Council Member discretionaryfunding as well as the funding of city-wide Council initiatives are reflected there.
Department of Youth and Community Development Financial SummaryDollars in Thousands
2008Actual
2009Actual
2010Adopted
2010Exec Plan
2011Exec Plan
Difference2010–2011*
Budget by Program AreaAdult Literacy $12,640 $13,775 $13,374 $18,606 $8,964 ($4,409)Beacon Community Centers 47,389 51,431 58,068 57,155 50,894 (7,174)Community Development Programs 49,607 41,174 38,576 47,544 25,236 (13,340)General Administration 34,434 21,684 24,788 22,946 22,148 (2,640)In-School Youth Programs (ISY) 10,608 13,456 19,797 19,768 14,317 (5,481)Other Youth Programs 51,102 47,712 43,541 42,196 18,726 (24,815)Out-of-School Time (OST) 105,356 117,728 108,631 110,407 102,422 (6,210)Out-of School Youth Programs (OSY) 6,770 8,369 13,516 17,537 8,516 (5,000)Runaway and Homeless Youth (RHY) 10,559 11,098 12,069 12,760 6,819 (5,250)Summer Youth Employment Program (SYEP) 55,595 56,279 55,486 67,192 35,612 (19,874,)
TOTAL $384,061 $382,705 $387,846 $416,111 $293,654 ($94,192)
FundingCity Funds NA NA $233,440 $219,910 $174,058 (59,382)Memo: Council Funds NA NA 51,338 47,007 0 (47,007)State NA NA 12,200 11,547 11,547 (653)Federal - Community Development NA NA 9,270 8,306 7,931 (1,339)Federal - Other NA NA 109,422 150,561 74,465 (34,958)Intra City NA NA 23,515 25,788 25,654 2,139
TOTAL $384,061 $382,705 $387,846 $416,111 $293,654 ($94,192)
FY 2010 Council Changes at Adoption by Program AreaDollars in Thousands
Initiative Funding
Adult Literacy Services $1,500
After -Three Corporation 3,800
Beacon Programs 3,500
Neighborhood Youth Alliance/Street Outreach 1,000
New York Junior Tennis League 800
Shelter Beds for At Risk/LGBT Youth 5,999
Sports & Arts in Schools (SASF) 1,200
WHEDCo 255
YMCA Virtual Y Program 500
EBTs at Food Markets/Council on the Environment 270
Food Pantries 575
Jill Chaifitz Helpline 200
Campaign for Fiscal Equity 50
TOTAL $19,649

Finance Division Briefing Paper Department of Youth and Community Development
Page 6
Program Areas
Adult Literacy
DYCD is a partner in the New York City Adult Literacy Initiative (NYCALI), which is the City’s system forcoordination of literacy services. In collaboration with the New York State Education Department, over50,000 New Yorkers attend classes and tutorials each year at over 150 sites throughout the City. Thishighly coordinated system insures that Federal Workforce Investment Act, U.S. Department of Education,New York State Employment Preparation Education and Adult Literacy Education, and New York City fundsare targeted for communities that have the greatest need for services and minimizes duplication of effort.Each year over $40 million is invested in providing basic educational services through NYCALI.
Dollars in thousands2008
Actual2009
Actual2010
Adopted2010
Exec Plan2011
Exec PlanDifference
2011 vs. 2010
Spending
Personal Services
Fulltime Salaried $30 $550 $841 $520 $844 $3
Additional Gross Pay & Fringe 1 12 0 0 0 0
Subtotal, PS $31 $563 $841 $520 $844 $3
Other than Personal Services
Property and Equipment $1 $1 $5 $5 $5 $0
Other Services and Charges 5,563 2,129 105 100 105 0
Contractual Services 7,045 11,082 12,423 17,981 8,011 (4,412)
Subtotal, OTPS $12,610 $13,213 $12,533 $18,086 $8,121 ($4,412)
TOTAL $12,640 $13,775 $13,374 $18,606 $8,964 ($4,409)
Funding
City Funds NA NA $8,130 $7,749 $3,631 ($4,499)
Federal – CDBG NA NA 2,525 1,561 1,561 (964)
Federal - Other NA NA 1,531 8,109 2,585 1,054
Intra-City NA NA 1,187 1,187 1,187 0
TOTAL $12,640 $13,775 $13,374 $18,606 $8,964 ($4,409)
*The difference of Fiscal 2010 Adopted compared to Fiscal 2011 Executive Plan funding.
Programmatic Overview
Adult Literacy programs are designed to assist out-of-school youth and adults in obtaining the reading andwriting skills necessary to succeed as workers parents and active community members. In addition togeneral adult literacy services, DYCD funds Family Literacy programs, which provide parents and school-aged children the opportunity to improve their reading, writing and English language skills together. TheDepartment allocates $2.4 million annually to fund 13 community based organizations that collaboratewith 15 public schools in their communities to offer Family Literacy programming.
Finally, under the Adult Literacy program area, DYCD funds the Adolescent Literacy program, whichpartners community organizations with 111 middle schools to help sixth, seventh and eight gradersimprove their reading, writing and communication skills.

Finance Division Briefing Paper Department of Youth and Community Development
Page 7
Fiscal 2011 Executive Budget Actions
Adult Literacy Elimination (City Funding). The Department proposes the elimination of City fundingin the amount of $4.6 million in Fiscal 2011 and in the outyears to the Adult Literacy budget, whichprovides 10,000 participants annually with English for Speaker of Other Languages (ESOL), Adult BasicEducation and GED preparation programs. This proposed elimination leaves approximately $6.1million in federal funding in the Adult Literacy program area. At the time of this report, the Departmenthad not finalized how the remaining funding will be allocated.
In the Fiscal 2011 Preliminary Budget, the Department proposed a reduction in City funding ofapproximately $449,000 in Fiscal 2010, $554,000 in Fiscal 2011 and in the outyears through a tenpercent reduction for the Adult Literacy program portfolio. The total City funding eliminated in Fiscal2011 and in the outyears to DYCD’s adult literacy portfolio is $5.2 million. Please note that theinitiative was funded at $10.1 million in Fiscal 2010.
The Department’s Family Literacy programs, which provide parents and school-aged children theopportunity to improve their reading, writing and English language skills together, will not be effectedby the proposed Departmental PEG, nor will the Adolescent Literacy program, which partnerscommunity organizations with 111 middle schools to help sixth, seventh and eight graders, improvetheir reading, writing and communication skills.
American Recovery and Reinvestment Act (ARRA) Funding
The agency enhanced a number of existing Youth and Community Development programs using federalstimulus Community Services Block Grant (CSBG) funding. In the Adult Literacy program area, over $8.6million in funding went towards Adult literacy GED and ESOL. The Department anticipates funding thefollowing programs with the remaining stimulus dollars in Fiscal 2011, however, funding amountshave not been finalized:
Adult Literacy/ESOL and Immigrant Employment Services. In Fiscal 2010, DYCD amended 31 high-performing existing ESOL contracts so that those organizations can provide the comprehensive ESOLand employment-related services required for this project;
Adult Literacy Employment. In Fiscal 2010, DYCD has selected 12 high-performing Literacy/GEDorganizations that have experience in providing both adult literacy/GED instruction and jobreadiness/job retention programming. Participants will attend classes for a five-month period beforejob placement.
Performance Measures
FY 07 FY 08 FY 09
FY 104-Month
ActualTargetFY 11
Number of participants served in Adult Basic Education(ABE) and English for Speakers of Other Languages(ESOL) literacy programs 5,507 6,269 9,626 6,404 10,000
Adult Basic Education and ESOL participants meetingfederal standards of improvement in demonstrating anincreased ability to read, write and speak English (%) 54% 46% 49% NA 45%
Finance Division Briefing Paper Department of Youth and Community Development
Page 8
The percentage of Community Development program participants who achieved target outcomes set forclients in each program held steady in Fiscal 2009, at 65 percent. The rate of participants in Adult BasicEducation (ABE) and English for Speakers of Other Languages (ESOL) programs who met federal Englishliteracy improvement standards rose to 49 percent in Fiscal 2009 from 46 percent in Fiscal 2008.
The number of participants enrolled in Adult Basic Education and English as a Second Language programsincreased by 54 percent, from 6,269 in Fiscal 2008 to 9,626 in Fiscal 2009. This was due to an expansion inthe number of these literacy programs from 25 to 40 in January 2008. During Fiscal 2008, there were sixmonths of expanded program operations with funding of $4.4 million. For Fiscal 2009, there was a full yearof expanded program operations with funding of $8.1 million.
Finance Division Briefing Paper Department of Youth and Community Development
Page 9
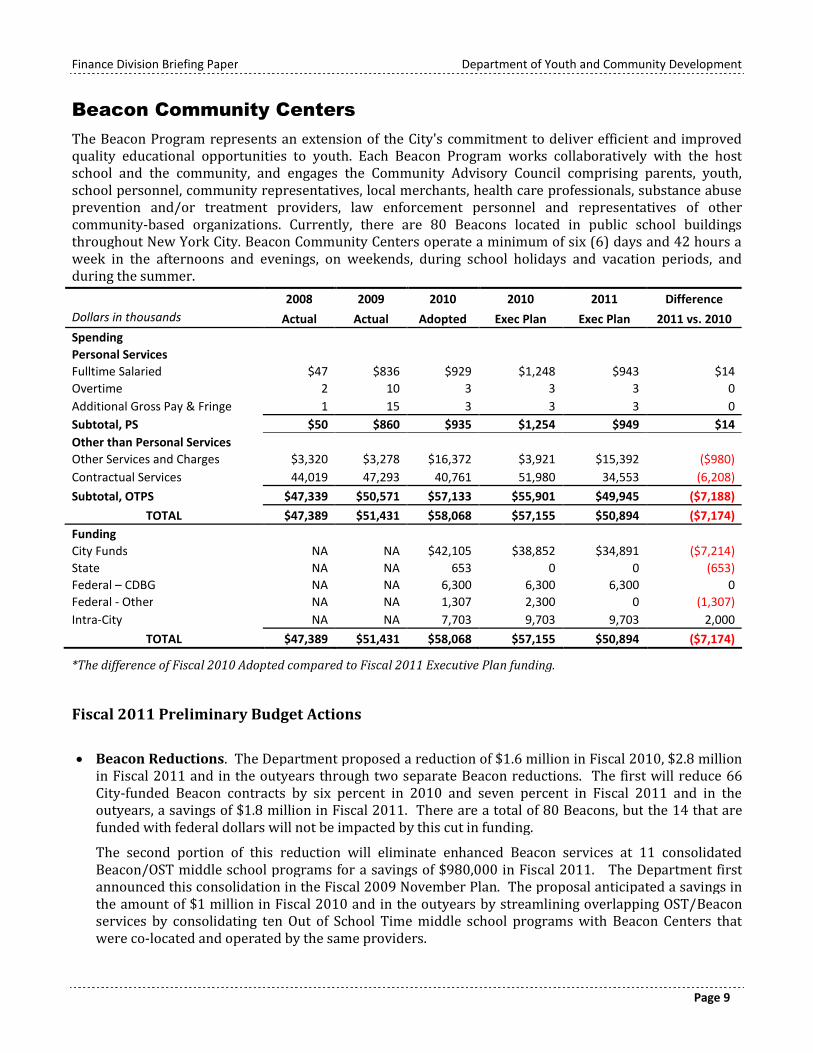
Beacon Community Centers
The Beacon Program represents an extension of the City's commitment to deliver efficient and improvedquality educational opportunities to youth. Each Beacon Program works collaboratively with the hostschool and the community, and engages the Community Advisory Council comprising parents, youth,school personnel, community representatives, local merchants, health care professionals, substance abuseprevention and/or treatment providers, law enforcement personnel and representatives of othercommunity-based organizations. Currently, there are 80 Beacons located in public school buildingsthroughout New York City. Beacon Community Centers operate a minimum of six (6) days and 42 hours aweek in the afternoons and evenings, on weekends, during school holidays and vacation periods, andduring the summer.
*The difference of Fiscal 2010 Adopted compared to Fiscal 2011 Executive Plan funding.
Fiscal 2011 Preliminary Budget Actions
Beacon Reductions. The Department proposed a reduction of $1.6 million in Fiscal 2010, $2.8 millionin Fiscal 2011 and in the outyears through two separate Beacon reductions. The first will reduce 66City-funded Beacon contracts by six percent in 2010 and seven percent in Fiscal 2011 and in theoutyears, a savings of $1.8 million in Fiscal 2011. There are a total of 80 Beacons, but the 14 that arefunded with federal dollars will not be impacted by this cut in funding.
The second portion of this reduction will eliminate enhanced Beacon services at 11 consolidatedBeacon/OST middle school programs for a savings of $980,000 in Fiscal 2011. The Department firstannounced this consolidation in the Fiscal 2009 November Plan. The proposal anticipated a savings inthe amount of $1 million in Fiscal 2010 and in the outyears by streamlining overlapping OST/Beaconservices by consolidating ten Out of School Time middle school programs with Beacon Centers thatwere co-located and operated by the same providers.
2008 2009 2010 2010 2011 Difference
Dollars in thousands Actual Actual Adopted Exec Plan Exec Plan 2011 vs. 2010
Spending
Personal Services
Fulltime Salaried $47 $836 $929 $1,248 $943 $14
Overtime 2 10 3 3 3 0
Additional Gross Pay & Fringe 1 15 3 3 3 0
Subtotal, PS $50 $860 $935 $1,254 $949 $14
Other than Personal Services
Other Services and Charges $3,320 $3,278 $16,372 $3,921 $15,392 ($980)
Contractual Services 44,019 47,293 40,761 51,980 34,553 (6,208)
Subtotal, OTPS $47,339 $50,571 $57,133 $55,901 $49,945 ($7,188)
TOTAL $47,389 $51,431 $58,068 $57,155 $50,894 ($7,174)
Funding
City Funds NA NA $42,105 $38,852 $34,891 ($7,214)
State NA NA 653 0 0 (653)
Federal – CDBG NA NA 6,300 6,300 6,300 0
Federal - Other NA NA 1,307 2,300 0 (1,307)
Intra-City NA NA 7,703 9,703 9,703 2,000
TOTAL $47,389 $51,431 $58,068 $57,155 $50,894 ($7,174)

Finance Division Briefing Paper Department of Youth and Community Development
Page 10
New York City Housing Authority (NYCHA) Cornerstone Reductions. The Department proposed areduction of $1.2 million in Fiscal 2010, $980,000 in Fiscal 2011 and in the outyears due to the delayedopening of four NYCHA centers and from lower than anticipated start-up costs in 2010, which reducesthe total Cornerstone Initiative by approximately eight percent.
American Recovery and Reinvestment Act (ARRA) Funding
Through federal stimulus Community Services Block Grant (CSBG) funding, the Department restored $2.3million in Fiscal 2010 for Beacons. The funding to these programs will serve 13,500 participants in highquality programs that take place after school, during the summer and on school holidays. DYCD estimatesthat 1,400 workers will be employed at 66 out of 80 Beacons. This is a restoration of a Fiscal 2009reduction in City funds. The Department anticipates funding this program with remaining stimulus dollarsin Fiscal 2011, however, funding amounts have not been finalized.
Council Initiatives and Funding
The Council provided $3.5 million for the Beacon program in Fiscal 2010, which serve approximately96,000 children and adults every year. Please note that the following funding is not included in the Fiscal2011 Executive Budget therefore is included in the total reduction of $7.2 million that is reflected in theBeacon Community Centers funding reduction.
Beacon Community CentersDollars in Thousands
Beacon Programs $3,500
Subtotal $3,500

Finance Division Briefing Paper Department of Youth and Community Development
Page 11
Community Development Programs
Funding in this program area is used to administer community development programs, which provide awide variety of community-based social services. Funding is used to purchase supplies, materials and otherservices required to support these services.
The Community Development Program area’s proposed Fiscal 2011 Executive Budget is $22.3 millionwhich is a total reduction of $13.3 million from the Fiscal 2010 Adopted Budget, which is an additional $1million reduction from the Fiscal 2011 Preliminary Budget. This is due in large part to both Councildiscretionary and citywide initiative funding not being reflected in the Fiscal 2011 Executive Budget as wellas the Department’s proposed program to eliminate the gap in the amount of $1.2 million and a slightreduction in Community Development Block Grant (CDBG) funding.
2008 2009 2010 2010 2011 Difference
Dollars in thousands Actual Actual Adopted Exec Plan Exec Plan 2011 vs. 2010
Spending
Personal Services
Fulltime Salaried $211 $2,708 $2,720 $3,449 $2,965 $246
Overtime 0 8 5 5 5 0
Additional Gross Pay & Fringe 15 28 6 6 6 0
Subtotal, PS $226 $2,744 $2,730 $3,459 $2,976 $246
Other than Personal Services
Supplies and Materials $0 $1 $44 $43 $44 $0
Other Services and Charges 262 234 8 160 8 0
Contractual Services 48,590 38,000 35,209 40,017 21,066 (14,144)
Fixed and Misc Charges 530 196 585 3,865 1,143 558
Subtotal, OTPS $49,382 $38,430 $35,846 $44,085 $22,260 ($13,586)
TOTAL $49,607 $41,174 $38,576 $47,544 $25,236 ($13,340)
Funding
City Funds NA NA $15,242 $12,691 $276 ($14,966)
Federal – CDBG NA NA 445 445 70 (375)
Federal - Other NA NA 22,889 34,408 24,890 2,001
TOTAL $49,607 $41,174 $38,576 $47,544 $25,236 ($13,340)
*The difference of Fiscal 2010 Adopted compared to Fiscal 2011 Executive Plan funding.
Programmatic Review
DYCD administers the Federal Community Services Block Grant program to fund anti-poverty initiatives in43 designated low-income Neighborhood Development Areas (NDAs) across the five boroughs of New YorkCity. The NDA programs are designed to allow individual neighborhoods to fund the social services theydetermine best meet their particular needs. The Department allocates $16.5 million to these programs,which provide literacy, immigrant services family support, youth development, senior support, housingassistance and health insurance access.

Finance Division Briefing Paper Department of Youth and Community Development
Page 12
Fiscal 2011 Preliminary Budget Actions
Reduction in Community Services Program. The Department proposes to eliminate $1.2 million ofCity funding in Fiscal 2010 and in the outyears to community services contract programs that now willbe funded solely with Community Services Block Grant (CSBG) funding, which totals approximately $30million.
American Recovery and Reinvestment Act (ARRA) Funding
Through federal stimulus Community Services Block Grant (CSBG) funding, the Department allocated anadditional $6.2 million in Fiscal 2010 to the Fatherhood Program and to the Young Adult InternshipProgram (YAIP). Thirteen Fatherhood and 10 YAIP providers will collaborate to create a Fatherhood Re-entry Jobs Program that will help participants who are 25 years and older and ex-offenders enrolled ineducational programs or job placement services, connecting them with employment opportunities. Inaddition, five Fatherhood providers that are serving younger fathers will receive funds to create the YouthFatherhood Re-entry Internship program, which will build on linkages with YAIP programs. This initiativeassists fathers who are 16 to 24 years old enrolled in educational programs, vocational training or jobplacement. The Department hopes to assist approximately 600 fathers. The Department anticipatesfunding this program with the remaining stimulus dollars in Fiscal 2011, however, funding amounts havenot been finalized.
The Department also enhanced its Immigrant Services/Domestic Violence Program by allocating anadditional $2 million to five domestic violence programs to expand their services to include employment-related activities. Program participants will receive assistance with enrollment in job placement servicesor educational and vocational programs that will connect them with employment opportunities. TheDepartment anticipates funding this program with the remaining stimulus dollars in Fiscal 2011, however,funding amounts have not been finalized.
Council Initiatives and Funding
The Council provided funding for the following initiatives in the Community Development program area forFiscal 2010. Please note that the following funding is not included in the Fiscal 2011 Executive Budgettherefore is included in the total reduction of $13.3 million that is reflected in the Community Developmentfunding reduction:
Community Development ProgramsDollars in Thousands
Adult Literacy $1,500
Immigrant Opportunities Initiative 5,000
Electronic Benefits Transfer (EBTs) at Food Markets 270
Food Pantries 570
WHEDCo 255
Subtotal $7,595
Finance Division Briefing Paper Department of Youth and Community Development
Page 13
The Council restored $1.5 million to the Adult Literacy Program for various services and $5 million for theImmigrant Opportunities Initiative (IOI). This funding is allocated to CBOs that assist immigrant adultsgain access to information and resources and to strengthen their participation in the democratic process.Specifically, this initiative provides funding for English for Speakers of Other Languages (ESOL) classes,legal services for recent immigrants to assist with applications for citizenship or permanent residency, andlegal services that focus specifically on wage and hour disputes and other workplace issues.
Other Council initiatives include $270,000 to expand access to Electronic Benefits Transfer (EBT) atfarmers’ markets throughout the City, as well as support Youth Market-Urban Farm stands and the NewFarmer Development project, $570,000 to food pantries and soup kitchens throughout the City and$255,000 to the Women’s Housing and Economic Development Corporation (WHEDCo) which providesHeadstart and youth services programs to low-income families.
Finance Division Briefing Paper Department of Youth and Community Development
Page 14
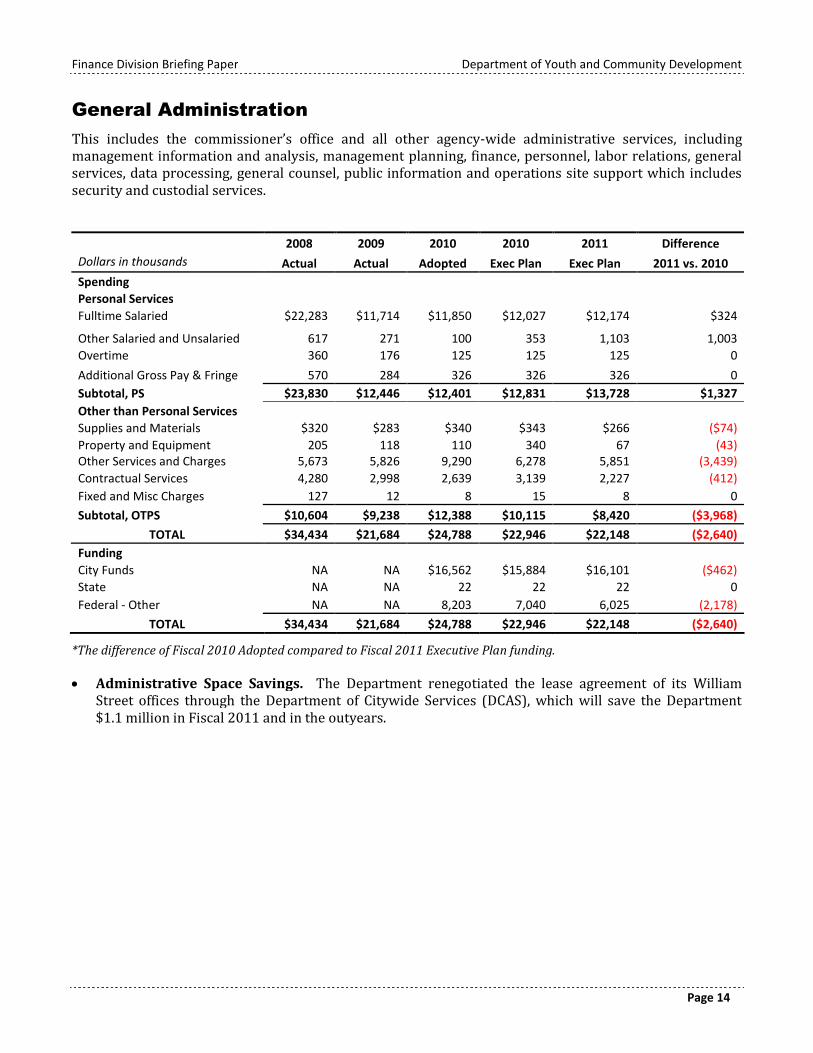
General Administration
This includes the commissioner’s office and all other agency-wide administrative services, includingmanagement information and analysis, management planning, finance, personnel, labor relations, generalservices, data processing, general counsel, public information and operations site support which includessecurity and custodial services.
2008 2009 2010 2010 2011 Difference
Dollars in thousands Actual Actual Adopted Exec Plan Exec Plan 2011 vs. 2010
Spending
Personal Services
Fulltime Salaried $22,283 $11,714 $11,850 $12,027 $12,174 $324
Other Salaried and Unsalaried 617 271 100 353 1,103 1,003
Overtime 360 176 125 125 125 0
Additional Gross Pay & Fringe 570 284 326 326 326 0
Subtotal, PS $23,830 $12,446 $12,401 $12,831 $13,728 $1,327
Other than Personal Services
Supplies and Materials $320 $283 $340 $343 $266 ($74)
Property and Equipment 205 118 110 340 67 (43)Other Services and Charges 5,673 5,826 9,290 6,278 5,851 (3,439)
Contractual Services 4,280 2,998 2,639 3,139 2,227 (412)
Fixed and Misc Charges 127 12 8 15 8 0
Subtotal, OTPS $10,604 $9,238 $12,388 $10,115 $8,420 ($3,968)
TOTAL $34,434 $21,684 $24,788 $22,946 $22,148 ($2,640)
Funding
City Funds NA NA $16,562 $15,884 $16,101 ($462)
State NA NA 22 22 22 0
Federal - Other NA NA 8,203 7,040 6,025 (2,178)
TOTAL $34,434 $21,684 $24,788 $22,946 $22,148 ($2,640)
*The difference of Fiscal 2010 Adopted compared to Fiscal 2011 Executive Plan funding.
Administrative Space Savings. The Department renegotiated the lease agreement of its WilliamStreet offices through the Department of Citywide Services (DCAS), which will save the Department$1.1 million in Fiscal 2011 and in the outyears.

Finance Division Briefing Paper Department of Youth and Community Development
Page 15
In-School Youth Programs (ISY)
Funded by Title I of the Workforce Investment Act (WIA) of 1998, DYCD In-School Youth (ISY) employmentprograms focus on vocational training and education. In-School Youth programs serve high school studentsin their junior and senior years. Youth meeting the age and income requirements who need basic skillsenhancement are eligible.
2008 2009 2010 2010 2011 Difference
Dollars in thousands Actual Actual Adopted Exec Plan Exec Plan 2011 vs. 2010
Spending
Personal Services
Fulltime Salaried $46 $885 $648 $664 $665 $16
Overtime 0 2 2 2 2 0
Additional Gross Pay & Fringe 97 34 7 7 7 0
Subtotal, PS $143 $921 $657 $673 $674 $16
Other than Personal Services
Supplies and Materials $3 $0 $0 $0 $0 $0
Other Services and Charges 5 31 0 0 0 0
Contractual Services 10,458 12,504 15,998 15,983 13,643 (2,355)
Fixed and Misc Charges 0 0 3,142 3,112 0 (3,142)
Subtotal, OTPS $10,465 $12,535 $19,140 $19,096 $13,643 ($5,497)
TOTAL $10,608 $13,456 $19,797 $19,768 $14,317 ($5,481)
Funding
City Funds NA NA $70 $85 $86 $16
Federal – Other NA NA 19,727 19,683 14,230 (5,497)
TOTAL $10,608 $13,456 $19,797 $19,768 $14,317 ($5,481)
*The difference of Fiscal 2010 Adopted compared to Fiscal 2011 Executive Plan funding.
Programmatic Review
ISY services are provided by 40 contractors in all five boroughs. All In-School Youth program participantsare guaranteed employment in the Summer Youth Employment Program (SYEP), a subsidized summerwork experience.
American Recovery and Reinvestment Act (ARRA) Funding
Through federal stimulus Workforce Investment Act (WIA) funding the Department created a new programknown as “Go to School, Get a Job”. The total funding allocated in Fiscal 2010 to the program is $5.5 millionthrough the amending of existing ISY contracts. The goal of the program is to provide part-time jobs duringthe school year to youth provided they remain in or return to high school and meet academic andgovernment performance standards. A total of 2,796 ISY youth will be served (2,055 current ISY youth and741 new youth served). The total $5.5 million in ARRA funding is eliminated in Fiscal 2011 and constitutesthe total reduction of funding from the Fiscal 2010 Adopted Budget to the Fiscal 2011 Executive Budget.

Finance Division Briefing Paper Department of Youth and Community Development
Page 16
Other Youth Programs
This program area includes other After School Services that the Department provides.
2008 2009 2010 2010 2011 Difference
Dollars in thousands Actual Actual Adopted Exec Plan Exec Plan 2011 vs. 2010
Spending
Personal Services
Fulltime Salaried $325 $3,962 $3,246 $2,846 $3,171 ($76)
Other Salaried and Unsalaried 4 35 0 1 1 1
Overtime 0 0 10 10 10 0
Additional Gross Pay & Fringe 335 34 10 10 10 0
Subtotal, PS $664 $4,030 $3,267 $2,867 $3,192 ($75)
Other than Personal Services
Supplies and Materials $6 $6 $0 $10 $0 $0
Other Services and Charges 8 6 14 4 100 87
Contractual Services 48,628 40,647 40,261 35,832 15,434 (24,827)
Fixed and Misc Charges 1,795 3,023 0 3,483 0 0
Subtotal, OTPS $50,438 $43,682 $40,274 $39,329 $15,534 ($24,741)
TOTAL $51,102 $47,712 $43,541 $42,196 $18,726 ($24,815)
Funding
City Funds NA NA $42,069 $41,046 $17,253 ($24,815)
State NA NA 104 104 104 0
Federal – Other NA NA 1,368 1,045 1,368 0
TOTAL $51,102 $47,712 $43,541 $42,196 $18,726 ($24,815)
*The difference of Fiscal 2010 Adopted compared to Fiscal 2011 Executive Plan funding.
Council Initiatives and Funding
The Council provided funding for the following initiatives in the Other Youth program area for Fiscal 2010.Please note that the following funding is not included in the Fiscal 2011 Executive Budget therefore isincluded in the total reduction of $24.8 million that is reflected in the Community Development fundingreduction from the Fiscal 2010 Adopted Budget to the Fiscal 2011 Executive Budget. The remainingfunding consists of Council youth discretionary funding:
Other Youth ProgramsDollars in Thousands
After – Three Corporation $3,800
Campaign for Fiscal Equity 50
Jill Chaifitz Helpline 200
Neighborhood Youth Alliance/Street Outreach 1,000
New York Junior Tennis League 800
Sports & Arts in Schools Foundation (SASF) 1,200
YMCA Virtual Y Program 500
Subtotal $7,550

Finance Division Briefing Paper Department of Youth and Community Development
Page 17
The Council provided funding totaling $6.3 million to four CBO’s for youth programs including the After-Three Corporation, the New York Junior Tennis League, the Sports & Arts in Schools Foundation and theYMCA Virtual Y Program. The Council also provided $250,000 for education-related services includingfunds to the Campaign for Fiscal Equity and the Jill Chaifitz Helpline. Lastly, the Council provided $1million for the Neighborhood Youth Alliance/Street Outreach program.
Finance Division Briefing Paper Department of Youth and Community Development
Page 18
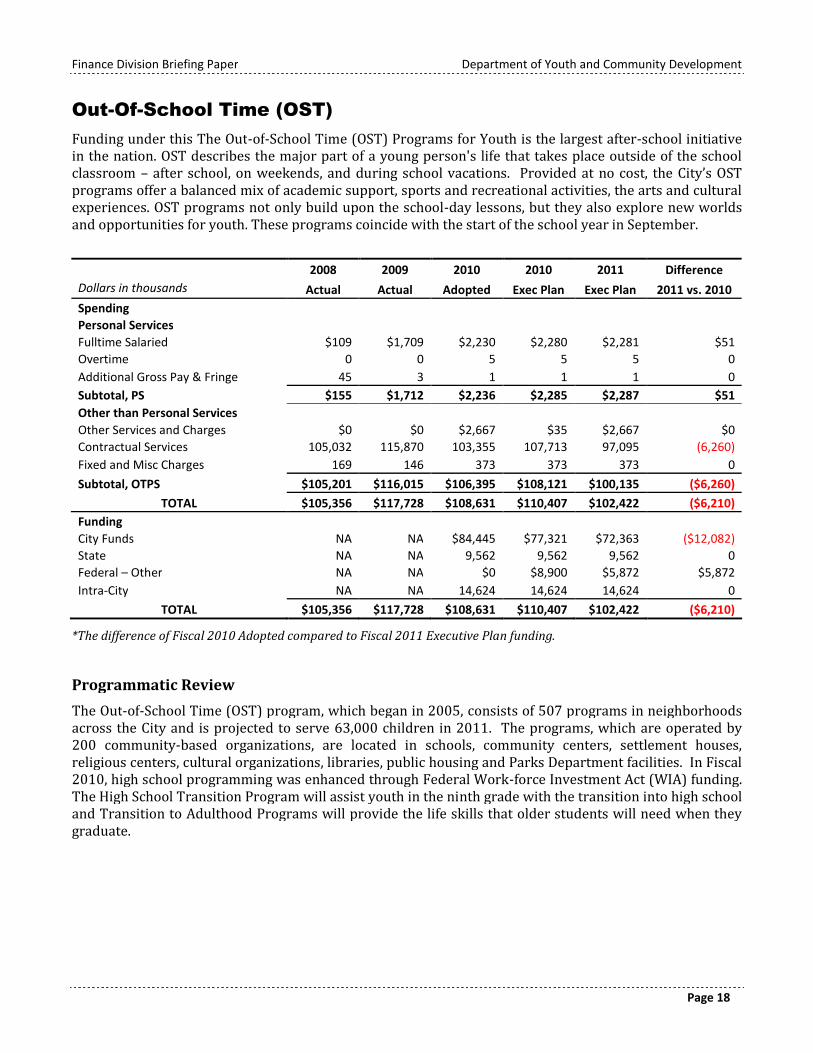
Out-Of-School Time (OST)
Funding under this The Out-of-School Time (OST) Programs for Youth is the largest after-school initiativein the nation. OST describes the major part of a young person's life that takes place outside of the schoolclassroom – after school, on weekends, and during school vacations. Provided at no cost, the City’s OSTprograms offer a balanced mix of academic support, sports and recreational activities, the arts and culturalexperiences. OST programs not only build upon the school-day lessons, but they also explore new worldsand opportunities for youth. These programs coincide with the start of the school year in September.
2008 2009 2010 2010 2011 Difference
Dollars in thousands Actual Actual Adopted Exec Plan Exec Plan 2011 vs. 2010
Spending
Personal Services
Fulltime Salaried $109 $1,709 $2,230 $2,280 $2,281 $51
Overtime 0 0 5 5 5 0
Additional Gross Pay & Fringe 45 3 1 1 1 0
Subtotal, PS $155 $1,712 $2,236 $2,285 $2,287 $51
Other than Personal Services
Other Services and Charges $0 $0 $2,667 $35 $2,667 $0
Contractual Services 105,032 115,870 103,355 107,713 97,095 (6,260)
Fixed and Misc Charges 169 146 373 373 373 0
Subtotal, OTPS $105,201 $116,015 $106,395 $108,121 $100,135 ($6,260)
TOTAL $105,356 $117,728 $108,631 $110,407 $102,422 ($6,210)
Funding
City Funds NA NA $84,445 $77,321 $72,363 ($12,082)
State NA NA 9,562 9,562 9,562 0
Federal – Other NA NA $0 $8,900 $5,872 $5,872
Intra-City NA NA 14,624 14,624 14,624 0
TOTAL $105,356 $117,728 $108,631 $110,407 $102,422 ($6,210)
*The difference of Fiscal 2010 Adopted compared to Fiscal 2011 Executive Plan funding.
Programmatic Review
The Out-of-School Time (OST) program, which began in 2005, consists of 507 programs in neighborhoodsacross the City and is projected to serve 63,000 children in 2011. The programs, which are operated by200 community-based organizations, are located in schools, community centers, settlement houses,religious centers, cultural organizations, libraries, public housing and Parks Department facilities. In Fiscal2010, high school programming was enhanced through Federal Work-force Investment Act (WIA) funding.The High School Transition Program will assist youth in the ninth grade with the transition into high schooland Transition to Adulthood Programs will provide the life skills that older students will need when theygraduate.

Finance Division Briefing Paper Department of Youth and Community Development
Page 19
Fiscal 2011 Executive Budget Action
Out of School Time Reduction (OST). The Department proposes restoring 1,943 summer slots at OSTmiddle school programs that were slated for elimination in the Fiscal 2011 Preliminary Budget. TheDepartment will restore $600,000 in Fiscal 2011 in City funding that will be matched with $700,000 inprivate funds from the New York Community Trust, for a total one-time allocation of $1.3 million.
However, the Department still proposes a reduction in City funding of approximately $2 million inFiscal 2010 and $6.2 million in Fiscal 2011 and in the outyears, which will eliminate 33 school-year-only OST programs (4,110 elementary and middle school slots) that are located in what theDepartment considers lower priority zip codes.
American Recovery and Reinvestment Act (ARRA) Funding
Through federal stimulus Community Services Block Grant (CSBG) funding the Department restoredapproximately $14.1 million in Fiscal 2010, to 91 OST Option II programs that were to be eliminated inFiscal 2010. OST Option II is a public/private match program which serves 10,750 youth for a minimum of160 hours a year. Funding was also allocated to 272 elementary and middle school programs for their OSTsummer programming. It is estimated that this funding created and/or preserved 1,800 jobs. TheDepartment anticipates funding this program through August 2010 with the remaining stimulus dollars,however, after that the OST Option II program will be eliminated.
Performance Measures
FY 07 FY 08 FY 09
FY 104-Month
ActualTargetFY 11
Out-of-School Time (OST) Enrollment 78,364 87,256 85,513 55,343 63,000
OST Program Participations Rate – Elementary (school year) (%) 81% 78% 82% 68% 80%
OST programs meeting target enrollment (school year) (%) 90% 86% 93% 86% 85%
OST programs meeting target enrollment (summer) (%) 86% 95% 94% 96% 85%
OST programs meeting target enrollment - elementary (%) 99% 89% 99% 94% 90%
OST programs meeting target enrollment – middle school (%) 94% 89% 91% 77% 85%
OST programs meeting target enrollment – high school (%) 75% 77% 81% 45% 80%
Out-of-School Time (OST) program enrollment rose for school-year programs while declining slightly forsummer programs in Fiscal 2009. The total OST enrollment decreased by two percent in Fiscal 2009, to85,513 from 87,256 in Fiscal 2008.
Out-of-School Time enrollment in the first four months of Fiscal 2010 was 11 percent lower than the sameperiod in Fiscal 2009 due to a redesign of the OST High School portfolio that reduced the number ofprograms funded, and a consolidation of several middle school programs due to a budget reduction. With astrong portfolio of programs in place, a higher percentage of school-year programs are meeting enrollmenttargets, with 86 percent of programs meeting target enrollment in the first four months of Fiscal 2010compared to 74 percent in the same period in Fiscal 2009. At 96 percent, summer programs meetingenrollment targets exceeded the target of 85 percent.

Finance Division Briefing Paper Department of Youth and Community Development
Page 20
Out-Of-School Youth Programs (OSY)
Funded by Title I of the Workforce Investment Act (WIA) of 1998, Out-of-School Youth (OSY) employmentprograms focus on vocational training and education. Some out-of-school youth programs serve olderyouth aged 19 – 21, some serve younger youth aged 16 – 18, and some programs serve both age groups.Youth meeting the age requirement who have either dropped out of high school or have graduated fromhigh school but need basic skills enhancement and meet the income requirements are eligible.
2008 2009 2010 2010 2011 Difference
Dollars in thousands Actual Actual Adopted Exec Plan Exec Plan 2011 vs. 2010
Spending
Personal Services
Fulltime Salaried $43 $733 $938 $984 $956 $18
Other Salaried and Unsalaried 0 55 0 5 5 5
Overtime 0 0 2 2 2 0
Additional Gross Pay & Fringe 1 18 0 0 0 0
Subtotal, PS $44 $806 $940 $991 $963 $23
Other than Personal Services
Other Services and Charges $0 $0 $2,000 $1,767 $0 ($2,000)
Contractual Services 6,726 7,563 8,085 13,349 7,553 (532)
Fixed and Misc Charges 0 0 2,491 1,430 0 (2,491)
Subtotal, OTPS $6,726 $7,563 $12,576 $16,546 $7,553 ($5,023)
TOTAL $6,770 $8,369 $13,516 $17,537 $8,516 ($5,000)
Funding
City Funds NA NA $59 $80 $82 $23
Federal – Other NA NA 13,457 17,457 8,434 (5,023)
TOTAL $6,770 $8,369 $13,516 $17,537 $8,516 ($5,000)
*The difference of Fiscal 2010 Adopted compared to Fiscal 2011 Executive Plan funding.
Programmatic Review
Out-of-School Youth programs offer occupational skills training, assistance with job and college placement,GED preparation, and a wide range of supportive services designed to increase young adults’ success in theworkplace and in their personal lives. Participants receive 12 months of follow-up services aftercompleting the program. OSY programs are located in community-based organizations in all five boroughsof New York City, and offer a range of occupational training in many industries, including construction, foodservice, tourism, healthcare, and retail. Beginning in July 2009, OSY programming expanded from 875 to1,521 slots through reallocations of federal funding that at the time supported ISY programs.
American Recovery and Reinvestment Act (ARRA) Funding
Through federal stimulus Workforce Investment Act (WIA) funding, the Department expanded OSYinternships with the allocation of approximately $3 million in Fiscal 2010, amending existing OSY contractsof providers who assist young adults ages 16-21 who are not working and not in school. Approximately anadditional 1,064 youth will be served.

Finance Division Briefing Paper Department of Youth and Community Development
Page 21
Performance Measures
FY 07 FY 08 FY 09
FY 104-Month
ActualTargetFY 11
Out-of-School Youth placed in post-secondary education,employment, or advanced training during the first quarterafter exiting the program NA 72% 69% 92% *
Out-of-School Youth attaining a degree or certificate by theend of the third quarter after exiting the program NA 55% 58% 70% *
The percentage of Out-of School youth placed in post-secondary education, employment or advancedtraining during the first quarter after exiting the program rose from 85 percent in the first four months ofFiscal 2009 to 92 percent in the first four months of Fiscal 2010 due to the infusion of stimulus fundingwhich led to more available slots.

Finance Division Briefing Paper Department of Youth and Community Development
Page 22
Runaway And Homeless Youth (RHY)
DYCD funds programs that are designed to protect runaway and homeless youth and, whenever possible,reunite them with their families. In cases where reunification is not possible, these programs are designedto help youth progress from crisis and transitional care to independent living. Program activities andexperiences are designed to assist youth in becoming healthy, caring, and responsible adults.
2008 2009 2010 2010 2011 Difference
Dollars in thousands Actual Actual Adopted Exec Plan Exec Plan 2011 vs. 2010
Spending
Personal Services
Fulltime Salaried $38 $618 $653 $683 $683 $30
Other Salaried and Unsalaried 0 3 0 0 0 0
Overtime 0 0 2 2 2 0
Additional Gross Pay & Fringe 22 9 0 0 0 0
Subtotal, PS $60 $630 $655 $685 $685 $30
Other than Personal Services
Other Services and Charges $0 $0 $116 $0 $116 $0
Contractual Services 10,500 10,468 11,298 12,075 6,017 (5,281)
Subtotal, OTPS $10,500 $10,468 $11,415 $12,075 $6,134 ($5,281)
TOTAL $10,559 $11,098 $12,069 $12,760 $6,819 ($5,250)
Funding
City Funds NA NA $10,161 $10,559 $4,771 ($5,390)
State NA NA 1,858 1,858 1,858 0
Federal – Other NA NA 51 149 51 0
Intra-City NA NA 0 195 139 139
TOTAL $10,559 $11,098 $12,069 $12,760 $6,819 ($5,250)
*The difference of Fiscal 2010 Adopted compared to Fiscal 2011 Executive Plan funding.
Programmatic Review
DYCD funds programs charged with giving vulnerable young people the resources they need to get off thestreets and stabilize their lives. These services include Street Outreach and Referral Services as well asDrop-In Centers and transportation. For youth in need of more intensive assistance, Crisis Shelters offersafe and welcoming environments on a short-term basis while Transitional Independent Living facilitiescombine longer-term shelter with training and support designed to put formerly homeless youth on thepath to independence.
Council Initiatives and Funding
The Council provided almost $6 million for shelter beds for at risk and LGBTQ youth. Please note that thisfunding is not included in the Fiscal 2011 Executive Budget therefore it consists of a total reduction of $5.3million reflected in the Runaway and Homeless Youth program area with previous plan changes, as well ascost of living increases, which slightly offsets the total reduction:

Finance Division Briefing Paper Department of Youth and Community Development
Page 23
Runaway and Homeless YouthDollars in Thousands
Shelter Beds for at Risk/LGBT Youth $5,990
Subtotal $5,990
Council funding to CBOs support crisis shelter beds and transitional independent living beds for at-risk,runaway and homeless youth and enhances the Department’s Runaway and Homeless Youth RFP that wasrenewed in July 2009. The total funding for the RFP in Fiscal 2010 is $4.1 million, an increase of sevenpercent, for 47 crisis shelter beds ($1.6 million) and 59 TIL beds ($2.4 million). When adding the Council’scommitment to the initiative the total funding is over $12 million.
Performance Measures
FY 07 FY 08 FY 09
FY 104-Month
ActualTargetFY 11
Runaway and Homeless Youth served – Crisis beds 2,421 1,824 1,713 548 1,860
Runaway and Homeless Youth served – Transitional IndependentLiving beds 218 244 275 170 250
Utilization rate for Crisis beds (%) 100% 100% 100% 100% 90%
Utilization rate for Transitional Independent Living beds (%) 83% 86% 82% 70% 85%
Youth reunited with family or placed in a suitable environmentfrom Crisis Shelters (%) 65% 75% 72% 60% 60%
Youth reunited with family or placed in a suitable environmentfrom Transitional Independent Living (TIL) centers (%) 91% 89% 90% 89% 85%
The number of runaway and homeless youth served in crisis shelters decreased 27 percentage points fromthe same period in Fiscal 2009. This was due to the introduction of new providers, offering more diverseservices, who began the certification process at the start of Fiscal 2010 following funding awards. Thirty-eight additional beds were certified by the end of the second quarter, significantly increasing capacity forserving these youth.
The percentage of youth reunited with family or placed in a suitable living environment from crisis sheltersin the first four months of Fiscal 2010 fell 22 percentage points from the same time period in Fiscal 2009.An organizational restructuring at the largest provider of these services temporarily affected its ability tonegotiate family reunifications.

Finance Division Briefing Paper Department of Youth and Community Development
Page 24
Summer Youth Employment Program
The purpose of the Summer Youth Employment Program (SYEP) is to provide New York City youth,between the ages of 14 through 21, with summer employment and educational experiences that build ontheir individual strengths and incorporate youth development principles. SYEP comprises two summerprograms: the Stand-Alone summer program and the WIA In-School Youth (ISY) summer program. Overthe years, between 25,000 to as many as 50,000 youth annually have received summer jobs through theseprograms. Many young people work in a variety of entry-level jobs at community-based organizations andgovernment agencies. Some examples include assisting with clerical duties in local hospitals and libraries;serving lunches at a senior center; helping children at a day care center; and helping with clean up at localparks.
2008 2009 2010 2010 2011 Difference
Dollars in thousands Actual Actual Adopted Exec Plan Exec Plan 2011 vs. 2010
Spending
Personal Services
Fulltime Salaried $68 $1,092 $1,085 $1,133 $1,134 $50
Other Salaried and Unsalaried 64 377 0 451 2 2
Overtime 0 0 1 1 1 0
Additional Gross Pay & Fringe 59 9 0 0 0 0
Subtotal, PS $190 $1,478 $1,086 $1,586 $1,138 $52
Other than Personal Services
Other Services and Charges $13 $4 $0 $13 $0 $0
Contractual Services 11,391 10,938 6,470 15,464 4,189 (2,281)
Fixed and Misc Charges 44,001 43,860 47,931 50,129 30,285 (17,645)
Subtotal, OTPS $55,405 $54,801 $54,400 $65,607 $34,474 ($19,926)
TOTAL $55,595 $56,279 $55,486 $67,192 $35,612 ($19,874)
Funding
City Funds NA NA $14,597 $15,644 $24,603 $10,006
Federal – Other NA NA 40,889 51,470 11,009 (29,880)
Intra-City NA NA 0 79 0 0
TOTAL $55,595 $56,279 $55,486 $67,192 $35,612 ($19,874)
*The difference of Fiscal 2010 Adopted compared to Fiscal 2011 Executive Plan funding.
Programmatic Review
The Summer Youth Employment Program participants work in a variety of entry-level jobs at community-based organizations, government agencies and private sector businesses and are paid for-up to 25 hoursper week for seven weeks at $7.25 per hour. Program enhancements in 2010 included a new focus onvulnerable youth such as children in foster care or involved in the juvenile justice system. The Departmentalso implemented the Summer of Services initiative which will connect 1,000 SYEP participants to publicservice opportunities in all five boroughs.
Finance Division Briefing Paper Department of Youth and Community Development
Page 25
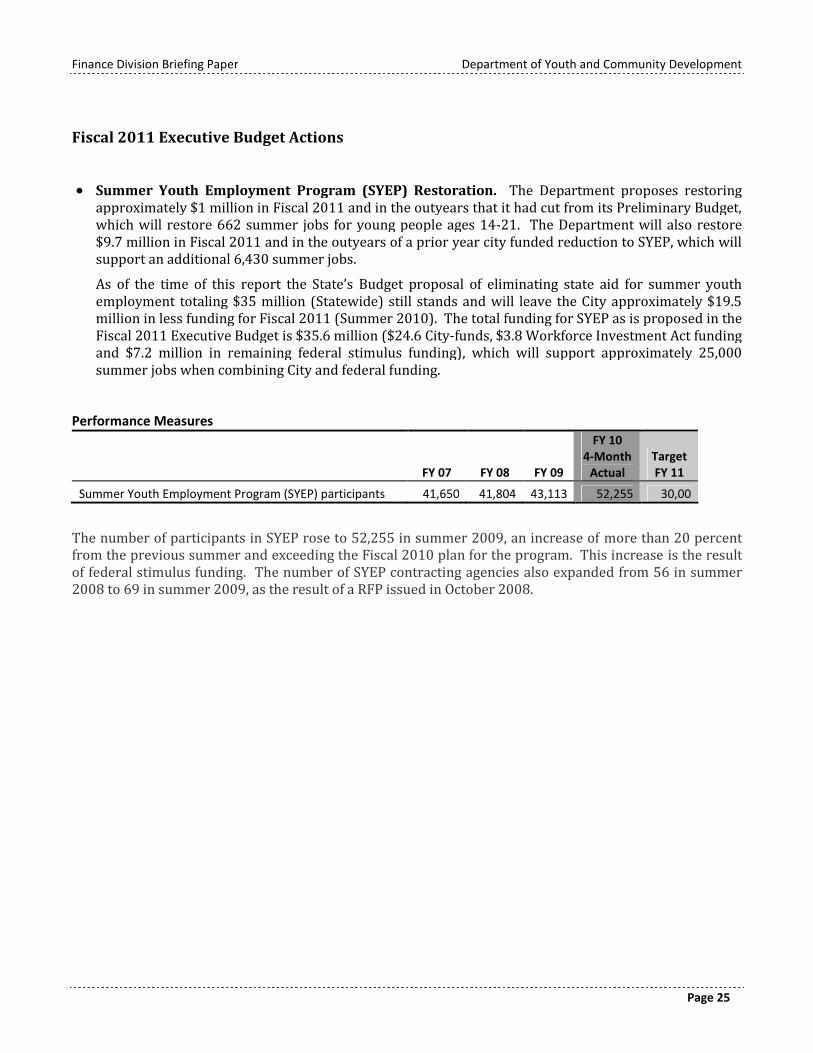
Fiscal 2011 Executive Budget Actions
Summer Youth Employment Program (SYEP) Restoration. The Department proposes restoringapproximately $1 million in Fiscal 2011 and in the outyears that it had cut from its Preliminary Budget,which will restore 662 summer jobs for young people ages 14-21. The Department will also restore$9.7 million in Fiscal 2011 and in the outyears of a prior year city funded reduction to SYEP, which willsupport an additional 6,430 summer jobs.
As of the time of this report the State’s Budget proposal of eliminating state aid for summer youthemployment totaling $35 million (Statewide) still stands and will leave the City approximately $19.5million in less funding for Fiscal 2011 (Summer 2010). The total funding for SYEP as is proposed in theFiscal 2011 Executive Budget is $35.6 million ($24.6 City-funds, $3.8 Workforce Investment Act fundingand $7.2 million in remaining federal stimulus funding), which will support approximately 25,000summer jobs when combining City and federal funding.
Performance Measures
FY 07 FY 08 FY 09
FY 104-Month
ActualTargetFY 11
Summer Youth Employment Program (SYEP) participants 41,650 41,804 43,113 52,255 30,00
The number of participants in SYEP rose to 52,255 in summer 2009, an increase of more than 20 percentfrom the previous summer and exceeding the Fiscal 2010 plan for the program. This increase is the resultof federal stimulus funding. The number of SYEP contracting agencies also expanded from 56 in summer2008 to 69 in summer 2009, as the result of a RFP issued in October 2008.

Finance Division Briefing Paper Department of Youth and Community Development
Page 26
Appendix A: Budget Actions Since Fiscal 2010 Adoption
FY 2010 FY 2011
Dollars in Thousands City Non-City Total City Non-City Total
Agency Budget as per the June 2009 Plan $233,440 $154,407 $387,847 $168,091 $103,322 $271,413
Program to Eliminate the Gap (PEGs)
Administrative Space Savings $0 $0 $0 ($1,129) $0 ($1,129)
Adult Literacy Elimination 0 0 0 (4,625) 0 (4,625)
CEO Reduction 0 0 0 (260) 0 (260)
OST Middle School Summer Programs 0 0 0 600 0 600
SYEP 0 0 0 999 0 999
SYEP Restoration $- 0 0 9,725 0 9,725
Preliminary PEGS (9,435) 0 (9,435) (13,974) 0 (13,974)
Total PEGs ($9,435) $0 ($9,435) ($8,664) $0 ($8,664)
Other Adjustments
ARRA Fatherhood Initiative $0 $618 $618 $0 ($618) ($618)
Beacon Surplus (500) 0 (500) 0 0 0
CEO Rollover (410) 0 (410) 0 0 0
CSBG SYEP 10 Startup 0 89 89 0 (89) (89)
Lease Adjustment 0 0 0 0 56 56
OSY Increase Funds 0 3,680 3,680 0 0 0
Increase WIA Partnership 0 510 510 0 255 255
Council MOD 154 0 154 0 0 0
Preliminary Adjustments (3,339) 36,899 33,560 14,631 16,671 31,303
Total Other Adjustments ($4,095) $41,796 $37,701 $14,631 $16,275 $30,906
Agency Budget as per the Fiscal 2011 Executive Plan $219,910 $196,203 $416,113 $174,058 $119,597 $293,655
Finance Division Briefing Paper Department of Youth and Community Development
Page 27
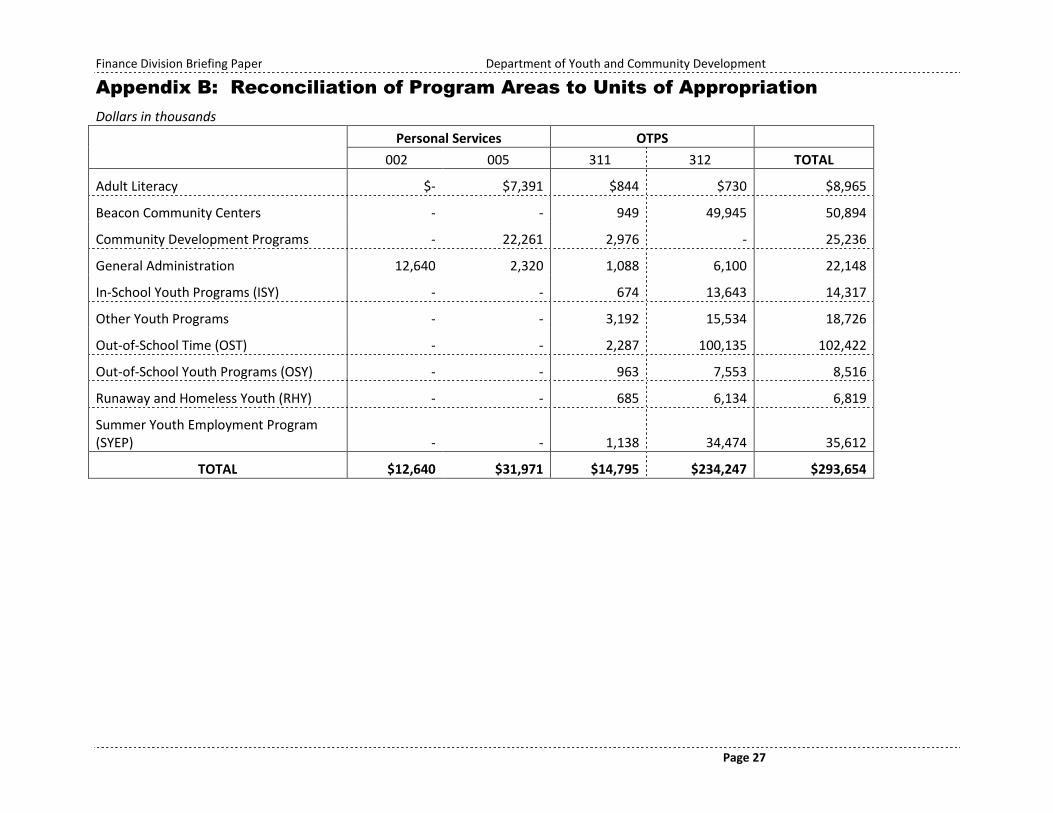
Appendix B: Reconciliation of Program Areas to Units of Appropriation
Dollars in thousands
Personal Services OTPS
002 005 311 312 TOTAL
Adult Literacy $- $7,391 $844 $730 $8,965
Beacon Community Centers - - 949 49,945 50,894
Community Development Programs - 22,261 2,976 - 25,236
General Administration 12,640 2,320 1,088 6,100 22,148
In-School Youth Programs (ISY) - - 674 13,643 14,317
Other Youth Programs - - 3,192 15,534 18,726
Out-of-School Time (OST) - - 2,287 100,135 102,422
Out-of-School Youth Programs (OSY) - - 963 7,553 8,516
Runaway and Homeless Youth (RHY) - - 685 6,134 6,819
Summer Youth Employment Program(SYEP) - - 1,138 34,474 35,612
TOTAL $12,640 $31,971 $14,795 $234,247 $293,654