department of zoology university of peshawar...
TRANSCRIPT

EVALUATION OF HEAVY METALS TOXICITY IN SELECTED
FISH SPECIES OF RIVER KABUL
BY
MUHAMMAD SIRAJ
DEPARTMENT OF ZOOLOGY
UNIVERSITY OF PESHAWAR
PAKISTAN
2015

i
EVALUATION OF HEAVY METALS TOXICITY IN SELECTED
FISH SPECIES OF RIVER KABUL
A MANUSCRIPT PRESENTED TO THE DEPARTMENT OF ZOOLOGY,
UNIVERSITY OF PESHAWAR IN THE PARTIAL FULFILLMENT OF THE
REQUIREMENTS FOR
THE DEGREE OF
DOCTOR OF PHILOSOPHY
IN
ZOOLOGY
BY
MUHAMMAD SIRAJ
DEPARTMENT OF ZOOLOGY
UNIVERSITY OF PESHAWAR
PAKISTAN
2015

ii
IN THE NAME OF ALLAH, MOST COMPASSIONATE, EVER MERCIFUL
iii
ACKNOWLEDGMENTS
“In the name of Allah the most merciful and beneficent”All prayers for
Almighty Allah, the most merciful and beneficent, without whose consent and
consecration nothing would ever be imaginable. I am absolutely beholden by my
Lord’s generosity in this effort. Praises be to Holy Prophet (pbuh) for he is a beacon
as I pace on in my life and work.
First of all I want to acknowledge my supervisor Assist. Prof Dr.
Mohammad Khisroon, Zoology Department, University of Peshawar, Pakistan for
his kind support during the entire period of my Ph.D. Without whom I may have not
been able to complete this research thesis.
I like to gratitude my respectable teacher and chairperson madam Prof. Dr.
Nahid Ali, Zoology Department, University of Peshawar, Pakistan for her help and
providing research facilities in completing my thesis. I am thankful to external
evaluators and internal viva examiners for their kind suggestions to improve the
quality of research presented in this thesis.
Thanks are also due to my honourable teachers Prof. Dr. Abdul Hamid Jan,
Prof. Dr. Inayat Ali Shahjehan, Prof. Dr. Syed Akram Shah, Assist. Prof.
Zaigham Hassan, Assist. Prof. Dr. Syed Basit Rasheed, Assist. Prof. Dr. Farah
Zaidi, Assist. Prof. Dr. Sobia, Assist. Prof. Dr. Nazma and Qaiser Jamal Zoology
Department, University of Peshawar, Pakistan for their kind cooperation, moral
support and nice guidance during entire period of my Ph.D program.
I am also thankful to my Ph.D collegues Ajmal Khan (Lecturer),
Muhammad Iftikhar (Lecturer), Abid ullah Dawar (Lecturer) and Ahmad ullah
(Lecturer) for their kind, encouragement, support and excellent company during the
course of my studies.

iv
I present my profound thanks to Farhat ullah, Mr. Zafer Khan, Abdul
Wadood and all staff of Zoology Department University of Peshawar for their moral
support and co-operation during my research studies.
My thanks are due to my friends Dr.Sahib Gul (AWKU Mardan), Mr.
Muhammad Shahid (Ph.D Scholar), Hashmat Ali (Lecturer) Wisal Ahmad (M.Phil
Scholar), Javid Farooqi (M.Phil Scholar), Muhammad Riaz Khan, Shabir Ahmad,
Hasibullah, Ziaullah Jan, Alif noor and Hafiz Iftikhar Khan, Saad Muhammad
(M.Phil Scholar), Muhammad Nawaz, Ikram ullah and Bakhmali Shah for
excellent company, cooperation and moral support during my research work.
I pay my humblest thanks to my loving parents and sisters whose ever lasting
prayers always chased my success. It is due to their efforts that I have been able to
continue my study.
I present my whole hearted thanks to my eldest brother Mr. Ayaz Khan for
his patience, sacrifices, effort, encouragement and financial support.
I am also thankful to my brothers Gul Bayees Khan, Mumtaz Khan (M.A,
L.L.B) and Malik Zeb Khan (M.Phil Scholar) for their kinds and affection during the
course of my studies.
I offer my hearted affection to my nephews Junaid Khan, Anees Khan
Talha Mumtaz, Waqas Khan, Uzair Khan and Ukasha for their innocent faces.
MUHAMMAD SIRAJ

v
D E D I C A T I O N
Dedicated To
My loving Father Qialees Khan (Late)
My loving Mother Khaista bibi (Late)
And
My Eldest Brother Mr. Ayaz khan

vi
TABLE OF CONTENTS
ACKNOWLEDGMENTS ........................................................................................ III
TABLE OF CONTENTS ......................................................................................... VI
LIST OF TABLES ................................................................................................... XII
LIST OF FIGURES .............................................................................................. XVII
LIST OF ABBREVIATION.............................................................................. XXVII
PREFACE ..........................................................................................................XXVIII
ABSTRACT ........................................................................................................... XXX
CHAPTER-1 ................................................................................................................. 1
GENERAL INTRODUCTION ................................................................................... 1
1.1 Study Area Description ...................................................................................... 2
1.2 River Kabul ........................................................................................................ 2
Fig. 1.1: The River Kabul and its tributaries .................................................... 4
1.3 Warsak Dam....................................................................................................... 5
1.4 Background ........................................................................................................ 5
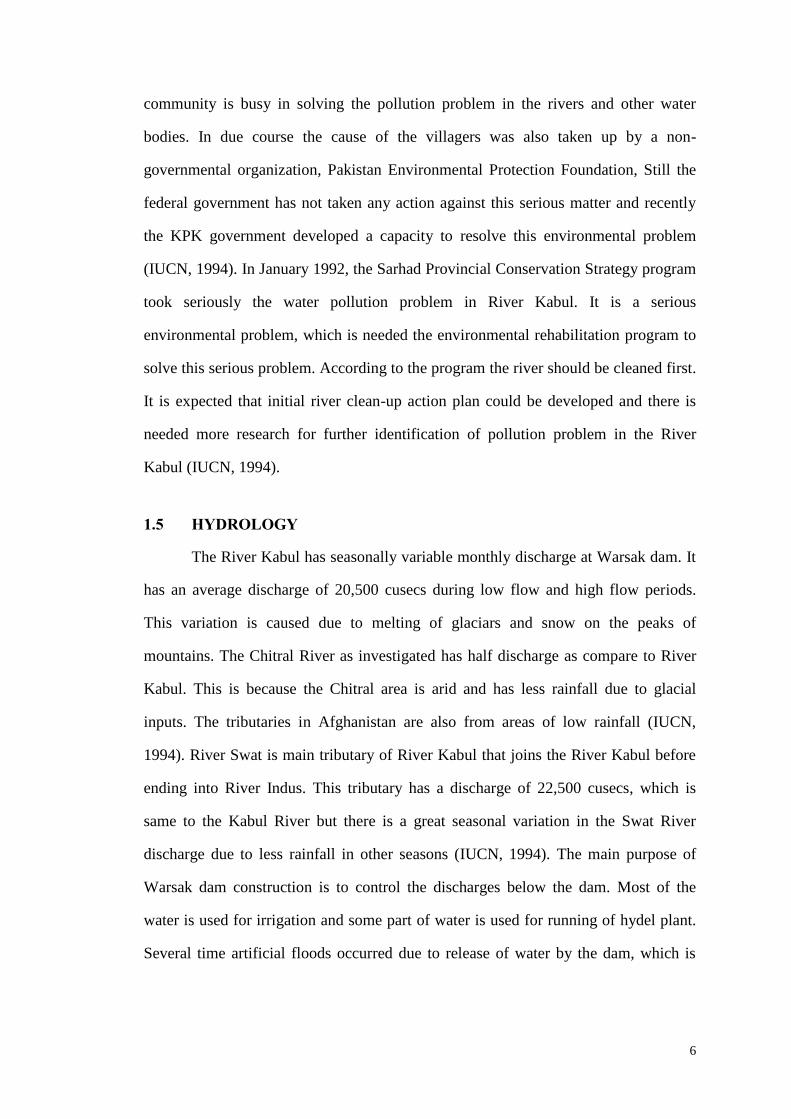
1.5 Hydrology .......................................................................................................... 6
1.6 Geology .............................................................................................................. 7
1.7 Vertebrates Fauna in the River Kabul, Pakistan ................................................ 7
1.7.1 Fish Fauna .................................................................................................. 7
1.7.1.1 Wallago Attu .......................................................................................... 8
1.7.1.2 Labeo dyocheilus ................................................................................... 9
1.7.1.3 Cyprinus carpio ................................................................................... 10
1.7.1.4 Ompok bimaculatus ............................................................................. 11
Fig.1.5: Photograph showing Ompok bimaculatus .......................................... 12
1.7.1.5. Aorichthys seenghala .......................................................................... 12
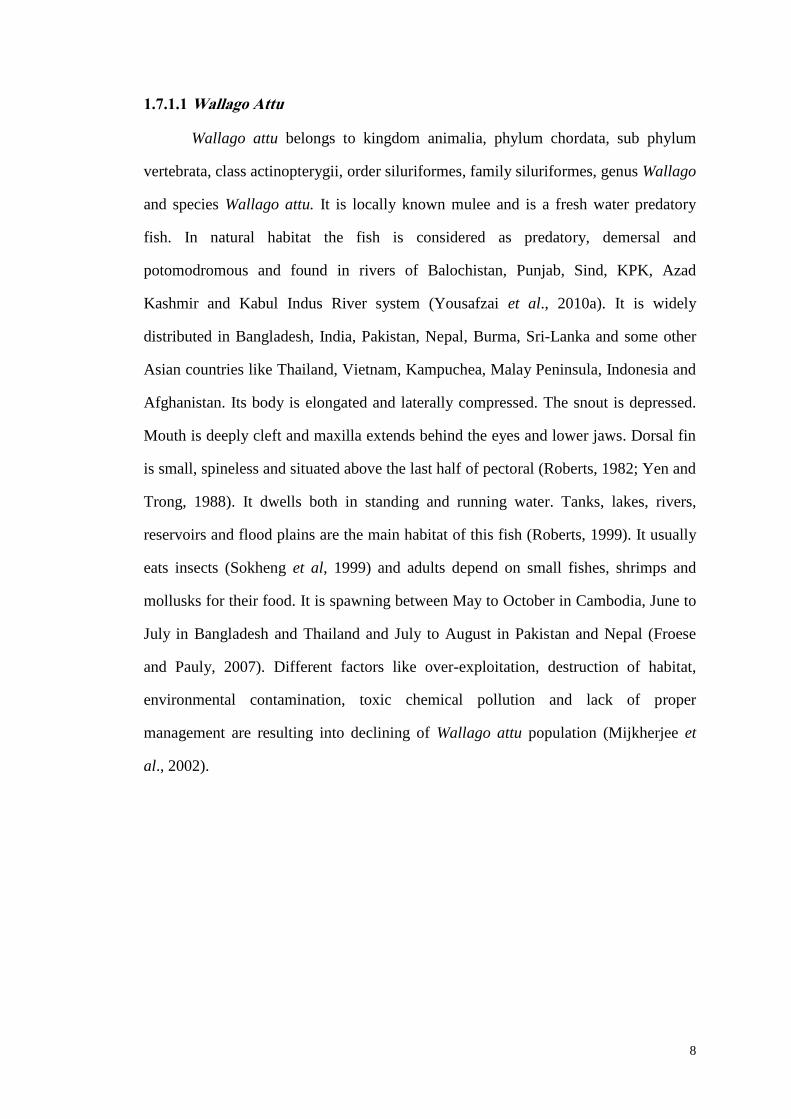
Fig.1.6: Photograph showing Aorichthys seenghala ..................................... 13
1.8 Human Population ........................................................................................... 13
1.9 Principal uses of River Kabul .......................................................................... 13
1.9.1 Irrigation .................................................................................................. 13
1.9.2 Fisheries in River Kabul .......................................................................... 14
1.9.2.1 Importance of Fish ........................................................................... 14
1.9.3 Hunting .................................................................................................... 15
1.9.4 Recreation ................................................................................................ 15
1.9.5 Washing and Bathing ............................................................................... 15

vii
1.10 Industries along River Kabul ........................................................................... 16
1.10.1 Industries at Aman Garh Industrial Zone................................................. 16
1.11 Sewage and Industrial Effluents Disposal to River Kabul ............................... 17
1.12 Water Contamination ....................................................................................... 17
1.13 Sources of Heavy Metals ................................................................................. 19
1.13.1 Metals in the Environment ....................................................................... 19
1.13.2 Metals in the Body of an Organism ......................................................... 20
1.13.3 Essential and Non-Essential Metals ......................................................... 20
1.13.4 Role of Metals in the Body of an Organism ............................................ 20
1.13.5 Heavy Metals Pollution in River Kabul ................................................... 21
1.13.6 Hazards of Heavy Metals ......................................................................... 23
a. Effects on Fish Fauna....................................................................... 23
b. Effects on Human Beings ................................................................ 24
1.14 Aims and Objectives ........................................................................................ 27
1.15 Data Interpretation and Significance ............................................................... 28
CHAPTER-2 ............................................................................................................... 29
LITERATURE REVIEW ......................................................................................... 29
2.1 Water Analysis ................................................................................................. 29
2.2 Bioaccumulation .............................................................................................. 34
2.3 Genotoxicity ..................................................................................................... 38
2.4 Histopathology ................................................................................................. 42
CHAPTER-3 ............................................................................................................... 46
PHYSICAL AND CHEMICAL PROPERTIES OF WATER COLLECTED
FROM THE RIVER KABUL ................................................................................... 46
3.1 Introduction ...................................................................................................... 46
3.1.1 Physico-chemical Parameters ..................................................................... 46
3.1.2 Heavy Metal Parameters .......................................................................... 50
3.2 Materials and Methods ..................................................................................... 53
3.2.1 Study Area Description ............................................................................ 53
3.2.2 Sampling Sites ......................................................................................... 53
3.2.3 Sampling Points ....................................................................................... 54
3.2.4 Water sample from Warsak Dam ............................................................. 56
3.2.5 Water samples from the main River ........................................................ 56
3.2.6 Collection of water samples ..................................................................... 56
viii
3.2.7 Preservation of water samples ................................................................. 56
3.2.8 Water analysis .......................................................................................... 57
3.2.9 Physico-Chemical Parameters ................................................................. 57
3.2.9.1 pH ......................................................................................................... 57
3.2.9.2 Electrical Conductivity ........................................................................ 58
3.2.9.3 Total Dissolved Solid (TDS) ............................................................... 58
3.2.9.4 Total Suspended Solid (TSS) ............................................................... 58
3.2.9.5 Chloride................................................................................................ 58
3.2.9.6 Total Alkalinity .................................................................................... 59
3.2.9.7 Sodium and Potassium ......................................................................... 59
3.2.10 Heavy Metals Parameters ........................................................................ 59
3.2.11 Statistical Analysis ................................................................................... 61
3.3 Result and Discussion ...................................................................................... 61
3.3.1 Water Analysis of River Kabul ................................................................ 61
3.3.1.1 Warsak dam upstream water from site 3 (Sample A= Control)....... 62
a. Physico-Chemical Parameters ......................................................... 62
b. Heavy Metals Parameters ................................................................ 70
3.3.1.2 Polluted River Kabul water from site 4 receiving sewages (Water
sample-B) ......................................................................................................... 73
a. Physico-Chemical Parameters ......................................................... 73
b. Heavy Metals Parameters ................................................................ 82
3.3.1.3 Polluted River Kabul water from site 1 receiving effluents (Water
sample C) ......................................................................................................... 85
a. Physico-Chemical Parameters ......................................................... 85
b. Heavy Metals Parameters ................................................................ 89
3.3.1.4 Polluted River Kabul water from site 2 receiving city sewage (Water
sample D) ......................................................................................................... 92
a. Physico-Chemical Parameters ......................................................... 92
b. Heavy Metals Parameters ................................................................ 95
3.3.1.5 Conclusions and Remarks .................................................................... 99
CHAPTER-4 ............................................................................................................. 103
BIOACCUMULATION OF HEAVY METALS IN SELECTED FISH SPECIES
OF RIVER KABUL ................................................................................................. 103
4.1 Introduction .................................................................................................... 103
4.2 Materials and Methods ................................................................................... 109
4.2.1 Study Area ............................................................................................. 109
4.2.2 Fish Sampling Sites................................................................................ 109
4.2.3 Collection of Fish Samples .................................................................... 109
ix
4.2.4 Collection and Preservation of Fish Tissues .......................................... 112
4.2.5 Tissue Digestion..................................................................................... 112
4.2.6 Determination of Heavy Metals ............................................................. 112
4.2.7 Statistical Analysis ................................................................................. 113
4.3 Result and Discussion .................................................................................... 114
4.3.1 Bioaccumulation of Heavy Metals in Gills ............................................ 114
4.3.2 Bioaccumulation of Heavy Metals in Skin ............................................ 126
4.3.3 Bioaccumulation of Heavy Metals in Intestine ...................................... 140
4.3.4 Bioaccumulation of Heavy Metals in Liver ........................................... 152
4.3.5 Bioaccumulation of Heavy Metals in Muscle ........................................ 163
4.3.6 Sequences of Metals Bioaccumulation .................................................. 177
4.3.7 Conclusions and Remarks ...................................................................... 180
CHAPTER-5 ............................................................................................................. 183
GENOTOXIC EFFECTS OF HEAVY METALS IN SELECTED FISH
SPECIES OF RIVER KABUL ............................................................................... 183
5.1 Introduction .................................................................................................... 183
5.2 Methods and Materials ................................................................................... 189
5.2.1 Study Area ............................................................................................. 189
5.2.2 Fish Sampling Sites................................................................................ 189
5.2.3 Collection of the Fish Samples .............................................................. 189
5.2.4 Collection and Preservation of Fish Tissues .......................................... 189
5.2.5 Comet Assay .......................................................................................... 190
5.2.5.1 Preparation of different solutions for comet assay ............................ 190
5.2.5.2 Lysing solution................................................................................... 190
5.2.5.3 Final lysing solution ........................................................................... 190
5.2.5.4 Phosphate buffer saline (PBS) ........................................................... 190
5.2.5.5 Preparation of stock solutions ............................................................ 190
5.2.5.6 Electrophoresis buffer ........................................................................ 191
5.2.5.7 Neutralization buffer .......................................................................... 191
5.2.5.8 Staining solution ................................................................................ 191
5.2.5.9 Stock solution..................................................................................... 191
5.2.5.10 Working solution ............................................................................. 191
5.2.5.11 Preparation of 1% and 0.5 % LMPA and 1% NMA ........................ 191
5.2.5.12 Preparation of base slides ................................................................. 191
5.2.5.13 Layering of cells and LMPA on base slides .................................... 191
5.2.5.14 Placing of slides in final lysing solution .......................................... 192
5.2.5.15 Electrophoresis of slides .................................................................. 192
x
5.2.5.16 Neutralization of slides .................................................................... 192
5.2.5.17 Drying of slides ................................................................................ 192
5.2.5.18 Rehydration and staining of slides ................................................... 193
5.2.5.19 Scoring of slides and visualization of DNA damage ....................... 193
5.2.5.20 Comet Classes .................................................................................. 193
5.2.5.21 Statistical analysis ............................................................................ 193
5.3 Results and Discussion .................................................................................. 194
5.3.1 TCS and Comet Classes in Blood .......................................................... 194
5.3.2 TCS and Comet Classes in Gills ............................................................ 203
5.3.3 TCS and Comet Classes in Skin ............................................................ 213
5.3.4 TCS and Comet Classes in Intestine…………………………………..222
5.3.5 TCS and Comet Classes in Liver ........................................................... 231
5.3.6 TCS and Comet Classes in Muscle ........................................................ 240
5.3.7 Sequences of TCS and Comet Classes................................................... 250
5.3.8 Conclusions and Remarks ...................................................................... 253
CHAPTER-6 ............................................................................................................. 255
HISTOPATHOPLOGIC EFFECTS OF HEAVY METALS IN SELECTED
FISH SPECIES OF RIVER KABUL ..................................................................... 255
6.1 Introduction .................................................................................................... 255
6.2 Methods and Materials ................................................................................... 261
6.2.1 Study Area ............................................................................................. 261
6.2.2 Fish Sampling Sites................................................................................ 261
6.2.3 Collection of Fish Samples .................................................................... 261
6.2.4 Collection and Preservation of Fish Tissues .......................................... 261
6.2.5 Procedure ............................................................................................... 261
6.2.6 Preparation of Solutions for Tissue Processing ..................................... 261
6.2.7 Preparation of Fixative Solution ............................................................ 262
6.2.8 Preparation of PBS ................................................................................. 262
6.2.9 Preparation of 10% NBF ........................................................................ 262
6.2.10 Preparation of Different Ethanol Solutions............................................ 262
6.2.10.1 50% Ethanol solution ....................................................................... 262
6.2.10.2 70% Ethanol solution ....................................................................... 262
6.2.10.3 80% Ethanol solution ....................................................................... 262
6.2.10.4 90% Ethanol solution ....................................................................... 262
6.2.10.5 95% Ethanol solution ....................................................................... 262
6.2.11 Preparation of Alcohol-Xylene Solution ............................................... 262
6.2.12 Preparation of Xylene-Paraffin Solution ............................................... 262
xi
6.2.13 Preparation of Different Solutions for Staining ..................................... 262
6.2.13.1 Mayer’s Albumin ............................................................................. 262
6.2.13.2 Harris Hematoxylin Stain ................................................................ 262
6.2.13.3 Eosin Stain ....................................................................................... 263
6.2.13.4 Eosin-Y Stock Solution.................................................................... 263
6.2.13.5 Phloxine-B Stock Solution ............................................................... 263
6.2.13.6 Eosin-Phloxine Working Solution ................................................... 263
6.2.13.7 1% Acid-Alcohol Solution ............................................................... 263
6.2.13.8 1000mL Ammonia Solution ............................................................ 263
6.2.14 Tissue Processing ................................................................................... 263
6.2.15 Tissues Fixation ..................................................................................... 263
6.2.16 Tissues Dehydration............................................................................... 263
6.2.17 Clearing of Tissues ................................................................................ 264
6.2.18 Paraffin Infiltration of Tissues ............................................................... 264
6.2.19 Embedding of Tissues ............................................................................ 264
6.2.20 Sectioning of Tissues ............................................................................. 264
6.2.21 Staining of Tissues ................................................................................. 264
6.2.22 Observation of Tissues under Microscope ............................................. 265
6.2.23 Statistical Analysis ................................................................................. 265
6.3 Result and Discussion .................................................................................... 265
6.3.1 Histopathological Lesions in Intestine ................................................... 266
6.3.2 Histopathological Lesions in Liver ........................................................ 277
6.3.3 Histopathological Lesions (%) in Gills .................................................. 288
6.3.4 Histopathological Lesions (%) in Muscle .............................................. 300
6.3.5 Sequences of Histopathological Conditions (%) ................................... 310
6.3.7 Conclusions and Remarks ...................................................................... 312
CHAPTER-7 ............................................................................................................. 314
CONCLUSIONS AND RECOMMENDATIONS ................................................. 314
7.1 Conclusions .................................................................................................... 314
7.2 Recommendations .......................................................................................... 315
REFERENCES ......................................................................................................... 317

xii
LIST OF TABLES
Tables No Title Page No
Table 3.1 Operating data of Atomic Absorption Spectrophotometer for
determination of metals……………………………………..………..61
Table 3.2 Physico-chemical characteristics of water sample A from Warsak
dam during low (winter) and high (summer) flows during 2012-
2014……..........................…………………………………………..65
Table 3.3 Heavy metals concentration of water sample A from Warsak dam
during low (winter) and high (summer) flows during 2012-2014……72
Table 3.4 Physico-chemical characteristics of water sample B from River
Kabul upstream to the confluence point during low (winter) and
high (summer) flows during 2012-2014……………………………...76
Table 3.5 Heavy metals concentration of water sample B from River Kabul
upstream to the confluence point during low (winter) and high
(summer) flows during 2012-2014…………………………………...84
Table 3.6 Physico-chemical characteristics of water sample C from River
Kabul downstream to the confluence point during low (winter)
and high (summer) flows during 2012-2014………………………....88
Table 3.7 Heavy metals concentration of water sample C from River Kabul
downstream to the confluence point during low (winter) and high
(summer) flows during 2012-2014……………………….……… 91

xiii
Table 3.8 Physico-chemical characteristics of water sample D, downstream
to C during low (winter) and high (summer) flows during 2012-
2014……………………………..........................................................94
TTable 3.9 Heavy metals concentration of water sample D, downstrea to
C during low (winter) and high (summer) flows during 2012-2014....98
Table 3.10 Physico-chemical and heavy metals contents of water sample-A
from Warsak dam (control), water sample-B from River Kabul
upstream to the confluence point, water sample C from River
Kabul downstream to the confluence point and water sample-D
from River Kabul downstream of C during low flow (winter)
2012-2014 ………….……………………………………………...101
Table 3.11 Physico-chemical and heavy metals contents of water sample A
from Warsak dam (control), water sample B from River Kabul
upstream to the confluence point, water sample C from River
Kabul downstream to the confluence point and water sample D
from River Kabul downstream of C during high flow (summer)
2012-2014 …………………………………………………………102
Table 4.1 Operating data of Atomic Absorption Spectrophotometer for
determination of metals……………………………………...……...113
Table 4.2 Heavy metal concentrations (µg/g wet weight) in gills of five different
fish species netted from site 3 (control) and site 1 and site 2 (polluted)
of River Kabul receiving city sewages and industrial effluents….....122
Table 4.3 Heavy metal concentrations (µg/g wet weight) in skin of five different
fish species netted from site 3 (control) and site 1 and site 2 (polluted)
of River Kabul receiving city sewages and industrial effluents…….135

xiv
Table 4.4 U.S Recommended Daily Diatary Allowance (RDA) supplied by
a 100g of fish skin……………………………………...................... 136
Table 4.5 Heavy metal concentrations (µg/g wet weight) in intestine of five
different fish species netted from site 3 (control) and site 1 and site 2
(polluted) of River Kabul receiving city sewages and industrial
effluents……………………………………………………………..148
Table 4.6 Heavy metal concentrations (µg/g wet weight) in liver of five different
fish species netted from site 3 (control) and site 1 and site 2 (polluted)
of River Kabul receiving city sewages and industrial effluents…….159
Table 4.7 Heavy metal concentrations (µg/g wet weight) in muscle of five
different fish species netted from site 3 (control) and site 1
and site 2 (polluted) of River Kabul receiving city sewages and
industrial effluents…………………………………………………..172
Table 4.8 U.S Recommended Daily Diatary Allowance (RDA) supplied by
a 100g of fish muscle………..……………………………………....173
Table 5.1 Degree of total comet score (TCS) and comet classes in blood of
five different fish species netted site 3 (control) and site 1
and site 2 (polluted) of River Kabul receiving city sewages and
industrial effluents…………………………………………………..199
Table 5.2 Degree of total comet score (TCS) and comet classes in gills of five
different fish species netted from site 3 (control) and site 1 and site 2
(polluted) of River Kabul receiving city sewages and industrial
effluents……………………………………………………………..209
Table 5.3 Degree of total comet score (TCS) and comet classes in skin of five
different fish species netted from site 3 (control) and site 1 and site 2

xv
(polluted) of River Kabul receiving city sewages and industrial
effluents……………………………………………………………..218
Table 5.4 Degree of total comet score (TCS) and comet classes in intestine
of five different fish species netted from site 3 (control) and site 1 and
site 2 (polluted) of River Kabul receiving city sewages
and industrial effluents……………………………………………... 227
Table 5.5 Degree of total comet score (TCS) and comet classes in liver of
five different fish species netted from site 3 (control) and site 1 and site
2 (polluted) of River Kabul receiving city sewages
and industrial effluents……………………………………………... 236
Table 5.6 Degree of total comet score (TCS) and comet classes in muscle of
five different fish species netted from site 3 (control) and site
1 and site 2 (polluted) of River Kabul receiving city sewages and
industrial effluents……………………………................................245
Table 6.1 Histopathological lesions (%) in intestine of five different fish
species netted from site 3 (control) and site 1 and site 2
(polluted) of River Kabul receiving city sewages and industrial
effluents……………………………………………………………..270
Table 6.2 Histopathological lesions (%) in livers of five different fish species
netted from site 3 (control) and site 1 and site 2 (polluted) of
River Kabul receiving city sewages and industrial effluents ……....281
Table 6.3 Histopathological lesions (%) in gills of five different fish species
netted from site 3 (control) and site 1 and site 2 (polluted) of
River Kabul receiving city sewages and industrial effluents ……....292
xvi
Table 6.4 Histopathological lesions (%) in muscle of five different fish
species netted from site 3 (control) and site 1 and site 2
(polluted) of River Kabul receiving city sewages and industrial
effluents……………………………………………………………..304
xvii
LIST OF FIGURES
Figure Title Page
No
1.1 The River Kabul and its tributaries……………………………. 4
1.2 Photograph showing Wallago attu………………………………… 9
1.3 Photograph showing Labeo dyocheilus…………………………… 10
1.4 Photograph showing Cyprinus carpio…………………………..... 11
1.5 Photograph showing Ompok bimaculatus……………………… 12
1.6 Photograph showing Aorichthys seenghala……………………… 13
3.1 Water sampling site 4 (water sample B), site 1 (water sample
C) and site 2 (water sample D) at River Kabul (polluted
samples) and site 3 (water sample A) in Warsak dam (control
sample)…………………………………………………………. 55
3.2 Comparative physico-chemical parameters concentration of pH
and total suspended solid of water samples from Warsak dam
and main River Kabul during low and high flows……………... 66
3.3 Comparative physico-chemical parameters concentration of
total dissolved solid and electrical conductivity of water
samples from Warsak dam and main River Kabul during low
and high flows…………………………………………………. 67
3.4 Comparative Physico-chemical parameters concentration of
chloride and potassium of water samples from Warsak dam
and main River Kabul during low and high flows…………… 68

xviii
3.5 Comparative Physico-chemical parameters concentration of
sodium and total alkalinity of water samples from Warsak dam
and main River Kabul during low and high flows…………… 69
3.6 Comparative heavy metals concentration of zinc and nickel in
water samples from Warsak dam and main River Kabul during
low and high flows…………………………………………….. 77
3.7 Comparative heavy metals concentration of chromium and
copper in water samples from Warsak dam and main River
Kabul during low and high flows……………………………… 78
3.8 Comparative heavy metals concentration of lead and cadmium
in water samples from Warsak dam and main River Kabul
during low and high flows……………………………………... 79
3.9 Comparative heavy metals concentration of iron and
manganese in water samples from Warsak dam and main River
Kabul during low and high flows……………………………… 80
3.10 Comparative heavy metals concentration of mercury in water
samples from Warsak dam and main River Kabul during low
and high flows…………………………………………………. 81
4.1 Fish sampling sites 1 and 2 at River Kabul (polluted samples)
and site 3 in Warsak dam (control sample)……………………. 111
4.2 Heavy metal concentrations in gills of Wallago attu and
Aorichthys seenghala netted from site 3 (control) and site 1
and site 2 (polluted) of River Kabul receiving city sewages and
industrial effluents……………………………………………... 123
4.3 Heavy metal concentrations in gills of Labeo dyocheilus and

xix
Cyprinus carpio netted from site 3 (control) and site 1 and site
2 (polluted) of River Kabul receiving city sewages and
industrial effluents……………………………………………
124
4.4 Heavy metal concentrations in gills of Ompok bimaculatus
netted from site 3 (control) and site 1 and site 2 (polluted) of
River Kabul receiving city sewages and industrial
effluents….................................................................................. 125
4.5 Heavy metal concentrations in skin of Wallago attu and
Aorichthy Seenghala netted from site 3 (control) and site 1 and
site 2 (polluted) of River Kabul receiving city sewages and
industrial effluents……………………………………………... 137
4.6 Heavy metal concentrations in skin of Labeo dyocheilus and
Cyprinus carpio netted from site 3 (control) and site 1 and site
2 (polluted) of River Kabul receiving city sewages and
industrial effluents……………………………………………... 138
4.7 Heavy metal concentrations in skin of Ompok bimaculatus
netted from site 3 (control) and site 1 and site 2 (polluted) of
River Kabul receiving city sewages and industrial effluents…. 139
4.8 Heavy metal concentrations in intestine of Wallago attu and
Aorichthys seenghala netted from site 3 (control) and site 1
and site 2 (polluted) of River Kabul receiving city sewages and
industrial effluents…………………………………………….. 149
4.9 Heavy metal concentrations in intestine of Labeo dyocheilus
and Cyprinus carpio netted from site 3 (control) and site 1 and
site 2 (polluted) of River Kabul receiving city sewages and
industrial effluents……………………………………………..
150
xx
4.10 Heavy metal concentrations in intestine of Ompok bimaculatus
netted from site 3 (control) and site 1 and site 2 (polluted) of
River Kabul receiving city sewages and industrial effluents….. 151
4.11 Heavy metal concentrations in liver of Wallago attu and
Aorichthys seenghala netted from site 3 (control) and site 1
and site 2 (polluted) of River Kabul receiving city sewages and
industrial effluents…………………………………………….. 160
4.12 Heavy metal concentrations in liver of Labeo dyocheilus and
Cyprinus carpio netted from site 3 (control) and site 1 and site
2 (polluted) of River Kabul receiving city sewages and
industrial effluents…………………………………………….. 161
4.13 Heavy metal concentrations in liver of Ompok bimaculatus
netted from Warsak dam (site 3) and two polluted sites (Site 1
and Site 2) of River Kabul receiving city sewages and
industrial effluents…………………………………………….. 162
4.14 Heavy metal concentrations in muscle of Wallago attu and
Aorichthys seenghala netted from site 3 (control) and site 1
and site 2 (polluted) of River Kabul receiving city sewages and
industrial effluents…………………………………………….. 174
4.15 Heavy metal concentrations in muscle of Labeo dyocheilus and
Cyprinus carpio netted from site 3 (control) and site 1 and site
2 (polluted) of River Kabul receiving city sewages and
industrial effluents……………………………………………...
175
4.16 Heavy metal concentrations in muscle of Ompok bimaculatus
netted from site 3 (control) and site 1 and site 2 (polluted) of
xxi
River Kabul receiving city sewages and industrial effluents…. 176
5.1 Degree of total comet score (TCS) and comet classes in blood
of Wallago attu and Aorichthys seenghala netted from site 3
(control) and site 1 and site 2 (polluted) of River Kabul
receiving city sewages and industrial effluents………………... 200
5.2 Degree of total comet score (TCS) and comet classes in blood
of Labeo dyocheilus and Cyprinus carpio netted from site 3
(control) and site 1 and site 2 (polluted) of River Kabul
receiving city sewages and industrial effluents……………….. 201
5.3 Degree of total comet score (TCS) and comet classes in blood
of Ompok bimaculatus and netted from site 3 (control) and site
1 and site 2 (polluted) of River Kabul receiving city sewages
and industrial effluents………………………………………… 202
5.4 Degree of total comet score (TCS) and comet classes in gills of
Wallago attu and Aorichthys seenghala netted from site 3
(control) and site 1 and site 2 (polluted) of River Kabul
receiving city sewages and industrial effluents………………... 210
5.5 Degree of total comet score (TCS) and comet classes in gills of
Labeo dyocheilus and Cyprinus carpio netted from site 3
(control) and site 1 and site 2 (polluted) of River Kabul
receiving city sewages and industrial effluents………………. 211
5.6 Degree of total comet score (TCS) and comet classes in gills of
Ompok bimaculatus netted from site 3 (control) and site 1 and
site 2 (polluted) of River Kabul receiving city sewages and
industrial effluents……………………………………………. 212

xxii
5.7 Degree of total comet score (TCS) and comet classes in skin of
Wallago attu and Aorichthys seenghala netted from site 3
(control) and site 1 and site 2 (polluted) of River Kabul
receiving city sewages and industrial effluents……………….. 219
5.8 Degree of total comet score (TCS) and comet classes in skin of
Labeo dyocheilus and Cyprinus carpio netted from site 3
(control) and site 1 and site 2 (polluted) of River Kabul
receiving city sewages and industrial effluents………………. 220
5.9 Degree of total comet score (TCS) and comet classes in gills of
Ompok bimaculatus and netted from site 3 (control) and site 1
and site 2 (polluted) of River Kabul receiving city sewages and
industrial effluents……………………………………………... 221
5.10 Degree of total comet score (TCS) and comet classes in
intestine of Wallago attu and Aorichthys seenghala netted from
site 3 (control) and site 1 and site 2 (polluted) of River Kabul
receiving city sewages and industrial effluents……………….. 228
5.11 Degree of total comet score (TCS) and comet classes in
intestine of Labeo dyocheilus and Cyprinus carpio netted from
site 3 (control) and site 1 and site 2 (polluted) of River Kabul
receiving city sewages and industrial effluents……………….. 229
5.12 Degree of total comet score (TCS) and comet classes in
intestine of Ompok bimaculatus netted from site 3 (control)
and site 1 and site 2 (polluted) of River Kabul receiving city
sewages and industrial effluents………………………………
230
5.13 Degree of total comet score (TCS) and comet classes in liver of
Wallago attu and Aorichthys seenghala netted from site 3

xxiii
(control) and site 1 and site 2 (polluted) of River Kabul
receiving city sewages and industrial effluents………………..
237
5.14 Degree of total comet score (TCS) and comet classes in liver of
Labeo dyocheilus and Cyprinus carpio netted from site 3
(control) and site 1 and site 2 (polluted) of River Kabul
receiving city sewages and industrial effluents………………. 238
5.15 Degree of total comet score (TCS) and comet classes in liver of
Ompok bimaculatus netted from site 3 (control) and site 1 and
site 2 (polluted) of River Kabul receiving city sewages and
industrial effluents…………………………………………… 239
5.16 Degree of total comet score (TCS) and comet classes in muscle
of Wallago attu and Aorichthys seenghala netted from site 3
(control) and site 1 and site 2 (polluted) of River Kabul
receiving city sewages and industrial effluents………………. 246
5.17 Degree of total comet score (TCS) and comet classes in muscle
of Labeo dyocheilus and Cyprinus carpio netted from site 3
(control) and site 1 and site 2 (polluted) of River Kabul
receiving city sewages and industrial effluents……………….. 247
5.18 Degree of total comet score (TCS) and comet classes in muscle
of Ompok bimaculatus netted from site 3 (control) and site 1
and site 2 (polluted) of River Kabul receiving city sewages and
industrial effluents…………………………………………….
248
5.19 Images showing different comet classes that are induced as a
result of heavy metals accumulation in different tissues of
fish…………………………………………………………….. 249

xxiv
6.1 Histopathological lesions (%) in intestine of Wallago attu and
Aorichthys seenghala netted from site 3 (control) and site 1
and site 2 (polluted) of River Kabul receiving city sewages and
industrial effluents…………………………………………….. 271
6.2 Histopathological lesions (%) in intestine of Labeo dyocheilus
and Cyprinus carpio netted from site 3 (control) and site 1 and
site 2 (polluted) of River Kabul receiving city sewages and
industrial effluents……………………………………………... 272
6.3 Histopathological lesions (%) in intestine of Ompok
bimaculatus netted from site 3 (control) and site 1 and site 2
(polluted) of River Kabul receiving city sewages and industrial
effluents……………………………………………………….. 273
6.4 Image showing normal epithelium, normal cillia of epithelium
and degeneration of cillia in intestinal epithelium…………….. 274
6.5 Image showing degeneration of intestinal epithelium………… 274
6.6 Image showing complete degeneration of cillia of epithelium… 275
6.7 Image showing coagulative necrosis in intestinal epithelium… 275
6.8 Image showing inflammation in intestine……………………. 276
6.9 Histopathological lesions (%) in liver of Wallago attu and
Aorichthys seenghala netted from site 3 (control) and site 1
and site 2 (polluted) of River Kabul receiving city sewages and
industrial effluents……………………………………………..
282
6.10 Histopathological lesions (%) in liver of Labeo dyocheilus and
Cyprinus carpio netted from site 3 (control) and site 1 and site

xxv
2 (polluted) of River Kabul receiving city sewages and
industrial effluents……………………………………………...
283
6.11 Histopathological lesions (%) in liver of Ompok bimaculatus
netted from site 3 (control) and site 1 and site 2 (polluted) of
River Kabul receiving city sewages and industrial effluents….. 284
6.12 Image showing normal liver cells and coagulative necrosis in
liver……………………………………………………………. 285
6.13 Image showing non-specific inflammation in liver cells…….. 285
6.14 Image showing liquefactive necrosis in liver cells…………….. 286
6.15 Image showing spongiosis necrosis in liver cells…………….. 286
6.16 Image showing hydyropic degeneration in liver cells………… 287
6.17 Image showing inflammation in liver cells……………………. 287
6.18 Histopathological lesions (%) in gills of Wallago attu and
Aorichthys seenghala netted from site 3 (control) and site 1
and site 2 (polluted) of River Kabul receiving city sewages and
industrial effluents……………………………………………... 293
6.19 Histopathological lesions (%) in gills of Labeo dyocheilus and
Cyprinus carpio netted from site 3 (control) and site 1 and site
2 (polluted) of River Kabul receiving city sewages and
industrial effluents……………………………………………...
294
6.20 Histopathological lesions (%) in gills of Ompok bimaculatus
netted from site 3 (control) and site 1 and site 2 (polluted) of
River Kabul receiving city sewages and industrial effluents….. 295
6.21 Image of gills showing normal primary and secondary gills 296

xxvi
lamellae…………………………………………………………
6.22 Image showing the disquamation of gills epithelium…………. 296
6.23 Image showing the non-specific inflammation in gills lamellae. 297
6.24 Image showing vacuolization and oedema in gills epithelium… 297
6.25 Image showing disquamation and distortion of secondary gills
lamellae with epithelial cells exudate……………………. 298
6.26 Image showing clumping of secondary gills lamellae………… 298
6.27 Image showing necrosis in primary gills lamellae (arrow)…… 299
6.28 Histopathological lesions (%) in muscle of Wallago attu and
Aorichthys seenghala netted from site 3 (control) and site 1
and site 2 (polluted) of River Kabul receiving city sewages and
industrial effluents……………………………………………... 305
6.29 Histopathological lesions (%) in muscle of Labeo dyocheilus
and Cyprinus carpio netted from site 3 (control) and site 1 and
site 2 (polluted) of River Kabul receiving city sewages and
industrial effluents……………………………………………... 306
6.30 Histopathological lesions (%) in muscle of Ompok bimaculatus
netted from site 3 (control) and site 1 and site 2 (polluted) of
River Kabul receiving city sewages and industrial effluents…..
307
6.31 Image showing normal muscle tissue (below) and
inflammation in same tissue (above)…………………………... 308
6.32 Image showing coagulative necrosis in muscle tissues………... 308
6.33 Image showing coagulative necrosis in muscle tissues………... 309
6.34 Image showing non-specific inflammation in muscle tissues…. 309

xxvii
LIST OF ABBREVIATION
AAC: Air acetylene LMPA: Low melting point agarose
ADD: Average daily doses LN: Liquefactive necrosis
Kcl: Potassium chloride Mn: Manganese
Ag: Silver MW: Mega watt
As: Arsenic NA: Necrotic area
Ba: Barilium Na: Sodium
B: Boran NaCl: Sodium chloride
CDC: Complete degeneration of cillia. NaOH: Sodium hydroxide
Co: Cobalt NBF: Neutrally buffered formalin
CW: Constructed wetland NEQS: National and environmental
CGL: Clumping of gills lamellae quality standards
Cl: Chloride Ni: Nickel
CN: Coagulative necrosis CRL: Centralized Resource Laboratory
NMA: Normal melting agarose NSI: Non specific inflammation
Cr: Chromium OD: Optical density
Cu: Copper Pb: Lead
DE: Degeneration of epithelium. PBS: Phosphate buffered saline
DC: Degenerative cillia PCA: Principal component analysis
DMSO: Dimethylsulfoxide pH: Power of hydrogen
DNA: Deoxyribo nucleic acid R: Fuel-rich
EC: Electrical conductivity RDA: Recommended daily dietary
EDTA: Ethylene diemine tetra acitic acid allowance
ED: Epithelial disquamation Se: Selinium
Fe: Iron SH: Spongiosis hepatis
FD: Fibrillar degeneration S.S: Stainless steel
GAIE: Gadoon Amazai Industrial Estate Sr: Stroncium
HCl: Hydrochloric acid TA: Total alkalinity
HD: Hydropic degeneration TCS: Total comet score
Hg: Mercury TDS: Total dissoled solid
INF: Inflammation TSS: Total suspended solid
K: Potassium VO: Vacuolation and oedema
KH2PO4: Potassium phosphate monobasic WHO: World health organization
KPK: Khyber Pakhtonkhowa WQI: Water quality indices
L: Fuel-lean Zn: Zinc
xxviii
PREFACE
The main objectives of the present thesis were to study physico-chemical and
heavy metal contaminations in water and heavy metals accumulation and toxicity in
selected fish species of River Kabul and to achieve these objectives, the thesis
research work has been divided into seven chapters; each chapter is focused on
specific objectives in details.They are as following.
First Chapter deals with introduction of this study. This chapter introduced the study
area along with aims and objectives and justification of this study.
Second Chapter describes literature reviews that explain related studies reported by
the environmental scientists in the world.
Third Chapter focuses on the physio-chemical parameters slike pH, total suspended
solid (TSS), total dissolved solid (TDS), total alkalinity (TA), chloride (Cl), electrical
conductivity (EC), sodium (Na) and potassium (K) and heavy metals such as zinc
(Zn), nickel (Ni), chromium (Cr), copper (Cu), cadmium (Cd), lead (Pb), iron (Fe),
manganese (Mn) and mercury (Hg) in the drinking water of River Kabul. This
chapter further used statistical analysis for source apportionment of the
contaminations in drinking water.
Fourth Chapter describes bioaccumulation of heavy metals including zinc, nickel,
chromium, copper, cadmium, lead, iron, manganese and mercury in different tissues
and organs of selected fish species of River Kabul. One paper from the data of this
chapter entitled; Bioaccumulation of heavy metals in different organs of Wallago
attu from River Kabul Khyber Pukhton Khowa, Pakistan; has been published in
Biological Trace Element Research international Journal.
Fifth Chapter focuses on genotoxicological impacts of heavy metals in different
tissues and organs of selected fish species of River Kabul.This chapter further
determined different degree of DNA damage like total comet score (TCS), comet
class 0, class 1, class 2, class 3 and class 4 in order to assess the risk for human life
and environmental impact.
Sixth Chapter describes histopathological impacts of heavy metals in different
tissues and organs of selected fish species of River Kabul. Further more in this
chapter different pathological abnormalities were investigated to assess the

xxix
pathological impacts of heavy metals as a risk for human beings. This dissertation
includes the conclusions and recommendations based on personal study. References
of all the chapters are given at the end.
Seventh Chapter deals with conclusions and recommendations of this research
works.

xxx
ABSTRACT
The main objectives of this work were to investigate physico-chemical and
heavy metal contaminations in water and heavy metals accumulation and toxicity in
selected fish species of River Kabul. For this purpose water sample A (control site 3),
water sample B (polluted site 4), water sample C (polluted site 1) and water sample D
(polluted site 2) upstream and downstream of River Kabul were collected during low
and high flow periods and analyzed for eight physico-chemical parameters (pH, TSS,
TDS, TA, Cl, K, EC, Na) and nine heavy metals (Zn, Ni, Cr, Cu, Cd, Pb, Mn, Fe, Hg)
and compared with water sample A and NEQS recommended limits. All the studied
physico-chemical and heavy metal parameters in water samples A, B, C and D except
TSS and Hg were below the NEQS proposed limits, where the values of TSS and Hg
were above the NEQS recommended limits in all the water samples A, B, C and D.
Thus the overall sequence of different water samples was D > C > B > A. This
highlights that water sample D had higher and sample A had lower physico-chemical
and heavy metal contaminations. Water samples A and B had highest TDS and lowest
K for low flow and had highest TSS and lowest K for high flow seasons. Similarly
water samples C and D showed highest TDS and lowest pH for low flow and showed
higher TSS and lower K for high flow periods. Among heavy metals water sample A
had highest Zn and lowest Pb for both low and high flow periods. Water sample B
showed higher Zn and lower Hg for low flow and greater Zn and smaller Cu for high
flow periods. Similarly water samples C and D had greater Zn and smaller Cr for low
flow and higher Zn and lower Cu for high flow seasons, respectively.
This investigation was further aimed to determine bioaccumulation of heavy
metals including Zn, Ni, Cr, Cu, Cd, Pb, Mn, Fe and Hg in intestine, skin, liver, gills
and muscle of Wallago attu, Ompok bimaculatus, Cyprinus carpio, Labeo dyocheilus
and Aorichthys seenghala of River Kabul and compared with permissible limits of
RDA. Overall accumulation of metals in Wallago attu was highest in skin and lowest
in liver, in Aorichthys seenghala was higher in skin and lower in intestine, in Labeo

xxxi
dyocheilus was high in skin and low in muscle, in Cyprinus carpio was maximum in
intestine and minimum in muscle and in Ompok bimaculatus was more in gills and
less in muscle. Thus overall order of heavy metals concentration in different fish
organs was intestine > skin > liver > gills > muscle and in different fish spcies was
Cyprinus carpio >Ompok bimaculatus >Aorichthys seenghala >Labeo dyocheilus
>Wallago attu. This shows that highest metals accumulated organ was intestine and
fish was Cyprinus carpio while lowest metals accumulated tissue was muscle and fish
was Wallago attu. Overall order of metals concentration in different tissues showed
that Zn was the highly and Cd was the lowest accumulated metals. Comparing this
result with RDA renders that in skin Zn, Ni, Cr, Cd, Pb and Hg and in muscle Ni, Cr,
Cd, Pb and Hg levels were above the RDA recommended limits.
Further more the present investigation was conducted to assess
genotoxicological impacts of heavy metals in various tissues and organs of selected
fish species. Therefore degree of DNA damage like TCS and comet class 0, class 1,
class 2, class 3 and class 4 were determined in blood, intestine, skin, gills, liver and
muscle cells of Wallago attu, Ompok bimaculatus, Labeo dyocheilus, Cyprinus carpio
and Aorichthys seenghala of River Kabul. Overall degree of DNA damage cells in
Wallago attu were highest in blood and lowest in muscle, in Aorichthys seenghala
were greatest in intestine and smallest in muscle, in Labeo dyocheilus were more in
blood and less in muscle, in Cyprinus carpio were high in blood and low in muscle
and in Ompok bimaculatus were maximum in intestine and minimum in muscle.
Overall trend of DNA damage cells in different tissues was intestine > blood > skin >
liver > gills > muscle and in different fish species was Cyprinus carpio >Ompok
bimaculatus >Aorichthys seenghala >Labeo dyocheilus >Wallago attu. This indicates
that highest degree of DNA damage cells were found in intestine and lowest in
muscle. Similarly higher frequency of DNA damage cells was observed in Cyprinus
carpio and lowest in Wallago attu.
This study was further meant to investigate histopathological impacts of heavy
metals in various tissues and organs like intestine, gills, liver and muscle of Wallago
xxxii
attu, Ompok bimaculatus, Labeo dyocheilus, Cyprinus carpio and Aorichthys
seenghala. The observed lesions in intestine of selected studied fish species were
degeneration of epithelium, complete degeneration of cillia, inflammation,
coagulative necrosis and degenerative cillia, in gills were disquamation and distortion
of secondary lamellae with epithelial cell exudate, clumping of gills lamellae, necrotic
area, epithelial disquamation, non specific inflammation, vacuolation and oedema, in
liver were inflammation, hydropic degeneration, coagulative necrosis, non specific
inflammation, liquefactive necrosis and spongiosis hepatis and in muscle were
fibrillar degeneration, inflammation, coagulative necrosis and non specific
inflammation. Overall pathological abnormalities in Wallago attu were the highest in
liver and lowest in the gills, in Aorichthys seenghala were more in liver and less in
gills, in Labeo dyocheilus were maximum in gills and minimum in intestine, in
Cyprinus carpio were higher in intestine and lower in muscle and in Ompok
bimaculatus were greater in liver and smaller in gills. Overall order of different
pathological lesions in different fish organs was liver > intestine >gills > muscle and
in different fish species was Cyprinus carpio >Ompok bimaculatus >Labeo
dyocheilus >Aorichthys seenghala >Wallago attu.This highlights that highest
histopathological disorders were found in liver and lowest in muscle. Similarly
highest pathological alterations were observed in Cyprinus carpio and lowest in
Wallago attu.
Key Words: River Kabul, Physico-chemical parameters, Heavy metals,
Bioaccumulation, Genotoxicity, Histopathology.

1
CHAPTER-1
GENERAL INTRODUCTION
Metals like potassium, calcium, magnesium, cobalt, copper and zinc are some
of the essential metals that can induce toxicity in aquatic and other animals due to
more accumulation in these organisms. Where as other heavy metals like lead,
chromium, nickel and cadmium are highly toxic for the human beings if taken in low
content (Angelova et al., 2004; Haider et al., 2004; Desideri et al., 2010). Different
health problems like physiological and psychological are induced as a result of heavy
metals toxicity (Flora, 2002; Liu et al., 2003). Heavy metals toxicities are related to
its total content, specific chemical form, metal binding state and other properties like
pH, organic matter and soil texture etc (Muhammad et al., 2011). Heavy metals are
the elements, which have different chemical properties and biological functions.
Heavy metals are the elements that have specific gravity. Measurement of density of a
given amount of a solid substance, when it is compared to an equal amount of water is
termed specific gravity (Lide, 1992). Heavy metal commonly called as trace elements
that play an important role in biological systems. They become toxic due to presence
of greater content (Ibok et al., 1989). Transformation of heavy metals in between
water, soil and plants is a portion of biogeochemical cycling processes in the
environment. Different factors like bed rocks weathering and erosion of ore deposits,
mining, smelting, electroplating, fuel production, power transmision, intensive
agriculture, waste water irrigation and sludge dumping impact this cycle (Igwe and
Abia, 2006; Khan et al., 2008; Muhammad et al., 2011).
Mining activities, tailing deposit, acid mines drainage and industrial waste
products can impact the ecosystem and then affect the ecological community and
living things in that ecosystem (Mapanda et al., 2007). Heavy metals can pollute the
water, which can affect the quality of both drinking and irrigation water (Krishna et
2
al., 2009). When these metals enter into the water bodies can affect the water quality
and various living life both plants and animals in water (Tahiri et al., 2005; Antonious
and Snyder, 2007). The heavy metals can enter into the human body through drinking
of polluted water and consumption of contaminated food (Rattan et al., 2005). The
environmental scientists have focused on toxicity, bioaccumulation, source
identification, reclamation and management studies of heavy metals around the world
(Zhou et al., 2008; Muhammad et al., 2011).
1.1 STUDY AREA DESCRIPTION
1.2 RIVER KABUL
River Kabul has its origination from the base of Unai Pass in the Paghman
mountains of Afghanistan. It then flows along the northern side of the Koh-i-Sufaid
range toward east; it passes through Kabul approximately 72km from its origion.
Below Jalalabad, it is joined by the Kunar River (Gress well and Huxley, 1965).
Hindu Kush mountains in Pakistan are the origion source of Chitral River. It enters
into Afghanistan at Arandu and is joined by a branch from Nuristan, where it is called
as the Kunar River. Near Jalalabad, the River Kabul is joined by the Kunar River. The
River Kabul enters Pakistan into through Khyber Agency. Then it flows through the
Khyber and Mohmand Agencies and finally reaches to Warsak dam. Below the dam,
it is divided into three main branches known as Shah Alam, Nagoman and Adezai.
The lands of Peshawar, Charsadda and Nowshera districts are irrigated through these
branches of River Kabul before joining the River Indus at Kund (IUCN, 1994). About
35km below Warsak dam Shah Alam and Nagoman Rivers join each other, while the
Adezi River joins River Swat. All these branches join each other 1km down stream at
Akberpura. At that junction the Bara River also joins it and is known as the main
Kabul River. The Kabul River joins Indus River at the Khairabad about 90km
downstream of Warsak dam. The Adezai River is divided further into other branches
near Larmandi village and these branches have greater volume of water than the other

3
two branches. The sewages from 40 villages containing 150000 populations are
discharged into the River Kabul (IUCN, 1994). The Nagoman River emerges from
Kabul River near Machni and receives effluent from tanneries near Nagoman and
sewages from 27 villages. The River Shah Alam also emerges from Kabul River near
Kander Landi at Daudzai. The Shah Alam River receives all the sewages from
Peshawar and 30 villages are carried into River Kabul through Shah Alam (IUCN,
1994).

4
Fig. 1.1: The River Kabul and its tributaries

5
1.3 WARSAK DAM
It is situated on River Kabul at Warsak and is helping in both irrigation and
electricity production. Its construction completed within 8 years started in 1952 and
ended in 1960 with the technical and financial assistance of the Canadian
Government. It is 750 feet long and 235 feet high. Its water reservoir capacity is about
26 miles and has 1000 feet storage capacity of 20,000 acre feet water. The dam can
produce 240 MW (mega watt) electricity. Three canals like the gravity canal, the
Kabul River canal and the Mohmand canal have been taken out. The former two
canals irrigate the valley of Peshawar and the later irrigate parts of Mohmand agency.
The dam is without any fish ladder and hence is an obstacle for upstream migration of
the fish population especially during breeding season, which starts in spring and lasts
till late summer. The reservoir inhabits almost the same fish population as found in
River Kabul and is used for commercial fishing (Yousafzai, 2004).
1.4 BACKGROUND
The people, who live near the banks of the River Kabul complained for water
pollution in the River Kabul. It was because of increased water pollution and fish
killing in the river, skin problems in humans and maladies in animals. Many people
have complained for reduction of crop production, which were irrigated from River
Kabul (IUCN, 1994). Initially these complaints were taken seriously by Pakistan
Council of Scientific Industrial and Research, Chemistry Department and Centre of
Excellence in Physical Chemistry of Peshawar University. They verified the pollution
in the River Kabul. In 1977, United Nations Industrial Development Organization
investigated the impact of industrial effluents on the water quality of River Kabul
(Karns, 1977). Previously it has been reported that there is a significant industrial
pollution in the River Kabul and it has been recommended that all the industrial waste
products should be detoxified before dumping into the River Kabul (IUCN, 1994).
The number of polluting industries is increasing day by day. The scientific
6
community is busy in solving the pollution problem in the rivers and other water
bodies. In due course the cause of the villagers was also taken up by a non-
governmental organization, Pakistan Environmental Protection Foundation, Still the
federal government has not taken any action against this serious matter and recently
the KPK government developed a capacity to resolve this environmental problem
(IUCN, 1994). In January 1992, the Sarhad Provincial Conservation Strategy program
took seriously the water pollution problem in River Kabul. It is a serious
environmental problem, which is needed the environmental rehabilitation program to
solve this serious problem. According to the program the river should be cleaned first.
It is expected that initial river clean-up action plan could be developed and there is
needed more research for further identification of pollution problem in the River
Kabul (IUCN, 1994).
1.5 HYDROLOGY
The River Kabul has seasonally variable monthly discharge at Warsak dam. It
has an average discharge of 20,500 cusecs during low flow and high flow periods.
This variation is caused due to melting of glaciars and snow on the peaks of
mountains. The Chitral River as investigated has half discharge as compare to River
Kabul. This is because the Chitral area is arid and has less rainfall due to glacial
inputs. The tributaries in Afghanistan are also from areas of low rainfall (IUCN,
1994). River Swat is main tributary of River Kabul that joins the River Kabul before
ending into River Indus. This tributary has a discharge of 22,500 cusecs, which is
same to the Kabul River but there is a great seasonal variation in the Swat River
discharge due to less rainfall in other seasons (IUCN, 1994). The main purpose of
Warsak dam construction is to control the discharges below the dam. Most of the
water is used for irrigation and some part of water is used for running of hydel plant.
Several time artificial floods occurred due to release of water by the dam, which is
7
resulted into soil erosion. The effect of extensive canal and irrigation systems on the
water quality and quantity has not been investigated (IUCN, 1994).
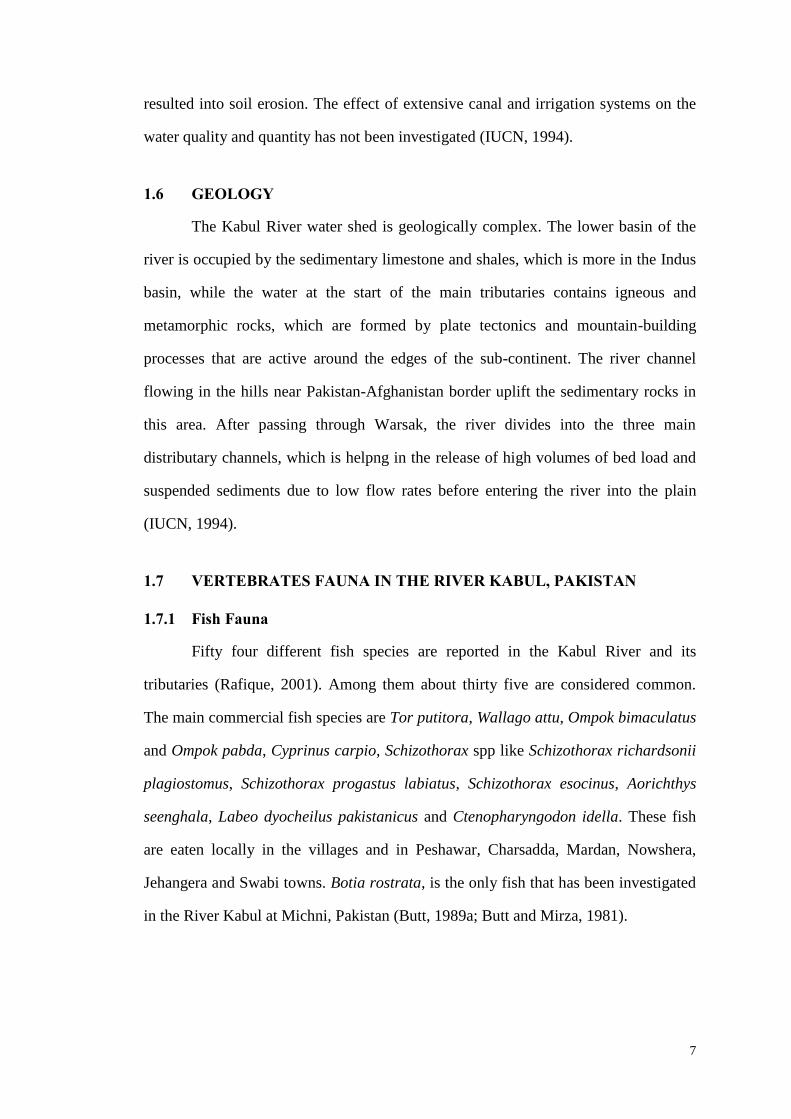
1.6 GEOLOGY
The Kabul River water shed is geologically complex. The lower basin of the
river is occupied by the sedimentary limestone and shales, which is more in the Indus
basin, while the water at the start of the main tributaries contains igneous and
metamorphic rocks, which are formed by plate tectonics and mountain-building
processes that are active around the edges of the sub-continent. The river channel
flowing in the hills near Pakistan-Afghanistan border uplift the sedimentary rocks in
this area. After passing through Warsak, the river divides into the three main
distributary channels, which is helpng in the release of high volumes of bed load and
suspended sediments due to low flow rates before entering the river into the plain
(IUCN, 1994).
1.7 VERTEBRATES FAUNA IN THE RIVER KABUL, PAKISTAN
1.7.1 Fish Fauna
Fifty four different fish species are reported in the Kabul River and its
tributaries (Rafique, 2001). Among them about thirty five are considered common.
The main commercial fish species are Tor putitora, Wallago attu, Ompok bimaculatus
and Ompok pabda, Cyprinus carpio, Schizothorax spp like Schizothorax richardsonii
plagiostomus, Schizothorax progastus labiatus, Schizothorax esocinus, Aorichthys
seenghala, Labeo dyocheilus pakistanicus and Ctenopharyngodon idella. These fish
are eaten locally in the villages and in Peshawar, Charsadda, Mardan, Nowshera,
Jehangera and Swabi towns. Botia rostrata, is the only fish that has been investigated
in the River Kabul at Michni, Pakistan (Butt, 1989a; Butt and Mirza, 1981).
8
1.7.1.1 Wallago Attu
Wallago attu belongs to kingdom animalia, phylum chordata, sub phylum
vertebrata, class actinopterygii, order siluriformes, family siluriformes, genus Wallago
and species Wallago attu. It is locally known mulee and is a fresh water predatory
fish. In natural habitat the fish is considered as predatory, demersal and
potomodromous and found in rivers of Balochistan, Punjab, Sind, KPK, Azad
Kashmir and Kabul Indus River system (Yousafzai et al., 2010a). It is widely
distributed in Bangladesh, India, Pakistan, Nepal, Burma, Sri-Lanka and some other
Asian countries like Thailand, Vietnam, Kampuchea, Malay Peninsula, Indonesia and
Afghanistan. Its body is elongated and laterally compressed. The snout is depressed.
Mouth is deeply cleft and maxilla extends behind the eyes and lower jaws. Dorsal fin
is small, spineless and situated above the last half of pectoral (Roberts, 1982; Yen and
Trong, 1988). It dwells both in standing and running water. Tanks, lakes, rivers,
reservoirs and flood plains are the main habitat of this fish (Roberts, 1999). It usually
eats insects (Sokheng et al, 1999) and adults depend on small fishes, shrimps and
mollusks for their food. It is spawning between May to October in Cambodia, June to
July in Bangladesh and Thailand and July to August in Pakistan and Nepal (Froese
and Pauly, 2007). Different factors like over-exploitation, destruction of habitat,
environmental contamination, toxic chemical pollution and lack of proper
management are resulting into declining of Wallago attu population (Mijkherjee et
al., 2002).

9
Fig. 1.2: Photograph showing Wallago attu
1.7.1.2 Labeo dyocheilus
Labeo dyocheilus belongs to kingdom animalia, phylum chordata, sub phylum
vertebrata, class actinopterygii, order siluriformes, family cyprinidae, genus labeo and
species Labeo dyocheilus. It is locally known by Torki name. This fish is omnivorous,
potomodromous and benthopelagic in their feeding habit. It is distributed across the
country (Yousafzai et al., 2010b). It is one of the most economically important and
fast growing fish. Incorporation of this high valued species is not only an important
step in species diversification of hill aquaculture but will also improve the socio-
economic care of poor farmers in hilly region. Therefore, it is very important to get
more and more information about its reproduction potential and usefulness as a
candidate species for hill aquaculture (Gupta et al., 2013).This fish is a bottom feeder
inhabiting upland streams and rivers at an elevation of 400-800m. The fish is reported
to attain a length of 91.44 cm (Day, 1977). Labeo dyocheilus has been categorized as
vulnerable species (Prasad, 1994). In the month of August and September, the
matured Labeo dyocheilus fish started spawning. Thus, these two months are
collectively called as breeding season of Labeo dyocheilus (Rakesh,
2013).

10
Fig.1.3: Photograph showing Labeo dyocheilus
1.7.1.3 Cyprinus carpio
Cyprinus carpio belongs to kingdom animalia, phylum chordata, sub phylum
vertebrata, class actinopterygii, order siluriformes, family cyprinidae, genus cyprinus
and species Cyprinus carpio.It is locally known as common carp and has a good
position among the fish species of the country and inhabits in inland waters and is
regarded as a good fish from economic point of view and breeding features. It also
inhabits in lakes, ponds and deep and slow flowing rivers containing detritus and
vegetation in bottom. The young fish generally prefer shallow water, while the elder
ones prefer deep water for living. They also live in warm water but can not survive in
high altitude lakes. It can survive in presence of less oxygen. It is considered as a
good fish for culture due to its omnivorous nature, rapid growth, keeping in closed
regions and tasty meat. They show maturaty between 3-4 years and spawning their
eggs form April to June. They can get a length of 1 m and weight of 40 kg (Geldiay
and Balık, 1988). It is a voracious omnivorous fish. Zooplankton, phytoplankton,
water plants and detritus are the main food sources of this fish. Besides these sources,
they also feed on small abundant organisms in the lake (Yousafzai et al., 2010b).
Cyprinus carpio mainly feeds on plankton and insects (Numann, 1958).

11
Fig.1.4: Photograph showing Cyprinus carpio
1.7.1.4 Ompok bimaculatus
Ompok bimaculatus belongs to kingdom animalia, phylum chordata, sub
phylum vertebrata, class actinopterygii, order siluriformes, family siluridae, genus
ompok and species Ompok bimaculatus. It has two distinctive spots above and behind
the pectoral fin base and at the caudal peduncle base. It is a very popular Asian cat
fish. It is locally known as Sher mahi in Pakistan and commonly known as butter cat
fish (Siraj et al., 2014). It is a fresh water catfish species native to India, Bangladesh,
Pakistan and Myanmar. The fish has also a wide geographical distribution covering
West Bengal, Bihar and North Eastern States of India as well. Open beel or wet land
connected with rivers is usually considered as common habitats of this fish.
O.bimaculatus is a higher priced, delicious and well preferred fish because of its
unique Lipo-protein texture with soft bones, good taste and higher nutritional value.
This species has been listed as endangered fish species in India (IUCN, 1990). In
aquaculture, the Ompok bimaculatus did not receive much attention due to
insufficiency of gravid stock for experimentation and also because of the shortage of
information regarding its breeding potential, larval rearing and culture technology
(Parameswaran et al., 1970; CAMP, 1998). Male Ompok bimaculatus become
matured during late March to April. Fully ripe females were observed during May to

12
the end of July. Breeding season extends from early June to late July (Banik et al.,
2011).
Fig.1.5: Photograph showing Ompok bimaculatus
1.7.1.5. Aorichthys seenghala
Aorichthys seenghala locally known as Singhara in Pakistan is a cat fish,
belonging to kingdom animalia, phylum chordata, sub phylum vertebrata, class
Actinopterygii, order siluriformes, family Bagridae and genus aorichthys and species
Aorichthys seenghala. This fish is distributed in Nepal and Banladesh, Southern Asia,
Afghanistan, Pakistan, India and also found in Thailand and China (Siraj et al., 2014).
It inhabits in fresh water, feeds on insects and commonly bottom feeder (Rahman,
2005). It usually eats insect-fry, fish-fry, fingerlings, water fleas, insects, adult-
insects, tadpoles and young fish (Yadav, 1997). This species has very broad and flat
head with smooth upper surface and the grayish sides. It spawns during January to
April at the edge of shore about 1- 2m below the surface. It makes a sand-gravel hole
near a rock about 1 m in diameter and 30 cm deep. In these holes the female lays eggs
and look after their fry. Both male and female are distinguished from each other by
the shape of the genital papilla. The male has pointed genital papilla and has a slender
body, while the female has oval papilla and the mature female fish has a big belly
containing large number of eggs. During spawning, its abdomen becomes distended.
13
It has reddish and prominent cloaca. Males have total length of 60-80 cm and body
weight of 2.0 - 2.5 kg, while females have length between 80 and 100 cm and body
weight between 3.0 and 4.5 kg (Ratanatrivong et al., 2008).
Fig.1.6: Photograph showing Aorichthys seenghala
1.8 HUMAN POPULATION
Kabul is located on the Kabul tributary from which the river gets its name.
Jalalabad is the last major town located close to the confluence of the Kabul and
Kunar before the river enters Pakistan. Below the Warsak dam River Kabul flows
through the more populated areas of the KPK and the more populated rural areas of
Pakistan. Peshawar city near to the Shah Alam branch of River Kabul has about one
million populations, while the Nowshera and Charsadda towns are also located near
the banks of the river. There are many Afghan refugees colonies, which are situated
close to the river and its tributaries (IUCN, 1994).
1.9 PRINCIPAL USES OF RIVER KABUL
1.9.1 Irrigation
Two canals like northern and the southern canals were taken-off below the
Warsak dam. The northern canal irrigates the lands of Shabqadar and Charsadda.
While the southern canal irrigates the lands of Jamrud. About 5 km below the Warsak
dam, a third canal was also taken off from the southrn bank of River Kabul, which
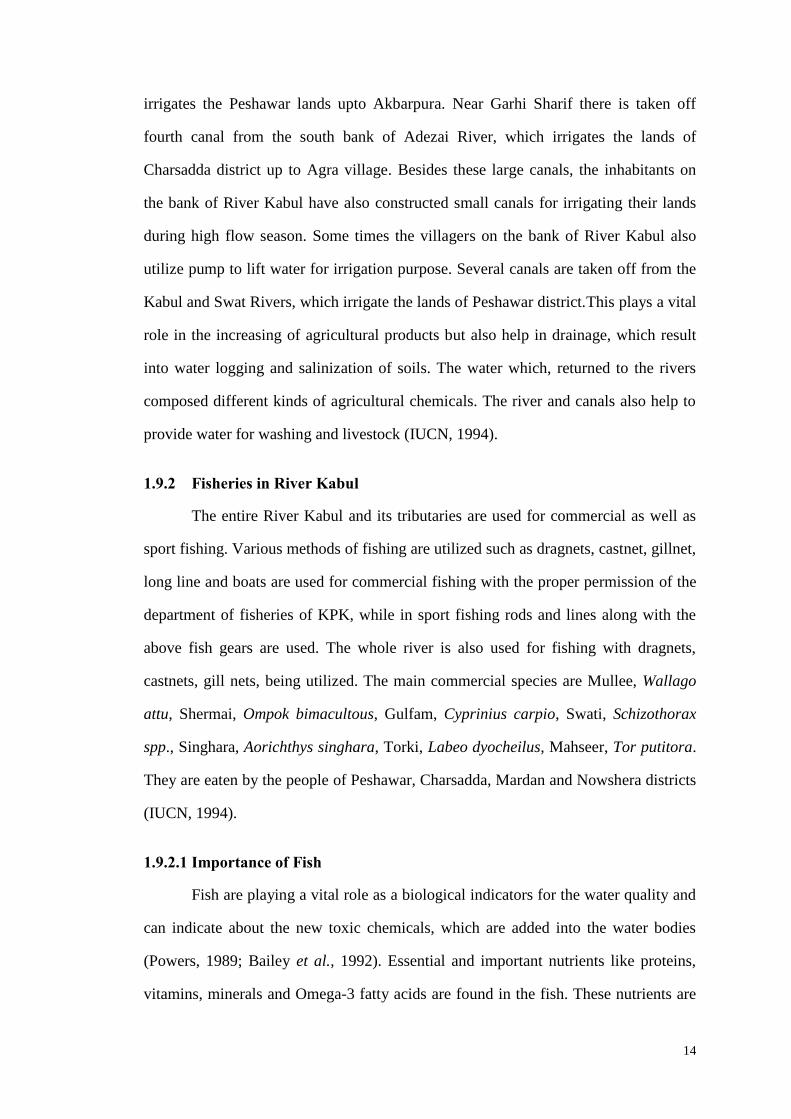
14
irrigates the Peshawar lands upto Akbarpura. Near Garhi Sharif there is taken off
fourth canal from the south bank of Adezai River, which irrigates the lands of
Charsadda district up to Agra village. Besides these large canals, the inhabitants on
the bank of River Kabul have also constructed small canals for irrigating their lands
during high flow season. Some times the villagers on the bank of River Kabul also
utilize pump to lift water for irrigation purpose. Several canals are taken off from the
Kabul and Swat Rivers, which irrigate the lands of Peshawar district.This plays a vital
role in the increasing of agricultural products but also help in drainage, which result
into water logging and salinization of soils. The water which, returned to the rivers
composed different kinds of agricultural chemicals. The river and canals also help to
provide water for washing and livestock (IUCN, 1994).
1.9.2 Fisheries in River Kabul
The entire River Kabul and its tributaries are used for commercial as well as
sport fishing. Various methods of fishing are utilized such as dragnets, castnet, gillnet,
long line and boats are used for commercial fishing with the proper permission of the
department of fisheries of KPK, while in sport fishing rods and lines along with the
above fish gears are used. The whole river is also used for fishing with dragnets,
castnets, gill nets, being utilized. The main commercial species are Mullee, Wallago
attu, Shermai, Ompok bimacultous, Gulfam, Cyprinius carpio, Swati, Schizothorax
spp., Singhara, Aorichthys singhara, Torki, Labeo dyocheilus, Mahseer, Tor putitora.
They are eaten by the people of Peshawar, Charsadda, Mardan and Nowshera districts
(IUCN, 1994).
1.9.2.1 Importance of Fish
Fish are playing a vital role as a biological indicators for the water quality and
can indicate about the new toxic chemicals, which are added into the water bodies
(Powers, 1989; Bailey et al., 1992). Essential and important nutrients like proteins,
vitamins, minerals and Omega-3 fatty acids are found in the fish. These nutrients are

15
needed to human beings (Dahl et al., 2006). Fish is a good and easy source of protein
and food for human (Olaifa et al., 2004). Fish has an important position as a good
quality food in the human diet. The fish lipids are considered important because play
a vital role against many heart and joint diseases (Shahidi and Botta, 1994). Fish
contain proteins, essential fatty and amino acids, which are more essential for the
growth of human beings and play a vital role in protection of the human body against
different diseases (Matthew, 1992). Lipids of fish contain omega-3 fatty acids, which
are necessary for the human health and growth. By making comparison with other
animal lipids, the fish lipids play a significant role against cardiovascular and
inflammatory abnormalities in human beings (Piclet, 1987).
1.9.3 Hunting
The river is used for sport hunting. The main hunting season starts from
November when water fowls start migration from Siberia to Pakistan and India for
feeding and lasts till April when emigration to Siberia for breeding along the Indus.
Shooting of water fowls is a popular sport both for locals and visiting people
(Yousazai et al., 2010a). River Kabul also provides recreation picnic spots to the
people of Charsadda, Peshawar and Nowshera (Arshad et al., 2011).
1.9.4 Recreation
Boating, hostelling, fishing and hunting are the main recreational uses of the
River Kabul. Huts and river view restaurants are present along the river bank. Fried
fish is specialty of these huts and restaurants. These uses and economic benefits
demand that the river must remain in a healthy" state (Yousazai et al., 2010a).
1.9.5 Washing and Bathing
The River Kabul is also providing washing and bathing facilities to the people
who live on the banks of River Kabul (IUCN, 1994).

16
1.10 INDUSTRIES ALONG RIVER KABUL
According to a survey, there are working about 348 large and small scales
industries in KPK. About 80 industries and industrial units out of 384 are dumping
their waste products into River Kabul. They are including 4 sugar mills, 2 distilleries,
3 ghee factories, 5 textile mills, 2 woolen mills, 12 tanneries, 3 paper and board mills,
10 chemical and pharmaceutical factories, 4 match factories, 10 soap industries, 1
petroleum refinery, 10 photo laboratories, 4 paint and varnish industries and 11 rubber
and plastic industries (IUCN, 1994).
1.10.1 Industries at Aman Garh Industrial Zone
Nowshera and the adjacent Aman Gar industrial zone have about 15 different
types of small and large scale industries that discharg their effluents into River Kabul.
They include ghee industries, Feroz son,s laboratories, colony sarhad textile industry,
Adamjee chemical works, Adamjee paper board mills, petrol godowns, Nowshera
engineering company limited, Nowshera DDT industry and tanneries across the
railway bridge, Nowshera (Yousafzai., 2004). Unluckily all the above units are
without effluents treatment facilities end up in the River Kabul through canals. These
effluents have not only deteriorated the river water but also the sub-surface water of
the area as well as aquatic organisms (IUCN, 1994; Khan et al., 1999; Akif et al.,
2002). The villagers living at the river banks have also been complaining about the
pollution in the River Kabul, which is very obvious and has often resulted into
periodic fish killing. It has been reported that the dumping of industrial effluents into
River Kabul are the cause of declining of the whole fish population, which are very
sensitive to oxygen depletion due to the pollution in the River Kabul (Khan and
Mumtaz, 1997). The textile industry at Amangarh, Nowshera are dumping their
effluents into River Kabul in greater concentration than the proposed limits of NEQS.
These effluents contain toxic heavy metals, high oxygen demanding wastes and
appreciable amounts of sulfide. This study indicates the presence of deleterious
effects of industrial pollutants (Akif et al., 2002).

17
1.11 SEWAGE AND INDUSTRIAL EFFLUENTS DISPOSAL TO RIVER
KABUL
The discharging of municipal sewages and industrial effluents into the River
Kabul is a wide spread activity throughout the world and particularly in the third
world countries like Pakistan. The cities, towns and villages of Afghanistan,
Malakand, Peshawar and Mardan, Mohmand, Khyber and Malakand agencies
discharge their untreated sewages into Kabul River. The lower sections of the river
pass through densely populated plains. Many industries like distilleries, paper, textile
and sugar mills, tanneries and ghee factories are dumping their toxic waste products
into River Kabul and make the river polluted (IUCN, 1994). In Pakistan due to lack of
proper organization, supervision for industrialization and urbanization, the water
pollution is a great problem. Similarly the accessible water also gets contamination
due to discharging of unprocessed domestic sewages, industrial effluents and
agricultural run-off (Balfours, 1987).
1.12 WATER CONTAMINATION
Water is a universal solvent that is essencial for the life on earth. The dischrge
of various toxic chemicals like heavy metals into water make the life difficult in the
water and on the land. Some of these heavy metals causes different acute and chronic
abnormalities like skin burns and rashes, bone disorders, lungs and digestive system
abnormalities in aquatic and teristrial animals (John, 1990). Pakistan is among the
countries of the world that is faced with fresh water pollution in its rivers. According
to ministry of environment and urban affairs, various industries dump their waste
products into different water bodies. Industrial estates in Peshawar are discharging
heavy metals and untreated effluents into water bodies. For instance 80000m3
industrial effluents are discharged into River Kabul every day, which are resulted into
decreasing of agricultural and fish production (Government of Pakistan Position
Paper, 2010). Water pollution affects the water qualities that make the water
unsuitable for drinking and irrigation purposes. Any substance, which impacts the
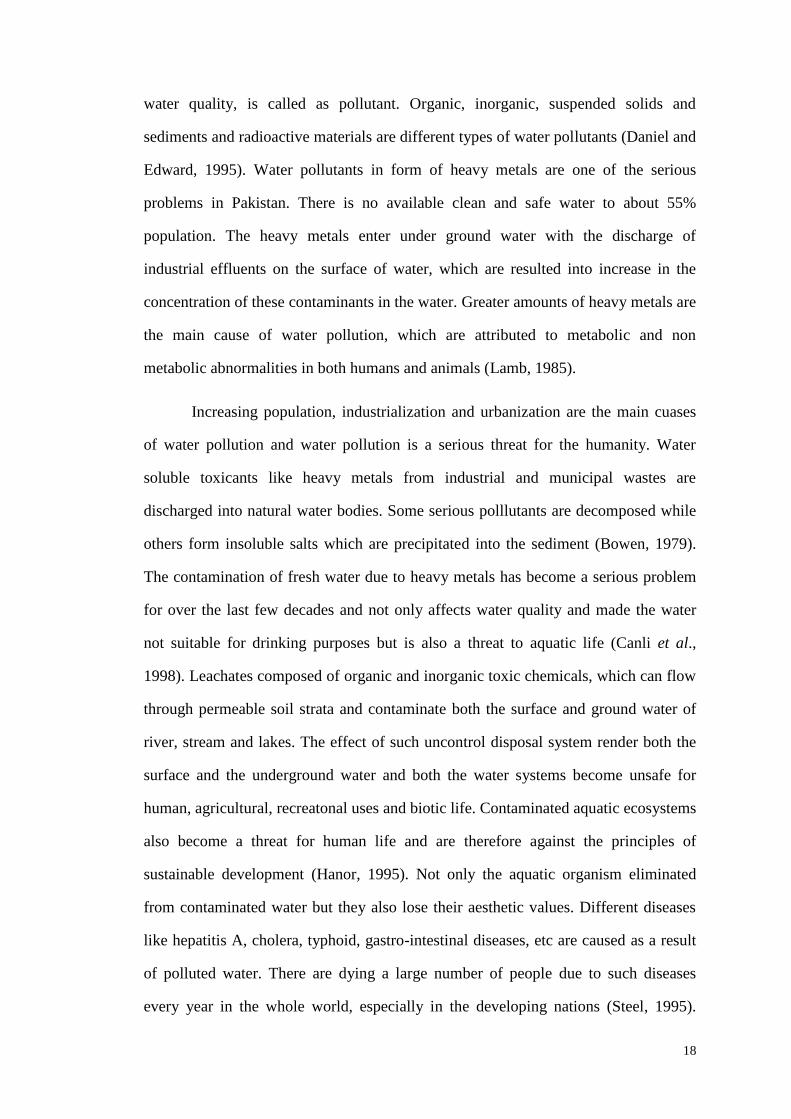
18
water quality, is called as pollutant. Organic, inorganic, suspended solids and
sediments and radioactive materials are different types of water pollutants (Daniel and
Edward, 1995). Water pollutants in form of heavy metals are one of the serious
problems in Pakistan. There is no available clean and safe water to about 55%
population. The heavy metals enter under ground water with the discharge of
industrial effluents on the surface of water, which are resulted into increase in the
concentration of these contaminants in the water. Greater amounts of heavy metals are
the main cause of water pollution, which are attributed to metabolic and non
metabolic abnormalities in both humans and animals (Lamb, 1985).
Increasing population, industrialization and urbanization are the main cuases
of water pollution and water pollution is a serious threat for the humanity. Water
soluble toxicants like heavy metals from industrial and municipal wastes are
discharged into natural water bodies. Some serious polllutants are decomposed while
others form insoluble salts which are precipitated into the sediment (Bowen, 1979).
The contamination of fresh water due to heavy metals has become a serious problem
for over the last few decades and not only affects water quality and made the water
not suitable for drinking purposes but is also a threat to aquatic life (Canli et al.,
1998). Leachates composed of organic and inorganic toxic chemicals, which can flow
through permeable soil strata and contaminate both the surface and ground water of
river, stream and lakes. The effect of such uncontrol disposal system render both the
surface and the underground water and both the water systems become unsafe for
human, agricultural, recreatonal uses and biotic life. Contaminated aquatic ecosystems
also become a threat for human life and are therefore against the principles of
sustainable development (Hanor, 1995). Not only the aquatic organism eliminated
from contaminated water but they also lose their aesthetic values. Different diseases
like hepatitis A, cholera, typhoid, gastro-intestinal diseases, etc are caused as a result
of polluted water. There are dying a large number of people due to such diseases
every year in the whole world, especially in the developing nations (Steel, 1995).
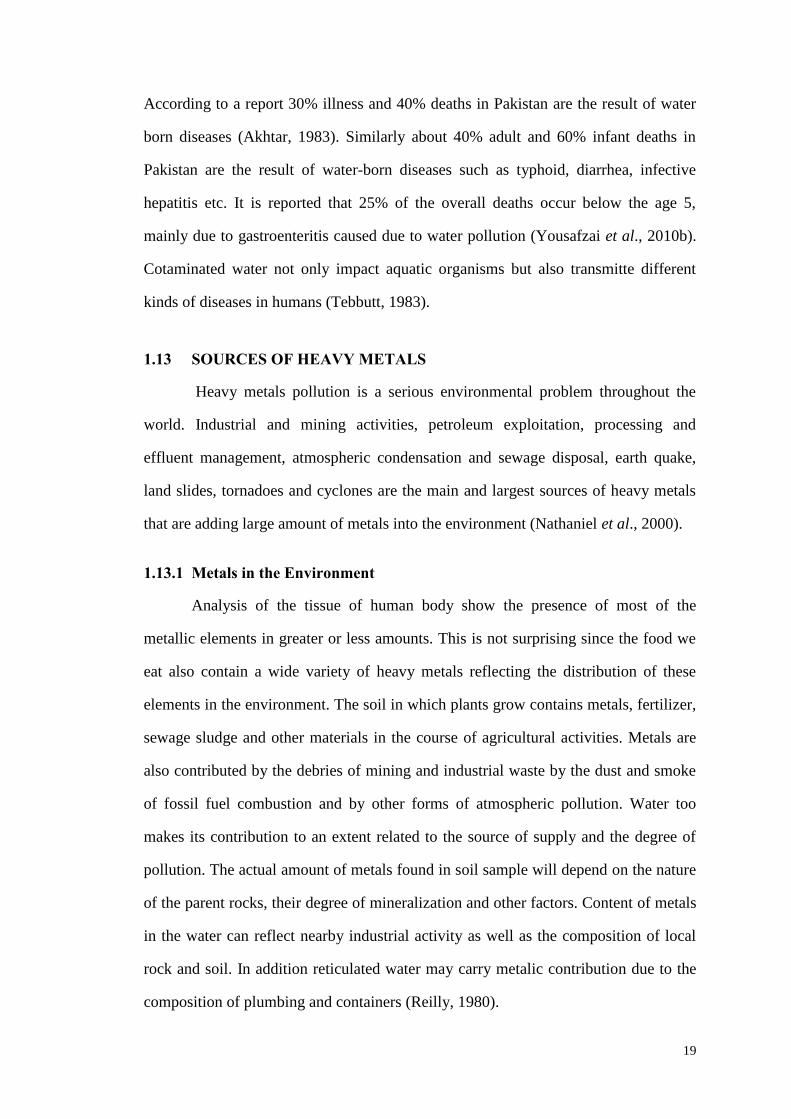
19
According to a report 30% illness and 40% deaths in Pakistan are the result of water
born diseases (Akhtar, 1983). Similarly about 40% adult and 60% infant deaths in
Pakistan are the result of water-born diseases such as typhoid, diarrhea, infective
hepatitis etc. It is reported that 25% of the overall deaths occur below the age 5,
mainly due to gastroenteritis caused due to water pollution (Yousafzai et al., 2010b).
Cotaminated water not only impact aquatic organisms but also transmitte different
kinds of diseases in humans (Tebbutt, 1983).
1.13 SOURCES OF HEAVY METALS
Heavy metals pollution is a serious environmental problem throughout the
world. Industrial and mining activities, petroleum exploitation, processing and
effluent management, atmospheric condensation and sewage disposal, earth quake,
land slides, tornadoes and cyclones are the main and largest sources of heavy metals
that are adding large amount of metals into the environment (Nathaniel et al., 2000).
1.13.1 Metals in the Environment
Analysis of the tissue of human body show the presence of most of the
metallic elements in greater or less amounts. This is not surprising since the food we
eat also contain a wide variety of heavy metals reflecting the distribution of these
elements in the environment. The soil in which plants grow contains metals, fertilizer,
sewage sludge and other materials in the course of agricultural activities. Metals are
also contributed by the debries of mining and industrial waste by the dust and smoke
of fossil fuel combustion and by other forms of atmospheric pollution. Water too
makes its contribution to an extent related to the source of supply and the degree of
pollution. The actual amount of metals found in soil sample will depend on the nature
of the parent rocks, their degree of mineralization and other factors. Content of metals
in the water can reflect nearby industrial activity as well as the composition of local
rock and soil. In addition reticulated water may carry metalic contribution due to the
composition of plumbing and containers (Reilly, 1980).

20
1.13.2 Metals in the Body of an Organism
The metals content of food, whether this is of animal or plant origin will
depend on many factors, ranging from environmental conditions to methods of
production and processing. Even in the same class of food, variations in the levels of
metals may be considerable (Reilly, 1980). Within a particular food stuff or organism
levels may vary between parts. Within the animals body the distribution of metals is
by no means uniform. Some metals are accumulated in particular tissues and organs
and in other different portions of the body. For example in 55 kg man the toxic metal
like cadmium will be accumulated preferentially in kidneys (12 mg) and to much
lower extent in blood (0.76 mg), where the kidney will contain 0.12 mg and blood 1.3
mg of lead. Chromium is concentrated preferentially in muscle (2.4 mg) but only
reaches 0.019 mg in the kidney (Somero et al., 1977).
1.13.3 Essential and Non-Essential Metals
Among many metals found in the body only a small number are known to be
essential for normal life. The absence of these elements will result in the appearance
of characteristic pathological deficiency symptoms. Most of the other metals present
are antifacts with no functional significance. The essential metals can be divided into
two classes according to the amounts of each, which are required for normal function.
These are macro-nutrients, which include Ca, K, Na and Mg and the micro-nutrients,
which include Fe, Zn, Mn, Cu, Mo, Co, Cr, Si, Ni and Sn. Metals found in the body
for, which no metabolic functions yet known are called as non essential. The non
essential metals include Pb, Hg, Ag, Sn, Bi, Sn, B, Be, Li, Ga, Ti, while Ba, Ar, Sr,
Cd and Va are essential elements (Reilly, 1980).
1.13.4 Role of Metals in the Body of an Organism
Metals including essential micro-nutrients and macro- nutrients work in three
main ways in the body as constituent of bones and teeth as soluble salts, which control
the composition of body fluids and cells and as essential adjuncts to many enzymes

21
and other functional proteins. The macronutrients play major roles in the body of
organisms, while micro-nutrients are especially prominent in assisting enzyme
function. Very few of the proteins that act as a biological catalysts can do entirely on
their own. Most of the proteins need the assistance of a non-protein prosthetic group.
If the prosthetic group is detachable it is known as coenzyme. The group may be an
organic molecule containing trace metals or it may contain solely of a trace element.
In the latter case if the metal is detachable from the protein part, it is known as an
activator. Iron and copper, for example occurred in the prosthetic group of many
enzymes concerned with oxidation. Zinc and manganese function as detachable
activators on some enzymes involved in cellular metabolism (Reilly, 1980).
Most of the micro-nutrients have been shown to play similar enzymatic role
and as a consequence the enzyme involved are often referred to as metallo- enzymes.
The inorganic micro-nutrients are also found in some other body compounds
including hormones and vitamins. The production and storage of insulin in the
pancrease for example involved zinc. Haemoglobin, essential for transport of oxygen
in the blood is an iron containing compound. Cobalt atom form part of cobalamin or
vitamin B12 (Reilly, 1980). It is clear that some metals are essential micro-element
and therefore their deficiency disturb biological functions. All the metals including
essential micro-nutrients and macro-nutrients may also become toxic to aquatic
organism as well as to humans, when present in excess (Under wood, 1977; Laws,
1981).
1.13.5 Heavy Metals Pollution in River Kabul
For over two decades the people living on the banks of the River Kabul are
complaining about water pollution in River Kabul. These complaints are the result of
the increasing signs of pollution and periodic fish killing. The river is also blamed for
skin diseases in humans as well as maladies in livestock. Some people have
complained for decreasing crop production in the fields irrigated from polluted River
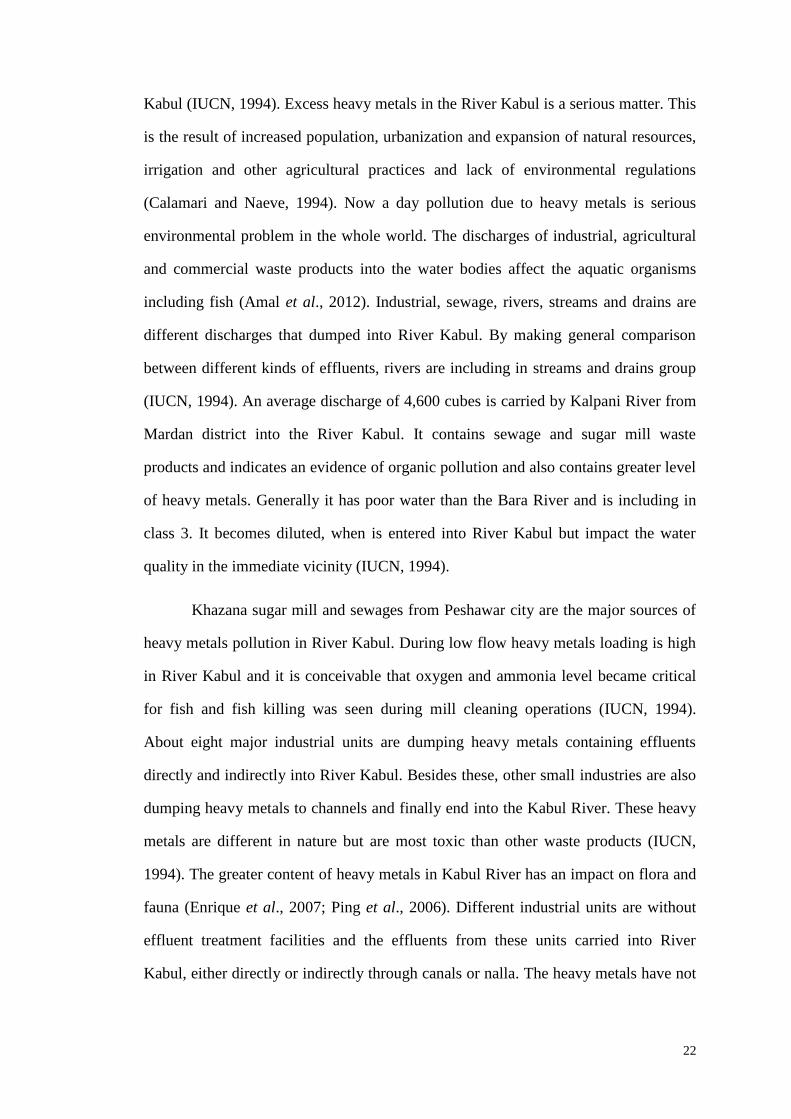
22
Kabul (IUCN, 1994). Excess heavy metals in the River Kabul is a serious matter. This
is the result of increased population, urbanization and expansion of natural resources,
irrigation and other agricultural practices and lack of environmental regulations
(Calamari and Naeve, 1994). Now a day pollution due to heavy metals is serious
environmental problem in the whole world. The discharges of industrial, agricultural
and commercial waste products into the water bodies affect the aquatic organisms
including fish (Amal et al., 2012). Industrial, sewage, rivers, streams and drains are
different discharges that dumped into River Kabul. By making general comparison
between different kinds of effluents, rivers are including in streams and drains group
(IUCN, 1994). An average discharge of 4,600 cubes is carried by Kalpani River from
Mardan district into the River Kabul. It contains sewage and sugar mill waste
products and indicates an evidence of organic pollution and also contains greater level
of heavy metals. Generally it has poor water than the Bara River and is including in
class 3. It becomes diluted, when is entered into River Kabul but impact the water
quality in the immediate vicinity (IUCN, 1994).
Khazana sugar mill and sewages from Peshawar city are the major sources of
heavy metals pollution in River Kabul. During low flow heavy metals loading is high
in River Kabul and it is conceivable that oxygen and ammonia level became critical
for fish and fish killing was seen during mill cleaning operations (IUCN, 1994).
About eight major industrial units are dumping heavy metals containing effluents
directly and indirectly into River Kabul. Besides these, other small industries are also
dumping heavy metals to channels and finally end into the Kabul River. These heavy
metals are different in nature but are most toxic than other waste products (IUCN,
1994). The greater content of heavy metals in Kabul River has an impact on flora and
fauna (Enrique et al., 2007; Ping et al., 2006). Different industrial units are without
effluent treatment facilities and the effluents from these units carried into River
Kabul, either directly or indirectly through canals or nalla. The heavy metals have not

23
only deteriorated the river water but also contaminated the sub-surface water (IUCN,
1994; Khan et al., 1999; Akif et al., 2002).
River Kabul water is blamed for causing skin diseases in humans, maladies in
livestock and periodic fish killing. The River Kabul water is no longer fit for drinking
purposes. Its major tasks today are as carrier of domestic and industrial wastes and to
provide water for irrigation (Khan et al., 1985; Khan and Mumtaz, 1997). Different
sources discharging their waste products into Kabul River and contaminated the
surface water. Bara canal and Budni nalla carry waste products from industrial estates
in Peshawar into River Kabul. However many other sources like sugar mills,
distilleries, paper mills, tanneries, ghee mills and textile mills in the Charsadda and
Peshawar area are also sources of heavy metals sources to Kabul River (IUCN, 1994).
Due to lack of waste water treatment plants high concentration of heavy metals are
discharged into Kabul River, which is most essential for both fish and agriculture.
Different resources such as industries, sewage, factories, land slides and tornadoes are
dumping greater amount of heavy metals into River Kabul (Khan et al., 2011). These
industries not only produce effluents, but their wastes also composed toxic heavy
metals like Pb, Cd, Cr and Hg and a large amount of organic halides (Ali et al., 2009).
The average daily discharge of Bara canal into the River Kabul is 304 cusecs.
Moreover the sewage from the Gul Bahar also joins the River Kabul (USMBA, 1989).
1.13.6 Hazards of Heavy Metals
a. Effects on Fish Fauna
Toxicological studies in fish species were initiated in 1930 for evaluation of
impacts of toxic chemicals in both laboratory and field and also to know about the
heavy metals, agricultural and industrial pollution in rivers, lakes and marine
environment (Sprague, 1969). Heavy metals can not be changed into less harmul
metals in the aquatic ecosystem. Therefore both localized and dispersed metal
pollution affect the aquatic organisms like fish (Khan et al., 2011). Different
24
abnormalities like pituitary, testicular disorders and decrease in number of fry fish
have investigated after exposure to heavy metals (Fernicola et al., 1985; Popek et al.,
2006). High contents of heavy metals are resulted into both lethal and chronic
abnormalities in fish (Kotze et al., 1999). Higher level of heavy metals impact the
aquatic environment and also affect the aquatic biodiversity (Farombi et al., 2007;
Vosyliene and Jankiite, 2006; Ashraj, 2005).
Heavy metals can impact fish when enterd into rivers and other different water
bodies (Bernet et al., 1999). Heavy metals control many body functions including
enzymes involved in gene expression. Carcinogenesis, mutagenesis and teratogenesis
are produced as a result of excessive intake of heavy metals in aquatic organisms
(Baby et al., 2012). Sublethal concentration of heavy metals could be resulted into
unhealthy fish. Less levels of heavy metals have no impact on the fish itself, which
would not indicates any sign of illness but greater amount of heavy metals can
decrease the fish populations, resulted into declining and finally leads into extinction
of fish (Krishnani et al., 2003; Burger and Gochfeld, 2005). Analysis of heavy metals
in fish and other aquatic organisms is an important bio indicator of heavy metals
pollution and their effects on aquatic organism and aquatic environment
(Krishnakumar et al., 1994). Different disorders such as changes in sensory reception,
reduced responses to normal olfactory function, reduction in swiming performance,
gills purge and reproductive efficiency have appeared in the fish after exposure to
toxic heavy metals (Mansour and Sidky, 2000). Fish take the essential metals from
water, food or sediment for its normal metabolism. High concentration of heavy
metals causes toxic effects (Tuzen, 2003). High concentration of heavy metal damage
gills, liver and kidneys of fish and (Joseph et al., 2012).
b. Effects on Human Beings
Low heavy metal contents are necessary for enzymatic activity and many
other biological processes in living things but at high concentration, the heavy metals
25
impact the living organisms and are toxic in nature. Due to the presence in greater
concentration, the essential metals also become toxic (Bryan, 1976; Alloway and
Ayres, 1993). Apart from the beneficial effects, there are some problems that take
place in human beings from consumption of contaminated fish (Mozaffarian et al.,
2000). Different abnormalities like reduction in functions of mental and central
nervous system, reduction in energy levels and damage to lungs, kidneys, liver and
other organs of the man are the result of heavy metal toxicity. Toxic effects of the
heavy metals will take place that time, when excretory, metabolic, storage and
detoxification mechanisms become shorter. Various diseases such as Alzheimer
disease, Parkinson's disease, muscular dystrophy and multiple sclerosis are produced
as a result of exposure of the human beings to heavy metals for long period (Joseph et
al., 2012).
There are many reports about renal tubules impairment in the human beings as
a result of heavy metals intoxication. Renal disfunction indication is investigated in
children as a result of heavy metals accumulation (Friberg et al., 1979). Heavy metals
have been shown to impair the renal tubular transport mechanism in humans (NAS,
1972). Heavy metals have also been reported that induce liver necrosis and necrosis of
renal tubules of kidney and finally leading to kidney failure in humans (Davies, 1978;
Baker, 1984; Langard and Norseth, 1979). Essential metals at greater contents have
also lethal and sublethal toxic effects to some organisms. Low content of heavy
metals impact the health of human beings. Thus essential metals also have double
toxic effect (Rainbow, 2007).
Various cases of toxic effects of heavy metals on fish and fish consumers have
been investigated (Bowen, 1979; Dix, 1981). Heavy metals naturally found in the
earth crust that cannot be destroyed but accumulate through food chain and produce
potential human health risks and ecological disturbances (Loka et al., 1990).
Consumption of contaminated fish can produce different disorders and abnormalities

26
in human health (Nussey, 2000). Different disorders like changes in sensory
reception, ventilation, coughs, learning impairment, loss of equilibrium, loss of
reproductive efficiency and irregular metamorphosis are produced in the human
beings as a result of heavy metals accumulation (Mansour and Sidky, 2000). It is a
fact that many adverse disorders and abnormalities in the human beings are related to
toxic heavy metals. Lung diseases, cancers, bone abnormalities, sterility and other
problems in the human beings are related to these contaminants (Balfours, 1987;
George, 1979). Many numbers of infectious diseases in the people are attributed to
increased heavy metals pollution in the River Kabul. This is clear from the fact that
about 70% illness and 30% deaths in the surroundings of River Kabul are the result of
water born diseases (Rakesh et al., 2007; Lamb, 1985). Some metals are very
dangerous to human beings. Hematological effects in both animals and humans are
investigated after exposure to heavy metals. Transient increase in blood reticulocytes
was investigated in the workers after drinking heavy metals containing water
(Sunderman et al., 1988).
The presence of heavy metals in water impact health of human beings either
through accumulation process or through drinking surface water. Kidney and bone
damage are correlated to metals exposure. Heavy metals are also investigated as
carcinogenic (Jarup et al., 1998; IARC, 1993). Abnormal development and
neurobehavioral disorder are produced in the fetus, infants and children and elevate
blood pressure in adults as a result of heavy metals (Huel beings et al., 1981).
Different anormalities like nausea, vomiting, abdominal pain and breathing disorder
in the human are the result of acute exposure to heavy metals and other disorders like
obstructive lung, renal disease, fragile bones, alopecia, anemia, arthritis, learning
disorders, migraines, growth impairment, osteoporosis, emphysema and
cardiovascular diseases are also symptoms of chronic exposure to heavy metals
(Dupler, 2001).

27
1.14 AIMS AND OBJECTIVES
Heavy metals pollution is a major environmental problem through out the
world. Industrial and mining activities, petroleum exploitation, processing and
effluent management, atmospheric condensation and sewage disposal are the common
sources of heavy metals and physico-chemicals. Natural processes like earth quake,
land slides, tornadoes and cyclones have also added a large amount of physico-
chemical and heavy metals parameters into the water resources. In Pakistan due to the
lack of adequate scientific data, proper education and environmental awareness, the
industrial and mining activities, petroleum exploitation, processing and effluent
management, atmospheric condensation and sewage disposal are dumping tons of
heavy metals into the nearby canals and rivers without prior treatment to make them
non-toxic.These toxic heavy metals impact the concerned ecosystem and food chains.
Fresh water organisms are slowly declining. Especially fish population is decreasing
day by day, while the most sensitive fish species became endanger or extinct. The
plants and animals inhibit in such environment not only have a defective growth
pattern, but are also transferred these toxic heavy metals to human beings. This
contaminated water is also taken by the cattles, birds and crops and in this way toxic
heavy metals are transported to human. The toxic heavy metals, which the human
system in this way are likely to cause tremendous health hazards. Most of the heavy
metals are non-biodegradable. Therefore it is essential to adopt preventive measures
to save our environment and also the plants and animals life there in aquatic
environment. In order to achieve the above objectives it is imperative to provide
scientific proofs to prove the contention. The present work aims at
To assess the pollution status of River Kabul.
To investigate the types and levels of toxic components, both physico-
chemical and heavy metals parameters in the water of River Kabul.
To study bioaccumulation of heavy metals in selected fish species of River
Kabul.

28
To evaluate histopathological effects of heavy metals in selected fish species
of River Kabul.
To determine genotoxicological effects of heavy metals in selected fish
species of River Kabul.
1.15 DATA INTERPRETATION AND SIGNIFICANCE
In this investigation, data was collected from water and fish and compared
with national and international standards in order to assess the risk to human life and
environmental impact. The data was further analyzed to know the pollution status of
River Kabul, whether industries of the study area and human activities are
contributing any contamination of hazardous nature to the water of River Kabul.
Furthermore, possible remedies were suggested to keep the environment of target’s
area safe and provide a clean and healthy ecosystem for living organisms.
Investigation of heavy metals accumulation in selected fish species help as
bioindicators for heavy metal+s pollution in River Kabul. Part of this data has been
published in journals of international repute for further dissemination to attract the
national and international collaborative research projects.

29
CHAPTER-2
LITERATURE REVIEW
2.1 WATER ANALYSIS
Ali et al (2012) have studied the water samples downstream of dumping site
of waste water effluent into Kabul River in the laboratory for different parameters like
pH, electrical conductivity (EC), total dissolved solid (TDS), total suspended solid
(TSS) and chlorides respectively. The pH, TSS, TDS, electrical conductivity (EC) and
chloride showed increasing tendency in the river water.
Yousafzai et al (2010a) had reported that electrical conductivity increased
significantly in both the downstream samples in comparison with control sample. This
can be correlated to the effluent samples with high electrical conductivities. TSS,
TDS, potassium, sodium, calcium and pH in downstream samples again showed an
increasing tendency. This shows that all the parameters in River Kabul were in high
concentration as compare to other rivers of South Asia.
Jan et al (2010) studied the ground water, effluents and soil for metal
concentration to assess the pollution in different water bodies caused by various
industries and also investigated their source, identification and distribution. A
comparison was made among the metal concentration of ground water, effluents and
soil of the polluted area and also compared with that of control site concentrations and
WHO permissible limits. The results revealed that effluents contained higher metal
levels than soil and ground water samples. Manganese and lead in water had 8.268
and 2.971 mg/L concentrations. Result indicates that the effluents had greater metal
concentration than soil and ground water.
Phan et al (2010) studied the ground water, well water and hair samples for
arsenic and other toxic heavy metals concentration and also investigated their health
impacts in the Mekong River basin of Cambodia. For this purpose, the water samples

30
were collected from three sites like Ampil commune (control) in Kampong Cham
province, Khsarch Andaet commune in Kratie province and Kampong Kong
commune in Kandal Province. Among these sites, ground water results were
significant for arsenic, manganese, iron and barilium content. As content in scalp hair
showed positively correlations with As content in the ground water and average daily
doses. This highlights that ground water is the main source of As accumulation in the
people of the study area. The number of respondents that were affected by non-cancer
health risks and threatened by cancer were 98.65% and 0.5%; 13.48% and 33.71%
and non for Kandal province, Kratie province and Kampong Cham province. This
study indicated that in future, level of As may be resulted into many health problems
of arsenicosis if the problem was not taken serious.
Arian et al (2009) analyzed the ground water, lake water, sediment, soil and
fish for accumulation of heavy metals like Zn, Ni, Cr, Cu and As and also investigated
human health problems related to these metals in south-east part of the Sindh,
Pakistan. As showed greater concentrations in ground water and lake water samples
than the WHO permissible limits.
Kavcar et al (2009) investigated heavy metals and their health related
problems via drinking water ingestion pathway in Province of the I˙zmir, Turkey. For
this purpose water samples of drinking water were collected and studied for the
concentration of heavy metals and metalloids like arsenic, nickel, chromium, cobalt,
copper, manganese, lead, zinc, cadmium, and varidium. The drinking water
consumption and demographics information were also collected from each sampling
point. For each individual, arsenic exposure and risks were estimated. As and Ni
concentrations have crossed the permissible limits in 20% and 58% respecting
samples. The result highlights that As non carcinogenic risks were higher than the
level of concern for 19% of the population, where as carcinogenic risks were 10-4 for
46%, and 10-6 for 90% of the population.
31
Krishna et al (2009) had studied the surface water and ground water for heavy
metals concentration such as cobalt, chromium, nickel, iron, manganese, lead, zinc
and arsenic in the Patancheru industrial town (India). According to the study, many
chemical and pharmaceutical industries have established during last three decades and
these industries dumping their waste products into surface water of rivers. Irrigation
fields and surrounding land forming point and non-point are various sources for
surface water and ground water contamination. In surface water, FA identified four
factors having 75% of total variance and in ground water two factors having 85% of
total variance. Heavy metals like cobalt, chromium and nickel surface water were
related and ground water received these metals from anthropogenic and geogenic
sources.Where as anthropogenic activities are the main sources of cobalt, iron,
manganese, lead, zinc and arsenic for both surface and ground water.
Khan et al (2009) investigated the role of wetland for heavy metals removal
from industrial effluents. For this purpose heavy metals like lead, cadmium, copper,
iron, nickel and chromium were investigated in the industrial effluent, sediments and
aquatic macrophytes of the wetland. Constructed wet lands were found more efficient
for the removal of heavy metals like lead, cadmium, copper, iron, nickel and
chromium. The findings also showed that the wet lands paly a significant role in the
removal of some other heavy metals like cadmium, iron, and copper removal. From
research it is cleared that wet land is more efficient for the removal of heavy metals
from industrial effluents and other waste products like sewages.
Baig et al (2009) studied the ground and surface water of Jamshoro Sindh,
Pakistan for physio-chemical parameters and heavy metals. Arsenic showed more
content in ground as compare to surface water, where in surface water the
concentration for arsenic was less. The ground water and surface water samples
showed greater arsenic and physio-chemical parameters like electrical conductivity,
sodium and potassium contents than WHO permissible limits for clean water. Water

32
logging is mainly related to Indus river irrigation system, which may be resulted into
greater concentration of arsenic in the ground water. The ground water also showed
higher level of iron, which is also a good source of arsenic concentration for the
ground water and surface water. The result revealed that coal combustion at brick
factories and power generation plants are main sources of arsenic for both ground
water and surface water.
Halim et al (2009) investigated the arsenic concentration and distribution in
the ground water of the Sherajdi khan area, Bangladesh. For this purpose ground
water samples were collected from both shallow and deep tube wells and studied for
the levels of arsenic and other parameters like temperature, pH, electrical
conductivity, calcium, magnisum, sodium, potassium, chloride, nitrate, iron and
manganese. The ground water showed greater concentration of arsenic. Further more
the other studied parameters in ground water also showed higher levels. In subsurface
aquifer, reducing environmental condition prevails that favors the release of As from
Fe-Mn oxyhydroxides in the target aquifers.
Kazi et al (2009) studied the water of Manchar Lake (Pakistan) for different
physio-chemical parameters, with five different monitoring sites. The water samples
were collected from three significant sites named site 1, site 2 and site 3. According to
the result industrial effluents, domestic sewages, agricultural runoff are the main
sources for different physio-chemical parameters and saline seeps and living people,
boats and fishing are the major sources of water contamination in the lake.
Manzoor et al (2006) studied the ground water, effluents and soil for selected
heavy metals and the distribution and source identification of heavy metals in these
samples were investigated through using multivariate analysis. For this purpose the
ground water, effluents and soil samples were collected from three textile industries
Hattar Industrial Estate, Pakistan and studied for metals. The results showed greater
level of metals in these samples and the overall order was soil > effluent > water. The

33
result further indicated that the textile effluents were containing more level of toxic
metal like chromium, which is correlated to soil and water bodies contamination.
Similarly, other heavy metals such as cadmium, cobalt, iron, manganese, nickel and
zinc were also observed in greater concentration in the textile effluents. The study
highlights that the effluents from textile industries contaminate both the soil and
ground water. The water and soil were found to be contained less concentration of
heavy metals than the permissible limits.
Jonnalagadda and Mhere (2001) studied the nature, extent and contamination
sources for the water of River Odzi, Zimbabwe. For this purpose the water samples
were collected from 6 different points of the river for about 9 months and studied the
water samples for different physical parameters like temperature, electrical
conductivity, pH, total suspended solid, total dissolved solid, BOD, PO4 and NO3.
There was made a comparison between the water quality of Odzi River and water
quality indices at various sites. This finding indicates that upstream water quality in
the river was safe and not polluted. However the water quality in plains was
contaminated due to dumping of sewages and waste products from the farm lands and
Mutare River that carried the seepage from abandoned mine dumps.
Khan et al (1999) had determined the impacts of industrial effluents on the
water quality of River Kabul water at Amangarh, Nowshera and studied the water for
various chemical and biochemical parameters. The water was found to high level of
chloride, potassium, sodium, pH, total suspended solid and total dissolved solid.
IUCN (1994) has studied the water of River Kabul for different parameters.
The concentration of sodium, chloride and potassium were within acceptable limits in
the River Kabul for the fisheries and aquatic life.
Nafees and Ghulam (1991) had pointed out that different parameters were
reported in the water of River Kabul. Electrical coductivity, total dissolved solid, total

34
suspended solid and chloride etc were higher in concentration as compare to the
recommended standard for industrial effluents.
2.2 BIOACCUMULATION
Bhattacharya et al (2007) have investigated that some commercially edible
fish accumulate heavy metals through consumption of food, water and sediment from
the water ecosystem. The bioaccumulation in the fish tissues depends on the
concentration of heavy metals in water. The muscle and gills tissues showed greater
level of heavy metals like zinc, copper and lead than gonads and skin. Greater
concentration of copper and lead were found in gill tissue, while lowest content was
found in gonads. The consumption of contaminated fish impact the health of human
beings.
Yilmaz and Doga (2007) had studied the muscle, liver, gills, skin and gonads
of Carasobarbus luteus fish for bioaccumulation of heavy metals like silver,
cadmium, chromium, copper, iron, nickel, lead and zinc. The gonad showed more
content of heavy metals like silver, cadmium, chromium and lead were followed by
the liver, gill, skin and muscle, while less content of copper, iron, nickel and zinc
were found in liver followed by other tissues. The muscle of C. luteus had
accumulated less levels than the permissible limits for human consumption. The
copper concentration was very close to the permissible limits.
Fatma et al (2005) investigated concentration of heavy metals like Fe, Zn? Mn,
Pb, Cu and Cd in several organs like muscle, gills, liver and kidneys of 0. niloticus, T.
zillii and C. lazera and water from Abu Za'baal lakes. Different organs like muscle,
gills, liver and kidney of O nihiicus. T. zillii and C. lazera fishes showed highest
concentration of heavy metals like Fe, Zn? Mn, Pb, Cu and Cd than water.
35
Arvinda (2002) has investigated that accumulation of heavy metals in fish
species are related to several factors like temperature, pH of water, conductivity,
rainfall, hardness, salinity and also by biotic community interactions.
Chaudhari et al (2002) investigated that gills is the prime organ that is exposed
to water pollutants and play a vital role in absorption of heavy metals from the
surrounding environment. The significant decrease in total glycogen content of gill,
food mantle, digestive gland and the whole body of fresh water bivalve, Parreysia
cylindrical was due to pollution stress caused by heavy metals.
Onwumere and Oladimeji (1990) exposed Oreochromis niloticus to petrolume
refinery effluents and reported this fish to be accumulated trace metals such as zinc,
nickel, chromium, copper, cadmium, iron thousand times above the levels existing in
the exposure medium, while some metals were preferentially accumulated than others.
Colburn (1993) has measured that heavy metals tend to accumulate in the air
and in food chain and resulted into poisoning. The heavy metals are toxic in nature
and can impact both the endocrine and reproductive systems of both terristrial and
aquatic animals and has similar effect on organocholine chemicals.
Adeyeye (1993) has mentioned that level of metals in fish is an indication of
heavy metal pollution of the water. Contents of different metals in the gills, skin,
intestine, liver and muscle showed variation. Statistical comparison indicated that
each organ had significantly different metal concentrations.
El-Ezaby (1994) had reported that heavy metals are the major part of aquatic
pollutants. Since they were investigated in the ecosystem in critical concentration. Not
only environmental organizations, such as EPA and UNEP but also the public
communities are concerned about the possible adverse consequences of such
pollutants to the aquatic biota and indirectly, to humans. Heavy metals are toxic and
tend to accumulate in the body organs of aquatic organisms.

36
Zia and Mcdonal (1994) had exposed rainbow trout, Oncorhynchus mykiss to
water elevated levels of heavy metal like cadmium, copper and zinc and the gills, liver
and kidney were taken out and processed for heavy metals concentration. The gills
concentrated metals 4-11 fold higher than other organs like liver and kidney.
Allen (1995) had investigated the influence of heavy metals like mercury, lead
and cadmium by exposing the Oreochromus aureus fish to these heavy metals. The
chronic accumulation profile was determined in the liver, brain, gill filaments,
intestine, caudal muscle, spleen, trunk, kidney and gonads of Oreocheomis aureus.
The highest concentration of Cd was found in the kidney as compare to other
examined tissues. The spleen, intestine and liver also showed greater concentration of
Cd. While the caudal muscle and brain contained smaller content of Cd.
Kotze (1997) had worked out that the ability of each tissue to accumulate
metals can be attributed to the total amount of metal accumulation in that tissue.
Further more physiological differences and the position of each tissue in the fish can
also influence the bioaccumulation of a particular metal.
Brown and Gratzek (1980) had reported that there are hundred metals that
have been demonstrated to be toxic to fish. Among these groups that have received
the most notoriety are the synthetic organic insecticides, heavy metals, especially
mercury, the polychlorinated biphenyls, ammonia and chlorine. The fish intake heavy
metals from their surrounding environment by directly exposition to the metals and
and other ways through which wild or cultured fish accumulate toxic materials is
called food. Gills of the fish also play a vital role in the intaking of many toxic
materials from their environment.
Goldstein and Weese (1999) have investigated that Cyprinus carpio was
analyzed for bioaccumulation of heavy metals like cadmium, chromium, copper, lead,
nickel, selinium and zinc. Organs like liver, muscle and whole body showed different
contents. Generally, trace element contents were the greatest in liver, while

37
concentrations of cadmium, copper, nickel, lead and zinc in whole bodies were higher
than those in muscle. Concentrations of As and Se in muscle were similar to those in
the whole body. Concentration of chromium was lower in liver as compare to muscle
or whole body. There was present a stronger correlations between liver and whole
body concentration than those between liver and muscle concentration. But the
correlation between muscle and whole body concentration was the strongest.
Kotze et al (1999) investigated the accumulation of heavy metal like Pb in the
kidney. The physiological role of an organ helps role in accumulation of heavy metals
in different organs of a fish. Behaviour and feeding habits are also other factors that
play a vital role in accumulation of heavy metals in different tissues and organs of
fish.
Zyadah and Chouiki (1999) studied bioaccumulation of heavy metals like
copper, zinc, cadmium and lead concentration in flesh, gills and gonads of three
commericial fish Mullus barbatus, Merluccius merluccius and Boops boops. Cu, Zn
and Pb concentrations in flesh were smaller, while in gonads cadmium level was
greater. Liver had maximum content of Cu than other organs. Gonads and liver had
accumulated higher level of cadmium. Liver and gills showed greater concentration of
Pb as compare to other organs. The organs of Boops boops fish had accumulated
greater concentration of heavy metals as compare to others fish.
Larsson et al (1985) determined that the tendency of heavy metals to get
accumulation in organisms is one of the important property of metals and
bioavailability of trace metals is the key factor for determination of tissue
concentration. The bioaccumulation of metals depend on availability of metals in fish
tissues can be used as an indicator of environmental metal contamination.
Ramalingam and Rarnalingam (1982) had reported that accumulation of heavy
metals may be attributed to mortality or may be the cause of many biochemical and
pathological abnormalities in the aquatic organisms. Several investigations had

38
concerned with the effect of metals on the levels of tissue protein and lipid. Reduction
in protein levels was noticed in muscle and liver of Sarotherodon mossambicus
exposed to mercury.
2.3 GENOTOXICITY
Obiakoret al (2014) have investigated that micronucleus assay is a technique
that applicable in aquatic organisms to evaluate the genotoxicological impacts of
polluted water in both in vivo and in vitro. According to a report, gill cells are more
sensitive than the hematopoietic cells for micronucleus.
Nevenka et al (2008) have evaluated that determination of genotoxic effects of
toxic substances is necessary for comprehensive study to assess the genotoxicological
impacts of pollutants like heavy metals in the aquatic organisms. Although pollutants
like heavy metals can induce DNA damage in red blood cells of Balkan loach. They
are also promising for further standardization and the use of comet assay on fish in
environmental risk assessment.
Nevenka et al (2008) had investigated that DNA integrity in erythrocytes of
Cobitis elongate is affected by heavy metals. A higher degree of DNA damage was
seen in the blood of Cobitis elongata from polluted sites. The erythrocytes of
specimens showed different degree of DNA damage cells.
Yingmei et al (2006) have studied the degree of DNA damage cells in
different tissues of hepato pancreas of loach, Misgurnus anguillicaudatus fish after
exposed to heavy metals like Cd, Pb and Zn. The percentage of DNA damage cells
was increased with increasing exposure time to heavy metals. Therefore highest
percentage of DNA damage cells was observed in the skin as compare to other
tissues.
Cavas et al (2005a) has studied the Cyprinus carpio, Carassius gibelio and
Corydoras paleatus for genotoxicological effects of heavy metals. Fish were exposed

39
to different doses of cadmium, chromium and copper. Frequency of DNA damage
cells was evaluated comparatively in peripheral of liver than blood erythrocytes, gill
epithelial cells. It was noticed that, fish and their tissues showed sensitivity to the
heavy metal treatment.
Leonard et al (2004) has investigated metal toxicity. The main reason of heavy
metals toxicity is related to its oxidative stress. This result provides evidences that
metals are binding with nuclear proteins and DNA, which is resulted into DNA
damage and also causing oxidative deterioration of biological macromolecules.
Bowden et al (2003) had investigated that the loaches were collected from
control and polluted Sava River. The blood was collected and processed for degree of
damage DNA cells. Greater degree of DNA damage cells was observed in the blood
of loaches collected from the contaminated site than control site of Sava River. By
making comparison, there was more variation in the tail intensity of DNA among
animals. It is suggested that the tail length would be increased upto a plateau after
migrating to a specific distance. The tail does not show increasing in length after
reaching to specific distance.
Lee et al (1999) has determined that physical agents like solar radiation, x-
rays and a variety of chemicals such as heavy metals are the agents that induce DNA
damage cells in different types of tissues if these DNA damage cells did not repair.
Then there will be produced a cascade of biological consequences in the cells, organs,
animals and finally in community and population level. Reduced growth, abnormal
development and reduced survival of embryos, larvae and adults are related to DNA
damage cells in a variety of tissues of aquatic animals.
Steinert (1999) has investigated that the DNA damage in the cell is attributed
to the impact of multiple toxic chemicals like heavy metals and environmental
pollutants. However, this DNA damage is depends on both the toxicant content and

40
exposure time. It has been reported that different cells showed increased DNA
damage after exposure to pollutants for longer time.
Mitchelmore and Chipman (1998) have investigated that different fish species
were collected from control and polluted water of River Gomti. The fish from
polluted portion of river showed greater degree of DNA damage cells than control
site. This could be related to interaction of toxic heavy metals with DNA in polluted
water. The DNA damage could be produced from DNA single-strand breaks, DNA
double-strand breaks, DNA adduct formations and DNA-DNA and DNA-protein
cross-links.
Pandrangi et al (1995) worked out that various tissues and organs were
collected from differnt marine and fresh water animals and processed through comet
assay to assess DNA damage cells due to various toxic chemicals like heavy metals in
these organisms. Fish tissues that have been examined for DNA damage cells
including gut, intestine, liver, kidney, spleen, muscle, gills and gonads. Among these
tissues and organs gills and intestine showed greater frequency of DNA damage as
compare to other mentioned tissues.
Christopher (1994) has pointed out that blue gill sunfish, Lepomis
macrochirus was collected from contaminated water containing heavy metals. The
DNA was isolated from the blood cells and examined for DNA damage. The
quantitative measures were used to determine the difference in the number of double
and single strand breaks between DNA preparations. Both strand breakage was found
to be greater in fish exposed to heavy metal compounds as compare to non exposed
fish.
Kurelec (1993) has studied that DNA integrity is a complex intrinsic process
in the organism cell. It is also affected by many external factors like exposure
duration to heavy metals. Neoplasia, is a disorder that is attributed to exposure time to
genotoxic chemicals in lower animals, but other genotoxic disease syndromes are also

41
induced as a result of exposure of the animals to toxic heavy metals and finally the
extinction of species occured.
Gedik et al (1992) have determined that resident fish were selected as an
indicator organism to assess the genotoxicological impact of polluted water in the
resident fish species. For this purpose different fish species were collected from both
polluted and non polluted water and processed through comet assay. Different fish
species from polluted water showed greater frequency of DNA damage cells as
compare to control water. The micronuclei frequency was also varied according to the
season, kind of pollution and species of fish. Comet assay is more sensitive for
detecting low levels of DNA damage in both fish and human beings.
Dzwonkowska and Hubner (1986) had reported that cells from the gills of the
fish species were removed and used for the assay to assess DNA damage in these
cells. The gills showed greater degree of DNA damage as compare to other tissues
and this could be correlated to cells directly and constantly exposure of the gills to
DNA damage chemicals dissolved in the water.
Hooft man and de Raat (1982) have investigated that genotoxic pollutants
would not be only a threat to aquatic organisms, but also impact the aquatic
ecosystem and finally humans. The aquatic environment therefore should be
monitored. The micronucleus method was used in fish to assess the exposure duration
to genotoxic water pollutants like heavy metals.
Latt and Allen (1977) have reported that in the sister-chromatid exchange
assay there is assessment of exchange of chromosome fragments between sister-
chromatids after DNA strand damage as a result of heavy metals accumulation in the
aquatic organisms.

42
2.4 HISTOPATHOLOGY
Kaoud and Dahshan (2010) have worked out that different abnormalities like
skin, liver, kidney, lung and bladder cancer, cardiovascular disease, diabetes and
anemia as well as reproductive, developmental, immunological and neurological
disorders are attributed to heavy metals toxicity in the human body. Mining, industrial
effluents and sewages are various sources of metal contamination.
Metwally et al (2010) had investigated various histopathological changes like
hepatocytes vacuolation, cellular swelling, nuclear degeneration and congestion of
blood vessels in the liver and pathological disorders such as secondary lamellar
disorganization, rupture in lamellar epithelium and epithelial lifting in gills of
different fish after collection from polluted water.
Kaoud and Dahshan (2010) have studied the gills, kidney, liver, intestine and
muscle tissues of Oreochromis niloticus from Egyptian fish farms for pathological
abnormalities. Pathological disorders like mild congestion and edema of the primary
lamellae. Severe edema, hyperplasia, mononuclear leukocytic infiltration, edema and
congestion were seen in the gills tissue of the fish. In the liver degeneration of the
hepatocytes and intravascular haemolysis in blood vessels, congestion of central vein,
hemorrhages were observed. The kidney showed hydropic swelling of tubules and
large glomerulus in diameter. Various pathological abnormalities such as
degeneration in muscle bundles with aggregations of inflammatory cells between
them and focal areas of necrosis, atrophy and edema of muscle bundles as well as
splitting of muscle fibers were observed in the muscular tissues. The intestine also
showed different pathological changes like atrophy in the muscularis, degenerative
and necrotic changes in the intestinal mucosa and submucosa with necrotized cells
aggregated in the intestinal lumen, edema and atrophy in the submucosa.

43
Elahee and Bhagwant (2007) have studied that gills histopathological lesions
as indicators of exposure to heavy metals have previously been used in numerous
laboratory and field studies around the world.
Bertin and Averbeck (2006) had investigated that heavy metals are an
important toxic environmental pollutants. In humans and other animals like fish heavy
metals are associated with damaging and cancer of different tissues like prostate,
lungs and testes. Acute exposures of the fish to heavy metals are responsible for
damage to these organs. Different changes like obstructive airway disease,
emphysema, renal failure, bone disorders and immuno-suppression are related to
chronic exposure to heavy metals.
Nero et al (2006) had studied the gills and liver of Perca flavescens and
Carassius auratus fish for different pathological abnormalities after collection from
polluted water. Generally gills and liver pathological data indicates that degenerative
changes were the most prevalent and sensitive abnormalities seen in these fishes after
exposure to elevated levels of heavy metals in polluted water.
Fatma et al (2005) have investigated that examination of fish gills, collected
from contaminated Abu Za'baal lakes showed marked histopathological changes.
Different histopathological abnormalities like proliferative, degenerative and necrotic
changes in the epithelium of gills filaments and secondary lamellae, edema in
secondary lamellae, separation of epithelium of the secondary lamellae from the
lamellar supporting cells, dilation and congestion in the blood vessels of gills
filaments, atrophy in secondary lamellae, bulging at the tips of secondary lamellae
and dark deposits on the surface of gills epithelia were observed in the gills tissue.
Sabry et al (2005) have investigated histopathological changes in epidermis,
dermis, hypodermis and underlying muscles of Oreochromis niloticus fish specimens
collected from El-Kanater, Benha, Zefta and Talkha stations and found necrosis of
epithelial and mucous cells of the epidermis, degeneration, necrosis and edema of

44
muscle fibers. They also revealed congestion and dilation of the dermal blood vessels
together with hypodermic inflammatory signs which may extend to the underlying
muscle.
Yacoub et al (2003) has studied several histopathological alterations in liver of
different fish. These alterations including vacuolar degeneration in the hepatocytes,
focal areas of necrosis, haemorrhage and haemostderin between the hepatocytes and
around hepatic and hepatoportal blood vessels and dilation and congestion in hepatic
and hepatoportal blood vessels. The observed degeneration in the liver may be
attributed to disruption in the lysosomal membrane, which is very sensitive to
toxicants as heavy metals and thus their enzymes released and caused degeneration
and vacuolation of cytoplasm of hepatocytes.
Mohammad (2003) has mentioned that different histopathological
abnormalities were observed in the gills and liver of C. gariepinus fish after collection
from El-Rahawy drain. The pathological abnormalities in gills of C. gariepinus could
be correlated to toxicants reaction after intaking or an adaptive response to prevent the
entry of the pollutants through the gill surface.
Ambrose et al (1994) have measured that heavy metal like zinc is known for
its essential role in growth, immunity, DNA replication, body’s defensive system, cell
division, cell growth, wound healing and carbohydrates breaking down. High zinc
intake leads to enfeeblement, stunted growth and also attributed to metabolic and
pathological disorders in various organs of fish.
Orecka and Grabda (1986) have measured that heavy metals were determined
in fish species like eels netted from contaminated lakes in north western Poland.
Steady deterioration in the health of eels, chronic degenerative inflammation of the
internal organs, non-specific anemia, aplasia or hypoplasia of the erythrocytes in fish
was observed.

45
Laurent (1984) has evaluated that examination of fish gills collected from Abu
Za'baal lakes showed marked histopathological changes. These changes are including
proliferative, degenerative and necrotic changes in the epithelium of gills filaments
and secondary lamellae, edema in secondary lamellae, separation of the epithelium of
the secondary lamellae from the lamellar supporting cells, dilation and congestion in
the blood vessels of gill filaments, atrophy in secondary lamellae, bulging at the tips
of secondary lamellae and dark deposits on the surface of gills epithelia. The studied
changes in the respiratory lamellar epithelium may increase the epithelial thickness,
which prevent the entry of toxic metals into the blood stream.
Daoust et al (1984) observed pathological lesions under microscope in various
tissues of fish after exposure to heavy metals like mercury and copper and different
pathological abnormalities like apoptosis of lamellar epithelial cells and lamellar
fusion were observed in different tissues. The latter process occurre either by simple
apposition of adjacent lamellae to each other or through epithelial hypertrophy and
hyperplasia
Srivastava et al (1979) investigated different pathological disorders and
accumulation of cadmium in the fish tissues after exposure to cadmium concentration.
Cadmium exposure induces pathological abnormalities like appearance of granular
deposits in the liver, atrophy of the proximal renal tubules and increases in chloride
cell turnover in the gills.

46
CHAPTER-3
PHYSICAL AND CHEMICAL PROPERTIES OF WATER
COLLECTED FROM THE RIVER KABUL
3.1 INTRODUCTION
Water is necessary for the survival of both plants and animals. On average
human beings consume about 2 liter of water every day. There is about 80% water on
the earth surface. Out of the estimated 1011 million km3 of the total water present on
the earth, only 3340 m3 of water is available for drinking, agriculture and domestic
and industrial consumption. The rest of the water is locked up in ocean as salt water,
polar ice caps and glaciers and under ground. Due to increasing industrilization and
exploding, the demand of water supply is also increasing tremendously. Moreover
sewage, industrial wastes and a wide array of synthetic chemical are the main causes
of contamination for this limited quantity of water. The meanance of water born
diseases and epidemic still threatents not only the human but also the fish population.
Thus both the quality and quantity of clean water supply are essential for the welfare
of mankind (Dara, 1993).
3.1.1 Physico-chemical Parameters
The water of River Kabul was analyzed for different physico-chemical
parameters. The levels of pH, total suspended solid, total dissolved solid, electrical
conductivity, total alkalinity, sodium, potassium and chloride were high as compare to
national environmental quality standards (Yousafzai, 2004). The water of River Kabul
was analyzed for different parameters. Analytical data showed that pH, total
suspended solid and total dissolved solid were present in high concentration (Khan
and Ullah., 1991). Previous studies have also reported a high content of total
dissolved solid from different water bodies (Subramanian, 2004; Kamin, 2001; Khan
and Ullah, 1991). The impacts of industrial discharges on the quality of River Kabul
water at Amangarh, Nowshera was studied for various chemical and biochemical

47
parameters like pH, total suspended solid, electrical conductivity, alkalinity, chlorides,
sulfates, sodium, potassium etc. The results indicated localized pollution within half
kilometer after the confluence point where the quality of the river water was reported
to have deteriorated (Akif et al., 2002; Khan and Mumtaz, 1997; Khan et al.,1999).
In another finding a high level of total suspended solid has been also reported for
River Swat at Mingora, Pakistan (Muhammad et al., 1998).
The water of different rivers such as Kerala, Cauvery, Gomti, Krishna,
Godavari, Mahanadi, Narmada, Tapti, Indus, Brahamputra and Ganges was analyzed
for total alkalinity and all these rivers showed different values for total alkalinity
(Subramanian, 2004). The water of River Kabul has high level of total conductivity as
related to the concentrations of TDS, TSS and major ions (IUCN, 1994). The water of
River Kabul has greater alkalinity level, which is essential for buffering pH changes
and for reduction heavy metals toxicity. The high values of alkalinity, total suspended
solid and total dissolved solid all are helping in reductionof the toxicity of what would
be lethal concentration of metals (IUCN, 1994).The water of ten rivers was analyzed
for suspended load quantitatively and qualitatively. The Chitral and Bara rivers were
found turbid most followed by River Kabul, Panjkora and Swat. Other parameters that
were studied are including pH, total suspended solid, electrical conductivity, sodium
and potassium, which were within the permissible limits (Sabir, 1996). The analysis
of effluent sample of River Kabul indicated significant amount of total dissolved
solid. The TDS was within permissible limits laid down by National Environmental
Quality Standards (NEQS) for municipal and liquid industrial effluents of Pakistan
(Kamin et al., 1985). The water of River Kabul was studied and found with high level
of total alkalinity (Yousafzai, 2004).
The water of River Kabul was analyzed for total dissolved solid concentration
during high and low flow seasons. The total dissolved solid had high content for both
low and high flow seasons (Yousafzai, 2004). The aquatic pollution due industries in
48
the River Kabul is a major problem. The water of the river was analyzed for different
parameters. Analytical data showed that pH, total suspended solid and total dissolved
solid were high in concentration (Khan and Ullah, 1991). Silt, clay, fine particles of
organic and inorganic matter, soluble organic compounds are the structural
componenets of total suspended solid. Thus the concentration in River Kabul are
greater but in some cases the level of total suspended solids are above desirable levels
for all uses, they are mainly a natural characteristic of the river due to its catchment
and discharge characteristics. Natural erosion is greater in mountainous areas and
volcanic regions. The source of much of the total suspended solid is erosion of rock
and soil rather than pollution (IUCN, 1994). Many people described the River Kabul
as a ‘dirty river bescuse it is very turbid. This is due to the high total suspended solid
(TSS) carried by the river. This is high during both low flow and high flow conditions
(IUCN, 1994). Total suspended solid (TSS) values at all the sampling sites of the
River Kabul including dam exceeded the NEQS value for this parameter. This could
be correlated to high flooding during high flow due to snowmelt on the peaks of the
surrounding hills, both in Pakistan and Afghanistan and monsoon rains during
summer months, excessive deforestation, weathering, soil erosion, mining and other
anthropogenic activities along the banks of the river (Yousazai et al., 2010a).
The River Kabul is receiving the effluents from associated industries near
Nowshera. The water was taken from River Kabul and analyzed for different
parameters such as electrical conductivity, alkalinity, potassium, chloride and pH. The
contents of all these parameters were slightly higher in the above water than the below
(Ali, 1995). The water of River Swat was analyzed and found high value for total
alkalinity for River Swat at Mingora, Pakistan (Muhammad et al., 1998). The water of
River Kabul was analyzed for alkalinity, chloride, potassium and sodium. The effluent
sample discharges high quantity of chloride, magnessium, potassium and sodium both
during low and high flow into the River Kabul. This discharge has caused a
significant increase of chloride, potassium and sodium in down stream samples both
49
during low and high flows (Yousazai et al., 2010b). The water of different rivers such
as River India, River Gomti, River Godavari, River Indus, River Brahamputra and
River Ganges was studied and found that the Cl level was highest in the River
Godavari and lowest in River Indus (Subramanian, 2004). Agricultural, industrial and
domestic waste water are the major sources of chlorides, potassium and sodium in the
River Kabul. Kitchen and human wastes are the sources of chloride in municipal
sewage. Large amounts of chlorides also come from the industries (Khan, 1996;
WWF, 2001).
The water of River Kabul from Warsak dam was studied for different physico-
chemical parameters. The water from this site had high chloride concentration for
both lowand high flow periods (Yousafzai, 2004). When the chloride content of given
sewage is found too high, it may indicate the presence of industrial wastes in the
water bodies (Ramakar et al., 2005). The water sample from Warsak dam had been
taken and studied for alkalinty. The water showed high content of alkalinity
(Yousafzai, 2004). Various physical, chemical and biological parameters in the water
of the River Kabul at Nowshera were analyzed and found that the water of the main
river was not much affected by the pollutants of the industries (Butt, 1989b).
The impacts of industrial effluents and sewages on the water quality of River
Kabul was studied. The water was analyzed and found high sodium content from
polluted sites of River Kabul (Yousafzai, 2004). This attempt was made for the first
time in NWFP with special refrence to water pollution analysis of the industrial
effluents in the River Kabul. The pH, electrical coductivity, total dissolved solid, total
suspended solid and chloride etc were in higher concentration as compare to the
recommended standard for industrial effluents (IUCN, 1994). The impacts of
industrial effluents on Kabul River was studied. Various industrial effluents, which
are ended into River Kabul revealed high concentration of pH, chloride, potassium,
sodium and salinity but they all were within permissible limits (Khattak and

50
Rehman.,1992). The effluents of selected industries located at small Industrial Estate,
Kohat Road, Peshawar were analyzed and found higher concentration of TSS, TDS,
potassium and chloride and sodium in it. Higher values of these parameters are of
great concern because finally these effluents are drained into River Kabul (Jan et al.,
2002). The water of River Kabul was studied for different parameters. The
concentration of sodium, chloride and potassium were within acceptable limits in the
River Kabul for the maintenance of fisheries and aquatic life (IUCN, 1994).
3.1.2 Heavy Metal Parameters
Due to toxicity of heavy metals, accurate informations on their concentration
in aquatic ecosystem are needed, especially from natural, uncontaminated habitats
(Janssen et al., 2000). Analysis of heavy metals like Pb, Ni and Cu in the water of
River Kabul revealed that they were below permissible limits (Nafees and Ghulam,
1991). The impacts of industrial effluents on Kabul River were studied. Various
industrial effluents revealed high concentration of heavy metals like Cu, Zn, Fe, Cd,
Pb and Ni. Level of most trace elements exceeded the limits for irrigation water
(Khattak and Rehman., 1992). The water of the River Kabul was evaluated for
different heavy metals like Cd, Cr, Ca, Pb, Fe, Mn and Zn. The Kabul River receives
sewage and effluents from Peshawar through Budni nalla and Ganda vinda and
disturbs it ecological status. The analysis of these effluents revealed high
concentration of Cd, Cu and Fe (Nawab, 1992). The effluents of selected industries
located at small Industrial Estate, Kohat Road, Peshawar was analyzed for heavy
metals and found higher concentrations of Fe, Mn and Cr in it. Higher values of these
parameters are of great concern because finally these effluents are drained into River
Kabul (Jan et al., 2002). The heavy metals like Cu, Fe, Pb, Cd, Mn and Zn
concentrations in the water of El-Rahawy drain and River Nile at El- Kanater El-
Khyria were seasonally estimated. It was found that heavy metals concentration in
water from El-Rahawy drain region were higher than those obtained from River Nile
(Mohammad et al., 2013). Heavy metals are one of the major types of toxic pollutants

51
commonly present in surface water and highly toxic to marine and fresh water aquatic
life (DWAF, 1996).
The chemical composition of sea and fresh water influences to a great extent
the speciation of heavy metals. In river water, large proportion of metals is bound to
be organic and inorganic particulate matter (Salomons and Forstner, 1984). Many
studies were previously carried out on the level of heavy metals in water (El-Rafe,
1991; Abdel-Shafy et al., 1995; Khallaf et al., 1998; Bahnasawy, 2001; Sabae and
Abdel-Satar, 2001). The water from Abu Za'baal lakes in Egypt was studied to assess
the level of some heavy metals like Fe, Zn? Mn, Pb, Cu and Cd in water of this river.
The heavy metals were found in high contents in the River water (Fatma et al., 2005).
The presence of heavy metals in river, lake or any aquatic environment can impact the
aquatic biodiversity and ecosystems due to their toxicity and accumulative behavioure
(Heath, 1987). The heavy metals like chromium, copper, manganese and zinc are
accumulated in sediments, aerobic and anaerobic bacteria in lakes, rivers and streams
(Shahunthala, 1989). Metals crap market, activities of the blacksmiths by the lake,
municipal wastes on the bank of the lake, agricultural activities within the catchments
area of the lake and intense irrigation practices are sources of heavy metals in lake
Geriyo (Jonathan and Maina, 2009).
The water of Ogun River was studied for heavy metals like lead and cadmium
concentrations and found these metals were to be high above the WHO limit (Jaji et
al., 2007). It is known that waste water and surface waters are the major sources of a
multitude of chemical substances like heavy metals in the water bodies (Reifferschied
and Grummt, 2000). This assumption is also sustained by the results of the chemical
analysis of water and showing increased level of various heavy metals such as
mercury, arsenic, copper, cadmium, chromium and manganese in municipal water at
the location Ivanja Reka. Wet land ecosystems also receive composite effluents
containing greater level of heavy metals, which are of the prime environmental

52
concern especially for the biotic components that interact with contaminated aquatic
environment (Abdelmeguid et al., 2002; Wong, 2003; Raychaudhuri et al., 2008).
Sharp declining of heavy metals in water and fish samples could be attributed to
recycling of heavy metals in the river and their deposition into the sediments (Johnson
et al., 2005, Tipping et al., 2006).
Metals have no natural elimination process in the aquatic ecosystems, so they
transport from one compartment to another compartment inside the aquatic
environment including the biota (Chapman, 1992). Heavy metal such as Cr content
was greater during high than low flow conditions in the River Kabul. The range of Cr
from 0.002 to 0.02 mg/l is considered to be acceptable standards for maintenance of
fisheries and aquatic life is depending upon the valency state of the chromium. These
values were greater during high flow conditions throughout the river. Three branches
viz Shah Alam, Adezi and Naguman of the River Kabul showed greater level of Cr
than the main river. The Naguman branch was more affected than other two branches,
where high concentration was present downstream of the Akbar Tannery (IUCN,
1994). Heavy metal like Zn content compare to a standard of 0.03 mg/l for the
maintenance of aquatic life was also high in the River Kabul. This is the case for the
Shah Alam branch of River Kabul during high and low flows. However the levels of
zinc is generally greater in the water of river during high flow (IUCN, 1994). Metals
can be accumulated in bottom sediments as a result of remaining for many years.
Sediments are considered the main repository of heavy metal in aquatic environment
(Asaolu and Olaofe, 2005; Olowu et al., 2010).
Heavy metals are naturally occurring elements (Nies, 1999; Mighall et al.,
2002) and are present deep in the earth crust (Malle, 1992). Natural erosion processes
like weathering and abrasion of rocks, soils and sediments by wind and water are
responsible to add heavy metals into aquatic environment. Volcanic eruptions, forest
fires and aerosol formation above seas are also natural sources of heavy metals for
53
aquatic environment. These processes are helping in cycling of metals in the
environment, in air, surface waters and soil (Mighal et al., 2002). The river water
survey reported three major water issues from River Kabul. They are organic water
pollution in the Shah Alam, Naguman branches and lower main river and the survey
found the greatest level of chromium in the three branches and the Bara River (IUCN,
1994). In the River Kabul three metals like Cr, Cu and Zn were present in content
above those suitable for the maintenance of fisheries and aquatic life. The recorded
levels were greater during high flow conditions due to re-suspension from sediments
and possibly diffuse pollution sources (IUCN, 1994). The concentration of heavy
metals such as Pb, Na, Ca and Ni were well within limits in the River Kabul for the
maintenance of fisheries and aquatic life (IUCN, 1994). The heavy metal like Cu level
was higher in the River Kabul during high flow than low flow conditions and were
frequently above normal standards for fisheries and aquatic life. However toxicity of
copper was markedly reduced in very hard water such as the Kabul River and toxic
concentration was high (Anon, 1976).
3.2 MATERIALS AND METHODS
3.2.1 Study Area Description
For detail see page≠2
3.2.2 Sampling Sites
The water and fish samples were collected from different sites of River Kabul.
The Kabul River enters Pakistan through Shalman in Khyber Agency. It then flows
through the Khyber and Mohmand Agencies until it reaches Warsak dam constructed
in 1960 without any fish ladder for upward migration of inhabitant fish. Below the
dam, it is divided into three main branches are known as Shah Alam, Nagoman and
Adezai and then joins the River Indus at Kund (Attock). River Swat also joins River
Kabul a few km below the dam (IUCN, 1994).
54
There are about 81 industrial units, the heavy metals containing effluents of
which are discharged directly or indirectly in the River Kabul (IUCN, 1994, Khan et
al., 1999). Besides that sewages of Peshawar city, several large towns, large number
of villages and several Afghan refuges camps ultimately drain into River Kabul.
3.2.3 Sampling Points
To evaluate the quality and quantity of physico-chemical and heavy metal
paramerters at Akber pora, Nowshera and adjacent Amangarh industrial area of River
Kabul, water from the following points of the main River and Warsak dam were
collected (Fig.3.1).

55
Fig 3.1: Water sampling site 4 (water sample B), site 1 (water sample C)
and site 2 (water sample D) at River Kabul (polluted samples) and
site 3 (water sample A)
56
3.2.4 Water sample from Warsak Dam
Water sample(A) was collected from non polluted site 3 (Warsak dam) water
reservoir constructed on River Kabul in 1960, which is about 60 km upstream of the
polluted part of the River and can be called safe in the sense of being far away from
the dense human and industrial population. This was considered as control sample.
3.2.5 Water samples from the main River
Water samples (B) (C) and (D) were collected from polluted part of the main
River at Akber Pura (site 4), Aman garh (site 1) and Nowshera (site 2). Site 4 is at the
main river after city sewage discharged into it. Site 1 is at the main River after
industrial effluent dumped into it and site 2 is at the main River after city sewages
flows into it.
3.2.6 Collection of water samples
Water samples were collected from the sampling sites in 1000ml bottles
already cleaned by vim and distilled water. At the time of sampling these bottles were
also washed with the respective river water. The samples collected below the surface
about 2-3 feet away from the river banks in such a way that no bobbles were allowed.
Conductivity, TDS and pH for the river water were determined immediately on the
spot and rest of the parameters were analyzed in the laboratory. Sampling was
conducted three times a year from January 2012 to December 2014. Water samples
from main river were collected once in high flow season in the month of June and two
times a year in low flow season in the months of January and December to highlight
the effect of water volume on the quantity and quality of water pollution.
3.2.7 Preservation of water samples
Water samples for heavy metals estimations were collected in separate 1 liter
plastic bottle and were preserved with 5ml nitric acid (50%) per liter to prevent metal
absorption on the inner surface of container. Samples for physico-chemical

57
parameters were collected in separate 1 liter plastic bottle. The water samples were
then stored at 4c° in the refrigerator before analysis for various physico-chemical and
heavy metal parameters.
3.2.8 Water analysis
To obtain information about the degree of contamination caused by industrial,
domestic and agricultural effluents with respect to concentration of chemical,
physical pollutants and heavy metals, samples were collected from three polluted sites
(Akber pora, Aman garh and Nowshera) downstream and from one spot of non
polluted site (Warsak dam) upstream of the River Kabul. Which is about 35 Km
upstream of the polluted site B of the river and can be called safe in the sense of being
far away from the dense human population and industrial activities. This was
considered as control sample. The physico-chemical parameters like pH, total
suspended solid (TSS), total dissolved solid (TDS), alkalinity, chloride, electrical
conductivity, sodium (Na) and potassium (K) were analyzed in the water samples
from both polluted and non polluted sites of River Kabul and the heavy metals such as
zinc, nickel, chromium, copper, cadmium, lead, iron, manganese, mercury were
determined in the water samples from both polluted and control portions of River
Kabul.
3.2.9 Physico-Chemical Parameters
3.2.9.1 pH
Model; 7020- pH meter.
pH values were determined on the spot in the quickest possible time. First the
pH meter was calibrated with the buffer 4 and 7. Then the pH values of the water
samples from three spots of polluted sites and one from non polluted site of River
Kabul were measured through pH meter.

58
3.2.9.2 Electrical Conductivity
Model; AGB 1000.
The instrument was calibrated with distilled water. Then conductivity of the
water samples from polluted and non polluted sites of River Kabul was measured in
microsiemenes per centimeter through conductivity meter.
3.2.9.3 Total Dissolved Solid (TDS)
The instrument was calibrated with distilled water. Then total dissolved solid
of the water samples from polluted and non polluted sites of River Kabul was
measured in milli gram per liter through TDS meter.
3.2.9.4 Total Suspended Solid (TSS)
First of all filter paper was taken and dried in oven at 103-105C0 for an hour.
After heating the filter paper kept in dessicater for moisture content absorption.The
weight of filter paper was noted and then a known amount of unfiltered water from
polluted and non polluted sites of River Kabul was taken in flasks and filtered through
filter paper. Filter paper was again kept in the oven at 103-105C0. The total suspended
solid was calculated and reported as mg/l.
3.2.9.5 Chloride
The chloride was determined through PC multi direct spectrophotometer.
Firstly filled a clean vial (24 mm) with 10ml of water samples and closed the vial with
cap tightly. Then placed the vial in the sample chamber and pressed the zero key.
Then removed the vial from the sample chamber and added one chloride T1 tablet to
the water sample and crushed through stirring rod and dissolved the tablet. Then
another chloride T2 tablet added to the same water sample and crushed tablet through
stirring rod and dissolved the tablet. Then closed the vial with the cap tightly and
swirl the vial several times until the tablet is dissolved. Then placed the vial in the
sample chamber and pressed the key and waited for a reaction period of 2 munites.

59
After the period completion, the reading starts automatically and the result is shown in
the display in mg/l chloride.
3.2.9.6 Total Alkalinity
The total alkalinity was also determined through PC multi direct
spectrophotometer. Firstly filled a clean vial (24 mm) with 10ml of water samples and
closed the vial with cap tightly. Then placed the vial in the sample chamber and
pressed the zero key. Then removed the vial from the sample chamber and added one
Alka-M- Photometer tablet straight from the foil to the water sample and crushed the
tablet using a clean stirring rod and dissolved the tablet. Then closed the vial with the
cap tightly and swirl the vial gently several times until the tablet is dissolved. Then
placed the vial in the sample chamber and pressed the key and waited for a reaction
period of two minutes. After the period completion, the reading starts automatically
and the result is shown in the display in mg/l CaCO3.
3.2.9.7 Sodium and Potassium
Atomic absorption Spectrophotometer (Spectra-AA-700) was used for the
determination of sodium and potassium in the water samples. The same method of
sample digestion and preparation was followed as adopted for the heavy metals
determination. Wave lengths set were 589.0nm for soduim and 766.5nm for
potassium in the presence of air acetylene flame.
3.2.10 Heavy Metals Parameters
Heavy metals like zinc, nickel, chromium, copper, cadmium, lead, manganese,
iron and mercury were determined in the water samples from both polluted and
control sites of River Kabul. Water sample (100ml) in the volumetric flask was
acidified with 5ml nitric acid (55%) and kept on evaporated on a hot plate to about 20
ml. 5ml additional nitric acid (55%) and perchloric acid (70%) and a few drops of
beads were added to prevent bumping. The mixture was then evaporated until a brown
fumes change into dense white fumes. The sample was removed from hot plate,
60
cooled down to room temperature and diluted to 100ml volumetric flask. The
solutions were then aspirated into flame Atomic Absorption Spectrophotometer
(Spectra-AA-700) for determination of Zn, Ni, Cr, Cu, Cd, Pb, Mn, Fe and Hg under
the following operating parameters. The flame used was air acetylene (A-AC).
Standard curve were prepared and the optical density obtained were caliborated
against the standard curves to know the contents of heavy metals in the water.

61
Table 3.1 Operating data of Atomic Absorption Spectrophotometer for
determination of metals
Elements Wave length (nm) Flame Working range (µgL-1)
Zn 213.9 AA (L) 0.4-1.6
Ni 232.0 AA (L) 3-12
Cr 357.9 AA (R) 2-8
Cu 324.7 AA (L) 2-8
Cd 228.8 AA (R) 0.5-2
Pb 217.0 AA (L) 5-20
Mn 279.5 AA (L) 1-4
Fe 248.3 AA (L) 1-4
Hg 253.7 AA (L) 100-400
Abbreviations, AA: air acetylene, R: Fuel-rich, L: Fuel-lean
3.2.11 Statistical Analysis
Statistical analysis was done by using ANOVA software for windows. Mean
and standard deviation values of the data were determined. The different sets of data
were analyzed for statistical differences by using student’s t –test (two-tailed). a P
value <0.05 was considered to show statistical significance.
3.3 RESULT AND DISCUSSION
3.3.1 Water Analysis of River Kabul
In the present study water samples from polluted sites (near Akber pura
Peshawar Amangarh, Nowshera) and control site (Warsak dam) of River Kabul were
taken from January 2012 to December 2014 and was studied for different Physico-
62
chemical and heavy metal parameters. Physico-chemical parameters include pH, total
suspended solid, total dissolved solid, total alkalinity, chloride, electrical conductivity,
potassium and sodium and heavy metals parameters include zinc, nickel, chromium,
copper, cadmium, lead, iron, manganese and mercury.
3.3.1.1 Warsak dam upstream water from site 3 (Sample A= Control)
a. Physico-Chemical Parameters
Water samples from Warsak dam (control site 3) were analyzed for both
Physico-chemical and heavy metal concentrations and showed less Physico-chemical
and heavy metals contents than polluted sites 1 and 2 (Table 3.2 and Figs 3.2-3.5).
Water sample from this site of River Kabul had a pH varying between 7.1 and
7.8 with mean values of 7.3±1.7 during low and 7.3±1.0 during high flow periods.
Total suspended solid (TSS) concentration was in the range of 375- 735 mg/l with
mean values of 418.8±398.9 mg/l for low flow and 715.0±138.0 mg/l for high flow
seasons. pH and EC values of the present study areas were higher than those reported
by (Subramanian, 2004; Kamin, 2001; Khan and Ullah, 1991).Total dissolved solid of
all the Warsak dam water was in the range of 298- 680 mg/l with mean values of
581.1±255.9 mg/l during low flow season and 337.0±132.2 mg/l for high flow season.
The electrical conductivity in water sample from Warsak dam was ranged between
263-363µs/cm with mean values of 343.1±111.7µs/cm during low flow and
273.0±60.3µs/cm during high flow periods. The chloride ranged between 6-15 mg/l
with mean values of 12.8±6.2 mg/l for low flow and 8.7±5.4 mg/l for high flow
seasons.
The potassium (K) range was 1.0 -2.9 mg/l with mean values of 1.1±0.7 mg/l
during low flow and 2.4±1.1mg/l during high flow periods. The sodium concentration
was ranged between 3-18 mg/l with mean values of 10.8±8.5mg/l for low flow and
4.0±2.3 mg/l for high flow seasons. Similarly water from this site had total alkalinity
in the range of 85-124 mg/l with mean values of 108.5±55.0 mg/l for low flow and

63
93.7±32.8 mg/l for high flow periods. The present results of higher TDS, TSS, EC
and TA contents in water sample from this site of River Kabul agree with the previous
findings (Akif et al., 2002; Khan and Mumtaz, 1997; Khan et al., 1999). On
comparison with NEQS recommended values for effluents, all physico-chemical
parameters except total suspended solid (TSS) were within recommended manimum
limits.
Total suspended solid (TSS) had mean values of 418.8±398.9 mg/l for low
flow and had 715.0±138.0 mg/l for high flow periods. Both these values were higher
than NEQS recommended limit of 150 mg/l for this parameter. This shows that TSS
concentration was the lowest during winter and highest during summer. The highest
concentration of TSS during high flow was correlated to flooding and soil erosion in
the river.The Kabul River described by many people as a ‘dirty river’ because it is
very turbid. This could be attributed to greater level of TSS in the river, which ranged
from 10 to 800 mg/l during low flow and from 340 to 1,310 mg/l during high flow
conditions (IUCN, 1994). Similarly Yousafzai (2004) had also reported high TSS
concentration with a mean value of 630 mg/l for high flow from the same water
resources of River Kabul that verifying the validity of our findings. Comparing our
study with the findings of Yousafzai (2004) and other workers showed an increasing
level of TSS in water from this site in the last few years. Rest of the physico-chemical
parameters like TDS, EC, TA, Cl, Na, pH and K in water from this point were below
the permissible limits proposed by NEQS.
The reservoir of Warsak dam is safe and quiet fit for aquatic life. The warsak
dam has been built in the tribal areas, away from the industrial activities and human
population. The only parameter which exceeds the NEQS limits is TSS value, which
can be correlated to excessive flooding in the River Kabul (on which Warsak dam is
constructed), during summer (June, July and August). During these months snow melt
occurs on the tops of surrounding hills, both in Pakistan and Afghanistan and causes

64
flooding in the River Kabul, moreover moon soon rains also add to flooding. Other
reason can be correlated to mining activities and deforestation in the adjoining hills.
As Wallago attu, Ompok bimaculatus, Labeo dyocheilus, Cyprinus carpio and
Aorichthys seenghala have most of the above stated adaptations for such environment,
therefore TSS can no way be a limiting factor.
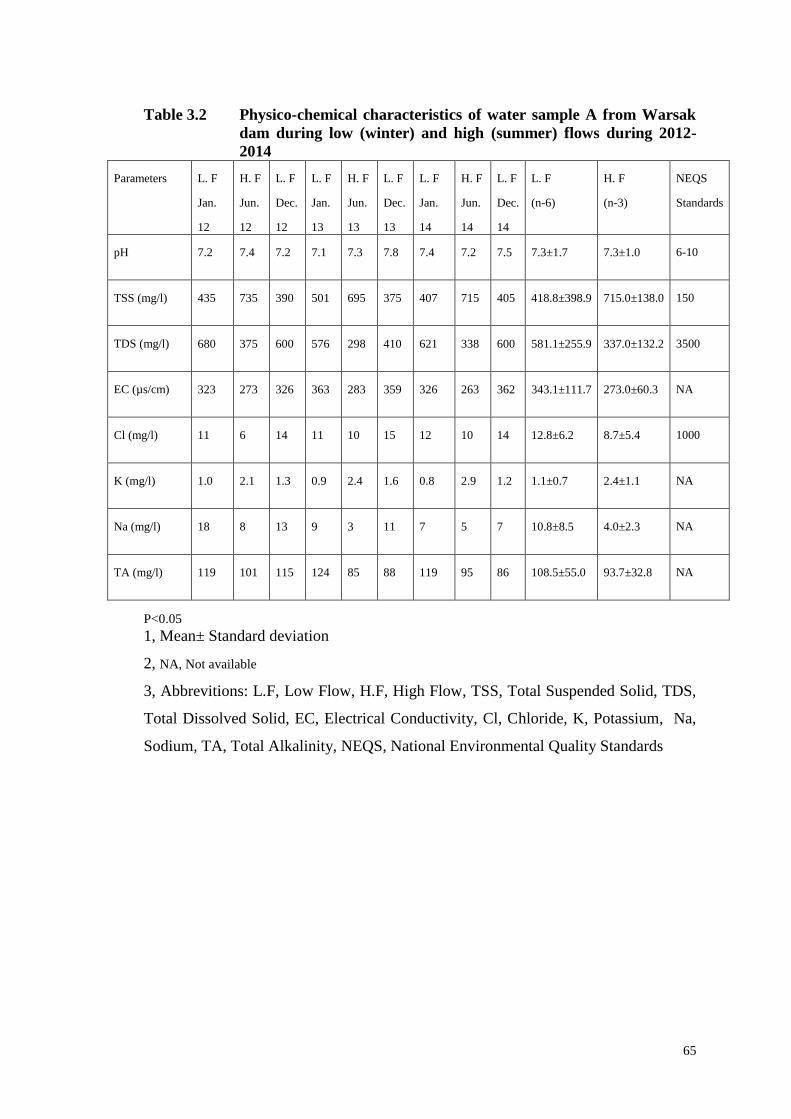
65
Table 3.2 Physico-chemical characteristics of water sample A from Warsak
dam during low (winter) and high (summer) flows during 2012-
2014
Parameters L. F
Jan.
12
H. F
Jun.
12
L. F
Dec.
12
L. F
Jan.
13
H. F
Jun.
13
L. F
Dec.
13
L. F
Jan.
14
H. F
Jun.
14
L. F
Dec.
14
L. F
(n-6)
H. F
(n-3)
NEQS
Standards
pH 7.2 7.4 7.2 7.1 7.3 7.8 7.4 7.2 7.5 7.3±1.7 7.3±1.0 6-10
TSS (mg/l) 435 735 390 501 695 375 407 715 405 418.8±398.9 715.0±138.0 150
TDS (mg/l) 680 375 600 576 298 410 621 338 600 581.1±255.9 337.0±132.2 3500
EC (µs/cm) 323 273 326 363 283 359 326 263 362 343.1±111.7 273.0±60.3 NA
Cl (mg/l) 11 6 14 11 10 15 12 10 14 12.8±6.2 8.7±5.4 1000
K (mg/l) 1.0 2.1 1.3 0.9 2.4 1.6 0.8 2.9 1.2 1.1±0.7 2.4±1.1 NA
Na (mg/l) 18 8 13 9 3 11 7 5 7 10.8±8.5 4.0±2.3 NA
TA (mg/l) 119 101 115 124 85 88 119 95 86 108.5±55.0 93.7±32.8 NA
P<0.05
1, Mean± Standard deviation
2, NA, Not available
3, Abbrevitions: L.F, Low Flow, H.F, High Flow, TSS, Total Suspended Solid, TDS,
Total Dissolved Solid, EC, Electrical Conductivity, Cl, Chloride, K, Potassium, Na,
Sodium, TA, Total Alkalinity, NEQS, National Environmental Quality Standards
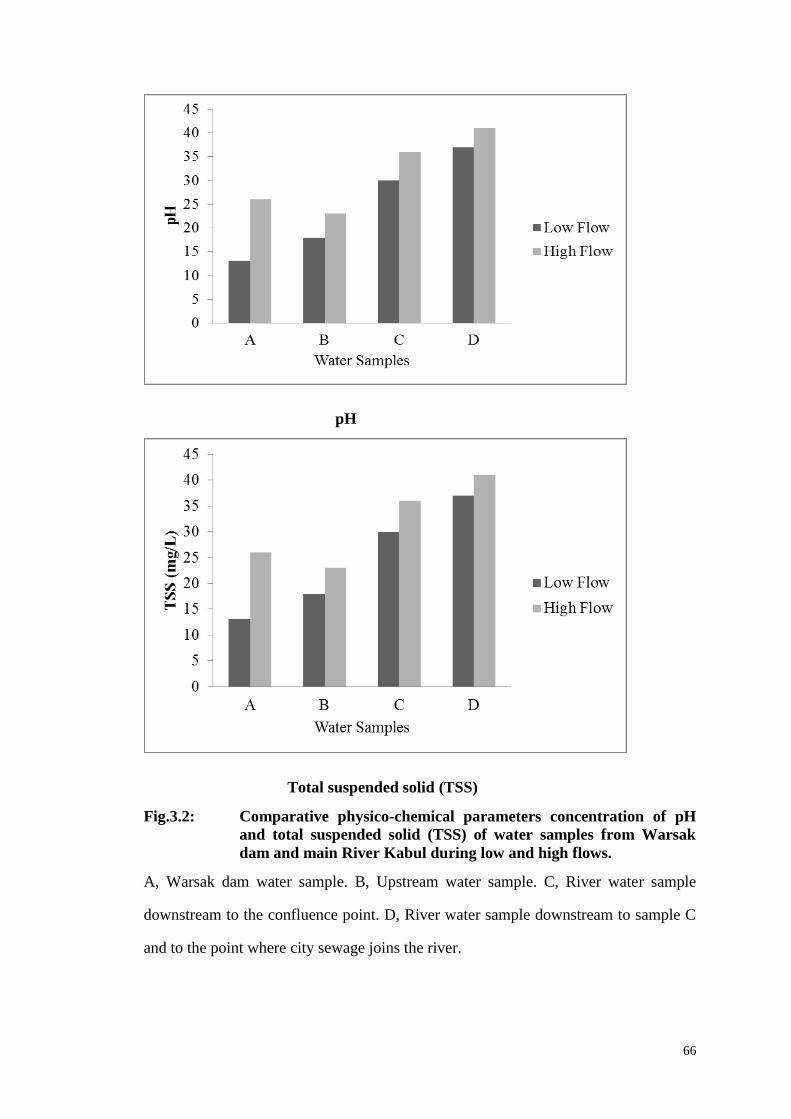
66
pH
Total suspended solid (TSS)
Fig.3.2: Comparative physico-chemical parameters concentration of pH
and total suspended solid (TSS) of water samples from Warsak
dam and main River Kabul during low and high flows.
A, Warsak dam water sample. B, Upstream water sample. C, River water sample
downstream to the confluence point. D, River water sample downstream to sample C
and to the point where city sewage joins the river.
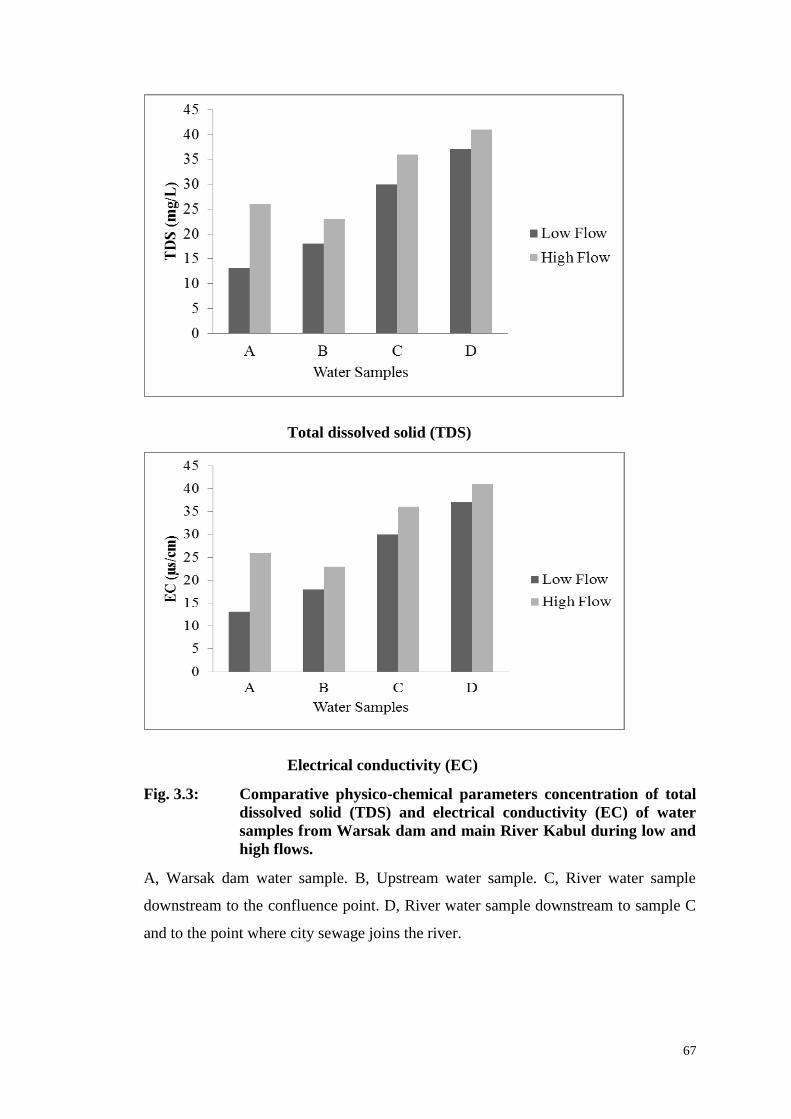
67
Total dissolved solid (TDS)
Electrical conductivity (EC)
Fig. 3.3: Comparative physico-chemical parameters concentration of total
dissolved solid (TDS) and electrical conductivity (EC) of water
samples from Warsak dam and main River Kabul during low and
high flows.
A, Warsak dam water sample. B, Upstream water sample. C, River water sample
downstream to the confluence point. D, River water sample downstream to sample C
and to the point where city sewage joins the river.

68
Chloride (Cl)
Potassium (K)
Fig.3.4: Comparative Physico-chemical parameters concentration of
chloride (Cl) and potassium (K) of water samples from Warsak
dam and main River Kabul during low and high flows.
A, Warsak dam water sample. B, Upstream water sample. C, River water sample
downstream to the confluence point. D, River water sample downstream to sample C
and to the point where city sewage joins the river.
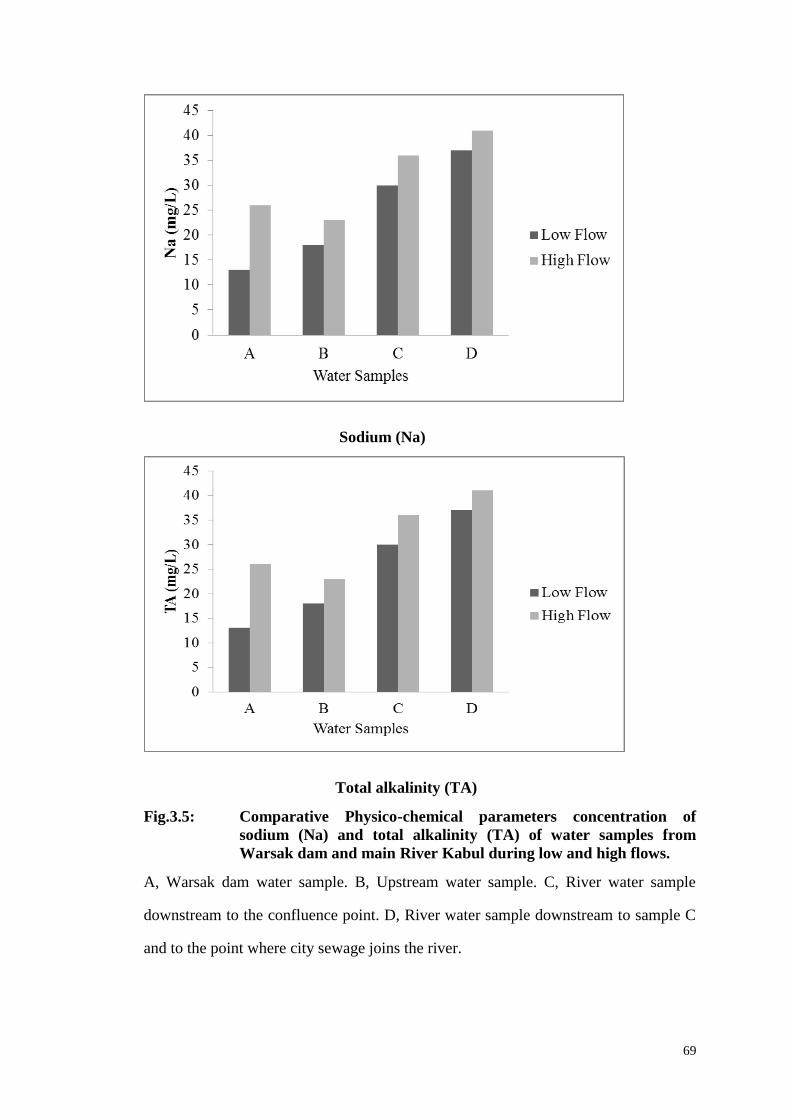
69
Sodium (Na)
Total alkalinity (TA)
Fig.3.5: Comparative Physico-chemical parameters concentration of
sodium (Na) and total alkalinity (TA) of water samples from
Warsak dam and main River Kabul during low and high flows.
A, Warsak dam water sample. B, Upstream water sample. C, River water sample
downstream to the confluence point. D, River water sample downstream to sample C
and to the point where city sewage joins the river.

70
b. Heavy Metals Parameters
Water samples A from control site 3 showed less concentration of heavy
metals as compare to polluted sites (Table 3.3 and Figs 3.6-3.10). From amongst the
heavy metal parameters, water sample A from Warsak dam had zinc in the range of
20-100 µg/l with mean values of 54.8±52.9 µg/l during low flow and 66.3±69.9 µg/l
during high flow seasons. The minimum concentration recorded for nickel was 27 and
maximum concentration of 65 µg/l with mean values of 33.3±14.9 µg/l for low flow
and 63.3±16.8 µg/l for high flow periods. Chromium content ranged between 16 and
37 µg/l with mean values of 18.8±9.3µg/l for low and 31.3±15.5 µg/l for high flow
periods. Copper concentration ranged between 2- 21 µg/l with mean values of 8.0±9.2
µg/l for low flow and 16.7±10.1µg/l for high flow seasons. The present result found
greater concentration of Zn, Ni, Cr as compare to previous findings (Khattak and
Rehman, 1992; Nawab, 1992; Peerzada et al., 1990), who reported low level of these
metals from the same site of River Kabul. Similarly lead at this point had minimum
range of 1 µg/l and maximum range of 12 µg/l with mean values of 3.7±3.11 µg/l for
low and 8.3±6.5 µg/l for high flow seasons. The cadmium had a concentration varying
between 15-31 µg/l with mean values of 16.7±6.7 µg/l for low flow and 26.7±12.8
µg/l for high flow periods. This is in agreement with the findings reported by Merian
(1991). Iron had a range from 12 to 25µg/l with mean values of 15.0±7.0 µg/l for low
flow and 21.0±10.5 µg/l for high flow seasons. Similarly the minimum concentration
recorded for manganese was 14 and maximum concentration of 27 µg/l with mean
values of 16.7±10.1µg/l for low flow and 23.3±11.5µg/l for high flow periods.
Mercury content ranged between 10 and 26 µg/ l with mean values of 13.1±6.9 µg/l
for low flow and 26.0±13.1µg/l for high flow periods. Heavy metals in water sample
A from this point was in order of Zn>Ni>Cr>Mn>Cd>Fe>Hg>Cu>Pb for low flow
and was Zn>Ni>Cr>Cd>Hg>Mn>Fe>Cu>Pb for high flow seasons. These results are
in agreement with those observed by many investigators (Nafees and Ghulam, 199;
Merian, 1991), who have also studied higher content of metals in water from other
71
resources. Many studies were previously carried out on the level of heavy metals in
water (El-Rafei, 1991; Abdel-Shafy., et al, 1995; Khallaf., et al., 1998; Radwan,
2000; Bahnasawy, 2001; Sabae and Abdel-Satar, 2001). In this study the average
mean shows that levels of all these parameters were lowest during winter and highest
during summer seasons. Highest concentration during summer could be correlated to
increased river volume, atmospheric condensation, earth quake, land slides, tornadoes
and cyclones in river. Heavy metals except Hg studied in water sample A from
Warsak dam were within permissible limits laid down by National Environmental
Quality Standards. All the heavy metals except Hg at this point were within
permissible limits (10µg/l) lay down by NEQS. The Hg mean values for low flow and
high flow periods were 13.1±6.9 µg/l and 26.0±13.1 µg/l, respectively. Therefore
Warsak dam water is safe for aquatic life including fish.
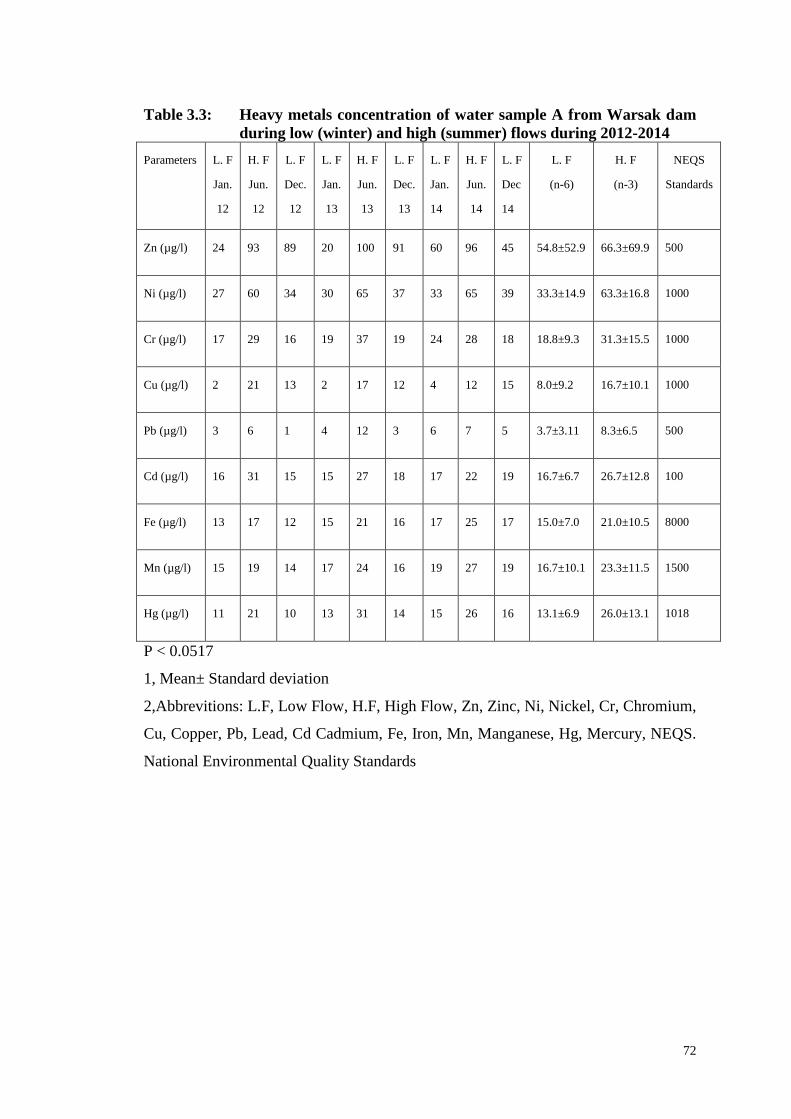
72
Table 3.3: Heavy metals concentration of water sample A from Warsak dam
during low (winter) and high (summer) flows during 2012-2014
Parameters
L. F
Jan.
12
H. F
Jun.
12
L. F
Dec.
12
L. F
Jan.
13
H. F
Jun.
13
L. F
Dec.
13
L. F
Jan.
14
H. F
Jun.
14
L. F
Dec
14
L. F
(n-6)
H. F
(n-3)
NEQS
Standards
Zn (µg/l) 24 93 89 20 100 91 60 96 45 54.8±52.9 66.3±69.9 500
Ni (µg/l) 27 60 34 30 65 37 33 65 39 33.3±14.9 63.3±16.8 1000
Cr (µg/l) 17 29 16 19 37 19 24 28 18 18.8±9.3 31.3±15.5 1000
Cu (µg/l) 2 21 13 2 17 12 4 12 15 8.0±9.2 16.7±10.1 1000
Pb (µg/l) 3 6 1 4 12 3 6 7 5 3.7±3.11 8.3±6.5 500
Cd (µg/l) 16 31 15 15 27 18 17 22 19 16.7±6.7 26.7±12.8 100
Fe (µg/l) 13 17 12 15 21 16 17 25 17 15.0±7.0 21.0±10.5 8000
Mn (µg/l) 15 19 14 17 24 16 19 27 19 16.7±10.1 23.3±11.5 1500
Hg (µg/l) 11 21 10 13 31 14 15 26 16 13.1±6.9 26.0±13.1 1018
P < 0.0517
1, Mean± Standard deviation
2,Abbrevitions: L.F, Low Flow, H.F, High Flow, Zn, Zinc, Ni, Nickel, Cr, Chromium,
Cu, Copper, Pb, Lead, Cd Cadmium, Fe, Iron, Mn, Manganese, Hg, Mercury, NEQS.
National Environmental Quality Standards
73
3.3.1.2 Polluted River Kabul water from site 4 receiving sewages (Water sample-
B)
a. Physico-Chemical Parameters
Water samples B from polluted site 4 of River Kabul downstream to Warsak
dam and upstream to confluence point was analyzed for different physico-chemical
and heavy metal paremeters contents. At this point sewages from Peshawar district
and effluents from Khazana sugar mills are discharged into River Kabul (Table 3.4
and Figs. 3.2-3.5).
From amongst the physico-chemical parameters, water sample B from this site
had pH in the range of 7.3-8.1 with mean values of 7.9±1.5 during low flow and
7.4±1.4 during high flow periods. Total suspended solid (TSS) concentration was in
the range of 467- 687 mg/l with mean value of 497.5±161.5 (mg/l) for low flow
period and 601.7±261.7 mg/l for high flow period. The present result of higher TSS
content in water sample from this site agree with the findings of Yousazai et al
(2010), who had also reported high TSS values in water sample from this site of River
Kabul. Similarly in a past investigation Khan et al (1999) have studied the impacts of
industrial effluents on the water quality of River Kabul at Amangarh, Nowshera and
analyzed water from this site for various chemical and biochemical parameters. They
also have found high level of total suspended solid (TSS) from the same water
resources. Total dissolved solid at this point had minimum range of 448 mg/l and a
maximum range of 795 mg/l with mean values of 725.8±310.2 mg/l for low flow
season and 478.7±139.3 mg/l for high flow season. The present result found low level
of pH, TSS and TDS in water samples from this site than reported by Khan and Ullah
(1991), who had reported 8.5,1230 mg/l and 2893.5 mg/L values for pH, TSS and
TDS from the same water of River Kabul.
The electrical conductivity in water sample B from main river was ranged
between 281- 461 µs/cm with mean values of 425.8±129.9µs/cm during low flow
period and 284.3±55.0µs/cm during high flow period. The chloride of all the samples
74
at this point was in the range of 13-27 mg/l with mean values of 25.1±7.6 mg/l for
low flow and 15.7±8.4 mg/l for high flow seasons. The potassium content ranged
between 2.2 mg/l and 4.8 mg/l with mean values of 4.5±1.5 mg/l during low flow and
2.3±0.71mg/l during high flow periods. In a previous finding Ali (1991) had reported
high levels of different parameters including temperature, pH, conductivity, dissolved
solid, suspended solid, alkalinity, chloride and nitrate in the water of River Swat.The
sodium concentration was between 16- 31 mg/l with mean values of 28.0±8.7 mg/l
for low flow and 17.0±4.8 mg/l for high flow seasons. Similarly water from this site
had total alkalinity in the range of 101- 262 mg/l with mean values of 185.7±142.9
mg/l for low flow and 104.7±22.5 for high flow seasons. These parameters in water
sample from this site was in sequence of TDS > TSS > EC > TA > Na > Cl > pH > K
for low flow and was TSS > TDS > EC > TA > Na > Cl > pH > K for high flow
seasons. In this study all physico-chemical parameters in water samples from this
point were below NEQS recommended values for effluents except TSS, which
exceeds the NEQS recommended limit of 150 mg/l for this parameter.
The total suspended solid (TSS) had minimum value of 497.5±161.5 mg/l for
low flow and maximum value of 601.7±261.7 mg/l for high flow seasons. Both these
values were higher than the value of 150 mg/l proposed by NEQS for this parameter.
However TSS mean value of 497.5±161.5 mg/l for low flow was higher than recorded
value for the same period (418.8±398.9) for Warsak dam. While TSS mean value
(601.7±261.7 mg/l) for high flow period at this point was lower than recorded value
for the same period (715.0±138.0) for Warsak dam. All parameters like pH, TDS, EC,
Cl, Na, K and TA were having increasing tendency on comparison with Warsak dam
water samples. The high level of TSS could be correlated to mining activities,
deforestation, natural process of weathering and poor agricultural practice in
adjoining hills of River Swat during low flow season, which also joins River Kabul
below Warsak dam. The Kabul River would be described by many people as a ‘dirty
river’ in that it is very turbid. This is due to high suspended solid load (TSS) carried
75
by river which range between 10 to 800 mg/l under low flow condition and 340 to
1,310 mg/l under high flow condition (IUCN, 1994). In a previous study Yousazai et
al (2010a) had also reported high TSS values at this sampling site of the River Kabul
exceeded the NEQS value of 150 mg/l for this parameter. This can be correlated to
high flooding during high flow due to snow melt on the peaks of surrounding hills,
both in Pakistan and Afghanistan and monsoon rains during summer months,
excessive deforestation, weathering, soil erosion, mining and other anthropogenic
activities along the banks of river. Similarly in a past investigation Khan et al (1999)
has also analyzed water of River Kabul and found the water sample from this site to
be contained high level of total suspended solid.

76
Table 3.4: Physico-chemical characteristics of water sample B from River
Kabul upstream to the confluence point during low (winter) and
high (summer) flows during 2012-2014
Parametes
L. F
Jan.
12
H. F
Jun.
12
L.F
Dec.
12
L. F
Jan.
13
H. F
Jun.
13
L. F
Dec.
13
L. F
Jan.
14
H. F
Jun.
14
L. F
Dec.
14
L. F
(n-6)
H. F
(n-3)
NEQS
Standards
pH 8.0 7.6 8.1 7.8 7.5 8.0 7.8 7.3 7.6 7.9±1.5 7.4±1.4 6-10
TSS 475 601 472 507 687 527 467 517 537 497.5±161.5 601.7±261.7 150
TDS 735 495 785 635 493 615 795 448 790 725.8±310.2 478.7±139.3 3500
EC 435 287 461 395 281 401 422 285 441 425.8±129.9 284.3±55.0 NA
Cl 26 19 23 24 15 25 27 13 26 25.1±7.6 15.7±8.4 1000
K 4.5 2.5 4.8 4.8 2.3 4.3 4.1 2.2 4.8 4.5±1.5 2.3±0.7 NA
Na 29 16 27 27 18 28 31 17 26 28.0±8.7 17.0±4.8 NA
TA 262 107 252 207 101 137 149 106 107 185.7±142.9 104.7±22.5 NA
P < 0.05
1, Mean± Standard deviation.
2, See table. 3.2 for abbrevitions.
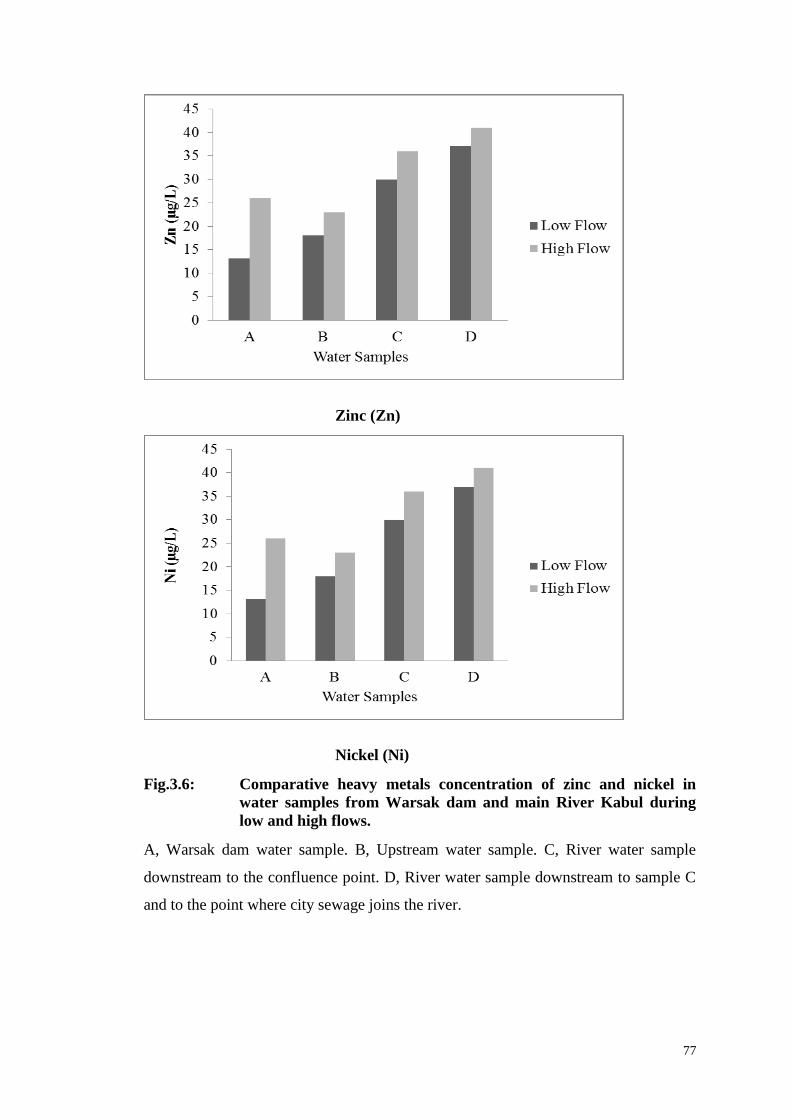
77
Zinc (Zn)
Nickel (Ni)
Fig.3.6: Comparative heavy metals concentration of zinc and nickel in
water samples from Warsak dam and main River Kabul during
low and high flows.
A, Warsak dam water sample. B, Upstream water sample. C, River water sample
downstream to the confluence point. D, River water sample downstream to sample C
and to the point where city sewage joins the river.
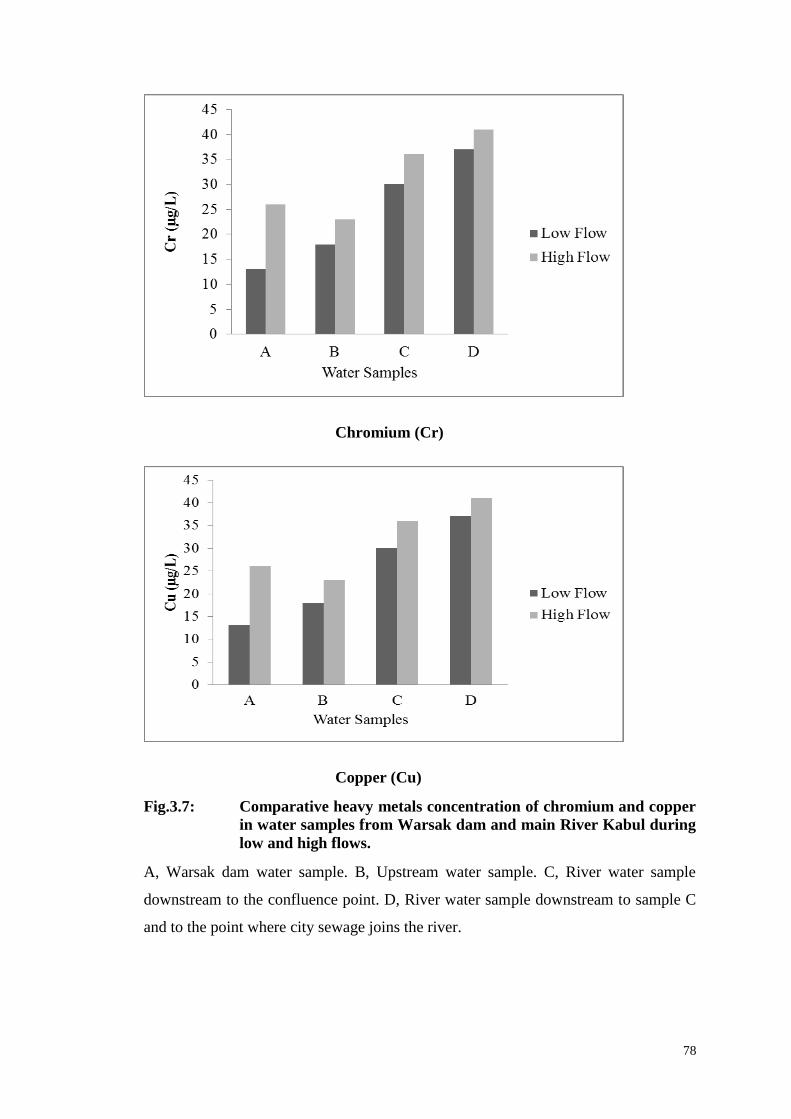
78
Chromium (Cr)
Copper (Cu)
Fig.3.7: Comparative heavy metals concentration of chromium and copper
in water samples from Warsak dam and main River Kabul during
low and high flows.
A, Warsak dam water sample. B, Upstream water sample. C, River water sample
downstream to the confluence point. D, River water sample downstream to sample C
and to the point where city sewage joins the river.

79
Lead (pb)
Cadmium (Cd)
Fig.3.8: Comparative heavy metals concentration of lead and cadmium in
water samples from Warsak dam and main River Kabul during
low and high flows.
A, Warsak dam water sample. B, Upstream water sample. C, River water sample
downstream to the confluence point. D, River water sample downstream to sample C
and to the point where city sewage joins the river.
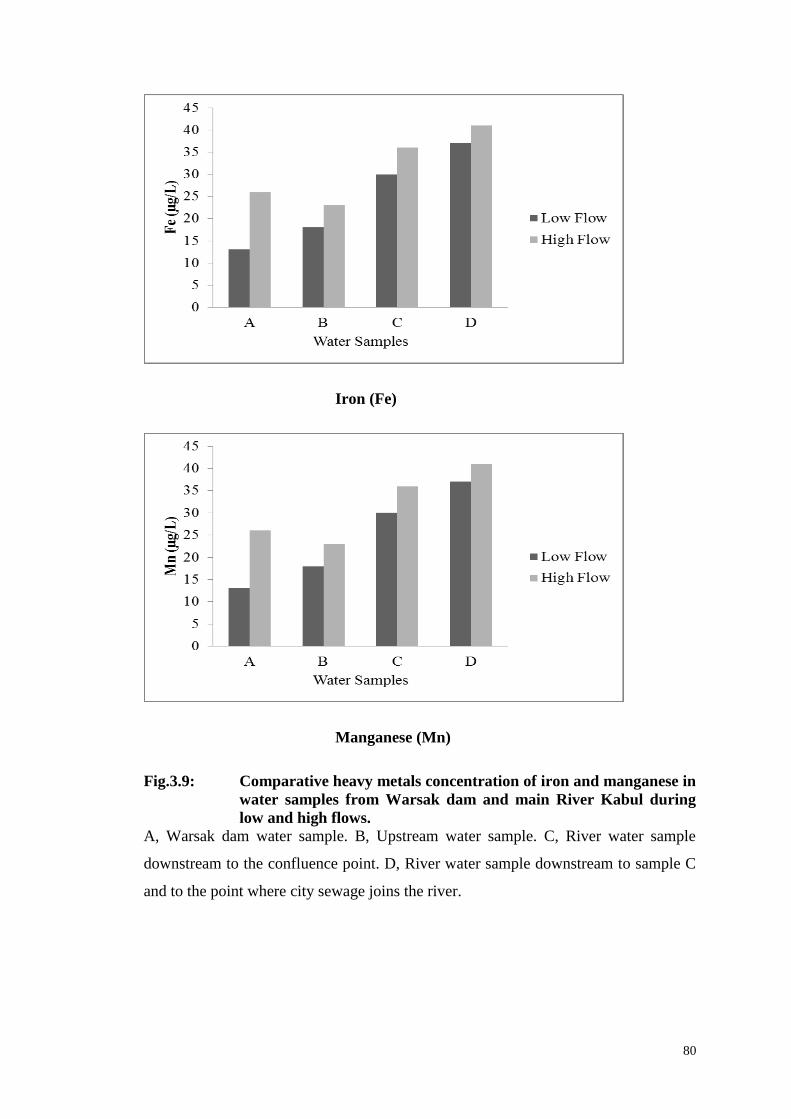
80
Iron (Fe)
Manganese (Mn)
Fig.3.9: Comparative heavy metals concentration of iron and manganese in
water samples from Warsak dam and main River Kabul during
low and high flows.
A, Warsak dam water sample. B, Upstream water sample. C, River water sample
downstream to the confluence point. D, River water sample downstream to sample C
and to the point where city sewage joins the river.
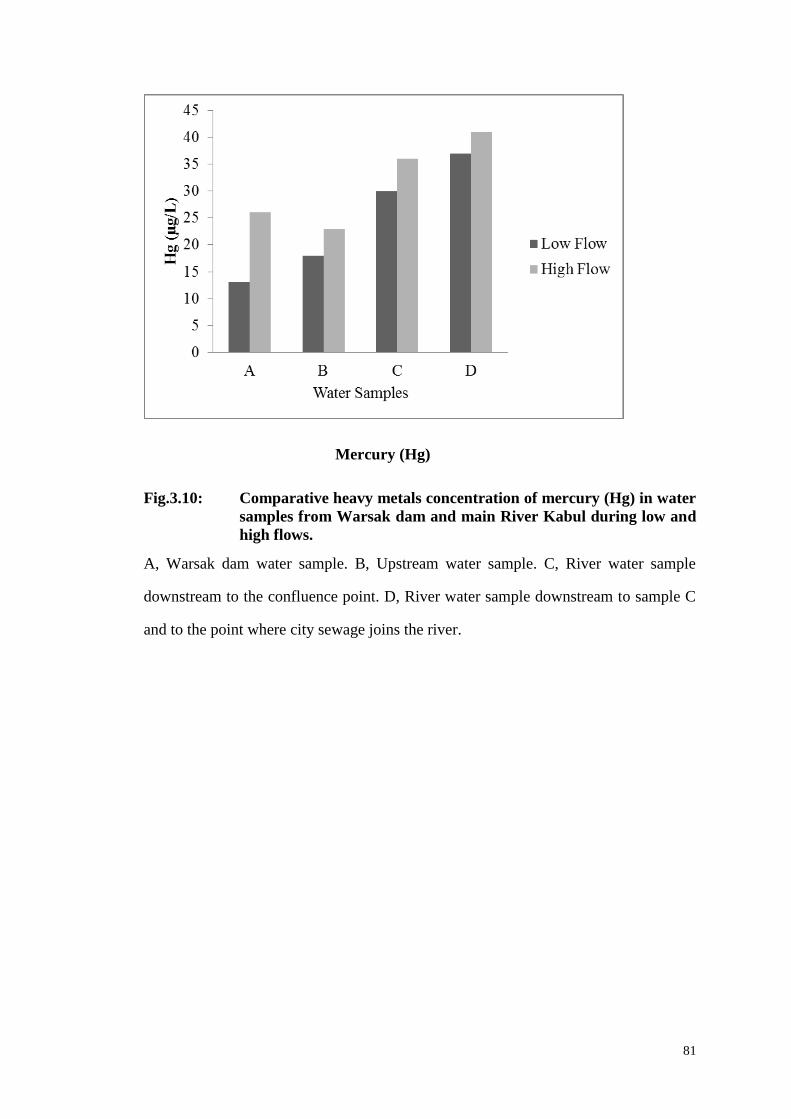
81
Mercury (Hg)
Fig.3.10: Comparative heavy metals concentration of mercury (Hg) in water
samples from Warsak dam and main River Kabul during low and
high flows.
A, Warsak dam water sample. B, Upstream water sample. C, River water sample
downstream to the confluence point. D, River water sample downstream to sample C
and to the point where city sewage joins the river.

82
b. Heavy Metals Parameters
Heavy metals in water sample B from site 4 showed greater concentration than
water sample A. Water sample B from this site had zinc concentration ranged between
202-227 µg/l with mean values of 211.5±45.9 µg/l for low flow and 221.3±40.9 µg/l
for high flow periods (Tables 3.5 and Figs 3.6-3.10). The minimum concentration
recorded for nickel was 51µg/l and maximum concentration of 61µg/l with mean
values of 55.5±15.4 µg/l for low flow and 59.7±11.4 µg/l for high flow periods. The
chromium of all the water samples at this site was in the range of 16-43 µg/l with
mean values of 18.7±8.0 µg/l for low flow and 41.0±10.4 µg/l for high flow seasons.
The copper content ranged between 13 µg/l and 28 µg/l with mean values of
21.0±15.3 µg/l during low flow and 20.3±7.6 µg/l during high flow periods. In this
investigation values for Zn, Ni, Cr, Cu and Cd were higher and Fe, Mn and Pb and Hg
were lower as compare to values mentioned by Shahina (2001). Similarly lead at this
point had minimum concentration of 62 and maximum concentration of 169 µg/l with
mean values of 65.8±16.9 µg/l during low flow and 164.3±31.9 µg/l during high flow
seasons. The cadmium concentration was 49-71 µg/l with mean values 55.0±15.9 µg/l
during low flow and 70.3±11.2 µg/l during high flow seasons. In a past study Nawab
(1992) had studied water of the River Kabul for different heavy metals like Cd, Cr,
Ca, Pb, Fe, Mn and Zn. The analysis of these effluents revealed high concentration of
Cd, Cu, Fe. Iron had a range from 28-49 µg/l with mean values of 30.5±10.1µg/l for
low flow and 47.0±11.2 µg/l for high flow seasons. Similarly minimum concentration
recorded for manganese was 29 and maximum concentration of 51 µg/l with mean
values of 35.0±12.7 µg/l for low flow and 50.0±8.1µg/l for high flow periods.
The mercury content ranged between 16 and 24 µg/l with mean values of
18.5±6.5 µg/l for low flow and 23.3±6.4 µg/l for high flow periods respectively.
These results are in agreement with the findings of Nawab (1992) and Zouboulis et al
(2004). The sequence of these parameters in water sample B was Zn> Pb> Ni> Cd>
Mn> Fe> Cu> Cr >Hg during low flow and was Zn > Pb > Cd > Ni > Mn > Fe > Cr >

83
Hg > Cu for high flow seasons respectively. Comparing our study with the findings of
above researchers showed that heavy metal and physico-chemical parameters
concentrations are the main pollutants for the River Kabul and levels of these
parameters have increased in River Kabul in the last few years and both heavy metal
and physico-chemical parameters also showed increasing tendency in water samples
from this point as compare to those with Warsak dam. The increasing in level of
heavy metal and physico-chemical parameters could be attributed to effluents from
factories and mills and sewages from Peshawar city. All the nine heavy metals like
Zn, Ni, Cr Cu, Cd, Pb, Fe, Mn and Hg studied in the water sample B from River
Kabul showed increasing tendency on comparison with water samples from Warsak
dam. All heavy metals except Hg at this point were within permissible limits laid
down by NEQS. The Hg mean values for low and high flow periods were 18.5±6.5
µg/l and 23.3±6.4 µg/l respectively.
As again all physico-chemical and heavy metal parameters except TSS had
values within the permissible range proposed by NEQS, therefore water quality at this
point seem fit for aquatic life. However all the parameters were showing increasing
tendency when compared to Warsak dam water samples. This water sample point was
35 km down stream from the Warsak dam and 20 km upstream from the confluence
point at Amangarh Nowshera. On down stream journey from Warsak dam, the river
passes through a number of villages and the city of Peshawar. Therefore city sewage
and effluents from many factories and mills and other installations in the vicinity of
River Kabul tributaries also joins the river. Moreover dirty water of River Bara
(IUCN, 1994) also joins the river on the downstream. Therefore it is obvious that
water quality of the river would be deteriorated down stream.

84
Table 3.5 Heavy metals concentration of water sample B from River Kabul
upstream to the confluence point during low (winter) and high (summer) flows
during 2012-2014
Parametes
L. F
Jan.
12
H. F
Jun.
12
L. F
Dec.
12
L. F
Jan.
13
H. F
Jun.
13
L. F
Dec.
13
L. F
Jan.
14
H. F
Jun.
14
L. F
Dec.
14
L. F
(n-6)
H. F
(n-3)
NEQS
Standards
Zn 213 217 202 216 227 218 214 220 206 211.5±45.9 221.3±40.9 500
Ni 54 58 56 51 60 55 59 61 58 55.5±15.4 59.7±11.4 1000
Cr 19 39 21 16 41 20 20 43 16 18.7±8.0 41.0±10.4 1000
Cu 13 21 26 17 19 28 16 21 26 21.0±15.3 20.3±7.6 1000
Pb 62 169 66 65 164 68 64 160 70 65.8±16.9 164.3±31.9 500
Cd 49 71 54 57 69 55 59 71 56 55.0±15.9 70.3±11.2 100
Fe 31 45 33 28 47 31 32 49 28 30.5±10.1 47.0±11.2 8000
Mn 29 51 34 37 49 35 39 50 36 35.0±12.7 50.0±8.1 1500
Hg 16 24 18 20 22 20 19 24 18 18.5±6.5 23.3±6.4 10
P < 0.05
1, Mean± Standard deviation.
2, See table 3.3 for abbrevitions.
85
3.3.1.3 Polluted River Kabul water from site 1 receiving effluents (Water sample
C)
a. Physico-Chemical Parameters
Water samples C from polluted site 1 down stream to the site B were taken
and studied for various physico-chemical and heavy metal parameters as already
mentioned to determine the extent of pollution in the River Kabul at this point. This
was the site from where fish sample 1 was collected. Comparing the data from
Warsak dam (control) shows that a considerable increase in pollution has occurred.
Most of the parameters have increased showing signs of increased localized pollution
in the river, most probably caused by effluents (Table 3.6 and Figs. 3.2-3.5).
The water sample C from this site of River Kabul had a pH ranged between
7.2 and 7.6 with mean values of 7.4±1.0 during low flow and 7.3±1.0 during high
flow seasons respectively. Total suspended solid (TSS) concentration was in the range
of 492- 912 mg/l with mean values of 549.7±228.7 mg/l for low flow and
881.3±409.0 mg/l for high flow periods. Total dissolved solid (TDS) of all water
samples C was in the range of 530 - 965 mg/l with mean values of 830.0±482.4 mg/l
and 567.3±168.8 mg/l for both low and high flow seasons. The electrical conductivity
in water sample from Warsak dam was ranged between 235 and 493µs/cm with mean
values of 473.7±102.0µs/cm during low flow and 245.3±69.4µs/cm during high flow
periods. The present results of higher pH, TSS, TDS contents in water samples from
this site agree with the findings of Adeogun (2012). On the other hand, the present
data for K, total alkalinity, Na, Cl and electrical conductivity agree with those of
Subramanian (2004) and Wahid and Muhammad (1992). In this study chloride
concentration ranged between 23-35.6 mg/l with mean values of 32.1±12.4 mg/l for
low flow and 25.0±8.1 mg/l for high flow seasons. The potassium (K) range was 5.2 -
8.8 mg/l with mean values of 8.2±2.2 mg/l during low flow and 5.8±2.2 mg/l during
high flow periods. The sodium ranged between 13- 47 mg/l with mean values of

86
36.3±19.2 for low flow and 16.0±7.9 mg/l for high flow seasons. Similarly water
sample from this site had total alkalinity in the range of 120- 271mg/l with mean
values of 207.8±112.7 mg/l for low flow and 122.3±24.4 mg/l for high flow periods.
These parameters in the water sample from this site were in the sequence of
TDS>TSS>EC>TA>Na>Cl>K>pH for low flow and were TSS>TDS>EC>TA>Cl>
Na>pH>K for high flow seasons respectively. This study found more values for TDS,
TSS, EC, TA, Na, Cl, K and pH as compare to the previous investigations (Akif et al.,
2002; Khan and Mumtaz, 1997; Khan et al., 1999). Previously Yousafzai (2004) had
also reported high mean values for pH, TDS, EC, Cl, K, Na and TA from the same
water resource of River Kabul that verifying the validity of our study. Comparing our
data with the finding of Yousafzai (2004) and other mentioned studies indicates that
all studied physico-chemical parameters, when compared with Warsak dam (control)
are high in concentration and showing an increasing tendency in river at this point.
All the physico-chemical parameters were below the permissible limits
proposed by NEQS except TSS, which exceeds the NEQS recommended limit of 150
mg/l for this parameter. TSS from this site had a minimum value of 549.7±228.7 mg/l
during winter and maximum value of 881.3±409.0 mg/l during summer seasons. Both
these values were higher than the value of 150 mg/l proposed by NEQS for this
parameter. These two values 549.7±228.7 mg/l and 881.3±409.0 mg/l for both lower
and higher flows were higher than the recorded values for the same periods
(418.8±398.9, 715.0±138.0) from Warsak dam. The TSS value was highest for high
flow and lowest for low seasons. This could be correlated to sewage, industrial
effluents, flooding, soil erosion etc in the river at this site. All the physico-chemical
parameters showed a considerable increase during low and high flow seasons in
relation to Warsak dam (control). Rest of the parameters were within the NEQS
range. A decrease in the pH level as compare to water sample A from Warsak dam
and water sample B from the main river upstream was also observed showing
deterioration of the river quality downstream. Water sample C possessed all the

87
parameters higher than the water sample A from Warsak dam and water sample B
upstream from the main river.
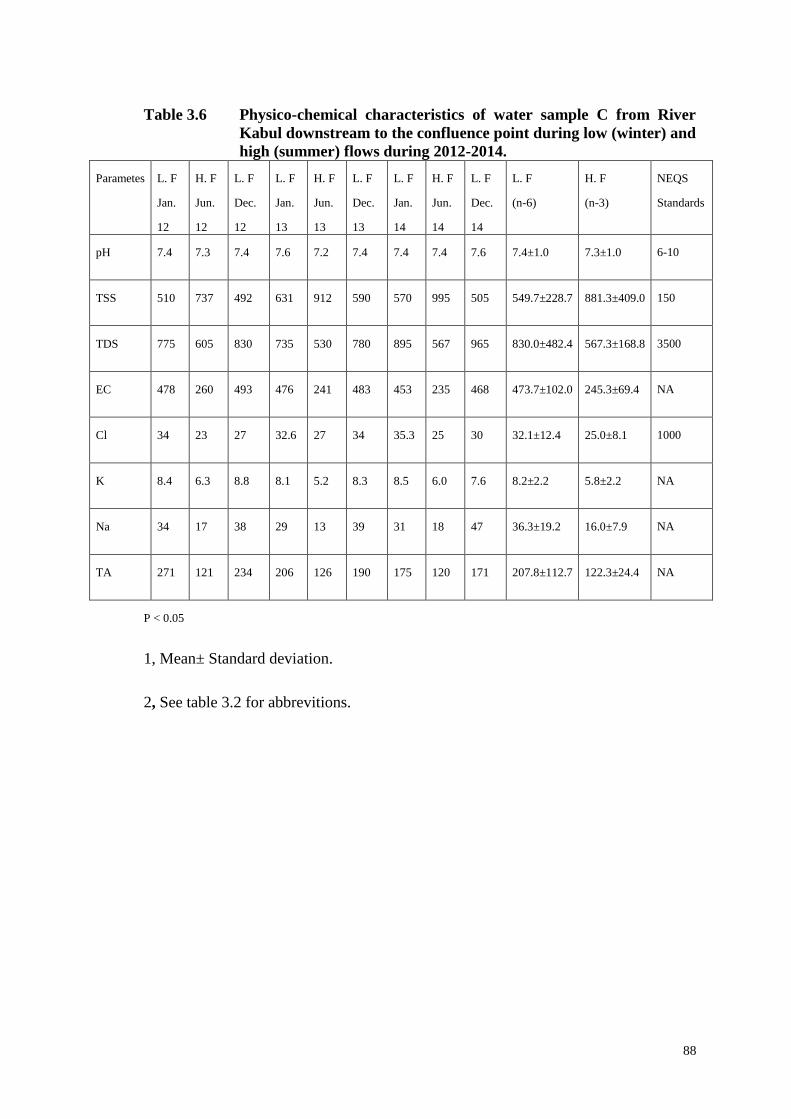
88
Table 3.6 Physico-chemical characteristics of water sample C from River
Kabul downstream to the confluence point during low (winter) and
high (summer) flows during 2012-2014.
Parametes
L. F
Jan.
12
H. F
Jun.
12
L. F
Dec.
12
L. F
Jan.
13
H. F
Jun.
13
L. F
Dec.
13
L. F
Jan.
14
H. F
Jun.
14
L. F
Dec.
14
L. F
(n-6)
H. F
(n-3)
NEQS
Standards
pH 7.4 7.3 7.4 7.6 7.2 7.4 7.4 7.4 7.6 7.4±1.0 7.3±1.0 6-10
TSS 510 737 492 631 912 590 570 995 505 549.7±228.7 881.3±409.0 150
TDS 775 605 830 735 530 780 895 567 965 830.0±482.4 567.3±168.8 3500
EC 478 260 493 476 241 483 453 235 468 473.7±102.0 245.3±69.4 NA
Cl 34 23 27 32.6 27 34 35.3 25 30 32.1±12.4 25.0±8.1 1000
K 8.4 6.3 8.8 8.1 5.2 8.3 8.5 6.0 7.6 8.2±2.2 5.8±2.2 NA
Na 34 17 38 29 13 39 31 18 47 36.3±19.2 16.0±7.9 NA
TA 271 121 234 206 126 190 175 120 171 207.8±112.7 122.3±24.4 NA
P < 0.05
1, Mean± Standard deviation.
2, See table 3.2 for abbrevitions.
89
b. Heavy Metals Parameters
From amongst the heavy metals water sample C from site 1 had zinc
concentration ranged between 218-234 µg/l with mean values of 226.1±39.5 µg/l for
low flow and 230.3±61.4 µg/l for high flow periods (Table 3.7 and Figs 3.6-3.10).
The minimum concentration recorded for nickel was 45 µg/l and maximum
concentration of 49 µg/l with mean values of 46.3±10.1µg/l for low flow and
47.7±10.2 µg/l for high flow seasons. The chromium of all the water samples at this
site was in the range of 16-44 µg/l with mean values of 23.0±14.5 µg/l and 43.3±8.8
µg/l for both low and high flow seasons. Copper content ranged between 15 and 32
µg/l with mean values of 23.8±17.6 µg/l during low flow and 26.0±8.3 µg/l during
high flow periods. Similarly lead at this point had minimum range of 67 µg/l and
maximum range of 181 µg/l with mean values of 70.8±17.5 µg/ l during low flow and
176.3±33.0 µg/l during high flow seasons. Cadmium concentration was ranged
between 53-76 µg/l with mean values of 57.7±13.2 µg/l during low flow and
74.0±45.0 µg/ l during high flow seasons. The iron of all the water samples at this site
was in the range of 35-61 µg/l with mean values of 40.8±15.2 µg/l and 60.0±8.9 µg/l
for low and high flows seasons. These results are in agreement with previous findings
as reported by (Anon, 1976; El-Ezaby, 1994; IUCN, 1994; Khan et al., 2011).
Manganese had a range varying between 34-57 µg/l with mean values of 38.5±9.1
µg/l during winter and 55.0±12.1 µg/l during summer respectively. Mercury was in
the range between 27-41 µg/l with mean values of 30.8±11.5µg/l for low flow and
36.3±15.0 µg/l for high flow periods. All the heavy metals except Hg at this point
were within permissible limits laid down by NEQS.
The Hg mean values for low flow and high flow seasons were 30.8±11.5 µg/ l
and 36.3±15.0 µg/ l respectively and showed an increasing tendency at this point than
the Warsak dam water. The heavy metal parameters in water sample C from this site
were in the order of Zn>Pb>Cd>Ni>Fe>Mn>Hg>Cu>Cr during low flow and were

90
Zn>Pb>Cd>Fe> Mn> Ni>Cr>Hg>Cu for high flow seasons respectively. In a
previous finding Amal et al (2012) have investigated that pollution due to heavy
metals of the aquatic environment is a serious and growing problem throughout the
world. Similarly in another finding Enrique et al (2007) and Ping et al (2006) have
reported that increasing number and amount of industrial, agricultural and commercial
chemicals discharged into aquatic environment have led to various deleterious effects
on aquatic organisms, including fish. A general comparison is made between the
different types of discharge, rivers having been included within the streams and drains
category. The increased load of heavy metals in Kabul River has adverse effects on
flora and fauna.
All heavy metals like Zn, Ni, Cr Cu, Cd, Pb, Fe, Mn and Hg studied in the
water sample C from River Kabul showed increasing tendency on comparison with
water samples from Warsak dam and water sample B. All heavy metals except Hg at
this point were within permissible limits laid down by NEQS. The Hg mean values
for low flow and high flow periods were 30.8±11.5 µg/ l and 36.3±15.0 µg/ l
respectively. All the studied heavy metals when compared with Warsak dam (control)
are high in concentration and showing increasing tendency due to dumping of
industrial effluents in river at this point. Zinc from this site showed high increase due
to various zinc using industries present in the vicinity of River Kabul. The heavy
metals contents at this point of the river were higher than the Warsak dam samples
and main River upstream to the confluence point samples, showing increasing
tendency due to dumping of industrial effluents into River Kabul (Table 3.7 and 3.5-
3.9).
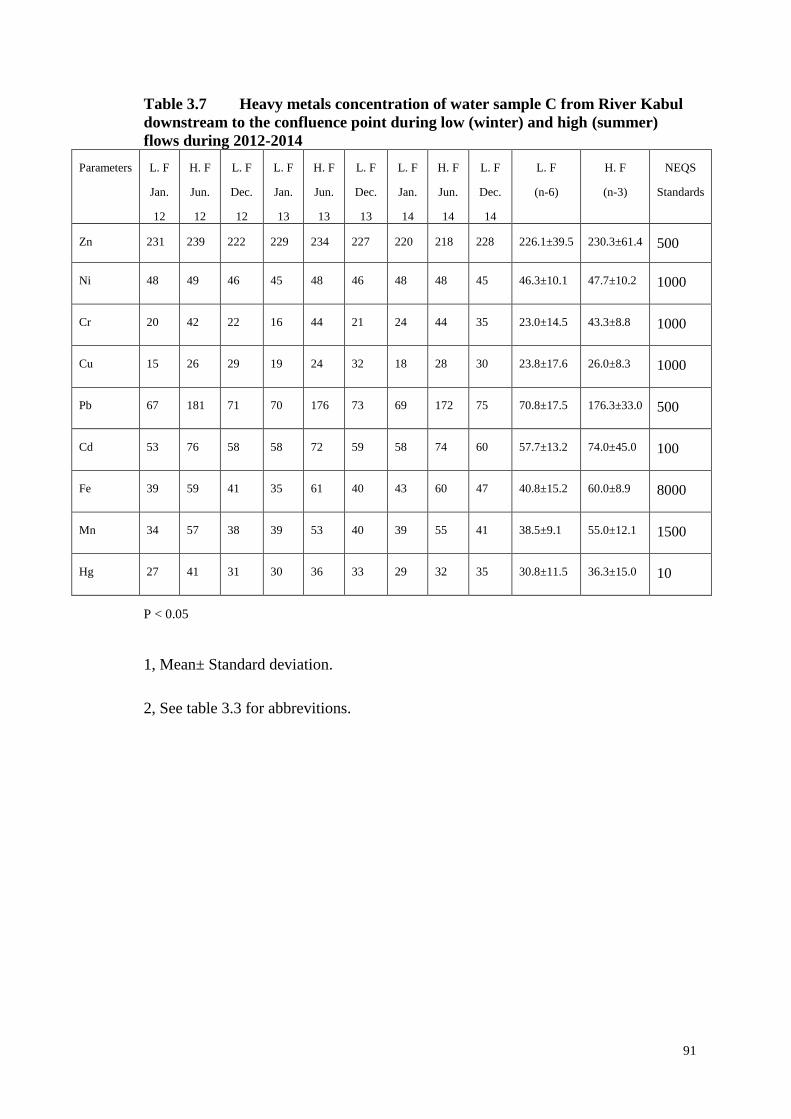
91
Table 3.7 Heavy metals concentration of water sample C from River Kabul
downstream to the confluence point during low (winter) and high (summer)
flows during 2012-2014
Parameters
L. F
Jan.
12
H. F
Jun.
12
L. F
Dec.
12
L. F
Jan.
13
H. F
Jun.
13
L. F
Dec.
13
L. F
Jan.
14
H. F
Jun.
14
L. F
Dec.
14
L. F
(n-6)
H. F
(n-3)
NEQS
Standards
Zn 231 239 222 229 234 227 220 218 228 226.1±39.5 230.3±61.4 500
Ni 48 49 46 45 48 46 48 48 45 46.3±10.1 47.7±10.2 1000
Cr 20 42 22 16 44 21 24 44 35 23.0±14.5 43.3±8.8 1000
Cu 15 26 29 19 24 32 18 28 30 23.8±17.6 26.0±8.3 1000
Pb 67 181 71 70 176 73 69 172 75 70.8±17.5 176.3±33.0 500
Cd 53 76 58 58 72 59 58 74 60 57.7±13.2 74.0±45.0 100
Fe 39 59 41 35 61 40 43 60 47 40.8±15.2 60.0±8.9 8000
Mn 34 57 38 39 53 40 39 55 41 38.5±9.1 55.0±12.1 1500
Hg 27 41 31 30 36 33 29 32 35 30.8±11.5 36.3±15.0 10
P < 0.05
1, Mean± Standard deviation.
2, See table 3.3 for abbrevitions.
92
3.3.1.4 Polluted River Kabul water from site 2 receiving city sewage (Water
sample D)
a. Physico-Chemical Parameters
Water sample D from site 2 down stream to site 1 was taken and studied for
various physico-chemical and heavy metal parameters as already mentioned. This was
the site from which fish samples 2 were collected. At this point Kalpani nalla from
Mardan district (IUCN, 1994) joins the River Kabul on opposite side. The quantity of
water down stream of this point is considerably deteriorated (IUCN, 1994, Khan et
al., 1999). All physico-chemical parameters were below the permissible limits
proposed by NEQS except TSS, which exceeds the NEQS recommended limit of 150
mg/l for this parameter. Water samples from this site were analyzed for different
physico-chemical and heavy metal parameters to quantify the extent of pollution at
this point (Table 3.8 and Figs 3.2-3.5).
Some physico-chemical parameters are components of industrial waste
products, which are discharged into the River Kabul along with other industrial
effluents and caused aquatic pollution. All physico-chemical parameters showed a
considerable increase during low and high flow periods in relation to Warsak dam
(control). The water sample D from this point had a pH in the range of 7.2-7.8 with
mean values of 7.5±2.0 during low flow and 7.4±1.4 during high flow seasons. In a
past study Nafees and Ghulam (1991) and IUCN (1994) have also reported higher
concentration for pH in water of River Kabul above than the recommended standard
for industrial effluents. Total suspended solid (TSS) was in the range of 491-989 mg/l
with mean values of 543.8±189.3 mg/l for low flow period and 962.3±209.6 mg/l for
high flow period. The TSS value was highest for high flow and lowest for low flow
seasons. This could be correlated to sewage, industrial effluents and flooding and soil
erosion in the river. In another investigation Ali (1991) had also reported a high TSS
level in the water samples from River Swat. Similarly total dissolved solid (TDS) at

93
this point had minimum range of 565 mg/l and a maximum range of 912 mg/l with
mean values of 793.1±353.4 mg/l during low flow and 615.0±201.4 mg/l during high
flow seasons. The electrical conductivity in water sample D was ranged between 208-
473 µs/cm with mean values of 453.0±125.1 µs/cm during low flow period and
229.7±81.1 µs/cm during high flow period. The chloride concentration of all the
samples at this point was in the range of 29-45 mg/l with mean values of 39.0±14.4
mg/l for low flow and 30.7±8.2 mg/l for high flow seasons. The potassium content
ranged between 21 mg/l and 40 mg/l with mean values of 75.5±65.5 mg/l during low
flow and 22.3±7.0 1mg/l during high flow periods. These values were greater than the
findings of other workers from the same water resources (South African Water
Quality Guidelines., 1996; Akifet al., 2002; Khan and Mumtaz, 1997; Khan et al.,
1999).
The sodium concentration was ranged between 16 and 31 mg/l with mean
values of 28.0±8.7 mg/l for low and 17.0±4.8 mg/l for high flow seasons. Similarly
the water samples from this site had total alkalinity in the range of 199-310 mg/l with
mean values of 302.1±54.2 mg/l for low flow and 205.3±42.7 mg/l for high flow
periods. These parameters in water sample D from this site were in the order of TDS
> TSS > EC > TA > Na > Cl > K > pH for low flow and were TSS > TDS > EC > TA
> Cl > Na > pH >K for high flow seasons respectively. In a past finding Yousafzai
(2004) had also reported greater mean values for pH, total dissolved solid, electrical
conductivity, chloride, potassium, sodium and total alkalinity from the same water
resource of River Kabul verifying the validity of our study. All physico-chemical
parameters in water sample D had higher concentration than the water samples A, B
and C. The TSS had mean values of 543.8±189.3 mg/l for low flow and 962.3±209.6
mg/l for high flow seasons and these values were greater than the NEQS
recommended limit of 150 mg/l.

94
Table 3.8 Physico-chemical characteristics of water sample D, downstream
to C during low (winter) and high (summer) flows during 2012-
2014.
Parameters L. F
Jan.
12
H. F
Jun.
12
L. F
Dec.
12
L. F
Jan.
13
H. F
Jun.
13
L. F
Dec.
13
L. F
Jan.
14
H. F
Jun.
14
L. F
Dec.
14
L. F
(n-6)
H. F
(n-3)
NEQS
Standards
pH 7.3 7.6 7.8 7.4 7.4 7.7 7.6 7.2 7.5 7.5±2.0 7.4±1.4 6-10
TSS 575 70 500 556 928 600 491 989 541 543.8±189.3 962.3±209.6 150
TDS 810 640 865 770 565 831 571 640 912 793.1±353.4 615.0±201.4 3500
EC 463 248 458 461 233 473 400 208 463 453.0±125.1 229.7±81.1 NA
Cl 45 29 34 38 32 40 40 31 37 39.0±14.4 30.7±8.2 1000
K 9 6.1 9.3 9.2 5 9 9.6 6 9.4 9.2±1.8 5.7±2.2 NA
Na 37 22 40 40 24 37 36 21 35 75.5±65.5 22.3±7.0 NA
TA 310 205 301 300 212 293 309 199 300 302.1±54.2 205.3±42.7 NA
P < 0.05
1, Mean± Standard deviation.
2, See table 3.2 for abbrevitions.
95
b. Heavy Metals Parameters
All heavy metal parameters in water from this site 2 showed a considerable
increasing tendency during low and high flow seasons in relation to control water
from Warsak dam (Table 3.9 and Figs 3.6-3.10).
Among the heavy metal parameters, water sample D from this site had zinc in
the range of 240- 258 µg/l with mean values of 247.7±36.4µg/l during low flow and
254.7±35.1 µg/l during high flow seasons. The minimum concentration recorded for
nickel was 54 and maximum concentration of 87 µg/l with mean values of 60.0±24.2
µg/l for low flow and 84.7±16.3 µg/ l for high flow periods. The present results are in
agreement with those observed by many investigators (DWAF, 1996; Salomons and
Forstner, 1984), who have also studied high levels of heavy metals in water from
other resources. The chromium content ranged between 17 and 37 µg/l with mean
values of 29.8±20.0 µg/ l for low flow and 29.0±8.8 µg/ l for high flow periods. The
copper concentration ranged varying between 17- 37 µg/l with mean values of
29.8±20.0 µg/l for low flow and 29.0±8.8 µg/ l for high flow seasons. Similarly lead
at this point had minimum concentration of 71 µg/l and maximum content of 190 µg/l
with mean values of 77.7±22.7 µg/l for low flow and 186.7±30.1 µg/l for high flow
seasons.
The cadmium of all the samples from this site had a concentration varying
between 60-84 µg/l with mean values of 65.0±14.6 µg/l for low flow and 81.3±19.0
µg/l for high flow periods. Iron had a range from 43-63 µg/l with mean values of
52.7±25.2 µg/l for low flow and 54.3±28.3 µg/l for high flow seasons. Similarly
minimum concentration recorded for manganese was 39 and maximum concentration
of 47µg/l with mean value of 43.7±12.7µg/l for low flow and 42.7±9.7µg/ l for high
flow periods. The mercury content ranged between 34µg/l and 45µg/l with mean
values of 37.3±12.5 µg/l for low flow and 41.0±14.8 µg/l for high flow periods
respectively. Heavy metal parameters in water sample D from this site were in the

96
order of Zn>Pb>Cd>Ni>Fe>Mn>Hg>Cu>Cr during low flow and were
Zn>Pb>Cd>Ni>Cd> Fe>Cr>Mn>Hg>Cu for high flow periods respectively. All
heavy metals except Hg at this point were within permissible limits laid down by
NEQS. The Hg mean contents for low and high flow seasons were 37.3±12.5 µg/ l
and 41.0±14.8 µg/ l respectively and show an increasing tendency at this point than
Warsak dam water. This study found maximum level of examined metals from this
point as compare to the previous findings reported by IUCN (1994) and Merian
(1991).
Heavy metals at this site showed higher concentration as compare to Warsak
dam and upstream of water samples B and C and indicating increasing heavy metal
pollution in down stream water. Heavy metals except Hg determined at this point
were within permissible limits laid down by National Environmental Quality
Standards (NEQS). But still alarming due to their bioaccumulation capability
especially during low flow season when water volume shrinks. Over all result showed
that industries in the vicinity are dumping effluents containing high level of TSS and
Hg into the River Kabul. Comparing heavy metal contents to Warsak dam water
(control) again showed a drastic increase in concentration of physico-chemical
parameters both during winter and summer seasons. Similarly a further increase had
also occurred in heavy metals concentration as compare to water sample C. As this
sample was collected from the portion of the river, where city sewage also joins the
river a little upstream, most probably this city sewage may be further increasing the
heavy metal concentration and physico-chemical characteristics. The overall results
show that industries in the vicinity discharging effluents and sewages containing high
TSS and Hg into River Kabul especially at sites C and D. Thus both sewages and
effluents causing both organic and inorganic pollution in River Kabul. The TSS and
Hg in upstream from Warsak dam (water sample A) and downstream from main river
(water sample B), from polluted site 1(water sample C) and polluted site 2 (water
sample D) exceeds the permissible limits proposed by NEQS during both low and
97
high flow periods. Both physico- chemical and heavy metal parameters in
downstream river water samples also showed an increasing tendency when compared
with upstream samples showing both physico-chemical and heavy metal stress in
down stream portion of River Kabul.
This extensive study confirmed that River Kabul has higher pollution down
stream the Warsak dam and there is a localized pollution in the vicinity of Peshawar
and Nowshera. Similar reports regarding River Kabul pollution have also been
reported in the past findings (Akif et al., 2002, IUCN, 1994, Karns, 1977, Yousafzai,
2004). Similarly in another investigation, Yılmaz et al (1998) reported that chromium
and lead concentrations in Nilufer Stream were well above the standard limits given
for the heavily polluted class of water. This pollution plug might be preventing the
fish from their migration into River Indus, which definitely play a vital role in
reduction in whole fish population, which are considered as clean water lover and
breed in clean water. Moreover this pollution will be lethal to eggs and juvenils as
compare to adults and there is the sure danger of loss of fish seed and grown up fish.

98
Table 3.9 Heavy metals concentration of water sample D, downstream to C
during low (winter) and high (summer) flows during 2012-2014.
Paramets
L. F
Jan.
12
H. F
Jun.
12
L. F
Dec
12
L. F
Jan.
13
H. F
Jun.
13
L. F
Dec
13
L. F
Jan.
14
H. F
Jun.
14
L. F
Dec.
14
L. F
(n-6)
H. F
(n-3)
NEQS
Standards
Zn 251 258 250 248 255 240 250 251 247 247.7±36.4 254.7±35.1 500
Ni 65 84 54 69 83 54 61 87 57 60.0±24.2 84.7±16.3 1000
Cr 23 51 27 18 49 27 16 43 31 23.7±14.8 47.7±17.1 1000
Cu 17 29 36 26 27 37 26 31 37 29.8±20.0 29.0±8.8 1000
Pb 71 190 79 76 187 81 76 183 83 77.7±22.7 186.7±30.1 500
Cd 60 82 65 65 78 67 65 84 68 65.0±14.6 81.3±19.0 100
Fe 49 61 53 44 59 60 47 43 63 52.7±25.2 54.3±28.3 8000
Mn 39 44 44 43 41 46 43 43 47 43.7±12.7 42.7±9.7 1500
Hg 34 45 37 36 41 39 36 37 42 37.3±12.5 41.0±14.8 10
P < 0.05
1, Mean± Standard deviation.
2, See table 3.3 for abbreviations.
99
3.3.1.5 Conclusions and Remarks
The following tables 3.10 and 3.11 summarize physico-chemical and heavy
metal parameters of different water samples collected from Warsak dam (water
sample A), polluted River Kabul (water samples B, C and D) during low flow (winter)
and high flow (summer).
Overall results show that industries in the vicinity are discharging effluents
containing high level of TSS and Hg. Level of these parameter was exceeding the
permissible limits laid down by NEQS for effluents but the remaining parameters
were within permissible limits provided by NEQS. The down stream water samples B,
C and D from polluted sites 3, 1 and 2 showed an increasing tendency of both
physico-chemical and heavy metal parameters as when compared with water samples
A showing metal stress in down stream portions of river. During low flow period in
winter due to less snow melt at the top of hills, the river water volume reduces about
three times, but the sewage and effluent contents remain the same. During high flow
in summer, snow melts at the hills and results in flooding and hence increases the
river volume, which dilutes the pollutants in the river in these months, except TSS,
which exceeded the NEQS limits even in high flow months. Among heavy metals
except Hg studied in the all water samples A, B, C and D were within permissible
limits laid down by NEQS. The high TSS and Hg content reduces light penetration in
deeper strata of river water and thus results in less growth of plankton and algae,
which naturally will reduce food and consequently reduce the fish yield. Deforestation
and mining activities on the hills resulted in soil erosion and hence increases TSS
concentration in river water. Thus different water samples were in the trend of D> C >
B > A. This shows that water sample D had highest physico-chemical and heavy
metal parameters followed by water sample C, B and water sample A had lowest
parameters.

100
The highest parameters in water sample D may be attributed to effluents and
sewages discharging into River Kabul at this site. Water sample D has received
effluents and sewages from Mardan and Nowshera cities and also received effluents
from upstream industries of Amanghar. Therefore here at site D the pollution is high
as compare to remaining studied sites of River Kabul. All investigated metals
including Zn, Ni, Cr, Cu, Cd, Pb, Fe, Mn and Hg and physico-chemical parameters
like TDS, TSS, EC, TA, Na, Cl, K and pH in water samples from polluted water
showed increasing tendency as compare with control water from Warsak dam. The
possible reasons for this tremendous increase in individual metal and physico-
chemical parameter level in water of River Kabul could be correlated to mining
activities in surrounding hills, agricultural activities, city sewage, industrial effluents
and other anthropogenic activities.

101
Table 3.10 Physico-chemical and heavy metal contents of water sample-A
from Warsak dam (control), water sample-B from River Kabul
upstream to the confluence point, water sample C from River
Kabul downstream to the confluence point and water sample-D
from River Kabul downstream of C during low flow (winter) 2012-
2014.
Characteristics Parameters Water
sample A
Water
sample B
Water
sample C
Water
sample D
Physico-chemical
properties
pH 7.3±1.7 7.9±1.5 7.4±1.0 7.5±2.0
TSS 418.8±398.9 497.5±161.5 549.7±228.7 543.8±189.3
TDS 581.1±255.9 725.8±310.2 830.0±482.4 793.1±353.4
EC 343.1±111.7 425.8±129.9 473.7±102.0 453.0±125.1
Cl 12.8±6.2 25.1±7.6 32.1±12.4 39.0±14.4
K 1.1±0.7 4.5±1.5 8.2±2.2 9.2±1.8
Na 10.8±8.5 28.0±8.7 36.3±19.2 75.5±65.5
TA 108.5±55.0 185.7±142.9 207.8±112.7 302.1±54.2
Heavy metals
Zn 54.8±52.9 211.5±45.9 226.1±39.5 247.7±36.4
Ni 33.3±14.9 55.5±15.4 46.3±10.1 60.0±24.2
Cr 18.8±9.3 18.7±8.0 23.0±14.5 23.7±14.8
Cu 8.0±9.2 21.0±15.3 23.8±17.6 29.8±20.0
Pb 3.7±3.11 65.8±16.9 70.8±17.5 77.7±22.7
Cd 16.7±6.7 55.0±15.9 57.7±13.2 65.0±14.6
Fe 15.0±7.0 30.5±10.1 40.8±15.2 52.7±25.2
Mn 16.7±10.1 35.0±12.7 38.5±9.1 43.7±12.7
Hg 13.1±6.9 18.5±6.5 30.8±11.5 37.3±12.5
P < 0.05
Mean± Standard deviation
See tables 3.2 and 3.4 for Abbreviations.
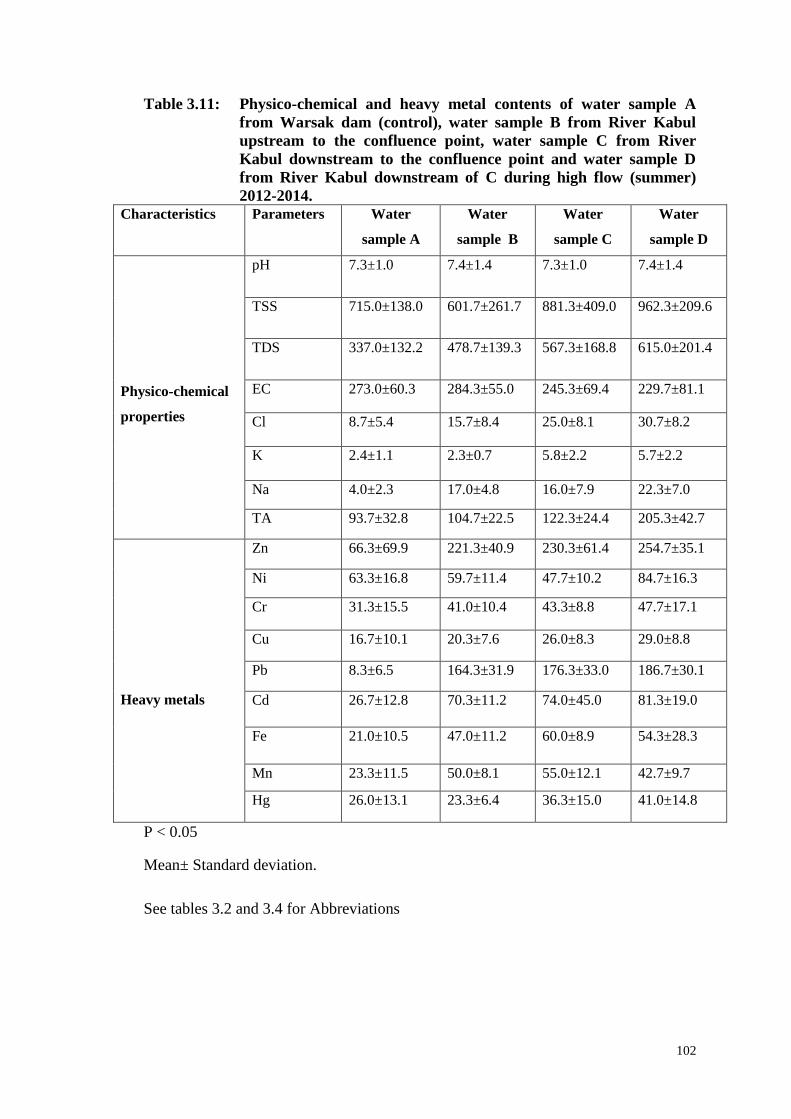
102
Table 3.11: Physico-chemical and heavy metal contents of water sample A
from Warsak dam (control), water sample B from River Kabul
upstream to the confluence point, water sample C from River
Kabul downstream to the confluence point and water sample D
from River Kabul downstream of C during high flow (summer)
2012-2014. Characteristics Parameters Water
sample A
Water
sample B
Water
sample C
Water
sample D
Physico-chemical
properties
pH 7.3±1.0 7.4±1.4 7.3±1.0 7.4±1.4
TSS 715.0±138.0 601.7±261.7 881.3±409.0 962.3±209.6
TDS 337.0±132.2 478.7±139.3 567.3±168.8 615.0±201.4
EC 273.0±60.3 284.3±55.0 245.3±69.4 229.7±81.1
Cl 8.7±5.4 15.7±8.4 25.0±8.1 30.7±8.2
K 2.4±1.1 2.3±0.7 5.8±2.2 5.7±2.2
Na 4.0±2.3 17.0±4.8 16.0±7.9 22.3±7.0
TA 93.7±32.8 104.7±22.5 122.3±24.4 205.3±42.7
Heavy metals
Zn 66.3±69.9 221.3±40.9 230.3±61.4 254.7±35.1
Ni 63.3±16.8 59.7±11.4 47.7±10.2 84.7±16.3
Cr 31.3±15.5 41.0±10.4 43.3±8.8 47.7±17.1
Cu 16.7±10.1 20.3±7.6 26.0±8.3 29.0±8.8
Pb 8.3±6.5 164.3±31.9 176.3±33.0 186.7±30.1
Cd 26.7±12.8 70.3±11.2 74.0±45.0 81.3±19.0
Fe 21.0±10.5 47.0±11.2 60.0±8.9 54.3±28.3
Mn 23.3±11.5 50.0±8.1 55.0±12.1 42.7±9.7
Hg 26.0±13.1 23.3±6.4 36.3±15.0 41.0±14.8
P < 0.05
Mean± Standard deviation.
See tables 3.2 and 3.4 for Abbreviations

103
CHAPTER-4
BIOACCUMULATION OF HEAVY METALS IN
SELECTED FISH SPECIES OF RIVER KABUL
4.1 INTRODUCTION
Accumulation of materials, which are not components of an organism body is
termed bioaccumulation of metals (Bain, 1993). Fish accumulate metals directly from
the water and indirectly by feeding on aquatic small organisms (Sasaki et al., 1998).
Fish are the choice animals that are used as a test organism for the assessment of
water pollution in the aquatic environment (Buikema et al., 1982). Fish are good
indicators of water quality in aquatic environment and can give informations about the
new toxic and dangerous chemicals, which are dumped into the aquatic environment
(Powers, 1989; Bailey et al., 1992). Some fish are capable of bioaccumulation of
metals nearly 100 times the concentration of metals in water, however it had been
reported that the fish accumulate trace metals like Zn, Ni, Cr, Cu, Cd, Fe thousand
times above the levels exiting in the exposure medium, while some metals were
preferentially accumulated than others (Onwumere and Oladimeji, 1990). Fish acts as
a bio-indicators for heavy metals pollution in the aquatic environment and can help in
detection of aquatic environmental problems (Cavas and Ergen, 2005b).
The field and laboratory experimental studies indicate that heavy metals
bioaccumulation in various organs and tissues of fish is attributed to heavy metals
concentration in water and exposure time. Although other parameters like salinity,
pH, hardness and temperature also help in metal accumulation (Jeffree et al, 2006;
Quan et al., 2006; Singh et al., 2006). It has been investigated that problems of heavy
metal accumulation in aquatic organisms including fish needs continuous monitoring
and surveillance owing to biomagnifying potential of toxic metals in human food
chain (Das and Kaviraj, 2000; Laxi, 2005; Jayakumar Paul, 2006; Kumar et al.,
2008). Fish are considered as a good indicator of heavy metal pollution in aquatic
104
environment because they have various trophic levels, different size and age
(Gabbianelli et al., 2003). Fish are the aquatic organism that can accumulate heavy
metals in their tissues (Nwaedozie, 1998). Aquatic organisms can accumulate metals
or pesticides directly from contaminated water or indirectly by the ingestion of
contaminated feed sources (Huong et al., 2012). Fish has higher rate of accumulation
for heavy metals than other species because of their different feeding habits. This has
been shown to be especially true for cadmium (Regoli et al., 2002, Kavun et al.,
2002). Aquatic organisms such as fish have capability to accumulate greater content
of heavy metals in their living cells than those present in water (Forstner and
Wittmann, 1981). Bioaccumulations of heavy metals adversely affect liver, muscle,
kidney and other tissues of fish. They also affect metabolism, development and
growth of fish (Sephar, 1976; Anadon et al., 1984; Birage and Black, 1980). Heavy
metals are the major industrial effluents, which along with other products from
industrial operations are added into the water resources. These heavy metals are more
toxic and dangerous to aquatic animals like fish (EL. Rayis and Ezzat, 1987;
Dallinger et al, 1987; Dutton et al., 1988). Heavy metals have the tendency to
accumulate in different tissues of fish (Buhler et al., 1977), which then enter into the
human body through consumption of contaminated fish and can cause serious
diseases in human beings (Puel et al., 1987).
Fish can accumulate greater amount of metals in their organs from their
environment, in which metals are below the limit of detection in routine water
samples (Barak and Mason, 1990). Accumulation of heavy metals in fish organs has
been studied by several investigators (Abdel-Baky, 2001; Bahnasawy, 2001; EI-
Ghazaly et al., 1992; Gutleb et al., 2002; Khallaf et al„ 1998; Moselhy, 1999; Heba et
al., 2001). Fish accumulate heavy metals in their organs and tissues from
contaminated environment. Different tissues and organs of fish accumulate different
heavy metals with different concentrations (Jezierska and Witesta, 2001). Feeding
diets, sediments and water are the sources from which the fish species mostly take
105
heavy metals and then heavy metals are accumulated in different tissues of the fish
(McCarthy and Shugart, 1990). The fish like C. anguillar is accumulate heavy metals
like nickel and lead, which could be correlated to the presence of nickel and lead on
the surface water due to weathering of materials and soil erosion (Jonathan and
Maina, 2009 ). Fish can store heavy metals in their liver or excretes through bile.
Kidney and gills are other organ for heavy metal regulatios in fish (Nussey, 2000).
The liver of fish plays a significant role in heavy metals accumulation and
detoxification (Yousafzai, 2004). Several investigations have also reported that
exposure duration, heavy metals concentration as well as salinity, temperature,
hardness and metabolism are helping in accumulation and retaining of heavy metals in
different tissues and organs of fish from their environment (Ademoroti, 1996;
Cusimano et al., 1986; Heath, 1987; Allen, 1995; Karthikeyan et al., 2007). It has
been shown that more heavy metals are accumulated in fish species than other
animals (Adeyeye et al., 1996). Aquatic ecosystems are subjected to low-level and
long term exposure of increasing number of new chemicals released continuously
(Folmer et al., 1993). Gills tissues have an active role in gas exchange, ion regulation,
acid balance and waste excretion and metals accumulation, while muscle on the other
hand play less role in metals bioaccumulation (Bajc et al., 2005; Filazi et al., 2003;
Shukla et al., 2007).
Liver and gills play a significant role in metabolism and respiration process.
Heavy metals accumulation in organs has been reported by many workers, which are
correlated to some abnormalities in organs and tissues after exposure of the fish to
heavy metals (Engelhardt et al., 1981; Khan, 2003). The amount of different heavy
metals were determined in various tissues of two cyprinidi fish species collected from
the upper, middle and lower parts of the Kor River, Iran. The purpose of the study
was to find out whether these fish are suitable for human consumption or not
(Ebrahimi and Taherianfard, 20 11). Heavy metal such as cadmium was analyzed in
the aquatic organism like fish. This metal has a cumulative polluting effect and could

106
result in causing vital disorders in fish such as abnormal behaviour, locomotor
abnomalities or anorexia (Woo et al., 1994; Bryan et al., 1995). Heavy metals tend to
accumulate in different tissues of fish and are one of the public health concerns to
both animals and humans (Asaolu and Olaofe, 2005; Olowu et al., 2010; Kalay et al.,
1999; Ashraf, 2005). In recent investigation different tissues of Synodentis budgetti
fish were studied for heavy metals bioaccumulation. The liver of Synodentis budgetti
showed greater level of metals as compare to other tissues. The liver tissue came
second for metals accumulation after gills (Joseph et al., 2012).
Heavy metal such as Cd is a highly toxic to aquatic organisms and
accumulates in liver and kidney inducing hepatic and renal injury (Kjellstrom and
Nordberg, 1985). The fish liver plays a good role in various functions like metabolism
of the fish body and also help in accumulation, biotransformation and excretion of
heavy metals in fish (Figueiredo et al., 2006). It is estimated that fish can act as front-
line indicators of suspected aquatic pollutants such as heavy metals (Bailey et al.,
1996). The analysis of the fish liver was done. Since heavy metals have the tendency
to be stored firstly in the liver as a detoxifying mechanism. Therefore the liver is a
better indicator of bioaccumulation of heavy metals for environmental protection
(Beder, 1990). It has been reported that Salmo trutta is a native fish of Spain. It is
common fish species in the rivers of Spain and has a wide spread range in the fresh
water ecosystem of the area ecosystem potentially polluted with heavy metals.The
fish plays a vital role in biomonitring of heavy metal pollution. Heavy metals like Cu,
Pb and Cd were determined in water and fish like Salmo trutta. Significant
correlations were observed between sediment Pb concentration and Pb content in trout
liver (Linde et al., 2002). In another study, it has been investigated that different
tissues of the fish were analyzed for heavy metals accumulation. The heavy metal like
copper was in the highest concentration in the liver but lowest in the muscle. The
greater level of copper in the liver could be correlated to metabolic process and
enzyme catalyzed reaction involving copper occurred in the liver (Gomaa et al., 1995;

107
El-Moselhy, 1999).
The water of the lake was studied for heavy metals and inorganic anions. The
content of heavy metals and inorganic anions in water has variation due to the
distance from the origin of the lakes, depth and seasons of the year. The flora and
fauna of the deserts along with fish were analyzed for heavy metals concentration.
Animals living near the lakes showed greater level of heavy metals like Pb, Hg and
Cd than animals of the same species collected further away from the lakes (Saleh et
al., 1987). The concentration of heavy metal in the muscle tissue of edible fish
collected from two selected mangrove areas was determined. The determination of the
concentration of heavy metal content in the muscle tissue was made from samples of
fish from Klong- dam. The concentration of heavy metals in samples was at the
permissible level so it was not harmful to consumers (Monkolprasi, 1983). Heavy
metals are non-biodegradable and dumped into aquatic environment through
industrial effluents and city sewages. They could accumulate in aquatic organisms.
Fish absorb the dissolved elements and heavy metals from surrounding enviornment,
which may accumulate in different tissues (Eiman and Zamzam, 1996).
Heavy metals like Fe, Cu, Ni, Cr, Pb and Zn were studied in different tissues
like muscle, skin, and gonads of Mugil cephalus and Trachurus mediterraneus fish.
The fish from different study sites showed different levels of heavy metal and
different stations also showed different contents of heavy metals. Two stations were
much polluted due to receiving untreated domestic wastes and industrial effluents and
particularly greater concentration of metals. Generally, skin and gonads had
accumulated greater concentration of metals than muscle. Some metals in some
tissues have crossed the permissible limits for a food source for human consumption
(Yilmaz, 2003).
Water and different tissues of Tilapia nilotica were studied for
bioaccumulation of heavy metals like Cd, Cu, Pb and Zn. The water showed greater

108
concentration of Pb than Cd, Cu, and Zn. These heavy metals also showed different
concentrations in different parts of the fish. The visceral tissues showed the greater
concentration followed by the head, while smallest level was found in the flesh of the
fish (Attam et al., 1997). Metal contents were measured in different fish species like
Cypranus carpiocommunis, Cypranus carpio specularis, Cypranus carpio nudus and
Salmo gairdneri. Lead concentration was below detectable in the fish. The kidney had
accumulated greater metal load. The study also reported the daily dietary intake of
metals by human through fish consumption (Muralidharan et al., 1997).
Concentration of heavy metals like cadmium, chromium, copper, nickel, lead and zinc
were determined in different tissues of marine fish like Epinephelus aerolatus,
Lutjanus russelli and Sparus sarba. The fish from cultured sites showed greater metal
concentration than sea water and sediments. Generally tissues of all three species
showed greater content of zinc and copper but nickel, lead, cadmium and chromium
concentration was the smallest. Metal contents were different in various tissues,
among species and among fish culture sites. Different tissues have different capacity
for heavy metals accumulation. Gonads of all three fish species showed higher levels
of zinc and liver seemed to be the primary organ for Cu accumulation (Wong et al.,
2001).
The impact of heavy metals like Cd, Zn and pesticides on the rate of uptake of
glucose, fructose and amino acid tryptophan by the intestine of fresh water teleost
fish, Channa punctatus and Heteropneustes fossilis was investigated. Fish have
showed decrease in the rate of transport of glucose and fructose after exposed to sub
lethal concentration of Cd and Zn (Shukla et al., 2001). Heavy metals like Zn, Cu and
Pb were studied in the muscle tissues of edible fish’s sample. These metals were also
analyzed in the sediment and aquatic phase to find out the degree of bioaccumulation.
Different fish species showed different metals accumulation. These metals were in the
order of Zn> Cu > Pb (Bhattacharya et al., 2001). Heavy metals like zinc, copper,
cadmium, lead, chromium, nickel and cobalt were determined in sediments and three

109
edible fish. The findings aimed to assess heavy metals accumulation in fish inhabiting
sediments characterized by varying metal bioavailability. Greater contents of zinc,
cadmium and copper were found in fish than sediments. The fish of Kolleru Lake
accumulated higher concentration of metals and was decleared unfit for human
consumption (Sekhar et al., 2004).
4.2 MATERIALS AND METHODS
4.2.1 Study Area
For detail see page≠2
4.2.2 Fish Sampling Sites
Two fish samples at different times were collected from highly polluted belt of
the main river. One sample (containing five different fish species) was from the area
of about 3 km in length upstream Nowshera- Mardan Road Bridge to Amangarh
industrial zone (site 1). It receives effluents from Amangarh Industries. The second
fish sample (containing five different fish species) was taken about 4 km downstream
Nowshera- Mardan Road Bridge (site 2). The sewages from Nowshera city, Mardan,
Risalpur and other adjacent towns join River Kabul at this point. Both the above
samples collected from sites 1 and 2 of River Kabul were considered fish samples
from polluted water (tested fish sample) and were compared with third fish sample
collected from non polluted Warsak dam (site 3) about 60 km upstream the polluted
part of the River Kabul. This was the control fish sample. Five different fish species
were selected from each polluted and non polluted part of River Kabul. Both the
tested and control fish samples were compared for heavy metals to assess water
pollution in River Kabul (Fig. 4.1).
4.2.3 Collection of Fish Samples
Fishing was done during late night with the help of local fishermen. The gills
net (Patti) (40×6ft) with a cork line at the top rope and metal line with the ground rope
110
made locally of nylon was used for fishing as fish gear, with the help of four
fishermen and a wooden boat usually operated a single pati. Moter driven boats were
not used as the fish would be disturbed with sound from engine. Fish species were
including Wallago attu, Ompok bimaculatus, Labeo dyocheilus, Cyprinus carpio and
Aorichthys seenghala.

111
Fig 4.1 Fish sampling sites 1 and 2 at River Kabul (polluted samples) and site 3
in Warsak dam (control sample).
112
4.2.4 Collection and Preservation of Fish Tissues
Different fish species including Wallago attu, Ompok bimaculatus, Labeo
dyocheilus,Cyprinus carpio and Aorichthys seenghala were collected from two sites
of the River Kabul, downstream (site 1, Amangarh and site 2, Nowshera) and
upstream (site 3, Warsak dam reservoir). The netted fish were dissected for collection
of tissues like intestine, gills, skin, liver and muscle. These tissues were washed with
distilled water and then shifted to marked sterilized polythene bags. Polythene bags
having fish tissues were then stored in the freezer (at -20 c°) for further analysis of
heavy metals accumulation.
4.2.5 Tissue Digestion
For the estimation of heavy metals, the tissues digestion was carried out in the
Department of Zoology University of Peshawar. Tissues samples were thawned rinsed
in distilled water and blotted with blotting paper and shifted to 100ml volumetric
flasks. Before tissues transfer, all the flasks were washed with distilled water and
were dried in oven at 60C˚ for a few minutes. Then the known weight of each tissue
(50g) was shifted to these volumetric flasks. Samples were digested according to the
methods described by Van Loon (1989). 5ml nitric acid (55%) and 1ml per chloric
acid (70%) were added to each flask and the flasks then were kept for overnight.
Next day a second dose of 5ml nitric acid (55%) and 4ml (70%) per chloric acid
(70%) were added to each flask. The flasks were then placed on hot plate and allowed
to digest at 200 to 250C° until a transparent and clear solution was obtained. After
digestion samples were cooled and were diluted to 100ml with distilled water.
Samples were stored in properly washed glass bottles until the metal concentration
could be determined.
4.2.6 Determination of Heavy Metals
Determination of heavy metals was done through Atomic Absorption
Spectrophotometer in the Centralized Resource Laboratory (CRL) University of

113
Peshawar. Atomic Absorption Spectrophotometer (Spectra-AA-700) was used for
determination of heavy metals like Zn, Ni, Cr, Cu, Cd, Pb, Mn, Fe and Hg
concentrations in different tissue of each fish from both polluted and control sites of
River Kabul.
Table 4.1 Operating data of Atomic Absorption Spectrophotometer for
determination of metals
Elements Wave length (nm) Flame Working range (µg/mL-1)
Zn 213.9 AA (L) 0.4-1.6
Ni 232.0 AA (L) 3-12
Cr 357.9 AA (R) 2-8
Cu 324.7 AA (L) 2-8
Cd 228.8 AA (R) 0.5-2
Pb 217.0 AA (L) 5-20
Mn 279.5 AA (L) 1-4
Fe 248.3 AA (L) 1-4
Hg 253.7 AA (L) 100-400
Abbreviations, AA: air acetylene, R: Fuel-rich, L: Fuel-lean
4.2.7 Statistical Analysis
Statistical analysis was done by using ANOVA software for windows. Mean
and standard deviation values of the data were determined. The different sets of data
were analyzed for statistical differences by using student’s t –test (two-tailed); a P
value <0.05 was considered to show statistical significance.

114
4.3 RESULT AND DISCUSSION
In the present investigation heavy metals like Zn, Ni, Cr, Cu, Cd, Pb, Fe, Mn
and Hg were determined in gills, skin, intestine, liver and muscle of different fish
species like Wallago attu, Aorichthys seenghala, Labeo dyocheilus, Cyprinnus carpio,
Ompok bimaculatous caught from site 3 (control) and site 1 and site 2 (polluted sites).
Comparing our studies with the findings of other workers and Yousafzai (2004)
showed that increase in levels of different heavy metals in different tissues was
observed. This reflects that in past three years, a further increase in level of heavy
metals has been occurred in River Kabul, which is suggestive of implementation of
environmental laws and a biomonitoring progamme.
4.3.1 Bioaccumulation of Heavy Metals in Gills
Gills of five selected fish from site 3 (control site) and site 1 and site 2
(polluted sites) were taken out and processed for estimation of zinc, chromium,
copper, cadmium, lead, iron, manganese and mercury. Gills of fish from site 1 and
site 2 showed greater concentration as compare to those from site 3 (Table 4.2 and
Figs 4.2-4.4).
From amongst heavy metals, zinc had highest concentration in gills of
Wallago attu from sites 1 and 2 with mean values of 824.0±594.5 µg/g and
894.0±643.5µg/g and had 404.3±101.8 µg/g from site 3, Aorichthys seenghala from
polluted sites had 499.3±477.5 µg/g and 909.0±624.7 µg/g and had 377.0±177.4 µg/g
from control site, Labeo dyocheilus from polluted water had 1537.0±1028.5 µg/g and
1626.7±1075.2 µg/g and had 402.3±127.2 µg/g from control water, Cyprinus carpio
from polluted site 1 and site 2 had 1416.3±1168.1 µg/g and 1497.7±1128.5 µg/g and
had 392.6±81.5 µg/g from Warsak dam and gills of Ompok bimaculatus from polluted
sites had 3496.0±5381.8 µg/g and 3633.0±5521.1 µg/g and had 360.3±142.0 µg/g
from control site respectively. Mean values of zinc in different fish species followed
the order: Ompok bimaculatus > Labeo dyocheilus > Cyprinus carpio > Aorichthys

115
seenghala > Wallago attu. This shows that Zn metal bioaccumulation is highest in
gills of Ompok bimaculatous and lowest in Wallago attu. The present result found
more Zn than those reported in previous studies (Jennings and Rainbow, 1979;
Wepner et al., 2001). Comparing these studies with our findings reflect that River
Kabul has more concentration of Zn as compare to other mentioned water resources.
However, in this study gills of Ompok bimaculatus had accumulated higher
concentration of Zn as compare to other fish species. This could be because of
omnivorous nature of this fish. Being an omnivorous nature it is more exposed to
metal bioaccumulation by many food chains.
Gills of Wallago attu from polluted sites showed more Ni mean values of
116.3±102.5 µg/g and 130.7±113.9 µg/g and showed 75.0±39.9 µg/g from site 3,
Aorichthys seenghala from polluted sites 1 and 2 showed 113.7±86.9 µg/g and
129.3±93.5 µg/g and showed 55.7±38.4 µg/g from control site, Labeo dyocheilus
from polluted water showed 136.7±141.7 µg/g and 160.3±209.4 µg/g and showed
41.7±19.9 µg/g from control site 3, Cyprinus carpio from polluted water showed
94.3±47.5 µg/g and 118.0±61.9 µg/g and showed 84.3±32.3 µg/g from site 3 and
Ompok bimaculatus from site 1 and site 2 showed 139.7±106.0 µg/g and 163.3±124.4
µg/g and showed 49.3±23.3 µg/g from site 3 respectively. In this investigation,
concentration of Ni in gills of examined fish species was higher than those reported in
previous findings (Zia and Mcdonald, 1994; Ptashynski et al., 2002; Uluzlu et al.,
2007). Nickel concentration in gills of different fish species was in the order of
Ompok bimaculatus >Labeo dyocheilus>Wallago attu>Aorichthys seenghala
Cyprinus carpio. This indicates that metal bioaccumulation is highest in gills of
Ompok bimaculatus and lowest in Cyprinus carpio. Nickel in gills from site 2 was
more than those from site 1. This could be correlated to dumping of city sewages and
industrial effluents at site 2 and more exposition of fish to this metal for long period.
116
Chromium content in gills of Wallago attu from polluted sites were
555.3±418.4 µg/g and 605.0±419.9 µg/g and was 11.3±7.0 µg/g from control site, in
Aorichthys seenghala from sites 1 and 2 were 552.7±414.1 µg/g and 610.7±441.1
µg/g and was 11.3±7.0 µg/g from site 3, in Labeo dyocheilus from polluted water
were 680.7±413.7 µg/g and 739.0±409.2 µg/g and was 70.3±32.5 µg/g from control
water, in Cyprinus carpio from polluted sites were 541.7±227.2 µg/g and 578.3±234.5
µg/g and was 18.0±13.6 µg/g from control site and in Ompok bimaculatus from sites
1 and 2 were 657.3±425.0 µg/ and 752.3±455.6 µg/g and was 40.7±45.3 µg/g from
site 3 respectively. Chromium bioaccumulation in gills of different fish species was in
the sequence of Ompok bimaculatus>Labeo dyocheilus>Aorichthys seenghala >
Wallago attu>Cyprinus carpio.This highlights that Cr metal bioaccumulation is
highest in gills of Ompok bimaculatus and lowest in Cyprinus carpio. High
concentration of Cr in gills of different fish species from River Kabul being
determined in this study are in agreement with many studies that determined also high
content of Cr in gills of other different fish (Avevnant- Oldewage and Marx, 2000;
Olaifa et al., 2004). Accumulated Cr metal in this organ varied significantly
depending upon fish species and sites of fish and water contamination. High metal
accumulation in Ompok bimaculatus indicates discharge of industrial and municipal
effluents into River Kabul.
Copper concenrations in gills of different fish species from polluted site 1 and
site 2 are also high as compare to control site, where the recorded value for Cu was
lowest. Copper concentration in gills of Wallago attu from both sites 1 and 2 were
105.3±89.1 µg/g and 301.0±91.7 µg/g and was of 90.7±79.3 µg/g from control site 3,
in Aorichthys seenghala from polluted sites were 208.0±145.3 µg/g and 232.7±153.3
µg/g and was 52.7±25.9 µg/g from control site, in Labeo dyocheilus from sites 1 and
2 were 154.3±42.3 µg/g and 175.3±49.9 µg/g and was 57.7±33.1 µg/g from site 3, in
Cyprinus carpio from polluted water were 148.0±103.8 µg/g and 167.0±114.8 µg/g
and was 74.0±37.0 µg/g from control water and in Ompok bimaculatus from sites 1

117
and 2 were 165.0±97.6 µg/g and 216.3±146.7 µg/g and was 54.3±34.1 µg/g from site
3 respectively. Copper bioaccumulation in gills of different fish species was in the
order of Wallago attu > Aorichthys seenghala> Ompok bimaculatus > Labeo
dyocheilus > Cyprinus carpio. This revealed that metal bioaccumulation is the highest
in gills of Wallago attu and the lowest in Cyprinus carpio. High concentration of Cu
has also been reported in previous investigations (Clear water et al., 2000; Olaifa et
al., 2004; Uluzlu et al., 2007; Amal et al., 2012). Comparing the above studies with
our findings is reflecting that River Kabul has more concentration of copper as
compare to other mentioned water bodies. However, in this study gills of Wallago
attu had accumulated higher concentration of copper as compare to other fish species.
This could be because of omnivorous nature, low elimination of metals from body,
low metabolic rate and low detoxification mechanism of this fish.
Gills of Wallago attu from both polluted sites accumulated maximum
concentration of cadmium with mean values of 62.7±31.1 and 79.0±58.8 and
accumulated minimum mean value of 8.3±7.5 from control site, Aorichthys seenghala
from site 1 and site 2 accumulated 58.3±87.2 µg/g and 72.7±41.5 µg/g and
accumulated 5.3±3.4 µg/g from site 3, Labeo dyocheilus from polluted water
accumulated 63.7±25.2 µg/g and 82.3±46.6 µg/g and accumulated 18.0±4.9 µg/g
from Warsak dam, Cyprinus carpio from both sites 1 and 2 accumulated 60.7±29.4
µg/g and 74.7±40.9 µg/g and accumulated 23.7±15.5 µg/g from control site and
Ompok bimaculatus from polluted sites 1 and 2 accumulated 69.3±43.2 µg/g and
83.0±52.2 µg/g and accumulated 53.0±49.5 µg/g from control site 3 respectively.
Cadmium bioaccumulation in gills of different fish species was in the order of Ompok
bimaculatus > Labeo dyocheilus > Wallago attu>Cyprinus carpio> Aorichthys
seenghala. This indicates that metal bioaccumulation is highest in gills of Ompok
bimaculatus and lowest in Aorichthys seenghala. The present results are in agreement
with those observed by many investigators (Uluzlu et al., 2007; Farakas et al., 2003;
Yap et al., 2005; Hilrny et al., 1985). However, in the present study gills of Ompok
118
bimaculatus from polluted sites has accumulated higher concentration of Cd as
compare to fish species from control site 3.
Gills of Wallago attu from polluted sites had accumulated highest
concentration of lead with mean values of 62.7±31.1 µg/g and 461.3±555.6 µg/g and
had accumulated lowest content with mean value of 66.3±36.4 from control site,
Aorichthys seenghala from site 1 and site 2 had accumulated 315.7±311.5 µg/g and
382.0±379.1 µg/g and had accumulated 149.3±99.0 µg/g from site 3, Labeo
dyocheilus from polluted sites had accumulated 262.3±217.4 µg/g and 309.3±257.0
µg/g and had accumulated 16.6±13.8 µg/g from control site, Cyprinus carpio from
polluted water had accumulated 115.3±105.9 µg/g and 133.7±125.9 µg/g and had
accumulated 53.0±48.7 µg/g from Warsak dam water and Ompok bimaculatus from
polluted water had accumulated 277.0±236.9 µg/g and 322.0±263.2 µg/g and had
accumulated 21.0±17.1 µg/g from control water. Lead bioaccumulation in gills of
different fish species was in the order of Wallago attu> Aorichthys seenghala
>Ompok bimaculatus > Labeo dyocheilus > Cyprinus carpio. This shows that metal
bioaccumulation was highest in gills of Wallago attu and lowest in Cyprinus carpio.
In this finding, levels of Pb in gills of different fish samples were more than the
concentrations reported in gills of other fish species (Barbarae, 1977; Rogers et al.,
2003; Naghshbandi et al., 2007). Comparing the above studies with our finding
reflecting that River Kabul has more concentration of Pb as compare to other
mentioned water resources. However, in this investigation gills of Wallago attu has
accumulated higher concentration of Pb as compare to other fish species.This could
be because of large body size, exposition of this fish to metal for long period and low
metabolic rate.
Gills of Wallago attu from polluted sites contained iron with mean values of
94.0±27.4 µg/g and 114.0±34.9 µg/g and contained 28.0±10.5 µg/g from control site,
Aorichthys seenghala from polluted water contained 87.0±26.3 µg/g and 107.0±33.8

119
µg/g and contained 22.0±8.9 µg/g from control water, Labeo dyocheilus from polluted
sites 1 and 2 contained 85.0±26.0 µg/g and 105.0±33.4 µg/g and contained18.0±8.4
µg/g from site 3, Cyprinus carpio from polluted sites contained 90.0±26.8 µg/g and
110.0±34.2 µg/g and contained 26.0±10.2 µg/g from control site and gills of Ompok
bimaculatus from polluted sites contained 88.0±26.5 µg/g and 108.0±33.9 µg/g and
contained 23.0±9.5 µg/g from control site respectively. The sequence of iron
bioaccumulation in gills of different fish species was Wallago attu >Cyprinus carpio
>Ompok bimaculatus > Aorichthys seenghala > Labeo dyocheilus. This reveales that
metal bioaccumulation is highest in gills of Wallago attu and lowest in Labeo
dyocheilus. These results are in agreement with those observed by many investigators,
who have also studied different metals in fish exhibited their highest levels in gills
(Olayan and Thomas, 2005; Yilmaz and Dogan, 2007; Fatma et al., 2005). In the
present finding gills of examined fish showed maximum content of Fe as compare to
other fish species of Pakistan. This is because of different feeding behaviors and
exposition of these fish to Fe concentration in water for long period and the result also
indicated further increase of Fe concentration in River Kabul for the last few years.
Among studied metals Fe came last six in number after Ni in gills of all studied fish.
Gills of Wallago attu from polluted sites had maximum concentration of
manganese with mean values of 80.0±25.3 µg/g and 97.0±32.1 µg/g and had
minimum value of 34.0±11.7 µg/g from control site, Aorichthys seenghala from
polluted sites had 73.0±24.1 µg/g and 93.0±31.5 µg/g and had 28.0±10.5 µg/g from
control site, Labeo dyocheilus from both sites 1 and 2 had 70.0±23.7 µg/g and
90.0±31.0 µg/g and had 27.0±10.0 µg/g from control site 3, Cyprinus carpio from
polluted site 1 and site 2 had 76.0±24 µg/g and 96.0±32.0 µg/g and had 32.0±11.3
µg/g from Warsak dam and gills of Ompok bimaculatus from polluted water had
71.0±23.8 µg/g and 91.0±31.1 µg/g and had 32.0±11.3 µg/g from site 3 respectively.
Sequence of manganese bioaccumulation in gills of different fish species was
Wallago attu>Cyprinus carpio > Aorichthys seenghala > Ompok bimaculatus >
120
Labeo dyocheilus. This highlights that manganese content was highest in gills of
Wallago attu and was lowest in Labeo dyocheilus. The present result found high Fe
concentration as compare to other metals in this organ. In this study, Mn
concentration was higher than those reported by Rashed (2001) in gills of Tilapia
nilotica and by Fatma et al (2005) in gills tisuue of 0. niloticus, T. zillii and C. lazera
collected, while was lower than those reported by Amal et al (2012). Comparing the
present result with the findings of above mentioned workers showed further increase
of Mn content in River Kabul in the last few years.
Heavy metal like mercury tend to accumulates in gills of fish. The higher level
of mercury was found in gills and exceeded the allowed limit. Mercury in gills of
Wallago attu from polluted sites were 77.0±24.8 µg/g and 97.0±32.1 µg/g and was
22.0±9.3 µg/g from control site, in Aorichthys seenghala from sites 1 and 2 were
69.0±21.6 and 89.0±30.0 µg/g and was 17.0±8.2 µg/g from site 3, in Labeo
dyocheilus from both polluted sites were 69.0±21.6 and 89.0±30.0 and was 17.0±8.2
from site 3, in Cyprinus carpio from sites 1 and 2 were 71.0±23.8 µg/g and 91.0±31.1
µg/g and was 20.0±8.9 µg/g from site 3 and in gills of Ompok bimaculatus from site 1
and site 2 were 69.7±21.6 µg/g and 89.0±30.8 µg/g and was 19.0±8.7 µg/g from
control site 3 respectively. Sequence of mercury accumulation in this organ was
Wallago attu> Labeo dyocheilus >Cyprinus carpio > Aorichthys seenghala > Ompok
bimaculatus. This indicates that mercury level was highest in gills of Wallago attu
and lowest in Ompok bimaculatus.The present result found greater level of Hg as
reported in previous findings (Azmat and Talat, 2006; Lazorchak et al., 2003; Masoud
et al., 2007). Comparing the above studies with our finding revealed that increased
concentration of heavy metals in tissues of different fish species from polluted sites
could be correlated to exposition of fish to metals for long period and high
concentration of metals in the water.

121
All investigated metals including Zn, Ni, Cr, Cu, Cd, Pb, Fe, Mn and Hg in
gills of different fish species from polluted water showed increasing tendency as
compare with those from control water. The possible reasons for this tremendous
increase in the individual metal level in fish tissue could be correlated to mining
activities in surrounding hills, agricultural activities, city sewage, industrial effluents
and other anthrapogenic activities and also the exposure of the fish to metal for long
time. In this investigation, high metal concentrations in different tisuues of different
fish species also could be correlated to higher metal concentration in the water and
sediments, which has not been investigated and has been reported to be potent site of
metal accumulation in the natural system. This could be suggestive of a large quantity
of metals uptake via the gills and the food chain because of the carnivorous,
herbivoreous and omnivorous feeding habits of Wallago attu, Aorichthys seenghala,
Labeo dyocheilus, Cyprinus carpio and Ompok bimaculatous. It has been suggested
that some fish are capable of bioaccumulating of metals nearly 100 times the
concentration of metals in water. Benthic vegetation also play a key role in metal
bioaccumulation as most of fish including Wallago attu, Aorichthys seenghala, Labeo
dyocheilus, Cyprinus carpio and Ompok bimaculatous especially in the early life in
natural system feed on vegetation. The present data also showed that metal
concentrations were highest in gills followed by skin, intestine and liver and was
lowest in muscle. It is well known that gills and skin are the primary sites of metals
contact and consquently their absorption. However absorption of the metals on gills
surface could also be an important factor in increase in total levels of metals in gills.

122
Table 4.2 Heavy metal concentrations (µg/g wet weight) in gills of five
different fish species netted from site 3 (control) and site 1 and site
2 (polluted) of River Kabul receiving city sewages and industrial
effluents.
P<0.05, P>0.05. (Values in bold are non-significant)
Fish Analytes (µg/g) Site 3 (n= 5) Site 1 (n= 5) Site 2 (n= 5)
Wallago attu
Zn 404.3±101.8 824.0±594.5 894.0±643.5
Ni 75.0±39.9 116.3±102.5 130.7±113.9
Cr 11.3±7.0 555.3±418.4 605.0±419.9
Cu 90.7±79.3 105.3±89.1 301.0±91.7
Cd 8.3±7.5 62.7±31.1 79.0±58.8
Pb 66.3±36.4 411.7±529.4 461.3±555.6
Fe 28.0±10.5 94.0±27.4 114.0±34.9
Mn 34.0±11.7 80.0±25.3 100.0±32.7
Hg 22.0±9.3 77.0±24.8 97.0±32.1
Aorichthys seenghala
Zn 377.0±177.4 499.3±477.5 909.0±624.7
Ni 55.7±38.4 113.7±86.9 129.3±93.5
Cr 4.6±3.2 552.7±414.1 610.7±441.1
Cu 52.7±25.9 208.0±145.3 232.7±153.3
Cd 5.3±3.4 58.3±87.2 72.7±41.5
Pb 149.3±99.0 315.7±311.5 382.0±379.1
Fe 22.0±8.9 87.0±26.3 107.0±33.8
Mn 28.0±10.5 73.0±24.1 93.0±31.5
Hg 93.0±8.2 69.0±21.6 89.0±30.0
Labeo dyocheilus
Zn 394.0±230.0 1537.0±1028.5 1626.7±1075.2
Ni 41.7±19.9 136.7±141.7 160.3±209.4
Cr 70.3±32.5 680.7±413.7 739.0±409.2
Cu 57.7±33.1 154.3±42.3 175.3±49.9
Cd 18.0±4.9 63.7±25.2 82.3±46.6
Pb 16.6±13.8 262.3±217.4 309.3±257.0
Fe 18.0±8.4 85.0±26.0 105.0±33.4
Mn 27.0±10.0 70.0±23.7 90.0±31.0
Hg 15.0±10.2 67.0±23.1 95.0±31.8
Cyprinus carpio
Zn 392.6±81.5 1416.3±1168.1 1497.7±1128.5
Ni 84.3±32.3c 94.3±47.5 118.0±61.9
Cr 18.0±13.6 541.7±227.2 578.3±234.5
Cu 74.0±37.0 148.0±103.8 167.0±114.8
Cd 23.7±15.5 60.7±29.4 74.7±40.9
Pb 53.0±48.7 115.3±105.9 133.7±125.9
Fe 26.0±10.2 90.0±26.8 110.0±34.2
Mn 32.0±11.3 76.0±24 96.0±32.0
Hg 20.0±8.9 71.0±23.8 91.0±31.1
Ompok bimaculatus
Zn 360.3±142.0 3496.0±5381.8 3633.0±5521.1
Ni 49.3±23.3 139.7±106.0 163.3±124.4
Cr 40.7±45.3 657.3±425.0 752.3±455.6
Cu 54.3±34.1 165.0±97.6 216.3±146.7
Cd 53.0±49.5 69.3±43.2 83.0±52.2
Pb 21.0±17.1 277.0±236.9 322.0±263.2
Fe 23.0±9.5 88.0±26.5 108.0±33.9
Mn 32.0±11.3 71.0±23.8 91.0±31.1
Hg 19.0±8.7 69.7±21.6 89.0±30.8

123
Wallago attu
Aorichthys seenghala
Fig 4.2 Heavy metal concentrations in gills of Wallago attuand Aorichthys
seenghalanetted fromsite 3 (control) and site 1 and site 2 (polluted)
of River Kabul receiving city sewages and industrial effluents.

124
Labeo dyocheilus
Cyprinus carpio
Fig. 4.3 Heavy metal concentrations in gills of Labeo dyocheilus and
Cyprinus carpio netted from site 3 (control) and site 1 and site 2
(polluted) of River Kabul receiving city sewages and industrial
effluents.

125
Ompok bimaculatus
Fig.4.4 Heavy metal concentrations in gills of Ompok bimaculatus netted
from site 3 (control) and site 1 and site 2 (polluted) of River Kabul
receiving city sewages and industrial effluents
126
4.3.2 Bioaccumulation of Heavy Metals in Skin
Skin of selected different fish from site 3 (control) and site 1 and site 2
(polluted) was taken out and processed for estimation of heavy metals like Zn, Ni, Cr,
Cu, Cd, Pb, Fe, Mn and Hg. (Table 4.3,4.4 and Figs 4.5-4.7). The skin of five
different fish species from polluted sites (Site 1 and Site 2) also had accumulated
greater concentatrion of metals as compare to those from control site (Site 3). Fish
skin is also consumed along with muscle in most of the rural population of the world.
Therefore researchers also have an emphasis on just tissues, while investigating
muscle. Inhabitants living around the River Kabul also eat fish skin along with
muscle. Adsorption on skin surface followed by their absorption in skin tissue by
various mechanisms favours accumulation of metals in skin.When fish are exposed to
elevated level of metals in aquatic environment. Fish can regulate metal concentration
to a certain extent after bioaccumulation (Heath, 1991). As already stated that skin of
five inhabitant fish species including Wallago attu, Aorichthys seenghala, Labeo
dyocheilus, Cyprinus carpio, Ompok bimaculatus along with muscle cooked and
consumed for being very tasty, therefore it should be compared with the U.S.
Recommended Daily Dietary Allowances (RDA) supplied by 100 gm serving of fish
muscle. Skin is the tissue that is exposed constantly and directly to water pollution.
Zn in skin of Wallago attu from polluted site 1 and site 2 showed more values
of 866.3±714.8 µg/g and 921.0±527.0µg/g and showed 425.7±138.0 µg/g from site 3,
Aorichthys seenghala from polluted sites showed 2691.0±1766.8µg/g and
2768.3±1835.4 µg/g and showed 358.7±171.2 µg/g from control site, Labeo
dyocheilus from polluted water showed 1945.7±930.9 µg/g and 1987.0±956.7 µg/g
and showed 406.3±123.7 µg/g from control water, Cyprinus carpio from sites 1 and 2
showed 4579.3±2585.8 µg/g and 4775.0±2578.2 µg/g and showed 442.7±150.8 µg/g
from site 3 and Ompok bimaculatus from polluted sites showed 1255.3±610.9 µg/g
and 1328.0±625.9 µg/g and showed 390.3±180.0 µg/g from control site. Overall order
of zinc accumulation in this organ of different fish species was Cyprinus carpio >

127
Aorichthys seenghala> Labeo dyocheilus > Ompok bimaculatus > Wallago attu. This
indicates that Cyprinus carpio had accumulated higher zinc level and Wallago attu
lower content. High concentrations of Zn in this study are in agreement with the
findings of previous workers (Coetzee et al., 2002.; Yilmaz, 2003; Honda et al.,
1983). Comparing these values with RDA maximum limits (in 100gm of the skin) for
human consumption, it is cleared that zinc metal concentration in skin of Aorichthys
seenghala and Cyprinus carpio were above the proposed RDA limits, which is 2600
µg/g/100g for zinc in the present finding. But in the rest of three fish zinc level was
below the RDA proposed limits. Therefore Aorichthys seenghala and Cyprinus carpio
from polluted sites of River Kabul are not suitable for human consumption and can
prove highly toxic. In the present study skin of Cyprinus carpio had accumulated
higher concentration of Zn as compare to other fish species. Skin is an important
tissue for metal accumulation and this is also the primary site of metal contact and
consequently their absorption and is second to the gills in storaging metals.
Skin of Wallago attu from polluted sites had more concentration of Ni with
mean values of 100.3±24.0 µg/g and 113.0±27.3 µg/g and had 85.3±40.2 µg/g from
reference site 3, Aorichthys seenghala from polluted water had 118.3±81.5 µg/g and
131.7±90.7 µg/g and had 66.3±41.0 µg/g from control water, Labeo dyocheilus from
polluted sites had 154.7±56.7 µg/g and 175.3±61.7 µg/g and had 51.3±25.8 µg/g from
control site, Cyprinus carpio from polluted water had 98.7±38.9 µg/g and 117.0±37.4
µg/g and had 92.3±29.9 µg/g from site 3 and Ompok bimaculatus from site 1 and site
2 had 138.7±84.0 µg/g and 139.7±105.5 µg/g and had 131.0±65.2 µg/g from control
site 3 e(Warsak dam) respectively. Nickel accumulation order in skin of different fish
species was Labeo dyocheilus>Ompok bimaculatus>Aorichthys seenghala>Cyprinus
carpio>Wallago attu. This shows that Labeo dyocheilus accumulated highest zinc
level and Wallago attu accumulated lowest content. By comparison our data with
RDA maximum limits (in 100gm of the skin) for human consumption, it is cleared
that nickel concentration in skin of all five inhabitant fish species from River Kabul
128
were above the RDA recommended limits, which is 10 µg/g/100g for nickel. The
present finding found highest level of nickel in skin of different fish species from
polluted sites. These results are agreed with the studies of those reported in previous
findings (Yilmaz, 2003; Tjalve et al., 1988; Ptashynski et al., 2002). Therefore all the
studied fish from polluted sites are not suitable for human consumption and proved to
be highly toxic. Comparing the above mentioned studies with our finding revealed
that River Kabul has more concentration of nickel as compare to other mentioned
water resources. However, in this study skin of Labeo dyocheilus accumulated higher
concentration of Ni as compare to other fish species. The skin of examined fish
showed greater amount of Ni as compare to the fish of control site. This finding also
indicated higher level of this metal in water of polluted sites than control water.
In this investigation chromium concentration in skin of different fish species
from polluted sites was high as compare to control site. As compare to liver, gills and
muscle, skin had accumulated higher content of chromium metal but this
concentration was lower than the intestine from sites 1 and 2. Higher Cr concentration
in skin of Wallago attu from both polluted sites 1 and 2 were 515.7±394.2 µg/g and
542.0±410.0 µg/g and lower content was 15.3±13.7 µg/g from control site 3, in
Aorichthys seenghala from polluted sites were 615.3±402.5 µg/g and 656.3±403.0
µg/g and was 6.7±3.8 µg/g from control site, in Labeo dyocheilus from polluted sites
1 and 2 were 692.0±145.9 µg/g and 725.7±140.3 µg/g and was 76.3±45.7 µg/g from
site 3, in Cyprinus carpio from polluted water were 459.0±120.0µg/g and
517.0±207.3 µg/g and was 46.0±20.8 µg/g from control water and in Ompok
bimaculatus from sites 1 and 2 were 621.7±405.3 µg/g and 676.3±432.7 µg/g and
was 50.3±51.0 µg/g from site 3 respectively. Chromium concentration in skin of
different fish species was in the sequence of Aorichthys seenghala>Labeo
dyocheilus>Ompok bimaculatus>Wallago attu>Cyprinus carpio. This highlights that
Aorichthys seenghala showed highest concentration of chromium and Cyprinus
carpio lowest content. Comparing our results with RDA maximum limits for human
129
consumption, it is cleared that nickel metal concentration in skin of all five inhabitant
fish species from polluted sites of River Kabul were above the RDA proposed limits,
which is 50-200µg/g/100g for chromium. Highest Ni concentration was observed in
skin sample collected from polluted sites. Ni of the study areas was higher than those
reported in skin of other fish species (Robinoson et al., 2004; Yousafzai, 2004).
Skin of Wallago attu from polluted sites contained maximum concentration of
copper with mean values of 108.7±97.8 µg/g and 373.3±176.5 µg/g and contained
minimum value of 96.7±90.4 µg/g from control site, Aorichthys seenghala from
polluted sites contained 196.7±181.5 µg/g and 219.0±188.3 µg/g and contained
64.3±33.5 µg/g from control site, Labeo dyocheilus from both polluted sites 1 and 2
contained 198.0±146.0 µg/g and 223.3±167.4 µg/g and contained 66.7±36.9 µg/g
from control site, Cyprinus carpio from polluted sites contained 144.0±76.2µg/g and
165.0±81.6 µg/g and contained 84.3±39.8 µg/g from site 3 and Ompok bimaculatus
from both polluted sites 1 and 2 contained 140.7±60.3 µg/g and 166.0±62.7 µg/g and
contained 62.3±38.9 µg/g from control site respectively. Copper concentration in skin
of different examined fish species was in the order of Wallago attu>Labeo
dyocheilus>Aorichthys seenghala>Ompok bimaculatus>Cyprinus carpio. This
indicates that Wallago attu accumulated highest copper concentration and Cyprinus
carpio lowest concentration. Comparing our findings with RDA maximum limits of
Cu (in 100gm of the skin) for human consumption, it is cleared that copper metal
concentration in skin of all five fish species from River Kabul were below the RDA
proposed limits, which is 2000-3000 µg/g/100g for copper. In this result, values of
copper were higher as compare to the values mentioned in previous studies (Yilmaz,
2003; Carvalho et al., 2002; Yousafzai, 2004). Comparing the other studies with our
data revealed that skin of different fish accumulated greater content of metals as
compare to other studied fish of the world. This high concentration in fish skin could
be attributed to more Cr concentration in the water and exposition of the fish to this
metal for long period.
130
Skin of Wallago attu from sites 1 and 2 accumulated highest concentration of
Cd with mean values of 70.0±34.7 µg/g and 82.3±41.6 µg/g and accumulated
26.0±16.3µg/g from site 3, Aorichthys seenghala from polluted sites accumulated
60.7±36.9 µg/g and 77.3±46.9 µg/g and accumulated 47.7±28.3 µg/g from control
site, Labeo dyocheilus from polluted water accumulated 68.0±16.5 µg/g and
85.7±20.3 µg/g and accumulated 22.3±8.9µg/g from control water, Cyprinus carpio
from both sites 1 and 2 accumulated 62.0±20.4 µg/g and 72.7±24.9 µg/g and
accumulated 29.3±17.0 µg/g from site 3 and Ompok bimaculatus from polluted water
accumulated 70.7±37.1 µg/g and 83.3±44.5 µg/g and accumulated 49.3±43.9 µg/g
from reference site respectively. Cadmium concentration in skin of different fish
species was in the order of Labeo dyocheilus>Ompok bimaculatus>Wallago attu >
Aorichthys seenghala>Cyprinus carpio, This revealed that Labeo dyocheilus had
accumulated highest concentration of cadmium and Cyprinus carpio lowest
concentration. By comparing our findings with RDA maximum limits (in 100gm of
the skin) for human consumption, it is cleared that cadmium concentration in skin of
all five inhabitant fish species from both control and polluted sites of River Kabul was
above the RDA propose limits. Which is 14 µg/g/100g for cadmium. Therefore all the
studied fish from River Kabul are not suitable for human consumption. In this study
content of Cd was higher than those reported by Yilmaz (2003). Comparing other
findings with our study indicates that River Kabul has more concentration of Cd as
compare to other mentioned water resources. However, in this study skin of Labeo
dyocheilus had accumulated higher concentration of Cd as compare to the other fish
species.
Skin of Wallago attu from polluted sites showed highest concentration of Pb
with mean values of 669.0±619.0 µg/g and 698.3±581.9 µg/g and lowest mean value
of 79.0±43.6 µg/ from control site, Aorichthys seenghala from polluted sites showed
281.3±355.4 µg/g and 296.0±365.1 µg/g and showed 159.3±57.8 µg/g from site,
Labeo dyocheilus from polluted water showed 378.3±487.5 µg/g and 405.3±517.0
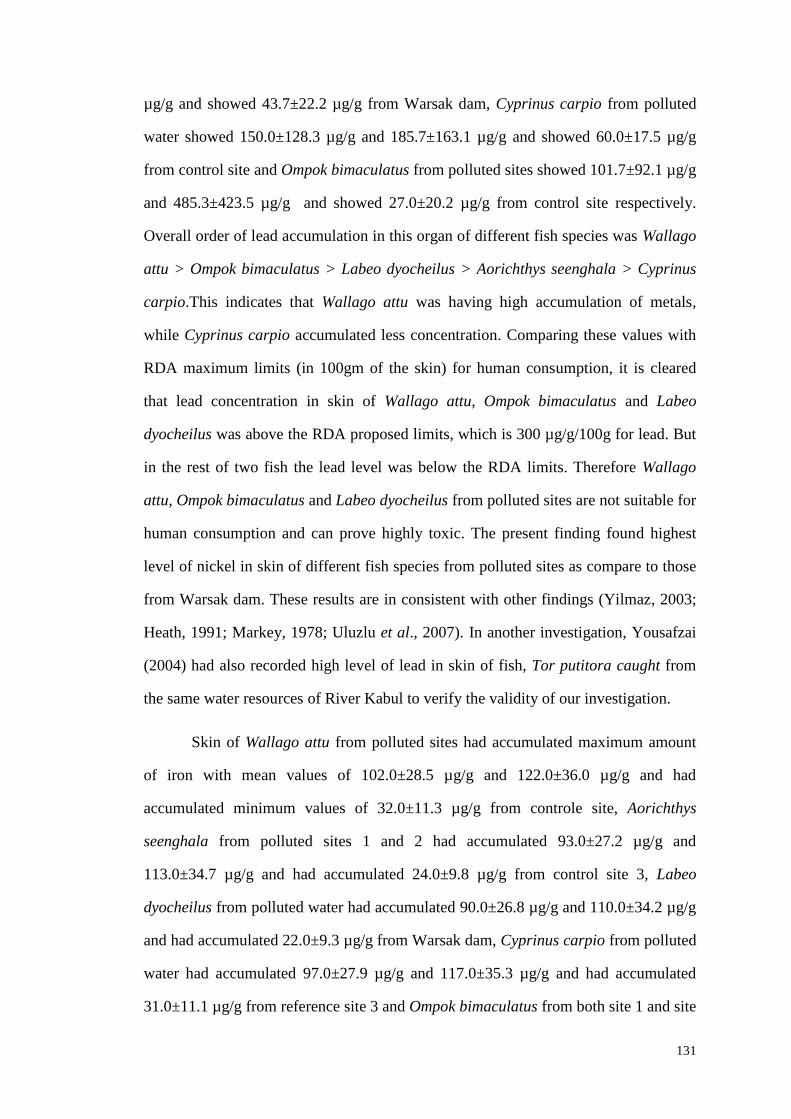
131
µg/g and showed 43.7±22.2 µg/g from Warsak dam, Cyprinus carpio from polluted
water showed 150.0±128.3 µg/g and 185.7±163.1 µg/g and showed 60.0±17.5 µg/g
from control site and Ompok bimaculatus from polluted sites showed 101.7±92.1 µg/g
and 485.3±423.5 µg/g and showed 27.0±20.2 µg/g from control site respectively.
Overall order of lead accumulation in this organ of different fish species was Wallago
attu > Ompok bimaculatus > Labeo dyocheilus > Aorichthys seenghala > Cyprinus
carpio.This indicates that Wallago attu was having high accumulation of metals,
while Cyprinus carpio accumulated less concentration. Comparing these values with
RDA maximum limits (in 100gm of the skin) for human consumption, it is cleared
that lead concentration in skin of Wallago attu, Ompok bimaculatus and Labeo
dyocheilus was above the RDA proposed limits, which is 300 µg/g/100g for lead. But
in the rest of two fish the lead level was below the RDA limits. Therefore Wallago
attu, Ompok bimaculatus and Labeo dyocheilus from polluted sites are not suitable for
human consumption and can prove highly toxic. The present finding found highest
level of nickel in skin of different fish species from polluted sites as compare to those
from Warsak dam. These results are in consistent with other findings (Yilmaz, 2003;
Heath, 1991; Markey, 1978; Uluzlu et al., 2007). In another investigation, Yousafzai
(2004) had also recorded high level of lead in skin of fish, Tor putitora caught from
the same water resources of River Kabul to verify the validity of our investigation.
Skin of Wallago attu from polluted sites had accumulated maximum amount
of iron with mean values of 102.0±28.5 µg/g and 122.0±36.0 µg/g and had
accumulated minimum values of 32.0±11.3 µg/g from controle site, Aorichthys
seenghala from polluted sites 1 and 2 had accumulated 93.0±27.2 µg/g and
113.0±34.7 µg/g and had accumulated 24.0±9.8 µg/g from control site 3, Labeo
dyocheilus from polluted water had accumulated 90.0±26.8 µg/g and 110.0±34.2 µg/g
and had accumulated 22.0±9.3 µg/g from Warsak dam, Cyprinus carpio from polluted
water had accumulated 97.0±27.9 µg/g and 117.0±35.3 µg/g and had accumulated
31.0±11.1 µg/g from reference site 3 and Ompok bimaculatus from both site 1 and site

132
2 had accumulated 95.0±27.5 µg/g and 115.0±35.0 µg/g and had accumulated
27.0±10.3µg/g from control site 3 respectively. These results are in agreement with
the findings of Yilmaz (2003). Iron bioaccumulation in skin of different fish species
was in order of Wallago attu>Cyprinus carpio >Ompok bimaculatus >Aorichthys
seenghala>Labeo dyocheilus.This shows that metal bioaccumulation is highest in
Wallago attu and lowest in Labeo dyocheilus. Comparing these values with RDA
maximum limits (in 100gm of the skin) for human consumption, it is cleared that iron
metal concentration in skin of all five inhabitant fish species was below the RDA
proposed limits, which is 500-2000 µg/g/100g for iron. As compare to other
investigations of the world, the present study found the Fe level high in skin tissue.
By comparison with other studied tissues, the skin also showed maximum
concentration of Fe.
Mn level in skin of Wallago attu from polluted sites were 87.0±26.3 µg/g and
107.0±33.8 µg/g and was 40.0±12.6 µg/g from control site, in Aorichthys seenghala
from polluted sites 1 and 2 were 80.0±25.3 µg/g and 100.0±32.7 µg/g and was
33.0±11.4 µg/g from control site, in Labeo dyocheilus from sites 1 and 2 were
78.0±25.0 µg/g and 98.0±33.6 µg/g and was 31.0±11.1 µg/g from site 3, in Cyprinus
carpio from polluted sites were 85.0±26.0 µg/g and 105.0±33.4 µg/g and was
38.0±12.3 µg/g from reference site and in Ompok bimaculatus from polluted water
were 82.0±25.6 µg/g and 102.0±33.0 µg/g and was 35.0±11.3 µg/g from control water
respectively. Manganese bioaccumulation in this organ of different fish was in the
order of Wallago attu>Cyprinus carpio>Ompok bimaculatus>Aorichthys seenghala
>Labeo dyocheilus. This highlights that manganese content was highest in Wallago
attu and lowest in Labeo dyocheilus. By comparing our result with RDA maximum
limits (100gm of Mn in skin) for human consumption, it is cleared that manganese
metal concentration in skin of all five inhabitant fish species from River Kabul was
below the proposed RDA limits, which is 2500-5000 µg/g/100g for manganese. Mn
of the present study was higher than those reported in skin of other fish species

133
(Yousuf et al., 2000; Mansour and Sidky, 2000). Skin from polluted sites showed
high level of Mn as compare to control site of River Kabul. By comparing the present
study with the above mentioned findings revealed that skin of selected fish in this
study had accumulated high level of this metal than other studied fish of the world.
This is because of direct and constant exposition of this tissue to Mn metal in water at
polluted sites.
Skin of different fish from polluted sites 1 and 2 showed highest level of
mercury as when compared with Warsak dam, where lowest concentration of mercury
was found from control site 3. Hg in skin of Wallago attu from sites 1 and 2 showed
more values of 83.0±25.8 µg/g and 103.0±33.1µg/g and showed less value of
27.0±10.3 µg/g from control site 3, Aorichthys seenghala from both site 1 and site 2
showed 75.0±24.4 µg/g and 95.0±31.8 µg/g and showed 21.0±9.1 µg/g from site 3,
Labeo dyocheilus from polluted sites showed 73.0±24.1 µg/g and 93.0±31.5 µg/g and
showed 18.0±8.4 µg/g from control site, Cyprinus carpio from polluted water showed
80.0±25.3 µg/g and 100.0±32.7 µg/g and showed 25.0±10.0 µg/g from reference site
(Warsak dam) and Ompok bimaculatus from polluted sites showed 78.0±25.0 µg/g
and 98.0±33.6 µg/g and showed 23.0±9.5 µg/g from control site respectively. These
results are agreed with the findings of previous workers (Lazorchak et al., 2003;
Bosnir et al., 2003; Matthew, 1992; Juresa and Blanusa, 2000). Mercury
bioaccumulation in skin of different fish species was in the order of Wallago attu>
Cyprinus carpio>Ompok bimaculatus>Aorichthys seenghala>Labeo dyocheilus. This
indicates that mercury level was highest in skin of Wallago attu and was lowest in
Labeo dyocheilus. Comparing these values with RDA maximum limits (in 100gm of
the skin) for human consumption, it is cleared that mercury metal concentration in
skin of all studied fish from polluted and reference sites was above the RDA proposed
limits, which is 8µg/g/100g for mercury. Therefore these fish are not suitable for
human consumption and proved to be highly toxic.

134
Fish skin is also consumed along with muscles in most of the rural population
of the world, therefore researchers also have an emphasis on just tissues, while
investigating muscle. Inhabitants living around the River Kabul also eat fish skin
along with muscle. Adsorption on the skin surface followed by their absorption in the
skin tissue by various mechanisms favours the accumulation of metals in skin.
Comparing the present concentration of heavy metals in skin of different fish species
with RDA limits showed that heavy metals such as Ni, Cd, Pb and Hg in skin were
above the permissible limits proposed by RDA and the rest of metals were below the
RDA proposed limits. The fish from polluted areas are not suitable for consumption.
Comparing our study with the findings of Yousafzai (2004) revealed that a further
increase of heavy metals in different tissues of selected fish has occurred, which
reflects a further increase in the heavy metal concentration in the water i.e a further
increase of heavy metals pollution in the River Kabul in the last ten years, which is
suggestive for strict implementation of the environmental laws and routine
biomonitoring programme.
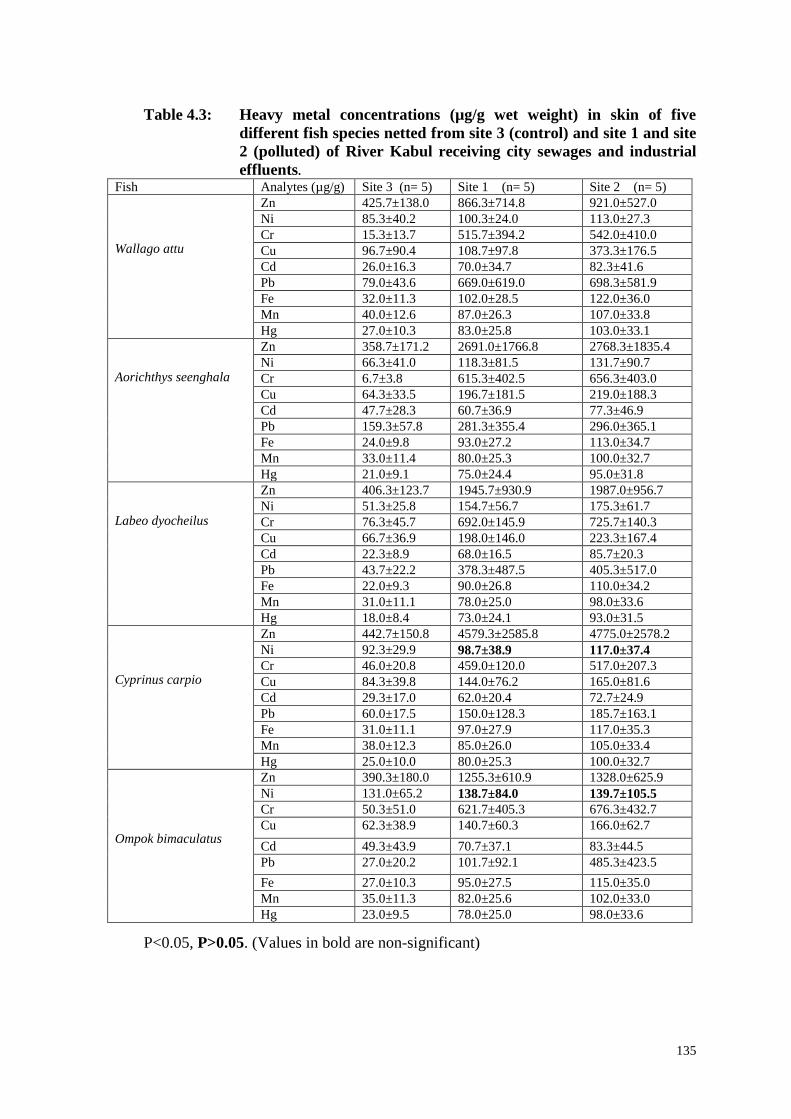
135
Table 4.3: Heavy metal concentrations (µg/g wet weight) in skin of five
different fish species netted from site 3 (control) and site 1 and site
2 (polluted) of River Kabul receiving city sewages and industrial
effluents. Fish Analytes (µg/g) Site 3 (n= 5) Site 1 (n= 5) Site 2 (n= 5)
Wallago attu
Zn 425.7±138.0 866.3±714.8 921.0±527.0
Ni 85.3±40.2 100.3±24.0 113.0±27.3
Cr 15.3±13.7 515.7±394.2 542.0±410.0
Cu 96.7±90.4 108.7±97.8 373.3±176.5
Cd 26.0±16.3 70.0±34.7 82.3±41.6
Pb 79.0±43.6 669.0±619.0 698.3±581.9
Fe 32.0±11.3 102.0±28.5 122.0±36.0
Mn 40.0±12.6 87.0±26.3 107.0±33.8
Hg 27.0±10.3 83.0±25.8 103.0±33.1
Aorichthys seenghala
Zn 358.7±171.2 2691.0±1766.8 2768.3±1835.4
Ni 66.3±41.0 118.3±81.5 131.7±90.7
Cr 6.7±3.8 615.3±402.5 656.3±403.0
Cu 64.3±33.5 196.7±181.5 219.0±188.3
Cd 47.7±28.3 60.7±36.9 77.3±46.9
Pb 159.3±57.8 281.3±355.4 296.0±365.1
Fe 24.0±9.8 93.0±27.2 113.0±34.7
Mn 33.0±11.4 80.0±25.3 100.0±32.7
Hg 21.0±9.1 75.0±24.4 95.0±31.8
Labeo dyocheilus
Zn 406.3±123.7 1945.7±930.9 1987.0±956.7
Ni 51.3±25.8 154.7±56.7 175.3±61.7
Cr 76.3±45.7 692.0±145.9 725.7±140.3
Cu 66.7±36.9 198.0±146.0 223.3±167.4
Cd 22.3±8.9 68.0±16.5 85.7±20.3
Pb 43.7±22.2 378.3±487.5 405.3±517.0
Fe 22.0±9.3 90.0±26.8 110.0±34.2
Mn 31.0±11.1 78.0±25.0 98.0±33.6
Hg 18.0±8.4 73.0±24.1 93.0±31.5
Cyprinus carpio
Zn 442.7±150.8 4579.3±2585.8 4775.0±2578.2
Ni 92.3±29.9 98.7±38.9 117.0±37.4
Cr 46.0±20.8 459.0±120.0 517.0±207.3
Cu 84.3±39.8 144.0±76.2 165.0±81.6
Cd 29.3±17.0 62.0±20.4 72.7±24.9
Pb 60.0±17.5 150.0±128.3 185.7±163.1
Fe 31.0±11.1 97.0±27.9 117.0±35.3
Mn 38.0±12.3 85.0±26.0 105.0±33.4
Hg 25.0±10.0 80.0±25.3 100.0±32.7
Ompok bimaculatus
Zn 390.3±180.0 1255.3±610.9 1328.0±625.9
Ni 131.0±65.2 138.7±84.0 139.7±105.5
Cr 50.3±51.0 621.7±405.3 676.3±432.7
Cu 62.3±38.9 140.7±60.3 166.0±62.7
Cd 49.3±43.9 70.7±37.1 83.3±44.5
Pb 27.0±20.2 101.7±92.1 485.3±423.5
Fe 27.0±10.3 95.0±27.5 115.0±35.0
Mn 35.0±11.3 82.0±25.6 102.0±33.0
Hg 23.0±9.5 78.0±25.0 98.0±33.6
P<0.05, P>0.05. (Values in bold are non-significant)
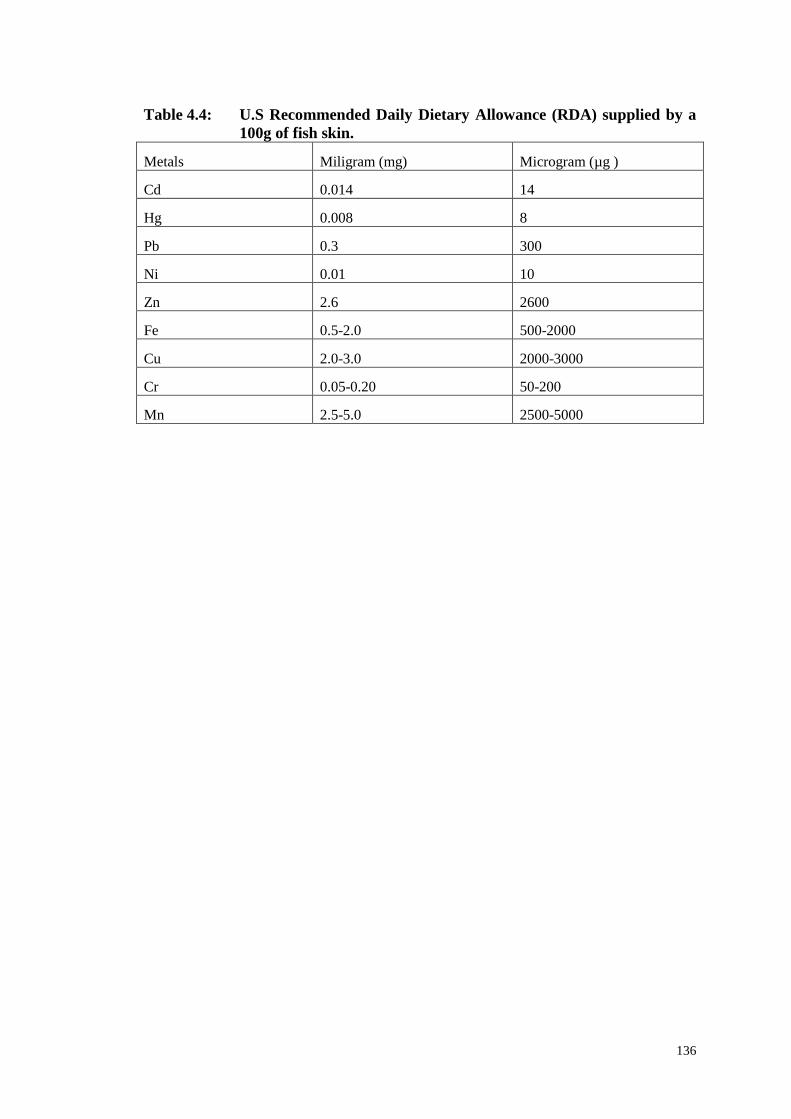
136
Table 4.4: U.S Recommended Daily Dietary Allowance (RDA) supplied by a
100g of fish skin.
Metals Miligram (mg) Microgram (µg )
Cd 0.014 14
Hg 0.008 8
Pb 0.3 300
Ni 0.01 10
Zn 2.6 2600
Fe 0.5-2.0 500-2000
Cu 2.0-3.0 2000-3000
Cr 0.05-0.20 50-200
Mn 2.5-5.0 2500-5000

137
Wallago attu
Aorichthys seenghala
Fig.4.5 Heavy metal concentrations in skin of Wallago attu and Aorichthys
seenghala netted from site 3 (control) and site 1 and site 2
(polluted) of River Kabul receiving city sewages and industrial
effluents.

138
Labeo dyocheilus
Cyprinus carpio
Fig.4.6: Heavy metal concentrations in skin of Labeo dyocheilus and
Cyprinus carpio netted from site 3 (control) and site 1 and site 2
(polluted) of River Kabul receiving city sewages and industrial
effluents.

139
Ompok bimaculatus
Fig. 4.7: Heavy metal concentrations in skin of Ompok bimaculatus netted
from site 3 (control) and site 1 and site 2 (polluted) of River Kabul
receiving city sewages and industrial effluents.
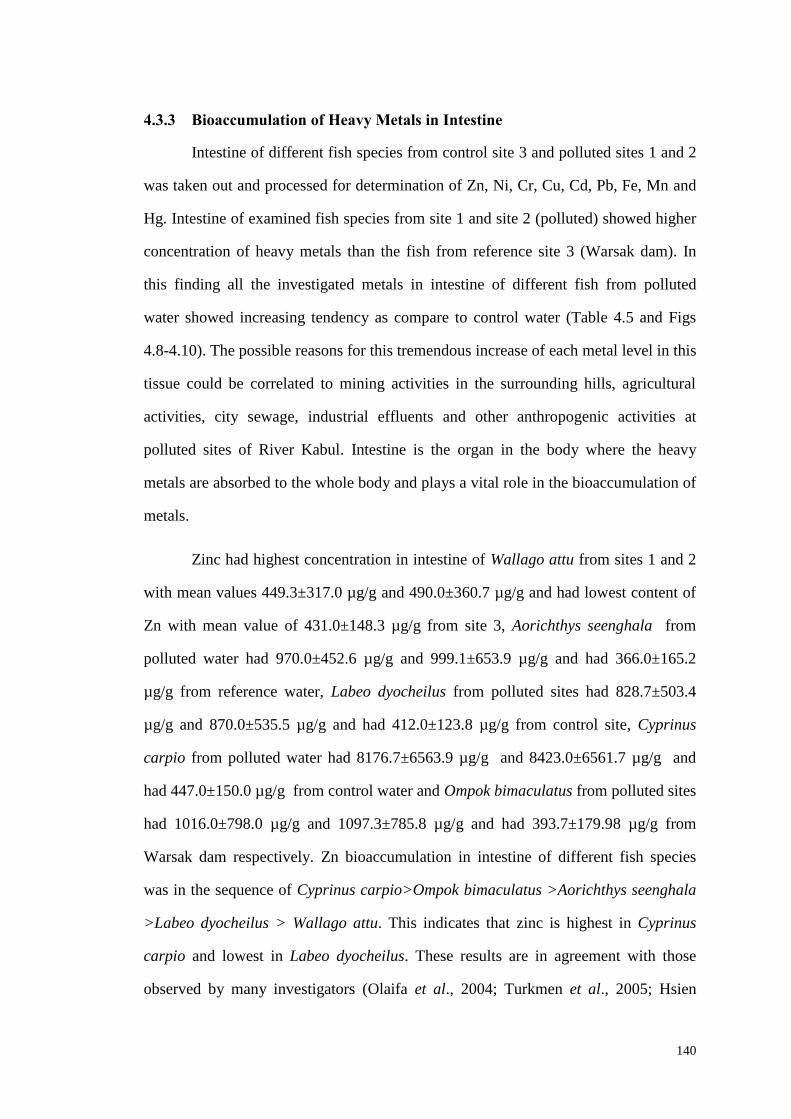
140
4.3.3 Bioaccumulation of Heavy Metals in Intestine
Intestine of different fish species from control site 3 and polluted sites 1 and 2
was taken out and processed for determination of Zn, Ni, Cr, Cu, Cd, Pb, Fe, Mn and
Hg. Intestine of examined fish species from site 1 and site 2 (polluted) showed higher
concentration of heavy metals than the fish from reference site 3 (Warsak dam). In
this finding all the investigated metals in intestine of different fish from polluted
water showed increasing tendency as compare to control water (Table 4.5 and Figs
4.8-4.10). The possible reasons for this tremendous increase of each metal level in this
tissue could be correlated to mining activities in the surrounding hills, agricultural
activities, city sewage, industrial effluents and other anthropogenic activities at
polluted sites of River Kabul. Intestine is the organ in the body where the heavy
metals are absorbed to the whole body and plays a vital role in the bioaccumulation of
metals.
Zinc had highest concentration in intestine of Wallago attu from sites 1 and 2
with mean values 449.3±317.0 µg/g and 490.0±360.7 µg/g and had lowest content of
Zn with mean value of 431.0±148.3 µg/g from site 3, Aorichthys seenghala from
polluted water had 970.0±452.6 µg/g and 999.1±653.9 µg/g and had 366.0±165.2
µg/g from reference water, Labeo dyocheilus from polluted sites had 828.7±503.4
µg/g and 870.0±535.5 µg/g and had 412.0±123.8 µg/g from control site, Cyprinus
carpio from polluted water had 8176.7±6563.9 µg/g and 8423.0±6561.7 µg/g and
had 447.0±150.0 µg/g from control water and Ompok bimaculatus from polluted sites
had 1016.0±798.0 µg/g and 1097.3±785.8 µg/g and had 393.7±179.98 µg/g from
Warsak dam respectively. Zn bioaccumulation in intestine of different fish species
was in the sequence of Cyprinus carpio>Ompok bimaculatus >Aorichthys seenghala
>Labeo dyocheilus > Wallago attu. This indicates that zinc is highest in Cyprinus
carpio and lowest in Labeo dyocheilus. These results are in agreement with those
observed by many investigators (Olaifa et al., 2004; Turkmen et al., 2005; Hsien
141
Chen and Young Chen, 1999). Comparing the above studies with our study showed
enormously high concentration of Zn in our findings and reflecting that River Kabul
has more concentration of Zn as compare to other mentioned water resources. This is
most probably due to mining activities in the upper streches of River Kabul as is also
reported by Yousafzai (2004).
Nickel in intestine of Wallago attu from both polluted sites contained
maximum concentration with mean values of 125.0±82.9 µg/g and 139.3±88.0 µg/g
and contained minimum mean value of 91.3±40.8 µg/g from control site, Aorichthys
seenghala from polluted water contained 127.7±71.4 µg/g and 138.3±72.8 µg/g and
contained 69.7±42.7 µg/g from control water, Labeo dyocheilus from polluted site 1
and site 2 contained 350.7±264.0 µg/g and 404.7±423.1 µg/g and contained 54.7±25.0
µg/g, Cyprinus carpio from polluted sites contained 103.0±28.6 µg/g and 114.3±33.3
µg/g and contained 100.0±40.1 µg/g from control site 3 and Ompok bimaculatus from
both sites 1and 2 contained 122.3±86.2 µg/g and 144.3±90.9 µg/g and contained
136.0±67.9 µg/g from reference site respectively. The mean values of nickel in this
organ of selected studied fish followed the order: Labeo dyocheilus > Ompok
bimaculatus > Wallago attu > Aorichthys seenghala > Cyprinus carpio.This shows
that nickel metal bioaccumulation is highest in intestine of Labeo dyocheilus and
lowest in Cyprinus carpio. The present result of higher Ni content in intestine of
Labeo dyocheilus, Ompok bimaculatus agree with the findings of Thielen et al (2004)
and Ptashynski and Klaverkamp (2002). On the other hand, the present data for
Wallago attu, Aorichthys seenghala and Cyprinus carpio agree with those of
Demirezen and Uruc (2006) and Turkmenet al (2005).
The present study found higher content of Cr in intestine of examined fish
from polluted sites as compare to control site. Cr level was highest in intestine as
compare to other studied tissues including gills, skin, liver and muscle. Intestine of
Wallago attu from polluted sites 1 and 2 accumulated highest concentration of Cr

142
with mean values of 461.3±355.4 µg/g and 471.0±360.7 µg/g and accumulated lowest
concentration with mean value of 18.7±16.4 µg/g from control site 3, Aorichthys
seenghala from sites 1 and 2 accumulated 471.0±427.1 µg/g and 506.0±457.4 µg/g
and accumulated 9.0±4.9 µg/g from control site, Labeo dyocheilus from polluted
water accumulated 849.0±396.0µg/g and 890.0±406.3µg/g and accumulated
81.7±38.2 µg/g from control water, Cyprinus carpio from polluted sites 1 and 2
accumulated 483.7±243.0µg/g and 513.7±245.5 µg/g and accumulated 50.0±23.1
µg/g from reference site and Ompok bimaculatus from polluted sites accumulated
644.7±358.1 µg/g and 701.3±378.0 µg/g and accumulated 54.3±52.0 µg/g from
control site respectively. Cr bioaccumulation in intestine of different fish species was
in the order of Labeo dyocheilus>Ompok bimaculatus>Cyprinus carpio>Wallago
attu>Aorichthys seenghala. This indicates that Cr bioaccumulation is highest in
Labeo dyocheilus and lowest in Aorichthys seenghala. These results are agreed with
the findings of previous workers (Robinoson et al., 2004; Thielen et al., 2004; Olaifa
et al., 2004). However, in the present study intestine of Labeo dyocheilus had
accumulated higher concentration of Cr as compare to the other fish species from
control site.
In this study intestine of Wallago attu from polluted sites had accumulated
maximum concentration of copper with mean values of 89.0±89.4 µg/g and
377.7±274.1 µg/g and had accumulated minimum value of 82.3±83.3 µg/g from
control site, Aorichthys seenghala from polluted sites had accumulated 157.7±99.5
µg/g and 176.0±102.5 µg/g and had accumulated 69.0±37.9 µg/g from control site,
Labeo dyocheilus from both sites 1 and 2 had accumulated 286.3±211.7 µg/g and
314.0±224.5 µg/g and had accumulated 69.7±38.2 µg/g from reference site, Cyprinus
carpio from polluted water had accumulated 115.0±110.7 µg/g and 136.0±125.5 µg/g
and had accumulated 86.7±40.7 µg/g from control water and Ompok bimaculatus
from both site 1 and site 2 had accumulated 160.7±114.2 µg/g and 185.3±134.0 µg/g
and had accumulated 65.3±39.8 µg/g from reference site 3 respectively. Copper
143
bioaccumulation in intestine of different fish species was in the order of Wallago attu
>Labeo dyocheilus>Ompok bimaculatus>Aorichthys seenghala>Cyprinus carpio.
This highlights that metal bioaccumulation is highest in intestine of Wallago attu and
lowest in Cyprinus carpio. High levels of Cu in intestine from polluted portions of
River Kabul being determined in this study are in agreement with many previous
studies of those, who also examined highest accumulation of Cu in intestine of other
fish species (Lundebye et al., 1999; Thielen et al., 2004; Olaifa et al., 2004; Dethloff
et al., 2001). Comparing the above findings with our study is reflecting that River
Kabul has more concentration of Cu as compare to other mentioned water resources
of the remaining world. However the present study found the intestine of Wallago attu
to be accumulated higher concentration of Cu as compare to other fish species from
control water.
Intestine of Wallago attu from polluted sites contained maximum
concentration of cadmium with mean values of 70.0±23.5 µg/g and 82.3±35.0 µg/g
and contained minimum mean value of 29.3±21.4 µg/g from control site 3, Aorichthys
seenghala from polluted sites 1 and 2 contained 67.0±26.9 µg/g and 80.3±37.2 µg/g
and contained 50.3±29.4 µg/g from site 3, Labeo dyocheilus from polluted sites
contained 75.7±24.0 µg/g and 90.7±28.2 µg/g and contained 25.7±10.8µg/g, Cyprinus
carpio from both site 1 and site 2 contained 71.0±25.9 µg/g and 85.0±72.8 µg/g and
contained 31.3±18.1 µg/g from site 3 and Ompok bimaculatus from polluted sites
contained 76.7±41.0 µg/g and 92.0±42.9 µg/g and contained 52.3±45.0 µg/g from
reference site respectively. In intestine of different fish species cadmium
accumulation was in the order of Labeo dyocheilus > Ompok bimaculatus > Cyprinus
carpio >Wallago attu > Aorichthys seenghala.This indicates that Labeo dyocheilus
had accumulated highest concentration of cadmium and Aorichthys seenghala
accumulated lowest concentration. The present study found maximum contents of Cd
in intestine of studied fish from polluted water are supported by various studies
(Thielen et al., 2004; Berntssen et al., 2003; Lundebyee et al., 1999; Fatma and
144
Mohamed, 2008). High concentration of Cd in intestine of Labeo dyocheilus could be
related to greater content of this metal in the water of study area and more exposition
of the fish to this metal for long period. The result also showed metal pollution in the
River Kabul.
Intestine of Wallago attu from polluted sites had highest lead concentration
with mean values of 509.7±386.1 µg/g and 801.7±199.3 µg/g and had lowest mean
value of 82.7±38.4 µg/g from control site (Warsak dam), Aorichthys seenghala from
polluted water had 347.3±340.8 µg/g and 375.3±434.5 µg/g and had 163.7±77.8 µg/g
from control site, Labeo dyocheilus from polluted site 1 and site 2 had 577.3±480.9
µg/g and 625.0±504.0 µg/g and had 46.7±21.7 µg/g from reference site, Cyprinus
carpio from sites 1 and 2 had 1020.7±1321.8 µg/g and 1088.3±1387.4 µg/g and had
63.3±28.8 µg/g from control site 3 and Ompok bimaculatus from polluted sites had
435.0±325.9 µg/g and 480.0±324.5 µg/g and had 29.7±21.5 µg/g from control site
respectively. These results were higher than the finding of Pham et al (2007). Pb is
known to be accumulated in intestine tissue of fish (Latif et al., 1982; Dallas and Day,
1993). The overall order of lead accumulation in this tissue was in the sequence of
Cyprinus carpio>Wallago attu>Labeo dyocheilus>Ompok bimaculatus>Aorichthys
seenghala. Cyprinus carpio showed highest concentration of Pb and Aorichthys
seenghala lowest concentration. In this study intestine of Cyprinus carpio had
accumulated higher concentration of Pb as compare to the other fish species. However
Noordhuis (2002) has also recorded Pb content with mean value of 18.2 ±2.2 (ppm) in
intestine of crayfish. Comparing the present results with other findings revealed that
intestine had accumulated more Pb level as compare to other examined tissues.
Intestine of selected fish species from polluted sites accumulated high level of
Fe as compare to those from control site. Iron level in intestine of Wallago attu from
polluted sites 1 and 2 were 105.0±29.0 µg/g 125.0±36.5 and µg/g and was 35.0±11.8
µg/g from control site, in Aorichthys seenghala from polluted site 1 and site 2 were
145
95.0±27.5 µg/g and 115.0±35.0 µg/g and was 27.0±10,3 µg/g from control site, in
Labeo dyocheilus from sites 1 and 2 were 92.0±27.1 µg/g and 112.0±34.5 µg/g and
was 24.0±9.8 µg/g from site 3, in Cyprinus carpio from polluted water were
101.0±28.4 µg/g and 121.0±35.5 µg/g and was 32.0±11.3 µg/g from control water and
in Ompok bimaculatus from polluted sites were 98.0±63.1 µg/g and 110.0±34.2 µg/g
and was 29.0±10.8µg/g from control site respectively. Overall sequence of Fe
accumulation in this organ of studied fish was Wallago attu>Cyprinus carpio
>Aorichthys seenghala>Labeo dyocheilus>Ompok bimaculatus.Wallago attu showed
highest concentration of Fe and Ompok bimaculatus lowest concentration. This study
observed greater content of Fe than those reported by Fatma and Mohamed (2008)
and Adeniyi et al (2007). Comparing this study with the findings of other workers
revealed that fish can accumulate metals in their tissues. The present result found
more Fe concentration in the intestine as compare to other studied tissues. Intestine
from polluted sites showed more Fe content as compare to those from control site,
where the recorded value for Fe was lowest at control site. The result also showed
heavy metals pollution in the study areas of River Kabul.The high accumulation of
this metal in the intestine may be ralated to the fact that intestine plays an important
role in accumulation and absorption of metals from digested food.
Mn amount in intestine of different fish species from polluted sites was greater
as compare to those from control site. Intestine of Wallago attu from polluted sites
showed highest concentration of manganese with mean values of 91.0±27.0 µg/g and
110.0±34.2 µg/g and showed lowest mean value of 42.0±13.0 µg/g from Warsak
dam, Aorichthys seenghala from polluted sites 1 and 2 showed 83.0±25.8 µg/g and
103.0±72.1 µg/g and showed 35.0±11.8 µg/g from site 3, Labeo dyocheilus from
polluted water showed 80.0±25.3 µg/g and 100.0±32.7 µg/g and showed 32.0±11.3
µg/g from reference water, Cyprinus carpio from sites 1 and 2 showed 88.0±26.5
µg/g and 108.0±33.9 µg/g and showed 40.0±12.6 µg/g from control site and Ompok
bimaculatus from polluted sites showed 86.0±26.2 µg/g and 106.0±33.6 µg/g and

146
showed 37.0±12.1 µg/g from control site. In this study, concentration of Mn was
higher than those reported by Mansour and Sidky (2000) and Rashed (2001), while
lower than those reported by Amal et al (2012). Manganese bioaccumulation in
intestine of studied fish species was in the order of Wallago attu>Cyprinus
carpio>Ompok bimaculatus>Aorichthys seenghala>Labeo dyocheilus. This reveales
that manganese content was highest in Wallago attu and lowest in Labeo dyocheilus.
The present investigation found the intestine from polluted sites accumulated more
Mn as compare to those from control site. The intestine also showed maximum
content of Mn as compare to the above mentioned investigations. The results also
showed further increase of Mn in River Kabul in the last few years.
Intestine of different fish species from polluted sites showed highest level of
mercury as compare with Warsak dam. Intestine of Wallago attu from site 1 and site
2 had more content of mercury with mean values of 83.0±25.8 µg/g and 103.0±33.1
µg/g and had less value of 27.0±10.3 µg/g from control site 3, Aorichthys seenghala
from polluted water had 75.0±24.4 µg/g and 95.0±31.8 µg/g and had 21.0±9.1 µg/g
from site 3, Labeo dyocheilus from polluted sites 1 and 2 had 73.0±24.1 µg/g and
93.0±31.5 µg/g and had 18.0±8.4 µg/g from control site 3, Cyprinus carpio from
polluted sites had 80.0±25.3 µg/g and 100.0±32.7 µg/g and had 25.0±10.0 µg/g from
control site and Ompok bimaculatus from polluted site 1 and site 2 had 78.0±25.0
µg/g and 98.0±33.6 µg/g and had 23.0±9.5 µg/g from control site respectively. This
study found higher content of Hg than those reported by (Juresa and Blanusa, 2000;
Bosnir et al., 2003). Mercury bioaccumulation in this organ of different fish species
was in the sequence of Cyprinus carpio >Aorichthys seenghala >Ompok bimaculatus
>Wallago attu >Labeo dyocheilus. This indicates that mercury level was highest in
intestine of Cyprinus carpio and lowest in Labeo dyocheilus. The level of mercury
was alarmingly high in intestine as compare to other examined tissues. Comparing the
above findings with our study is reflecting that River Kabul has more concentration of
Hg as compare to other mentioned water resources. However the present study found

147
the intestine of Cyprinus carpio to be accumulated higher concentration of Hg as
compare to the other examined fish species.

148
Table 4.5: Heavy metal concentrations (µg/g wet weight) in intestine of five
different fish species netted from site 3 (control) and site 1 and site
2 (polluted) of River Kabul receiving city sewages and industrial
effluents. Fish Analytes (µg/g) Site 3 (n= 5) Site 1 (n= 5) Site 2 (n= 5)
Wallago attu
Zn 431.0±148.3 449.3±317.0 490.0±360.7
Ni 91.3±40.8 125.0±82.9 139.3±88.0
Cr 18.7±16.4 461.3±355.4 471.0±360.7
Cu 82.3±83.3 89.0±89.4 377.7±274.1
Cd 29.3±21.4 70.0±23.5 82.3±35.0
Pb 82.7±38.4 509.7±386.1 801.7±199.3
Fe 35.0±11.8 105.0±29.0 125.0±36.5
Mn 42.0±13.0 91.0±27.0 110.0±34.2
Hg 30.0±10.9 85.0±26.0 97.0±32.1
Aorichthys seenghala
Zn 366.0±165.2 970.0±452.6 999.1±653.9
Ni 69.7±42.7 127.7±71.4 138.3±72.8
Cr 9.0±4.9 471.0±427.1 506.0±457.4
Cu 69.0±37.9 157.7±99.5 176.0±102.5
Cd 50.3±29.4 67.0±26.9 80.3±37.2
Pb 163.7±77.8 347.3±340.8 375.3±434.5
Fe 27.0±10,3 95.0±27.5 115.0±35.0
Mn 35.0±11.8 83.0±25.8 103.0±72.1
Hg 23.0±9.5 78.0±25.0 100.0±32.7
Labeo dyocheilus
Zn 412.0±123.8 828.7±503.4 870.0±535.5
Ni 54.7±25.0 350.7±264.0 404.7±423.1
Cr 81.7±38.2 849.0±396.0 890.0±406.3
Cu 69.7±38.2 286.3±211.7 314.0±224.5
Cd 25.7±10.8 75.7±24.0 90.7±28.2
Pb 46.7±21.7 577.3±480.9 625.0±504.0
Fe 24.0±9.8 92.0±27.1 112.0±34.5
Mn 32.0±11.3 80.0±25.3 100.0±32.7
Hg 20.0±8.9 76.0±24.7 96.0±32,0
Cyprinus carpio
Zn 447.0±150.0 8176.7±6563.9 8423.0±6561.7
Ni 100.0±40.1 103.0±28.6 114.3±33.3
Cr 50.0±23.1 483.7±243.0 513.7±245.5
Cu 86.7±40.7 115.0±110.7 136.0±125.5
Cd 31.3±18.1 71.0±25.9 85.0±72.8
Pb 63.3±28.8 1020.7±1321.8 1088.3±1387.4
Fe 32.0±11.3 101.0±28.4 121.0±35.5
Mn 40.0±12.6 88.0±26.5 108.0±33.9
Hg 27.0±10.3 83.0±25.8 103.0±72.1
Ompok bimaculatus
Zn `393.7±179.8 1016.0±798.0 1097.3±785.8
Ni 136.0±67.9 122.3±86.2 144.3±90.9
Cr 54.3±52.0 644.7±358.1 701.3±378.0
Cu 65.3±39.8 160.7±114.2 185.3±134.0
Cd 52.3±45.0 76.7±41.0 92.0±42.9
Pb 29.7±21.5 435.0±325.9 480.0±324.5
Fe 29.0±10.8 98.0±63.1 110.0±34.2
Mn 37.0±12.1 86.0±26.2 106.0±33.6
Hg 25.0±10.0 80.0±25.3 100.0±32.7
P<0.05, P>0.05. (Values in bold are non-significant)
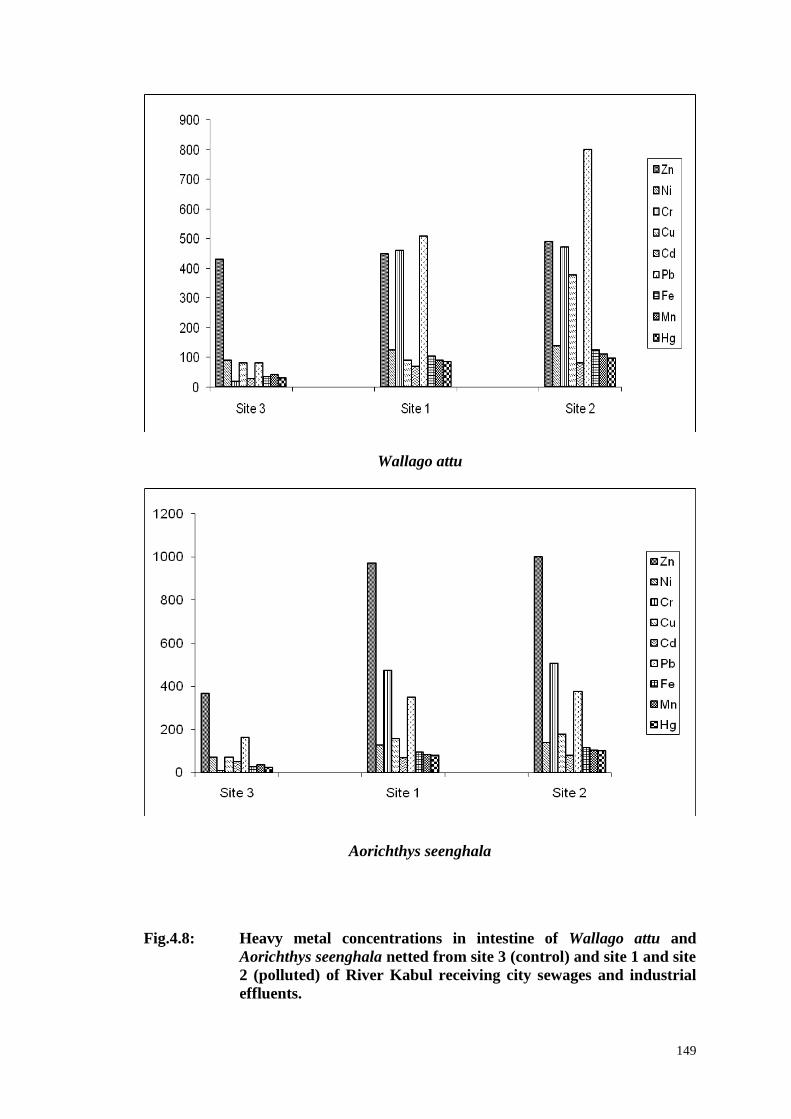
149
Wallago attu
Aorichthys seenghala
Fig.4.8: Heavy metal concentrations in intestine of Wallago attu and
Aorichthys seenghala netted from site 3 (control) and site 1 and site
2 (polluted) of River Kabul receiving city sewages and industrial
effluents.

150
Labeo dyocheilus
Cyprinus carpio
Fig.4.9: Heavy metal concentrations in intestine of Labeo dyocheilus and
Cyprinus carpio netted from site 3 (control) and site 1 and site 2
(polluted) of River Kabul receiving city sewages and industrial
effluents.
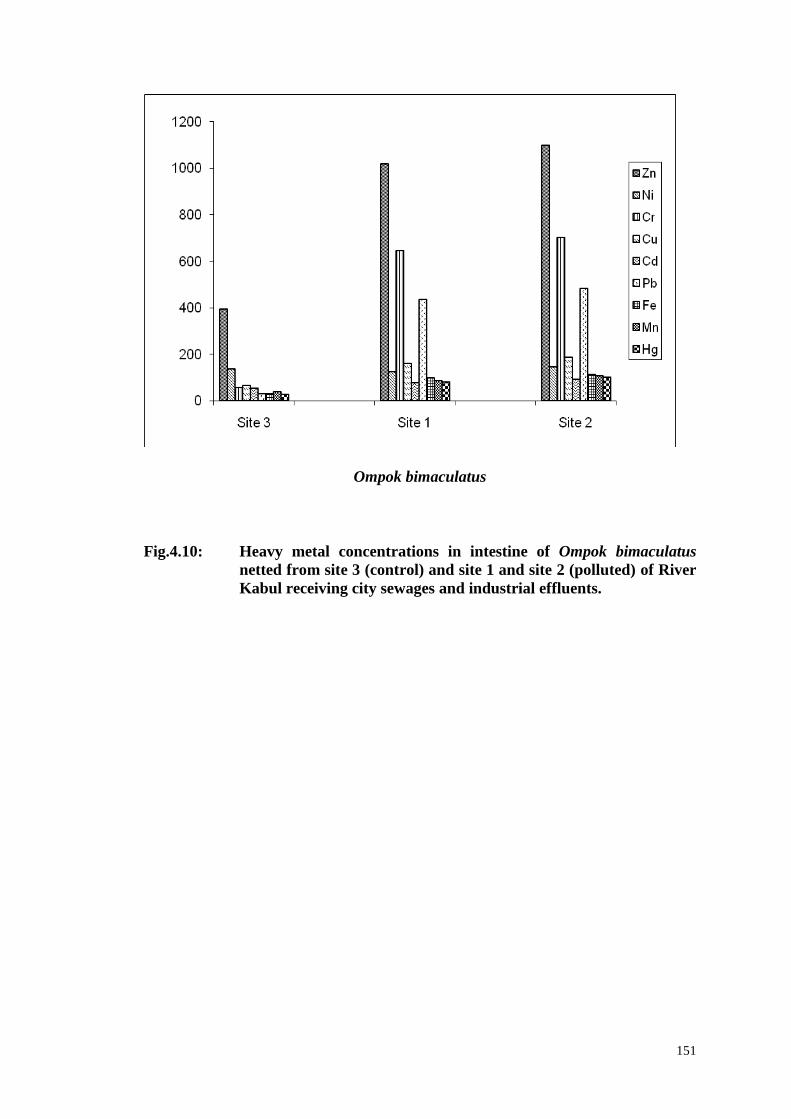
151
Ompok bimaculatus
Fig.4.10: Heavy metal concentrations in intestine of Ompok bimaculatus
netted from site 3 (control) and site 1 and site 2 (polluted) of River
Kabul receiving city sewages and industrial effluents.

152
4.3.4 Bioaccumulation of Heavy Metals in Liver
Liver of five different fish from reference site 3 (Warsak dam) and polluted
sites (sites 1 and 2) was collected and processed for determination of Zn, Ni, Cr, Cu,
Cd, Pb, Fe, Mn and Hg. Liver of fish from site 1 and site 2 accumulated higher
concentrations as compare with fish from site 3 (Table 4.6 and Figs 4.11-4.13). The
present study found the liver to be accumulated less metals than intestine and skin and
accumulated high metals than muscle and gills. Less accumulation of these metals in
liver may be related to the fact that liver plays an important role in detoxification of
metals. Liver in fish play a protective role against metal exposure by acting as a
storage site and being a vital organ in the regulation of metals (Mccarter and Roch,
1983). Liver is considered as one of the major metal bioaccumulation organ (Heath,
1987; Canali and Furness, 1993). It is urged that analysis of the fish liver should has
been done since metals tend to be stored in the liver as a detoxifying mechanism. The
livers would therefore be a better indication of bioaccumulation of heavy metals
(Sharon, 1990).
Liver of different fish from polluted sites showed highest concentration of
heavy metals as compare to those from control site. Liver of Wallago attu from sites
1 and 2 contained highest concentration of Zn with mean values of 485.7±265.2 µg/g
and 521.7±292.4 µg/g and contained lowest mean value of 413.0±145.2 µg/g from
Warsak dam, Aorichthys seenghala from polluted sites 1 and 2 contained 485.3±288.3
µg/g and 2291.7±2789.9 µg/g and contained 355.3±167.3 µg/g from reference site 3,
Labeo dyocheilus from polluted water contained 1096.7±1153.3 µg/g and
1181.7±1252.9 µg/g and contained 402.3±127.2 µg/g from control water, Cyprinus
carpio from polluted sites contained 2733.0±1078.7 µg/g and 3331.0±1509.5 µg/g
and contained 437.0±148.9 µg/g control site and Ompok bimaculatus from polluted
sites contained 765.3±465.7 µg/g and 872.0±516.3 µg/g and contained 387.0±46.6
µg/g from control site. Zn bioaccumulation in liver of different fish species was in the
order of Cyprinus carpio > Aorichthys seenghala > Labeo dyocheilus > Ompok
bimaculatus > Wallago attu. This shows that Cyprinus carpio had accumulated
highest concentration of Zn and Wallago attu lowest concentration. These results are
in agreement with the previous findings as reported by Rules and Osuna (2002) and

153
Mendezet al (2002). Comparing the these data with our study highlights that high
amount of Zn in liver of selected fish reflecting that River Kabul has more
concentration of Zn as compare to other mentioned water resources. In this
investigation liver of Cyprinus carpio had higher concentration of Zn as compare to
other fish species. This is related to omnivorous nature of this fish. Being as an
omnivorous nature, it is more exposed to metal bioaccumulation by many food chains.
Similarly in a past study Yousafzai (2004) has also reported high level of Zn in liver
of fish, Tor putitora caught from the same water resources verifying the validity of
our finding.
Liver of Wallago attu from polluted sites had maximum level of Ni with
mean values of 99.3±54.8 µg/g and 116.7±61.4 µg/g and had minimum value of
79.6±43.1µg/g from control site, Aorichthys seenghala from polluted water had
96.7±52.2 µg/g and 129.7±56.7 µg/g and had 62.6±39.5 µg/g from control site,
Labeo dyocheilus from both sites 1 and 2 had 105.7±68.4 µg/g and 123.7±103.2 µg/g
and had 48.0±25.4 µg/g from control site 3, Cyprinus carpio from polluted water had
77.7±45.3 µg/g and 92.0±52.5 µg/g and had 90.6±35.3 µg/g from control water and
Ompok bimaculatus from polluted water had 90.0±103.7 µg/g and 112.3±124.1 µg/g
and had 127.3±63.9 µg/g from control water (Warsak dam) respectively. Ni
bioaccumulation in liver of different studied fish was in the sequence of Aorichthys
seenghala>Labeo dyocheilus>Wallago attu>Ompok bimaculatus >Cyprinus carpio.
This indicates that Zn content was highest in liver of Aorichthys seenghala and was
lowest in Cyprinus carpio. These results were higher than those reported by
Ptashynski et al (2002) and Yousafzai (2004). In the present study liver of Aorichthys
seenghala had accumulated higher concentration of Ni as compare to other fish
species. This could be attributed to exposition of the fish to this metal for long period.
Cr content in liver of different fish species from polluted sites was greater as
compare to those from control site of River Kabul. Liver of Wallago attu from
polluted sites had maximum content of Cr with mean values of 485.0±408.1 µg/g and
525.0±422.0 µg/g and had minimum value of 12.3±12.4 µg/g from control site,
Aorichthys seenghala from polluted water had 470.3±391.4 µg/g and 621.7±430.5
µg/g and had 4.6±4.3 µg/g from control water, Labeo dyocheilus from both sites 1 and
2 had 597.7±254.1 µg/g and 655.7±272.3 µg/g and had 75.3±37.2 µg/g from site 3,
Cyprinus carpio from polluted sites had 407.3±209.0 µg/g and 505.7±233.4 µg/g and
had 43.6±20.0 µg/g from site 3 and Ompok bimaculatus from polluted sites had

154
602.3±213.8 µg/g and 682.7±495.2 µg/g and had 46.3±49.1 µg/g from control water
of Warsak dam respectively. Cr bioaccumulation in this organ of different fish
species was in the order of Ompok bimaculatus > Labeo dyocheilus > Aorichthys
seenghala > Wallago attu > Cyprinus carpio. This highlights that metal
bioaccumulation was highest in liver of Ompok bimaculatus and lowest in Cyprinus
carpio. These results are in agreement with those observed by many investigators
(Avenant and Marx, 2000; Klaassen, 1976; Gauglhoffer and Bianchi,1991).
Comparing our study with the findings of Yousafzai (2004) and other investigators
highlights that greater level of this metal in liver could be attributed to higher
concentration of Cr in the water of River Kabul and this result also indicates that a
further increase of Cr level has occurred in water of River Kabul in last few years.
This could be correlated to dumping of effluents from Amanghar industries and
sewages from Nowshera city and towns into River Kabul at sites 1 and 2.
Copper concentration in liver of different fish species from polluted sites was
higher as compare to control site. Liver of Wallago attu from polluted sites had
accumulated higher concentration of Cu with mean values of 148.0±50.8 µg/g and
366.0±176.2 µg/g and lower value of 134.7±56.1 µg/g from control site, Aorichthys
seenghala from polluted sites 1 and 2 had accumulated 129.3±48.7 µg/g and
232.7±56.7 µg/g and had accumulated 58.3±30.8 µg/g from control site 3, Labeo
dyocheilus from both sites 1 and 2 had accumulated 165.0±81.6 µg/g and 223.3±167.4
µg/g and had accumulated 63.3±34.5 µg/g from site 3, Cyprinus carpio from polluted
water had accumulated 306.0±118.8 µg/g and 402.0±100.6 µg/g and had accumulated
81.0±41.1 µg/g from control water and Ompok bimaculatus from polluted sites had
accumulated 141.3±135.0 µg/g and 176.0±172.9 µg/g and had accumulated 58.0±46.7
µg/g from Warsak dam respectively. Copper bioaccumulation in gills of selected fish
was in the order of Cyprinus carpio>Wallago attu>Aorichthys seenghala>Ompok
bimaculatus>Labeo dyocheilus. This indicates that metal bioaccumulation is highest
in Cyprinus carpio and lowest in Labeo dyocheilus. As compare to the present
investigation high copper concentrations were also found in some previous studies
(Medina et al., 1986; Kalay et al., 1999; Bhattacharya et al., 2007; Seymour, 1994;
Harris, 2000; Fernandes, 2007). In this study liver of Labeo dyocheilus has
accumulated higher concentration of Cu as compare to other fish species. However,
in a previous study Yousafzai (2004) has also reported high level of Cu in liver of

155
fish, Tor putitora caught from the same water resources to verify the validity of the
present result.
Liver of Wallago attu from polluted sites accumulated maximum
concentration of Cd with mean values of 66.3±30.1 µg/g and 76.3±32.2 µg/g and
accumulated minimum content with mean value of 23.3±17.5 µg/g from site 3,
Aorichthys seenghala from polluted water accumulated 60.7±223.0 µg/g and
76.7±46.1 µg/g and accumulated 44.3±27.7 µg/g from control water, Labeo
dyocheilus from sites 1 and 2 accumulated 73.7±32.2 µg/g and 84.3±38.5 µg/g and
accumulated 20.0±9.0 µg/g from reference site 3, Cyprinus carpio from polluted sites
accumulated 59.3±17.0 µg/g and 70.0±19.3 µg/g and accumulated 28.3±18.4 µg/g
from control site and Ompok bimaculatus from polluted water accumulated
117.7±124.4 µg/g and 150.3±169.7 µg/g and accumulated 58.3±24.8 µg/g from
control water respectively. Cadmium bioaccumulation in liver of these fish species
was in the order of Ompok bimaculatus > Labeo dyocheilus > Aorichthys seenghala
> Wallago attu > Cyprinus carpio. This study found more Cd in liver as compare to
previous findings reported by Mcgeer et al (2000) and Szebedinsky et al (2001). High
concentration of this metal in liver of Ompok bimaculatus may be related to more
concentration of this metal in water of River Kabul.
Wallago attu from polluted sites accumulated highest concentration of Pb with
mean values of 596.3±527.8 µg/g and 635.3±548.8 µg/g and accumulated lowest
content with mean value of 75.6±14.9 µg/g from control site, Aorichthys seenghala
from sites 1 and 2 accumulated 285.3±234.1 µg/g and 585.7±520.0 µg/g and
accumulated 155.6±56.5 µg/g from site 3, Labeo dyocheilus from polluted water
accumulated 353.7±467.1 µg/g and 389.0±495.2 µg/g and accumulated 39.6±21.2
µg/g from control water, Cyprinus carpio from polluted water accumulated
196.7±130 µg/g and 282.3±188.3 µg/g and accumulated 57.0±27.8 µg/g from control
water of Warsak dam and Ompok bimaculatus from polluted sites accumulated
1240.3±1975.8 µg/g and 1402.0±2187.0 µg/g and accumulated 24.3±19.9 µg/g from
156
control site respectively. The order of lead accumulation in liver of different fish
species was Ompok bimaculatus >Wallago attu>Aorichthys seenghala >Labeo
dyocheilus >Cyprinus carpio. The Pb metal accumulation in liver of Ompok
bimaculatus was found to be quite high in comparison with other fish species. In this
study, the concentration of lead in liver of studied fish was higher than those reported
by (Yousafzai, 2004; Canli and Atli, 2003; Rules and Osuna, 2002), while was lower
than those reported earlier (Roesijadi and Robinson, 1994; Thielen et al., 2004).
Comparing our result with the finding of Yousafzai (2004) and other studies indicate
that liver of all the studied fish accumulated a substaincial amount of metals as
compare to the other fish species of the world and the result also showed further
increase of metals pollution in River Kabul in last few years.
Fe level in liver of Wallago attu from polluted sites were 98.0±63.1 µg/g and
118.0±35.4 µg/g and was 30.0±10.9 µg/g from control site, in Aorichthys seenghala
from polluted sites 1 and 2 were 90.0±26.7 µg/g and 110.0±34.2 µg/g and was
22.0±9.3 µg/g from control site 3, in Labeo dyocheilus from polluted water were
87.0±26.3 µg/g and 107.0±33.8 µg/g and was 28.0±8.9 µg/g from control water, in
Cyprinus carpio from sites 1 and 2 were 94.0±27.4 µg/g and 114.0±34.9 µg/g and
was 28.0±10.5 µg/g from site 3 and in Ompok bimaculatus from polluted sites were
91.0±27.0 µg/g and 111.0±34.4 µg/g and was 22.0±9.3 µg/g from control site
respectively. These results agree with the finding of Adeniyi et al (2007). Fe
accumulation in this organ was in the sequence of Wallago attu>Cyprinus carpio
>Aorichthys seenghala>Ompok bimaculatus>Labeo dyocheilus. This reveales that
Wallago attu accumulated higher metal concentration and Labeo dyocheilus lower
concentration. In this study greater concentration of Fe metal was detected in liver as
compare to other organs and the results also showed that a further increase in Fe
concentration in water of River Kabul has occurred due to dumping of industrial
effluents from Amangarh industries and sewages from Nowshera city.

157
In this finding liver of different fish from polluted sites showed high manganes
level as compare to those from control site. Liver of Wallago attu from sites 1 and 2
had more content of Mn with mean values of 4.0±25.9 µg/g and 104.0±33.3 µg/g
and less concentration with mean value of 37.0±12.1 µg/g from site 3, Aorichthys
seenghala from polluted sites had 76.0±24.7 µg/g and 96.0±32.0 µg/g and had
31.0±11.1 µg/g from control site, Labeo dyocheilus from polluted water had
74.0±24.3 µg/g and 94.0±31.7 µg/g and had 29.0±10.8 µg/g from control water,
Cyprinus carpio from polluted site 1 and site 2 had 81.0±25.4 µg/g and 101.0±32.8
µg/g and had 35.0±11.8 µg/g from site 3 and Ompok bimaculatus from polluted sites
had 78.0±25.0 µg/g and 98.0±33.6 µg/g and had 33.0±11.4 µg/g from control site
respectively. Manganese content in the liver of different fish species was in the order
of Wallago attu> Cyprinus carpio >Ompok bimaculatus >Aorichthys seenghala
>Labeo dyocheilus. This highlights that manganese content was highest in the liver of
Wallago attu and was lowest in Labeo dyocheilus. The values of Mn metal found by
Yousuf et al (2000) and Rashed (2001) were lower than the values mentioned in our
results. Comparing our result with the finding of above mentioned researchers
highlights that greater level of Mn in liver of Wallago attu could be correlated to
exposition of this fish to Mn for long period.
Liver of Wallago attu from sites 1 and 2 accumulated Hg with mean values of
80.0±25.3 µg/g and 100.0±32.7 µg/g and accumulated less level with mean value of
25.0±10.0 µg/g from site 3, Aorichthys seenghala from polluted sites accumulated
71.0±23.8 µg/g and 91.0±31.1 µg/g and accumulated 19.0±8.7 µg/g from reference
site 3, Labeo dyocheilus from polluted water accumulated 70.0±23.7 µg/g and
90.0±31.0 µg/g and accumulated 16.0±8.0 µg/g from control site 3, Cyprinus carpio
from polluted site 1 and site 2 accumulated 76.0±24.7 µg/g and 96.0±32.0 µg/g and
accumulated 22.0±9.3 µg/g from control site 3 and Ompok bimaculatus from polluted
sites 1 and 2 accumulated 74.0±24.3 µg/g and 94.0±31.7 µg/g and accumulated
21.0±9.1 µg/g from water of Warsak dam (site 3) respectively. Hg bioaccumulation

158
in liver of different fish species was in the order of Wallago attu>Cyprinus carpio
>Ompok bimaculatus>Aorichthys seenghala>Labeo dyocheilus. This shows that Hg
metal level is highest in liver of Wallago attu and lowest in Labeo dyocheilus. These
results are in accordance with those obtained by Farakas et al (2003), Sephar (1976),
Azmat and Talat (2006), Bocher et al (2003). The present result found more amount
of Hg in liver of exmined fish species than the previous studies (Allen, 1995;
Randolph et al., 2004; Masoud et al., 2007). Comparing our finding to the studies of
other workers highlights that the exmanied fish have accumulated greater content of
heavy metals as compare to the rest fish species of the world. The highest
concentration of metals in different organs of fish could be attributed to more
exposition of fish to heavy metals for long period and high level of metals in the water
and also correlated to herbivorous, carnivorous and omnivorous nature of fish.

159
Table 4.6: Heavy metal concentrations (µg/g wet weight) in liver of five
different fish species netted from site 3 (control) and site 1 and site
2 (polluted) of River Kabul receiving city sewages and industrial
effluents. Fish Analytes (µg/g) Site 3 (n= 5) Site 1 (n= 5) Site 2 (n= 5)
Wallago attu
Zn 413.0±145.2 485.7±265.2 521.7±292.4
Ni 79.6±43.1 99.3±54.8 116.7±61.4
Cr 12.3±12.4 485.0±408.1 525.0±422.0
Cu 134.7±56.1 148.0±50.8 366.0±176.2
Cd 23.3±17.5 66.3±30.1 76.3±32.2
Pb 75.6±14.9 596.3±527.8 635.3±548.8
Fe 30.0±10.9 98.0±63.1 118.0±35.4
Mn 37.0±12.1 84.0±25.9 104.0±33.3
Hg 25.0±10.0 80.0±25.3 100.0±32.7
Aorichthys seenghala
Zn 355.3±167.3 485.3±288.3 2291.7±2789.9
Ni 62.6±39.5 96.7±52.2 129.7±56.7
Cr 4.6±4.3 470.3±391.4 621.7±430.5
Cu 58.3±30.8 129.3±48.7 232.7±56.7
Cd 44.3±27.7 60.7±223.0 76.7±46.1
Pb 155.6±56.5 285.3±234.1 585.7±520.0
Fe 22.0±9.3 90.0±26.7 110.0±34.2
Mn 31.0±11.1 76.0±24.7 96.0±32.0
Hg 19.0±8.7 71.0±23.8 91.0±31.1
Labeo dyocheilus
Zn 402.3±127.2 1096.7±1153.3 1181.7±1252.9
Ni 48.0±25.4 105.7±68.4 123.7±103.2
Cr 75.3±37.2 597.7±254.1 655.7±272.3
Cu 63.3±34.5 165.0±81.6 223.3±167.4
Cd 20.0±9.0 73.7±32.2 84.3±38.5
Pb 39.6±21.2 353.7±467.1 389.0±495.2
Fe 28.0±8.9 87.0±26.3 107.0±33.8
Mn 29.0±10.8 74.0±24.3 94.0±31.7
Hg 16.0±8.0 70.0±23.7 90.0±31.0
Cyprinus carpio
Zn 437.0±148.9 2733.0±1078.7 3331.0±1509.5
Ni 90.6±35.3 77.7±45.3 92.0±52.5
Cr 43.6±20.0 407.3±209.0 505.7±233.4
Cu 81.0±41.1 306.0±118.8 402.0±100.6
Cd 28.3±18.4 59.3±17.0 70.0±19.3
Pb 57.0±27.8 196.7±130 282.3±188.3
Fe 28.0±10.5 94.0±27.4 114.0±34.9
Mn 35.0±11.8 81.0±25.4 101.0±32.8
Hg 22.0±9.3 76.0±24.7 96.0±32.0
Ompok bimaculatus
Zn 387.0±46.6 765.3±465.7 872.0±516.3
Ni 127.3±63.9 90.0±103.7 112.3±124.1
Cr 46.3±49.1 602.3±213.8 682.7±495.2
Cu 58.0±46.7 141.3±135.0 176.0±172.9
Cd 58.3±24.8 117.7±124.4 150.3±169.7
Pb 24.3±19.9 1240.3±1975.8 1402.0±2187.0
Fe 22.0±9.3 91.0±27.0 111.0±34.4
Mn 33.0±11.4 78.0±25.0 98.0±33.6
Hg 21.0±9.1 74.0±24.3 94.0±31.7
P<0.05, P>0.05. (Values in bold are non-significant)

160
Wallago attu
Aorichthys seenghala
Fig.4.11 Heavy metal concentrations in liver of Wallago attu and Aorichthys
seenghala netted from site 3 (control) and site 1 and site 2
(polluted) of River Kabul receiving city sewages and industrial
effluents.

161
Labeo dyocheilus
Cyprinus carpio
Fig.4.12: Heavy metal concentrations in liver of Labeo dyocheilus and
Cyprinus carpio netted from site 3 (control) and site 1 and site 2
(polluted) of River Kabul receiving city sewages and industrial
effluents.

162
Ompok bimaculatus
Fig.4.13 Heavy metal concentrations in liver of Ompok bimaculatus netted
from Warsak dam (Site 3) and two polluted sites (Site 1 and Site 2)
of River Kabul receiving city sewages and industrial effluents.
163
4.3.5 Bioaccumulation of Heavy Metals in Muscle
Muscle of five different fish species from site 3 (control) and polluted sites
(sites 1 and 2) were taken out and processed for concentration of Zn, Ni, Cr, Cu, Cd,
Pb, Fe, Mn and Hg. The muscle of selected fish species from site polluted 1 and site 2
showed highest content of heavy metals as compare with fish from control site 3
(Table 4.7, 4.8 and Figs 4.14-4.16).
From amongst the heavy metals more zinc concentrations were observed in
muscle of Wallago attu from site 1 and site 2 with mean values of 582.3±290.8 µg/g
and 654.0±356.7µg/g, where less value of 393.7±98.7 µg/g observed from reference
site 3, in Aorichthys seenghala from polluted sites were observed 1119.0±738.7 µg/g
and 1174.7±728.3 µg/g and observed 328.7±175.9 µg/g from site 3, in Labeo
dyocheilus from polluted water were observed 735.0±461.3 µg/g and 888.0±495.9
µg/g and observed 384.7±105.2 µg/g from control water, in Cyprinus carpio from
polluted site 1 and site 2 were observed 717.7±394.0 µg/g and 831.3±415.4 µg/g and
observed 381.7±73.6 µg/g from control site 3 and in Ompok bimaculatus from
polluted water were observed 791.3±347.1 µg/g and 907.0±399.1 µg/g and observed
347.7±141.4 µg/g from control water respectively. The present investigation found
more Zn in muscle as reported in the previous studies by (Yilmaz, 2003; Yap et al.,
2005). The sequence of zinc accumulation in muscle of different fish species was
Aorichthys seenghala > Ompok bimaculatus > Labeo dyocheilus > Cyprinus carpio
> Wallago attu. This shows that Zn metal concentration is highest in liver of
Aorichthys seenghala and lowest in Wallago attu. Comparing our data with the RDA
maximum limits (100gm muscle) for human consumption, it is cleared that Zn metal
concentration in muscle of all five studied fish was below the RDA proposed limits,
which is 2600 µg/g/100g for zinc. Comparing the above studies with our finding
reflecting that River Kabul has more concentration of Zn as compare to other
mentioned water resources. However, muscle of Aorichthys seenghala had
accumulated higher concentration of Zn as compare to the rest of fish species.
164
In the present investigation Ni accumulated highly in muscle of different fish
species from polluted sites as compare to those from control site (Warsak dam).
Muscle of Wallago attu from polluted sites accumulated maximum concentration of
nickel with mean values of 91.3±27.7 µg/g and 112.7±37.9 µg/g and accumulated
minimum content with mean value of 69.3±36.2 µg/ from control site, Aorichthys
seenghala from sites 1 and 2 accumulated 76.0±57.3 µg/g and100.3±80.1 µg/g and
accumulated 50.7±37.8 µg/g from control site 3, Labeo dyocheilus from polluted sites
1 and 2 accumulated 100.0±70.1 µg/g and 123.0±82.5 µg/g and accumulated
36.7±16.2µg/g from control site, Cyprinus carpio from polluted water accumulated
67.3±47.0 µg/g and 80.0±52.6 µg/g and accumulated 78.3±31.1 µg/g from control
water (Warsak dam) and Ompok bimaculatus from polluted sites accumulated
107.3±25.8 µg/g and 140.0±49.5 µg/g and accumulated 44.3±141.4 µg/g from
warsak dam respectively. Nickel concentration in examined muscle of different fish
species was in the order of Ompok bimaculatus>Cyprinus carpio> Labeo
dyocheilus> Wallago attu>Aorichthys seenghala. This increased concentration of
nickel in Ompok bimaculatus fish from polluted sites could be attributed to large size
of fish, low metabolic rate and exposition of the fish to this metal for long period and
high concentration of Ni in water. This shows that metal bioaccumulation is highest
in muscle of Ompok bimaculatous and lowest in Aorichthys seenghala. Comparing
our result with RDA maximum limits (100gm of the muscle) for human consumption,
it is cleared that Ni metal concentration in muscle of all five studied fish species was
above the RDA proposed limits, which is 10 µg/g/100g for nickel. Therefore all the
fish from polluted sites of River Kabul are not suitable for human consumption and
can prove highly toxic. This study found more level of Ni as compare to previous
findings (Eric et al., 2004; Palaniappan et al., 2003). Comparing our results with the
finding of Yousafzai (2004) showed increased amount of Ni in our study. This reflects
that pollution in the River Kabul has further increased in the past three years.

165
Muscle of Wallago attu from polluted sites 1 and 2 had highest concentration
of chromium with mean values of 446.0±378.0 µg/g and 539.3±191.3 µg/g and had
lowest concentration with mean value of 8.7±5.4 µg/g from control site 3, Aorichthys
seenghala from polluted water had 498.3±315.2 µg/g and 570.7±326.4 µg/g and had
3.0±2.0 µg/g from control water, Labeo dyocheilus from polluted sites had
518.7±170.9 µg/g and 625.7±246.3 µg/g and had 64.0±44.4 µg/g from control site,
Cyprinus carpio from polluted sites 1 and 2 had 394.7±98.8 µg/g and 494.0±295.9
µg/g and had 14.3±9.6 µg/g from reference site 3 and Ompok bimaculatus from
polluted water had 605.3±139.8µg/g and 708.3±426.8 µg/g and had 33.3±36.8 µg/g
from control water respectively. These results are in agreement with previous studies
(Olaifa et al., 2004; Turkmen et al., 2005; Demirezen and and Uruc, 2006). Cr
bioaccumulation in muscle of these fish was in the sequence of Ompok bimaculatu
>Labeo dyocheilus >Aorichthys seenghala>Wallago attu>Cyprinus carpio.This
indicates that Cr metal bioaccumulation is highest in muscle of Ompok bimaculatus
and lowest in Cyprinus carpio. Comparing our result with RDA maximum limits
(100gm of the muscle) for human consumption, it is cleared that Cr metal
concentration in muscle of all examined fish was above the RDA proposed limits,
which is 50-200 µg/g/100g for Cr. Therefore all the fish from polluted sites of River
Kabul are not suitable for human consumption. Comparing the above studies with our
data reveales that River Kabul has more concentration of Cr as compare to other
mentioned water bodies. However, in this study muscle of Ompok bimaculatus
accumulated higher concentration of Cr as compare to other fish species. This could
be correlated to exposition of the fish to this metal for long period, low detoxification
mechanism and omnivorous nature of this fish. This investigation found higher values
of Cr in the muscle as compare to the finding of Yousafzai (2004).
In this investigation copper content in muscle of different examined fish
species from polluted water was highest as compare to those from control water of
Warsak dam. Copper in muscle of Wallago attu from polluted sites showed higher

166
content with mean values of 52.0±50.1 µg/g and 286.3±97.8 µg/g and showed lower
value of 41.7±40.8 µg/g from control site 3, Aorichthys seenghala from sites 1 and 2
showed 102.0±26.0 µg/g and 136.3±25.8 µg/g and showed 48.7±23.4 µg/g from
reference site, Labeo dyocheilus from both polluted sites 1 and 2 showed 150.0±87.2
µg/g and 196.7±76.7 µg/g and showed 51.7±30.2 µg/g from reference water,
Cyprinus carpio from polluted sites 1 and 2 showed 230.3±189.9 µg/g and
308.0±229.5 µg/g and showed 65.0±27.7 µg/g from site 3 and Ompok bimaculatus
from polluted sites 1 and 2 showed 191.3±161.6 µg/g and 247.7±133.2 µg/g and
showed 50.0±32.1 µg/g from Warsak dam respectively. The sequence of copper
bioaccumulation in different fish species was Cyprinus carpio>Wallago attu>Ompok
bimaculatus>Labeo dyocheilus >Aorichthys seenghala.This reveales that metal
bioaccumulation is highest in Cyprinus carpio and lowest in Aorichthys seenghala.
Comparing these values with RDA maximum limits (100gm of the muscle) for human
consumption, it is cleared that the Cu metal concentration in muscle of all five studied
fish is below the RDA limits, which is 2000-3000 µg/g/100g for copper. It is cleared
that Cu metal concentration in muscle of all the examined fish is below the RDA
proposed limits. This study found more level of Cu than the previous findings
(Yilmaz, 2003; Yap et al., 2005; Marijic and Raspor, 2007; Olaifa et al., 2004).
Comparing the findings of other workers with our data reflecting that River Kabul has
more concentration of Cu as compare to other mentioned water resources. However in
the present study muscle of Cyprinus carpio had accumulated higher concentration of
Cu as compare to other fish species. This could be because of more exposition of the
fish to this metal in water of River Kabul, low metabolic rate and low detoxification
mechanism of this fish.
Muscle of Wallago attu from both polluted sites 1 and 2 accumulated the
highest concentration of cadmium with mean values of 60.3±34.7 µg/g and 74.7±42.4
µg/g and accumulated 5.3±5.1 µg/g from control water, Aorichthys seenghala from
polluted site 1 and site 2 accumulated 49.3±26.9 µg/g and 66.0±30.9 µg/g and
167
accumulated 4.0±2.3 µg/g from site 3, Labeo dyocheilus from polluted sites
accumulated 64.3±27.3 µg/g and 72.3±32.8 µg/g and accumulated 15.0±4.4 µg/g
from reference site 3, Cyprinus carpio from polluted site 1 and site 2 accumulated
46.7±16.5 µg/g and 59.0±17.7 µg/g and accumulated 20.3±12.7 µg/g from reference
site 3 and Ompok bimaculatus from polluted sites accumulated 58.0±15.2 µg/g and
70.3±24.2 µg/g and accumulated 49.0±46.9 µg/g from Warsak dam respectively. In
muscle of different fish species cadmium accumulation was in the order of Wallago
attu > Labeo dyocheilus > Ompok bimaculatus > Aorichthys seenghala > Cyprinus
carpio. This indicates that Wallago attu had accumulated highest concentration of
cadmium and Cyprinus carpio lowest concentration. Comparing these values with
RDA maximum limits (100gm of the muscle) for human consumption, the Cd metal
concentration in muscle of selected fish was above the RDA proposed limits, which
is 14 µg/g/100g for Cd. it is cleared that Cd concentration in the muscle of all
examined fish from polluted sites is above the RDA proposed limits. Therefore all
the fish from polluted sites of River Kabul are not suitable for human consumption
and are highly toxic. This study found maximum level of Cd as compare to the
findings of Turkmen et al (2005) and Yap et al (2005). Comparing these mentioned
findings with our result showed higher concentration of Cd in fish samples and
reflects that River Kabul has more concentration of Cd as compare to other mentioned
water bodies. In this investigation cadmium concentration in the muscle like other
metals increased in both the fish samples from polluted water as compare to those
from control water.
The present investigation found the muscle of examined fish species from
polluted sites to be accumulated higher level of lead as compare to those from control
site. Muscle of Wallago attu from polluted sites had highest concentration with mean
values of 509.7±386.1 µg/g and 605.0±440.7 µg/g and had 61.0±34.1 µg/g from
control site, Aorichthys seenghala from site 1 and site 2 had 296.0±305.1 µg/g and
355.7±368.6 µg/g and had 138.3±48.5 µg/g from reference site 3, Labeo dyocheilus
168
from polluted water had 454.7±395.8 µg/g and 534.0±461.5 µg/g and had 13.3±10.3
µg/g from control water, Cyprinus carpio from sites 1 and 2 had 184.7±246.6 µg/g
and 231.3±307.6 µg/g and had 49.0±23.0 µg/g from water of Warsak dam and Ompok
bimaculatus from polluted sites had 353.3±266 µg/g and 412.3±321.7 µg/g and had
17.3±15.3 µg/g from control site respectively. Overall order of lead accumulation in
muscle of different fish species was Wallago attu > Labeo dyocheilus > Ompok
bimaculatus > Aorichthys seenghala > Cyprinus carpio. Wallago attu showed greater
level of Pb and Cyprinus carpio showed smaller level. Comparing these values with
RDA maximum limits (100gm of the muscle) for human consumption, the Pb metal
concentration in muscle of three selected studied fish was above the RDA proposed
limits except Cyprinus carpio and Aorichthys seenghala, where in these two fish the
values for Pb were below the RDA limits. The RDA limit is 300 µg/g/100g for Pb.
Therefore three fish from polluted sites of River Kabul are not suitable for human
consumption and proved to be highly toxic. The previous studies also reported high
concentration of Pb in muscle of other fish species (Rules and Osuna, 2002; Yilmaz,
2003; Huang et al., 2006; Beveridge et al., 1985; Honda et al., 1983). Comparing the
above mentioned findings with the present result revealed that all the fish showed a
substantial amount of Pb and the result also showed further increasing of Pb
concentration in the water of River Kabul.
Muscle of different fish species from polluted sites accumulated high level of
Fe as compare to those from reference site. Muscle of Wallago attu from sites 1 and 2
showed higher level of iron with mean values of 91.0±27.0 µg/g and 111.0±34.4 µg/g
and showed lower level with mean value of 25.0±10.0 µg/g from site 3, Aorichthys
seenghala from site 1 and site 2 showed 84.0±25.9 µg/g and 104.0±33.3 µg/g and
showed 18.0±6.4 µg/g from site 3, Labeo dyocheilus from polluted sites showed
81.0±25.4 µg/g and 93.0±31.5 µg/g and showed 16.0±8.0 µg/g from control site 3,
Cyprinus carpio from polluted sites showed 86.0±26.2 µg/g and 98.0±30.8 µg/g and
showed 23.0±8.9 µg/g from water of Warsak dam (control) and Ompok bimaculatus

169
from both site 1 and site 2 showed 81.0±25.4 µg/g and 98.0±30.1 µg/g and showed
20.0±8.9 µg/g from site 3 respectively. The sequence of Fe accumulation in muscle of
different fish species was Wallago attu > Aorichthys seenghala > Cyprinus carpio >
Ompok bimaculatus>Labeo dyocheilus. This shows that Wallago attu contained
highest concentration of Fe and Ompok bimaculatus lowest concentration. Comparing
these values with RDA maximum limits (100gm of the muscle) for human
consumption, the Fe metal concentration in muscle of studied fish was below the
RDA limits, which is 500-2000 µg/g/100g for iron. Other workers (Carvalho et al.,
2005; Olayan and Thomas, 2005) have also found relatively higher Fe content in
muscle of different fish species. The present result found more Fe concentration in
muscle tissues of examined fish species as compare to control fish from Warsak dam.
Therefore this finding suggests that the Fe is considered as a good indicator of
environmental pollution.
Muscle of Wallago attu from polluted sites contained highest concentration of
manganese with mean values of 77.0±24.8 µg/g and 97.0±32.1 µg/g and contained
lowest concentration of 31.0±11.0 µg/g from control site, Aorichthys seenghala from
polluted sites 1 and 2 contained 69.0±21.4 µg/g and 89.0±30.8 µg/g and contained
24.0±9.8 µg/g from site 3, Labeo dyocheilus from both site 1 and site 2 contained
66.0±23.0 µg/g and 86.0±30.2 µg/g and contained 24.0±9.8 µg/g from site 3,
Cyprinus carpio from polluted water contained 70.0±23.7 µg/g and 87.0±30.4 µg/g
and contained 28.0±10.5 µg/g from control water and Ompok bimaculatus from
polluted sites contained 67.0±23.1 µg/g and 85.0±30.1 µg/g and 28.0±10.5 µg/g from
control site 3 respectively. These results are agreed to the findings of Yousuf et al
(2000). Mn bioaccumulation in muscle of different fish species was in the order of
Wallago attu> Aorichthys seenghala >Cyprinus carpio > Labeo dyocheilus > Ompok
bimaculatus. This highlights that manganese content was highest in muscle of
Wallago attu and lowest in Ompok bimaculatus. Comparing these values with RDA
maximum limits (100gm of the muscle) for human consumption, the Mn metal

170
concentration in muscle of studied fish was below the RDA limits, which is 2500-
5000 µg/g/100g for Mn. Comparing the present result with the findings of above
mentioned studies revealed that in the last few years a further increase of Mn
concentration has occurred in the River Kabul. Therefore muscle from polluted sites
showed greater amount of Mn content as compare to Warsak dam.
Muscle of different fish species from polluted sites showed highest level of
mercury as compare to Warsak dam, where lowest concentration of mercury was
found from control site 3. Muscle of Wallago attu from polluted sites had higher
concentration of mercury with mean values of 74.0±24.3 µg/g and 94.0±31.7 µg/g
and had 20.0±8.9 µg/g from control water, Aorichthys seenghala from sites 1 and 2
had 63.0±22.4 µg/g and 83.0±29.7 µg/g and had 15.0±7.7 µg/g from site 3, Labeo
dyocheilus from site 1 and site 2 had 63.0±22.4 µg/g and 83.0±29.7 µg/g and had
13.0±8.9 µg/g from control site 3, Cyprinus carpio from both polluted sites had
67.0±23.1 µg/g and 85.0±30.1 µg/g and had 6.0±8.0 µg/g from control site and
Ompok bimaculatus from site 1 and site 2 had 65.0±22.8 µg/g and 81.0±29.3 µg/g and
had 16.0±8.9 µg/g from reference site 3 respectively. Mercury bioaccumulation in the
muscle of different fish species was in the order of Wallago attu>Cyprinus carpio >
Labeo dyocheilus > Aorichthys seenghala >Ompok bimaculatus. This indicates that
mercury level was highest in muscle of Wallago attu and lowest in Ompok
bimaculatus. This increased concentration of mercury in muscle tissue of Wallago
attu fish from polluted sites could be correlated to low metabolic rate, exposition of
the fish to metals for long period, low elimination of metal from body and high
concentration of metal in the water. Comparing these values with the RDA maximum
limits (100gm of the muscle) for human consumption, it is cleared that Hg metal
concentration in muscle of all studied fish was above the RDA limits, which is 8
µg/g/100g for Hg. Therefore all the fish from polluted sites of River Kabul are not
suitable for human consumption and are highly toxic. The present results are also in
agreement with the findings of previous investigations (Matthew, 1992; Masoud et

171
al., 2007; Allen, 1995). In the present finding muscle was found to be contained less
concentration of all the studied metals and came last in number for metals
accumulation. Muscle is the tissue that is not exposed directly to water pollution as
compare to gills and skin, where these tissues are constantly and directly exposed to
water pollution. Therefore the muscle showed less content of metals as compare to
other studied tissues. Fish muscle is consumed in most of the rural population of the
world; therefore researchers have an emphasis on just tissues. Inhabitants living
around the River Kabul eat fish muscle. Absorption in muscle tissue and various
mechanisms favours accumulation of metals in muscle. Comparing the present
concentration of heavy metals in muscle of different fish species with RDA limits
shows that heavy metals such as Ni, Cd, Pb and Hg were above the permissible limits
proposed by RDA and rest of the metals are below the RDA limits. The fish from
polluted areas are not suitable for consumption. Comparing our study with the finding
of Yousafzai (2004) revealed that a further increase of heavy metals in different
tissues have occurred, which reflects a further increase of heavy metal concentration
in the water i.e a further increase of heavy metals pollution in River Kabul in last
three years.

172
Table 4.7: Heavy metal concentrations (µg/g wet weight) in muscle of five
different fish species netted from site 3 (control) and site 1 and site
2 (polluted) of River Kabul receiving city sewages and industrial
effluents. Fish Analytes (µg/g) Site 3 (n= 5) Site 1 (n= 5) Site 2 (n= 5)
Wallago attu
Zn 393.7±98.7 582.3±290.8 654.0±356.7
Ni 69.3±36.2 91.3±27.7 112.7±37.9
Cr 8.7±5.4 446.0±378.0 539.3±191.3
Cu 41.7±40.8 52.0±50.1 286.3±97.8
Cd 5.3±5.1 60.3±34.7 74.7±42.4
Pb 61.0±34.1 509.7±386.1 605.0±440.7
Fe 25.0±10.0 91.0±27.0 111.0±34.4
Mn 31.0±11.0 77.0±24.8 97.0±32.1
Hg 20.0±8.9 74.0±24.3 94.0±31.7
Aorichthys seenghala
Zn 328.7±175.9 1119.0±738.7 1174.7±728.3
Ni 50.7±37.8 76.0±57.3 100.3±80.1
Cr 3.0±2.0 498.3±315.2 570.7±326.4
Cu 48.7±23.4 102.0±26.0 136.3±25.8
Cd 4.0±2.3 49.3±26.9 66.0±30.9
Pb 138.3±48.5 296.0±305.1 355.7±368.6
Fe 18.0±6.4 84.0±25.9 104.0±33.3
Mn 24.0±9.8 69.0±21.4 89.0±30.8
Hg 15.0±7.7 63.0±22.4 83.0±29.7
Labeo dyocheilus
Zn 384.7±105.2 735.0±461.3 888.0±495.9
Ni 36.7±16.2 100.0±70.1 123.0±82.5
Cr 64.0±44.4 518.7±170.9 625.7±246.3
Cu 51.7±30.2 150.0±87.2 196.7±76.7
Cd 15.0±4.4 64.3±27.3 72.3±32.8
Pb 13.3±10.3 454.7±395.8 534.0±461.5
Fe 16.0±8.0 81.0±25.4 93.0±31.5
Mn 24.0±9.8 66.0±23.0 86.0±30.2
Hg 13.0±8.9 63.0±22.4 83.0±29.7
Cyprinus carpio
Zn 381.7±73.6 717.7±394.0 831.3±415.4
Ni 78.3±31.1 67.3±47.0 80.0±52.6
Cr 14.3±9.6 394.7±98.8 494.0±295.9
Cu 65.0±27.7 230.3±189.9 308.0±229.5
Cd 20.3±12.7 46.7±16.5 59.0±17.7
Pb 49.0±23.0 184.7±246.6 231.3±307.6
Fe 23.0±8.9 86.0±26.2 98.0±30.8
Mn 28.0±10.5 70.0±23.7 87.0±30.4
Hg 16.0±8.0 67.0±23.1 85.0±30.1
Ompok bimaculatus
Zn 347.7±141.4 791.3±347.1 907.0±399.1
Ni 44.3±141.4 107.3±25.8 140.0±49.5
Cr 33.3±36.8 605.3±139.8 708.3±426.8
Cu 50.0±32.1 191.3±161.6 247.7±133.2
Cd 49.0±46.9 58.0±15.2 70.3±24.2
Pb 17.3±15.3 353.3±26.6 412.3±321.7
Fe 20.0±8.9 81.0±25.4 98.0±30.1
Mn 28.0±10.5 67.0±23.1 85.0±30.1
Hg 16.0±8.9 65.0±22.8 81.0±29.3
P<0.05, P>0.05. (Values in bold are non-significant)

173
Table 4.8: U.S Recommended Daily Diatary Allowance (RDA) supplied by a
100g of fish muscle.
Metals Miligram (mg) Microgram (µg )
Cd 0.014 14
Hg 0.008 8
Pb 0.3 300
Ni 0.01 10
Zn 2.6 2600
Fe 0.5-2.0 500-2000
Cu 2.0-3.0 2000-3000
Cr 0.05-0.20 50-200
Mn 2.5-5.0 2500-5000

174
Wallago attu
Aorichthys seenghala
Fig.4.14 Heavy metal concentrations in muscle of Wallago attu and
Aorichthys seenghala netted from site 3 (control) and site 1 and site
2 (polluted) of River Kabul receiving city sewages and industrial
effluents.

175
Labeo dyocheilus
Cyprinus carpio
Fig.4.15: Heavy metal concentrations in muscle of Labeo dyocheilus and
Cyprinus carpio netted from site 3 (control) and site 1 and site 2
(polluted) of River Kabul receiving city sewages and industrial
effluents.

176
Ompok bimaculatus
Fig.4.16: Heavy metal concentrations in muscle of Ompok bimaculatus
netted from site 3 (control) and site 1 and site 2 (polluted) of River
Kabul receiving city sewages and industrial effluents.

177
4.3.6 Sequences of Metals Bioaccumulation
The present investigation shows that all the tissues of fish accumulated a
substantial amount of heavy metals. Among various tissues and fish from polluted
sites different patterns of metal bioaccumulation are present. However, Zn is the
highly accumulated metals, while Cd is the least one.
Zinc bioaccumulation in gills of different fish species was in the order of
Ompok bimaculatus>Labeo dyocheilus>Cyprinus carpio>Aorichthys seenghala>
Wallago attu, in skin was Cyprinus carpio>Aorichthys seenghala>Labeo dyocheilus
>Ompok bimaculatus>Wallago attu, in intestine was Cyprinus carpio>Ompok
bimaculatus > Aorichthys seenghala > Labeo dyocheilus>Wallago attu, in liver was
Cyprinus carpio>Aorichthys seenghala>Labeo dyocheilus>Ompok bimaculatus
>Wallago attu in muscle was Aorichthys seenghala>Ompok bimaculatus>Labeo
dyocheilus>Cyprinus carpio>Wallago attu. Overall order of zinc concentration in
different tissues was intestine > skin > gills > liver > muscle and overall order of zinc
in different fish species was Cyprinus carpio>Aorichthys seenghala>Ompok
bimaculatus >Labeo dyocheilus>Wallago attu.
Nickel concentration in gills of different fish species was in the sequence of
Ompok bimaculatus>Labeo dyocheilus>Wallago attu>Aorichthys seenghala>
Cyprinus carpio, in skin was Labeo dyocheilus>Ompok bimaculatus>Aorichthys
seenghala>Cyprinus carpio>Wallago attu, in intestine was Labeo
dyocheilus>Ompok bimaculatus>Wallago attu>Aorichthys seenghala>Cyprinus
carpio, in liver was Aorichthys seenghala>Labeo dyocheilus>Wallago attu>Ompok
bimaculatus>Cyprinus carpio and in muscle was Ompok bimaculatus>Cyprinus
carpio>Labeo dyocheilus>Wallago attu>Aorichthys seenghala. Overall sequence of
nickel concentration in different tissues was intestine > gills > skin > muscle > liver
and overall order in different fish species was Labeo dyocheilus>Ompok
bimaculatus> Aorichthys seenghala>Wallago attu>Cyprinus carpio.

178
Chromium bioaccumulation in gills of different fish species was in the order
of Ompok bimaculatus>Labeo dyocheilus>Aorichthys seenghala>Wallago attu>
Cyprinus carpio, in skin was Aorichthys seenghala>Labeo dyocheilus>Ompok
bimaculatus>Wallago attu>Cyprinus carpio, in intestine was Labeo dyocheilus>
Ompok bimaculatus>Cyprinus carpio>Aorichthys seenghala>Wallago attu, in liver
was Ompok bimaculatus>Labeo dyocheilus>Aorichthys seenghala>Wallago attu>
Cyprinus carpio and in muscle was Ompok bimaculatus>Labeo dyocheilus>
Aorichthys seenghala>Wallago attu>Cyprinus carpio. Overall order of chromium
concentration in different tissues was gills > skin > intestine > liver > muscle and
overall order in different fish species was Labeo dyocheilus>Ompok bimaculatus>
Aorichthys seenghala>Wallago attu>Cyprinus carpio.
Copper bioaccumulation in gills of different fish species was in the sequence
of Wallago attu>Aorichthys seenghala>Ompok bimaculatus>Ompok bimaculatus>
Labeo dyocheilus>Cyprinus carpio, in skin was Wallago attu > Labeo dyocheilus >
Aorichthys seenghala>Ompok bimaculatus>Cyprinus carpio, in intestine was
Wallago attu>Labeo dyocheilus>Ompok bimaculatus>Aorichthys seenghala>
Cyprinus carpio, in liver was Cyprinus carpio>Wallago attu>Aorichthys seenghala>
Ompok bimaculatus>Labeo dyocheilus and in muscle was Cyprinus carpio>Wallago
attu>Ompok bimaculatus>Labeo dyocheilus>Aorichthys seenghala. Overall
sequence of copper concentration in different tissues was liver > intestine > muscle >
skin >gills and overall order in different fish species was Wallago attu > Cyprinus
carpio > Labeo dyocheilus > Aorichthys seenghala > Ompok bimaculatus.
Cadmium bioaccumulation in gills of different fish species was in the order of
Ompok bimaculatus>Labeo dyocheilus>Wallago attu>Cyprinus carpio>Aorichthys
seenghala, in skin was Labeo dyocheilus>Ompok bimaculatus>Wallago attu>
Aorichthys seenghala>Cyprinus carpio, in intestine was Labeo dyocheilus>Ompok
bimaculatus>Cyprinus carpio>Wallago attu>Aorichthys seenghala, in liver was
179
Ompok bimaculatus>Labeo dyocheilus>Aorichthys seenghala>Wallago attu>
Cyprinus carpio and in muscle was Wallago attu>Labeo dyocheilus>Ompok
bimaculatus>Aorichthys seenghala>Cyprinus carpio. Overall order of cadmium
concentration in different tissues was liver > intestine > skin > gills > muscle and
overall order in different fish species was Ompok bimaculatus > Labeo dyocheilus >
Wallago attu > Aorichthys seenghala > Cyprinus carpio.
Lead bioaccumulation in gills of different fish species was in the order of
Wallago attu>Aorichthys seenghala>Ompok bimaculatus>Labeo dyocheilus>
Cyprinus carpio, in skin was Wallago attu>Ompok bimaculatus>Labeo dyocheilus>
Aorichthys seenghala>Cyprinus carpio, in intestine was Cyprinus carpio>Wallago
attu>Labeo dyocheilus>Ompok bimaculatus>Aorichthys seenghala, in liver was
Ompok bimaculatus>Wallago attu>Aorichthys seenghala>Labeo dyocheilus>
Cyprinus carpio and in muscle was Wallago attu>Labeo dyocheilus>Ompok
bimaculatus>Aorichthys seenghala>Cyprinus carpio. Overall order of lead
concentration in different tissues was intestine > liver > muscle > skin > gills and
overall order of lead in different fish species was Wallago attu > Ompok bimaculatus
> Labeo dyocheilus > Aorichthys seenghala > Cyprinus carpio.
Iron bioaccumulation in gills of different fish species was in the sequence of
Wallago attu>Cyprinus carpio>Ompok bimaculatus>Aorichthys seenghala>Labeo
dyocheilus, in skin was Wallago attu>Cyprinus carpio>Ompok bimaculatus>
Aorichthys seenghala>Labeo dyocheilus, in intestine was Wallago attu>Cyprinus
carpio>Aorichthys seenghala>Labeo dyocheilus>Ompok bimaculatus, in liver was
Wallago attu>Cyprinus carpio>Aorichthys seenghala>Ompok bimaculatus>Labeo
dyocheilus and in muscle was in the sequence of Wallago attu>Aorichthys seenghala
>Cyprinus carpio>Ompok bimaculatus>Labeo dyocheilus. Overall sequence of iron
concentration in different tissues was intestine > skin > liver > gills > muscle and

180
overall order of iron in different fish species was Wallago attu > Cyprinus carpio >
Aorichthys seenghala > Ompok bimaculatus > Labeo dyocheilus.
Manganese bioaccumulation in gills of different fish species was in the order
of Wallago attu>Cyprinus carpio>Aorichthys seenghala>Ompok bimaculatus>
Labeo dyocheilus, in skin was Wallago attu>Cyprinus carpio>Ompok bimaculatus>
Aorichthys seenghala>Labeo dyocheilus, in intestine was Wallago attu>Cyprinus
carpio>Ompok bimaculatus>Aorichthys seenghala>Labeo dyocheilus, in liver was
Wallago attu>Cyprinus carpio>Ompok bimaculatus>Aorichthys seenghala>Labeo
dyocheilus and in muscle was Wallago attu>Aorichthys seenghala>Cyprinus carpio
>Labeo dyocheilus>Ompok bimaculatus. Overall order of manganese concentration
in different tissues was intestine > skin > gills > liver > muscle and overall order in
different fish species was Cyprinus carpio > Aorichthys seenghala > Ompok
bimaculatus > Labeo dyocheilus > Wallago attu.
Mercury bioaccumulation in gills of different fish species was in the order of
Wallago attu>Labeo dyocheilus>Cyprinus carpio>Aorichthys seenghala>Ompok
bimaculatus, in skin was Wallago attu>Cyprinus carpio>Ompok bimaculatus
>Aorichthys seenghala>Labeo dyocheilus, in intestine was Cyprinus carpio
>Aorichthys seenghala>Ompok bimaculatus>Wallago attu>Labeo dyocheilus, in
liver was Wallago attu>Cyprinus carpio>Ompok bimaculatus>Aorichthys seenghala
>Labeo dyocheilus and in muscle was Wallago attu>Cyprinus carpio>Labeo
dyocheilus>Aorichthys seenghala>Ompok bimaculatus. Overall order of mercury
concentration in different tissues was intestine > skin > liver > gills > muscle and the
overall order of mercury in different fish species was Wallago attu > Cyprinus carpio
> Ompok bimaculatus > Aorichthys seenghala > Labeo dyocheilus.
4.3.7 Conclusions and Remarks
In the present investigation heavy metals like Zn, Ni, Cr, Cu, Cd, Pb, Mn. Fe
and Hg were determined in intestine, skin, gills, liver and muscle of five different fish
181
species including Wallago attu, Ompok bimaculatous, Labeo dyocheilus, Cyprinus
carpio and Aorichthys seenghala netted from both polluted and non polluted sites of
River Kabul. Overall order of heavy metals concentration in different fish organs was
in the sequence of intestine>skin>liver>gills> muscle and in different fish species was
in the order of Cyprinus carpio>Ompok bimaculatus>Aorichthys seenghala>Labeo
dyocheilus>Wallago attu. This shows that highest amount of metal bioaccumulation
was found in intestine followed by skin, liver and gills while lowest concentration was
observed in muscle. Similarly highest amount of metal bioaccumulation was found in
Cyprinus carpio fish followed by Ompok bimaculatus, Aorichthys seenghala, Labeo
dyocheilus and lowest in Wallago attu fish. Thus the organs level order of metal
bioaccumulation in Wallago attu was in the sequence of skin >gills > intestine >
muscle > liver, in Aorichthys seenghala was skin > liver > muscle > gills > intestine,
in Labeo dyocheilus was skin > intestine >gills > liver >muscle, in Cyprinus carpio
was intestine > skin > liver > gills > muscle and in Ompok bimaculatus was gills >
liver > skin > intestine > muscle. Overall order of heavy metal concentrations in
different tissues are as below
» in muscle was Zn>Cr>Pb>Cu>Ni>Fe>Mn>Hg>Cd.
» In intestine was Zn>Pb>Cr>Cu>Ni>Fe>Mn>Hg>Cd.
» In liver was Zn>Pb>Cr>Cu>Ni>Fe>Mn>Hg>Cd.
» In skin was Zn>Cr>Pb>Cu>Ni>Fe>Mn>Hg>Cd.
» In gills was Zn>Cr>Pb>Cu>Ni>Fe>Mn>Hg>Cd.
Thus Zn was the highly accumulated metal while Cd was the lowest. Comparing our
studies with U.S Recommended Daily Dietary Allowance (RDA) render that the fish
populations from polluted sites 1 and 2 of River Kabul are not suitable for human
consumption. The data generated in these studies confirmed the presence of heavy
metal load in River Kabul as reported in the past by many workers including

182
Yousafzai (2004). High heavy metal load in River Kabul which is reflective from the
present studies could be one of the reason of fish decline.
183
CHAPTER-5
GENOTOXIC EFFECTS OF HEAVY METALS IN
SELECTED FISH SPECIES OF RIVER KABUL
5.1 INTRODUCTION
Genotoxicity is a deleterious action, which affects a cell's genetic material
(Smith, 1996). Heavy metals are genotoxicants that can damage DNA of a living cell
(Matsumoto et al., 2005; Igwilo et al., 2006). These genotoxicants have investigated
that they are related to mutations because they form strong covalent bonds with the
DNA, which result into formation of DNA adducts that prevent replication of DNA
and result into DNA damage (Hartwell et al., 2000). The comet assay is a sensitive,
rapid and reliable method that can be used for the determination of DNA damage in
eukaryotic and prokaryotic cells (Bajpayee et al., 2005). Many workers have reported
that the fish erythrocytes are suitable for the comet assay, because fish blood contains
97% erythrocytes, which ensure homogenecity of cells for comet studies (Theodora et
al., 1994). Among the various techniques so far used to assess the genotoxicity of
environmental pollutants, the comet assay is sensitive, rapid technique that can be
used for estimation of DNA damage in both proliferating and non-proliferating cells
(Rojas et al., 1999). Researchers have found DNA fragmentation through comet assay
before more severe abnormalities in both terrestrial and aquatic organisms. The comet
assay is a sensitive technique that can be used for detecting DNA damage in a cell. It
combines a biochemical approach to detect DNA strand breaks and alkali labile sites
with a single-cell approach typical for cytogenetic assays (Collins et al., 1997, Lee
and Steinert, 2003).
Comet assay is a successful method that can be used for determination of
DNA damage in both laboratory and field investigations with different fish species,
both from fresh and marine water (Deveaux et al., 1997; Belpaeme et al., 1998;
Pandey et al., 2006). Therefore, fish are sentinel organisms for genotoxic studies in

184
aquatic environment (Landolt and Kocan, 1983). The comet assay is a new technique
that is used in molecular epidemiology. It gives good results about genotoxicity which
is produced as a result of diseases, therapy in clinical trials environmental or
occupational exposure to toxic chemicals for short period of time and in a cost-
effective manner (Faust et al., 2004; Bay ram et al., 2006). Comet assay has wide
description and development. Various investigations have imposed concentration on
mammalian cells for comet assay but a number have focused on marine and fresh
water mussels and fish for determination of DNA damage in their hemocytes, blood
cells, gill, liver and gut cells (Gertraud et al., 2007). Fish are useful genetic models to
find out the genotoxicological impacts of aquatic pollution (Kumar et al., 2009). Fish
are good source for the genotoxic, mutagenic and carcinogenic studies and also used
for environmental risk assessment (Ali et al., 2008; Banu et al., 2001). Fish are used
for ecotoxicological studies because they help in the trophic web, in accumulation
toxic chemicals and respond to low levels of genotoxic substances like heavy metals
(Jha, 2008). Fish are used in testing of substances such as heavy metals, biocides,
agrochemical, food additives and pharmaceuticals for genotoxicity (Brendler-
Schwaab et al., 2005). Therefore comet assay technique is helping in investigation of
genotoxicity and mutagenesis in the fish erythrocyte collected from polluted
environment (Andrade et al., 2004). Recently increasing concern about genotoxicity
in land and water has led to development of many mutagenesis test systems in
bacteria, yeast, plants and animals including fish. Fish are suitable organisms for
genotoxicological and ecotoxicological studies because they play different roles in the
heterotrophic web, bioaccumulation of heavy metals and showed responce to
mutagenic environmental pollutants like heavy metals at low concentration (Goksoyr
et al., 1991; Cavas and Ergene-Gozukara, 2005). Fish are good model for detection of
mutagencity, genotoxicity and carcinogenicity of toxic chemicals because they can
accumulate, concentrate and store water pollutants like heavy metals (Al-sabti,
1995b).
185
Fish has slow DNA repair mechanism than mammals (Espina and Wesis,
1995). It has been investigated that DNA strand breaks was measured by the comet
assay, which is acted as a biomarker of genotoxicity in fish and other aquatic species
(Mitchelmore and Chipman, 1998). The researchers have focused on increasing
genotoxins like heavy metals in the aquatic environment and also busy in
development of sensitive biomarkers for detection of genotoxic effects of toxins in
aquatic organisms (Hayashi et al., 1998). Environmental pollutants like heavy metals
are genotoxic and can be monitored using a broad range of both in vitro and in vivo
biomarker assays, but the comet assay is gaining popularity over others due to
sensitivity for detecting low levels of DNA damage (Gedic et al., 1992). Fish are used
as a good genetic model for determination of genotoxicological impacts of pollution
in aquatic ecosystems (Mitchell and Kennedy, 1992) and can play vital roles in
evaluation of potential risk associated with contamination in aquatic environment
because they are directly exposed to chemicals and mutagens such as heavy metals
received from industries, agricultural production via surface runoff or indirectly
through the food chain in an ecosystem (Cavas and Ergene-Gozukara, 2005a).
Therefore the fish are used as indicator for the determination of genotoxicological
effects of increasing pollution and can permit early detection of aquatic environmental
problems (Lopez-Barea, 1996; Van Der Oost et al., 2003). It is essential to investigate
the level of DNA damage as determined by comet assay is not limited to the impacts
of exogenous environmental pollutants only but oxidative DNA damage alone
contributes to back ground levels of DNA damage and is also relevant to the
secondary effects of many pollutants like heavy metals. The metabolism of several
heavy metals among them can attack on DNA and leading to serious DNA damage
(Livingstone, 2001, Gabbianelli et al., 2003, Mamaca et al., 2005). Fish are important
indicators that are used for mutagenic or carcinogenic investigation especially in
aquatic environment because they have the ability to metabolize, accumulate and store
186
water pollutants such as heavy metals in their different tissues and organs, which are
resulted into DNA damage in tissues and organs cells (Ateeq et al., 2005).
Blue gill sunfish, Lepomis macrochirus was collected from contaminated site
and the DNA was isolated from the blood cells and examined for DNA damage.
These quantitative measures were used to determine the difference in the number of
double and single strand breaks between DNA preparations. Both strand breakage
were found to be greater in fish exposed to heavy metal compounds as compare to
non exposed fish (Christopher, 1994). Heavy metals are one of the most toxic
environmental metals that affect genetically various organisms like fish. High
concentrations of heavy metals are resulted into DNA damage in fish (Serpi et al.,
2006). The DNA damage due to heavy metals was determined in hepatopancreas of
loach, Misgurnus anguilli caudatus fish. The percentage of DNA damage increased
with the increased exposure time to heavy metals. Therefore the highest percentage of
DNA damage was observed in the fish after exposure to heavy metals like cadmium,
lead and zinc (Yingmei et al., 2006). Heavy metals are dangerous to living things both
plants and animals because they are toxic and carcinogenic in nature and can induce
different abnormalities in living organisms. In previous finding it has been
investigated that heavy metals can be binded with nucleic acid by reacting in sites of
the cellular DNA, which are resulted into mutations, adducts and many complexes.
Metal cations were also investigated to impact DNA replication (Chang et al., 1996).
Recent investigations have reported that heavy metals are carcinogenic and free
radicals and reactive oxygen species are produced as a result of oxidative mechanism,
which are attributed to DNA damage in both terrestrial and aquatic animals. Therefore
heavy metals toxicity and carcinogenicity are other threats to animals in aquatic
environment ecosystem and is an important concern of the scientific community (Bal
and Kasprzak, 2002, Chang et al., 1996). Different abnormalities such as damage to
plasma membranes, following binding to proteins and phospholipids, inhibition
activities of sodium and potassium dependent ATP enzymes, inhibition of

187
transmebrane amino acid transport, enzyme inhibition, lipid peroxidation and DNA
damage are attributed to heavy metal cytotoxicity in animals (Stohs and Bagchi, 1995
and Sigel, 1992). Heavy metals can enter into the cell and disturbing metabolism of
the cells but some time get entry into the nucleus. There is formed ionic and
coordinated bonds between heavy metals and DNA, but can not produce all the
disorders seen in chromatin of cells. Hence not only the direct, but mostly indirect
impacts of metals on nuclear chromatin must be essential to know about the DNA
damage (Kasprzak, 1995).
Frequency of DNA damage in red blood cells of Balkan loaches fish was
determined on the basis of tail length, tail intensity (% DNA) and tail moment. The
findings indicate that Balkan loaches from the Sava River contain smaller degree of
DNA damage cells as compare to those from reference site and therefore the comet
assay is very sensitive technique for evaluation of genotoxicity. The result showed
that the red blood cells in the fish showed low frequency of DNA damage at clean
Kupa site, intermediate degree in the site Sava 2 and greater degree in the relatively
polluted site Sava 1 (Nevenka et al., 2008). Recently it has been investigated
genotoxic disease syndrome in the fish. The reduction of DNA integrity in red blood
cells of fish affected with polluted water in their habitats (Nevenka et al., 2008). The
genotoxic effects of environmental pollutants like heavy metals was determined in
both vitro and in vivo through different assays but the comet assay has its advantages
include sensitivity for detecting smaller degree of DNA damage in both the terrestrial
and aquatic animals (Gedic et al., 1992).
It is very easy to find out degree of DNA damage cells in different tissues and
organs of fish because no knowledge about metaphase and chromosome numbers are
needed (Belpaeme et al., 1998). Some changes like strand breaks, alkali labile adducts
and other modifications in the cells of aquatic animals are induced as a result of
interaction of genotoxic metals with DNA, which due to enzymatic removal of

188
damage nucleotides can contribute to an increased level of DNA strand breaks.
Overall comparison of main comet parameters determined in the red blood cells of
Balkan loach highlights the presence of greater frequency of DNA damage in red
blood cells of fish netted from the Sava River at the polluted Ivanja Reka and the
result also showed genotoxicity of aquatic environment (Nevenka et al., 2008). The
Loaches fish was collected from polluted Sava River and blood was taken out and
processed for DNA damage. Synergistic effects of toxic chemicals are resulted into
greater degree of DNA damage and also has an impact on immune response in
loaches fish collected from the polluted water of Sava River (Nevenka et al., 2008).
Genotoxic and carcinogenic effects of heavy metals like Ar and Cu have been
determined. Both of them are attributed to higher frequency of DNA damage in
aquatic animals (Reif erschied and Grummt, 2000; Gabbianelli et al., 2003). Genetic
susceptibility, DNA repair activity, the number of alkali-labile sites, metabolic
activity, antioxidant concentrations and heavy metals are different factors through,
which DNA damage variability can be explained in the aquatic organisms
(Mitchelmore and Chipman, 1998; Akcha et al., 2003; Buschini et al., 2004).
Variation of DNA damage was estimated between the male and female sex of
fish. However studies on fish suggested controversial data on the involvement of sex
in regulation of DNA damage (Devaux et al., 1998). In past few decades ago it has
been investigated that heavy metals like Fe, Cu, Cd, Hg, Ni, Pb and Ar have the
ability to generate reactive radicals, which are resulting into cellular and DNA
damage in living cells of animals (Phillips, 1995). Degree of DNA damage was
determined in two fish like C. punctatus and M. vittatus and a significant difference of
DNA damage was found between C. punctatus and M. vittatus and the difference
between baseline values of DNA damage highlights that some factors like species,
age and sex may have affect these minor differences. The same differences in
genotoxicity patterns were also reported for other fish species such as cyprinids
(Smith, 1990; Lemos et al., 2001; Vigano et al., 2002).
189
Red blood and white blood cells were investigated to evaluate the degree of
DNA damage due to heavy metals in aquatic organisms. The cells showed greater
degree of DNA damage in the fish collected from polluted water as compare to those
from non polluted water (Nagpure et al., 2008). It has been investigated that toxic
chemicals like heavy metals have the ability to bind with DNA and resulted into
greater degree of DNA damage (De Flora et al., 1991; Bhaskaran et al., 1999), gene
mutations (Maccubin et al., 1991) and genetic disease syndromes (Kurelec, 1993) in
the aquatic organisms, particularly fish. The blood of different fish species was
processed for determination of genotoxicity. The red blood cells showed high degree
of DNA damage (Rajaguru et al., 2003). DNA damage in different tissues and organs
of C. punctatus fish was investigated and observed a significant increase in DNA
damage after different exposure times. The result showed that C. punctatus is more
sensitive fish for evaluation the water quality in aquatic environment (Basdeo et al.,
2012). The heavy metals like Cd and Hg are two most toxic metals, which toxicity
and genotoxicity for fish have investigated (Ayllon and Garcia, 2000; Risso Fave et
al., 2001).
5.2 METHODS AND MATERIALS
5.2.1 Study Area
For detail see page≠2
5.2.2 Fish Sampling Sites
For detail see page≠109
5.2.3 Collection of the Fish Samples
For detail see page≠109
5.2.4 Collection and Preservation of Fish Tissues
Different fish species including Wallago attu, Ompok bimaculatus, Labeo
dyocheilus, Cyprinus carpio and Aorichthys seenghala were collected from two sites
190
of the River Kabul, downstream (site 1, Amangar and site 2, Nowshera) and upstream
(site 3, Warsak dam reservoir) and on the spot the blood was collected by cardiac
puncture through sterilized syringe and the blood was then shifted to EDTA glass
tubes to prevent blood clotting. The collected fishes were dissected for collection of
tissues like intestine, gills, skin, liver and muscle were taken out. These tissues were
washed with distilled water and then shifted to polythene bags and stored in the
freezer (at -20 C°) for further study. For determination of genotoxicity, the tissues
were grinded through grinder machine and 200µl PBS was added to the grinded
tissues to obtain cell suspension. The same method was followed for genotoxicity in
intestine, gills, skin, liver and muscle as adopted for the blood through comet assay.
5.2.5 Comet Assay
Comet assay was conducted according to the method described by Singh et al
(1988) with slight modification. The comet assay technique is suitable for
determination of genotoxicity in the aquatic animals due to its sensitivity (Kim and
Hyun, 2006).
5.2.5.1 Preparation of different solutions for comet assay
5.2.5.2 Lysing solution (EDTA 37.2 gm, Nacl 146.1 gm and Trizma base 1.2 gm,
NaOH8 gm, d.H2O 890 mL, pH 10.0 by using concentrated Na OH or HCl,).
5.2.5.3 Final lysing solution (10 % DMSO, 1 % Trition, lysing solution).
5.2.5.4 Phosphate buffer saline (PBS) (PBS 1 packet, 1000 mL d.H2O, pH 7.4).
5.2.5.5 Preparation of stock solutions
a. EDTA (14.89 g/200 mL d.H2O, pH 10).
b. NaOH (200 g/500 mL d.H2O)./

191
5.2.5.6 Electrophoresis buffer
For electrophoresis buffer per liter, 30 mL NaOH and 5.0 mL EDTA were
added, q.s. to 1000 mL and were mixed well. The total volume was depended on our
gel box capacity. The pH of the buffer was measured to be 13.
5.2.5.7 Neutralization buffer (0.4 M Tris 48.5 gm,d.H2O 1000 mL, pH 7.5).
5.2.5.8 Staining solution (Acridine Orange, 20 μg/mL was used)
5.2.5.9 Stock solution (20mg / 20 mL, stored at room temperature and protected from
the light).
5.2.5.10 Working solution (Stock solution0.4 mL, d.H2O19.6 mL=20 μg/mL).
5.2.5.11 Preparation of 1% and 0.5 % LMPA and 1% NMA
a.1% LMPA (500 mg / 50ml PBS)
b.1 % NMA (500 mg / 50 ml mili Q H2O)
Both the low melting point agarose (LAMP) and normal melting agarose
(NMA) were boiled in microwave oven and kept in refrigerator until needed.
5.2.5.12 Preparation of base slides
For preparation of base slides, the NMA agarose was again melted briefly in
microwave. After boiling the NMA was poured in caplin jar and conventional slides
were kept in the caplin jor upto two-third the frosted area for a minute and then
removed from the jar and placed in tray for drying. The undersides of the slides were
wiped with the help of another slide to remove the agarose and were stored at room
temperature until needed. The slides were labeled.
5.2.5.13 Layering of cells and LMPA on base slides
To the coated slide, added 75 μL of LMPA mixed with 10 μL of blood and
suspension of grinded tissues. A cover slip was placed on it and the slide was kept on
ice pack for 5 to 10 minutes. The cover slip was then removed from the slide and

192
added 85 μL LMPA to the slide. The cover slip was again kept on this layer and the
slide was returned to the ice pack for 5 to 10 minutes.
5.2.5.14 Placing of slides in final lysing solution (Total volume 25ml, Tritone 250µl,
lysing solution 22.75ml, DMSO 2.5ml).
The cover slip was gently removed from the third LMPA layer and the slide
was kept in the glass tray and poured gently lysing solution in glass tray .The glass
tray containing the slides was kept in the refrigerator for 2 hours or for overnight at
4ºC.
5.2.5.15 Electrophoresis of slides (Total volume 250ml, NaOH 7.5ml, EDTA
1.25ml, pH 13).
After 2 hours or overnight at ~4ºC, we carefully removed the slides from the
lysing solution and placed the slides closely side by side on the horizontal gel box at
one end. Then the horizontal gel box was gently filled with electrophoresis buffer
(pH>13) and allowed the slides to remain in the electrophoresis buffer for 20 minutes
to unwind the DNA. After 20 minutes the gel box was kept in refrigerator and power
supply was seted at 24 Volts and 300 mill amperes current for 30 minutes time and
turned on.
5.2.5.16 Neutralization of slides
After the completion of electrophoresis, the slides were removed from the gel
box and washed with neutralization buffer drop by drop. The slides were let sit for
about 5 minutes and again washed with neutralization buffer drop by drop and the
process was repeated two more times.
5.2.5.17 Drying of slides
The slides were drained and kept for 20 minutes in cold 100% ethanol for
dehydration. The slides were dried in open air for drying.

193
5.2.5.18 Rehydration and staining of slides
Chilled distilled water was used for rehydration of slides. The slides were kept
for about 30 minutes in it and then stained with 70μL DNA specific fluorescent dye
acridine orange (20 μg/ml) and kept for 5 minutes. To remove the excess of dye, the
slides were dipped again in chilled distilled water. Then the slides were covered with
cover slips.
5.2.5.19 Scoring of slides and visualization of DNA damage
From every slide 100 cells were randomly selected and images were taken at
400x by using fluorescent microscope (Nikon Eclipse 80 i) equipped with an
excitation filter of 450-490 nm. Comet tail lengths (consisting of nuclear region and
tail) were scored visually into 5 comet classes.
5.2.5.20 Comet Classes
Comet class 0 (no damage, hence no tail),
Comet class 1 (tail up to 1.5 times the diameter of the comet nucleus),
Comet class 2 (tail 1.5–2.0 times the diameter of the comet nucleus),
Comet class 3 (tail 2.0–2.5 times the diameter of the comet nucleus) and
Comet class 4 (maximally damaged with total DNA in its tail).
A final overall total comet score for all 100 cells was obtained by summing up
the number of cells in each class times the class number, giving a rating between 0
(completely undamaged) and 400 (maximum damaged) (Collins, 2004) i.e.
TCS = 0(n) + 1(n) + 2(n) + 3(n) + 4(n), Where (n) indicate the number of cells in each
class. One slide reader performed the overall scoring.
5.2.5.21 Statistical analysis
Statistical analysis was done by using ANOVA software for windows. Mean
and standard deviation values of the data were determined. The different sets of data

194
were analyzed for statistical differences by using student’s t –test (two-tailed); a P
value <0.05 was considered to show statistical significance.
5.3 RESULTS AND DISCUSSION
The present investigation has determined genotoxicological effects of heavy
metals like Zn, Ni, Cr, Cu, Cd, Pb, Fe, Mn and Hg in blood, intestine, skin, liver, gills
and muscle of five selected fish species including Wallago attu, Aorichthys
seenghala, Cyprinus carpio, Labeo dyocheilus and Ompok bimaculatus from site 1
and site 2 (polluted) of River Kabul and were compared with fish samples from site 3
(control) to estimate degree of DNA damage like total comet score (TCS) and comet
classes caused by heavy metals through comet assay.
5.3.1 TCS and Comet Classes in Blood
Blood of the selected five different fish from control site 3 and polluted sites 1
and 2 was taken out and processed for estimation of degree of DNA damage like total
comet score (TCS) and comet class 0, class 1, class 2, class 3 and class 4 caused by
heavy metals like Zn, Ni, Cr, Cu, Cd, Pb, Fe, Mn and Hg. DNA damage cells
observed in blood of five different fish from sites 1 and 2 were significantly higher
than those observed in blood from control site 3 (Table 5.1 and Figs 5.1-5.3).
The blood of different fish species from site 1 and site 2 showed higher mean
frequency of total comet score (TCS) and comet class 1, class 2, class 3 and class 4
per 100 cell as compare with those from site 3 besides comet class 0 where its value
was highest in blood of studied fish species from control site 3 and was lowest from
polluted sites 1 and 2. Lowest mean values of comet class 0 in blood of Wallago attu
from polluted sites (1 and 2) were 47.0±4.0 cells and 33.3±4.5 cells and was 90.0±4.0
cells from reference sites, in Aorichthys seenghala from polluted sites were 30.6±3.5
cells and 20.0±4.0 cells and was 82.0±4.0 cells from site 3, in Labeo dyocheilus from
polluted water were 38.0±4.0 cells and 26.0±3.6 cell and was 87.0±4.0 cells from
control water, in Cyprinus carpio from polluted sites were 12.0±4.0 cells and 2.6±2.5

195
cells and was 71.0±4.0 cells from site 3 and in Ompok bimaculatus from polluted site
1 and site 2 were 21.6±1.5 cells and 14.6±3.0 cells and was 77.0±4.0 cells from site 3
respectively. The sequence of comet class 0 in blood tissues of different studied fish
was Wallago attu>Labeo dyocheilus >Aorichthys seenghala >Ompok bimaculatus >
Cyprinus carpio. This indicates that comet class 0 was greater in Wallago attu and
lower in Cyprinus carpio. These results are in agreement with those observed by
many investigators (Ozkan et al., 2011; Fagr et al., 2008; Al-Sabti, 1986; Dan and
Nanda, 1986). Comet class 0 observed in blood of examined fish species from
polluted water was significantly lower than those observed from Warsak dam. In this
investigation comet class 0 in blood of selected fish species from polluted sites was
lower as compare to those from control site of the River Kabul. This was correlated to
less heavy metals in this tissues and the result also confirmed less heavy metals
pollution in control water of Warsak dam.
The highest degree of comet class 1 observed in blood sample of Wallago attu
from polluted site 1 and 2 were 5.0±1.0 cells and 8.0±1.0 cells and was 2.0±1.0 cells
from control water, in Aorichthys seenghala from sites 1 and 2 were 9.3±0.5 cells and
11.0±1.0 cells and was 6.0±1.0 cells from control site 3, in Labeo dyocheilus from
polluted water were 7.0±1.0 cells and 10.0±1.0 cells and was 4.0±1.0 cells from
control water, in Cyprinus carpio from both sites 1 and 2 were 13.0±1.0 cells and
14.6±0.5 cells and was 9.0±1.0 cells from site 3 and in Ompok bimaculatus from sites
1 and were 12.0±1.0 cells and 13.0±1.0 cells and was 7.0±1.0 cells from site 3
respectively. The order of comet class 1 in this tissue of different fish species was
Cyprinus carpio>Ompok bimaculatus>Aorichthys seenghala >Labeo dyocheilus
>Wallago attu. This shows that comet class 1 was highest in Cyprinus carpio and
lowest in Wallago attu. In this study the values for comet class 1 were lower as
compare to the values mentioned by (Wirzinger et al., 2007; Smith., 1996). The
greater degree of comet class 1 in blood of Cyprinus carpio is related to greater

196
content of heavy metals in this tissue. The result also showed metal pollution in the
studied areas.
Blood of Wallago attu from polluted sites had highest comet class 2 with
mean values of 7.0±1.0 cells and 10.0±1.0 cells and had lowest mean value of
3.0±1.0 cells from Warsak dam, Aorichthys seenghala from polluted sites 1 and 2 had
10.0±1.0 cells and 13.0±1.0 cells and had 5.0±1.0 cells from control site 3, Labeo
dyocheilus from polluted sites had 9.0±1.0 cells and 12.0±1.0 cells and had 4.0±1.0
cells from control site, Cyprinus carpio from polluted water had 15.0±1.0 cells and
16.3±0.5 cells and had 8.0±1.0 cells from control water and Ompok bimaculatus from
polluted sites had 12.3±0.5 cells and 15.0±1.0 cells and had 6.0±1.0 cells from
reference site 3 respectively. Comet class 2 in blood having a sequence: Cyprinus
carpio>Ompok bimaculatus>Aorichthys seenghala >Labeo dyocheilus >Wallago attu.
This reveales that Cyprinus carpio had greater degree of comet class 2 and Wallago
attu had smaller comet class 2.These values for comet class 2 in blood were higher
than those reported by (Ozkan et al., 2011; Fagr et al., 2008). Higher degree of comet
class 2 in this tissue is attributed to greater level of heavy metals in blood. Therefore
blood of different fish species from polluted water showed greater degree of DNA
damage cells than those from control water.
The observed mean values for comet class 3 in blood of Wallago attu from
polluted sites were 20.0±1.0 cells and 23.0±1.5 cells and was 3.0±1.0 cells from
Warsak dam, in Aorichthys seenghala from polluted sites were 24.0±1.0 cells and
27.0±1.0 cells and was 3.0±1.0 cells from control water, in Labeo dyocheilus from
polluted sites 1 and 2 were 22.0±1.0 cells and 25.0±1.0 cells and was 2.0±1.0 cells
from control site, in Cyprinus carpio from polluted water were 28.0±1.0 cells and
30.6±0.5 cells and was 6.0±1.0 cells from control site and in Ompok bimaculatus from
sites 1 and 2 were 26.0±1.0 cells and 27.0±1.0 cells and was 5.0±1.0 cells from
control site 3 respectively. The sequence of comet class 3 in this tissue was Cyprinus

197
carpio > Ompok bimaculatus > Aorichthys seenghala > Labeo dyocheilus >Wallago
attu. This highlights that comet class 3 was highest in Cyprinus carpio and lowest in
Wallago attu. This could be attributed to more heavy metals and low detoxification
mechanism in this fish. In this study the values for comet class 3 were higher as
compare to the findings of these workers (Al-Sabti, 1986; Dan and Nanda, 1986).
Blood of Wallago attu from both sites 1 and 2 showed high level of comet
class 4 with mean values of 21.0±1.0 cells and 25.0±1.0 cells and showed low level
with mean value of 2.0±1.0 cells from Warsak dam, Aorichthys seenghala from
polluted sites showed 24.0±1.0 cells and 27.0±1.0 cells and showed 3.0±1.0 cells
from control site, Labeo dyocheilus from polluted site 1 and site 2 showed 24.0±1.0
cells and 27.0±1.0 cells and showed 3.0±1.0 cells from control site 3, Cyprinus carpio
from polluted water showed 32.0±1.0 cells and 35.3±0.5 cells and showed 6.0±1.0
cell from reference water and Ompok bimaculatus from both polluted sites 1 and 2
showed 28.0±1.0 cells and 30.3±1.5 cells and showed 5.0±1.0 cells from control site 3
respectively. The sequence of comet class 4 in blood of different fish species was
Cyprinus carpio > Ompok bimaculatus > Aorichthys seenghala > Labeo dyocheilus >
Wallago attu. This indicates that Cyprinus carpio showed maximum degree of comet
class 4 while Wallago attu showed minimum comet class 4. These results of higher
values for comet class 4 in blood agree with the findings of those reported by
(Richard et al., 2003; Mishra and Mohanty, 2009; Li et al., 2011; Adams et al.,1989).
The greater frequency of comet class 4 in blood of Cyprinus carpio could be related
to high content of heavy metals in this tissue and exposition of the fish to heavy
metals in water for long period.
In our study degree of TCS observed in blood of studied fish species from
polluted water was significantly higher than those observed from Warsak dam. Blood
of Wallago attu from polluted sites 1 and 2 had maximum level of total comet score
(TCS) with mean values of 163.0±10.0 cells and 199.0±11.5 cells and had minimum
198
level with mean value of 25.0±10.0 cells from control site 3, Aorichthys seenghala
from polluted sites had 205.3±9.5 cells and 232.6±10.2 cells and had 41.0±10.0 cells
from Warsak dam, Labeo dyocheilus from polluted water had 187.0±10.0 cells and
217.0±8.8 cells and had 30.0±10.0 cells from control water, Cyprinus carpio from
polluted site 1 and site 2 had 255.0±10.0 cells and 279.3±4.1 cells and had 67.0±10.0
cells from reference site 3 and blood of Ompok bimaculatus from both sites 1 and 2
had 226.6±4.9 cells and 245.3±8.7 cells and had 54.0±10.0 cells from Warsak dam
respectively. The order of TCS in different studied fish species was Ompok
bimaculatus > Cyprinus carpio > Aorichthys seenghala > Labeo dyocheilus >
Wallago attu. This reveales that Cyprinus carpio had maximum TCS and Wallago
attu had minimum. This greater degree of DNA damage cells in the blood tissue of
Cyprinus carpio could be related to low elimination of metals from body, exposition
of fish to metals for long period and more content of metals in the blood of this fish.
In this study more TCS was observed than those reported in the previous findings by
Christopher (1994) and Buschini et al (2004). In the present finding high degree of
TCS was observed in blood. This is in agreement with the findings of Nevenka et al
(2008), who had also reported greater frequency of TCS in blood of Balkan loaches
after exposure to heavy metals. By making overall comparison, blood came second
after intestine followed by skin, liver, gills and muscle for comet classes and TCS.
This tissue showed more comet classes and TCS than skin, liver, gills and muscle.
This is because of more heavy metals accumulation in this tissue and low
detoxification mechanism of red blood cells. Overall trend of DNA damage cells in
different fish species was in the order of Cyprinus carpio>Ompok bimaculatus >
Aorichthys seenghala>Labeo dyocheilus >Wallago attu and overall order of comet
classes in blood was class 4 > class 3> class 0> class 2> class 1.
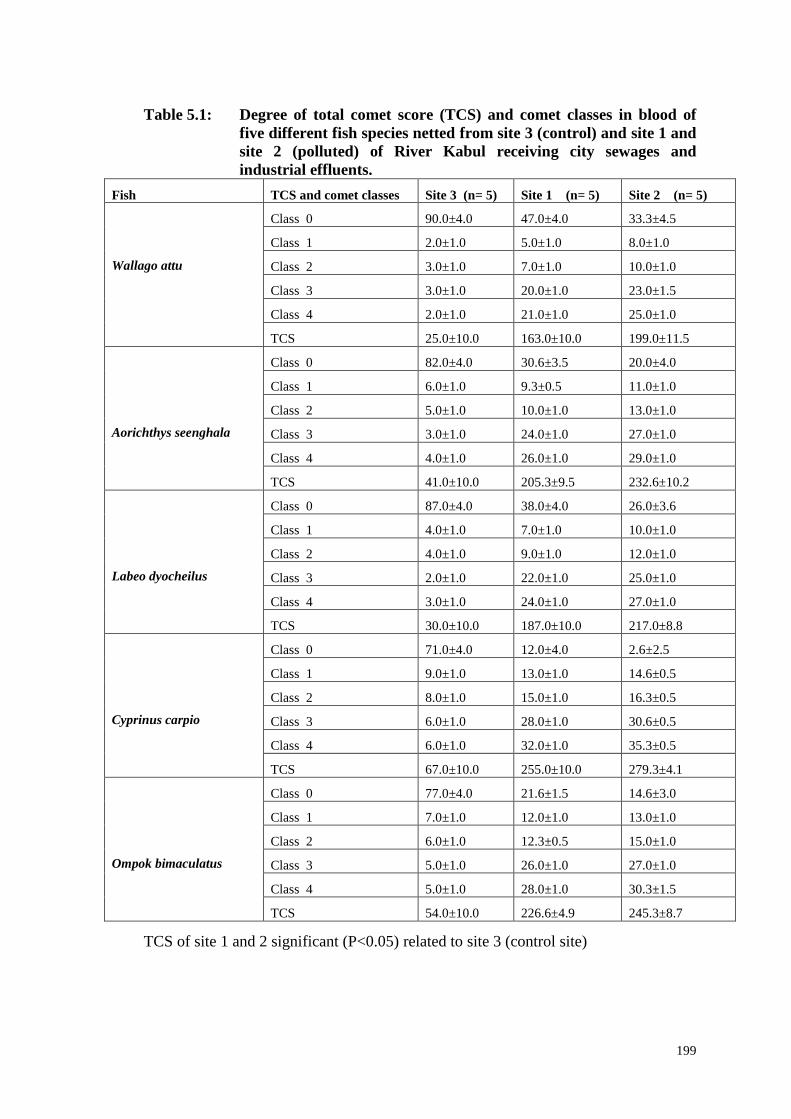
199
Table 5.1: Degree of total comet score (TCS) and comet classes in blood of
five different fish species netted from site 3 (control) and site 1 and
site 2 (polluted) of River Kabul receiving city sewages and
industrial effluents.
Fish TCS and comet classes Site 3 (n= 5) Site 1 (n= 5) Site 2 (n= 5)
Wallago attu
Class 0 90.0±4.0 47.0±4.0 33.3±4.5
Class 1 2.0±1.0 5.0±1.0 8.0±1.0
Class 2 3.0±1.0 7.0±1.0 10.0±1.0
Class 3 3.0±1.0 20.0±1.0 23.0±1.5
Class 4 2.0±1.0 21.0±1.0 25.0±1.0
TCS 25.0±10.0 163.0±10.0 199.0±11.5
Aorichthys seenghala
Class 0 82.0±4.0 30.6±3.5 20.0±4.0
Class 1 6.0±1.0 9.3±0.5 11.0±1.0
Class 2 5.0±1.0 10.0±1.0 13.0±1.0
Class 3 3.0±1.0 24.0±1.0 27.0±1.0
Class 4 4.0±1.0 26.0±1.0 29.0±1.0
TCS 41.0±10.0 205.3±9.5 232.6±10.2
Labeo dyocheilus
Class 0 87.0±4.0 38.0±4.0 26.0±3.6
Class 1 4.0±1.0 7.0±1.0 10.0±1.0
Class 2 4.0±1.0 9.0±1.0 12.0±1.0
Class 3 2.0±1.0 22.0±1.0 25.0±1.0
Class 4 3.0±1.0 24.0±1.0 27.0±1.0
TCS 30.0±10.0 187.0±10.0 217.0±8.8
Cyprinus carpio
Class 0 71.0±4.0 12.0±4.0 2.6±2.5
Class 1 9.0±1.0 13.0±1.0 14.6±0.5
Class 2 8.0±1.0 15.0±1.0 16.3±0.5
Class 3 6.0±1.0 28.0±1.0 30.6±0.5
Class 4 6.0±1.0 32.0±1.0 35.3±0.5
TCS 67.0±10.0 255.0±10.0 279.3±4.1
Ompok bimaculatus
Class 0 77.0±4.0 21.6±1.5 14.6±3.0
Class 1 7.0±1.0 12.0±1.0 13.0±1.0
Class 2 6.0±1.0 12.3±0.5 15.0±1.0
Class 3 5.0±1.0 26.0±1.0 27.0±1.0
Class 4 5.0±1.0 28.0±1.0 30.3±1.5
TCS 54.0±10.0 226.6±4.9 245.3±8.7
TCS of site 1 and 2 significant (P<0.05) related to site 3 (control site)

200
Wallago attu
Aorichthys seenghala
Fig. 5.1: Degree of total comet score (TCS) and comet classes in blood of
Wallago attu and Aorichthys seenghala netted from site 3 (control)
and site 1 and site 2 (polluted) of River Kabul receiving city
sewages and industrial effluents.

201
Labeo dyocheilus
Cyprinus carpio
Fig. 5.2: Degree of total comet score (TCS) and comet classes in blood of
Labeo dyocheilus and Cyprinus carpio netted from site 3 (control)
and site 1 and site 2 (polluted) of River Kabul receiving city
sewages and industrial effluents.

202
Ompok bimaculatus
Fig.5.3: Degree of total comet score (TCS) and comet classes in blood of
Ompok bimaculatus and netted from site 3 (control) and site 1 and
site 2 (polluted) of River Kabul receiving city sewages and
industrial effluents.

203
5.3.2 TCS and Comet Classes in Gills
Gills of the selected five different fish from Warsak dam (Site 3) and polluted
sites 1 and 2 (Nowshera and Amangarh) were taken out and processed for the
determination of DNA damage cells. The gills of the fish from polluted water showed
higher degree of DNA damage cells as compare with those fish from Warsak dam,
where lower DNA damage cells were observed (Table 5.2 and Figs 5.4-5.6).
Gills of Wallago attu from both polluted sites of River Kabul showed smaller
frequency of comet class 0 with mean values of 55.6±4.0 cells and 43.6±4.0 cells and
showed greater level with mean value of 91.6±4.0 cells from control site 3 (Warsak
dam), Aorichthys seenghala from both sites 1 and 2 showed 42.6±4.9 cells and
30.0±2.6 cells and showed 88.0±3.6 cells from control site 3, Labeo dyocheilus from
polluted water showed 50.6±5.8 cells and 37.0±5.0 cells and showed 89.3±4.1 cells
from control water, Cyprinus carpio from site 1 and site 2 showed 33.0±5.5 cells and
19.3±3.0 cells and showed 85.3±40.2 cells from site 3 and Ompok bimaculatus from
sites 1 and 2 showed 40.0±5.5 cells and 29.0±3.4 cells and showed 85.0±3.4 cells
from reference site 3 respectively. The sequence of comet class 0 in different studied
fish was Wallago attu > Labeo dyocheilus > Aorichthys seenghala > Ompok
bimaculatus > Cyprinus carpio. This highlights that comet class 0 was maximum in
Wallago attu and minimum in Cyprinus carpio. In this finding degree of comet class
0 in this tissue was lower than those reported in past findings (Pandrangi et al., 1995;
Villarini et al., 1998; Tice, 1995; Wilson et al., 1998). The result shows that comet
class 0 was lowest in gills from polluted water and highest from control water. This
could be related to less metals in this tissues. Comparing our result with the findings
of above mentioned studies highlights that heavy metals are toxic in nature and can
induce genotoxicity in various tissues of aquatic and terrestrial animals including
human beings.
204
The observed greater mean values for comet class 1 in gills of Wallago attu
from polluted sites were 6.0±1.0 cells and 8.0±1.0 cells and was 3.0±1.0 cells from
Warsak dam, in Aorichthys seenghala from polluted sites 1 and 2 were 7.0±1.0 cells
and 9.3±0.5 cells and was 4.0±1.0 cells from control site 3, in Labeo dyocheilus from
polluted water were 6.3±1.5 cells and 8.3±1.5 cells and was 3.0±1.0 cells from control
water, in Cyprinus carpio from polluted sites were 8.3±1.5 cells and 11.3±0.5 cells
and from control site was 4.0±1.0 cells and in Ompok bimaculatus from sites 1 and 2
were 8.0±1.0 cells and 9.0±1.0 cells and was 4.0±1.0 cells from control site 3
respectively. The order of comet class 1 in gills of different fish species was Cyprinus
carpio>Ompok bimaculatus>Aorichthys seenghala >Labeo dyocheilus >Wallago attu.
This indicates that Cyprinus carpio showed high degree of comet class 1 and Wallago
attu low degree of comet class 1. This greater degree of comet class 1 in gills of
Cyprinus carpio could be the cause of greater concentration of heavy metals in this
tissue. The gills is the tissue that are directly and constantly exposed to heavy metals
in water as compare to other organs of the fish body. These results are in agreement
with the findings of those reported by (Belpaeme et al., 1996; Mitchelmore and
Chipman, 1998; Maruya, 20000; Kim et al., 2000). Comparing the present result with
the findings of previous workers reveale that heavy metals are genotoxic in nature,
which may be resulted into greater frequency of DNA damage cells in different
tissues of the fish.
Gills of Wallago attu from polluted sites contained highest degree of comet
class 2 with mean values of 5.0±1.0 cells and 10.0±1.0 cells and contained lowest
frequency with mean value of 2.0±1.0 cells from control site, Aorichthys seenghala
from both sites 1 and 2 contained 8.0±1.0 cells and 13.0±1.0 cells and contained
3.0±1.0 cells from reference site 3, Labeo dyocheilus from polluted water contained
6.3±1.5 cells and 11.6±1.5 cells and contained 3.0±1.0 cells from control water,
Cyprinus carpio from site 1 and site 2 contained 10.3±1.5 cells and 14.3±0.5 cells and
contained 5.0±1.0 cells from reference site 3 and Ompok bimaculatus from polluted

205
sites contained 8.3±1.5 cells and13.0±1.0 cells and contained 4.0±1.0 cells from
control water of Warsak dam respectively. Comet class 2 in gills of different studied
fish species having a sequence: Cyprinus carpi>Ompok bimaculatus>Aorichthys
seenghala > Labeo dyocheilus>Wallago attu. This reveales that greater frequency of
comet class 2 was observed in Cyprinus carpio and smaller in Wallago attu. These
results are agreed with the findings of (Chandra and Khuda, 2004), who had also
reported greater degree of comet class 2 in gills of Oreochromis mossambicus after
exposure to cadmium chloride and azadirachtin.
Gills of Wallago attu from site 1 and site 2 showed more degree of comet
class 3 with mean values of 16.0±1.0 cells and 17.3±1.5 cells and showed less degree
with mean value of 2.0±1.0 cells from control site 3 (Warsak dam), Aorichthys
seenghala from polluted sites showed 19.6±1.1 cells and 22.6±0.5 cells and showed
3.0±1.0 cells from reference site 3, Labeo dyocheilus from polluted water showed
17.3±1.5 cells and 19.0±1.0 cells and showed 2.6±1.5 cells from control water,
Cyprinus carpio from site 1 and site 2 showed 23.0±1.0 cells and 26.0±1.0 cells and
showed 4.0±1.0 cells from site 3 and Ompok bimaculatus from polluted sites showed
20.3±1.5 cells and 23.0±1.0 cells and showed 4.0±1.0 cells from Warsak dam
respectively. Comet class 3 in gills of different fish species was in the order of
Cyprinus carpio > Ompok bimaculatus > Aorichthys seenghala > Labeo dyocheilus >
Wallago attu. Here again the order of comet class 3 was same to comet class 1 and 2.
The present result of higher comet class 3 in gills of Cyprinus carpio, Ompok
bimaculatus and Aorichthys seenghala agree with the findings of Bertin and Averbeck
(2006). On the other hand, the present data for Labeo dyocheilus and Wallago attu
agree with those of Cotelle and Erard (1999) and Valko et al (2005). In humans and
other animals like fish heavy metals are associated with DNA damage. Therefore
accumulation of heavy metals can induce DNA damage cells in aquatic animals like
fish. The present investigation found more degree of DNA damage cells in gills of
examined fish species from polluted water as compare to control fish of Warsak dam.

206
This could be correlated to higher concentration of heavy metals in gills of studied
fish from polluted sites of River Kabul. This result also confirmed the heavy metals
pollution in River Kabul.
Gills of Wallago attu from polluted sites showed maximum degree of comet
class 4 with mean values of 17.3±1.5 cells and 21.0±1.0 cells and showed minimum
mean value of 1.3±1.5 cells from control site (Warsak dam), Aorichthys seenghala
from polluted sites 1 and 2 showed 22.3±1.5 cells and 25.0±1.0 cells and showed
2.0±1.0 cells from control site 3, Labeo dyocheilus from both polluted sites 1 and 2
showed 19.3±1.5 cells and 24.0±1.0 cells and showed 2.0±1.0 cells from control site
3, Cyprinus carpio from polluted water showed 25.3±1.5 cells and 29.0±1.0 cells and
showed 4.0±1.0 cells from control water and Ompok bimaculatus from both site 1 and
site 2 showed 23.3±1.5 cells and 26.0±1.0 cells and showed 3.0±1.0 cells from
Warsak dam respectively. The order of comet class 4 in this tissue was Cyprinus
carpio>Ompok bimaculatus>Aorichthys seenghala>Labeo dyocheilus>Wallago attu.
This order was same to comet class 1, 2 and 3. This trend shows greater degree of
comet class 4 in Cyprinus carpio and smaller in Wallago attu. These results are
agreed with the findings of previous investigations (Serpi et al., 2006; Bresler et al.,
2001). By comparing the present result with the findings of above mentioned studies
reveales that heavy metals tend to be concentrated in gills tissues and indunce greater
degree of comet class 4 in gills tissues. The result also showed heavy metals pollution
in the studied areas. The gills from polluted portions of River Kabul showed
maximum frequency of comet class 4 as compare to control water.
Gills of Wallago attu from polluted sites had highest frequency of total comet
score (TCS) with mean values of 133.3±11.0 cells and 164.0±10.5 cells and had
lowest mean value of 18.3±11.0 cells from control site, Aorichthys seenghala from
site 1 and 2 and had 171.3±12.0 cells and 203.3±6.6 cells and had 27.0±8.8 cells
from site 3, Labeo dyocheilus from polluted water had 148.3±14.9 cells and
207
184.6±11.5 cells and had 25.0±11.1 cells from Warsak dam, Cyprinus carpio from
polluted site 1 and site 2 had 199.0±13.6 cells and 234.0±8.5 cells and had 42.0±8.8
cells from reference site 3 and Ompok bimaculatus from sites 1 and 2 had 179.0±14.7
cells and 208.0±8.7 cells and had 36.0±8.7 cells from control site 3 respectively.TCS
in gills of different fish species was in the sequence of Cyprinus carpio > Ompok
bimaculatus > Aorichthys seenghala > Labeo dyocheilus > Wallago attu.This
indicates that TCS was highest in Cyprinus carpio and lowest in Wallago attu.This
greater degree of TCS in Cyprinus carpio could be the result of high level of heavy
metals in this fish. It is an omnivorous fish. Being an omnivorous nature, it is more
exposed to heavy metals and accumulated more metals in this organ. Therefore gills
of this fish showed more TCS as compare to other examined fish species. This result
found more TCS than those reported by (Bresler et al., 2001; Ayllon and Garcia,
2000; Risso et al., 2001). Results of the present and previous studies demonstrated
that heavy metals are genotoxic in nature and can induce genotoxicity in aquatic and
terrestrial animals.
In the present study gills of the selected fish from polluted sites of River Kabul
showed greater frequency of DNA damage cells as compare to those from Warsak
dam. This higher degree of DNA damage cells in gills cells from polluted sites could
be correlated to greater concentration of heavy metals in gills and also attributed to
directly and constantly exposure of gills to heavy metals in the water. Comparing our
result with the above findings shows that heavy metals are toxic and have capability
to accumulate in gills, which resulted into DNA damage. By comparison the degree of
DNA damage, the fish from polluted sites showed increasing tendency as compare to
those from control site. All the TCS and comet class 1, 2, 3 and 4 values were highest
in gills tissues of examined fish from polluted water than those from control water.
Gills came last second for frequency of comet classes and TCS after intestine, blood,
skin and liver and followed by muscle. Gill is the prime target organ that is directly
and constantly exposed to heavy metals. The gills showed less degree of DNA

208
damage cells as compare to the intestine, blood, skin and liver. This could be related
to low concentration of heavy metals in the gills, high elimination of heavy metals
from body and strong detoxification mechanism of this tissue. Overall sequence of
DNA damage cells in gills of different fish species was Cyprinus carpio>Ompok
bimaculatus>Aorichthys seenghala>Labeo dyocheilus >Wallago attu and overall
order of comet classes in gills was class 0> class 4 > class 3> class 2> class 1.

209
Table 5.2: Degree of total comet score (TCS) and comet classes in gills of five
different fish species netted from site 3 (control) and site 1 and site
2 (polluted) of River Kabul receiving city sewages and industrial
effluents.
Fish TCS and comet classes Site 3 (n= 5) Site 1 (n= 5) Site 2 (n= 5)
Wallago attu
Class 0 91.6±4.0 55.6±4.0 43.6±4.0
Class 1 3.0±1.0 6.0±1.0 8.0±1.0
Class 2 2.0±1.0 5.0±1.0 10.0±1.0
Class 3 2.0±1.0 16.0±1.0 17.3±1.5
Class 4 1.3±1.5 17.3±1.5 21.0±1.0
TCS 18.3±11.0 133.3±11.0 164.0±10.5
Aorichthys seenghala
Class 0 88.0±3.6 42.6±4.9 30.0±2.6
Class 1 4.0±1.0 7.0±1.0 9.3±0.5
Class 2 3.0±1.0 8.0±1.0 13.0±1.0
Class 3 3.0±1.0 19.6±1.1 22.6±0.5
Class 4 2.0±1.0 22.3±1.5 25.0±1.0
TCS 27.0±8.8 171.3±12.0 203.3±6.6
Labeo dyocheilus
Class 0 89.3±4.1 50.6±5.8 37.0±5.0
Class 1 3.0±1.0 6.3±1.5 8.3±1.5
Class 2 3.0±1.0 6.3±1.5 11.6±1.5
Class 3 2.6±1.5 17.3±1.5 19.0±1.0
Class 4 2.0±1.0 19.3±1.5 24.0±1.0
TCS 25.0±11.1 148.3±14.9 184.6±11.5
Cyprinus carpio
Class 0 83.0±3.6 33.0±5.5 19.3±3.0
Class 1 4.0±1.0 8.3±1.5 11.3±0.5
Class 2 5.0±1.0 10.3±1.5 14.3±0.5
Class 3 4.0±1.0 23.0±1.0 26.0±1.0
Class 4 4.0±1.0 25.3±1.5 29.0±1.0
TCS 42.0±8.8 199.0±13.6 234.0±8.5
Ompok bimaculatus
Class 0 85.0±3.4 40.0±5.5 29.0±3.4
Class 1 4.0±1.0 8.0±1.0 9.0±1.0
Class 2 4.0±1.0 8.3±1.5 13.0±1.0
Class 3 4.0±1.0 20.3±1.5 23.0±1.0
Class 4 3.0±1.0 23.3±1.5 26.0±1.0
TCS 36.0±8.7 179.0±14.7 208.0±8.7
TCS of site 1 and 2 significant (P<0.05) related to site 3 (control site)

210
Wallago attu
Aorichthys seenghala
Fig.5.4: Degree of total comet score (TCS) and comet classes in gills of
Wallago attu and Aorichthys seenghala netted from site 3 (control)
and site 1 and site 2 (polluted) of River Kabul receiving city
sewages and industrial effluents.

211
Labeo dyocheilus
Cyprinus carpio
Fig.5.5: Degree of total comet score (TCS) and comet classes in gills of
Labeo dyocheilus and Cyprinus carpio netted from site 3 (control)
and site 1 and site 2 (polluted) of River Kabul receiving city
sewages and industrial effluents.

212
Ompok bimaculatus
Fig.5.6: Degree of total comet score (TCS) and comet classes in gills of
Ompok bimaculatus netted from site 3 (control) and site 1 and site 2
(polluted) of River Kabul receiving city sewages and industrial
effluents.
213
5.3.3 TCS and Comet Classes in Skin
Skin of five selected fish species from control site 3 (Warsak dam) and
polluted sites 1 and 2 were collected and processed through comet assay for
estimation of total comet score (TCS) and comet classes. Skin of fish from polluted
sites showed higher level of total comet score (TCS) and comet classes as compare
with fish from control site 3 besides comet class 0, where mean values for comet class
0 were higher from control site as compare to polluted water (Table 5.3 and Figs 5.7-
5.9).
Comet class 0 in skin of Wallago attu from both polluted sites were 49.3±5.5
cells and 35.6±3.2 cells and was 90.6±4.6 cells from control site, in Aorichthys
seenghala from polluted sites were 34.0±4.0 cells and 22.3±3.0 cells and was
86.3±3.5 cells from control site, Labeo dyocheilus from sites 1 and 2 were 40.3±4.0
cells and 26.6±2.0 cells and was 88.0±3.4 cells from control site 3, in Cyprinus carpio
from polluted water were 21.0±5.0 cells and 9.3±4.0 cells and was 82.3±1.5 cells
from control water and in Ompok bimaculatus from polluted sites were 27.0±5.0 cells
and 13.6±2.5 cells and was 82.0±3.6 cells from Warsak dam respectively. Comet class
0 in skin of different fish was in the order of Wallago attu > Labeo dyocheilus >
Aorichthys seenghala > Ompok bimaculatus > Cyprinus carpio. This highlights that
Wallago attu was found to be contained greater mean values of comet class 0 and
Cyprinus carpio smaller values. This data for comet class 0 was lower than those
reported previously (Ali et al., 2009). This organ from polluted sites of River Kabul
showed low degree of comet class 0 as compare to those from control site. This
greater degree of comet class 0 in this tissue from control site is because of less heavy
metals concentration in skin and the result also showed less heavy metals pollution in
control water of River Kabul.
Skin of Wallago attu from polluted sites contained maximum degree of comet
class 1 with mean values of 6.3±1.0 cells and 8.6±0.5 cells and contained minimum
214
mean value of 3.0±1.0 cells from control site, Aorichthys seenghala from polluted
sites 1 and 2 contained 7.0±1.0 cells and 11.3±0.5 cells and contained 3.6±1.1 cells
from reference site 3, Labeo dyocheilus from polluted water contained 6.0±1.0 cells
and 9.6±0.5 cells and contained 4.0±1.0 cells from control water, Cyprinus carpio
from both site 1 and site 2 contained 11.0±1.0 cells and 13.0±1.0 cells and contained
5.0±1.0 cells from Warsak dam and Ompok bimaculatus from sites 1 and 2 contained
8.6±1.5 cells and 12.3±0.5 cells and contained 6.0±1.0 cells from site 3 respectively.
The order of comet class 1 in this tissue of different fish species was Cyprinus
carpio>Ompok bimaculatus>Aorichthys seenghala>Wallago attu >Labeo dyocheilus.
This indictes that comet class 1 was highest in Cyprinus carpio and lowest in Labeo
dyocheilus. This result for comet class 1 was higher than the previous findings
reported by Nehls and Segner (2005) and Huong et al (2012). Greater degree of comet
class 1 in Cyprinus carpio could be attributed to high concentration of heavy metals in
this fish. This fish has exposed to heavy metals for long period. This is also the target
organ that is directly exposed to water pollution. Skin came on third no for DNA
damage after intestine and blood.
Skin of Wallago attu from polluted sites showed highest level of comet class 2
with mean values of 7.3±1.5 cells and 11.6±0.5 cells and showed lowest mean value
of 3.0±1.0 cells from Warsak dam (control), Aorichthys seenghala from sites 1 and 2
showed 10.0±1.0 cells and 13.3±0.5 cells and showed 4.0±1.0 cells from site 3, Labeo
dyocheilus from polluted sites showed 8.6±1.5 cells and 12.6±0.5 cells and showed
3.0±1.0 cells from control site, Cyprinus carpio from polluted sites 1 and 2 showed
13.0±1.0 cells and 15.6±1.1 cells and showed 4.0±1.0 cells from control site and
Ompok bimaculatus from polluted water showed 12.0±1.0 cells and 15.6±0.5 cells
and showed 5.0±1.0 cells from control water respectively. The sequence of comet
class 2 in this organ of different fish species was Cyprinus carpio>Ompok
bimaculatus>Aorichthys seenghala>Labeo dyocheilus>Wallago attu. This shows that
Cyprinus carpio was having higher degree of comet class 2 and Wallago attu was

215
having lower comet class 2 respectively. This result found greater frequency of comet
class 2 than reported in the previous findings by Ali et al (2009) and Al- Sabti and
Metcalfe (1995a). In the present study frequency of comet class 2 was higher
significantly in skin from polluted sites as compare to Warsak dam. On the other hand
skin showed higher frequency of comet class 2 than liver, muscle and gills and lower
frequency than intestine and blood.
Comet class 3 in skin of Wallago attu from site 1 and site 2 were 17.6±1.5
cells and 21.0±2.0 cells and was 2.0±1.0 cells from site 3, in Aorichthys seenghala
from polluted water were 23.0±1.0 cells and 25.0±1.0 cells and was 3.0±1.0 cells
from control water, in Labeo dyocheilus from polluted sites were 21.0±1.0 cell and
24.0±1.0 cell and was 3.0±1.0 cells from control site, in Cyprinus carpio from site 1
and site 2 were 26.3±1.5 cells and 30.0±1.0 cells and was 4.0±1.0 cells from site 3
and in Ompok bimaculatus from polluted sites were 25.0±1.0 cells and 28.0±1.0 cells
and was 4.0±1.0 cells from Warsak dam respectively. These results were in agreement
with the study of Chipman (1998). The order of comet class 3 in the studied fish was
Cyprinus carpio>Ompok bimaculatus>Aorichthys seenghala>Labeo dyocheilus >
Wallago attu. This indicates that Cyprinus carpio had greater degree of comet class 3
and Wallago attu had smaller respectively. This is because of heavy metals
accumulation in this fish, which induced greater degree of comet class 3 in this fish.
Skin of Wallago attu from both polluted sites 1 and 2 had greater degree of
comet class 4 with mean values of 19.6±1.5 cells and 23.0±1.0 cells and had 2.0±1.0
cells from Warsak dam, Aorichthys seenghala from polluted sites had 26.0±1.0 cells
and 28.0±1.0 cells and had 3.0±1.0 cells from control site, Labeo dyocheilus from
polluted water had 24.0±1.0 cells and 27.0±1.0 cells and had 2.0±1.0 cells from
control water, Cyprinus carpio from polluted sites had 29.6±1.5 cells and 32.0±1.0
cells and had 4.6±0.5 cells from reference site and Ompok bimaculatus from both
sites 1 and 2 had 27.3±1.5 cells and 30.3±0.5 cells and had 3.0±1.0 cells from site 3

216
respectively. The comet class 4 in skin of these fish was in the order of Cyprinus
carpio > Ompok bimaculatus > Aorichthys seenghala > Labeo dyocheilus > Wallago
attu. Cyprinus carpio was found to be contained high degree of comet class 4 and
Wallago attu low degree of comet class 4. The values for comet class 4 were higher
than the previous findings reported by Gertraud et al (2007). Comparing the present
result with the findings of previous studies indicates that heavy metals are genotoxic
in nature and indunce DNA damage cells in the aquatic and terrestrial animals.
Skin of Wallago attu from both polluted sites 1 and 2 showed maximum
frequency of TCS with mean values of 152.3±4.5 cells and 187.0±10.1 cells and
showed minimum degree of TCS with mean value of 23.0±8.6 cells from control site,
Aorichthys seenghala from polluted water showed 200.0±10.0 cells and 225.0±8.5
cells and showed 32.6±8.7 cells from Warsak dam, Labeo dyocheilus from sites 1 and
2 showed 182.3±9.7 cells and 215.0±6.9 cells and showed 27.0±8.8 cells from
reference site, Cyprinus carpio from polluted sites showed 233.6±13.5 cells and
262.3±10.0 cells and showed 43.6±3.7 cells from Warsak dam and Ompok
bimaculatus from both sites 1 and 2 showed 217.0±12.5 cells and 249.0±6.5 cells and
showed 40.0±9.1 cells from site 3 respectively. The order of TCS in skin of different
fish species was Cyprinus carpio>Ompok bimaculatus>Aorichthys seenghala>Labeo
dyocheilus>Wallago attu. Overall order of comet classes in skin was class 4 > class
3> class 0> class 2> class 1 and TCS in different fish species was in the order of
Cyprinus carpio > Ompok bimaculatus > Aorichthys seenghala > Labeo dyocheilus >
Wallago attu. This shows that TCS was higher in Cyprinus carpio and lower in
Wallago attu. In this finding degree of DNA damage cells was higher than those
reported by Yingmei et al (2006) and Gertraud et al (2007). In the present study
generally frequency of DNA damage cells was higher significantly in skin from
polluted sites as compare to Warsak dam. On the other hand skin cells showed higher
degree of DNA damage cells than liver, muscle and gills and lower frequency than
intestine and blood. The greater frequency of DNA damage cells in skin could be

217
attributed to more heavy metals accumulation in this tissue. The skin is laso the prime
target organ like the gills that is exposed directly and constantly to heavy metals in
water. Skin came third for degree of DNA damage after intestine and blood tissues.
Skin showed less DNA damage cells than intestine and blood and more than liver,
gills and muscle when overall comparison is made. The skin is also acting as
protective layer against external agents and other chemicals. Therefore it had less
degree of DNA damage cells as compare to intestine and blood. Overall order of
DNA damage in different fish species was Cyprinus carpio > Ompok bimaculatus >
Aorichthys seenghala > Labeo dyocheilus > Wallago attu. Overall trend of comet
classes in the skin was class 4 > class 3> class 0> class 2> class 1.
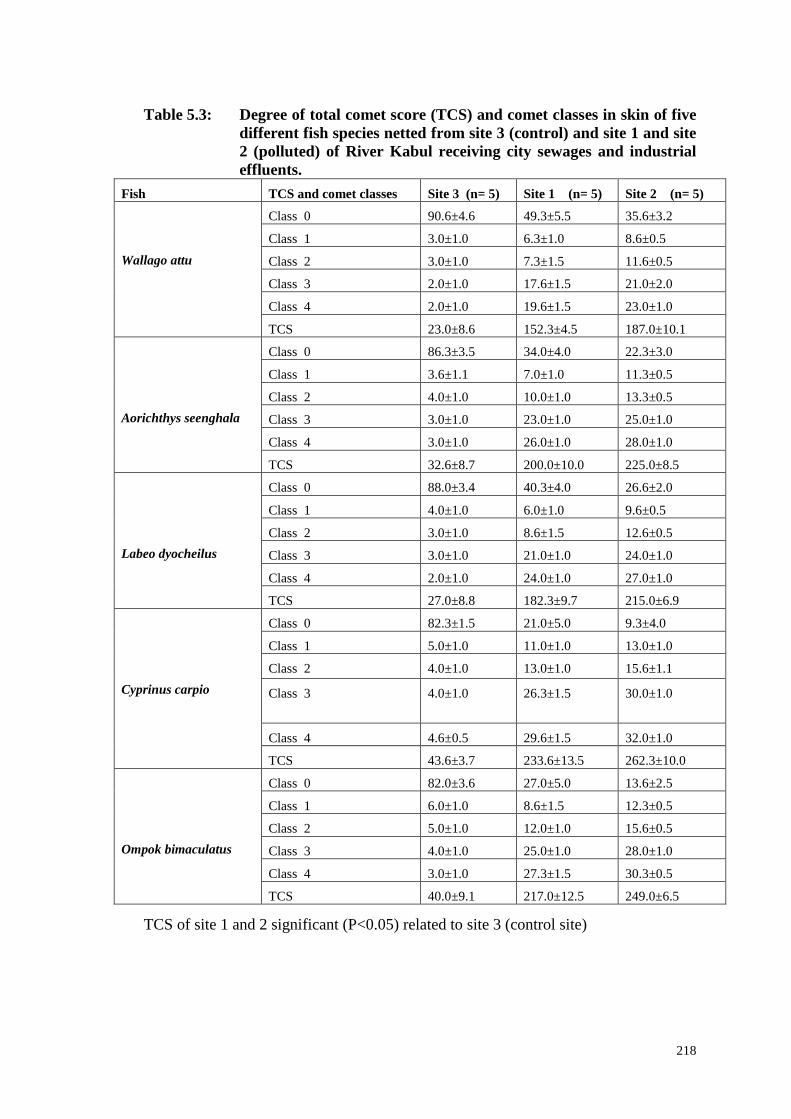
218
Table 5.3: Degree of total comet score (TCS) and comet classes in skin of five
different fish species netted from site 3 (control) and site 1 and site
2 (polluted) of River Kabul receiving city sewages and industrial
effluents.
Fish TCS and comet classes Site 3 (n= 5) Site 1 (n= 5) Site 2 (n= 5)
Wallago attu
Class 0 90.6±4.6 49.3±5.5 35.6±3.2
Class 1 3.0±1.0 6.3±1.0 8.6±0.5
Class 2 3.0±1.0 7.3±1.5 11.6±0.5
Class 3 2.0±1.0 17.6±1.5 21.0±2.0
Class 4 2.0±1.0 19.6±1.5 23.0±1.0
TCS 23.0±8.6 152.3±4.5 187.0±10.1
Aorichthys seenghala
Class 0 86.3±3.5 34.0±4.0 22.3±3.0
Class 1 3.6±1.1 7.0±1.0 11.3±0.5
Class 2 4.0±1.0 10.0±1.0 13.3±0.5
Class 3 3.0±1.0 23.0±1.0 25.0±1.0
Class 4 3.0±1.0 26.0±1.0 28.0±1.0
TCS 32.6±8.7 200.0±10.0 225.0±8.5
Labeo dyocheilus
Class 0 88.0±3.4 40.3±4.0 26.6±2.0
Class 1 4.0±1.0 6.0±1.0 9.6±0.5
Class 2 3.0±1.0 8.6±1.5 12.6±0.5
Class 3 3.0±1.0 21.0±1.0 24.0±1.0
Class 4 2.0±1.0 24.0±1.0 27.0±1.0
TCS 27.0±8.8 182.3±9.7 215.0±6.9
Cyprinus carpio
Class 0 82.3±1.5 21.0±5.0 9.3±4.0
Class 1 5.0±1.0 11.0±1.0 13.0±1.0
Class 2 4.0±1.0 13.0±1.0 15.6±1.1
Class 3 4.0±1.0 26.3±1.5 30.0±1.0
Class 4 4.6±0.5 29.6±1.5 32.0±1.0
TCS 43.6±3.7 233.6±13.5 262.3±10.0
Ompok bimaculatus
Class 0 82.0±3.6 27.0±5.0 13.6±2.5
Class 1 6.0±1.0 8.6±1.5 12.3±0.5
Class 2 5.0±1.0 12.0±1.0 15.6±0.5
Class 3 4.0±1.0 25.0±1.0 28.0±1.0
Class 4 3.0±1.0 27.3±1.5 30.3±0.5
TCS 40.0±9.1 217.0±12.5 249.0±6.5
TCS of site 1 and 2 significant (P<0.05) related to site 3 (control site)
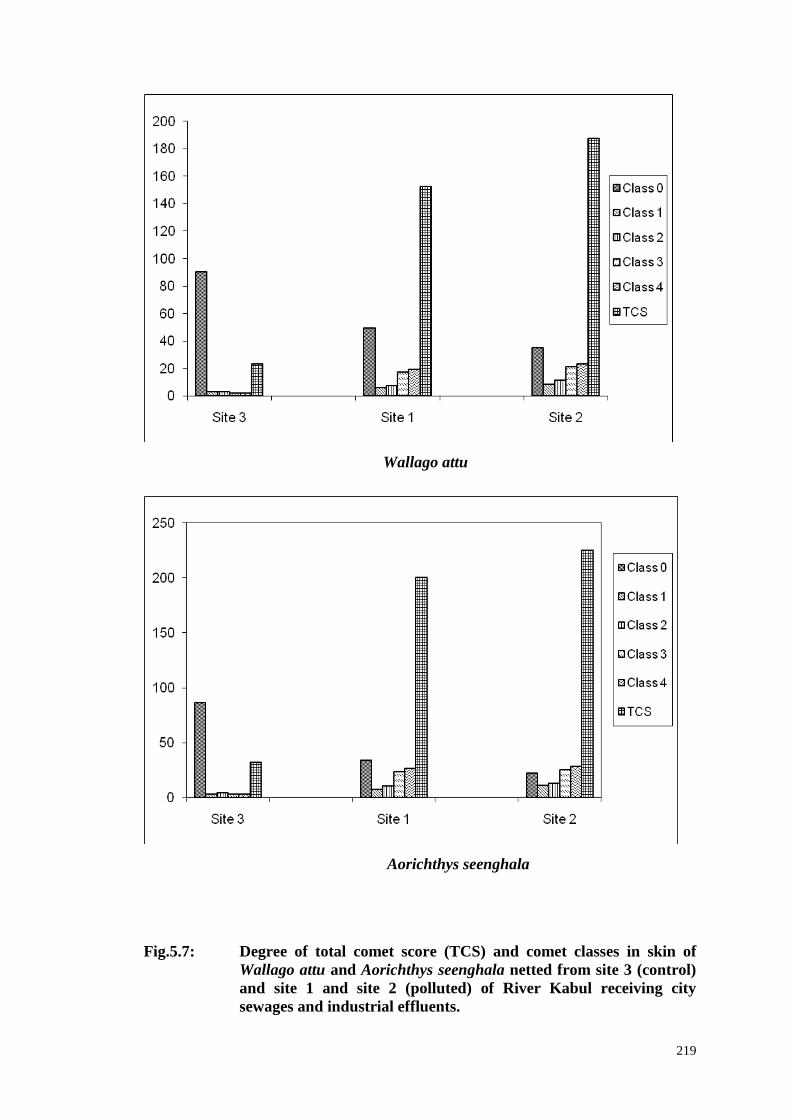
219
Wallago attu
Aorichthys seenghala
Fig.5.7: Degree of total comet score (TCS) and comet classes in skin of
Wallago attu and Aorichthys seenghala netted from site 3 (control)
and site 1 and site 2 (polluted) of River Kabul receiving city
sewages and industrial effluents.

220
Labeo dyocheilus
Cyprinus carpio
Fig.5.8: Degree of total comet score (TCS) and comet classes in skin of
Labeo dyocheilus and Cyprinus carpio netted from site 3 (control)
and site 1 and site 2 (polluted)of River Kabul receiving city
sewages and industrial effluents.

221
Ompok bimaculatus
Fig.5.9: Degree of total comet score (TCS) and comet classes in gills of
Ompok bimaculatus and netted from site 3 (control) and site 1 and
site 2 (polluted) of River Kabul receiving city sewages and
industrial effluents
222
5.3.4 TCS and Comet Classes in Intestine
Intestine of selected fish species from polluted water and Warsak dam was
processed for determination of degree of DNA damage due to accumulation of heavy
metals such as Zn, Ni, Cr, Cu, Cd, Pb, Fe, Mn and Hg in it. Total comet score (TCS)
and comet classes like class 0, class 1, class 2, class 3 and class 4 were found in this
organ and compared with control fish species from Warsak dam. Intestine of the
examined fish species from polluted sites 1 and 2 showed higher degree of TCS and
comet classes as compare to control site besides comet class 0, where the lowest
values of comet class 0 were found in intestine from reference site (Table 5.4 and Figs
5.10-5.12).
From amongst comet classes, intestine of Wallago attu from polluted sites had
less degree of comet class 0 with mean values of 48.3±37 cells and 35.0±4.0 cells and
had more frequency of comet class 0 with mean value of 86.6±3.7 from control site,
Aorichthys seenghala from polluted water had 29.0±3.6 cells and 16.6±4.1cells and
had 80.0±3.4 cells from reference water, Labeo dyocheilus from polluted sites had
39.0±3.6 cells and 27.0±4.0 cells and had 84.0±2.6 cells from Warsak dam, Cyprinus
carpio from site 1 and site 2 had 13.0±3.6 cells and 7.3±5.0 cells and had 72.0±4.0
cells from reference site 3 and Ompok bimaculatus from both sites 1 and 2 had
20.0±3.5 cells and 12.0±3.6 cells and had 76.0±4.0 cells from control site
respectively. Comet class 0 in this tissue of different fish species was in the order of
Wallago attu > Labeo dyocheilus > Aorichthys seenghala > Ompok bimaculatus >
Cyprinus carpio. This highlights that more comet class 0 was observed in Wallago
attu and less in Cyprinus carpio. These results are agreed with the findings of
(Obiakor et al., 2014; Theodora is et al., 1994), who have also found the same values
for comet class 0 in the intestine of other fish species.
Comet class 1 in intestine of Wallago attu from polluted water were 4.0±1.0
cells and 7.0±1.0 cells and was 4.0±1.0 cells from control water, in Aorichthys
223
seenghala from polluted sites were 8.0±1.0 cells and 11.0±1.0 cells and was 6.0±1.0
cells from control site, in Labeo dyocheilus from site 1 and 2 were 5.3±0.5 cells and
9.0±1.0 cells and was 5.0±1.0 cells from site 3, in Cyprinus carpio from polluted sites
were 11.3±0.5 cells and 13.0±1.0 cells and was 8.0±1.0 cells from reference site 3 and
in Ompok bimaculatus from polluted water were 9.6±0.5 cells and 12.0±1.0 cells and
was 7.0±1.0 cells from control site respectively. The sequence of comet class 1 in this
organ of different studied fish was Cyprinus carpio>Ompok bimaculatus > Aorichthys
seenghala>Labeo dyocheilus>Wallago attu. This indicates that Cyprinus carpio had
greater frequency of comet class 1 and Wallago attu had smaller frequency
respectively. In the present finding the values for comet class 1 were lower as
compare to the values mentioned by (Nevenka et al., 2008). In this study intestine
from polluted water showed high degree of comet class 1 than control water. This
could be related to greater concentration of heavy metals in this organ at polluted sites
and less detoxification mechanism against metals.
Intestine of Wallago attu from polluted water contained greater degree of
comet 2 with mean values of 6.6±1.0 cells and 10.0±1.0 cells and contained smaller
mean value of 3.3±1.5 cells from control water, Aorichthys seenghala from polluted
sites contained 11.0±1.0 cells and 14.0±1.0 cells and contained 5.0±1.0 cells from
control site 3, Labeo dyocheilus from both sites 1 and 2 contained 9.0±1.0 cells and
12.0±1.0 cells and contained 4.0±1.0 cells from reference site 3, Cyprinus carpio from
site 1 and site 2 contained 15.3±0.5 cells and 17.0±1.0 cells and contained 7.0±1.0
cells from Warsak dam and Ompok bimaculatus from polluted sites contained
13.0±1.0 cells and 15.0±1.0 cells and contained 6.0±1.0 cells from control site
respectively. The order of comet class 2 in intestine of these fish was Cyprinus
carpio>Ompok bimaculatus>Aorichthys seenghala>Labeo dyocheilus>Wallago attu.
This trend shows that Cyprinus carpio had greater frequency of comet class 2 and
Wallago attu had smaller. The data for comet class 2 was higher than those reported
by Kurelec (1993) and Pandrangi et al (1995). This study found highest degree of

224
comet class 2 in intestine of examined fish species from polluted water than those
from control water. The present study reveles that heavy metals are genotoxic in
nature and indunce genotoxicity in aquatic animals. The result also showed heavy
metals pollution in the study areas.
Intestine of Wallago attu from polluted sites 1 and 2 had high degree of comet
class 3 with mean values of 21.0±1.0 cells and 25.0±1.0 cells and had low mean value
of 3.0±1.0 cells from Warsak dam, Aorichthys seenghala from polluted sites had
25.0±1.0 cells and 28.0±1.0 cells and had 4.0±1.0 cells from control site, Labeo
dyocheilus from polluted water had 22.0±1.0 cells and 25.0±1.0 cells and had 3.0±1.0
cells from control water, Cyprinus carpio from polluted site 1 and site 2 had 29.0±1.0
cells and 30.0±1.0 cells and had 6.0±1.0 cells from reference site 3 and Ompok
bimaculatus from polluted sites had 27.0±1.5 cells and 29.0±1.0 cells and had 5.0±1.0
cells from control site respectively. Comet class 3 in this organ of different fish was in
the order of Cyprinus carpio > Ompok bimaculatus > Aorichthys seenghala > Labeo
dyocheilus > Wallago attu. Greater degree of comet class 3 was observed in Cyprinus
carpio and lower in Wallago attu. In this study more values of comet class 3 were
observed than those reported by Villarini et al (1998) and Tice (1995) in intestine of
other fish species. In this study the degree of comet class 3 in intestine of different
examined fish from polluted sites was higher than the control site. This could be
attributed to high contents of heavy metals in this organ from polluted water.
Comet class 4 in intestine of Wallago attu from both polluted sites 1 and 2
were 21.0±1.0 cells and 25.0±1.0 cells and was 3.0±1.0 cells from control site 3
(Warsak dam), in Aorichthys seenghala from polluted water were 27.0±1.0 cells and
30.3±1.5 cells and was 5.0±1.0 cells from control water, in Labeo dyocheilus from
polluted sites were 24.0±1.0 cells and 27.0±1.0 cells and was 4.0±1.0 cells from
control site, in Cyprinus carpio from polluted water were 31.3±1.5 cells and 32.3±1.5
cells and was 7.0±1.0 cells from Warsak dam and in Ompok bimaculatus from both
225
polluted sites 1 and 2 were 29.0±1.5 cells and 32.0±1.0 cells and was 6.0±1.0 cells
from reference site respectively. Comet class 4 in intestine of these studied fish was in
the order of Cyprinus carpio > Ompok bimaculatus > Aorichthys seenghala > Labeo
dyocheilus > Wallago attu. This indicates that comet class 4 was highest in Cyprinus
carpio and lowest in Wallago attu. These results were higher than those reported by
(Wilson et al., 1998; Belpaeme et al., 1996). In this finding the examined fish species
from polluted water showed greater frequency of comet class 4 as compare to control
water. This is because of higher concentration of heavy metals in this fish and in
water of River Kabul.
Total comet score (TCS) in intestine of Wallago attu from polluted water were
161.3±9.2 cells and 196.0±10.0 cells and was 31.0±9.4 cells from control site, in
Aorichthys seenghala from site 1 and 2 were 215.3±6.8 cells and 247.6±8.3 cells and
was 48.0±8.6 cells from site 3, in Labeo dyocheilus from polluted sites were
186.0±8.7 cells and 216.0±10.0 cells and was 38.0±7.0 cells from Warsak dam, in
Cyprinus carpio from polluted sites were 253.3±10.6 cells and 266.3±12.0 cells and
was 68.0±10.1 cells from control site and in Ompok bimaculatus from site 1 and site 2
were 238.6±6.4 cells and 257.0±8.7 cells and was 58.0±10.0 cells from site 3
respectively. TCS values showed a trend of Cyprinus carpio>Ompok bimaculatus >
Aorichthys seenghala>Labeo dyocheilus>Wallago attu. This indicates that Cyprinus
carpio had maximum degree of TCS and Wallago attu had minimum degree of TCS.
The results of the present study are not consistent with the previous findings reported
by (Cotelle and Erard, 1999; Tolga, 2008). Intestine came first for degree of DNA
damage cells followed by blood, skin, liver, gills and muscle. The present study found
significantly higher degree of DNA damage cells in intestine than the control sample.
This could be attributed to high metal accumulation and less detoxification
mechanism of this tissue and the results also showed that heavy metals are toxic in
nature and can induce genotoxicity in different tissues and organs of both aquatic and
terrestrial animals, which are in agreement with the past findings (Mitchelmore and

226
Chipman, 1998; Maruya, 20000; Kim et al., 2000). High frequency of DNA damage
cells in this organ may vary according to the season, kind of pollution involved and
the species of fish. The result also showed heavy metals pollution in River Kabul.
Overall sequence of DNA damage in different fish species was Cyprinus carpio >
Ompok bimaculatus > Aorichthys seenghala > Labeo dyocheilus > Wallago attu.
Overall trend of comet classes in intestine was class 4 > class 3> class 0> class 2>
class 1.

227
Table 5.4: Degree of total comet score (TCS) and comet classes in intestine of
five different fish species netted from site 3 (control) and site 1 and
site 2 (polluted) of River Kabul receiving city sewages and
industrial effluents.
Fish TCS and comet classes Site 3 (n= 5) Site 1 (n= 5) Site 2 (n= 5)
Wallago attu
Class 0 86.6±3.7 48.3±37 35.0±4.0
Class 1 4.0±1.0 4.0±1.0 7.0±1.0
Class 2 3.3±1.5 6.6±1.0 10.0±1.0
Class 3 3.0±1.0 21.0±1.0 25.0±1.0
Class 4 3.0±1.0 21.0±1.0 25.0±1.0
TCS 31.0±9.4 161.3±9.2 196.0±10.0
Aorichthys seenghala
Class 0 80.0±3.4 29.0±3.6 16.6±4.1
Class 1 6.0±1.0 8.0±1.0 11.0±1.0
Class 2 5.0±1.0 11.0±1.0 14.0±1.0
Class 3 4.0±1.0 25.0±1.0 28.0±1.0
Class 4 5.0±1.0 27.0±1.0 30.3±1.5
TCS 48.0±8.6 215.3±6.8 247.6±8.3
Labeo dyocheilus
Class 0 84.0±2.6 39.0±3.6 27.0±4.0
Class 1 5.0±1.0 5.3±0.5 9.0±1.0
Class 2 4.0±1.0 9.0±1.0 12.0±1.0
Class 3 3.0±1.0 22.0±1.0 25.0±1.0
Class 4 4.0±1.0 24.0±1.0 27.0±1.0
TCS 38.0±7.0 186.0±8.7 216.0±10.0
Cyprinus carpio
Class 0 72.0±4.0 13.0±3.6 7.3±5.0
Class 1 8.0±1.0 11.3±0.5 13.0±1.0
Class 2 7.0±1.0 15.3±0.5 17.0±1.0
Class 3 6.0±1.0 29.0±1.0 30.0±1.0
Class 4 7.0±1.0 31.3±1.5 32.3±1.5
TCS 68.0±10.1 253.3±10.6 266.3±12.0
Ompok bimaculatus
Class 0 76.0±4.0 20.0±3.5 12.0±3.6
Class 1 7.0±1.0 9.6±0.5 12.0±1.0
Class 2 6.0±1.0 13.0±1.0 15.0±1.0
Class 3 5.0±1.0 27.0±1.5 29.0±1.0
Class 4 6.0±1.0 29.0±1.5 32.0±1.0
TCS 58.0±10.0 238.6±6.4 257.0±8.7
TCS of site 1 and 2 significant (P<0.05) related to site 3 (control site)

228
Wallago attu
Aorichthys seenghala
Fig. 5.10: Degree of total comet score (TCS) and comet classes in intestine of
Wallago attu and Aorichthys seenghala netted from site 3 (control)
and site 1 and site 2 (polluted) of River Kabul receiving city
sewages and industrial effluents.

229
Labeo dyocheilus
Cyprinus carpio
Fig. 5.11: Degree of total comet score (TCS) and comet classes in intestine of
Labeo dyocheilus and Cyprinus carpio netted from site 3 (control)
and site 1 and site 2 (polluted) of River Kabul receiving city
sewages and industrial effluents.

230
Ompok bimaculatus
Fig. 5.12: Degree of total comet score (TCS) and comet classes in intestine of
Ompok bimaculatus netted from site 3 (control) and site 1 and site 2
(polluted) of River Kabul receiving city sewages and industrial
effluents.

231
5.3.5 TCS and Comet Classes in Liver
All the investigated total comet score (TCS) and comet classes including class
1, class 2, class 3 and class 4 in liver of different fish species from polluted water
showed increasing tendency as when compare with control water besides class 0,
which showed lowest value at sites 1and 2 and highest value from control site 3. The
possible reason for this tremendous increase of comet classes and total comet score in
fish tissue could be correlated to highest concentration of heavy metals in tissues and
also high level in the water of polluted sites 1 and 2(Table 5.5 and Figs 5.13-5.15).
Liver of Wallago attu from polluted water showed lowest frequency of comet
class 0 with mean values of 53.0±4.3 cells and 42.0±4.5 cells and showed highest
frequency with mean value of 92.0±5.0 cells from control site, Aorichthys seenghala
from both sites 1 and 2 showed 37.6±4.1 cells and 27.3±3.0 cells and showed
89.6±3.0 cells from control site, Labeo dyocheilus from polluted sites showed
44.0±4.5 cells and 31.3±2.8 cells and 92.0±3.6 cells from Warsak dam, Cyprinus
carpio from polluted sites 1 and 2 showed 33.0±5.5 cells and 20.3±3.7 cells and
showed 87.6±2.0 cells from reference site 3 and Ompok bimaculatus from polluted
sites showed 33.0±5.5 cells and 20.3±3.7 cells and showed 87.6±2.0 cells from
control site respectively. The frequency of comet class 0 in liver of studied fish was in
the order of Wallago attu > Labeo dyocheilus > Cyprinus carpio > Ompok
bimaculatus > Aorichthys seenghala. This indicates that comet class 0 was greatest in
Wallago attu and smallest in Aorichthys seenghala. These results were higher than
those reported previously (Jenssen and Ramel, 1980; Latt and Allen, 1977). All the
fish from control site showed greater degree of comet class 0 as compare to polluted
sites 1 and 2. This could be attributed to less heavy metals pollution at control site.
Liver of Wallago attu from polluted sites contained greater degree of comet
class 1 with mean values of 6.0±1.0 cells and 8.3±4.5 cells and contained smaller
frequency of 3.0±1.0 cells from control site, Aorichthys seenghala from sites 1 and 2

232
contained 8.0±1.0 cells and 10.0±1.5 cells and contained 3.3±0.5 cells from site 3,
Labeo dyocheilus from polluted water contained 7.3±0.5 cells and 9.3±0.5 cells and
contained 3.0±1.0 cells from control water, Cyprinus carpio from both sites 1 and 2
contained 9.6±1.5 cells and 12.3±0.5 cells and contained 5.0±1.0 cells from site 3 and
Ompok bimaculatus from polluted sites contained 8.0±1.0 cells and 11.3±0.5cells and
contained 4.0±1.0 cells from control site respectively. The order of comet class 1 in
liver of these fish species was Cyprinus carpio>Ompok bimaculatus>Aorichthys
seenghala>Labeo dyocheilus>Wallago attu. This shows that comet class 1 was
highest in Cyprinus carpio and lowest in Wallago attu. This is related to greater
content of heavy metals in this fish. These results were higher than the findings of
Grisolia (2002) and Al-Sabit (1994). Liver of examined fish species from polluted
water had higher frequency of comet class 1 as compare to those from reference site.
This could be correlated to greater concentration of heavy metals in this organ and our
data also showed heavy metals pollution in River Kabul.
Liver of Wallago attu from polluted water had more comet class 2 with mean
values of 6.3±1.5 cells and 9.0±1.0 cells and had less value of 2.0±1.0 cells from
control water, Aorichthys seenghala from polluted sites 1 and 2 had 10.0±1.0 cells
and 13.6±0.5 cells and had 3.0±1.0 cells from control site 3, Labeo dyocheilus from
polluted sites had 8.0±1.0 cells and 12.3±0.5 cells and had 2.0±1.0 cells from control
site, Cyprinus carpio from site 1 and site 2 had 11.6±1.5 cells and 15.0±1.0 cells and
had 4.0±1.0 cells from site 3 and Ompok bimaculatus from polluted water had high
mean values of 10.3±1.5 cells and 14.3±0.5 cells and had 3.3±0.5 cells from control
water respectively. The sequence of comet class 2 in this organ of different studied
fish was Cyprinus carpio > Ompok bimaculatus > Aorichthys seenghala > Labeo
dyocheilus > Wallago attu.This highlights that Cyprinus carpio is having highest
frequency of comet class 1 and Wallago attu had lowest degree of comet class 2. This
data in our finding was greater than those reported in previous studies (De Flora et al.,
1991; Bhaskaran et al., 1999). Liver of the studied fish species from polluted area of
233
River Kabul showed greater level of comet class 2 than those from Warsak dam. This
is because of greater level of heavy metals in liver and this result also showed heavy
metals pollution in study area of River Kabul.
Comet class 3 in liver of Wallago attu from site 1 and site 2 samples were
17.0±1.0 cells and 19.3±1.5 cells and was 1.3±1.5 cells from site 3, in Aorichthys
seenghala from polluted sites were 22.0±1.0 cells and 24.0±1.0 cells and was 2.0±1.0
cells from control site, in Labeo dyocheilus from polluted water were 19.3±1.5 cells
and 23.0±1.0 cells and was 2.0±1.0 cells from control water, in Cyprinus carpio from
both site 1 and site 2 were 24.6±1.5 cells and 27.3±1.5 cells and was 4.0±1.0 cell
from site 3 and in Ompok bimaculatus from polluted sites were 23.3±1.5 cells and
26.0±1.7 cells and was 3.0±1.0 cells from Warsak dam respectively. The order of
comet class 3 in liver of different studied fish was Cyprinus carpio>Ompok
bimaculatus > Aorichthys seenghala >Labeo dyocheilus >Wallago attu. This trend
shows that Cyprinus carpio had maximum and Wallago attu had minimum degree of
comet class 3. These results are in agreement with those observed by many
investigators in previous studies (Maccubin et al., 1991; Kurelec, 1993), who have
also investigated the same result in the same tissue of other fish species.
Liver of Wallago attu from polluted sites had maximum degree of comet class
4 with mean values of 17.6±1.5 cells and 21.3±1.5 cells and had minimum frequency
with mean value of 1.6±1.5 cells from control site, Aorichthys seenghala from
polluted sites 1 and 2 had 22.3±1.5 cells and 25.0±1.0 cells and had 2.0±1.0 cells from
control site, Labeo dyocheilus from both polluted sites had 21.3±1.5 cells and
24.0±1.0 cells and had 1.0±1.0 cells from reference site, Cyprinus carpio from
polluted sites had 27.0±2.0 cells and 30.0±1.0 cells and had 3.6±1.1 cells from
Warsak dam and Ompok bimaculatus from polluted water had 25.3±1.5 cells and
28.0±1.0 cells and had 2.0±1.0 cells from site 3 respectively. The sequence of comet
class 4 in this organ of different examined fish was Cyprinus carpio > Ompok
234
bimaculatus > Aorichthys seenghala > Labeo dyocheilus > Wallago attu. This
reveales that Cyprinus carpio contained high degree of comet class 4 and Wallago
attu contained low degree. These results were lower than those reported in past
studies (Barry, 1992; Richard et al., 2003; Omaret al., 2012). In this study comet class
4 in liver of different examined fish species was higher than the reference site. This
could be attributed to greater content and toxicity of heavy metals in this tissue.
Liver of Wallago attu from both sites 1 and 2 had maximum frequency of total
comet score (TCS) with mean values of 140.3±11.3 cells and 169.6±13.2 cells and
had minimum degree of TCS with mean value of 17.6±13.5 cells from site 3,
Aorichthys seenghala from polluted water had 183.3±11.6 cells and 209.3±8.0 cells
and had 23.3±8.1 cells from Warsak dam, Labeo dyocheilus from polluted sites had
166.6±13.2 cells and 199.0±7.8 cells and had 17.0±9.1 cells from control site 3,
Cyprinus carpio from polluted sites had 215.0±17.0 cells and 244.3±11.0 cells and
had 39.6±7.3 cells from Warsak dam and Ompok bimaculatus from polluted site 1 and
site 2 had 200.0±14.7 cells and 230.0±10.5 cells and had 27.6±6.6 cells from control
water respectively. The order of TCS in intestine of these studied fish was Cyprinus
carpio>Ompok bimaculatus>Aorichthys seenghala>Labeo dyocheilus > Wallago attu.
This trend indicates that Cyprinus carpio contained maximum and Wallago attu
minimum frequency of TCS. This study found more TCS as compare to the previous
findings (Ali et al., 2000; Cavas et al., 2005). In this study generally frequency of
DNA damage cells were higher significantly in liver from polluted sites as compare to
Warsak dam. On the other hand liver showed higher frequency of DNA damage cells
than muscle and gills and lower frequency than intestine, blood and skin when over
all comparisons is made. As compare to other studied organs liver came fourth after
intestine, blood and skin for DNA damage. Liver is the organ that playing a
significant role in detoxification of toxic chemicals. Therefore the liver showed less
DNA damage cells as compare to intestine, blood and skin. Overall order of DNA
damage in different fish species was Cyprinus carpio > Ompok bimaculatus >

235
Aorichthys seenghala >Labeo dyocheilus > Wallago attu and overall trend of comet
classes in liver was class 4 > class 3> class 0> class 2> class 1.

236
Table 5.5: Degree of total comet score (TCS) and comet classes in liver of five
different fish species netted from site 3 (control) and site 1 and site
2 (polluted) of River Kabul receiving city sewages and industrial
effluents.
Fish TCS and comet classes Site 3 (n= 5) Site 1 (n= 5) Site 2 (n= 5)
Wallago attu
Class 0 92.0±5.0 53.0±4.3 42.0±4.5
Class 1 3.0±1.0 6.0±1.0 8.3±4.5
Class 2 2.0±1.0 6.3±1.5 9.0±1.0
Class 3 1.3±1.5 17.0±1.0 19.3±1.5
Class 4 1.6±1.5 17.6±1.5 21.3±1.5
TCS 17.6±13.5 140.3±11.3 169.6±13.2
Aorichthys seenghala
Class 0 89.6±3.0 37.6±4.1 27.3±3.0
Class 1 3.3±0.5 8.0±1.0 10.0±1.5
Class 2 3.0±1.0 10.0±1.0 13.6±0.5
Class 3 2.0±1.0 22.0±1.0 24.0±1.0
Class 4 2.0±1.0 22.3±1.5 25.0±1.0
TCS 23.3±8.1 183.3±11.6 209.3±8.0
Labeo dyocheilus
Class 0 92.0±3.6 44.0±4.5 31.3±2.8
Class 1 3.0±1.0 7.3±0.5 9.3±0.5
Class 2 2.0±1.0 8.0±1.0 12.3±0.5
Class 3 2.0±1.0 19.3±1.5 23.0±1.0
Class 4 1.0±1.0 21.3±1.5 24.0±1.0
TCS 17.0±9.1 166.6±13.2 199.0±7.8
Cyprinus carpio
Class 0 83.3±2.8 27.0±6.5 15.3±4.0
Class 1 5.0±1.0 9.6±1.5 12.3±0.5
Class 2 4.0±1.0 11.6±1.5 15.0±1.0
Class 3 4.0±1.0 24.6±1.5 27.3±1.5
Class 4 3.6±1.1 27.0±2.0 30.0±1.0
TCS 39.6±7.3 215.0±17.0 244.3±11.0
Ompok bimaculatus
Class 0 87.6±2.0 33.0±5.5 20.3±3.7
Class 1 4.0±1.0 8.0±1.0 11.3±0.5
Class 2 3.3±0.5 10.3±1.5 14.3±0.5
Class 3 3.0±1.0 23.3±1.5 26.0±1.7
Class 4 2.0±1.0 25.3±1.5 28.0±1.0
TCS 27.6±6.6 200.0±14.7 230.0±10.5
TCS of site 1 and 2 significant (P<0.05) related to site 3 (control site)

237
Wallago attu
Aorichthys seenghala
Fig. 5.13: Degree of total comet score (TCS) and comet classes in liver of
Wallago attu and Aorichthys seenghala netted from site 3 (control)
and site 1 and site 2 (polluted) of River Kabul receiving city
sewages and industrial effluents.

238
Labeo dyocheilus
Cyprinus carpio
Fig. 5.14: Degree of total comet score (TCS) and comet classes in liver of
Labeo dyocheilus and Cyprinus carpio netted from site 3 (control)
and site 1 and site 2 (polluted) of River Kabul receiving city
sewages and industrial effluents.

239
Ompok bimaculatus
Fig. 5.15: Degree of total comet score (TCS) and comet classes in liver of
Ompok bimaculatus netted from site 3 (control) and site 1 and site 2
(polluted) of River Kabul receiving city sewages and industrial
effluents.
240
5.3.6 TCS and Comet Classes in Muscle
In the present study like blood, gills, skin, intestine and liver, the muscle of
different fish species from polluted sites also had significantly more degree of total
comet score (TCS) and comet classes like class 1, class 2, class 3 and class 4 as
compare with control fish from Warsak dam. Comet class 0 showed highest values at
control site 3 (Warsak dam) and lowest at polluted sites 1 and 2 (Table 5.6 and Figs
5.16-5.18).
Among the comet classes muscle of Wallago attu from polluted sites of River
Kabul showed smaller frequency of comet class 0 with mean values of 58.6±4.1 cells
and 50.6±4.5 cells and showed greater degree with mean value of 93.0±4.0 cells from
control site, Aorichthys seenghala from polluted water showed 49.6±4.1 cells and
36.0±3.6 cells and showed 89.0±3.6 cells from control water, Labeo dyocheilus from
sites 1 and 2 showed 54.6±4.1 cells and 42.6±3.2 cells and showed 90.0±5.0 cells
from site 3, Cyprinus carpio from site 1 and site 2 showed 33.6±5.8 cells and
25.3±3.0 cells and showed 86.0±3.4 cells from control site and Ompok bimaculatus
from both site 1 and site 2 showed 40.3±3.7 cells and 30.0±3.4 cells and showed
88.0±3.2 cells from control site 3 respectively. The order of comet class 0 in muscle
of these studied fish was Cyprinus carpio>Ompok bimaculatus>Aorichthys seenghala
>Labeo dyocheilus>Wallago attu.This shows that Cyprinus carpio had higher and
Wallago attu had lower degree of comet class 0. These results were in agreement with
the findings reported peviously (Espina and Weiss, 1995; Bolognesi et al., 1996). All
the examined fish species from polluted sites showed minimum comet class 0 as
compare to control site 3. This could be attributed to less accumulation of heavy
metals in muscle at control site 3.
Muscle of Wallago attu from polluted water had more comet class 1 with
mean values of 5.0±1.0 cells and 7.0±1.0 cells and had less comet class 1 with mean
value of 2.0±1.0 cells from control water, Aorichthys seenghala from polluted sites

241
had 7.0±1.0 cells and 9.0±1.0 cells and had 3.0±1.0 cells from control site, Labeo
dyocheilus from sites 1 and 2 had 6.0±1.0 cells and 8.0±1.0 cells and had 2.3±1.5
cells from site 3, Cyprinus carpio from site 1 and site 2 had 9.6±1.1 cells and
10.0±1.0 cells and had 4.0±1.0 cells from site 3 and Ompok bimaculatus from
polluted water had 9.0±1.0 cells and 10.3±0.5 cells and had 3.0±1.0 cells from control
water respectively.The sequence of comet class 1 in this organ of different fish
species was Cyprinus carpio > Ompok bimaculatus > Aorichthys seenghala > Labeo
dyocheilus > Wallago attu. This indicates that Cyprinus carpio was found to be
contained greater and Wallago attu smaller degree of comet class 1.These results are
consisted with those observed by many other investigators (Pruski and Dixon, 2002;
Pandrangi et al., 1995). The present investigation found more degree of comet class 1
in this tissue from polluted water as compare to control water. This study also
confirmed heavy metals pollution in the study area of River Kabul.
Muscle of Wallago attu from polluted water contained highest comet class 2
with mean values of 6.0±1.0 cells and 9.0±1.0 cells and contained lowest mean value
of 3.0±1.0 cells from control site, Aorichthys seenghala from sites 1 and 2 contained
9.0±1.0 cells and 12.0±1.0 cells and contained 3.0±1.0 cells from control site 3, Labeo
dyocheilus from polluted sites contained 6.3±1.5 cells and 10.0±1.0 cells and
contained 3.0±1.0 cells from control site, Cyprinus carpio from polluted water
contained 12.3±1.5 cells and 13.6±0.5 cells and contained 4.0±1.0 cells from control
site and Ompok bimaculatus from polluted sites contained 11.0±1.0 cells and 13.0±1.0
cells and contained 2.6±0.5 cells from control site respectively. The order of comet
class 2 in muscle of studied fish was Cyprinus carpio > Ompok bimaculatus >
Aorichthys seenghala > Labeo dyocheilus > Wallago attu. This trend shows that
Cyprinus carpio contained higher and Wallago attu had lower comet class 2.This
could be correlated to highest content of heavy metals in this fish. This finding found
more frequency of comet class 2 as compare to the findings reported by Wilson et al
(1998) and Belpaeme et al (1996). Muscle from polluted sites was found to be

242
contained high frequency of comet class 2 than those from control site. This could be
attributed to greater accumulation of heavy metals in this tissue and this result also
showed heavy metals pollution in the study area.
Greater mean values of comet class 3 in muscle of Wallago attu from polluted
water were 15.0±1.0 cells and 16.0±1.0 cells and smaller mean value was 1.0±1.0
cells from Warsak dam, in Aorichthys seenghala from polluted sites were 17.0±1.0
cells and 21.0±1.0 cells and was 3.0±1.0 cells from control site, in Labeo dyocheilus
from polluted sites 1 and 2 were 19.3±4.9 cells and 19.0±1.0 cells and was 2.6±1.5
cells from control site 3, in Cyprinus carpio from site 1 and site 2 were 23.0±2.0 cells
and 24.6±1.5 cells and was 3.0±1.0 cells from Warsak dam and in Ompok
bimaculatus from polluted water were 19.6±1.5 cells and 23.0±1.0 cells and was
3.0±1.0 cells from control site respectively. Sequence of comet class 3 in muscle of
different studied fish was Cyprinus carpio>Ompok bimaculatus>Labeo dyocheilus >
Aorichthys seenghala>Wallago attu. This order reveales that Cyprinus carpio showed
maximum and Wallago attu minimum degree of comet class 3. The greater degree of
comet class 3 in this fish could be attributed to heavy metals content in this fish. This
study found greater frequency of comet class 3 than those reported by Mitchelmore
and Chipman (1998), Maruya (2000) and Kim et al (2000). The present study found
more comet class 3 in muscle from polluted sites than those from control water. The
present finding confirmed that heavy metals are genotoxic in nature and can induce
genotoxicity in both aquatic and terrestrial animals.
Muscle of Wallago attu from both sites 1 and 2 showed more degree of comet
class 4 with mean values of 15.3±1.5 cells and 17.3±1.5 cells and showed less
frequency of comet class 4 with mean value of 1.0±1.0 cells from Warsak dam,
Aorichthys seenghala from polluted water showed 17.3±1.5 cells and 22.0±1.0 cells
and showed 2.0±1.0 cells from control water, Labeo dyocheilus from polluted sites
showed 17.0±1.0 cells and 20.3±0.5 cells and showed 2.0±1.0 cells from control site,

243
Cyprinus carpio from polluted sites showed 21.3±1.5 cells and 26.3±1.5 cells and
showed 3.0±1.0 cells from control site and Ompok bimaculatus from both polluted
sites 1 and 2 showed 20.0±1.0 cells and 23.6±1.5 cells and showed 3.0±1.0 cells from
site 3 respectively. Degree of comet class 4 in muscle of these studied fish was in the
order of Cyprinus carpio > Ompok bimaculatus > Aorichthys seenghala > Labeo
dyocheilus > Wallago attu. This highlights that Cyprinus carpio had more and
Wallago attu had less degree of comet class 4 respectively. This is because of more
heavy metals in this fish. The present result found more comet class 4 as compare to
previous findings (Richard et al., 2003; Lee and Steinert, 2003). This study showed
that comet class 4 was highest in muscle from polluted sites as compare to control
water. This is related to more heavy metals concentration in this tissue and the present
results also agree with the previous findings that heavy metals are genotoxic in nature.
Muscle of Wallago attu from polluted water had highest frequency of total
comet score (TCS) with mean values of 123.3±11.1 cells and 135.6±8.0 cells and had
lowest degree with mean value of 15.0±1.0 cells from control site, Aorichthys
seenghala from both sites 1 and 2 had 145.3±11.0 cells and 184.0±8.8 cells 2 and had
26.0±9.1 cells from site 3, Labeo dyocheilus from polluted sites had 134.6±10.5 cells
and 166.3±7.5 cells and had 24.3±12.0 cells from Warsak dam, Cyprinus carpio from
polluted water had 188.6±15.5 cells and 216.6±8.6 cells and had 33.0±8.7 cells from
control water and Ompok bimaculatus from sites 1 and 2 had greater degree of TCS
with mean values of 170.0±10.1 cells and 203.3±9.2 cells and had 29.3±8.0 cells
from site 3 respectively. Frequency of total comet score in this organ of different
examined fish species was in the trend of Cyprinus carpio>Ompok bimaculatus >
Aorichthys seenghala>Labeo dyocheilus>Wallago attu. This indicates that Cyprinus
carpio had greater and Wallago attu had smaller degree of TCS. This could be
correlated to higher concentration of heavy metals in Cyprinus carpio as compare to
Wallago attu. In this study the values of TCS were lower than those reported by Lee
et al (1999), Shugart et al (1992) and Steinert (1999). In this investigation muscle

244
came last one in number after gills that showed least frequency of DNA damage cells.
This could be correlated to less concentration of heavy metals in this tissue, high
metabolic rate and strong detoxification mechanism. The present result also showed
that River Kabul is a dirty river and the water and fish from the mentioned study area
are not suitable for drinking and consumption purpose for human beings because the
water and fish contained greater level of heavy metals that can induce different
abnormalities like genotoxicity in the human beings. Overall trend of DNA damage in
different fish species was Cyprinus carpio>Ompok bimaculatus>Aorichthys
seenghala>Labeo dyocheilus>Wallago attu. Overall order of comet classes in muscle
was class 0> class 4 >class 3> class 2> class 1 and overall trend of DNA damage cells
in different tissues was intestine >blood >skin >liver > gills > muscle.

245
Table 5.6: Degree of total comet score (TCS) and comet classes in muscle of
five different fish species netted from site 3 (control) and site 1 and
site 2 (polluted) of River Kabul receiving city sewages and
industrial effluents.
Fish TCS and comet classes Site 3 (n= 5) Site 1 (n= 5) Site 2 (n= 5)
Wallago attu
Class 0 93.0±4.0 58.6±4.1 50.6±4.5
Class 1 2.0±1.0 5.0±1.0 7.0±1.0
Class 2 3.0±1.0 6.0±1.0 9.0±1.0
Class 3 1.0±1.0 15.0±1.0 16.0±1.0
Class 4 1.0±1.0 15.3±1.5 17.3±1.5
TCS 15.0±1.0 123.3±11.1 135.6±8.0
Aorichthys seenghala
Class 0 89.0±3.6 49.6±4.1 36.0±3.6
Class 1 3.0±1.0 7.0±1.0 9.0±1.0
Class 2 3.0±1.0 9.0±1.0 12.0±1.0
Class 3 3.0±1.0 17.0±1.0 21.0±1.0
Class 4 2.0±1.0 17.3±1.5 22.0±1.0
TCS 26.0±9.1 145.3±11.0 184.0±8.8
Labeo dyocheilus
Class 0 90.0±5.0 54.6±4.1 42.6±3.2
Class 1 2.3±1.5 6.0±1.0 8.0±1.0
Class 2 3.0±1.0 6.3±1.5 10.0±1.0
Class 3 2.6±1.5 19.3±4.9 19.0±1.0
Class 4 2.0±1.0 17.0±1.0 20.3±0.5
TCS 24.3±12.0 134.6±10.5 166.3±7.5
Cyprinus carpio
Class 0 86.0±3.4 33.6±5.8 25.3±3.0
Class 1 4.0±1.0 9.6±1.1 10.0±1.0
Class 2 4.0±1.0 12.3±1.5 13.6±0.5
Class 3 3.0±1.0 23.0±2.0 24.6±1.5
Class 4 3.0±1.0 21.3±1.5 26.3±1.5
TCS 33.0±8.7 188.6±15.5 216.6±8.6
Ompok bimaculatus
Class 0 88.0±3.2 40.3±3.7 30.0±3.4
Class 1 3.0±1.0 9.0±1.0 10.3±0.5
Class 2 2.6±0.5 11.0±1.0 13.0±1.0
Class 3 3.0±1.0 19.6±1.5 23.0±1.0
Class 4 3.0±1.0 20.0±1.0 23.6±1.5
TCS 29.3±8.0 170.0±10.1 203.3±9.2
TCS of site 1 and 2 significant (P<0.05) related to site 3 (control site)

246
Wallago attu
Aorichthys seenghala
Fig. 5.16: Degree of total comet score (TCS) and comet classes in muscle of
Wallago attu and Aorichthys seenghala netted from site 3 (control)
and site 1 and site 2 (polluted) of River Kabul receiving city
sewages and industrial effluents.

247
Labeo dyocheilus
Cyprinus carpio
Fig. 5.17: Degree of total comet score (TCS) and comet classes in muscle of
Labeo dyocheilus and Cyprinus carpio netted from site 3 (control)
and site 1 and site 2 (polluted) of River Kabul receiving city
sewages and industrial effluents.
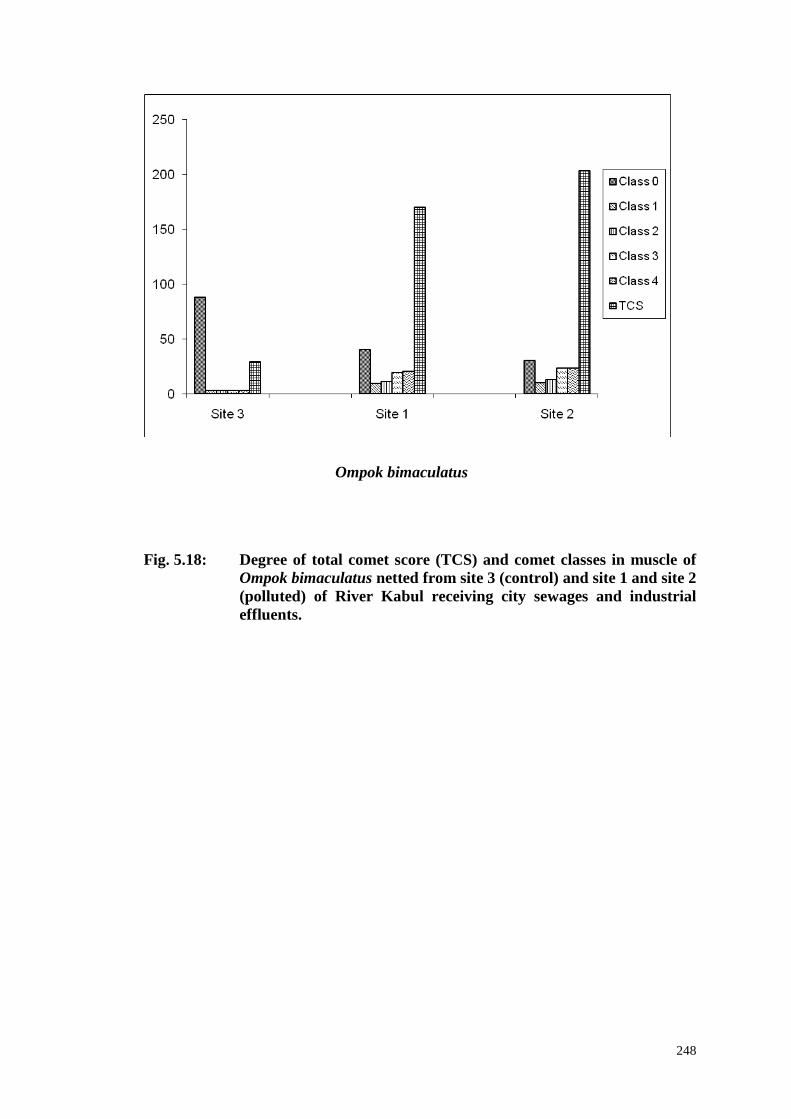
248
Ompok bimaculatus
Fig. 5.18: Degree of total comet score (TCS) and comet classes in muscle of
Ompok bimaculatus netted from site 3 (control) and site 1 and site 2
(polluted) of River Kabul receiving city sewages and industrial
effluents.

249
Class 0 Class 1 Class 2
Class 3 Class 4
Fig. 5.19: Images showing different comet classes that are induced as a result
of heavy metals accumulation in different tissues of fish.
250
5.3.7 Sequences of TCS and Comet Classes
The present investigations showed that all the tissues and fish have a
substantial degree of DNA damage cells. Among various tissues and fish from the
polluted sites different patterns of total comet score (TCS) and comet classes were
found.
Comet class 0 in blood of different fish species was in the order of Wallago
attu>Labeo dyocheilus>Aorichthys seenghala>Ompok bimaculatus>Cyprinus
carpio, in gills was in Wallago attu>Labeo dyocheilus>Aorichthys seenghala
>Ompok bimaculatus>Cyprinus carpio, in skin was Wallago attu>Labeo
dyocheilus>Aorichthys seenghala>Ompok bimaculatus> Cyprinus carpio, in
intestine was Wallago attu>Labeo dyocheilus > Aorichthys seenghala>Ompok
bimaculatus>Cyprinus carpio, in liver was Wallago attu>Labeo dyocheilus
>Cyprinus carpio>Ompok bimaculatus > Aorichthys seenghala and in muscle was
Cyprinus carpio>Ompok bimaculatus>Aorichthys seenghala>Labeo dyocheilu
>Wallago attu. The overall order of comet class 0 in different tissues was muscle>
gills >liver> skin > intestine >blood and in different fish species was Wallago
attu>Labeo dyocheilus>Aorichthys seenghala>Ompok bimaculatus>Cyprinus
carpio.
Comet class 1 in blood of different studied fish was in the sequence of
Cyprinus carpio>Ompok bimaculatus>Aorichthys seenghala>Labeo dyocheilus
>Wallago attu, in gills was Cyprinus carpio>Ompok bimaculatus>Aorichthys
seenghala>Labeo dyocheilu>Wallago attu, in skin was Cyprinus carpio>Ompok
bimaculatus>Aorichthys seenghala>Wallago attu>Labeo dyocheilus, in intestine was
Cyprinus carpio>Ompok bimaculatus>Aorichthys seenghala>Labeo dyocheilus
>Wallago attu, in liver was Cyprinus carpio>Ompok bimaculatus>Aorichthys
seenghala>Labeo dyocheilus>Wallago attu and in muscle was Cyprinus carpio
>Ompok bimaculatus>Aorichthys seenghala>Labeo dyocheilus>Wallago attu. The
251
overall order of comet class 1 in different tissues was blood >intestine> skin>liver>
gills> muscle and in different fish species was Cyprinus carpio>Ompok bimaculatus
>Aorichthys seenghala>Labeo dyocheilus > Wallago attu.
Comet class 2 in blood of different studied fish was in the order of Cyprinus
carpio>Ompok bimaculatus>Aorichthys seenghala>Labeo dyocheilus>Wallago attu,
in gills was Cyprinus carpio>Ompok bimaculatus>Aorichthys seenghala>Labeo
dyocheilus>Wallago attu, in skin was Cyprinus carpio>Ompok bimaculatus>
Aorichthys seenghala>Labeo dyocheilus>Wallago attu, in intestine was Cyprinus
carpio>Ompok bimaculatus>Aorichthys seenghala>Labeo dyocheilus>Wallago attu,
in liver was Cyprinus carpio>Ompok bimaculatus>Aorichthys seenghala>Labeo
dyocheilus>Wallago attu and in muscle was Cyprinus carpio>Ompok bimaculatus
>Aorichthys seenghala>Labeo dyocheilus>Wallago attu. The overall order of comet
class 2 in different tissues was skin>intestine>blood >liver> gills> muscle and in
different fish species was Cyprinus carpio>Ompok bimaculatus >Aorichthys
seenghala>Labeo dyocheilus >Wallago attu.
Comet class 3 in blood of different examined fish was in the order of Cyprinus
carpio>Ompok bimaculatus>Aorichthys seenghala>Labeo dyocheilus>Wallago attu,
in gills was Cyprinus carpio>Ompok bimaculatus>Aorichthys seenghala>Labeo
dyocheilus>Wallago attu, in skin was Cyprinus carpio>Ompok bimaculatus
>Aorichthys seenghala>Labeo dyocheilus>Wallago attu, in intestine was Cyprinus
carpio>Ompok bimaculatus>Aorichthys seenghala>Labeo dyocheilus >Wallago
attu, in liver was Cyprinus carpio>Ompok bimaculatus>Aorichthys seenghala
>Labeo dyocheilus >Wallago attu and in muscle was Cyprinus carpio>Ompok
bimaculatus>Labeo dyocheilus>Aorichthys seenghala>Wallago attu. The overall
order of comet class 3 in different tissues was intestine>blood >skin>liver>gills>
muscle and in different studied fish was Cyprinus carpio>Ompok bimaculatus
>Aorichthys seenghala >Labeo dyocheilus >Wallago attu.

252
Comet class 4 in blood of different studied fish was in the order of Cyprinus
carpio>Ompok bimaculatus>Aorichthys seenghala>Labeo dyocheilus>Wallago attu,
in gills was Cyprinus carpio>Ompok bimaculatus>Aorichthys seenghala>Labeo
dyocheilus>Wallago attu, in skin was Cyprinus carpio>Ompok bimaculatus
>Aorichthys seenghala>Labeo dyocheilus>Wallago attu, in intestine was Cyprinus
carpio>Ompok bimaculatus>Aorichthys seenghala>Labeo dyocheilus>Wallago attu,
in liver was Cyprinus carpio>Ompok bimaculatus>Aorichthys seenghala>Labeo
dyocheilus>Wallago attu and in muscle was Cyprinus carpio>Ompok bimaculatus
>Aorichthys seenghala>Labeo dyocheilus>Wallago attu. The overall order of comet
class 4 in different tissues was blood >intestine>skin>liver>gills> muscle and in
different fish species was Cyprinus carpio>Ompok bimaculatus>Aorichthys
seenghala>Labeo dyocheilus>Wallago attu.
TCS in blood of different studied fish was in the order of Ompok
bimaculatus>Cyprinus carpio>Aorichthys seenghala>Labeo dyocheilus>Wallago
attu, in gills was Cyprinus carpio>Ompok bimaculatus>Aorichthys seenghala>Labeo
dyocheilus>Wallago attu, in skin was Cyprinus carpio>Ompok bimaculatus
>Aorichthys seenghala>Labeo dyocheilus>Wallago attu, in intestine was Cyprinus
carpio>Ompok bimaculatus>Aorichthys seenghala>Labeo dyocheilus>Wallago attu,
in liver was in the order of Cyprinus carpio>Ompok bimaculatus>Aorichthys
seenghala>Labeo dyocheilus>Wallago attu and in muscle was in the order of
Cyprinus carpio>Ompok bimaculatus>Aorichthys seenghala>Labeo dyocheilus
>Wallago attu. The overall order of TCS in different tissues was intestine> blood
>skin>liver>gills> muscle and in different examined fish was Cyprinus
carpio>Ompok bimaculatus > Aorichthys seenghala>Labeo dyocheilus >Wallago
attu.

253
5.3.8 Conclusions and Remarks
In the present investigation total comet score (TCS) and comet class 0, class 1,
class 2, class 3 and class 4 were determined in blood, intestine, skin, gills, liver and
muscle of five different fish species including Wallago attu, Ompok bimaculatus,
Labeo dyocheilus, Cyprinus carpio and Aorichthys seenghala netted from both
polluted and non polluted sites of River Kabul. The overall order of DNA damage
cells in various organs of fish species was in the sequence of intestine >blood >skin
>liver > gills > muscle and in different fish species was in the order of Cyprinus
carpio>Ompok bimaculatus>Aorichthys seenghala>Labeo dyocheilus >Wallago attu.
This shows that highest degree of DNA damage cells was found in intestine followed
by blood, skin, liver and gills, while lowest frequency was found in muscle. Similarly
highest frequency of DNA damage cells was observed in Cyprinus carpio fish
followed by Ompok bimaculatus, Aorichthys seenghala, Labeo dyocheilus and lowest
in Wallago attu. Thus the organs level order of DNA damage cells in Wallago attu
was in the sequence of blood >intestine >skin >liver >gills > muscle, in Aorichthys
seenghala was in the order of intestine>blood>skin > liver >gills>muscle, in Labeo
dyocheilus was in the order of blood >intestine > skin >liver >gills > muscle, in
Cyprinus carpio was in the order of blood >intestine > skin >liver >gills > muscle
and in Ompok bimaculatus was in the order of intestine> skin >blood> liver >gills
>muscle.
Overall order of comet classes in different tissues are as below
» In blood was Class 4 > Class 3> Class 0> Class 2> Class 1
» In intestine was Class 4 > Class 3> Class 0> Class 2> Class 1
» In skin was Class 4 > Class 3> Class 0> Class 2> Class 1
» In gills was Class 0> Class 4 > Class 3> Class 2> Class 1
» In liver was Class 4 > Class 3> Class 0> Class 2> Class 1
254
» In muscle was Class 0> Class 4 > Class 3> Class 2> Class 1
TCS in different tissues was in the order of intestine >blood >skin >liver >
gills > muscle and in different fish species was in the sequence of Cyprinus
carpio>Ompok bimaculatus>Aorichthys seenghala>Labeo dyocheilus >Wallago attu.

255
CHAPTER-6
HISTOPATHOPLOGIC EFFECTS OF HEAVY METALS
IN SELECTED FISH SPECIES OF RIVER KABUL
6.1 INTRODUCTION
Histopathology together with other methods such as biochemical, growth,
diseases and diagnostic are biomarkers used in assessing effects of both internal (feed
used) and external (aquatic) environmental conditions on aquatic organisms like fish
(Connell, 1976; Hinton et al., 1987, Segner and Braun beck, 1988). Accumulated
heavy metals may lead to histopathological alterations in the tissues of fish (Monteiro
et al., 2005). Various pathological abnormalities like apoptosis of lamellar epithelial
cells and lamellar fusion were observed under microscope in different organs of the
fish after exposure to the heavy metals like mercury and copper and the latter process
occurred either by simple apposition of adjacent lamellae to each other or through
epithelial hypertrophy and hyperplasia (Daoust et al., 1984). Synthesis of
metallothionein is increased in fish during chronic and acute exposures to heavy
metals. The metallothionein is saturated by metals and excess metal ions spill over
into other cellular compartments and cause pathological lesions in different tissues of
fish (Steven and Paul, 2011). Induced abnormal functioning of phagocytes, induction
of respiratory burst activity and damage of tissues in fish and other animals are
associated with an increase in concentration of heavy metals (Masroor et al., 2000).
The liver histology is used as biomarker for the environmental pollution (EI. Serafy et
al., 2009). There have been numerous reports of histopathological changes in liver of
fish after exposure to a wide range of heavy metals (Au, 2004; Abdel-Moneim et al.,
2012). The changes in fish gills are among the most commonly recognized responses
to environmental stressors and are indicative of physical and chemical stress like
heavy metals (Abdel-Moneim et al., 2012; Au, 2004; Mallat, 1985). The gills
histology is used as indication of environmental pollution (EI. Serafy et al., 2009).

256
Gill histopathological lesions as indicators of exposure to a wide range of heavy
metals have previously been used in numerous laboratory and field studies around the
world (Au, 2004; Ribeiro et al., 2002; Elahee, and Bhagwant, 2007).
Histopathoiogical lesions such as degeneration and necrosis of hepatocytes as
the elevation in transaminase activities may be attributed to heavy metals in the liver
of fish C. gariepinus (Aly et al., 2003). Histological biomarkers of toxicity in fish
organs are a useful indicator of environmental pollution (Peebua et al., 2008). Several
pathological abnormalities have been observed in the gills, liver, kidneys and gonads
of fish as exposed to agricultural, sewage and industrial pollutants (Mohamed, 2003).
Pathological disorders in the gills of fish are related to specific classes of toxicants.
Many researchers have investigated different pathological alterations in the gills of
different fish species after exposure to heavy metals (Pacheco and Santos, 2002;
Moore et al., 2003). Different histopathological changes in the gills of Fundulus
heteroclitus were observed after exposure to heavy metal like cadmium (Gardner and
Yevich, 1970). Histopathological changes in the gills of Salmo gairdneri were
observed after exposure to heavy metals (Balah et al., 1993). Gills are the respiratory
and osmoregulatory organ of the fish. The histopathological changes of the gills due
to heavy metals might impair the respiratory function of the gills by reducing
respiratory surface area, resulted in hypoxia, respiratory failure problems (Alazemi et
al., 1996; Yasser and Naser, 2011) and this badly affects the physiology of the fish
body and may be resulted to the fish death (Mohamed, 2003).
The liver is particularly susceptible to damage from a variety of toxicants.
Liver helps in cleaning of pollutants from the blood. Therefore it is a good indicator
of aquatic environmental pollution (Soufy et al., 2007). The liver alterations in the C.
gariepinus fish samples were more severe and reflecting that the water qualities of El-
Rahway drain was poor. These abnorsmalities in the liver could be correlated to toxic
effects of heavy metals on hepatocytes, thus liver is most important organ, which help

257
in detoxification of toxic chemicals (Freeman, 1983). Severals pathological disorders
in the liver of Clarias gariepinus Cat fish were investigated as a result of heavy
metals accumulation in the liver (Mohammad et al., 2013). Heavy metals in Elbe
Rivers might cause liver damage in fish (Sorensen, 1991). The same abnormalities in
the liver of Tilapia zillii and Clarias gariepinus were also investigated after exposure
to heavy metals living in Nile water (Ibrahim and Mahmoud, 2005).
Histopathological effects of heavy metals were reported in some fish inhabiting
Bardawil lagoon. Heavy metals are the toxicants that induce histopathological
abnormalities in different tissues of animals and fish (Yacoub and Abdel Satar.,
2003). Histopathological alterations were seen after exposure of the lake white fish
Coregonus clupeaformis to heavy metal like nickel (Ptashynski et al., 2002). The liver
histopathological lesions were seen in the fish, Clarias gariepinus after exposure to
heavy metal like Pb (Wedemeyer and Yasutake, 1978). Several pathological
abnormalities in the liver of Oreochromis niloticus and Tilapia zillii fish were
observed collected from the southern region of contaminated water (Mohamed, 2001).
Microscopic examination of hepatocytes and their nuclei of fish from
contaminated areas exhibit histopathological changes in comparison to control ones
due to contamination. Hepatocytes lose their normal boundaries (Metwally et al.,
2010). Histopathological changes like hepatocytes vacuolation, cellular swelling,
nuclear degeneration and congestion of blood vessels in the liver and pathological
disorders such as secondary lamellar disorganization, rupture in lamellar epithelium
and epithelial lifting in the gills of different fish were observed after collection from
polluted water (Metwally et al., 2010). Several histopathological lesions in fish liver
after exposure to heavy metals were reported and supported by many other studies
deals with monitoring the fish health and environmental pollution in aquatic
ecosystem (Stentford et al., 2003). Exposure of the fish to heavy metals like cadmium
or zinc can induce histopathological conditions of the kidney and epidermis
(Somasundaram, 1985), the gills (Grobler, 1989) and the liver (Morsey and

258
Protasowicki, 1990). Hepatocellular alterations in fish hepatic tissue after exposure to
heavy metals were seen (Myers et al., 1998). Most previous studies have reported that
exposure of fish to heavy metals is associated with structural damage of gills
epithelia. Most gills changes caused by pollutants in the fish like epithelial lifting and
inflammatory response of the tissue were seen in the gills of the fish (Metwally et al.,
2010).
It has been observed that lifting and peeling of the lamellar epithelium and
rupture of capillaries are common lesions in gills of Senegal sole fish after exposure
to heavy metals (Arellano et al., 1999). Same changes were also seen in other fish
species after exposure to heavy metals like copper, zinc and mercury (Krishnani et
al.,2003). Pathological alterations like strand scission, depurination, cross linking and
base modifications were observed after exposure of experimental fish to carcinogenic
metals (Bal and Kasprzak, 2002). Heavy metals accumulation in fish could be resulted
to high mortality rate and biochemical and histological abnormalities in different
tissues of the fish (Ramalingam and Rarnalingam, 1982). Several pathological
disorders were seen in gills, liver and kidneys of the studied fish collected from Abu
Za'baall akes in Egypt (Fatima et al., 2005). Several pathological abnormalities were
also observed in the muscle, gills. liver and kidneys of Archosargus probatocephalus
as a result of exposure to copper (Cardeilhac et al„ 1979), in Tijapia niloiica exposed
to lead acetate, mercuric chloride and cadmium chloride (Balah et al., 1993), in
Cyprinion mhaknsis exposed lo copper (Ghazaly et al., 1994), in Macropsobrycon
uruguayanae exposed to cadmium (Randi et al., 1996) and in Salmo trutta exposed to
iron sulphate (Dalzell and Macfarlane, 1999). Pathological diorders were seen in the
kidneys of Heteropnettstes fossilis after exposure to heavy metals like mercury and
cadmium (Bano and Hassan, 1990), in Cyprinus carpio exposed to cadmium (Singhal
and Jain, 1997) and in rainbow trout exposed to Cd (Iliopoulou and Kotsanis, 2001).

259
The gills of three studied fish collected from Abu Za'baal lakes showed
different pathological disorders like proliferative changes in the epithelium of gills
filaments and secondary lamellae and degenerative and necrotic changes in gills
filaments and secondary lamellae. Besides these changes inflammatory cells
infiltration was also noticed among the proliferated epithelial cells. Moreover, in the
gills of O. nilolicus histopathological alterations such as severe curling of secondary
lamellae, severe atrophy of secondary lamellae and dilation and congestion in the
blood vessels of gills filaments were also seen. Collapse of the epithelium of gills
filaments, bulging with blood at the tips of lamellae and dark deposits were seen on
the surface of gills epithelia (Fatima et al., 2005). The pathological alterations such as
dilation of the lamellar blood vessels and the presence of edematous fluid in the
secondary lamellae may be related to increased permeability induced as a result of
exposure of the fish to toxic metals for long period (Balah et al., 1993).The
edematous fluid separated the respiratory epithelium from the underlying tissues and
led to its disquamation as well as necrosis. The dark deposits seen on the surface of
gills epithelia were most probably related to heavy metals (Peuranen et al., 1994). It
has been investigated that the kinetics of heavy metal uptake and metallothionein
synthesis are both to be taken into account, where the pathological effects would
appear when the rate of metal uptake exceeds the rate of metallothionein synthesis
(Mccarter et al., 1982).
The histopathological changes observed in present investigation after exposure
to lethal and sublethal content of mercury chloride and copper chloride in the liver,
muscle and intestine of test fish Channa gachua (Deore and Wagh, 2012). The
pathological lesions in different tissues of aquatic organisms confirmed that exposure
of aquatic organisms to heavy metals may be resulted into histological and
pathological disorders, as reported already in previous findings by (Damek and
Sawicka, 2003; Zhang et al., 2005; Martin-Diaz et al., 2006; Raldua et al., 2007).

260
The histological structure is not altered even in experiments in which fish were
fed heavy metals containing food (Andreozzi et al., 1994). Histopathological
alterations were seen in tissues of Anguilla anguilla after exposure to heavy metal like
copper (Grosell et al., 1996), in liver of Rutilus rubiliohridanus (Roganovic et
al.,1998), in hepatic capillaries in Barbus meridionalis (Roganovic et al., 2003), in
liver of Cyprinus carpio on exposure to copper sulphate (Varanka et al., 2001).
Different histopathological changes in epidermis, dermis, hypodermis and underlying
muscle of Oreochromis niloticus fish specimens collected from El-Kanater, Benha,
Zefta and Talkha stations were investigated and found necrosis of epithelial and
mucous cells of the epidermis, degeneration, necrosis and edema of muscle fibers.
They also revealed congestion and dilation of the dermal blood vessels together with
hypodermic inflammatory signs which may extend to underlying muscle (Sabry et al.,
2005). Several histopathological alterations were studied in the liver of different fish.
These alterations including vacuolar degeneration in the hepatocytes, focal areas of
necrosis, haemorrhage and haemostderin between the hepatocytes and around hepatic
and hepatoportal blood vessels and dilation and congestion in hepatic and
hepatoportal blood vessels. The observed degeneration in the liver may be attributed
to disruption in the lysosomal membrane, which is very sensitive to toxicants as heavy
metals and thus their enzymes released and caused degeneration and vacuolation of
cytoplasm of hepatocytes (Yacoub et al., 2003).
It has been investigated that heavy metal like zinc is known for its essential
role in growth, immunity, DNA replication, body’s defensive system, cell division,
cell growth, wound healing and the breakdown of carbohydrates. High zinc intake
leads to enfeeblement, retardation of growth and may bring about metabolic and
pathological changes in various organs in fish (Ambrose et al., 1994). Different heavy
metals were determined in fish species like eels caught from polluted lakes in north
western Poland. Steady deterioration in the health of eels, chronic degenerative
inflammation of the internal organs, non-specific anemia, aplasia or hypoplasia of the

261
red blood cells in fish were observed (Orecka and Grabda, 1986). Examination of the
gills of the fish collected from Abu Za'baal lakes showed marked histopathological
changes. These changes are including proliferative, degenerative and necrotic changes
in the epithelium of gills filaments and secondary lamellae, edema in secondary
lamellae, separation of the epithelium of the secondary lamellae from the lamellar
supporting cells, dilation and congestion in the blood vessels of gills filaments,
atrophy in secondary lamellae, bulging at the tips of secondary lamellae and dark
deposits on the surface of gills epithelia. The observed proliferative changes in the
respiratory lamellar epithelium may increase the epithelial thickness which retard or
prevent the entry of toxic metals into the blood stream (Laurent, 1984).
6.2 METHODS AND MATERIALS
6.2.1 Study Area
For detail see page≠2
6.2.2 Fish Sampling Sites
For detail see page≠109
6.2.3 Collection of Fish Samples
For detail see page≠109
6.2.4 Collection and Preservation of Fish Tissues
For detail see page≠188
6.2.5 Procedure
6.2.6 Preparation of Solutions for Tissue Processing
The following different solutions for tissues processing were prepared
according the method described by Prophet et al (1992).

262
6.2.7 Preparation of Fixative Solution
10% neutrally buffered formalin (NBF) was used as a fixative and was
prepared by mixing 10% formalin with PBS.
6.2.8 Preparation of PBS (Potassium chloride 0.2 gm, sodium phosphate dibasic
dehydrate 1.44 gm, potassium phosphate monobasic 0.24 gm, d.H2O 1000 ml, pH 7.4)
6.2.9 Preparation of 10% NBF (37% formaldehyde 270.27 ml, PBS1000 mL).
6.2.10 Preparation of Different Ethanol Solutions
6.2.10.1 50% Ethanol solution (ethanol 250 ml, d.H2O 250 ml).
6.2.10.2 70% Ethanol solution (ethanol 350 ml, d.H2O 150 ml).
6.2.10.3 80% Ethanol solution (ethanol 400 ml, d.H2O 100 ml).
6.2.10.4 90% Ethanol solution (ethanol 450 ml, d.H2O 50 ml).
6.2.10.5 95% Ethanol solution (ethanol 950 ml, d.H2O50 mL).
6.2.11 Preparation of Alcohol-Xylene Solution
(Distilled alcohol 50 mL, 100% xylene 50 mL).
6.2.12 Preparation of Xylene-Paraffin Solution
(Paraffin 50 mL, 100% xylene 50 mL).
6.2.13 Preparation of Different Solutions for Staining
6.2.13.1 Mayer’s Albumin
Equal quantities of both fresh egg albumin and glycerol was mixed. Few drops
of formaldehyde 37% were also added and then stored at 4oC.
6.2.13.2 Harris Hematoxylin Stain
(Hematoxylin powder 5.0 gm, mercuric oxid 2.5 gm, potassium alum 100 gm,
absolute ethanol 50 mL, glacial acetic acid 40 mL, d. H2O1000 mL).

263
6.2.13.3 Eosin Stain
Working solution was prepared from eosin and phloxine-B stock solutions.
6.2.13.4 Eosin-Y Stock Solution (Eosin-Y powder 1gm, d.H2O 100mL, few drops of
37% formaldehyde).
6.2.13.5 Phloxine-B Stock Solution (Phloxine-B 1g, d.H2O 100 ml, few drops of
37% formaldehyde).
6.2.13.6 Eosin-Phloxine Working Solution (Eosin Y stock solution 100 ml,
phloxine-B stock solution 10 ml,95% ethanol 780 mL, Glacial acetic acid 4 mL).
6.2.13.7 1% Acid-Alcohol Solution (Fuming HCl5ml, 70% ethanol 500 mL).
6.2.13.8 1000mL Ammonia Solution (Ammonium hydroxide 2 ml, d. H2O 998 mL).
6.2.14 Tissue Processing
The tissues were processed according to the protocol of Prophet et al (1992).
6.2.15 Tissues Fixation
Weighted tissues of liver, intestine, muscle and gills were kept in 10% NBF
for 48 hours.
6.2.16 Tissues Dehydration
Tissues (80gm) were cut into a small pieces and kept in tissue cassettes. These
cassettes were then kept in a series of ethanol solutions (30%, 50%, 70%, 80%, 90%,
95%).To accelerate dehydration, the tissues were kept on hot plate magnetic stirrer
and adjusted the temperature between 55-57oC. The tissues were dehydrated
according to the following schedule.
6.2.16.1 70% Ethanol solution for 1 hour.
6.2.16.2 80% Ethanol solution for 1 hour.
6.2.16.3 90% Ethanol solution for 1 hour.

264
6.2.16.4 Two changes each of 100% ethanol solution for 1 hour.
6.2.17 Clearing of Tissues
Tissues were transferred to clearing solution (50% Xylene, 50% ethanol) and
kept on hot plate magnetic stirrer and adjusted the temperature between 45-47oC. The
cleared tissues were finally treated twice with 100% Xylene.
6.2.18 Paraffin Infiltration of Tissues
The tissues were infiltrated with melted paraffin wax. First tissues were
incubated at 62oC with combined solution of 50% xylen and molten paraffin wax for
one hour and then kept twice for I hour each in paraffin wax.
6.2.19 Embedding of Tissues
Tissues were transferred to stainless steel (S.S). Melted paraffin was poured
into moulds and tissues were placed with heated forceps in it. Warm tissue cassettes
were placed on the surface of paraffin. The paraffin wax moulds were kept in freezer
till solidified. After solidification the tissue wax blocks were removed.
6.2.20 Sectioning of Tissues
The tissues were sectioned through a rotary microtome. The sections were
adjusted to 12μm thickness. The section ribbon was removed from blade edge through
forceps and the shiny side of the sectioned tissue was kept in water bath containing
clean water at a temperature of 10 degree below the melting point of wax. Then the
tissues were mounted on microscopic slides coated with Mayer’s albumin and cooled
at ambient temperature and placed in staining slide tray. The staining slide tray was
then placed in oven at 58oC for 10-15 minutes.
6.2.21 Staining of Tissues
The tissues were stained with hematoxylin and eosin in staining glass jars.
Before staining wax were removed and then rehydrated by xylene and then gradual
ethanol solution and finally with 100 % ethanol. For hemotoxyline staining, tissue

265
slides were kept in it for 5 min and then genetly washed with running tap water. The
same tissue slides were then kept in eosin-phloxine solution for 8 min and washed
gently with running tap water. Stained tissues were covered with candabolsm and then
placed cover slips on it.
6.2.22 Observation of Tissues under Microscope
The dried stained tissues were observed under a compound microscope using
all magnification (40X, 100X, 400X). Photomicrographs of tissues sections were
obtained on a digital camera connected to the microscope. Photomicrographs of low
and higher resolutions were taken.
6.2.23 Statistical Analysis
Statistical analysis was done by using ANOVA software for Windows.
Percentage values of pathological disorders were determined through the following
formula
No of fish in which pathological abnormalities were observed × 100
Total no of fish species studied for pathological disorders
6.3 RESULT AND DISCUSSION
The present study was aimed to assess the histopathological effects of heavy
metals in intestine, liver, gills and muscle of Wallago attu, Aorichthys seenghala,
Cyprinus carpio, Labeo dyocheilus and Ompok bimaculatus from polluted sites of
River Kabul and compared with fish samples from reference site (Warsak dam).
Histopathological changes associated with heavy metals in fish have been studied by
many authors. But no histopathological studies have been carried out on the fish of
River Kabul. Therefore, for the first time this study was conducted to determine
pathological abnormalities due to heavy metals accumulation in selected fish species
of River Kabul. Metal contamination of aquatic ecosystems has long been recognized
as a serious pollution problem. When fish are exposed to elevated levels of metals in a
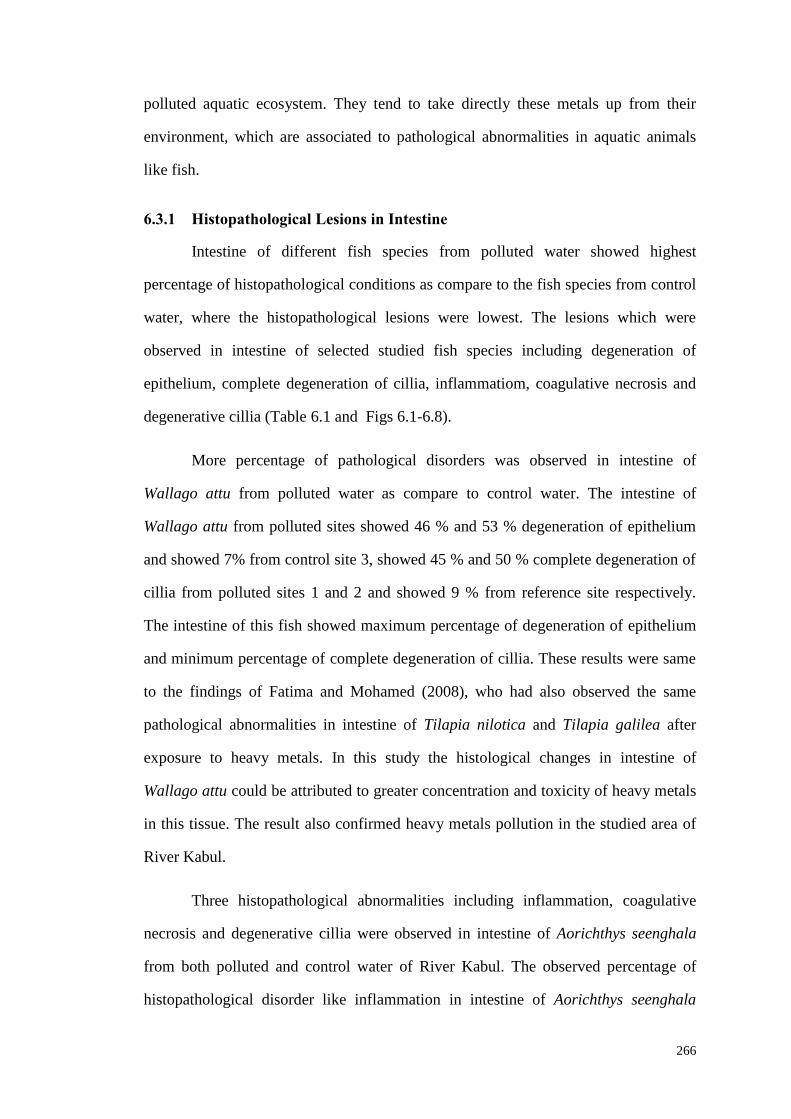
266
polluted aquatic ecosystem. They tend to take directly these metals up from their
environment, which are associated to pathological abnormalities in aquatic animals
like fish.
6.3.1 Histopathological Lesions in Intestine
Intestine of different fish species from polluted water showed highest
percentage of histopathological conditions as compare to the fish species from control
water, where the histopathological lesions were lowest. The lesions which were
observed in intestine of selected studied fish species including degeneration of
epithelium, complete degeneration of cillia, inflammatiom, coagulative necrosis and
degenerative cillia (Table 6.1 and Figs 6.1-6.8).
More percentage of pathological disorders was observed in intestine of
Wallago attu from polluted water as compare to control water. The intestine of
Wallago attu from polluted sites showed 46 % and 53 % degeneration of epithelium
and showed 7% from control site 3, showed 45 % and 50 % complete degeneration of
cillia from polluted sites 1 and 2 and showed 9 % from reference site respectively.
The intestine of this fish showed maximum percentage of degeneration of epithelium
and minimum percentage of complete degeneration of cillia. These results were same
to the findings of Fatima and Mohamed (2008), who had also observed the same
pathological abnormalities in intestine of Tilapia nilotica and Tilapia galilea after
exposure to heavy metals. In this study the histological changes in intestine of
Wallago attu could be attributed to greater concentration and toxicity of heavy metals
in this tissue. The result also confirmed heavy metals pollution in the studied area of
River Kabul.
Three histopathological abnormalities including inflammation, coagulative
necrosis and degenerative cillia were observed in intestine of Aorichthys seenghala
from both polluted and control water of River Kabul. The observed percentage of
histopathological disorder like inflammation in intestine of Aorichthys seenghala
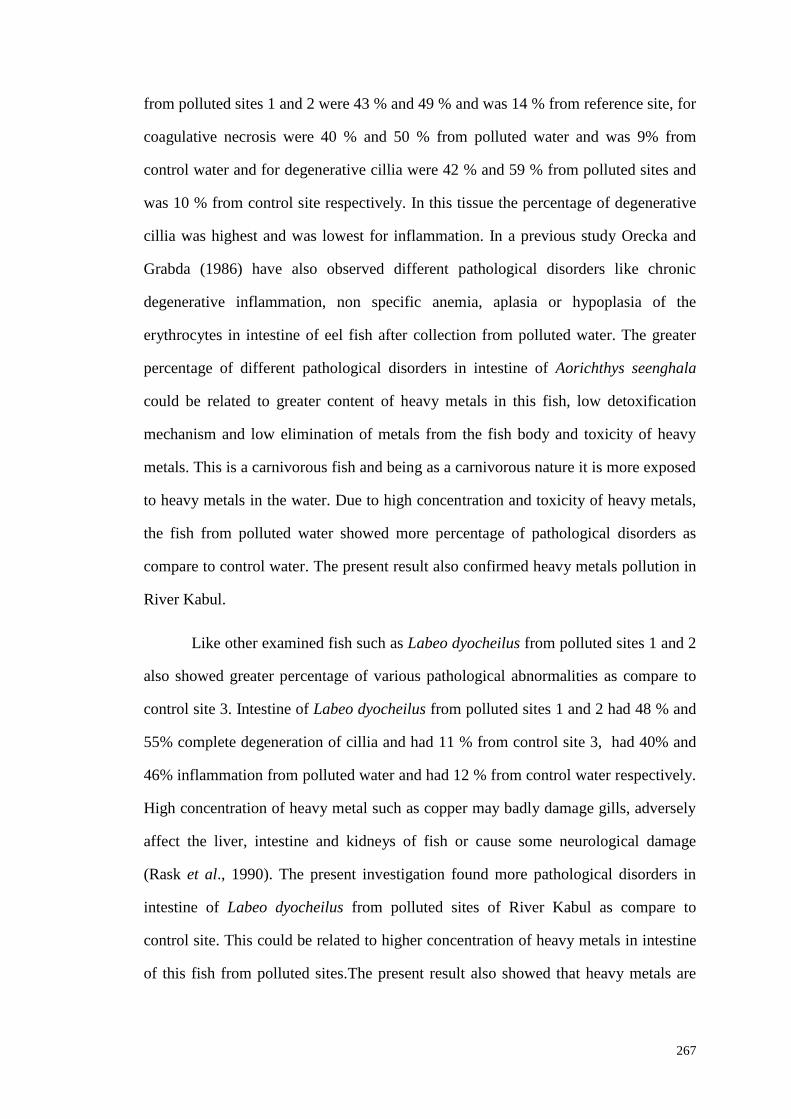
267
from polluted sites 1 and 2 were 43 % and 49 % and was 14 % from reference site, for
coagulative necrosis were 40 % and 50 % from polluted water and was 9% from
control water and for degenerative cillia were 42 % and 59 % from polluted sites and
was 10 % from control site respectively. In this tissue the percentage of degenerative
cillia was highest and was lowest for inflammation. In a previous study Orecka and
Grabda (1986) have also observed different pathological disorders like chronic
degenerative inflammation, non specific anemia, aplasia or hypoplasia of the
erythrocytes in intestine of eel fish after collection from polluted water. The greater
percentage of different pathological disorders in intestine of Aorichthys seenghala
could be related to greater content of heavy metals in this fish, low detoxification
mechanism and low elimination of metals from the fish body and toxicity of heavy
metals. This is a carnivorous fish and being as a carnivorous nature it is more exposed
to heavy metals in the water. Due to high concentration and toxicity of heavy metals,
the fish from polluted water showed more percentage of pathological disorders as
compare to control water. The present result also confirmed heavy metals pollution in
River Kabul.
Like other examined fish such as Labeo dyocheilus from polluted sites 1 and 2
also showed greater percentage of various pathological abnormalities as compare to
control site 3. Intestine of Labeo dyocheilus from polluted sites 1 and 2 had 48 % and
55% complete degeneration of cillia and had 11 % from control site 3, had 40% and
46% inflammation from polluted water and had 12 % from control water respectively.
High concentration of heavy metal such as copper may badly damage gills, adversely
affect the liver, intestine and kidneys of fish or cause some neurological damage
(Rask et al., 1990). The present investigation found more pathological disorders in
intestine of Labeo dyocheilus from polluted sites of River Kabul as compare to
control site. This could be related to higher concentration of heavy metals in intestine
of this fish from polluted sites.The present result also showed that heavy metals are

268
toxic in nature and can induce various pathological abnormalities in living organisms
especially fish.
Intestine of Labeo dyocheilus from polluted water had greater percentage of
pathological disorders as compare to control water. Four histopathological conditions
including complete degeneration of cillia, inflammation, coagulative necrosis and
degenerative cillia were observed in intestine of Cyprinus carpio from both polluted
and control sites. In this study the observed histopathological changes in intestine of
Labeo dyocheilus are in agreement with those observed by Masroor et al (2000), who
have also observed the same pathological disorders to the present result. The intestine
of Cyprinus carpio from polluted site 1 and site 2 showed 55% and 61 complete
degeneration of cillia, 49% and 55% inflammation, 51% and 59% coagulative
necrosis and showed 49% and 60% degenerative cillia and showed 14% complete
degeneration of cillia, 15% inflammation, 13% coagulative necrosis and 14%
degenerative cillia from control site 3 respectively. In this tissue greater percentage
was observed for complete degeneration of cillia and lower for inflammation. Chronic
exposure of the fish to heavy metals are responsible for disorders like obstructive
airway disease, emphysema, irreversible renal failure, bone disorders and immuno
suppression and some pathological lesions in fish (Bertin and Averbeck, 2006).
Comparing our data with the findings of other workers indicates that heavy metals are
toxic and can induce pathological disorders in aquatic organisms.
Histopathological abnormalities like inflammation, coagulative necrosis and
degenerative cillia were observed in intestine of Ompok bimaculatus from polluted
and control sites of River Kabul. Ompok bimaculatus from polluted sites showed 47%
and 51% inflammation, showed 43% and 53% coagulative necrosis and showed 45%
and 63% degenerative cillia and from reference site showed 14% inflammation, 11%
coagulative necrosis and 12 % degenerative cillia respectively. In intestine of this fish
more percentage was observed for degenerative cillia and less for inflammation. The

269
present result of higher percentag of pathological disorders in this tissue of Ompok
bimaculatus agree with the findings of Uran et al (2009). Results of the present and
previous studies (Orecka and Grabda, 1986; Ebrahimi and Taherian, 2009; Masroor et
al., 2000) have demonstrated that heavy metals are toxic in nature and could be
associated to pathological abnormalities in both the animals from aquatic and
terrestrial environments. The observed percentage of pathological lesions in intestine
was in the order of inflammation >degenerative cillia >complete degeneration of cillia
> coagulative necrosis>degeneration of epithelium and in different fish species was in
the sequence of Cyprinus carpio>Ompok bimaculatus >Aorichthys seenghala >
Wallago attu>Labeo dyocheilus.This indicates that greater percentage of pathological
disorders was observed in Cyprinus carpio and smaller in Labeo dyocheilus.The
highest degree of lesions in Cyprinus carpio could be correlated to greater content of
heavy metals in this fish, low elimination of metals from fish body, low metabolic rate
and exposion of this fish to heavy metals for long period. Comparing the above
findings with our result confirmed that heavy metals are toxic and induce patholgical
changes in the external and internal organs of aquatic organisms like fish. In our
finding more histopathological lesions were found in the intestine of different fish
species from polluted sites. More histopathological abnormalities could be attributed
to high concentration of heavy metals in this organ. This result also showed heavy
metals pollution in the down stream portions of River Kabul. The overall result
indicates that intestine came second after liver followed by gills and muscle for
pathological abnormalities.

270
Table 6.1: Histopathological lesions (%) in intestine of five different fish
species netted from site 3 (control) and site 1 and site 2 (polluted)
of River Kabul receiving city sewages and industrial effluents.
Fish Lesions Site 3 (%) Site 1 (%) Site 2 (%)
Wallago attu
Degeneration of epithelium 7 46 53
Complete degeneration of cillia 9 45 50
Aorichthys seenghala
Inflammation 14 43 49
Coagulative necrosis 9 40 50
Degenerative cillia 10 42 59
Labeo dyocheilus
Complete degeneration of cillia 11 48 55
Inflammation 12 40 46
Cyprinus carpio
Complete degeneration of cillia 14 55 61
Inflammation 15 49 55
Coagulative necrosis 13 51 59
Degenerative cillia 14 49 60
Ompok bimaculatus
Inflammation 14 47 51
Coagulative necrosis 11 43 53
Degenerative cillia 12 45 63
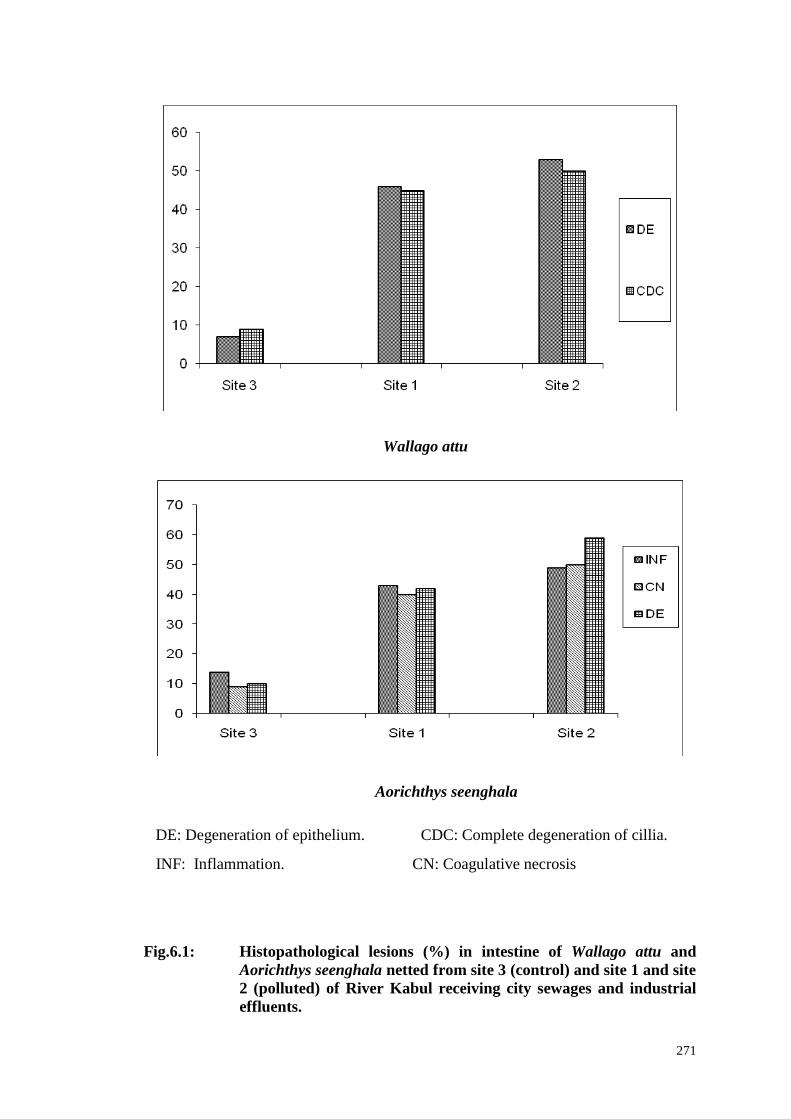
271
Wallago attu
Aorichthys seenghala
DE: Degeneration of epithelium. CDC: Complete degeneration of cillia.
INF: Inflammation. CN: Coagulative necrosis
Fig.6.1: Histopathological lesions (%) in intestine of Wallago attu and
Aorichthys seenghala netted from site 3 (control) and site 1 and site
2 (polluted) of River Kabul receiving city sewages and industrial
effluents.

272
Labeo dyocheilus
Cyprinus carpio
CDC: Complete degeneration of cillia. INF: Inflammation
CN: Coagulative necrosis DC: Degenerative cillia
Fig. 6.2: Histopathological lesions (%) in intestine of Labeo dyocheilus and
Cyprinus carpio netted from site 3 (control) and site 1 and site 2
(polluted) of River Kabul receiving city sewages and industrial
effluents.

273
Ompok bimaculatus
INF: Inflammation CN: Coagulative necrosis DC : Degenerative cillia
Fig.6.3: Histopathological lesions (%) in intestine of Ompok bimaculatus
netted from site 3 (control) and site 1 and site 2 (polluted) of River
Kabul receiving city sewages and industrial effluents.
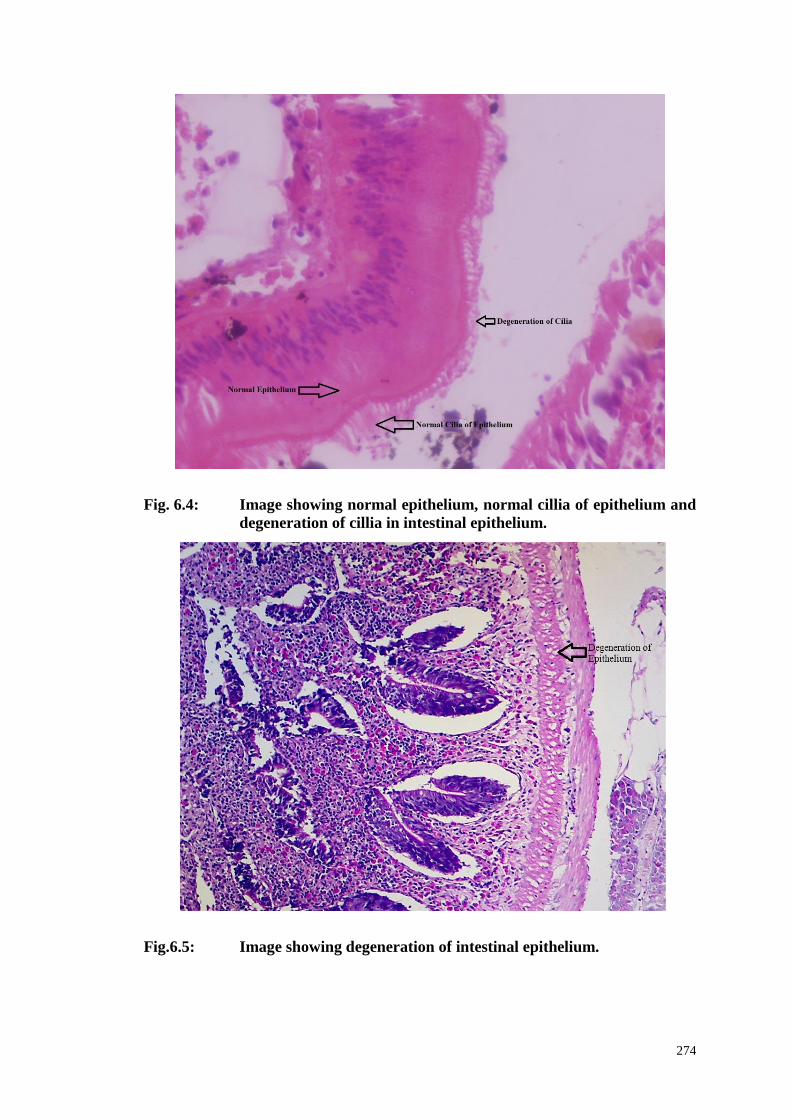
274
Fig. 6.4: Image showing normal epithelium, normal cillia of epithelium and
degeneration of cillia in intestinal epithelium.
Fig.6.5: Image showing degeneration of intestinal epithelium.
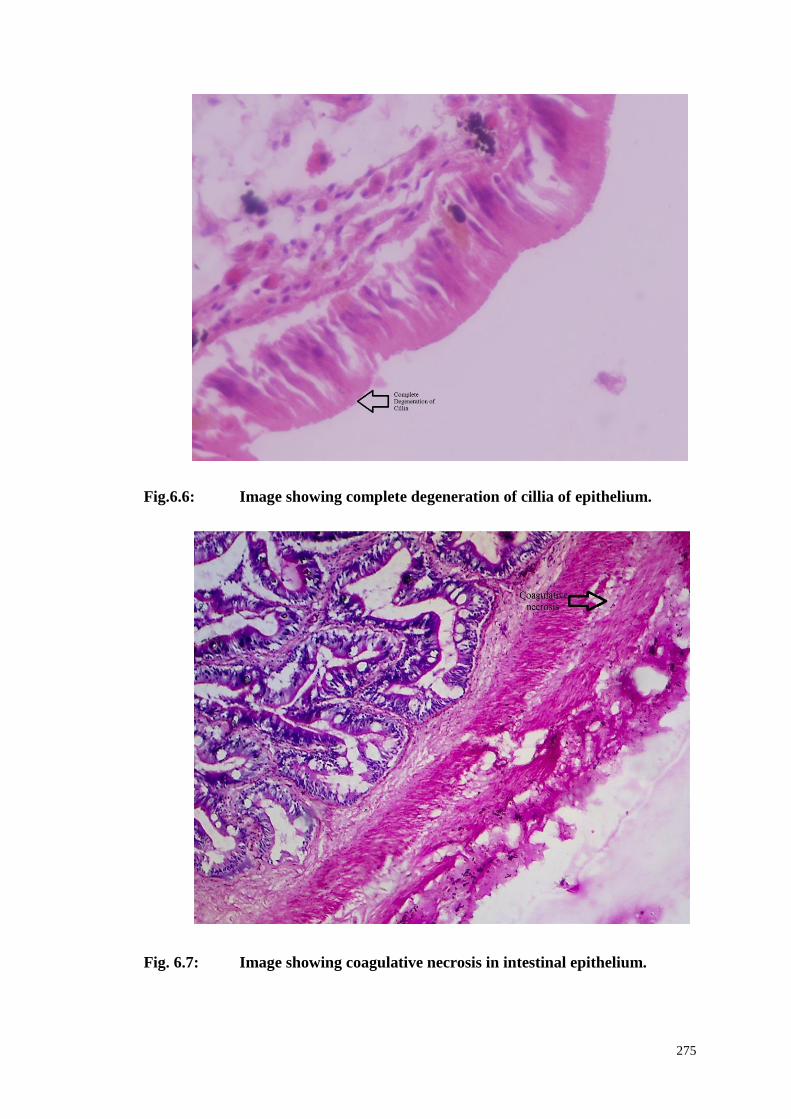
275
Fig.6.6: Image showing complete degeneration of cillia of epithelium.
Fig. 6.7: Image showing coagulative necrosis in intestinal epithelium.

276
Fig. 6.8: Image showing inflammation in intestine.

277
6.3.2 Histopathological Lesions in Liver
In the present investigation liver of five different fish species from polluted
water showed maximum percentage of histopathological conditions as compare to the
fish species from control water, where the minimum percentage of pathological
abnormalities was found. The lesions, which were seen in liver of selected examined
fish species including inflammatiom, hydropic degeneration, coagulative necrosis,
non specific inflammation, liquefactive necrosis and spongiosis hepatis (Table 6.2 and
Figs 6.9-6.16).
Heavy metals like chromium, lead, mercury, zinc, copper and nickel are
among the most toxic metallic pollutants. Bioaccumulation of these metals is known
to adversely affect liver and other tissues of fish, disturbs metabolism and hampers
development and growth of fish (Sephar, 1976). In the present study liver of Wallago
attu from polluted water had 43% and 49% inflammatiom, 51% and 53% hydropic
degeneration and 41% and 45% coagulative necrosis and had 9% inflammatiom, 8%
hydropic degeneration and 10% coagulative necrosis from reference water (Warsak
dam) respectively. Liver of this fish had high percentage of hydropic degeneration
and low percentage of coagulative necrosis. These results are supported by the
findings of Sastry and Gupta (1978), who had observed shrinkage in liver cells,
degenerated nuclei and focal necrosis in liver of Channa punctatus fish after exposure
to lead intoxication. Comparing this study with the investigations of other researchers
highlights that heavy metals are associated with pathological disorders in aquatic and
other animals. This could be the result of heavy metals toxicity.
The histopathological conditions like non specific inflammation, liquefactive
necrosis and spongiosis hepatis were observed in liver of Aorichthys seenghala from
polluted and non polluted water of River Kabul. Liver of Aorichthys seenghala from
polluted sites contained 45% and 56% non specific inflammation, 47% and 55%
278
liquefactive necrosis and 51% and 59% spongiosis hepatis and contained 13% non
specific inflammation, 11% liquefactive necrosis and 10% spongiosis hepatis from
Warsak dam (control) respectively. Liver of Aorichthys seenghala contained highest
percentage of spongiosis hepatis and lowest percentage of non specific inflammation.
In a past finding Benedetti et al (1981) had observed pathological disorder like
cytoplasmic vacuolation in liver of Ictaburus nebulous fish after exposure to copper.
Comparing the present result with the findings of previous workers showed that heavy
metals are toxic in nature and induce pathological alterations in the fish and other
animals.
Liver of Labeo dyocheilus from polluted site 1 and site 2 showed 46% and
50% non specific inflammation and 12% from control site 3, Labeo dyocheilus from
polluted site 1 and site 2 showed 49% and 53% liquefactive necrosis and showed 9%
from site 3 respectively. In liver of this fish maximum percentage was observed for
liquefactive necrosis and lowest percentage for non specific inflammation. These
results are in agreement with the findings of Kumar and pant (1981), who have also
observed the same pathological abnormalities in liver of Puntius conchonius after
exposure to heavy metals like copper and zinc. Comparing our data with the findings
of above mentioned studies and other workers indicates that heavy metals are toxic in
nature and can induce pathological abnormalities in aquatic and other organisms. The
result also showed heavy metals pollution in the River Kabul.
Liver of Cyprinus carpio from polluted water showed more percentage of
pathological abnormalities as compare to control water, where the percentage of
histopathological conditions was low. Liver of Cyprinus carpio from both polluted
sites 1 and 2 had 48% and 54% coagulative necrosis and had 16 % from control site 3,
had 49% and 58% non specific inflammation from polluted water and had 14% from
reference site and had 48% and 57% liquefactive necrosis from polluted sites and
had 13% from control site respectively. In this organ the pathological condition like
279
non specific inflammation showed greater percentage and coagulative necrosis
showed lowest percentage. Several histopathological lesions in the fish liver after
exposure to heavy metals were reported and supported by many other studies and
deals with monitoring fish health and environmental pollution in natural water bodies
(Stent ford et al., 2003). Comparing the present result with the findings of previous
workers reveales that heavy metals accumulated in different tissues of the fish, which
can induce various histopathological disorders in fish.
The lesions, which were seen in liver of Ompok bimaculatus from polluted
and control sites including inflammatiom, hydropic degeneration, liquefactive
necrosis and non specific inflammation. Liver of Ompok bimaculatus from polluted
sites 1 and 2 showed 51% and 53% inflammatiom, 53% and 55% hydropic
degeneration, 44% and 48% liquefactive necrosis, 41% and 50% non specific
inflammation and showed 11% inflammatiom, 10% hydropic degeneration, 11%
liquefactive necrosis and showed 9% non specific inflammation from Warsak dam
respectively. Liver of Ompok bimaculatus had maximum percentage of hydropic
degeneration and minimum percentage of liquefactive necrosis. For overall
pathological changes liver came first followed by intestine, gills and muscle. In
previous finding Singh (1983) has observed various pathological abnormalities like
vacuolation and necrosis in liver of Colisa fasciatus fish after exposure to copper
sulphate. In another finding Dalela et al (1984) have reported various pathological
disorders like necrosis, hypertrophy and atrophy, loss of polygonal shape of cells,
splitting of the cells and formation of spaces in the liver tissues after exposure of
Cyprinus carpio to lethal and sublethal concentration of copper and cadmium. The
present study found the liver to be contained maximum percentage of pathological
conditions as compare to intestine, gills and muscle as already mentioned in the
previous studies (Peters et al., 1987; Ramlingam, 1988; Roncero et al., 1992).The
percentage of examined lesions in liver was in the sequence of non specific
inflammation > liquefactive necrosis >hydropic degeneration > inflammation >

280
coagulative necrosis > spongiosis hepatis and in different fish species was Ompok
bimaculatus > Aorichthys seenghala > Cyprinnus carpio > Wallago attu > Labeo
dyocheilus.The greater lesions in Ompok bimaculatus could be attributed to greater
level of heavy metals in this organ. This may be due to omnivorous nature of this fish.
Being omnivorous nature this fish is more exposed to metal bioaccumulation by many
food chains. Comparing the present result with above mentioned studies indicates that
heavy metals are toxic in nature and can induce pathological disorders in both animals
from both aquatic and terrestrial environments. The present study found more
pathological disorders in liver from polluted water as compare to those from control
water. This may be attributed to more accumulation of metals, low metabolic rate and
low detoxification mechanism of this tissue. Liver came first followed by intestine,
gills and muscle for histopathological abnormalities, when overall comparison is
made.

281
Table 6.2: Histopathological lesions (%) in liver of five different fish species
netted from site 3 (control) and site 1 and site 2 (polluted) of River
Kabul receiving city sewages and industrial effluents.
Fish Lesions Site 3 (%) Site 1 (%) Site 2 (%)
Wallago attu
Inflammation 9 43 49
Hydropic degeneration 8 51 53
Coagulative necrosis 10 41 46
Aorichthys seenghala
Non specific inflammation 13 45 56
Liquefactive necrosis 11 47 55
Spongiosis hepatis 10 51 59
Labeo dyocheilus
Non specific inflammation 12 46 50
Liquefactive necrosis 9 49 53
Cyprinus carpio
Coagulative necrosis 16 48 53
Non specific inflammation 14 49 58
Liquefactive necrosis 13 48 57
Ompok bimaculatus
Inflammatiom 11 53 51
Hydropic degeneration 10 53 55
Liquefactive necrosis 11 44 48
Non specific inflammation 9 41 50
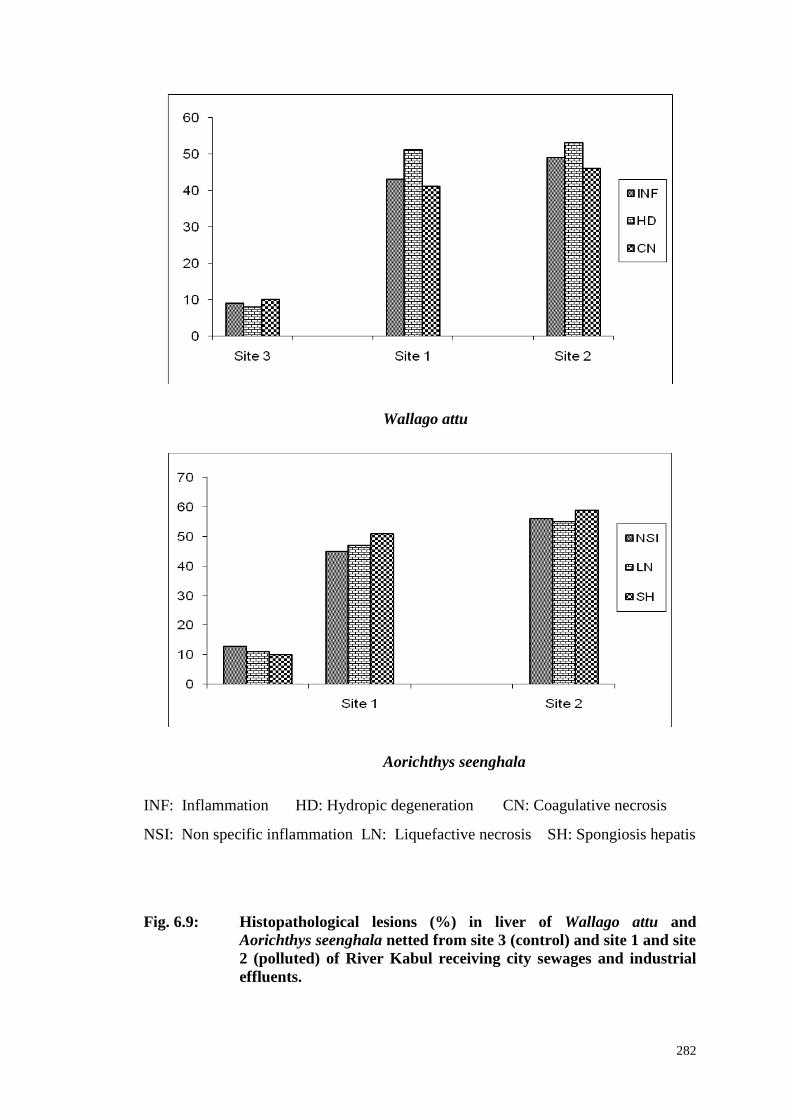
282
Wallago attu
Aorichthys seenghala
INF: Inflammation HD: Hydropic degeneration CN: Coagulative necrosis
NSI: Non specific inflammation LN: Liquefactive necrosis SH: Spongiosis hepatis
Fig. 6.9: Histopathological lesions (%) in liver of Wallago attu and
Aorichthys seenghala netted from site 3 (control) and site 1 and site
2 (polluted) of River Kabul receiving city sewages and industrial
effluents.
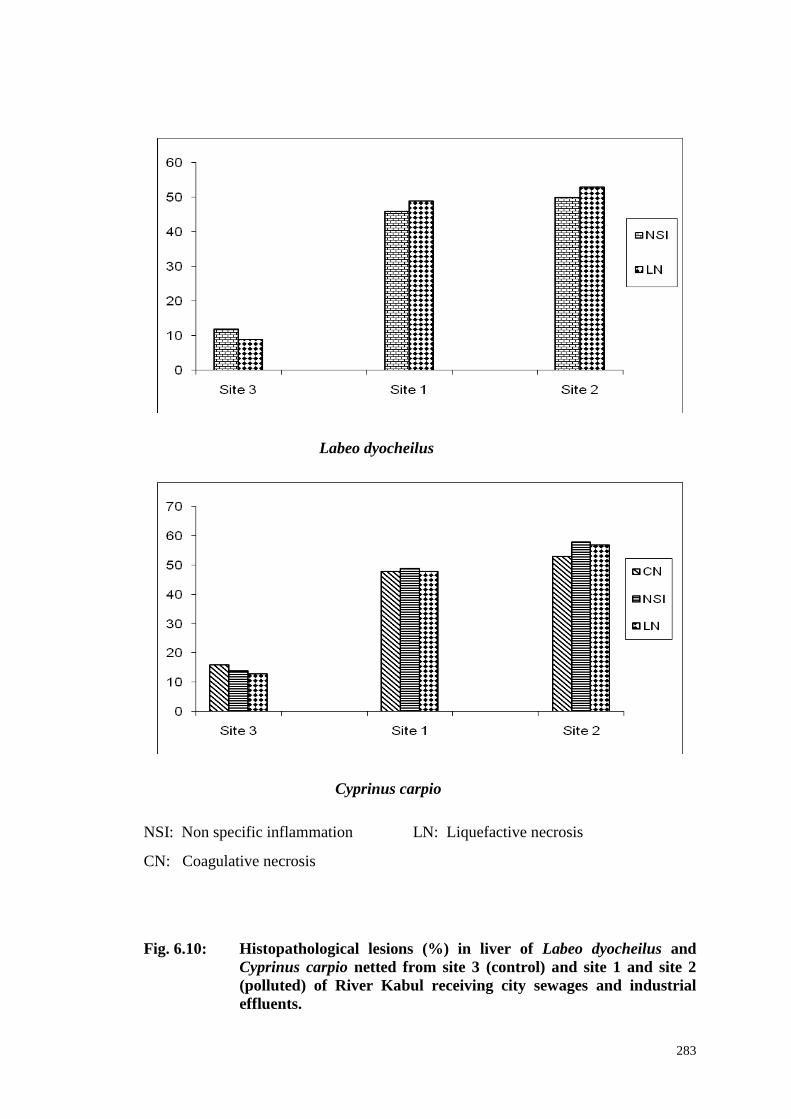
283
Labeo dyocheilus
Cyprinus carpio
NSI: Non specific inflammation LN: Liquefactive necrosis
CN: Coagulative necrosis
Fig. 6.10: Histopathological lesions (%) in liver of Labeo dyocheilus and
Cyprinus carpio netted from site 3 (control) and site 1 and site 2
(polluted) of River Kabul receiving city sewages and industrial
effluents.

284
Ompok bimaculatus
INF: Inflammation HD: Hydropic degeneration
LN: Liquefactive necrosis NSI: Non specific inflammation
Fig. 6.11: Histopathological lesions (%) in liver of Ompok bimaculatus netted
from site 3 (control) and site 1 and site 2 (polluted) of River Kabul
receiving city sewages and industrial effluents.

285
Fig. 6.12: Image showing normal liver cells and coagulative necrosis in liver.
Fig. 6.13: Image showing non-specific inflammation in liver cells.
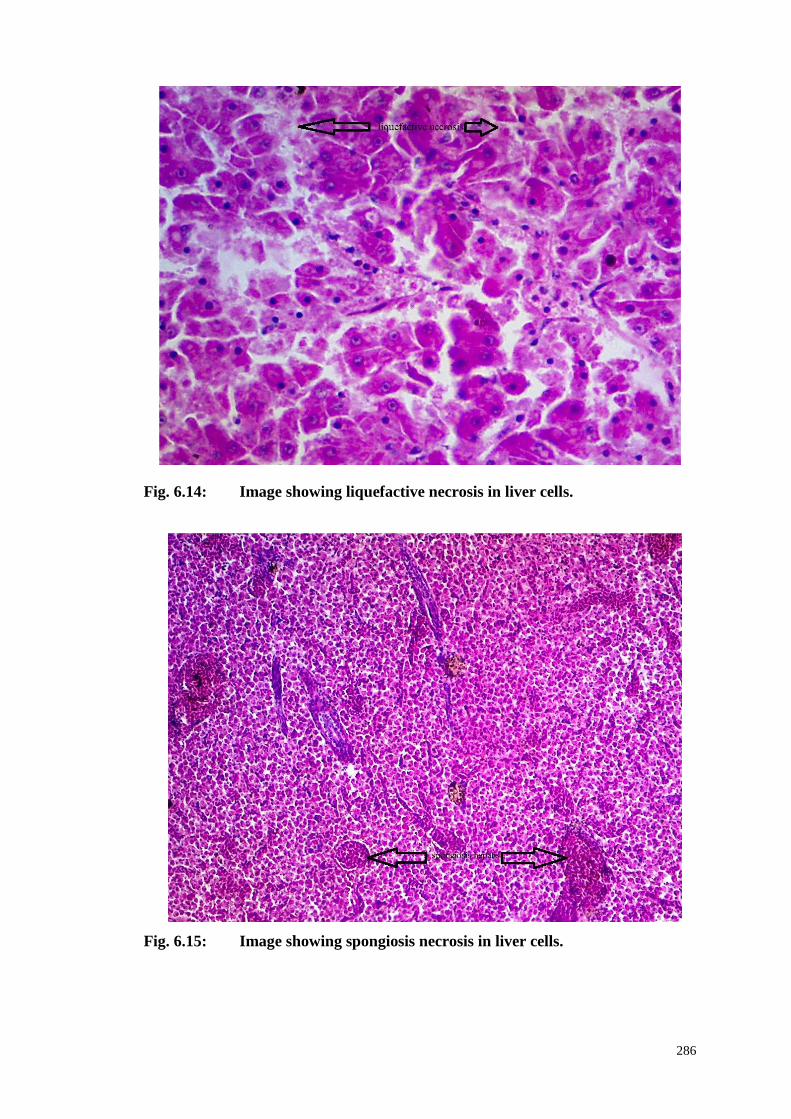
286
Fig. 6.14: Image showing liquefactive necrosis in liver cells.
Fig. 6.15: Image showing spongiosis necrosis in liver cells.

287
Fig. 6.16: Image showing hyropic degeneration in liver cells.
Fig. 6.17: Image showing inflammation in liver cells.

288
6.3.3 Histopathological Lesions (%) in Gills
The gills from selected fish species was removed and processed for different
histopathological abnormalities. Gills of different studied fish from polluted water
showed maximum pecentage of histopathological lesions as compare to the fish
species from control water. The lesions which were observed in gills of the selected
fish species including disquamation and distortion of secondary lamellae with
epithelial cell exudate, clumping of gills lamellae, necrotic area, epithelial
disquamation, non specific inflammation, vacuolation and oedema (Table 6.3 and
Figs 6.17-6.26).
In the present finding gills of Wallago attu from polluted sites showed 33%
and 41% disquamation and distortion of secondary lamellae with epithelial cell
exudate and showed 6% from control site 3, showed 42% and 48% clumping of gills
lamellae from both sites 1 and 2 and showed 5% clumping of gills lamellae from
control site respectively. Gills of this fish was found to be contained greater
percentage of clumping of gills lamellae and lower percentage of disquamation and
distortion of secondary lamellae with epithelial cell exudate. The present results of
higher percentage for various pathological disorders in this organ of different
examined fish species agree with the findings of Swee et al (1997), who has also
investigated the same histopathological alterations in gills of feral fish after exposure
to heavy metals.The present result found more pathological disorders in gills from
polluted area as compare to those from reference site, where the percentage of
disorders was less. This could be attributed to higher concentration of heavy metals in
this tissue and the result also confirmed heavy metals pollution in River Kabul.
The histopathological abnormalities such as necrotic area and epithelial
disquamation were observed in gills of Aorichthys seenghala from polluted and
control sites. The observed percentage values in gills of this fish from polluted sites
were 35% and 40% for necrotic area, 38% and 44% for epithelial disquamation and
289
was 9% for necrotic area and was 7% for epithelial disquamation from control site 3
respectively. In this organ greater percentage was found for epithelial desquamation
and lower for necrotic area. The present study found greater percentage of
pathological disorders as compare to the findings of Mohammad et al (2013), who
have reported less percentage for various histopathological alterations in gills of C.
gariepinus. The present investigation found more percentage for pathological
disorders in gills from polluted water than control water. This is because of greater
concentration and toxicity of heavy metals in this tissue. This result also indicates
heavy metals pollution in water of River Kabul in study area of River Kabul. Gills is
highly susceptible to toxic chemicals of environmental pollutants, because of direct
contact and constantly exposition to environmental pollutants.The absorption of toxic
chemicals through gills is enhanced by increasing the permeability to water and ions
of gill epithelium.
The observed pathological alterations in gills of Labeo dyocheilus from
polluted and control sites are including necrotic area, epithelial disquamation, non
specific inflammation and vacuolation and oedema. Gills of this fish from polluted
sites 1 and 2 had 44% and 48% necrotic area, 46% and 50% epithelial disquamation,
43% and 53% non specific inflammation and had 45% and 51% vacuolation and
oedema and had 15% necrotic area, 11% epithelial disquamation, 12% non specific
inflammation and 9% vacuolation and oedem from control site respectively. The gills
of this examined fish showed more percentage of pathological lesions like non
specific inflammation and lower percentage of necrotic area. Histopathological
alterations in gills of Labeo dyocheilus from River Kabul being observed in this study
are in agreement with many studies that examined the effects of different pollutants
on fish gills (Jon, 2011; Mirjana et al., 2011).The marked histopathological alterations
in fish gills of this study may be due to the cumulative effect of increased metal
concentration in the gills. This study found more histopathological disorders in gills

290
from polluted sites than those from reference site. This could be related to heavy
metals toxicity in the gills from polluted water.
Gills of Cyprinus carpio from polluted and control sites showed three
pathological abnormalities like epithelial disquamation, non specific inflammation
and necrotic area. The gills of this fish from polluted sites showed 39% and 46%
epithelial disquamation, 36% and 48% non specific inflammation and 37% and 43%
necrotic area and showed 8% epithelial disquamation, 9% non specific inflammation
and 11% necrotic area from control water (Warsak dam) respectively. In this fish
pathological abnormalities like non specific inflammation showed high percentage
and necrotic area showed low percentage. Significantly higher Zn, Ni, Cr, Cu, Cd, Pb,
Mn, Fe and Hg content in gills could be linked to the occurrence of above mentioned
alterations in gills of Cyprinus carpio in response to metal exposure of this fish to
polluted water of River Kabul. Histopathological changes associated with heavy
metals in fish have been studied by many authors (Mohammad et al., 2013; Rask et
al., 1990). The present study found more pathological alterations in gills than muscle
and less disorder than liver and intestine. This could be because of gerater
concentration of heavy metals and directly and constantly exposur of this tissue to
heavy metals in water. Gills came third after liver and intestine followed by muscle
for pathological abnormalities.
Two histopathological lesions such as clumping of gills lamellae and non
specific inflammation were found in gills of Ompok bimaculatus from polluted and
control sites of River Kabul respectively. Gills of Ompok bimaculatus from polluted
water had 51% and 57% clumping of gills lamellae and had 41% and 50% non
specific inflammation and had 9% clumping of gills lamellae and 11% non specific
inflammation from control water respectively.This fish showed greater percentage of
clumping of gills lamellae and lower percentage of non specific inflammation. High
zinc intake leads to enfeeblement, retardation of growth and may bring about

291
metabolic and pathological changes in various organs in fish (Ambrose et al.,
1994).The overall order of percentage of different abnormalities in gills was non
specific inflammation > epithelial disquamation > necrotic area > clumping of gills
lamellae > disquamation and distortion of secondary lamellae with epithelial cell
exuudate and in different studied fish species was Labeo dyocheilus > Cyprinnus
carpio > Ompok bimaculatus > Wallago attu> Aorichthys seenghala. This reveales
that non specific inflammation showed more percentage and disquamation and
distortion of secondary lamellae with epithelial cell exudate showed less percentage.
Similarly Labeo dyocheilus showed maximum pathological lesions and Aorichthys
seenghala showed lowest alterations. Greater pathological conditions in Labeo
dyocheilus could be attributed to omnivorous nature of this fish and being an
omnivorous it is more exposed to toxic heavy metals accumulation. Due to heavy
metals toxicity, the gills of this fish showed maximum frequency of patholgical
lesions.

292
Table 6.3: Histopathological lesions (%) in gills of five different fish species
netted from site 3 (control) and site 1 and site 2 (polluted) of River
Kabul receiving city sewages and industrial effluents.
Fish Lesions Site 3 (%) Site 1 (%) Site 2 (%)
Wallago attu
Disquamation and distortion of
secondary lamellae with epithelial
cell exudates
6 33 41
Clumping of gills lamellae 5 42 48
Aorichthys seenghala
Necrotic area 9 35 40
Epithelial desquamation 7 38 44
Labeo dyocheilus
Necrotic area 15 44 48
Epithelial desquamation 11 46 50
Non specific inflammation 12 43 53
Vacuolation and oedema 9 45 51
Cyprinus carpio
Epithelial desquamation 8 39 46
Non specific inflammation 9 36 48
Necrotic area 11 37 43
Ompok bimaculatus
Clumping of gills lamellae 9 51 57
Non specific inflammation 11 41 50

293
Wallago attu
Aorichthys seenghala
DSCE: Disquamation and distortion of secondary lamellae with epithelial cell exudate
CGL: Clumping of gills lamellae NA: Necrotic area ED: Epithelial desquamation
Fig. 6.18: Histopathological lesions (%) in gills of Wallago attu and
Aorichthys seenghala netted from site 3 (control) and site 1 and site
2 (polluted) of River Kabul receiving city sewages and industrial
effluents.

294
Labeo dyocheilus
Cyprinus carpio
NA: Necrotic area ED: Epithelial disquamation NSI: Non specific inflammation
VO: Vacuolation and oedema NA: Necrotic area
Fig. 6.19: Histopathological lesions (%) in gills of Labeo dyocheilus and
Cyprinus carpio netted from site 3 (control) and site 1 and site 2
(polluted) of River Kabul receiving city sewages and industrial
effluents.
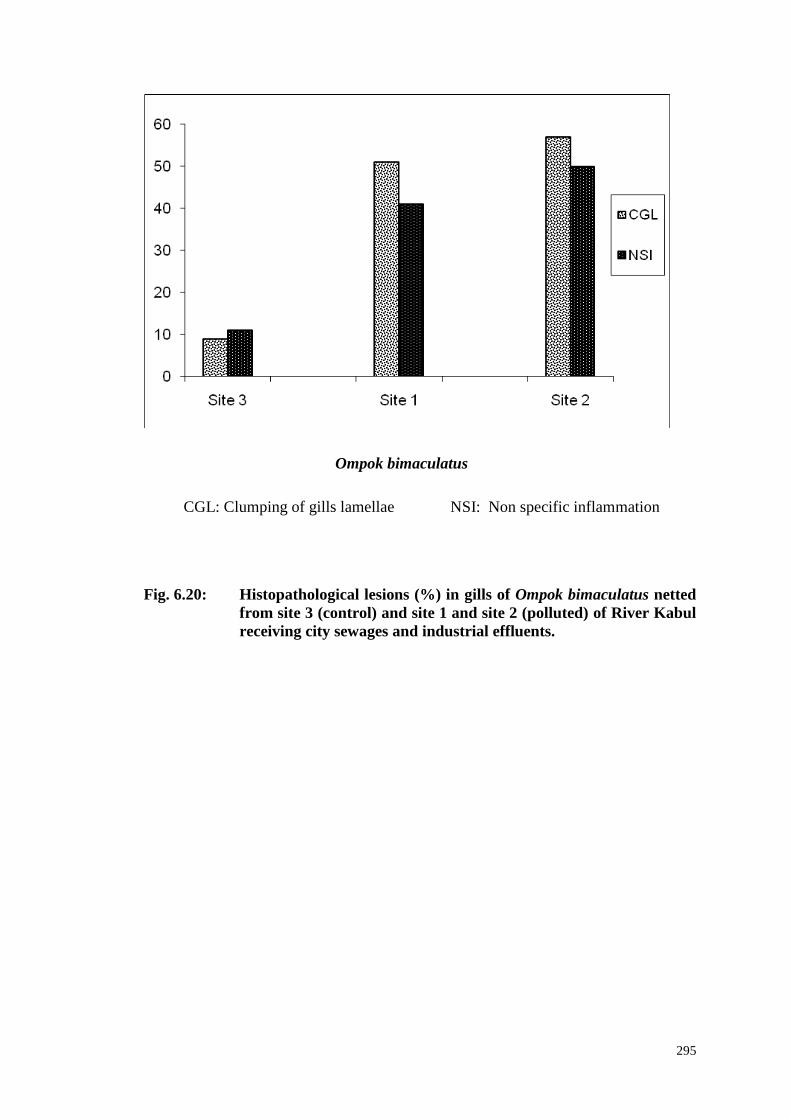
295
Ompok bimaculatus
CGL: Clumping of gills lamellae NSI: Non specific inflammation
Fig. 6.20: Histopathological lesions (%) in gills of Ompok bimaculatus netted
from site 3 (control) and site 1 and site 2 (polluted) of River Kabul
receiving city sewages and industrial effluents.
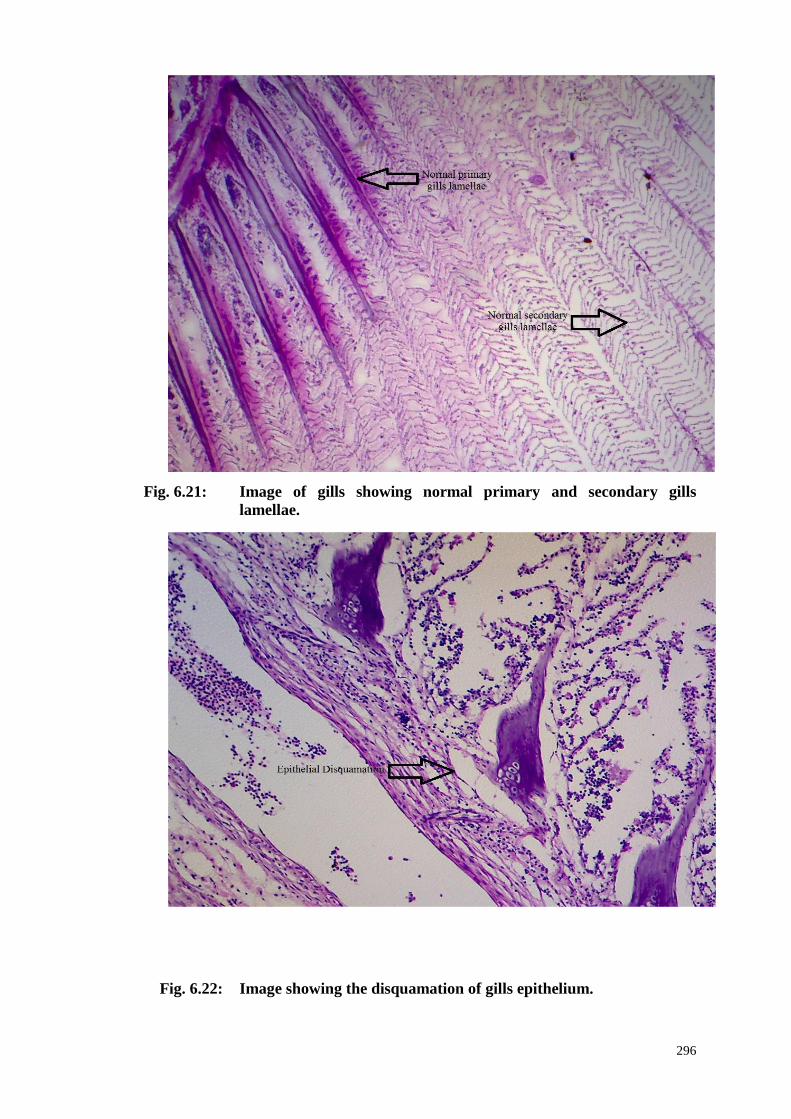
296
Fig. 6.21: Image of gills showing normal primary and secondary gills
lamellae.
Fig. 6.22: Image showing the disquamation of gills epithelium.

297
Fig. 6.23: Image showing the non-specific inflammation in gills lamellae.
Fig. 6.24: Image showing vacuolization and oedema in gills epithelium.
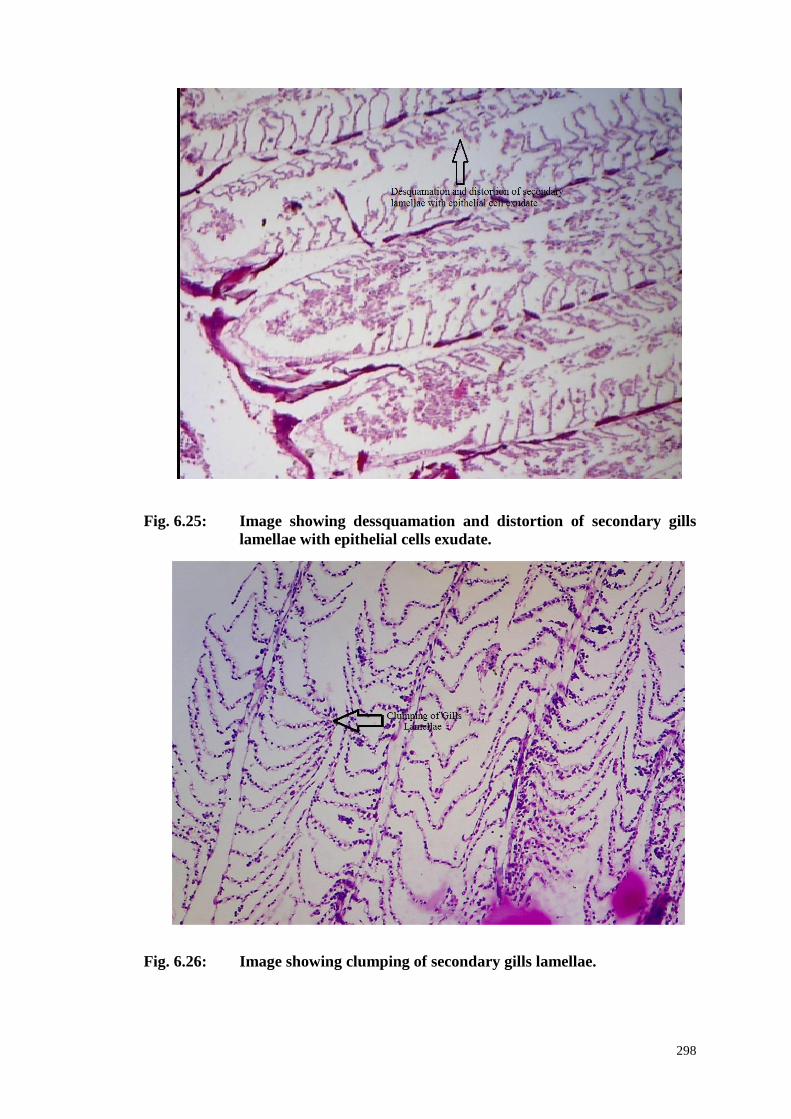
298
Fig. 6.25: Image showing dessquamation and distortion of secondary gills
lamellae with epithelial cells exudate.
Fig. 6.26: Image showing clumping of secondary gills lamellae.

299
Fig. 6.27: Image showing necrosis in primary gills lamellae (arrow).
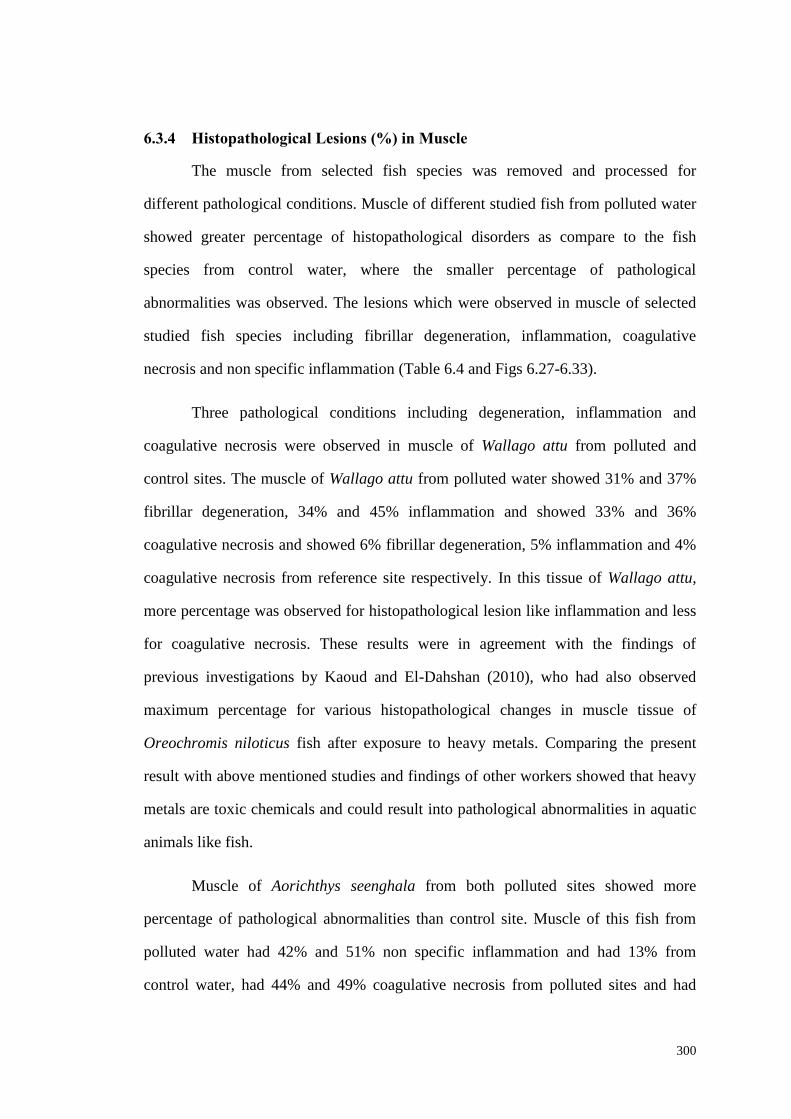
300
6.3.4 Histopathological Lesions (%) in Muscle
The muscle from selected fish species was removed and processed for
different pathological conditions. Muscle of different studied fish from polluted water
showed greater percentage of histopathological disorders as compare to the fish
species from control water, where the smaller percentage of pathological
abnormalities was observed. The lesions which were observed in muscle of selected
studied fish species including fibrillar degeneration, inflammation, coagulative
necrosis and non specific inflammation (Table 6.4 and Figs 6.27-6.33).
Three pathological conditions including degeneration, inflammation and
coagulative necrosis were observed in muscle of Wallago attu from polluted and
control sites. The muscle of Wallago attu from polluted water showed 31% and 37%
fibrillar degeneration, 34% and 45% inflammation and showed 33% and 36%
coagulative necrosis and showed 6% fibrillar degeneration, 5% inflammation and 4%
coagulative necrosis from reference site respectively. In this tissue of Wallago attu,
more percentage was observed for histopathological lesion like inflammation and less
for coagulative necrosis. These results were in agreement with the findings of
previous investigations by Kaoud and El-Dahshan (2010), who had also observed
maximum percentage for various histopathological changes in muscle tissue of
Oreochromis niloticus fish after exposure to heavy metals. Comparing the present
result with above mentioned studies and findings of other workers showed that heavy
metals are toxic chemicals and could result into pathological abnormalities in aquatic
animals like fish.
Muscle of Aorichthys seenghala from both polluted sites showed more
percentage of pathological abnormalities than control site. Muscle of this fish from
polluted water had 42% and 51% non specific inflammation and had 13% from
control water, had 44% and 49% coagulative necrosis from polluted sites and had

301
11% from reference site 3 respectively. Muscle of this fish showed higher percentage
of non specific inflammation and lower percentage of coagulative necrosis
respectively. More pathological lesions were found in muscle of examined fish
species from polluted water as compare to control water. The lesions in this finding
confirmed that exposure of the muscle to heavy metals can induce histological and
pathological changes, as already mentioned in other studies (Damek and Sawicka,
2003; Zhang et al., 2005; Martin-Diaz et al., 2006; Raldua et al., 2007). Comparing
the present investigation with previous findings highlights that heavy metals are toxic
chemicals and could be correlated to pathological disorders in fish and other animals
including human beings. By making overall comparison, muscle came last after liver,
intestine and gills for histopathological disorders. This is because that muscle had less
heavy metals as compare to other examined tissues like liver, intestine and gills.
Different pathological conditions like inflammation, coagulative necrosis and
non specific inflammation were observed in muscle of Labeo dyocheilus from
polluted and control sites. In muscle of Labeo dyocheilus from polluted sites 1 and 2
percentage of inflammation were 43% and 51%, for coagulative necrosis were 36%
and 43% and for non specific inflammation were 37% and 42%. From site 3
percentage were 8%, 9% and 7% for inflammation, coagulative necrosis and non
specific inflammation respectively. This fish had maximum percentage of
inflammation and minimum percentage of coagulative necrosis respectively.
Histopathological changes were observed in Archosargus probatocephalus exposed to
copper (Cardeilhac et al„ 1979), in Tijapia niloiica exposed to lead acetate, mercuric
chloride and cadmium chloride (Balah et al., 1993), in Cyprinion mhaknsis exposed to
copper (Ghazaly et al., 1994), in Macropsobrycon uruguayanae exposed to cadmium
(Randi et al., 1996) and in Salmo trutta exposed to iron sulphate (Dalzell and
Macfarlane, 1999). Comparing the present result with the findings of above
mentioned studies indicates that heavy metals are toxic in nature and could result into
pathological alterations in fish.

302
More histopathological abnormalities were observed in muscle of Cyprinus
carpio from polluted water than control water. Muscle of this fish from polluted sites
1 and 2 contained 32% and 41% coagulative necrosis and 35% and 42% non specific
inflammation. From site 3 the muscle contained 7% coagulative necrosis and 6% non
specific inflammation respectively. This fish had greater percentage of pathological
conditions such as coagulative necrosis and smaller percentage of non specific
inflammation. The present result confirmed various pathological disorders in muscle
of different fish species after collection from polluted sites of River Kabul. These
alterations have also been reported for other fish species exposed to heavy metals
particularly lead and cadmium (Deore and Wagh, 2012; Patnaik et al., 2011; De Smet
and Blust 2001). The present result confirmed different pathological abnormalities in
muscle, which are also supported by the findings of other workers. This result proved
that heavy metals are toxic in nature and can induce pathological alterations in fish.
Three most prominent histopathological lesions including non specific
inflammation, fibrillar degeneration and coagulative necrosis were seen in muscle of
Ompok bimaculatus. Muscle of this fish from polluted sites showed 38% and 46%
non specific inflammation, 41% and 45% fibrillar degeneration and 40% and 47%
coagulative necrosis and showed 11% non specific inflammation, 13% fibrillar
degeneration and 9% coagulative necrosis from control site 3 respectively. In this
organ maximum percentage was observed for coagulative necrosis and minimum
percentage for fibrillar degeneration respectively. These results agree with the
findings of previous workers (Sabry et al., 2005; Deore and Wagh, 2012). The
percentage of these lesions in muscle was in the order of coagulative necrosis > non
specific inflammation > fibrillar degeneration and in different fish species was Ompok
bimaculatus > Labeo dyocheilus> Wallago attu> Aorichthys seenghala > Cyprinus
carpio. This shows that the percentage of coagulative necrosis was highest and that of
fibrillar degeneration was the lowest. Similarly more percentage of pathological
disorders was seen in Ompok bimaculatus and less in Cyprinus carpio. Muscle came

303
last for pathological conditions as compare to other tissues. This could be attributed to
less concentration of metals and high metabolic rate in this tissue. The present result
indicates that heavy metal contamination definitely affects the aquatic life of both
fresh and marine water. Hence, a scientific method of detoxification is essential to
improve the health of these economic fish in any stressed environmental conditions.
However, the high concentration of the analyzed metals in the whole body tissues
investigated could be due to the storage role played by these tissues. Fish
contaminated by heavy metals suffers from various pathological alterations. Our
result furtherly showed that heavy metals are toxic in nature and can induce different
histopathological abnormalities in aquatic organisms. The result also showed heavy
metals pollution in River Kabul.
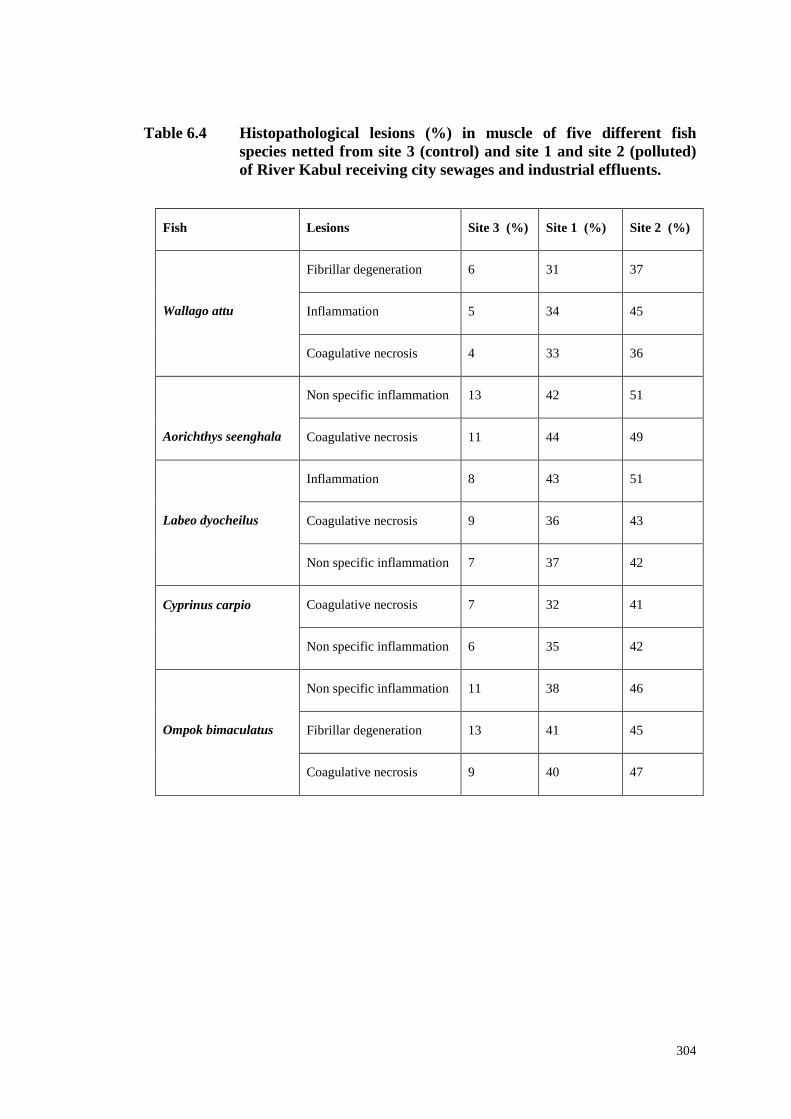
304
Table 6.4 Histopathological lesions (%) in muscle of five different fish
species netted from site 3 (control) and site 1 and site 2 (polluted)
of River Kabul receiving city sewages and industrial effluents.
Fish Lesions Site 3 (%) Site 1 (%) Site 2 (%)
Wallago attu
Fibrillar degeneration 6 31 37
Inflammation 5 34 45
Coagulative necrosis 4 33 36
Aorichthys seenghala
Non specific inflammation 13 42 51
Coagulative necrosis 11 44 49
Labeo dyocheilus
Inflammation 8 43 51
Coagulative necrosis 9 36 43
Non specific inflammation 7 37 42
Cyprinus carpio
Coagulative necrosis 7 32 41
Non specific inflammation 6 35 42
Ompok bimaculatus
Non specific inflammation 11 38 46
Fibrillar degeneration 13 41 45
Coagulative necrosis 9 40 47
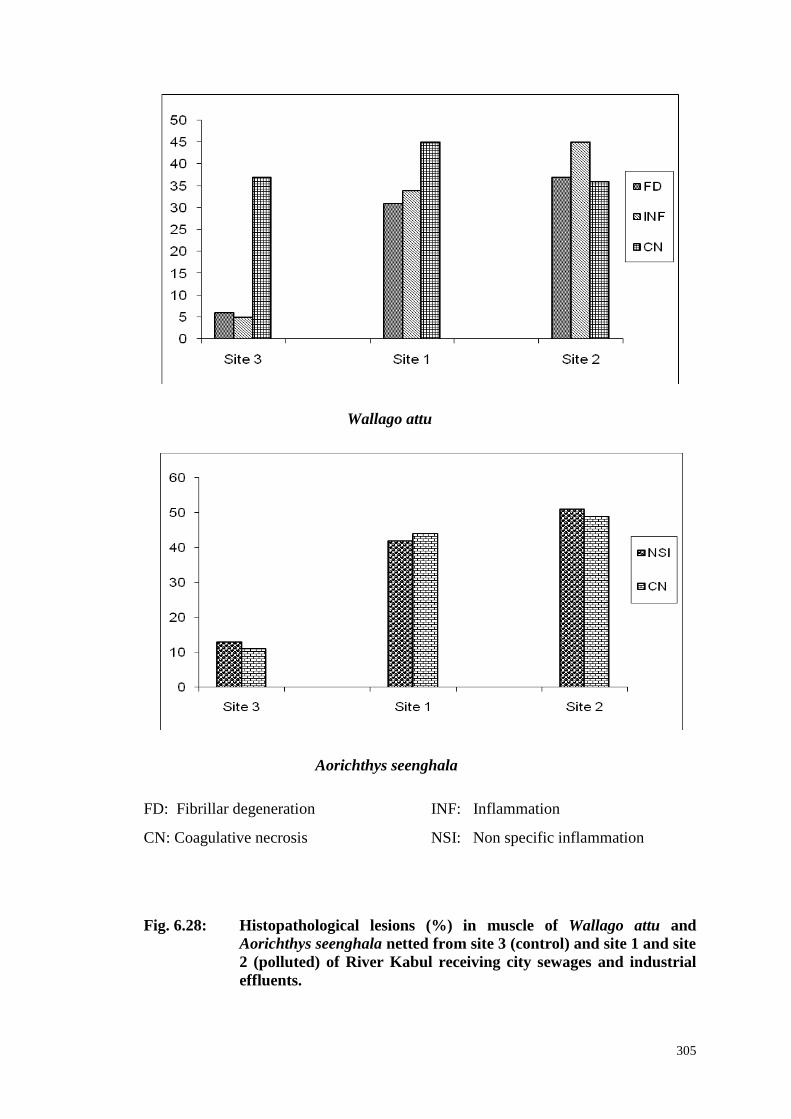
305
Wallago attu
Aorichthys seenghala
FD: Fibrillar degeneration INF: Inflammation
CN: Coagulative necrosis NSI: Non specific inflammation
Fig. 6.28: Histopathological lesions (%) in muscle of Wallago attu and
Aorichthys seenghala netted from site 3 (control) and site 1 and site
2 (polluted) of River Kabul receiving city sewages and industrial
effluents.

306
Labeo dyocheilus
Cyprinus carpio
INF: Inflammation CN: Coagulative necrosis NSI: Non specific inflammation
Fig. 6.29: Histopathological lesions (%) in muscle of Labeo dyocheilus and
Cyprinus carpio netted from site 3 (control) and site 1 and site 2
(polluted) of River Kabul receiving city sewages and industrial
effluents.

307
Ompok bimaculatus
NSI: Non specific inflammation FD: Fibrillar degeneration
CN: Coagulative necrosis
Fig. 6.30: Histopathological lesions (%) in muscle of Ompok bimaculatus
netted from site 3 (control) and site 1 and site 2 (polluted) of River
Kabul receiving city sewages and industrial effluents.
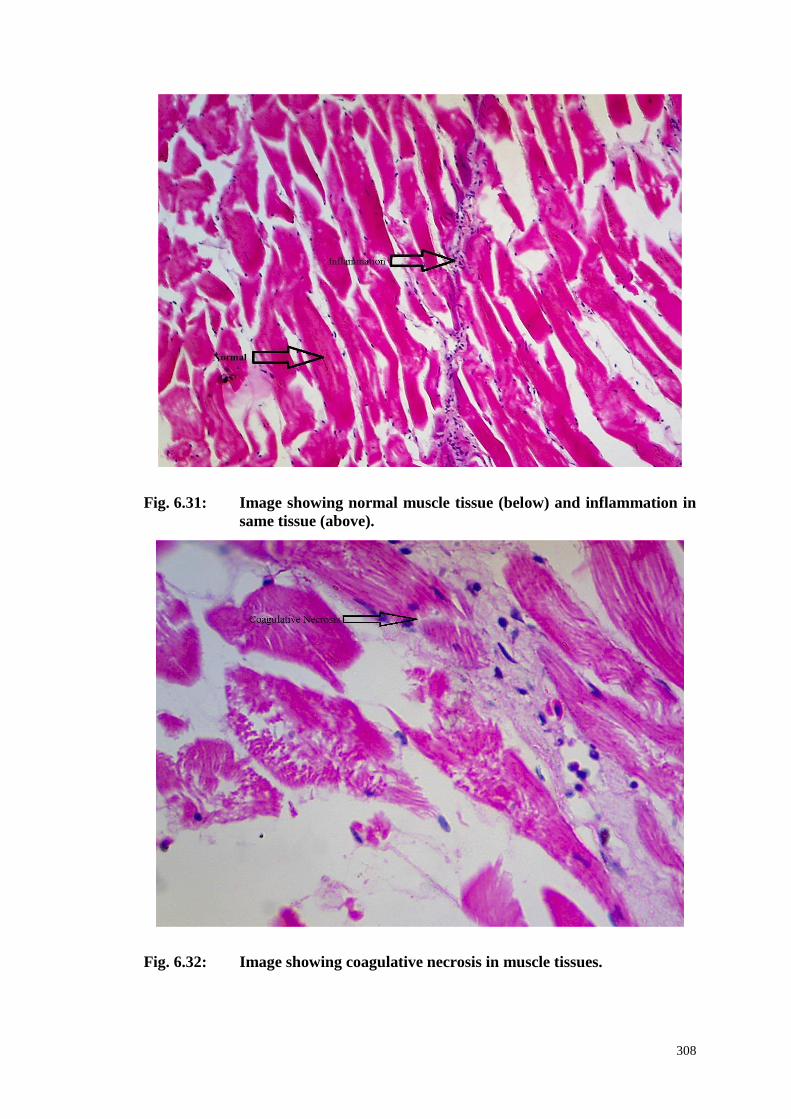
308
Fig. 6.31: Image showing normal muscle tissue (below) and inflammation in
same tissue (above).
Fig. 6.32: Image showing coagulative necrosis in muscle tissues.

309
Fig. 6.33: Image showing fibrillar degeneration in muscle tissue.
Fig. 6.34: Image showing non-specific inflammation in muscle tissue.
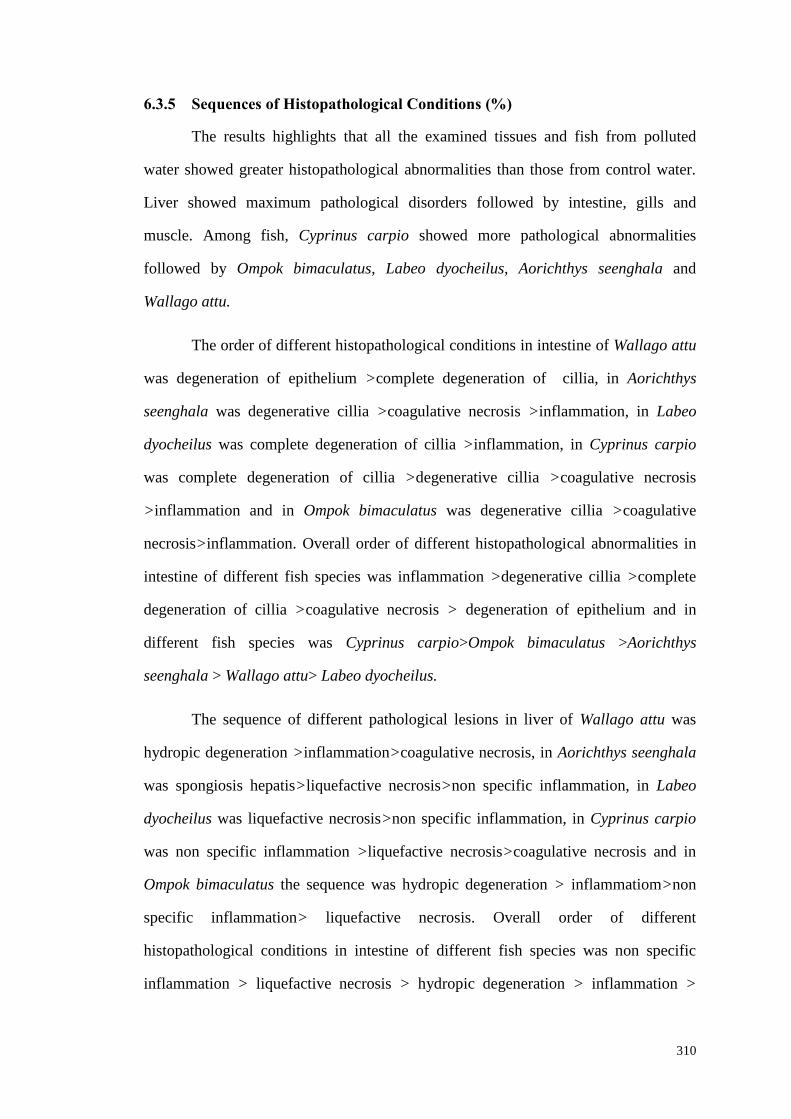
310
6.3.5 Sequences of Histopathological Conditions (%)
The results highlights that all the examined tissues and fish from polluted
water showed greater histopathological abnormalities than those from control water.
Liver showed maximum pathological disorders followed by intestine, gills and
muscle. Among fish, Cyprinus carpio showed more pathological abnormalities
followed by Ompok bimaculatus, Labeo dyocheilus, Aorichthys seenghala and
Wallago attu.
The order of different histopathological conditions in intestine of Wallago attu
was degeneration of epithelium >complete degeneration of cillia, in Aorichthys
seenghala was degenerative cillia >coagulative necrosis >inflammation, in Labeo
dyocheilus was complete degeneration of cillia >inflammation, in Cyprinus carpio
was complete degeneration of cillia >degenerative cillia >coagulative necrosis
>inflammation and in Ompok bimaculatus was degenerative cillia >coagulative
necrosis>inflammation. Overall order of different histopathological abnormalities in
intestine of different fish species was inflammation >degenerative cillia >complete
degeneration of cillia >coagulative necrosis > degeneration of epithelium and in
different fish species was Cyprinus carpio>Ompok bimaculatus >Aorichthys
seenghala > Wallago attu> Labeo dyocheilus.
The sequence of different pathological lesions in liver of Wallago attu was
hydropic degeneration >inflammation>coagulative necrosis, in Aorichthys seenghala
was spongiosis hepatis>liquefactive necrosis>non specific inflammation, in Labeo
dyocheilus was liquefactive necrosis>non specific inflammation, in Cyprinus carpio
was non specific inflammation >liquefactive necrosis>coagulative necrosis and in
Ompok bimaculatus the sequence was hydropic degeneration > inflammatiom>non
specific inflammation> liquefactive necrosis. Overall order of different
histopathological conditions in intestine of different fish species was non specific
inflammation > liquefactive necrosis > hydropic degeneration > inflammation >

311
coagulative necrosis >spongiosis hepatis and in different fish species was Ompok
bimaculatus > Aorichthys seenghala > Cyprinus carpio > Wallago attu > Labeo
dyocheilus.
The sequence of different pathological lesions in gills of Wallago attu was
clumping of gills lamellae>disquamation and distortion of secondary lamellae with
epithelial cell exudate, in Aorichthys seenghala was epithelial disquamation >necrotic
area, in Labeo dyocheilus was non specific inflammation > vacuolation and
oedema>epithelial disquamation >necrotic area, in Cyprinus carpio was non specific
inflammation>epithelial desquamation >necrotic area and in Ompok bimaculatus the
sequence was clumping of gills lamellae>non specific inflammation. Overall order of
different histopathological conditions in gills of different fish species was non specific
inflammation>epithelial disquamation >clumping of gills lamellae>necrotic area >
vacuolation and oedema>disquamation and distortion of secondary lamellae with
epithelial cell exudate and in different fish species was Labeo dyocheilus>Cyprinus
carpio>Ompok bimaculatus >Wallago attu >Aorichthys seenghala.
The order of different histopathological abnormalities in muscle of Wallago
attu was inflammation>fibrillar degeneration>coagulative necrosis, in Aorichthys
seenghala was non specific inflammation>coagulative necrosis, in Labeo dyocheilus
was inflammation>non specific inflammation>coagulative necrosis, in Cyprinus
carpio was coagulative necrosis>non specific inflammation and in Ompok
bimaculatus was coagulative necrosis > non specific inflammation> fibrillar
degeneration respectively. Overall order of different histopathological conditions in
different fish species was coagulative necrosis>non specific inflammation>
inflammation > fibrillar degeneration and in different fish species was Ompok
bimaculatus > Labeo dyocheilus > Wallago attu > Aorichthys seenghala > Cyprinus
carpio.

312
6.3.7 Conclusions and Remarks
In the present investigation different histopathological conditions were
determined in intestine, gills, liver and muscle of five different fish species including
Wallago attu,Ompok bimaculatus, Labeo dyocheilus, Cyprinus carpio and Aorichthys
seenghala netted from both polluted and control sites of River Kabul. The observed
lesions in intestine of studied fish species were degeneration of epithelium, complete
degeneration of cillia, inflammatiom, coagulative necrosis and degenerative cilia, in
gills were disquamation and distortion of secondary lamellae with epithelial cell
exudate, clumping of gills lamellae, necrotic area, epithelial disquamation, non
specific inflammation, vacuolation and oedem, in liver were inflammatiom, hydropic
degeneration, coagulative necrosis, non specific inflammation, liquefactive necrosis
and spongiosis hepatis and in muscle were fibrillar degeneration, inflammation,
coagulative necrosis and non specific inflammation. The organs level of
histopathological alterations in Wallago attu was in the sequence of liver >muscle
>intestine >gills, in Aorichthys seenghala was in the order of liver > intestine >muscle
>gills, in Labeo dyocheilus was in the order of gills > muscle > liver> intestine, in
Cyprinus carpio was in the order of intestine >liver > gills > muscle and in Ompok
bimaculatus was in the order of liver>intestine >muscle>gills. Overall pathological
abnormalities in Wallago attu were highest in liver and lowest in gills, in Aorichthys
seenghala were more in liver and less in gills, in Labeo dyocheilus were maximum in
gills and minimum in intestine, in Cyprinus carpio were higher in intestine and lower
in muscle and in Ompok bimaculatus were greater in liver and smaller in gills.
Overall order of pathological lesions in different fish organs was liver >intestine >
gills > muscle and in different fish species was Cyprinus carpio > Ompok bimaculatus
> Labeo dyocheilus > Aorichthys seenghala > Wallago attu. This shows that more
histopathological abnormalities were found in liver followed by intestine and gills
while less lesions were observed in muscle. Similarly maximum histopathological

313
lesions were observed in Cyprinus carpio fish followed by Ompok bimaculatus,
Labeo dyocheilus, and Aorichthys seenghala and minimum in Wallago attu fish.
314
CHAPTER-7
CONCLUSIONS AND RECOMMENDATIONS
7.1 CONCLUSIONS
1. The industries in the vicinity of River Kabul discharge their effluents
containing high levels of TSS and Hg into the River Kabul. Thus raising the
levels of these parameters beyond the recommended levels of National
Environmental Quality Standards.
2. Some of the parameters like TSS and Hg still remain higher in downstream
water showing sublethal contents of contaminants in the water of River Kabul.
3. The fish accumulated heavy metals like Zn, Ni, Cr, Cu, Cd, Pb, Mn, Fe and
Hg in its various organs. The intestine generally accumulated highest metals
followed by skin, liver, gills and muscle.
4. The data generated in these studies confirm the presence of sublethal
concentrations of pollutants in the River Kabul that fish population is
surviving under stressful conditions, which is apparent from the
genotoxicological and pathological disorders and heavy metals load in the
bodies of inhabitant fish population.
5. The data generated also confirms the presence of pollution plug in the river at
Nowshera, which has created a barrier between the fish population of River
Indus and River Kabul. The migration of Cyprinus carpio, Ompok
bimaculatus, Aorichthys seenghala, Labeo dyocheilus and Wallago attu from
River Indus into spawning areas in River Kabul during breeding season has
also stopped, which in another reason for decline of these fish population in
River Kabul and also in River Indus.
6. The decline in the fish population, especially Cyprinus carpio, Aorichthys
seenghala, Ompok bimaculatus, Labeo dyocheilus and Wallago attu in River

315
Kabul can not only attributed to detrimental effect on adult fish health but also
on the fish eggs and seeds.
7. The damage to the fish health is indicated by genotoxicological and
histopathological abnormalities in the fish samples collected from polluted
portions of River Kabul.
7.2 RECOMMENDATIONS
1. The processing of industrial effluents, before their disposal should be
regulated by strict vigilance and effective legislation.
2. The industrial effluents and sewages should be detoxified before discharging
into River Kabul.
3. Strict environmental laws should be implemented and public awareness should
be created.
4. A general biomonitoring programing needed to be established where the
hydrological and geomorphological characteristics, the chemical and physical
water quality and the river vegetation are taken into consideration as these will
affects aquatic system.
5. To avoid harmful accumulation of heavy metals in the human system, the
gills, liver, intestine and skin should be discarded while processing fish for
consumption. Removal of these organs would drastically reduce the metal
intake.
6. The construction of Warsak dam on River Kabul without fish ladder has also
limited the Cyprinus carpio, Ompok bimaculatus, Aorichthys seenghala,
Labeo dyocheilus and Wallago attu into zones in Pakistan and Afghanistan.
This dam has blocked the migration of these fish from Pakistan to the breeding
areas in Afghanistan. Construction of the fish ladder in Warsak dam could be
helpful in the rural propagation of the fish population.
316
7. Illegal and indiscriminate fishing, even during spawning seasons, is another
reasons of Cyprinus carpio, Ompok bimaculatus, Aorichthys seenghala, Labeo
dyocheilus and Wallago attu decline. As this practice is not only harming the
adult’s population but is also destroying the fish seeds. Therefore strict
supervision by supervisory staff and social awareness is highly needed.
8. Uses of brutal means for fishing like electric currents, dynamite and addition
of chemicals should be avoided in the River Kabul and its tributaries. Because
these practices are destroying the fish population and its seeds and are even
detrimental to men and consuming chemical baited fish.
9. The general biomonitoring programme is needed to be established to check the
level of heavy metals and physico-chemical parameters in the River water on
rountine basis.

317
REFERENCES
Abbasi, S. A.; Soni, R., Nuria denricus. Environ. Poll. Sera. Ecol. Biol. 1984, 36, 75
82.
Abdel-Baky, I .E. Egypt. J. Aquat. Biol. Fish. 2001, 5, 79-98
Abdel meguid, N.; Kheirallah, A. M.; Abou-Shabna Adham, K.; Abdel-Momeim, A. J
of Bio. Sci. 2002, 2, 224-229.
Abdel-moneim, A.M.; Al-Kahtani, M.A.; Elmenshawy, O. M., Chemosphere, 2012,
88, 1028-1035
Abdel-Shafy, H.; Zidain, Z.; Aly, R.; El-GamaL I.; El-Water, N. Cairo, Egypt,1995,
19-23.
Adams, S. M.; Shepard, K. L.; Greeley, M.S.; Jimenez, B.D.; Ryon, M.G.; Shugar,
L.R.; Mccarthy J.F.; Hinton D.E. Marine. Environ. Resea J.1989, 28, 459-464.
Ademoroti, C. M. A. Environ. Chem. Toxicol. 1996, pp. 171 – 204.
Adeniyi, A. A.; Yusuf, K. A.; Okedeyi, O. O. Environ. Monit. Assess J. 2007, 137,
451-458.
Adeyeye, E.I. J. Sci. Indust. Res. 1993, 36, 333-337.
Adeyeye, E.I. Akinyugha, R. J. Febosi, M.E.; Tenabe, V.O. Aqua. 1996, 47, 205-214.
Aggett, P. J.; Erdman, J. W.; Macdonald, I. A.; Zeisel, S. H. Wiley-Blackwell. 2012,
506-20.
Ahmad, Ashiq. Unpublished notes, WWF Pakistan, Peshawar, 1993.
Alazemi, B.M.; Lewis, J.W.; Andrews, E.B. Environ. Technol. 1996, 17, 225-238.
Al-Sabti, K., Mut .Res, 1994, 335, 157-163.

318
Al-Sabti, K.; Metcalfe, C.D. Mut. Res. 1995a, 343, 121–135.
Al-Sabti, K. Mut. Res, 1995b, 335, 109-120.
Al-Sabti, K., Cytobios, 1986, 47, 147–154
Ali, D.; Nagpure, N.S.; Kumar, D.; Kumar, R.; Kushwaha, B.; Lakra, W.S. Food.
Chem. Toxicol. 2009, 47, 650–656.
Ali, A.; Baig1, N .Iqbal, S.; Begum ,J.; Nosheen, G. Arch. Environ .Sci.2012, 6, 62-
67.
Ali, D.; Nagpure, N.S.; Kumar, S.; Kumar, R.; Kushwaha, B. Chemosphere. 2008, 71,
1823–1831.
Ali, A., Water quality assessment of River Swat, Department of environmental
plaining and management, University of Peshawar. 1991, Pp, 13-28.
Allen, P. Arch. Environ. Contam. Toxicol. 1995, 29, 8-14.
Alloway, B. J.; Ayres, D.C. Blackie Academic U.K 1993, Pp, 140-149.
Aly, S. M.; Zaki, M. S., El-Genaidy, H. M. J. Egyptian. Veter. Med. Associ, 2003, 63,
331-342.
Akcha F.; Vincent, H. F.; Pfohl, L. A. Mut. Res. 2003, 534, 21–32.
Akhter, T. PMRC Research Center Kyber medical College Peshawar. 1983.
Akif, M.; Khan, A.R.; Sok, M. K.; Hussain, Z.; Abrar, M.; Muhammad, A. J. Chem.
Soc. Pak. 2002, 24, 106-111.
Amal, M. Yacoub.; Nahed. S.G. Int .J. Environ. Sci. Eng. 2012, 3, 1- 10
Ambrose, T.; Vincent, S.; Cyril, L. J. Environ. Toxicol. 1994, 4, 29-31.
Anadon, A.; Maria, J. M.; Ortiz, J. J. Bombay .Nat. Hist. Soc. 1984, 79, 225-230.
Andrade, V. M.; Silva, J.; Silva, F. R.; Heuser., V. D.; Dias, J. F.; Yoneama, M. L.;
Freitas, T. R. Environ. Mol. Mut. 2004, 44, 459–468.
Andreozzi, G.; Antonucci, R.; Affatato, C.; Gargiulo, G.; Battaglini, P. Anatom,
Histolo, Embryol. 1994, 23, 102-111.
319
Angelova, V; Ivanova, R; Delibaltova, V; Ivanov, K. Bio. Ind. Crop. Prod .2004, 19,
197-205.
Anon. Quality Criteria for Water. US EPA Office of Water and Hazardous Materials,
Washington DC, 1976.
Antonious, G.F.; Snyder, J.C., J. Environ. Sci. Hlth. 2007, 42 811-816.
Arabi, M. Bio.Trace. Elem. Res. 2004, 100, 229-245.
Arain, M.B; Kazi, T.G; Baig, J.A; Jamali, M.K; Afridi, H.I; Shah, A.Q; Jalbani, N;
Sarfraz, R.A Food. Chem. Toxicol.2009, 47, 242-248.
Arellano, J. M., Storch, V and Sarasquete, C. Ecotoxicol. Environ. Safe. 1999, 44, 62-
72.
Arvind, K., Ecolo. Poll. water, 2002, Pp 290.
Asaolu, S. S., Olaofe, O. Pak J. Sci. Ind. Res.2005, 48, 96-102.
Ashraf, W. Environ. Monit. Assess. 2005, 101, 311-316.
Ashraj, W. Environ. Monit. Assess. 2005, 10, 311-316.
Attam, B. S.; Sebaiel, A. E.; Noman, M. A.; Kassab,H. E. Food. Sci.Technol. 1997,
58, 1- 4.
Ateeq, B.; Farah, M. A.; Ahmad , W. Ecotoxicol. Environ. Safe. 2005, 62, 348–354.
Au, D.W.T. Marine.Poll. Bull. 2004, 48, 817-834.
Avenant, O. A.; Marx, H.M. Kruger National Park. Water SA. 2000, 26, 569-582.
Ayllon, F.; Garcia-Vazquez, E. Mut. Res.2000, 467, 177–186.
Azmat, R.; Talat, R. J. Appl. Sci. 2006, 6, 1974-1977.
Baby, J.; Jency, G.; Jeevitha, M.V. Int. J. Biosci. 2012, 9, 51-64.
320
Baeter,A. M., Chromium.vol.1 (ed. M. J Udy). Amercan chem.. Soci. Monog, 1956,
pp132.
Bahnasawy, M. H., Egypt.J. Aquat. Biol. Fish. 2001, 5, 99-125.
Baig, J.A; Kazi, T.G; Arain, M.B; Afridi, H.I; Kandhro, G.A; Sarfraz, R.A; Jamal,
M.K; Shah, A.Q. J. Hazard. Mater. 2009, 166, 662-669.
Bailey, G.; Hendricks, J.; Dashwood, R. Mut. Res. 1992, 267, 243-250.
Bailey, G.;Williams, D.;Hendricks, J.Environ. Hlth. Presp.1996, 104, 5-21.
Bain, W. 1st edition. Oxford University Press, Oxford. 1993, p. 358.
Bajc, Z.; Gacnik, K. S.; Jenci, V.; Doganoc, D.Z. Slov. Vet. Res. 2005, 42, 15-21.
Bajpayee, M.; Pandey, A. K.; Parmar, D.; Marthur, N.; Seth, P. K.; Dhawan, A.
Mut. Res. 2005, 565, 163–172
Baker, R.S.V. Toxicol. Environ. Chem.1984, 7, 191-212.
Bal, W.; S Kasprzak KS. Toxicol. 2002, 127, 55-62.
Balah, A.M.; El-Bouhy, Z.M.; Easa, M.E. Zagazig. Veter. J. 1993, 21, 351-364.
Balfours, J. Report of Punjab Province, Pakistan.1987.
Banik ., S ; Pritam., G.; Samir., M. J. Adva. Lab.Res. Bio.2011, Vol, 2.
Bano, Y.; Hassan, M. J. Environ. Sci. Hlth. 1990, 25, 67-85.
Banu, B.S.; Danadevi, K.; Rahman, M.F.; Ahuja, Y.R.; Kaiser, J Food.Chem.
Toxicol.2001, 39, 361–366.
Barak, N. A.; Mason, C. F. Sci. Tot. Environ. 1990, 92, 249-256.
Barbarae, B., Rac. Freshwater. Biol. 1977, 7, 235–244.
Basdeo, K.; Sanjay, P.; Shilpi, S.; Rashmi, S.; Ravindra, K.; Naresh, S.; Nagpure,
A. D.; Satish, K. S. Int. Aquat. Res. 2012, 4, 16-26

321
Beder, S. Ecologist. 1990, 20, 136-140.
Belpaeme, K.; Cooreman, K.; Kirsch-Volders, M. Mutat. Res. 1998, 415, 167-184.
Belpaeme, K.; Delbeke, K.; Zhu, L.; Kirsch-Volders, M. Mutagenesis. 1996, 11, 485-
492.
Benedetti, I. L.; Benedetti, A. M.; Biolognani, F.; Marini, M. Riv.Idro.Biol. 1981,20,
611-620.
Bernet, D.; Schmidt, H.; Meier, W.P.; Burkhardt-Holmand, P.; Wahli T.J. Fish. Dis.
1999, 22, 2534.
Berntssen, M. H. G.; Waagbo, R.; Toften, H.; Lundebye, A. K. J. Aqu. Nut. 2003
,93,175–183.
Bertin, G.; Averbeck, D. J Article, Review, Res Suppt, Non-U.S. Gov't. 2006,11,
1549-59.
Beveridge, M. C.; Stafford, E.; Coutts, R. Aqua. Fish. Man. 1985, 1, 41-53.
Bhaskaran, A.; May, D. R.; Weaver, M.; Tyler, R. Environ. Mol. Mut. 1999, 33, 177-
184.
Bhattacharya, A. K.; Chudhury, A.; Mitra, A., Res. J. Chem. Environ, 2001, 5, 1.
Bhattacharya, A. K. Mandal, S. N.; Das, S. K. Appl. Sci. Res. 2007, 2, 492-499.
Birag, W. S.; Black, J. A. John. Wiley and Sons INS, USA, 1980, 13, 349-366.
Bocher, P.; Cherel, Y.; Miramand, P.; Caurant, F.; Bustamante, P. Bioloie. ET.
Environ. Mar. 2003, 313, 25-39.
Bolognesi, C.; Rabboni, R.; Roggiere, P. Toxicol. Endocrinol. 1996, 113, 319–323.
Bosnir, J.; Puntaric, D.; Skes, I.; Klaric, M.; Simic, S.; Zoric, I.; Galic, R. College of
Anthro. 2003, 27, 31-39.
322
Bowden, R.D.; Buckwalter, M. R.; McBride, J. F.; Johnson, D. A.; Murray, B. K.
O.; Neill K. L. Mut. Res. 2003, 537, 1–9.
Bowen, H. J. M. Environmental chemistry of the elements. Academeic Press.London,
1979.
Brendler-Schwaab, S.; Hartman, A.; Pfuhler, S. Speit, G. Mut. 2005, 20, 245–254.
Bryan, G.W .Effects of pollutants on aquatic organisms. Canbridge University Press
Canbridge England,1976, Pp 7.
Bryan, M. D.; Atchison, G. J.; Sandheinrich, M. B. Can. J. Fish. Aquat. Sci. 1995, 52,
1630-1638.
Buckely.; Yoshida., Proc. Am. Chem. Soc. Nat. Meet. 1987, Pp, 194-229.
Buhler, D. R.; Stokes, R. M.; Caldwell, R. S. J. Fish. Res. Bd. Canada. 1977, 34, 918-
924.
Buikema, A. L.; Niederlehner, B. R.; Cairns, J. Water. Res. 1982, 16, 239-262.
Buschini, A.; Martino, A.; Gustavano, B.; Monfrinotti, M.; Poli, P.; Rossi, C.;
Santoro, M.; Orr, A. J. M.D.; Rizzoni, R. Mut. Res. 2004, 557, 119–129.
Butt, J. A. Pak. Agri. Res. Coun, 1989a.
Butt, J. A. Study of Physical Chemistry and biological parameters of Kabul River at
Nowshera; Department of Zoology University of Peshawar, 1989b.
Butt, J. A.; Mirza, M. R. Biologia, 1981, 27 (2).
Calamari, D.; Naeve, H.Tech paper 1994, 25, 1-118.
CAMP. Report of the Workshop on Conservation Assessment and Management Plan
for Freshwater Fishes of India, 1998, p156.
Campanella Annls. Chim.1987, 77, 637-642.
Canli, M.; Ay, O.; Kalay, M. Turk J. Zool. 1998, 22, 149-157.

323
Canli, M.; Furness, R.W. Chem. Ecol.1993, 8, 19-32.
Canli, M and Atli, G. J. of Environ. Poll. 2003, 121, 129-136.
Cardeilhac, P.; Simpson, C.; Lovelock, R.; Yosha, S.; Calderwood, H.; Gudat, J.
Aquaculture.1979, 17, 23, 1- 239.
Carvalho, M. L.; Pereira, R. A.; Brito, J. Sci. Total. Environ.2002, 292, 247-54.
Carvalho, M. L.; Santiago, S.; Nunes, M. L. Anal and Bioanal. Chem.Portugal.2005,
382, 426-432.
Cavas, T.; Ergene-Gozukara , S. Environ. Mol. Mut. 2005b, 46, 64–70.
Cavas, T.; Natasha N.; Garanko, Victor, V.; Arkhipchuk. Food. Chem. Toxicol.2005a,
43, 569–574.
Chandra, P.; Khuda, A. R. Ecotoxicol. Environ. safe. J. 2004, 58, 194-201.
Chang, L.; Magos, L.; Suzuki, T. Toxicology of Metals. CRC Press, Boca Raton, FL,
1996.
Chapman, D. Water Quality Assessment. London: Chapman and Hall, 1992.
Chaudhari, R.T; Lomte, V. S.; Sultana, M. J. Indl. Poll. Cont. 2002,18, 145-149.
Cheremision off, P. N.; Habib, Y. H. Water Sewage Works.1972, 119, 73-86.
Christopher, W.; Theodorakis.; Steven, J. D.; Surney, Lee, R.; Shugatt. Environ.
Toxicol. Chemi.J. 1994, 13, 1023–1031.
Clearwater, S. J.; Baskin, S. J.; Wood, C. M.; Mcdonald, D. G. J. Exp. Biol. 2000, 16,
2455–2466.
Coetzze, L. Bioaccumulation of metals in selected fish species and the effect of pH on
aluminium toxicity in a cichlid, Oreochromis mossambicus. M.Sc thesis, Rand
African University, South Africa, 1996.
Coetzee, L.; Dupreez, H. H.; Vanvuren, J. H. J. Water SA. 2002, 28, 221- 226.

324
Colburn, T. Environ. Hlth. Perspec. 1993, 101.
Collins, A.; Dusinska, M.; Franklin, M.; Somorovska, M.; Petrovska, H.; Duthie. S.
Environ Mol Mut. 1997, 30,139–46.
Connell, C. P. J. Experi. Marin. Bio. Ecol. 1976, 25, 285-312.
Cotelle, S.; Erard, J. F. F. Environ. Mol. Mut. 1999, 34, 246–255.
Cusimano, R.F. Brakke, D.F and Chapman, G.A. Can. J. Fish. Aquat. Sci. 1986, 43,
1497-1503.
Dahl, L.; Bjorkkjaer, T.; Graff, I. E.; Malde, M. K.; Klemenlen, BF. Tidsskr. Nor.
Laegeforen.2006, 126, 309-311.
Dalela, K. A .; Kumar and Sharma, R.B.,1984. Environ Poll. 1984, pp37.
Dalzell, D. J.; Macfarlane, N.A. J. Fish. Biol. 1999, 55, 301- 315.
Dalls and Day. A review Water Research commision Report 1993, Pp 240.
Dallinger, R.; Prosi, F.; Seger, H.; Black, H. Ecologia.1987, 73, 91-98.
Dally, H., Hartwig, A. Carcinogenesis. 1997,18, 1021e1026
Damek, P. M.; Sawicka, K. K. Toxicol. 2003,186, 1-10.
Dan, R.K. Nanda, N.K. Mut. Res. 1986, 175, 67–71.
Daniel, B.B.; Edward, A.K.John Wiley and sons Inc. 1995, pp 410-412.
Daoust, P.Y.; Wobeser, G.; Newstead, J. D.Veter. Pathol. 1984, 21, 1 93-101.
Dara, S. S. A text book of environmental chemistry and pollution control. S. Chand
and Company Ltd. Ram Nagar, New Delhi, 1993.
Das, S.; Kaviraj. Geobios.2000, 27, 69-72.
Davies, J.M. Lancet, 1978, 18, 384-389.
325
Day, F.Burma and Ceylon. Edward Arnold Pub, London, 1978.
De Flora, S.; Bagnasco, S.; Zanacchi, M. Mut. Res. 1991, 258, 285-320.
Demirezen, D .; Uruç, K. J. Marin. Sci. 2006, 74, 255-260.
Deore, S. V,; Wagh, S.B. J. Exper. Sci. 2012, 3, 35-38.
Desideri, D; Meli, M.A and Roselli, C. Microchem. J. 2010, 95, 174-180.
Desmet, H.B.; Dewachter, R.; Lobinski, H.; Blust, R. Aqua. Toxicol. 2011, 52, 269-
281.
Dethloff, G. M.; Bailey, H. C.; Maier, K. J. Arch. Environ. Contam. Toxicol. 2001,
30, 371-380.
Devaux, A.; Flammarion, P.; Bernardon, V.; Garric , J.; Monod G. Marin. Environ.
Res.1998, 46, 257–262.
Devaux A.; Pesonen M.; Monod G. Toxicol. In. Vitro. 1997, 11, 71–79.
Dix, H. M. John Wiley and Sons, New York, 1981.
Drum, W. H.; Hem, J. H.; Heidle, S. G. Geological survey. Circular, 643. U.S
Department of interior. Washingtone , D.C, 9171.
Dupler, D. Heavy metal poisoning. Gale Encyclopedia of Alternative
Medicine.Farmington Hills, MI: Gale Group, 2001.
Dutton, M. D.; Majewski, H. S.; Klaverkamp, J. E. Int. Assoc. Great. Lakes. Res.
Conf. 1988, 13, 9-14.
Dwaf (Department of water affairs and forestry), Aqua. Ecosys. 1996, Volume, 7
Dwyer, F.J.; Schmitt, C.J.; Finger, S. E.; Mehrel, P. M. J. Fish. Biol.1888, 3, 307-317.
Dzwonkowska, A., Hubner, H. Arch. Toxicol. 1986, 58, 152–156.
Ebrahimi, M.; Taherianfard, M. Iranian J. Fish. Sci. 2011, 10, 13-24.

326
El-Ezaby, M. M. Certain studies on the effect of some pollutants on freshwater fish.
Ph.D. Thesis. Fac. ScL Zagazig L niv.. Benha Branch. Egypt, 1994.
EI. Moselhy, K.M., J. Aqua. Biol. Fish. 1999, 3, 73- 83.
El-Rafi. H. Water pollution due to industrial heavy metal to the River Nile. M.Sc.
Thesis. Institute of Enironmemal and Research. Ain Shams Univ., Cairo.
Egypt, 1991.
Eiman, M. E.; Zamzam, H. A. Toxicol. Dev. Count., Cairo, Egypt.1996, 2, 379-392.
Elahee, K.B.; Bhagwant, S. Ecotoxicol. Environ Safe. 2007, 68, 361-371.
El-Rayis, O. A. M.; Ezzat, A. A. J. Boiassay. F.A.O.Fish. Res. 1987, 334, 57-66.
El-Serafy, S.S.; Abdel-Hameid, N.A.H.; El-Daly, A.A., Juveniles Egypt J of Aqua Bio
and Fish. 2009, 13, 151-172.
Elahee, K.B.; Bhagwant, S. Ecotoxicol. Environ.Safe, 2007, 68, 361-371.
Enrique, J. L.; Silva, E. Harold, A. B.; Jackeline, L. J. Env. Engg. 2007, 133, 397-
4039.
Ernest, H. A textbook of modern toxicology. 3rd edition, Published by John Wiley and
Sons, Inc., Hoboken, New Jersey, Canada, 2004.
Eric, E. Pane, A. H.; Wood, C. H. Aqua. Toxicol. 2004, 69, 11-24.
Espina, N. G.; Wesis, P. Mar. Environ. Res. 1995, 39, 309-312.
Fag, A, El-shehawi, A. M, Seehy, M. A. Afr. J. Biotech. 2008, 7, 606–612.
Fan, A. M. Adv. Mod. Environ. Toxicol, 1987,11, 87-125.
Farakas, A.; Salanki. J.; Speozoar, A. Water. Res. 2003, 37, 959-964.
Farombi, E.O.; Adelowo, O. A.; Ajimoko, Y,R.Int. J. Environ. Res. Public. Hlth.
2007, 4, 158-165.
Fatma, A. S.; Mohamed.; Nahed, S. G. J. Aqua. Biol. Fish.2005, 9, 41–80.
Fatma, A. S.; Mohamed. Global. Veter. 2008, 2, 205-218.

327
Faust, F.; Kassie, F.; Knasmüller, S.; Boedecker, R.H.; Mann, M.; Mersch-
Sundermann, V. Mut. Res. 2004,566, 209–229.
Fazal-i-Hadi, Sarin, F. M.; Akhtar, S. Sarhad. J. of Agricul. 1988, 4, 5.
Fernandes, C.; Fernandes, A. F.; Cabral, D.; Salgado, M. A. J. Environ. Monit.
Assess.2007, 136, 267-275.
Fernicola, C.; Govoni, S.; Coniglio, L.; Trabucchi, M. Giornale Italiano Dimedicina
Del Lavoro ed Ergonomia. 1985, 7, 175-180.
Figueiredo-Fernandes, A., A.; Fontainhas-Fernandes, E.; Rocha M.A. Arch. Environ.
Cont. Toxicol. 2006, 51, 626-632.
Filazi, A.; Baskaya, R.; Kum, C. Human. Experi. Toxicol. 2003, 22, 85-87.
Fleck, H. Introduction to Nutrition, 3rdedn. Mac Milan Publishing Co. Inc., New
York, 1976, Pp 552.
Flora, S.J.S. J. Environ. Biol. 2002, 23, 25-41.
Folmer, L. C.; Gardner, G. R.; Hichey, J.; Bonomelli.; Moody, T. Arch. Enviro
n.Contam. Toxicol. 1993, 25, 298-303.
Forstner, U.; Wittman, G.T.W. Heides. Berg. New Yor, 1981,Pp 336.
Forstner, U.; Prosi, F. Biol. Aspects. Freshwater, Poll. 1979, 129-161.
Freeman, H.; Sangalang, G.B.; Uthe, J.F.; Garside, E.T.; Daye, P.G. Arch. Environ
Contam. Toxicol. 1983, 12, 627-632.
Friberg, L.; Nordberg, G.; Vouk, V. Handbook on the toxicology of metals.
Elsevier/North-Holland, Biomedical Press, Amsterdam, New York, 1979.
Froese R.; Pauly, D. Fishbase. World Wide Web electronic publication. Available at:
http/www. fishbase.org, 2007.
328
Gabianelli, R.; Lupidi , G.; Villarini, M.; Falcioni, G. Arch. Environ. Contam.
Toxicol. 2003,45, 350–356.
Galvin, R. M. Water. SA. 1996, 22, 7-18.
Gardner, G.R.; P.P. Yevich. J. Fish Res Board of Canada. 1970, 27, 2185-2196.
Gauglhoffer, J. Met. Umwelt.1984, 8, 409-424.
Gauglhoffer, J.; Bianchi, V. Occurrence, analysis and biological relevance (ed. E.
Merian). VCH Publishers Inc., New York, USA, 1991.
Gedic, C. M.; Ewen, S. W. B.; Collins, A. R . Int. J. Radia. Biol.1992, 62, 313–320.
Geldiay, R.; Balık S. Bornova, İzmir, 1988. 97,519,
George, T.; Franklin, L. B.; David, H. S.; Metcalf, E.Wastewater Engineering
Treatment, Disposal and Reuse, 1979.
Gertraud, W.; Lennart, W.; Jens, G.; Holmer, S., Mut. Res. 2007, 628, 19-30.
Ghazaly, K.S.; Zari., T. A.; Attar, A. M. Egypt. Ger. Soc. Zool. J. 1994, 5, 43-56.
Ghazalv, K.S.; EI, Mefy, M. M.; Attia, S.L. Bull. Inst. Oceanogr. Fish.1992, 7, 43-
52.
Ginter, E.; Chorvatovicova, D.; Kosinova, A. Int. J. Vitam. Nutr. Res. 1989, 59, 161-
166.
Goksoyr, A.; Anderson, T.; Buhler, D. R.; Stegeman, J. J.; Williams , D. B.; Forlin,
L. Fish. Physio. Chem. 1991, 9, 1–13
Goldstein, R. M.; Weese, L. R. D. J of the American. Water. Res. Associ.1999, 35,
1133-1140.
Govt. of Pakistan position paper. Brief on water pollution. http:www.en
Viornment.gov.pk/PRO-PDF/ position paper/ Water %20 Pollution.pdf. 2010.
Gomaa, M.; Abou-Arab, A.; Badawy, A.; Naguib, K. Food. Chem.1995, 53, 385-389.
329
Gress well, R. K.; Huxeley, A. Standard Encyclopedia of the world River and lakes,
Weiden field and Nicholson, 1965.
Grisolia, C.K. Mut. Res. 2002, 518, 145–150.
Grobler, E.; Du Preez, H. H.; Van Vuren, J.H. J. Comp. Biochem. Physiol. 1989, 94,
207-214.
Grosell, M.; Boetius I.; Hansen. H. J. M.; Rosenkilde, P. Comp.Biochem.Physiol.
1996, 114, 229-23.
Gupta, M.; Pandey, N. N.; Tiwari, V. K.; SingH, R.; PrakasH, H.; Chaturvedi, C. S.Int
J. Adv. Res, 2013,1, 137-140.
Gutleb, A.; Helsberg, A.; Mitchell. C. Bull. Environ. Contam. Toxicol, 2002, 69, 523-
529
Haider, S.; Naithani, V.; Barthwal, J.; Kakkar, P. Bull. Environ. Contam. Toxicol,
2004, 72, 119-127.
Halim, M.A; Majunder, R.K; Nessa, S.A; Oda, K; Hiroshiro, K; Saha, B.B; Hussain,
S.M; Latif, S.A; Islam, M.A; Jinno, K. Environ. Geol.2009, 58, 73-84.
Handy, R. D. Toxicol. Aqua. Poll.1996, Pp, 29-60.
Hanor, J. S. Environ. Geol. 1995, 26, 97-106.
Harris, E. D. Annu. Rev. Nutr. 2000, 20, 291 -310.
Hartwell, L. H.; Hood, L.; Goldberg, M. L.; Reynolds, A. E.; Silver, L. M and
Veres, R. C. McGraw Hill Higher Education, 2000, Pp 70–98.
Hayashi, M.; Ueda , T.; Uyeno, L.; Wada, K.; Kinae, N.; Saotome, K.; Tanaka , N.;
Takai , A.; Sasaki , Y. F.; Asano, N.; Sifuni, Y.; Ojimma, T. Mut. Res.
1998, 399, 125–133.
Heath, A. G. Water. poll. Fish. physio. 1991, 359.
Heath, A. G. Water. poll. Fish. physio. 1987,pp 145.
Heba, H. M.; Al-Edreesi, M. A.; Al-Saad, H.T.; Abdel Moneim, M. A. Bull. Nat.
Inst. Oceanogr. Fish. ARE. 2001, 27, 311- 322.

330
Hinton, D. E.; Lantz, R. C.; Hampton, J.A.; McCuskey, P.R.; Mccuskey, R.S.
Environ Hlth Perspec. 1987, 71,139-146.
Holdway, D. A. John Wiley and Sons, New Yark, USA, 1988, Pp 369-397.
Honda, K. Sahrul, M. Hildaka, H.; Tatsukawa, R. Agricul. Biolo. Chem.1983,
47,2521-2532.
Hooftman, R.N. Mut. Res.1982,104, 142–157.
Hsien Chen, M.; Young Chen, C. Marine. Poll. Bull. 1999, 39, 239-244.
Huang, Z. Y.; Zhang, Q.; Chen, J.; Zhuang, Z. X.; Wang, X. R. J. Appl. Organo. Met.
Chem.2006, 21, 101-107.
Huel, G.; Boudene, C and lbrahim, M. A. Arch. Environ Hlth. 1981, 36, 221-227.
Huong, M.; Jerome, C.; Justine, B.; Oliver, G.; Angel, B.; Helene, B.; Benedicte, M.
Marin. Poll. Bull. 2012, 64, 2663–2670.
IARC, International Agency for Research on Cancer, 1993, 58.
Ibok, U. J.; Udosen, E. D.; Udoidiong, O. M., Nig. J. Tech. Res. 1989, 1, 61-68.
Ibrahim, S.A.; Mahmoud, S.A. Egyptian J. Aqua. Biol. Fish. 2005, 9, 203-219.
Igwe, J.C; Abia, A.A. Afr.J. Biotechnol. 2006, 5, 1167-1179.
Igwilo, I. O.; Afonne, O. J.; Maduabuchi , U. J.; Orisakwe, O. E . Arch. Environ.
Occup. Hlth. 2006, 61, 205–208.
Iliopoulou, J.; Kotsanis, N. Bull. Environ. Contam. Toxicol, 2001, 66, 77-85.
IUCN (International Union for Conservation of Nature). Pollution and Kabul River,
An analysis and action plan. Environmental planning and Development Deptt
NWFP Pakistan, 1994.
IUCN. The red data book of endangered animals complied by the World Conservation
monitoring center. International Union for the conservation of natureand
natural resources. Gland. Switzerland.1990, pp 192.
Jaji, M. O.; Bamgbose, O.; Odukoya, O. O.; Arowolo, T. A. Environ.Moni. Assess.
2007,133, 473-482.
331
Jan, M.R.; Shah, J.; Shah, H. J. Chem. Soc. Pak. 2002, 24, 129-133.
Jan, F.A; Ishaq, M; Ihsanullah, I; Asim, S.M. J. Hazard. Mater.2010, 176, 609-616.
Janssen, C. R.; Schamphelaera, K. D.; Heijerick, D.; Muyssen, B.; Lock, M.; Bossuyt,
B.; Vangheluwe, M.; Van Sprang, P. Ecol. Risk. Assess.2000, 6, 1003-1018.
Jarrup, L.;Berglund, M.; Elinder, C.G.; Nordberg, G.; Vahter, M. Scan. J. Environ.
Hlth. 1998, 24, 1-51.
Jarrup, L. Br. Med. Bull. 2003, 68, 167-182.
Jayakumar, P and Paul, V. I. Veter, Archiv, 2006, 76, 167-177.
Jeffree, R. A.; Warnau, M.; Oberhansli, F.; Teyssie, J. L. Marin. Poll. Bull.2006, 52,
1278-1286.
Jenning, J. R.; Rainbow, P. S. Mar Bio.1979, 50, 131 139.
Jenssen, D.; Ramel, C. Mut. Res. 1980, 75, 191–202.
Jezierska, B.; Witeska, M. Prusa. Siedlce. Poland. 2001, Pp107.
Jha, A.N. Mutagenesis.2008, 23, 207–221.
John, D. Z. Hand book of drinking water quality standards and control. Van
Nostrrand Rein hold Publications. New Yark, 1990, Pp, 34-151.
Johnson, V. G.; Peterson, R. E.; Olsen, K. B. Environ. Monit. Iranian. J.Fish. Sci.
Assess.2005, 110, 3, 271-289.
Jonathan, B. Y.; Maina,H. M. Nat. Sci, Jonathan. Maina, 2009.
Jonnalagadda, S.B; Mhere, G. Water Res.2001, 35, 2371-2376.
Joseph, C. A.; Salwa, M.; Bashir, S.Y.; Victor, O. O. American. J. Analy. Chem.2012,
3, 727-736.
Juresa, D.; Blanusa, M. Food. Addit. Cont. 2000, 20, 241-246.
Kalay, M.; Ay, P and Canil, M. Bull. Environ. Cont. Toxicol. 1999, 63, 673-671.
Kamin, K. Chemical Characteristics of the drinking water of NWFP part 1, PCSIR
Laboratries, Peshawar, 2001.

332
Kaoud., H.A.; El-Dahshan ., A.R. Nat. Sci.2010, 8, 10-22.
Karns, L. J. Control of Pollution of Kabul River and the Needed Legislation.
UNIDO/UNDP Report, 1977.
Kasprzak , K. S. Cancer. Inves. 1995, 13, 411-430.
Kavcar, P.; Sofuoglub, A.; Sofuoglub, S. C. Int. J. Hyg. Environ. Hlth. 2009, 212,
216-227.
Kavun, V.Y.; Shulkin ,V.M.; Khristoforova, N.K. Marine. Environ. Res.2002, 53,
219-226.
Kazi, T.G.; Arain, M.B.; Jamali, M.K.; Jalbani, N.; Afridi, H.I.; Sarfraz, R.A.; Baig,
J.A.; Shah, A.Q. Ecotoxicol. Environ. Safe. 2009, 72, 301-309.
Kelly, Y. M. Elsvier.Appl. Sci. Lomdon.1988, Pp, 231.
Khallaf, E.A.; Galal, M.; Authman. M. L. Egypt. Ger. Soc. Zool. 1998, 26, 39-74.
Khan, B.; Ullah, Z. Aquatic pollution due to industries in the River Kabul at
Amangarh Nowshera NWFP Pakistan. M.Sc thesis Peshawar University.
Peshawar, 1991.
Khan, S. A.; Mumtaz, K. J. Chem. Soc. Pak. 1997, 19, 205-210.
Khan, A. R.; Akif, M.; Khan, M.; Riaz, M., J. Chem. Soc. Pak. 1999, 21, 97-105.
Khan, R. A. Arch. Environ. Cont. Toxicol.2003, 44, 485-492.
Khan U. To study the effects of Deg Nullah on the groundwater quality of nearby
residential areas. MSc Thesis, IEER UET Lahore, Pakistan, 1996.
Khan, T.; Muhammad, S.; Khan, B.; Khan, H. J. Him. Earth. Sci. 2011, 44, 71-79.
Khan, S; Ahmad, I.; Shah, M.T; Rehman, S; Khaliq, A. J. Environ. Manage. 2009,
90, 3451-3457.
Khattak,R.; Rehman,A. Effect of disposal of industrial wastes on the quality of Kabul
River water and soil at Pirsanak, A final project report, NWFP Agriculture
University,1992.

333
Kim, G. B.; Lee, R. F.; Maruya, K. A.; Smalling, K.L. Soci. Environ. Toxicol. Chem.
Pensacola, 2000, p. 225.
Kim, L. Y.; Hyun, C. K. Ecotoxicol. Environ. Safe. 2006, 64, 288-297.
Kjellstrom, T.; Nordberg. G., Friberg. L.: Elinder, C; Kjellstrom, T.; Nordberg, G.
CRC Press. Boca. Raton. Florida.1985, 1, 179-197.
Klaassan, C.D. Drug. Metabol. Rev. 1976, 5, 165-196.
Klein, I. A.; Lang, M.; Nash, N.; Kirschner, S. L. J. Water. Poll. Cont. Fed. 1974, 46,
2653-2662.
Kotze, P. F. Aspects of water quality, metal contamination of sediment and fish in the
Olifants River, Mpumalanga. M.Sc. thesis, Rand African University, South
Africa, 1997.
Kotze, P.; Du Preez, H. H.; Van Vuren, J. H .J. Water. S.A. 1999, 25, 25, 99-110.
Krishnakumar, K.; Casillas, E.; Varanasi, U. Marin. Ecol. Prog. Series. 1994, 106,
249-261.
Krishnani, K.; Kailasa , K.; B.P.; Gupta. A. Tox. Hazard. Subst. Environ. Eng. 2003,
38, 645-655.
Krishna, A.K.; Satyanarayanan, M.; Govil. P.K. J. Hazard. Mater. 2009, 167, 366-
373.
Kumar, P. Y.; Prasad, A.K.; Patra; Ranjan, R.C.; Patra, D.; Swarup A.K and
Pattanaik. Ani. Nut. Feed. Technol.2008, 8, 115-119.
Kumar, R.; Nagpure, N.S.; Kushwaha, B.; Srivastava, S.K.; Lakra, W.S. Arch.
Environ. Cont. Toxicol.2009, 58, 123–130.
Kurelec, B. Marin. Environ. Res.1993, 35, 341–348.
Lamb, C. Water Quality and its Control. John Wiley and Sons, UK, 1985.
Landolt, M. L.; Kocan, R. M. Advan in Environ. Sci. Technol. 1983, 335-353.
Langard, S.; Norseht, T. Chromium. In: Handbook on the toxicology of metal, 1979,
56, 383-397.
334
Larsson, A.; Haux, C.; Sjobeck, M. Ecolo. Environ. Safe. 1985, 9, 250-281.
Latif, A. Khalaf, A. N.; Khaliol, B.Y. J. Fish. Biol.1982, 13, 45-46.
Latt, S. A.; Allen, J. W. Elsevier. Amste. 1977, Pp, 275–291.
Laurent. P. Gill internal morphology. In: Fish physio. Vol. XL Hoar, W. and Randall,
D. (eds.), 1984, Pp, 73-183.
Laws, E. A., Aquatic pollution. John Wiley, New Yark, 1981, Pp, 166-166.
Laxi, R. Hamalayan. J.Environ. Zool.2005, 19-23.
Lazorchak, J. M.; Mccormick, F. H.; Henry,T.R.; Herlihy, A.T. Environ. Toxicol.
Chem. 2003, 22, 545-53.
Lee, R.F.; Steinert, S.A.; Nakayama, K.; Oshima, Y. Environ. Toxicol. Risk. Assess.
1999, pp, 341–349.
Lee, R. F.; Steinert, S. Mut. Res.2003, 544, 43–64.
Lemos, D.; Rodel, C. T.; Rödel, P. M.; Terra, N. R.; Erdtmann, B. Environ. Toxicol
.Chem. 2001, 20, 1320–1324.
Lenntec,B.V. Chemical, health and environmetal effects of manganese.
Rotterdamsewa 402 M, Netherland, 1998.
Leonard, S. S.; Harris, G. K.; Shi, X. L. Free. Rad. Biol. Med. 2004, 37, 1921-1942.
Li, Z. H.; Zlabek ,V.; Turek, J.; Velisek, J.; Pulkrabova, J.; Kolarova, J.; Sudova,
E.; Berankova, P.; Hradkova, P.; Hajslova, J.; Randak, T. Water. Res. 2011,
45, 1403–1413.
Lide D. CRC Handbook of Chemistry and Physics. 73rd Edition. Boca Raton, FL:
CRC Press, 1992.
Linde, A. R.; Galan, S. S.; Izquierte, J. I.; Arribas, P.; Maranon, E.; Vazques, E. G.,
Marin. Poll. Bull, 2002, 40, 120- 125.
Livingstone, D. R. Marin. Poll. Bull.2001, 42, 656–666.
Loka, B. P. A.; Sathe, V.; Chandramohan, D. Environ. Poll.1990, 46, 24-28.
Lopez-Barea, J. Toxicol. Lett. 1996, 88, 77–79.

335
Lundebye, A. K.; Berntssen, M. H. G.; Bonga, S. E.W.; Maage, A. Marin. Poll.
Bull.1999, 39, 137-144.
Luo, S. Q.; Plowman, M. C.; Hopfer, S.M.; Sunderman, F. W. J.Ann. Clin. Lab.
Sci.1993, 23, 121-129.
Maccubin, A. E.; Earsing, N.; Frank, M. E. J. Great. Lakes. Res.1991, 17, 314-321.
Malle, K.G. The int. J. Gastroentero. 1992, 4, 1-11.
Mamaca, E.; Bechmann, R. K.; Torgrimsen, S.; Aas, E;. Bjørnstad, A.; Baussant ,
T.; Le Floch, S. Aqua. Toxicol. 2005, 75, 191–201.
Manoguerra, A. S.; Erdman, A. R.; Booze, L. L.; Christianson, G.; Wax, P. M.;
Scharman, E. J Clin Toxicol. 2005, 43, 553-70.
Mansour, S. A.; Sidky, M. M. Aqua. Toxicol. 2000, 1, 15-22.
Manzoor, S; Shah, M. H; Shaheen, N; Khalique, A; Jaffar, M. J. Hazard. Mater.2006,
137, 31-37.
Mapanda, F.; Mangwayana, E. N.; Nyamangara, J.; Giller, K.E. Phys. Chem. Earth..
2007, 32, 1399-1405.
Marijic, V. F.; Raspor, B. J. Marin. Poll. Bull.2007, 54, 935-940.
Martin-Diaz, M. L.; Tuberty, S. R.; Mckenney, C. L.J.; Blasco, J.; Sarasquete, C.;
Delvalls, T. A. Environ Monit. Assess, 2006,116, 169-184.
Maruya, K. A.; Vetter, W.; Wakeham, S. G.; Lee, R. F.; Francendese, L. American
Chem Soci, Washington, 2000, pp. 164–175
Masoud, S. M.; Samra, E. I. M.; Sadawy, E. M. M. Environ Monit. Assess 2007, 23,
201-216.
Masroor, F.; Iqbal, A.; Iqbal, S.; Mohammad, A.; Sheikh, R. Aqua. Toxicol J. 2000,
49, 243-250.
Matthew, L. John, Wiley and Sons. 1992, 140-311
Matsumoto, S. T.; Janaina, R.; Mario, S. M.; Maria, A. M . Caryologia. 2005, 58,
40–46.

336
Mccarter, J. A.; Roch, M. Comp. Biochem. Physio.1983, 74, 133- 137.
Mccarter, J. A.; Matheson, A. T.; Roch, M.; Olafson, R.W.; Buckley, J .T. Comp.
Biochem. Physiol. 1982, 74, 133-137.
Mcgeer, J. C.; Szebedinsky, C.; Mcdonald, D. G.; Wood, C. M. Aqua. Toxicol. 2000,
50,245 -256.
Medina, J.; Hernandez, F.; Pastor, A.; Beferfuli, J. B.; Barbera, J.C. Mar.Poll. Bull.
1986,17, 41-44.
Mendez, L.; Castaneda, A.; Acosta, B.; Beltran, S. Marin. Poll. Bull. 2002, 44, 217-
221.
Merian, E. Metals and their compounds in the environment. Occurrence Analysis and
Biological Relevance (eds). UCH, Weinheim- New York-Basel-Cambridge,
1991,369-378.
Mertz, W. Physiolo. Rev.1969, 49, 163-239.
Metwally, M.; Magdy, E.; Mahfouz, Samir, A.M.; El-Shazly, Gamal, H.; Abdel, R.;
Sayed , B. J. Fish. Marine Sci. 2010, 2, 174-185.
Mighall, T.M.; Grattan, J.P.; Timberlake, S.; Lees, J.A.; Forsyth, S. Environ. 2002, 2,
175-184.
Mirjana, L.; Zoran, G. Z.; Branka, V. G.; Vesna, P.; Željka, V. J.; Stojimir, K.; Ivan,
J. Seria Ştiinţele Vieţii. 2011, 21,855-860.
Mitchelmore, C. L.; Chipman, J. K. Aqua. Toxicol. 1998, 4, 161–182.
Mitchell, S.; Kennedy, S. Sci. Total. Environ. 1992, 115, 235–240.
Mishra, A. K.; Mohanty B. Chemosphere. 2009, 76, 982–988.
Mohammad, M. N.; Authman.; Seham , A.; Ibrahim.; Midhat , A.; El-Kasheif.; Hanan
S. G. Global. Veterinaria.2013, 10, 103-115.
Mohamed, F. A. E. S. Egypt. J. Aqua. Bio. Fish. 2003, 7, 99-138.
Monkolprasi, S. J. Article ISEW, Thailand, 1983, 36, 540- 547.

337
Monteiro, S.M.; Mancera, J.M.; Fontainhas Fernandes, A.; Sousa, M. 2005. Comp
Biochem. Physiol. 141, 375-383.
Moore, M. J.; Mitrofanov, I.V.; Valentini, S.S.; Volkov, V. V.; Kurbskiy, A.V.;
Zhimbey, E. N.; Eglinton, L. B.; Stegeman, J. J. Marine. Poll. Bull, 2003,
46, 107-119.
Morsey, M. G.; Protasowicki, M. Acta. Ichthyol. Piscat. 1990, 45, 50-62.
Muhammad, S; Shah, M.T.; Khan, S. Microchem. J. Doi. Microc, 2011, 3- 12
Muhammad, A.; Shah, F. M.; Asadullah.; Bangash, G. N.; Zeb, H. Sarhad. J.
Agric.1998, 14, 235-240.
Muralidharan, S.; Jayakumar, R.; Veerakumar, N.; Suresh, N., Heavy metals
contamination in the fishes of selected high altitude water bodies in the
National park Bhara, Ph.D thesis Univsity of Rajasthan India, 1997.
Mozaffarian, D.; Gottdiener, J. S.; Siscovick, D. S. Am. J.cardial. 2006, 97, 216-222.
Myers, M. S.; Johnson, L. L.; Olson, O.P.; Stehr, C.M.; Horness, B. H.; Collier
T.K.; Mccain, B. B. Marine. Poll. Bull. 1998, 37, 92-113.
Nafees, M.; Ghulam, K. Environmental impact assessment of Amangarh industries
estate Nowshera. M.Sc thesis submitted to Peshawar University, 1991.
Naghshbandi, N.; Zare, S.; Heidari, R.; Palcheglu, S. S. Pak. J. Biolo. Sci.2007,10,
3245-3247.
Nagpure, N. S.; Hilpi, S.; Sanjay, P.; Ravindra, K.; Satish, K.; Srivastava, M. S.;
Verma.; Kapoor ,D. Indian. J. Fish. 2008, 55, 285-288.
Nathainel, I. T.; Salami, A.T.; Olajuyigble, A. C. Afri. J. Ent.Studies. 2000, 1, 9-17.
NAS. Air borne lead in perspective. National Research Council, National Academy of
Sciences, Washington, DC, 1972.
Nawab,B. Evalution of sewage water pollution in Peshawar city. Department of
environmental plaining and management, Unversity of Peshawar, 1992.
Nehls, S.; Segner, H. Environ. Toxicol. Chem. 2005, 24, 2078–2087.
338
Nemcsok, J.; Orban, B.; Asztalos.; Vig, E. Bull. Environ. Contam. Toxicol. 1987, 39,
370-378.
Nero, V.; Farwell, A.; Van Der, K.; Lee, G. L. E.; Van Meer, T. Ecotoxcol. Environ.
Safe.2006, 63, 365-377.
Nevenka , K.; Perica, M.; Davor, Z.; Ivana, B.; Marko, C.; Zoran , M.; Mirta, M.;
Zdravko, D. Mut. Res. 2008, 12, 20-30.
Nies, D. H. Appl. Microbio. Biotech.1999, 51, 730-750.
Norseth, T.; Piscator, M. Elsevier/ North Holl. Biomedical Press Amsterdam, 1979,
541-545.
Noordhuis, R. Grou. Bull. 2002, 19, 75- 86.
Numann, W. Hidrobiyol Monog. 1958, 7, 114.
Nussey, G., Water SA. 2000, 26, 269-284.
Nwaedozie, J. M. J. Chem. Soc. Nigeria. 1998, 23, 21-23.
Obiakor, M. O.; Okonkwob, J. C.; Ezeonyejiaku, C. D. Mut. Res.2014, 20-30.
Olaifa, F. E.; Olaifa, A. K.; Adelaja, A. A.; Owolabi, A G. African. J.biomed.
Res.2004, 7, 145-148.
Olowu, R. A.; Ayejuyo, O. O.; Adewuyi, G. O.; Adejoro, I. A.; Denloye, A. A. B.;
Babatunde, A. O.; Ogundajo, A. L. E-J of Chem. 2010,7, 215-221.
Olson, P. A.; Foster, R. F. Hanford. Biol. Res. Annu. Rep.1956, 35-47.
Olyan, B. A. H.; Thamas, B. V. Deptt, of chemistry Kuwait University, Kuwait.2005,
21,199-197.
Omar, W.A.; Zaghloul, K. H.; Abdel-Khalek, A. A.; Abo-Hegab, S. Mut. Res. 2012,
746, 7– 14.
Onwumere, B. G.; Oladimeji. Exotocicol. Enivion. Safe. 1990, 19, 123-134.
Orecka, G.T. Grabda, O. T. Acta. Ichthyol. Piscat.1986, 16, 107-127.
Ozkan, F.; Gunduz, S. G.; Berkoz,M.; Hunt,A.O. Turk.J.Zool. 2011, 35, 585–592.
Pacheco, M.; Santos, M. A. Ecotoxicol. Environ Safe, 2002, 53, 331-347.

339
Palaniappan, P.; Kathikeyan, S.; Sabhanayakam, S. Poll. Res. 2003, 22, 247-250.
Pandey, S.; Nagpure , N.S.; Kumar, R.; Sharma, S.; Srivastava , S. K.; Verma,
M.S. Ecotoxicol. Environ. Safe. 2006, 65, 56–61.
Pandrangi, R. M.; Petras, S.; Ralph.; Vrzoc, M. Environ. Mol. Mut.1995, 26, 345-
356.
Pant, J.C.; Gill, T.S. Indian. J.Phys. Nat. Sci. 1984, 4, 12-17.
Parameswaran, S.; Selvaraj, C.; Radhakrishnan, S. Proc. Nat. Acad Sci India. 1970,
40, 145- 157.
Patnaik, B.B.; Hongray, H. J.; Theresia M.; Selvanayagam, M. African J.
Biotech.2011, 10, 12218-12223.
Peebua, P.; Kruatrachue, M.; Pokethitiyook, P.; Singhakaew, S. J. Environ. Biol.
2008, 29, 325-331.
Peraza, M.A.; Ayala-Fierro, F.; Barber, D.S.; Casarez, E.; Rael, L.T. Environ. Hlth
Perspec. 1998,106, 203–216.
Peerzda., N.; Mcmorrow., L.; Skiliros., S.; Guine., M.; Ryan. Sci. Total. Environ.
1990,92,1 - 12.
Peters, N.; kohler, A .; Kranz, h. J. Disease Aqua. Org. 1987, 2, 7-97.
Peuranen, S.; Vuorinen, P.; Vuorinen, M.; Hollcnder., A. Zool. Fenn. J. 1994, 31,
389-396.
Phan, K; Sthiannopkao, S; Kima, K.W; Wong, M.H; Sao, V; Hashim, J. H; Yasin, M.
S. M; Aljunid, S.M., 2010. Water Res. 2010, 44, 5777-5788.
Phillips, D. J. H. Mar. Poll. Bull. 1995, 31, 193-200.
Piclet, G. Cah. Nut. Diet.1987, 23, 317-336.
Ping, W.; Lewis, C.; Richard, L.; Batiuk, C. ASCE. J. Env. Engg. 2006, 132, 377-383.
Popek, W.; Dietrich, G.; Glogowski, J.; Demska-Zakes, K.; Drag-Kozak, E.;
Sionkowski, J.; Luszczek-Trojan, E. Reprod. Bio. 2006, 6,175-188.
Powers, D. A. Fish as model systems. Sci, 1989, 246, 352-358.
340
Pruski, A. M.; Dixon, D. R. Aqua. Toxicol. 2002, 57, 127–137.
Ptashynski, M. D.; Klaverkamp, J. F. Coreg. Clupeaf. Aqua. Poll. 2002, 58, 249-264.
Ptashynski, M. D.; Pedlar, R.M.; Evans, R.E.; Baron, C.L.; Klaverkamp, J. F. Aqua.
Toxicol.2002, 58, 229-247.
Puel, D.; Zsuerger, N.; Berittmayer, J. P. Bull. Environ. Catam. Toxicol. 1987, 38,
700-706.
Quan, W. M.; Han, J. D.; Shen, A. L.;Ping, X. Y.; Qian, P. L.; Li,J. Shi, L. Y. Marin.
Environ. Res. 2006.
Rafique. Pak J. Zool 2001, 33, 279-288.
Rahman, A. K. A. Zool. Soci. Bang. 2005, 254-263.
Rainbow, P. S. Environ. Int. 2007, 33, 576-582.
Rajaguru, P.; Suba, S.; Palanivel, M.; Kalaiselvi, K. Environ. Mol. Mut. 2003, 41, 85-
91.
Rakesh, K.; Steven, G.; Effler, W. ASCE. J. Env. Engg.2007, 133, 139-148.
Rakesh, V. Int J. Adva. Fish. Aqu Sci. 2013, 1, 39-48.
Raldua, D.; Diez, S.; Bayona, J. M.; Barcelo, D. Chemosphere.2007, 66, 1217-1225.
Ramalingam, K.; Ramalingam, K. Ani. Sci. 1982, 91, 501- 505.
Ramalingam, K. Environ. Ecol. 1988, 6,761-762.
Ramakar J.; Ojha CP.; Bhatia KS. ASCE. J. Env. Engg. 2005, 131, 1706-1715.
Randolph, J.; Howard, C. University of Houston Chear Lake, Houston, TX, U. S. A,
2004.
Rashed, M. N. J. Environ. Int. 2001, 27, 27-33.
Rask, M.; Vuorinen, P.J.; Vuorinen, M. J. Fish. Biol. 1990, 36, 317-325.
Ratanatrivong, W.; Anurakchanachai, N.; Rungpiboonsophit., P. J. Environ. Int.
2008, 13, 02-28.

341
Rattan, R.K.; Datta, S.P.; Chhonkar, P.K.; Suribabu, K.; Singh, A.K. Agric. Ecosyst.
Environ. 2005, 109, 310- 322.
Raychaudhuri, S.; Misher, M.; Salodkar, S.; Sudarshan, M.; Thakur, A.R. Ameri. J.
Environ. Sci. 2008, 4, 173-177.
Regoli, F.; D. Pellegrini, G.W.; Winston, S.; Gorbi, S.; Giuliani, C.; Virno-Lamberti,
S. Marine. Poll. Bull.2002, 44, 912-922.
Reifferscheid, G.; Grummt, T. Water. Air. Soil. Poll.2000, 123, 67–79.
Reilly, C. Metal contaminnation of food. Applied Science Publishers Londan, 1980.
Roberts, J. R. J. Environ. Int. 1999, 31, 170-179.
Robinson, B.; Bus, A.; Diebal, B.; Froehlick, E.; Grayson, B. Fish. Biol. 2004. 30,
217-225.
Roesijadi, G.; Robinson, W. E. Aqua. Toxicol.1994, 539.
Roganovic-Zafirova, D.; Jordannova, M. Macedonian Ecolog, Soci. 1988, 51, 530-
544.
Rogers, J. T.; Richards, J. G.; Wood, C. M. Aqua. Toxicol. 2003, 64, 215-234.
Rojas E.; Lopez, M. C.; Valverde, M. J. Chroma.1999, 722, 225-254.
Roncero, V. E.; Duran, F.; Soler, J.; Masot L.; Gomez. Environ. Res.1992, 57, 45-48.
Ribeiro, D.O.; Belger, C.A. L.; Pelletier, E.; Rouleau, C. Environ Res, 2002, 90, 217-
225.
Richard, F.; Lee.; Steinert, S. Mut. Res.2003, 544, 43–64.
Risso-De Faverney, C.; Devaux, A.; Lefaurie, M.; Girard , J. P.; Bailly, B.;
Rahmani, R. Aqua. Toxicol. 2001, 53, 65–76.
Ruelas, I. J.; Osuna F. P. Environ. Int.2002, 28, 325-329.
Sabae, S.Z.; Abdel-Satar, A. M. J Egypt. Acad. Soc. Environ. 2001, 2,173- 197.
Sabry, S.; El-Serafy.; Seham , A.I.; Soaad, A . M. Egypt. J. Aqua. Biol. Fish.2005, 9,
81 – 96.

342
Saleh, M. A.; Fouda, M. M.; Abdel lattif, M. S.; Wilson, B. L. J. Arch. Environ. Cont.
Toxicol. 1987, 17, 391-403.
Salomons, W.; Forstner U. Pesticid. Biochem and Physio. 1984, 100, 206-211.
Sarkka, J.; Hatulla, M. L.; Paasivirta, J.; Janatiunem, J. Finland. Holarctic. Ecol.
1978, 1, 326- 332.
Sastry, K.V.; Gupta, R.K. Bull. Environ. Contam. Toxicol.1978, 19, 549-555.
Schuhamcher, M.; Bosque, M. A.; Domingo, J. L.; Corbella. Bull. Environ. Conatm.
Toxicol.1990, 44, 784-789.
Segner, H.; Braunbeck, T. Fish. Physio. Biochem. 1988, 5, 79-97.
Sephar, R. L.Floridae J. Fish. Res. Bd.Canada. 1976, 33, 1939-1945.
Sekhar, K. C.; Chary, N. S.; Kamala, C. T.; Suman, D. S.; Sreenivasa, R. A. Instite.
Chem. Technol. 2004, 7, 1001-1008.
Serpi, U.; Ayla, C.; Ozlem, F.C.; Aysin, G. Oxford j, Life. Sci. Med. Mutag.2006, 21,
77-81.
Seymour T. Bioaccumulation of metals in Barbus marequensis from the Olifants
River, Kruger National Park, and lethal levels of Mn to juvenile Oreochromis
mossambicus . M.Sc thesis, Rand Afrikaans University, South Africa, 1994.
Shahidi, F.; Botta, J. Sea. Food. Chem. 1994, 10, 3-29.
Shahunthala, D. Fish. Bull, 1989, Pp3-6.
Sharon, B. Science and Australian Case Study, the Ecologist, 1990, 20, 136-140.
Shukla, V.; Pratima, R.; Sastry, K. V. Himalayan J. Environ, 2001, 15, 129-136.
Shugart, L.; Bickham, J.; Jackim, G.; McMahon, G.; Ridley, W.; Stein, J.; Steinert, S.
Lewis Publishers, Boca Raton, FL. 1992, 125–153.
Shukla, V.; Dhankhar, M.; Prakash, J.; Sastry, K. V. J. Environ. Biol. 2007, 28, 395-
397.
Sigel, A.; Sigel, H. Series: Metal Ions in Biological Systems. Marcel Dekker, Inc.
NewYork, Vol.36, 1992.

343
Singhal, R.N.; Jain, M. Bull. Environ. Contam. Toxicol. 1997, 58, 456- 462.
Singh, V.N. Biol. Sci. 1983, 53, 213- 216.
Singh, R. K.; Chavan, S. L.; Sapkale, P. H. Environ. Monit. Assess. 2006, 129, 471-
481.
Siraj, M.; Shaheen, M.; Sthanadar, A. A.; Khan, A.; Chivers, D.P.; Yousafzai, A. M.
J. Bio. Environ. Sci. 2014, 4, 40-54.
Smith, T. M. Environ. Hlth. Perspect. 1996, 6, 1219–1225.
Smith, R. J Great. Lakes. Res. 1990, 16, 139–142.
Sokheng , C.; Chhea, C. K.; Viravong, S.; Bouakhamvongsa, K.; Suntornratana, U.;
Yoorong N.;Subramaian, V. Asian. J.Water. Environ. Poll. 2004, 1, 41-54.
Somasundaram, B. Mar. Biol. 1985, 85, 199-207.
Sorensen, E.M.B. CRC Press Inc., Austin, Texas, Boston. 1991, pp, 374.
Somero, G. N.; Tsaiwas, J. C.; Yancey, P. H.; Synder, C.B. Arch. Environ. Cont.
Toxicol.1977, 6, 337-388.
Soufy, H.; Soliman, M .K.; El-Manakhly, E.M.; Gaafar, A.Y. Global. Veter.2007, 1,
45-52.
South African Water Quality Guidelines. volume 6, second edition. Department of
Water Affairs and Forestry. Private Bag X313, 1996.
Sprague, J. B. Water. Res. 1969, 3, 793-821.
Srivastava, A. K.; Agarwal, S. J.; Chaudhry, H. S. Ecotoxicol. Environ. Safe.1979, 3,
321-324.
Steel, E.W. Water Supply and Sewerage (6th ed.), London: McGraw Hill, 1995.
Steinert, S. A. DNA damage as a bivalve biomarker. Biomarkers. 1999, 4, 492–496.
Stentiford, G.D., M.; Longshaw, B.P.; Lyons, G.; Jones M.; Green, S.W. Mar.
Environ. Res. 2003, 55, 137-159.
Stohs, S. J.; Bagchi , D. Free. Radic. Biol. Med.1995, 18, 321-336.
344
Summerfelt, R. C.; Mauck, P.E.; Mesinger, I. Southeast, Asso, Game Fish Comm.
1971, 24, 352-377.
Sunderman, F. W. J.; Dingle, B.; Hopfer, S. M.; Swift, T. American. J. Indus. Med.
1988,14, 257-266.
Sunderman, F.W J.; Plowman, M. C.; Hopfer, S. M. Ann. Clin. Lab. Sci. 1991, 21,
81-391.
Swee, J. T.; Adams, S.M.; David, E. H. Aqua. Toxicol. J.1997, 37, 1, 51-70.
Szebedinsky, C.; Mcgeer, J. C.; Mcdonald, D. G.; Wood, C. M. Environ. Toxicol.
Chem. 2001, 20, 597 -607.
Tahiri, M.; Benyaich, F.M.; Bilal, E.; Gruffat, J. J.; Moutee, J. Environ. Monit. Assess.
2005, 102, 405-417
Tebbut,T.H.Y. Principles of water quality control. 3rd
ed. Pergamon Press,
Oxford,1983. pp.42.
Theodora, C .W. D.; Surney, S. J.; Shugart , L. R. Environ. Toxicol. Chem. 1994, 13,
1023–1031.
Thielen, F.; Zimmermann, S.; Baska, F.;Taraschewski, H.; Sures, B. J. Environ.
Poll.2004, 129, 421-429.
Tice, R.R. Biomonitors and Biomarkers as Indicators of Environmental Change,
Plenum Press, New York. 1995, 69–79.
Tipping, E.; Lawlor, A. J.; Lofts, S.; Shotbolt, L. Environ. Poll.2006, 141, 139-150.
Tjalve, H.; Gottofrey, J.; Borg, K. Water. Res.1988, 22, 321-324.
Tsuchuya, K. Lead. In: Handbook on toxicology of metals (eds, L. Friberg, F. G.
Nordberg and V. B, Vouk), 1979, Pp, 451-484.
Turkmen, A.; Turkmen, M.; Tepe, Y.; Akyart, I. Turkey. J. Food. Chem.2005, 91,
167-172.
Tuzen, M. Food. Chem. 2003, 80, 119-123.
Urán, P.A.; Schrama, J. W.; Jaafari, S.; Baardsen, G.; Rombout, J.H.W.M.; Koppe,
W.; Verreth, J.A. J. Acqua. Nutrit. 2009, 15, 492-499.

345
Uluozlu, O. D.; Tuzen, M.; Mendil, D.; Soylak, M. Turkey .J. Food. Chem. 2007, 14,
835-84.
Underwood, E. J. Trace elements in human and animal nutrition. 4th edn. Academic
press, New Yark, 1977, Pp 1-9A.
USMAB. Comp. Biochem. Physio.1989, 106, 655-660.
Valko, M.; Morris , H.; Cronin , M. T. Curr. Med. Chem. 2005, 12, 1161-208.
Valverde, M.; Trejo, C.; Rojas, E. Mut. 2001, 16, 265-270.
Van Loon, J.W.; Ellen, G.; Tolsma, K.Z. Lebensm. Unters. Forsch. 1989, 189, 534-
537.
Vanranka,Z.; Rojik,I .; Varanka,I.; Nemcsok, J.; Abraham ,M. Biochem. Physiol.
2001, 128, 467-478.
Vigano, L. Camoirano, A. Izzotti, A. D´Agostini, F. Polesello, S. Francisci, C. De
Flora, S. Mut. Res. 2002, 515,125–134.
Vigano, L.; Camoirano, A.; Izzotti, A.; D. Agostini, F.; Polesello, S.; Francisci,
C.; Vosyliene, M. Z.; A. J ankaite. Ekologija. 2006, 4, 12-17.
Villarini, M.; Moretti, M.; Damiani, E.; Greci,L.; Santroni, A.M.; Fedeli, D.;
Falcioni, G. Free Radic. Biol. Med. 1998, 24, 1310–1315.
Wahid,A.; Muhammad,G. Impact of industrial effluents on wheat and aquatic fauna
(fishes) in River Kabul near Amangarh, M.Sc thesis DEPM Peshawar
University, 1992.
Waisberg , M.; Joseph , P.; Hale, B.; Beyersmann, D. Toxicol. 2003, 192, 95-117.
Wedemeyer, G.A.; Yasutake, W.T. J. Fish. Res. Board. Canada. 1978, 35, 822-827.
Weiner, J.; Krabbenhoft, D.; Heinz, G.; Scheuhammer, A. Ecotoxicology of mercury.
Hand book of Ecotoxicology, second ed. Boca Raton, Florida, CRC, 2003, p.
1312.
Wepener, W.; Vurenvan J. H. J.; Preezdu, H. H. Water SA. 2001, 27, 99- 108.
Wessling, R.M.; Ross, A.C.; Caballero. B.; Cousins, R. J.; Tucker, K. L.; Ziegler,
R.G. 11th ed. Baltimore, MD: Lippincott Williams. Wilkins. 2014, 176-88.
346
WHO. Methyl mercury. In: Environmental Health Criteria, vol. 101. World Health
Organization, Geneva, Switzerland, 1990.
Wilson, J. T.; Pascoe, P. L.; Parry, J. M.; Dixon, D. R. Mut. Res. 1998, 399, 87–95.
Wirzinger, G.; Weltje, L.; Gercken,J.; Sordyl, H. Mut. Res.2007, 628, 19–30.
Wong, C. K..; Wong, P. P.; Chu, L. M. J. Arch Environ. Contam.Toxicol, 2001, 40,
60-69.
Wong, M. H. Chemosphere.2003, 50, 775-780.
Woo, P. T. K.; Sin, Y. M.; Wong, M. K. Environ. Biol. Fish.1994, 37, 67- 74.
Wright, D. A.; Frain, J. W. Arch. Environ. Cont. Toxicol.1981, 10, 321-328.
WWF. Pollution monitoring of Hudiara drain. UNDP, GEF Pakistan, 2001.
Yacoub, A.M.; Abdel Satar, A.M. Egypt J of Aquat Biol. Fish. 2003, 7, 403-422.
Yadav, B. N. Fish and fisheries Daya publishing hous 1123/74 Deva Ram Park, Tri
Nagar, Delhi 110035, India, 1997, p-25.
Yap, C. K.; Ismail, A.; Chu, P. K. J. Water. Environ. Poll. 2005, 2, 65-70.
Yasser, A. G.; Naser, M. D. Environ. Monit. Assess. 2011, 181, 175-182.
Yingmei, Z.; Yejing, W.; Runliu, Y.; Sheng, Z.; Zhenbin, W. Acta. Hydrobio. Sinica.
2006, 30, 399–403.
Yilmaz, E.I. Microbio.2003, 154, 409-415.
Yilmaz, A.B. and Dogan, M. Faculty of Fisheries, Mustafa Kemal Univs Turkey,
2007, 65, 80-82.
Yılmaz, A.; Ozer, U.; Torunog˘lu, T.; Aksoy, S. Turkey. Fresen. Environ. Bull. 1998,
7269, 276.
Yousafzai, A. M. Toxicological effects of industrial effluents dumped in River Kabul
on Mahaseer, Tor Putitora at Aman Garh industrial area Nowshera, Peshawar,
Pakistan,” Ph.D. Thesis, University of the Punjab, Lahore, 2004.
Yousafzai, A. M.;Khan, A. R.; Shakoori, A. R. Pak. J. Zool. 2010a, 42,795-808.

347
Yousafzai, A. M.; Douglas , P.; Khan, A. R.; Ahmad, K.; Siraj, M. Pak. J.
Zool.2010b, 42, 537-544.
Yousuf, M. H. A.; Shahawi, M. S. E.; Ghais, S. M. A. Deptt of chemistry, Faculty of
Science, UAE Univs, 2000, 256, 87-94.
Zhang, Y. M.; Huang, D. J.; Wang, Y. Q.; Liu, J. H.; Yu, R. L.; Long, J. Bull of
Environ. Contam. Toxicol.2005, 75, 1191-1199.
Zhou, J., Ma, Z., Pan, J., Nie, W. & Wu, K. Environ. Geol. 2008, 54, 373-380.
Zia, S.; Mcdonald, D. G. Can. J. Fish. Aqua. Sci.1994, 51, 2482–2492.
Zouboulis, A. I.; Loukidou, M. X.; Matis, K. A. Process. Biochem.2004, 39, 909-916.
Zyadah, M.; Chouikhi, A. Int. J. Food. Sci. Nut.1999, 5, 429-434.