departures from equilibrium: coring, zoning, and dendrites · practical 21 materials and minerals...
TRANSCRIPT

Practical 21 Materials and Minerals ScienceCourse C: Microstructure CP5
1
Departures from Equilibrium: Coring, zoning, and dendrites
1.1 Introduction
The equilibrium phase diagram enables us to predict the sequence of events occurring during solidification. Typically, the phase diagram requires that the compositions of solid and liquid phases in equilibrium with each other evolve continuously during cooling. Equilibrium can only be maintained, therefore, if there is sufficient time for atomic diffusion to take place (i.e. if cooling is very slow). In most real situations, some departure from the expected equilibrium behaviour is inevitable. In this practical we explore some of the ways in which departures from equilibrium can occur, and the microstructural features associated with non-equilibrium behaviour. These concepts are important since varying the cooling rate allows us to control the type of microstructure that develops and therefore the physical properties of the material. In a rock, examining the microstructure of the minerals present provides information about their thermal history.
i. What is meant by the terms ‘coring’ and ‘zoning’ and the reasons why it occurs
ii. What is meant by the term ‘dendrites’ and why they form
iii. Be able to predict the microstructure of a simple eutectic system based on the information provided by the equilibrium phase diagram
iv. Understand how changing cooling rate might effect microstructure
v. Be familiar with the different types of microstructure observed in eutectic systems.
What you should know by the end of the practical!

Practical 21 Materials and Minerals ScienceCourse C: Microstructure CP5
2
1.2 Zoning and Coring
As you have seen in previous practicals, the first solid to form when a melt solidifies has a chemical composition very different from the bulk composition. As solidification proceeds, the compositions of the solid and melt must continuously adjust themselves in order to maintain thermodynamic equilibrium. This requires long-range diffusion of atoms within the solid and melt and exchange of atoms across the solid/melt interface, which will only occur if the system is cooled very slowly. If cooling is too fast, then there is insufficient time for diffusion to take place, resulting in chemical heterogeneities in the growing crystals (i.e. the core of the crystal, which formed first, has a different chemical composition to the outer rim, which formed last). This phenomenon is called zoning (in minerals) or coring (in alloys).
(a) Olivine is a natural mineral solid solution between the endmembers forsterite (Mg2SiO4) and fayalite (Fe2SiO4). The equilibrium phase diagram is shown in Fig. 1. For a bulk composition 50% Fayalite, determine the temperature at which solidification begins. What is the composition of the first solid phase to form at this temperature?
1900
1800
1700
1600
1500
1400
1300
1200
1100
1000
Tem
pera
ture
(°C
)
1009080706050403020100
Atomic % Fe2SiO
4
Forsterite
Mg2
SiO4
Fayalite
Fe2
SiO4
Melt
Solid Solution
Solidus
Liquidus
1205
Fig. 1. Phase diagram for the olivine solid solution

Practical 21 Materials and Minerals ScienceCourse C: Microstructure CP5
3
(d) Would you expect the outer rim of the zoned crystals to be Fe-rich, Mg-rich, or have the same composition as the bulk composition?
(b) Assuming very slow cooling (i.e. that equilibrium between solid and melt is maintained at all times), describe how the composition of the solid and melt are expected to evolve as the temperature decreases. What would be the composition of the final liquid to solidify and the composition of the final solid?
(c) If cooling is much more rapid, exchange of atoms between solid and melt has less time to take place. Examine the photographs of the olivine-bearing rock taken using transmitted light under crossed polars (a limited number of thin sections are also available). Notice how the interference colour of the olivine grains varies from the centre to the rim. This change in interference colour is due to the change in refractive index of olivine as a function of composition. Based on the information in Fig. 1, will the centres of the crystals be Fe-rich or Mg-rich relative to the bulk composition?
2.1 Dendrites
When a new solid phase is formed with a different composition to the parent phase, a region of altered composition accumulates around the growing phase. For example, if the new phase has a lower solute concentration than the parent phase, a solute-rich layer forms at the interface as the solute is rejected. There will be a concentration variation in the parent, with solute concentration falling on moving away from the growing interface. If, through a random fluctuation, a part of the interface advances ahead of the rest, it finds itself in a region of reduced solute concentration, and hence grows more quickly. There is positive feedback, and the protuberance (’bulging out’) grows at an increased rate over the remaining interface. Secondary and high-order protuberances can then grow out from the original ‘spike’. This growth form is called a dendrite (meaning ‘tree-like’). In fact dendrite ‘arms’ or branches tend to grow in specific crystallographic directions, which correspond to the fastest growth directions.
(a) On the computer you are provided with several movies showing both computer simulations and real experimental observations of how dendrites form during solidification. Double click each file in turn to view the movies. Ask your demonstrators to explain what is going on!

Practical 21 Materials and Minerals ScienceCourse C: Microstructure CP5
4
(b) Specimen 594 is an as-cast Cu-Ni alloy, containing 30 wt% Ni. The microstructure consists of cored dendrites. Only a single phase is present, but the centres of the dendrites are of a different chemical composition from the inter-dendritic regions. Make a sketch of the microstructure and add a scale bar. Use Fig. 2 to deduce the composition of the centre of the dendrites (wt% and at% are very similar in this system).
Fig. 2. Melting loop for Cu-Ni alloy
1500
1450
1400
1350
1300
1250
1200
1150
1100
1050
1000
Tem
pera
ture
(°C
)
1009080706050403020100
Atomic % Nickel
3.1 Microstructures in eutectic systems: Cu-P system
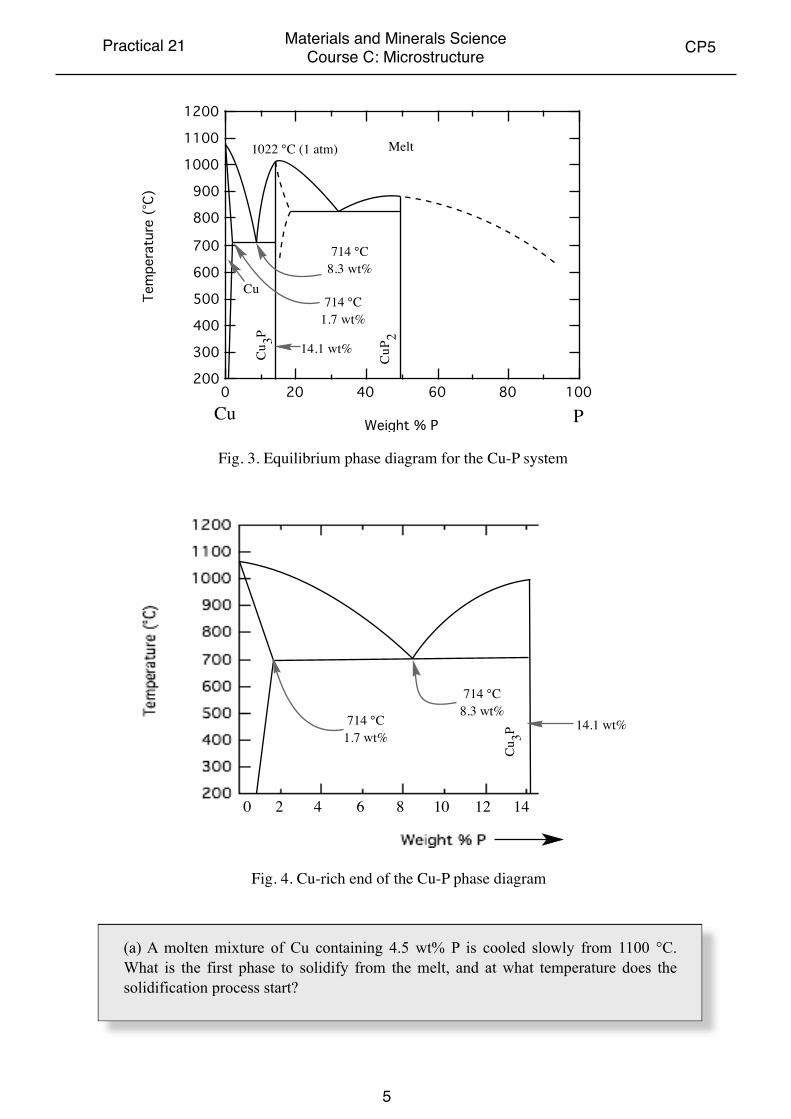
The phase diagram for the binary system Cu-P is shown in Fig. 3. This system contains two intermediate compounds, Cu3P and CuP2. We can treat the whole phase diagram as three separate binary phase diagrams stuck together. We are only interested in the left-most portion of the phase diagram between the Cu endmember and the compound Cu3P (shown in more detail in Fig. 4).
Practical 21 Materials and Minerals ScienceCourse C: Microstructure CP5
5
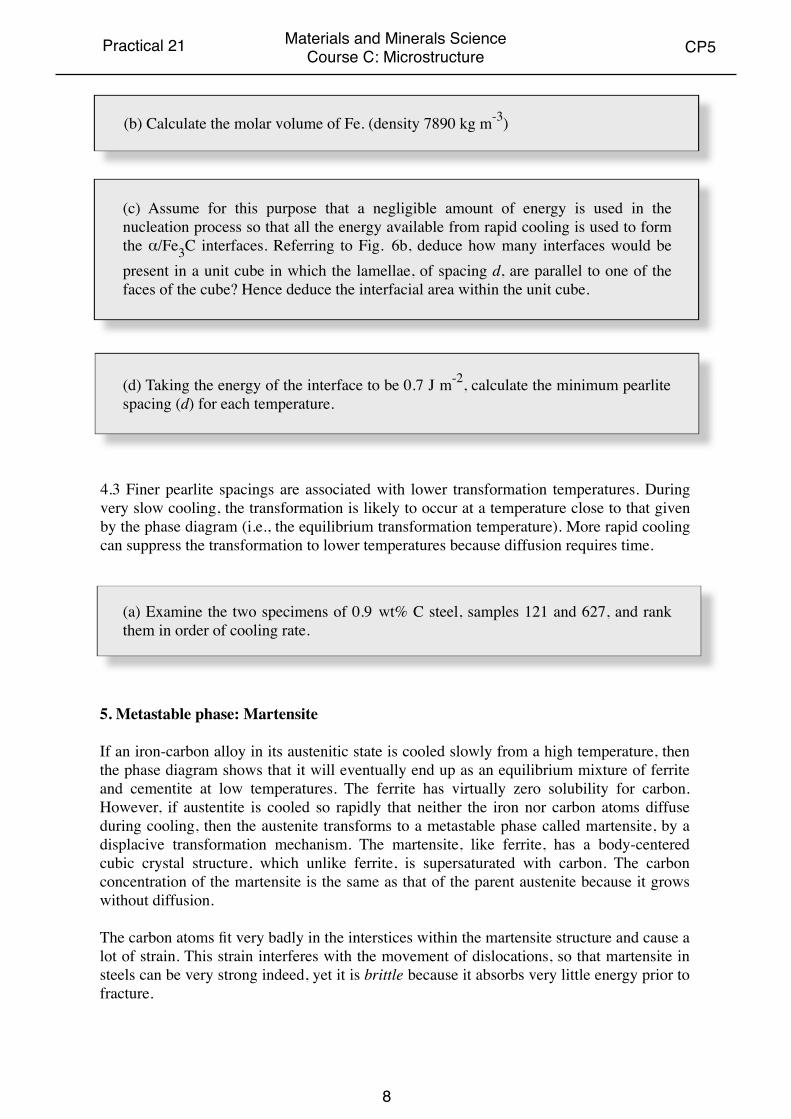
Fig. 4. Cu-rich end of the Cu-P phase diagram
Fig. 3. Equilibrium phase diagram for the Cu-P system
1200
1100
1000
900
800
700
600
500
400
300
200
Tem
pera
ture
(°C
)
100806040200
Weight % P
Cu 3P
CuP
2
1022 °C (1 atm)
Cu
714 °C8.3 wt%
Melt
14.1 wt%
714 °C1.7 wt%
Cu P
(a) A molten mixture of Cu containing 4.5 wt% P is cooled slowly from 1100 °C. What is the first phase to solidify from the melt, and at what temperature does the solidification process start?
714 °C1.7 wt%
Cu3P 14.1 wt%
714 °C8.3 wt%
0 2 4 6 8 10 12 14

Practical 21 Materials and Minerals ScienceCourse C: Microstructure CP5
6
The first phase to solidify is referred to as the primary phase, and may be dendritic in form. At the eutectic temperature, the system consists of primary dendrites in equilibrium with melt of eutectic composition. On further cooling, the melt solidifies via the eutectic reaction to a fine-scale eutectic intergrowth. The microstructure consists, therefore, of large primary dendrites surrounded by eutectic intergrowth.
(b) What are the compositions of solid and liquid phases in equilibrium with each other at a temperature just above the eutectic temperature (714 °C)? Hence, calculate the relative proportions of primary dendrites and eutectic intergrowth expected in the microstructure after cooling below the eutectic temperature.
(c) Examine the micrographs of an as-cast Cu - 4.5wt% P alloy in Fig. 5. Reconcile the microstructural features with the phase relations in Fig. 4. To what extent was equilibrium maintained during the cooling of this sample?
(d) A Cu-1.5wt%P alloy is solidified relatively quickly, to produce a microstructure composed of dendrites surrounded by a small amount of eutectic intergrowth. Explain why some eutectic is produced, despite the fact that, according to the phase diagram, the structure should be a single phase at the eutectic temperature.
4.1 Scale of Microstructure
The finesse of the eutectic intergrowth is also a non-equilibrium feature, in the sense that solidification of a melt of eutectic composition happens extremely rapidly. If it could be slowed down infinitely, the solid would just have two regions of composition of the two phases making up the eutectic. The boundary between these two phases costs interfacial energy (per unit area) as atoms attempt imperfectly to belong to both adjacent crystals. An interface is a defect, a non-equilibrium phenomenon which is not represented on an equilibrium phase diagram.
The following example illustrates a conflict between the two non-equilibrium phenomena of diffusion and interfaces. Colonies of pearlite (eutectic) in steels (iron-carbon alloys, c.f., phase diagram in the Data Book DIB15) consist of alternating layers of body-centred ferrite (α) and cementite (Fe3C), which grow at a common front with the parent cubic close-packed phase austenite (γ), as illustrated in Fig. 6a. α is the phase that has a very low solubility for carbon. Consequently, carbon diffusion in γ is needed during the growth of pearlite, the diffusion occurring towards the Fe3C layers (Fig. 6a). Faster transformation can be achieved if the diffusion distance is small, i.e., the distance between the α and Fe3C layers in the pearlite is reduced. On the other hand, a finer spacing is associated with a larger amount of α/Fe3C interface per unit volume, and hence a greater quantity of defect energy stored in the product phases.

Practical 21 Materials and Minerals ScienceCourse C: Microstructure CP5
7
Fig. 5. Cu - 4.5 wt% P at a range of magnifications.
4.2 Estimation of the minimum pearlite spacing in pearlite colonies formed by very rapid cooling of austenite.
(a) Fig. 7 shows a set of relative-free-energy curves representing the γ → α + Fe3C reaction. Estimate the maximum energy (in J/mol) that would be available for α/Fe3C interfaces if the growth of pearlite is delayed to (i) 700°C and (ii) 450°C by very rapid cooling.
Practical 21 Materials and Minerals ScienceCourse C: Microstructure CP5
8
4.3 Finer pearlite spacings are associated with lower transformation temperatures. During very slow cooling, the transformation is likely to occur at a temperature close to that given by the phase diagram (i.e., the equilibrium transformation temperature). More rapid cooling can suppress the transformation to lower temperatures because diffusion requires time.
(b) Calculate the molar volume of Fe. (density 7890 kg m-3)
(c) Assume for this purpose that a negligible amount of energy is used in the nucleation process so that all the energy available from rapid cooling is used to form the α/Fe3C interfaces. Referring to Fig. 6b, deduce how many interfaces would be present in a unit cube in which the lamellae, of spacing d, are parallel to one of the faces of the cube? Hence deduce the interfacial area within the unit cube.
(d) Taking the energy of the interface to be 0.7 J m-2, calculate the minimum pearlite spacing (d) for each temperature.
(a) Examine the two specimens of 0.9 wt% C steel, samples 121 and 627, and rank them in order of cooling rate.
5. Metastable phase: Martensite
If an iron-carbon alloy in its austenitic state is cooled slowly from a high temperature, then the phase diagram shows that it will eventually end up as an equilibrium mixture of ferrite and cementite at low temperatures. The ferrite has virtually zero solubility for carbon. However, if austentite is cooled so rapidly that neither the iron nor carbon atoms diffuse during cooling, then the austenite transforms to a metastable phase called martensite, by a displacive transformation mechanism. The martensite, like ferrite, has a body-centered cubic crystal structure, which unlike ferrite, is supersaturated with carbon. The carbon concentration of the martensite is the same as that of the parent austenite because it grows without diffusion.
The carbon atoms fit very badly in the interstices within the martensite structure and cause a lot of strain. This strain interferes with the movement of dislocations, so that martensite in steels can be very strong indeed, yet it is brittle because it absorbs very little energy prior to fracture.

Practical 21 Materials and Minerals ScienceCourse C: Microstructure CP5
9
Martensite can be made tougher, i.e., capable of absorbing more energy during fracture, by giving it a tempering heat-treatment, which allows some of the excess carbon in the martensite to precipitate as cementite. This leads to a loss of strength, but an improvement in toughness. Dislocation interactions and material properties will be studied in greater depth in Course D.
In conclusion, we can alter physical properties by tailoring the microstructure by controlling the cooling rate.
The shaft is a critical component in any transport vehicle because its failure can cause an accident. The microstructure at the core of the shaft of a transit van (Fig. 8) shows pearlite, whereas that at the surface shows martensite.
Fe3C
Fe3C
Fe3C
Fe3C
!
!
!!
"
d
C diffusion
Fig. 6a. Growth of pearlite into austenite. Fig. 6b. The interfaces of a colony of pearlite.
x
!"#$%&'"()*""("+"*,-(.(/0(1(23#!4
5%6(7$*83+
!
9":;
"<==>;
"?0=>;
Fig. 7. Free energy curves for ferrite, austenite and cementite as a function of the carbon concentration. In the case of austenite, the curves are presented for two different temperatures. You may assume that the ferrite and cementite curves remain in the same relative position at all temperatures.
d
! !
Fe3C

Practical 21 Materials and Minerals ScienceCourse C: Microstructure CP5
10
(a) Why is it useful to have a martensitic microstructure at the surface of the shaft?
(b) How can the observed variation in microstructure be produced, given that the steel is homogenous in its chemical composition?
Martensitic transformations don’t happen at equilibrium, so can’t be represented by a phase diagram, but can be represented by TTT diagram, which we will study in the next practical.
Fig. 8. Micrographs of pearlite and martensite, at the core and surface respectively, of a shaft from a transit van.