dependability approaches for mobile environment
TRANSCRIPT
HAL Id: tel-02507101https://tel.archives-ouvertes.fr/tel-02507101
Submitted on 12 Mar 2020
HAL is a multi-disciplinary open accessarchive for the deposit and dissemination of sci-entific research documents, whether they are pub-lished or not. The documents may come fromteaching and research institutions in France orabroad, or from public or private research centers.
L’archive ouverte pluridisciplinaire HAL, estdestinée au dépôt et à la diffusion de documentsscientifiques de niveau recherche, publiés ou non,émanant des établissements d’enseignement et derecherche français ou étrangers, des laboratoirespublics ou privés.
Dependability approaches for mobile environment :Application on connected autonomous vehicles.
Abdallah Dabboussi
To cite this version:Abdallah Dabboussi. Dependability approaches for mobile environment : Application on connectedautonomous vehicles.. Other. Université Bourgogne Franche-Comté, 2019. English. �NNT :2019UBFCA029�. �tel-02507101�

1
DEPENDABILITY APPROACHES FOR
MOBILE ENVIRONMENT - APPLICATION
ON CONNECTED AUTONOMOUS VEHICLES
Abdallah DABBOUSSI


Thèse présentée par
Abdallah DABBOUSSI
pour obtenir le
Grade de Docteur de
l’Université de Technologie de Belfort-Montbéliard
Spécialité : Informatique
APPROCHE POUR LA SURETE DE
FONCTIONNEMENT EN ENVIRONNEMENT MOBILE
APPLICATION AUX VEHICULES AUTONOMES ET
CONNECTES
Soutenue le 20 décembre 2019 devant le Jury :
Mr. Pascal LORENZ Président du jury Professeur, Université de Haute Alsace UHA
Mr. Tarek El-GHAZAWI Rapporteur Professeur, George Washington University GWU
Mr. Ahmed NAIT-SIDIMOH Rapporteur Maître de Conférences, HDR, Université de
Picardie Jules Verne (UPJV)
Mr. Rachid OUTBIB Examinateur Professeur, Université d’Aix-Marseille
Mr. Maxime WACK Directeur de thèse Professeur Émérite, UTBM
Mr. Raed KOUTA Co-directeur de thèse Maître de Conférences, HDR, UTBM
Mr. Jaafar GABER Co-directeur de thèse Maître de Conférences, HDR, UTBM
Mr. Bachar EL-HASSAN Co-directeur de thèse Professeur, Université Libanaise

1

Acknowledgments
First and above all, I praise God the almighty for granting me this opportunity, and for
health, protection, and capability to finish this thesis successfully.
This thesis would have not been possible without the assistance and guidance of several
people to whom I offer my sincere thanks and gratitude.
It is difficult to state my gratitude to my supervisors Dr. Maxim WACK, Dr. Raed KOUTA
and Dr. Jaafar JABER due to ongoing support, inspiration, and great efforts in guiding me
throughout the thesis. They have provided me with encouragement, sound advice, and good
company. For your efforts, guidance and support, which brought this work to a successful
completion, I would like to say THANK YOU!
I want to express my deep thanks to Dr. Bachar EL HASSAN and Dr Lina NACHABEH for
their kind support, warm encouragement, caring guidance and critical comments. May the
Almighty God richly bless you.
I would like to thank the jury members for accepting to review my thesis, Drs Tarek El-
GHAZAWI, Ahmed NAIT-SIDIMOH, Pascal LORENZ and Rachid OUTBIB; Thank You…
This work would not have been possible without the help, support and encouragement of my
colleagues. Special thanks to the director of Cisco Academy at Lebanese University Mr.
Mustafa BADWI. I also thank my colleagues in OMNI and in UTBM, for their support and for
the good times spent together. Particular big thanks to Dr. Mohamad SLEIMANI cannot finish
without thanking my family...
Nobody has been more important to me in the pursuit of this project than the members of
my family. I would like to thank my mom, whose love and guidance are with me in whatever I
pursue.
I want to thank my brother Fouad, Thank you for your encouragement and support...

Finally, I wish to thank my loving and supportive wife, Najwa, and my four wonderful
children, Nadine, Ahmad, Hassan and Sara.
I thank all who in one way or another supported me and contributed towards the completion of
this thesis.

Table of Contents
CHAPTER 1 - GENERAL INTRODUCTION ..........................................................................................13
1.1 THE RESEARCH DOMAIN ........................................................................................................................ 14
1.2 BACKGROUND ..................................................................................................................................... 14
1.3 PROBLEM STATEMENT .......................................................................................................................... 16
1.4 THE CONTRIBUTIONS ............................................................................................................................ 17
1.5 ORGANIZATION OF THE DISSERTATION ..................................................................................................... 18
1.5.1 General presentation ................................................................................................................ 18
1.5.2 Global view ............................................................................................................................... 19
1.5.3 Chapter Contents ...................................................................................................................... 19
CHAPTER 2 - CAV: INFLUENCES AND CHALLENGES ...................................................................21
2.1 INTRODUCTION ................................................................................................................................... 23
2.1.1 What is an autonomous vehicle? .............................................................................................. 23
2.1.2 What is a connected vehicle? ................................................................................................... 25
2.1.2.1 VANETs applications ....................................................................................................................... 26
2.1.2.2 Safety applications ......................................................................................................................... 27
2.1.2.3 User applications ............................................................................................................................ 27
2.2 CONNECTED AND AUTONOMOUS VEHICLES (CAV) ..................................................................................... 27
2.2.1 The advantages of CAV ............................................................................................................. 28
2.2.1.1 Road safety..................................................................................................................................... 28
2.2.1.2 Protect the environment ................................................................................................................ 28
2.2.1.3 Improve the way of life .................................................................................................................. 29
2.2.1.4 Allow people with disabilities to move more easily ....................................................................... 29
2.2.1.5 Save time and money ..................................................................................................................... 29
2.2.2 CAV: How does it work? ............................................................................................................ 29

2.2.3 Conditions for CAV Deployment. .............................................................................................. 31
2.2.4 Example of existence and revolution ........................................................................................ 32
2.3 THE ECONOMIC, SOCIAL, ETHICAL AND LEGAL IMPACT OF A CAV DEPLOYMENT ................................................ 33
2.3.1 The Economic impact ................................................................................................................ 33
2.3.1.1 Platform for new services .............................................................................................................. 34
2.3.1.2 New automobile industry ............................................................................................................... 34
2.3.1.3 New business model ...................................................................................................................... 35
2.3.1.4 Improve preventive maintenance. ................................................................................................. 35
2.3.1.5 No need to own a personal car ...................................................................................................... 35
2.3.2 Social impact ............................................................................................................................ 36
2.3.2.1 Sharing CAV .................................................................................................................................... 36
2.3.2.2 Mobility and Quality of Life ............................................................................................................ 36
2.3.3 Ethical impact ........................................................................................................................... 37
2.3.3.1 Ethics of driving .............................................................................................................................. 37
2.3.4 The ethical dilemma ................................................................................................................. 37
2.3.5 Legal impact ............................................................................................................................. 38
2.4 THE TECHNOLOGICAL AND SCIENTIFIC CHALLENGES OF CAV ......................................................................... 39
2.4.1 Challenges related to autonomous navigation ......................................................................... 39
2.4.1.1 Sensors ........................................................................................................................................... 40
2.4.1.2 Environment interpretation ........................................................................................................... 41
2.4.1.3 Planning routes .............................................................................................................................. 42
2.4.1.4 Planning maneuver ........................................................................................................................ 43
2.4.1.5 Vehicle-user interactions ............................................................................................................... 43
2.4.1.6 Trajectory planning ........................................................................................................................ 43
2.4.1.7 High level control-command .......................................................................................................... 44
2.4.2 Challenges related to integration and dependability ............................................................... 45
2.4.2.1 The design of embedded architectures .......................................................................................... 45
2.4.2.2 The formal proofs of the algorithms .............................................................................................. 45
2.4.2.3 Hardware and software optimization ............................................................................................ 45
2.4.2.4 Resilience, fault tolerance, uncertainty management ................................................................... 45
2.4.2.5 Physical systems security and reliability ........................................................................................ 46
2.4.3 Reliable communication between vehicles ............................................................................... 46

2.4.4 Cybersecurity ............................................................................................................................ 47
2.4.5 The Big Data Processing ........................................................................................................... 48
2.4.6 Validation of the CAV system ................................................................................................... 49
2.4.7 The modeling of large systems: road traffic and fleet management ....................................... 50
2.5 STATE OF ARTS ................................................................................................................................ 51
2.6 CONCLUSION ................................................................................................................................... 57
CHAPTER 3 - GLOBAL QUALITATIVE STUDY OF DEPENDABILITY OF CAV ........................58
3.1 INTRODUCTION ................................................................................................................................... 59
3.2 DEPENDABILITY OVERVIEW ................................................................................................................. 61
3.3 THE PROPOSED APPROACH .................................................................................................................... 63
3.4 PRELIMINARY RISK ANALYSIS (PRA) ......................................................................................................... 64
3.4.1 Definition .................................................................................................................................. 64
3.4.2 Functional Architecture of CAV ................................................................................................ 65
3.4.3 Severity, Frequency and Controllability .................................................................................... 69
3.5 EXTERNAL FUNCTIONAL ANALYSIS ........................................................................................................... 71
3.5.1 Bull chart .................................................................................................................................. 72
3.5.2 Octopus diagram ...................................................................................................................... 73
3.5.2.1 Manufacturing and transportation ................................................................................................ 74
3.5.2.2 Maintenance .................................................................................................................................. 75
3.5.2.3 Use ................................................................................................................................................. 75
3.5.2.4 End of life ....................................................................................................................................... 76
3.6 INTERNAL FUNCTIONAL ANALYSIS ............................................................................................................ 76
3.6.1 The functional block diagram ................................................................................................... 77
3.6.2 Global functional block diagram .............................................................................................. 78
3.6.2.1 Functional block diagram of sensors .............................................................................................. 79
3.6.3 Functional analysis table .......................................................................................................... 81
3.7 FAILURE MODE, EFFECTS AND CRITICALITY ANALYSIS (FMECA) .................................................................... 82
3.7.1 The "project" benefit FMECA .................................................................................................... 82
3.7.2 The "system" objectives of FMECA product .............................................................................. 83
3.7.3 The FMECA "Product" ............................................................................................................... 84

3.8 CONCLUSION ...................................................................................................................................... 86
CHAPTER 4 - A FAULT TREE ANALYSIS FOR THE RELIABILITY OF CAV .............................87
4.1 INTRODUCTION ................................................................................................................................ 88
4.2 COMPONENT OF V2X TECHNOLOGY ........................................................................................................ 89
4.2.1 Communication reliability of CV ............................................................................................... 89
4.2.1.1 On Board Unit (OBU) ...................................................................................................................... 90
4.2.1.2 Trusted Platform Module (TPM) .................................................................................................... 91
4.2.1.3 Road Side Unit (RSU) ...................................................................................................................... 92
4.2.2 RBD ........................................................................................................................................... 92
4.3 PROBABILISTIC MODELING OF THE FAULT TREE EVENTS ................................................................................ 95
4.3.1 Lifetime distributions ................................................................................................................ 95
4.3.2 The exponential distribution ..................................................................................................... 96
4.3.3 Reliability of OBU and RSU ....................................................................................................... 96
4.3.4 V2V Reliability ........................................................................................................................... 99
4.3.5 V2I Reliability .......................................................................................................................... 100
4.3.6 V2X Reliability ......................................................................................................................... 101
4.4 FAULT TREE FOR CAV ......................................................................................................................... 102
4.5 IMPROVEMENT PROPOSAL FOR THE FAULT TREE .............................................................................. 110
4.6 CONCLUSION FOR THE FAULT TREE ............................................................................................... 115
CHAPTER 5 - RELIABILITY AND CONNECTIVITY ANALYSIS FOR BSM IN CAV .................118
5.1 INTRODUCTION .............................................................................................................................. 118
5.2 RELIABILITY OF CONNECTED VEHICLES .................................................................................................... 119
5.2.1 Experimental results ............................................................................................................... 121
5.2.1.1 Reliability CAV connectivity against transmission range .............................................................. 121
5.2.1.2 Reliability CAV connectivity against Density ................................................................................ 123
5.2.1.3 Reliability for CAV connectivity against safety headway distance ............................................... 125
5.3 COMMUNICATION RELIABILITY ..................................................................................................... 126
5.3.1 BSM Fundamentals ................................................................................................................. 127
5.3.2 The Analytic Approach ............................................................................................................ 127
5.4 RELIABILITY OF BSM IN VANET ...................................................................................................... 129

5.5 RELIABILITY OF SAFETY APPLICATIONS IN DSRC ............................................................................. 133
5.6 ANALYTIC VALIDATION FOR THE NUMBER OF RETRANSMISSIONS ................................................. 135
5.7 CONCLUSION ................................................................................................................................. 140
CHAPTER 6 - CONCLUSIONS & PERSPECTIVES ............................................................................142
6.1 SUMMARY........................................................................................................................................ 143
6.2 FUTURE WORK .................................................................................................................................. 144
LIST OF PERSONAL PUBLICATIONS ........................................................................................................146
LIST OF TABLES .............................................................................................................................................147
LIST OF FIGURES ...........................................................................................................................................148
LITERATURES .................................................................................................................................................150
ACRONYMS AND ABBREVIATIONS ..........................................................................................................159

Abstract
Connected and Autonomous vehicles (CAV) must have adequate reliability and safety
requirements in uncertain environments with complex circumstances. Sensor technology,
actuators and artificial intelligence (AI) are constantly and rapidly evolving, thus enabling
further development of self-driving vehicles, and increasing the automation of driving. CAV
shows many benefits in human life such as increasing road safety, reducing pollution, and
providing independent mobility to non-drivers. However, these advanced components create
a new set of challenges concerning safety and dependability. Hence, it is necessary to evaluate
these technologies before implementation.
We study in this thesis the reliability of CAV as a whole, focusing on sensors and the
communication system. For that purpose, a functional analysis was done for the CAV system.
Our scientific approach for analyzing the CAV reliability was structured with methods that
combine quantitative and qualitative approaches such as internal and external functional
analysis, Preliminary Risk Analysis (PRA), and failure modes and effects criticality analysis
(FMECA), in addition to other analysis techniques.
In order to prove our results, a simulation was done using the Fault Tree analysis (FTA)
probability in order to validate the proposed approach. The data (Failure ratio) used were from
a professional database related to the type of components presented in the system. Using this
data, a probabilistic model of degradation was proposed. A probability calculation was
performed in relation to a reference time of use. Thereafter, a sensitivity analysis was
suggested concerning the reliability parameters and redesign proposals developed for the
components.
CAV provides several communication models: vehicles to vehicle (V2V), or with Road
Side Infrastructure: vehicle to infrastructure (V2I). Dedicated Short Range Communication
(DSRC) employs a multichannel approach to cater for a variety of safety and non-safety
applications. Safety applications necessitate appropriate and reliable transmissions, while non-

safety applications require performance and high speed. Broadcasting of Basic Safety
Messages (BSM) is one of the fundamental services in today’s connected vehicles. For that,
an analytical model to evaluate the reliability of IEEE 802.11 based V2V safety-related
broadcast services in DSRC system on highway was proposed. Finally, an enhancement on
the proposed model was made in order to increase the reliability of the V2V connection, taking
into consideration many factors such as transmission range, vehicle density, and safety
headway distance on highway, packet error rate, noise influence, and failures rates of
communication equipment.
Evaluating these problems leads to a sensitivity analysis related to reliability parameters,
which helps further innovation in CAV and automobile engineering.
Keywords: Connected Autonomous vehicles, Dependability, Reliability, BSM, DSRC,
VANET, wireless network, FMECA, Fault Tree.

Résumé
Les véhicules autonomes et connectés (VAC) doivent avoir une exigence de fiabilité et de
sécurité adéquate dans un environnement incertain aux circonstances complexes. La
technologie des capteurs, les actionneurs et l'intelligence artificielle (IA) améliorent
constamment leurs performances, ce qui permet un développement continu des véhicules
autonomes et une automatisation accrue de la tâche de conduite. Les VAC présentent de
nombreux avantages dans la vie humaine, tels que l’augmentation de la sécurité routière, la
réduction de la pollution et la fourniture d’une mobilité autonome aux non-conducteurs.
Cependant, ces composants avancés créent un nouvel ensemble de défis en matière de sécurité
et de fiabilité. Il est donc nécessaire d’évaluer ces technologies avant leur mise en œuvre.
Nous étudions dans cette thèse la fiabilité du VAC dans son ensemble, en nous concentrant
sur les capteurs et le système de communication. Pour cela, une analyse fonctionnelle a été
réalisée pour le système VAC. Notre approche scientifique pour l'analyse de la fiabilité du
VAC a été structurée avec des méthodes combinant des approches quantitatives et qualitatives
(telles que l'analyse fonctionnelle interne et externe, l'analyse préliminaire des risques (APR)
et l'analyse des modes de défaillance, de leurs effets et de leur criticité (AMDEC), etc. Afin
de prouver nos résultats, une simulation a été réalisée à l'aide de la probabilité d'analyse d'arbre
de défaillance (ADD) et elle a été réalisée pour valider l'approche proposée. Les données (taux
d'échec) utilisées proviennent d'une base de données professionnelle concernant le type de
composants présentés dans le système. À partir de ces données, un modèle probabiliste de
dégradation a été proposé. Le calcul de probabilité a été effectué par rapport à un moment
d'utilisation de référence. Par la suite, une analyse de sensibilité a été suggérée concernant les
paramètres de fiabilité et des propositions de restructuration ont été élaborées pour les
composants.
CAV fournit des services de communication entre véhicules : véhicules à véhicules (V2V)
ou avec infrastructures côté rue : véhicules à infrastructures (V2I). La technologie des

“Communications dédiées à courte portée” (DSRC = Dedicated Short Range
Communications) utilise plusieurs canaux pour fournir une variété d'applications de sécurité.
Les applications de sécurité nécessitent des transmissions appropriées et fiables, tandis que les
applications non liées à la sécurité exigent des performances et une vitesse élevée.
Aujourd’hui, la diffusion de messages de sécurité de base (Basic safety message, BSM) est
l’un des services fondamentaux des véhicules connectés. Pour cela, un modèle analytique
destiné à évaluer la fiabilité des services de diffusion V2V relatifs à la sécurité basée sur IEEE
802.11 dans le système DSRC sur autoroute a été proposé. Enfin, une amélioration du modèle
proposé a été faite afin d'accroître la fiabilité de la connexion V2V, en tenant compte de
nombreux facteurs tels que la portée de transmission, la densité du véhicule, la distance de
sécurité sur l'autoroute, le taux d'erreur de paquets, l'influence de bruit et les taux de défaillants
pour les équipements de communications.
L'évaluation de ces problèmes conduit à une analyse de sensibilité liée aux paramètres de
fiabilité, ce qui contribue à davantage d'innovation dans les domaines de l'ingénierie
automobile.
Mots clés : Véhicule autonome et connecté, Sureté de fonctionnement, fiabilité, BSM,
DSRC, VANET, Réseaux sans fil, AMDEC, arbre de défaillance.
CHAPTER 1 - GENERAL INTRODUCTION ..........................................................................................13
1.1 THE RESEARCH DOMAIN ........................................................................................................................ 14
1.2 BACKGROUND ..................................................................................................................................... 14
1.3 PROBLEM STATEMENT .......................................................................................................................... 16
1.4 THE CONTRIBUTIONS ............................................................................................................................ 17
1.5 ORGANIZATION OF THE DISSERTATION ..................................................................................................... 18
1.5.1 General presentation ................................................................................................................ 18
1.5.2 Global view ............................................................................................................................... 19
1.5.3 Chapter Contents ...................................................................................................................... 19
Chapter 1 - General Introduction

Chapter 1: General Introduction
14
1.1 The research domain
General context: Dependability in the context of mobile-based systems considering
Connected Autonomous Vehicles (CAV) as an application.
Specific context: Reliability analysis approach for CAV. Applications on the basic safety
message in Vehicular Ad hoc Networks (VANETs).
1.2 Background
The number of road traffic deaths continues to climb, from 1.25 million in 2013, reaching
1.35 million in 2016, according to the World Health Organization [1]. Connected and
Autonomous Vehicles (CAV) are proposed as one solution to improve road safety, by
eliminating driver-related accident-causing factors where human error is estimated to account
for 94% of the total accidents [2]. Human errors that lead to crashes are many, such as
inattentive driving, over speed, dozing off, and driving under the influence of drugs or alcohol
(which amounts to 20% of the accidents) [3]. CAV systems will help the driver to avoid all
these accidents or reduce their severity. The aim is to divide the percentage accident ratio by
ten by employing full or partial automation penetration [4].
However, other than enhancing road safety, autonomous and connected vehicles have other
important benefit such as human timesaving, reducing energy consumption and emissions, and
giving social accessibility for disabled, elderly, handicapped and blind persons [5]. It may also
facilitate mobility for youngsters. This marks a sign that we are at the dawn of a revolution in
the world of transportation and mobility.
CAV imposes completely new modes of transport and promises many disruptions to
transportation, but more importantly, will have political, legal, economic and ethical impacts–
in which the dependability and the safety will play an essential part [6].

Chapter 1: General Introduction
15
Transport is responsible for millions of tons of pollutant emissions, as well as a quarter of
global energy consumption and CO2 emissions in the atmosphere. The deployment of
autonomous vehicles should significantly reduce the number of vehicles in circulation [7].
To develop these complex systems, which use emerging technologies and various scientific
disciplines, it is necessary to understand the scientific and technological challenges obstructing
the fast progress of CAV.
A strategic concern with automated driving at this phase of its growth is that it is not yet
dependable and safe enough. This fast growing area provides great opportunities but also poses
significant challenges from a dependability point of view. Currently, in VANET, most of the
work carried out relates to the evaluation of the communication performance and for routing
protocols, without taking into consideration dependability and operational safety of the system
as whole. System reliability is greatly reliant on the availability of hardware and software
components and their life time cycle. Given that this problem is relatively new for applications
in the mobile environment using ad-hoc networks, the development of methods and models to
assess the reliability of smart vehicles by the approaches of reliability and dependability
analysis, that evaluate quantitative and qualitative measures characterizing the dependability
of CAV, has become indispensable. However, a full understanding of how CAVs can fail and
the causes of such failures is still needed.
This thesis evaluates this problem by enabling the designers of CAV to ensure that the
selected system is well suited to fulfill the dependability requirements. We mainly take into
account the impact of dependability on the self-driving services.

Chapter 1: General Introduction
16
1.3 Problem Statement
An autonomous vehicle should also be a connected vehicle. To be autonomous; it must be
able to communicate with other vehicles, as well as with the road infrastructure. In this thesis,
we use the term CAV for a Connected and Autonomous Vehicle.
To gain a better understanding of the radical changes imposed by these intelligent vehicles,
we first need to understand the specific features of a CAV. A collaboration between many
different aspects of research, technologies, and sciences should take place. This includes safety
and reliability engineering, automation techniques, artificial intelligence (AI), geo-location,
mathematical modeling, robotic techniques, processing and multisensory fusion,
telecommunications, networks, cybersecurity, and others…
Ad-hoc communications are present in wireless sensor networks (WSNs), for VANETs [8].
Communication in VANETs has many reliability challenges due to the high mobility, dynamic
topology and different traffic patterns. Safety applications have strict latency constraints to the
order of a few milliseconds, in addition to very high reliability and relevance requirements.
Therefore, it is essential to establish a reliable communications platform.
One of the biggest challenges to introduce CAV is to achieve a sufficient level of reliability
for the technology. For that, we analyze the reliability of CAV as a whole, and focus on the
Basic Safety Message (BSM) and applications that necessitate appropriate and reliable
transmissions for vehicle-to-vehicle (V2V) or with Road Side Infrastructure: vehicle to
infrastructure (V2I) using Dedicated Short Range Communication (DSRC).
In vehicular networks, connected vehicles broadcast safety messages periodically that
contain the vehicle identity, current location, velocity, acceleration and other useful
information. For that, an analytical model for the reliability of BSM reception was proposed.
This thesis evaluates this problem by enabling the designers of CAV to ensure that the

Chapter 1: General Introduction
17
selected system is well suited to fulfill the dependability requirements. We mainly take into
account the impact of dependability on the self-driving services. Several dependability
properties and quantitative measures were investigated and analyzed, with a particular focus on
reliability and safety.
1.4 The contributions
CAVs are targeted to improve safety in road. A CAV requires that a user must accept
protective safety measures in the development process. The user should trust the vehicle and
accept the possible risks; otherwise, it cannot be deployed in the market, before having a
suitably sufficient level of reliability.
For any complex system such as CAV, it is essential to focus the analysis efforts on the
most critical points.
To validate the potential risks related to the system, we should divide our CAV system into
subcomponents. A comprehensive behavior study for each single component was achieved to
establish the relationships between the components and overall system function. An analysis
of the more critical components helps in developing a complete reliability analysis.
Safety applications in CAV extend driver knowledge about the surrounding environment
and warn drivers of undesirable road conditions. For example, if the in-vehicle ABS is
activated, it might indicate bad road conditions, and if this information is shared between
vehicles, other vehicles are warned to take preventive actions before getting to a dangerous
situation, for that BSMs are sent periodically. We aim in this study to increase the reliability of
this safety message.
This dissertation mainly addresses the reliability in the context of mobile-based systems,
considering CAV as an example. Particularly, within the scope of the thesis the following
contributions have been made:
Chapter 1: General Introduction
18
- A complete reliability analysis was developed by achieving a comprehensive behavior
study between each component and overall system function, by using qualitative tools such
as Preliminary Risk Analysis (PRA), External Functional Analysis (EFA), Internal
Function Analysis (IFA), Failure mode, and Effects and Criticality Analysis (FMECA).
- A probabilistic fault-tree analysis tool was used to identify the reliability of the CAV and
the potential risks. This qualitative analysis using the exponential probabilistic models of
degradation can be used as feedback to redesigning the system.
- Analytical model to evaluate reliability and the connectivity of IEEE 802.11P based
vehicle-to-vehicle (V2V) safety-related broadcast services in DSRC system on highway
was proposed. Finally, an enhancement on the proposed model was suggested in order to
increase the reliability of the V2V communication, the proposed model takes into
consideration many parameters such as the hardware reliability, transmission range,
vehicle density, safety headway distance, packet error rate, and noise influence.
1.5 Organization of the Dissertation
1.5.1 General presentation
The Dissertation is structured in six chapters, including a general introduction, conclusions
and perspectives. The first chapter provides a general introduction and information about the
problem statement, the objectives and the contributions. The second chapter provides an
overview of the main concepts of CAV and theirs challenges and influences. The third chapter
proposes global and qualitative study of dependability of CAVs. The fourth and fifth chapters
present the Fault Tree Analysis, and the probabilistic models of degradation for the CAV
components. Simulation results for the proposed analytical model concern the V2V
connectivity for the BSM are presented in the fifth chapter. Finally, we present conclusions and
perspectives in the sixth chapter.

Chapter 1: General Introduction
19
1.5.2 Global view
- Chapter 1: General Introduction.
- Chapter 2: CAV: influences and challenges.
- Chapter 3: Global qualitative study of dependability of CAV.
- Chapter 4: A fault tree analysis for the reliability CAV.
- Chapter 5: Reliability and Connectivity Analysis for BSM in CAV.
- Chapter 6: Conclusions & Perspectives.
1.5.3 Chapter Contents
A. Chapter 1: General Introduction
This chapter provides information about background and motivation, problem statement, the
objectives and contributions of the dissertation.
B. Chapter 2: CAV influences and challenges.
This chapter presents the main concepts of CAV, The economic, social, ethical and legal
impact of a CAV deployment, in addition to the technological and scientific challenges of CAV.
C. Chapter 3: Global qualitative study of dependability of CAV
In this chapter, we present in details our reliability analysis approach in CAV. We
explain the functional and dysfunctional analyzes of the system. The proposed analysis focuses
on the safety and reliability components of CAV. Hence, the analytical tools dedicated to the
forecast reliability must be implemented using the most suitable tools are such as PRA, EFA,
IFA and FMECA.
D. Chapter 4: A Fault Tree analysis for the reliability of CAV
In this chapter, we present the fault tree and the probabilistic models of degradation for
the CAV. Using data concerning the failure rates from a professional database an exponential

Chapter 1: General Introduction
20
model of reliability was proposed. After simulation, an improvement on the fault tree was
suggested concerning the reliability parameters, and a redesign proposal is developed for the
components.
E. Chapter 5: Reliability and Connectivity Analysis for BSM in CAV
CAV must be able to communicate with other vehicles, as with the infrastructure road. For
that, in this chapter, we represent a connected vehicle environment in order to assess the
reliability of V2V communication applications by proposing an analytical approach to evaluate
reliability and the connectivity of IEEE 802.11p based vehicle-to-vehicle (V2V) for safety-
related broadcast messages, in a DSRC system on highways. The proposed model takes into
account many factors that affect the wireless communication in the vehicular environment, such
as transmission range, vehicle density, safety headway distance on highway, packet error rate,
noise influence and failure rates of DSRC hardware equipment.
F. Chapter 6: Conclusions and Perspectives
In this part of the dissertation, we present the summary of the work and future work, i.e.,
perspectives are listed at the end of the chapter.

CHAPTER 2 - CAV: INFLUENCES AND CHALLENGES ...................................................................21
2.1 INTRODUCTION ................................................................................................................................... 23
2.1.1 What is an autonomous vehicle? .............................................................................................. 23
2.1.2 What is a connected vehicle? ................................................................................................... 25
2.1.2.1 VANETs applications ....................................................................................................................... 26
2.1.2.2 Safety applications ......................................................................................................................... 27
2.1.2.3 User applications ............................................................................................................................ 27
2.2 CONNECTED AND AUTONOMOUS VEHICLES (CAV) ..................................................................................... 27
2.2.1 The advantages of CAV ............................................................................................................. 28
2.2.1.1 Road safety..................................................................................................................................... 28
2.2.1.2 Protect the environment ................................................................................................................ 28
2.2.1.3 Improve the way of life .................................................................................................................. 29
2.2.1.4 Allow people with disabilities to move more easily ....................................................................... 29
2.2.1.5 Save time and money ..................................................................................................................... 29
2.2.2 CAV: How does it work? ............................................................................................................ 29
2.2.3 Conditions for CAV Deployment. .............................................................................................. 31
2.2.4 Example of existence and revolution ........................................................................................ 32
2.3 THE ECONOMIC, SOCIAL, ETHICAL AND LEGAL IMPACT OF A CAV DEPLOYMENT ................................................ 33
2.3.1 The Economic impact ................................................................................................................ 33
2.3.1.1 Platform for new services .............................................................................................................. 34
2.3.1.2 New automobile industry ............................................................................................................... 34
2.3.1.3 New business model ...................................................................................................................... 35
2.3.1.4 Improve preventive maintenance. ................................................................................................. 35
2.3.1.5 No need to own a personal car ...................................................................................................... 35
2.3.2 Social impact ............................................................................................................................ 36
2.3.2.1 Sharing CAV .................................................................................................................................... 36
2.3.2.2 Mobility and Quality of Life ............................................................................................................ 36
2.3.3 Ethical impact ........................................................................................................................... 37
Chapter 2 - CAV: influences and challenges
2.3.3.1 Ethics of driving .............................................................................................................................. 37
2.3.4 The ethical dilemma ................................................................................................................. 37
2.3.5 Legal impact ............................................................................................................................. 38
2.4 THE TECHNOLOGICAL AND SCIENTIFIC CHALLENGES OF CAV ......................................................................... 39
2.4.1 Challenges related to autonomous navigation ......................................................................... 39
2.4.1.1 Sensors ........................................................................................................................................... 40
2.4.1.2 Environment interpretation ........................................................................................................... 41
2.4.1.3 Planning routes .............................................................................................................................. 42
2.4.1.4 Planning maneuver ........................................................................................................................ 43
2.4.1.5 Vehicle-user interactions ............................................................................................................... 43
2.4.1.6 Trajectory planning ........................................................................................................................ 43
2.4.1.7 High level control-command .......................................................................................................... 44
2.4.2 Challenges related to integration and dependability ............................................................... 45
2.4.2.1 The design of embedded architectures .......................................................................................... 45
2.4.2.2 The formal proofs of the algorithms .............................................................................................. 45
2.4.2.3 Hardware and software optimization ............................................................................................ 45
2.4.2.4 Resilience, fault tolerance, uncertainty management ................................................................... 45
2.4.2.5 Physical systems security and reliability ........................................................................................ 46
2.4.3 Reliable communication between vehicles ............................................................................... 46
2.4.4 Cybersecurity ............................................................................................................................ 47
2.4.5 The Big Data Processing ........................................................................................................... 48
2.4.6 Validation of the CAV system ................................................................................................... 49
2.4.7 The modeling of large systems: road traffic and fleet management ....................................... 50
2.5 STATE OF ARTS ................................................................................................................................ 51
2.6 CONCLUSION ................................................................................................................................... 57

Chapter 2: CAV: influences and challenges
23
2.1 Introduction
Autonomous vehicles will increasingly rely on connectivity to have the ability to receive and
transmit data from the external environment in order to achieve autonomy. The two
technologies can be complementary and with the technology convergence, will result in
intelligent vehicles that are both connected and autonomous [9].
This vehicle will radically change the way we move. Its deployment will have an impact on
the evolution of society in terms of security, environment, urbanism ... The automotive industry
itself, to produce vehicles in which telecommunications and AI will play a decisive role, is in
the process of undergoing a profound transformation, and is already seeing the arrival of new
players from the digital world.
2.1.1 What is an autonomous vehicle?
The autonomous vehicle is able to move safely due to its ability to sense its surroundings
and to detect and identify objects and landscape around it. The fully autonomous vehicle is
entirely driven by AI. It is able to go alone, interact with its environment and adapt its behavior
according to events (accidents, road works ...) and other road users (cars, pedestrians, cyclists
...). This means that it can move to a certain place without human intervention. While some
current prototypes approach these circumstances in certain particular situations, they do not yet
cover all the real cases [10].
There are two main standards of automation classifications. The international Society of
Automotive Engineers (SAE) and the US National Highway Traffic Safety Administration
(NHTSA). The main variance is that SAE is using a six-level scale for defining the stage of
automated driving, while NHTSA is using five. Later NHTSA accepted SAE standard and
published it. For that reason, this thesis will use SAE standard that classified AV into six levels
[11].

Chapter 2: CAV: influences and challenges
24
- Level 0: no automation. The driving is entirely under the responsibility of the drive that
should control the braking, the steering, the throttle, and the motive power.
Driver’s responsibilities: the human driver is responsible for the full-time performance of
all aspects of driving task. He is responsible for the safe operation of the vehicle and has to
monitor and be aware of the traffic around the vehicle.
- Level 1: also called driver assistance automation, the driver is always responsible for the
maneuvers, but delegates some of the tasks to the system, typically for the longitudinal control
of the vehicle, for example through: adaptive cruise control (ACC), lane-keeping assistance
(LKA) and electronic stability control (ESC). It can be referred to as a traffic jam assistant that
keeps the vehicle in a flow.
Driver’s responsibilities: The driver is fully responsible for the overall control of a vehicle
and its safe operation. He can turn on the driver assistance and hand over the control of the
vehicle to a system in a specific occasion. He must be able to fully regain control over driving
if the situation requires it.
- Level 2: also called partial automation, the maneuvering responsibility is delegated to the
system, but everything is done under constant supervision of the driver, who can decide to take
back the hand at any time, for example during an automatic lane change. Another illustration is
Parking Assist, which is activated only when a parking space is detected or selected by the
driver.
Driver’s responsibilities: the driver must still pay attention to driving conditions at all times
and take over immediately if the conditions exceed the system's limitations, of which there are
many.
- Level 3: called conditional automation, the driver can delegate driving on both the guiding
dimensions (longitudinal and lateral) and can lower his level of alertness to focus on other tasks.
The intelligent piloting system then takes care of positioning and maintaining the vehicle on its

Chapter 2: CAV: influences and challenges
25
track while maintaining a pace adapted to the speed and traffic conditions. Level 3 can sense
and identify the traffic signs, red lights thus being able to operate in urban areas, but it may
have difficulties in sensing surroundings in different weather conditions.
Driver’s responsibilities: The driver must remain able to regain control of the operation if
the conditions require it, but only after a warning and a short transition time.
- Level 4: highly automated Level: an automated driving system performs all dynamic tasks
of driving, e.g., monitoring of the environment and motion control... On the other hand, this
level concerns only certain modes of driving, and under certain conditions. For example, AV
may be limited to travel only on specific roads or under certain weather conditions. The Waymo
(Google car) is an example of such vehicle.
Driver’s responsibilities: the driver no longer intervenes and can completely divert his
attention to do something else. The driver activates and deactivates the automated mode and he
is capable of getting full control of the vehicle’s safety-critical functions under certain
scenarios.
- Level 5: it is the ultimate or full automation: all the driving functions of a vehicle are
completely automated and performed safely without the need for human interaction. Everything
is under the responsibility and control of the system in all scenarios, on any road and under any
condition. The presence of a human being at the controls is no longer necessary.
Driver’s responsibilities: The human driver does not intervene any more, neither in the
control, nor in the supervision of the task of driving or navigation. In this case, the drive acts as
a passenger, he can request the car on demand by his phone to his desired location.
2.1.2 What is a connected vehicle?
A connected vehicle (CV) integrates wireless telecommunications systems that allows it to
collect information that it can record, process, operate and relay to other vehicles, or send to

Chapter 2: CAV: influences and challenges
26
the road infrastructure. The data collected by the vehicle are numerous and varied. Some data
is related to the security of the route, such as distance information with another vehicle
measured by a radar, or geo-location data. Other data concerns the experience on board, for
example, the transfer of music stored on a smartphone or a film ... [12].
Connecting vehicles is realized through a topology known as vehicular networks or
vehicular ad-hoc networks (VANETs), which provides communication between Vehicle-to-
Vehicle (V2V) and Vehicle to Roadside unit (V2R) communication in order to increase
driver/vehicle safety, transport efficiency and comfort. These vehicles will be connected
using dedicated short-range communication (DSRC) radios, operating in the FCC-granted
5.9 GHz band for DSRC with a bandwidth of 75 MHz and very low latency for the safety-
critical applications [13].
However, due to some limitations on quality of service (QOS), and unbounded channel
access delay for this technology, a focus on leveraging the high penetration rate of long-term
evolution (LTE) and 5G cellular networks has initiated to support vehicle-to-everything (V2X)
services [14]. It is easy to imagine that future CV will process up to several gigabytes of data
per second.
Since 2017, by decision of the European Union, all new vehicles must be connected in
order to automatically make emergency calls in case of an accident: this is the e-Call service.
By 2020, it is estimated that 80% of the car fleet will be connected [15].
2.1.2.1 VANETs applications
Applications in VANETs can be categorized into two main classes, i.e., user or comfort
applications and safety applications [16] [17]. However, safety and user applications are not
completely separated from each other. For example, a message generated for accident can be
seen as a safety and urgency message from the perspective of nearby vehicles. The same can

Chapter 2: CAV: influences and challenges
27
message can be seen by farther vehicles as an informative message to choose an alternative
optimal route with lower traffic jams [18].
2.1.2.2 Safety applications
Safety messages are time-critical; they play a significant role in reducing the number of
accidents. The goal is to improve the safety level of passengers by exchanging safety relevant
information between vehicles, which are required to disseminate warnings immediately to
avoid probable accidents and traffic congestions [19].
Typically, safety applications can be classified to 4 types: accident warnings, intersections
warnings, road congestion warnings, and passive safety applications.
Safety information should be disseminated to other surrounding vehicles in order to inform
and eventually take preventive actions. It gives and early warning to the drivers by giving an
alert message of any accident down the road, thus preventing further accidents by giving some
extra time for the driver to react. Another example would be a vehicle having an embedded
traffic detection sensor, which can disseminate current traffic state to other vehicles to avoid
the congested area [18].
2.1.2.3 User applications
In general, comfort related applications aim at improving passenger comfort and traffic
efficiency, e.g. traffic-information, weather information, gas station or restaurant locations,
advertisements and other Internet services [20]. User applications can provide road users some
valuable information, traffic-information, weather information, entertainment services,
advertisements, gas station or restaurant location etc. Parking availability services and Internet
connectivity are examples of user applications.
2.2 Connected and autonomous vehicles (CAV)
An autonomous vehicle is a vehicle that is, in the broadest sense, capable of driving itself

Chapter 2: CAV: influences and challenges
28
without human intervention. A connected vehicle is a vehicle with technology that enables it
to communicate and exchange information wirelessly with other vehicles, infrastructure, other
devices outside the vehicle and external networks.
Connected driving can be regarded as a cooperative intelligent transport system [21] that
accelerates the introduction of automated driving significantly. Cooperative and CV can lead
to improved traffic, because it enables approaches for collective learning to identify and
resolve inappropriate behavior and driving strategies quickly.
CAVs have two essential features; namely, automation capability and cooperation
(connectivity). By integrating connected vehicle (V2V and V2I communication) with
autonomous vehicle technology, an effective cooperative driving network can be recognized
[22]. Hence, in this thesis we use the terminology: connected and autonomous vehicles (CAV)
that leverage autonomous and connected vehicle capabilities.
2.2.1 The advantages of CAV
CAVs bring plenty of potential benefits. Driverless vehicles are designed to make lives
easier and safer by:
2.2.1.1 Road safety
Safety is a primary goal for driverless vehicles. The National Highway Traffic Safety
Administration (NHTSA) declares based on data from the Fatality Analysis Reporting System
(FARS) that in 2016 there were an estimated 7,277,000 police-reported traffic crashes the
United States, in which 37,461 people were killed and an estimated 3,144,000 people were
injured [23]. Many accidents happen because of human error. The expected result is to reduce
fatal accidents using CAVs.
2.2.1.2 Protect the environment
CAVs can be very beneficial for the environment. They consume less energy and reduce

Chapter 2: CAV: influences and challenges
29
operational CO2 emissions, unlike a vehicle driven by a human being. Generally, most gas
burned when driving at high speed, braking or accelerating too fast. Autonomous vehicles
eliminate these factors from their driving style, which reduces air pollution [7].
2.2.1.3 Improve the way of life
Driverless technology will assure travel comfort. It will have profound impact on every
person in the community by reducing stress related to driving where they could rest, read a
book, surf the web, watch a movie, or talk with other passengers or work while traveling.
2.2.1.4 Allow people with disabilities to move more easily
All people who cannot drive (People with disabilities, elderly, teenagers) can enjoy the
benefits of autonomous driving with increased freedom and mobility. In USA 79 percent of
seniors age 65 and older live in car-dependent communities [24].
2.2.1.5 Save time and money
Due to their integrated electronic system and locators, CAVs are able to predict the shortest
and most economical paths. Many hours wasted in traffic every day, when an automated car
takes over driving responsibilities, are saved by drivers who can take advantage of this time
to do other things [25]. In addition, thanks to the communication system between the vehicles,
the traffic could be fluidized and thus avoid traffic jams. Finally, CAV may save money also
through the partial or total disappearance of insurance since they are safer and more reliable.
2.2.2 CAV: How does it work?
Autonomous cars have become a reality. They work through a combination of miniature
sensors and a powerful embedded computing AI systems.
A fully autonomous car is equipped with several hardware elements (sensors) and software
that cooperate automatically thanks to an AI. CAV operates independently, but it is in relation
with its environment due to the autonomous system (computer of the car). The autonomous

Chapter 2: CAV: influences and challenges
30
system responds to a long series of algorithms based on the information that it receives. Each
algorithm has its level of importance based on the situation. Therefore, AIis the engine of the
functioning of the autonomous car.
To be autonomous, CAV asks various information that are given to it by different sensors
(Fig. 2-1). These new vehicles include many sensors: Cameras that detect obstacles, traffic
lights and signs, radar that detects long-range obstacles, and an ultrasonic rangefinder that
detects short-range obstacles, and Light Detection and Ranging (LIDAR) that measures the
distances between obstacles.
CAV also needs a central inertia that detects if the car is moving without a satellite
connection, an anti-crossing system that detects if the car is still online and a Global
Positioning System (GPS) that geolocates the car for routing the path.
The software using the AIis the "brain" of each autonomous car as it processes data of each
sensor. It is with deep learning and analyzing sensor data that the car can build a 3D map of
everything around it to make the best decisions.
This AI requires enormous computing power because the data collected is massive: each
sensor sends information continuously and this information must be interpreted by AI
software. For example, cameras record at least 30 frames per second (30 fps), each of which
consists of thousands of pixels and their colors. These pixels must be processed to determine
if a panel is present, or if a car arrives etc. The amount of data to be processed is monumental.
For all that, the AI is able to process all the data in order to make decisions then it orders the
actuators that are responsible for the vehicle control such as breaking, accelerating, steering.
In particular, this quasi-instantaneous decision-making capability will eventually make
autonomous vehicles more reliable than human drivers.

Chapter 2: CAV: influences and challenges
31
Figure 2-1 General view of CAV
2.2.3 Conditions for CAV Deployment.
The evolution towards autonomous vehicles is inevitable, and it will affect all manufacturers
in transportations sectors such as: stockholder of vehicles, equipment manufacturers, transport
operators, software publishers or manufacturers of electronic components. However, to be
deployed on a large scale, CAV will have to:
1. Achieve a level of technological maturity that meets the reliability and the security
requirements [26]. CAV is an assembled systems "system of systems" - the majority of
components are sensors that interact with the software. A first challenge will be to ensure the
dependability of the vehicle by studying the reliability and fault tolerance of the systems that
make it up [27]. Two main locks must be lifted:
• The management of uncertainties, in embedded devices that interact with the
environment, whether in terms of location, perception, or decision-making.
• Dependability: Whatever the disruption, the system must continue to operate with the
required level of security. The solution involves design optimization and verification, testing,
and validation.
2. Ensure the interoperability of different systems, through cooperative infrastructures,
standards and norms, certification, etc. [28].

Chapter 2: CAV: influences and challenges
32
3. Offer new mobility services [29].
4. Guarantee their economic viability [30].
5. Enter into a defined legal and regulatory framework, nationally and internationally [31].
Other important considerations concern the deployment of the underlying infrastructures
necessary for the large-scale operation of CAVs: first, a wireless vehicular network that satisfies
- in terms of bandwidth and latency - the enormous data needed to be transferred, and also,
depending on the operating models that will emerge, the installation of signposts or dedicated
lanes [32] . It can be noted that the use of CAVs could develop at different speeds in urban and
rural areas: better network coverage and more infrastructure can provide richer features in the
city, at least initially.
2.2.4 Example of existence and revolution
The California Department of Motor Vehicles (CA DMV) is the state agency that
registers motor vehicles and issues driver's licenses in the U.S. state of California, and is
responsible for permitting and monitoring the testing of autonomous vehicles [33].
At the time of writing (June 2019), 61 AV testing permit holders acquired permission from
the DMV to begin testing on California public roads, listed by the date the permit was issued:
Volkswagen Group of America, Mercedes Benz, Waymo LLC, Delphi Automotive,Tesla
Motors, Bosch, Nissan, GM Cruise LLC, BMW, Honda, For, Zoox, Inc, Faraday & Future
Inc, Baidu USA LLC, Valeo North America, Inc., NIO USA, Inc., Telenav, Inc., NVIDIA
Corporation, AutoX Technologies Inc, Subaru, Udacity, Inc, Navya Inc., Renovo.auto, PlusAi
Inc, Nuro, Inc, CarOne LLC, Apple Inc., Pony.AI, TuSimple, Jingchi Corp, SAIC Innovation
Center, LLC, Almotive Inc, Aurora Innovation, Nullmax, Samsung Electronics, Continental
Automotive Systems Inc, Voyage, CYNGN, Inc, Roadstar.Ai, Changan Automobil, Lyft, Inc.,
Phantom AI, Qualcomm Technologies, Inc. ,SF Motors Inc., Toyota Research Institute,
Apex.Al, Intel Corp, Ambarella Corporation, Gatik AI. Inc., DiDi Research America LLC,

Chapter 2: CAV: influences and challenges
33
TORC Robotics Inc, Boxbot Inc, EasyMile, Mando America Corporation,Xmotors.ai, Inc.,
Imagry Inc., Ridecell Inc., AAA NCNU, ThorDrive Inc, Helm.AI Inc, Argo AI, LLC.
The original draft of the DMV regulation for deployment prohibited manufacturers from
selling driverless fully autonomous vehicles, allowing deployment of only semi-autonomous
vehicles with a back-up driver. Recently, DMV approved testing driverless autonomous
vehicles on public roads starting April 2018. However, in 2018 all the listed holders were still
doing their testing in the presence of a backup driver [33].
The arrival of autonomous cars is already shaking the world of the automotive industry. As
noticed above, major manufacturers and traditional equipment manufacturers are still present
(Volkswagen, Mercedes Benz, Nissan, GM, BMW, Honda…) but new players have joined
them. The big digital groups, like (Google –Waymo, Tesla, AppleInc. NVIDIA…), have
become the first partners of the automobile industry, and very soon they will become their
main rivals. For the first time after 100 years of existence, the mechanics and the thermal are
no longer the alpha and the omega of a car. The engine risk becoming simple and valueless,
while all focus is currently on computerization. Due to the mass of data collected by connected
vehicles from sensors, manufacturers will be able to improve the design of cars, and develop
new activities by creating new services, for example, predictive and preventive maintenance
of vehicles will definitely be improved by reading and analyzing collected data.
2.3 The Economic, social, ethical and legal impact of a CAV deployment
CAV will not only be a system of great technological complexity, its large-scale
deployment will induce profound changes in the functioning of society, which will affect the
organization of cities, transportation means, civil liability, and industry.
2.3.1 The Economic impact
The revolution in the different uses of this type of vehicles will also renew the traditional

Chapter 2: CAV: influences and challenges
34
form of the automobile and its core functions.
2.3.1.1 Platform for new services
Traditional Vehicles were designed to be driven by human beings, for private and family
use. However, in an autonomous car, there is no need, for instance, to have front seats and rear
seats: all seats could instead face each other to allow passengers to exchange in more user-
friendly ways. We can also imagine vehicles with work tables, large windows to contemplate
the landscape, coffee machines ... Mercedes-Benz presented in January 2015 a concept car
offering such an approach [34]. Start-up manufactures such as Zoox are also working on this.
From the moment human beings are exempted from the need to drive, the cabin of the car can
be thought of as a platform of services intended for users [35].
2.3.1.2 New automobile industry
The arrival of autonomous cars is already shaking the world of the automotive industry.
Major manufacturers and traditional equipment manufacturers are still present, but they are
joined and already jostled by new players. However, it is also the big digital groups, like
Google (Waymo), Uber, Apple and Microsoft, who become the first partners of the automobile
industry, and very soon their main rivals.
The major suppliers of chips and processors, NVidia, Qualcomm or Intel, are also key
players in the development of autonomous vehicles. Intel, for example, bought Mobileye, a
specialist in smart cameras for the car for $ 14.7 billion [36]. Many start-ups are working on
features and components specific to the autonomous car, such as cartography (Civil Maps,
Here), smart cameras (Mobileye), LIDAR sensors (Velodyne, Quanergy, Innoviz,
leddarTech,), AI(Drive, AI, Nuro.AI, Nauto, Five AI, AIMotive, ...).

Chapter 2: CAV: influences and challenges
35
2.3.1.3 New business model
A car has traditionally been something private, whether in the form of taxis or shared cars,
a convergence between public and private transport will occur. All the automotive players,
manufacturers and equipment manufacturers, dealers, repairers, renters will have to rethink
their business model [37]. The value chain should gradually migrate to software providers and
mobility service providers.
2.3.1.4 Improve preventive maintenance.
For the first time after 100 years of existence, the mechanics and the thermal engine are no
longer the most important modules for the car. The engine risk is becoming simple and
valueless, while all focus in now is on computerization. Due to the mass of data collected via
CAV from sensors, manufacturers will be able to improve the design of cars, and develop new
activities by creating new services like the predictive and preventive maintenance of vehicles
by reading and analyzing this data [38].
2.3.1.5 No need to own a personal car
The real revolution in progress is that of the uses of the smart automobile. The success of
car sharing companies like Blablacar, Uber, or Lyft, gives an idea of the changes to come.
With CAV, it will be very simple for a city-dweller to travel by ordering a vehicle via an
application, this vehicle that will move on its own to the client, has a much lower cost than
owning an individual car. With an upcoming advanced technology of autonomous vehicles,
ride-hailing service providers will challenge the current model of personal vehicle ownership.
In fact, with the progressive replacement of private cars by "on-demand" vehicles, the
ownership link between the driver and his vehicle will change [39].

Chapter 2: CAV: influences and challenges
36
2.3.2 Social impact
CAV will be an essential component of future smart cities.
2.3.2.1 Sharing CAV
Indeed, with the new transport services, being collective or private, intensively using shared
autonomous vehicles will significantly reduce the number of cars circulating in the heart of
crowded cities. This explains the interest of many cities in the world to pilot autonomous
shuttles or taxis (or "robot-taxis").
A 2013 study by Columbia University shows the dramatic effects that can be expected from
the introduction of shared AVs in a city. For the city of Ann Arbor, Michigan, whose
population of 285,000 has 200,000 vehicles, the authors of the study calculated the size of the
shared fleet that would be needed to meet the mobility needs of the entire community for the
population, without imposing too long waiting times. With only 18,000 vehicles, the fleet of
autonomous and shared vehicles would allow an average waiting time of less than one minute,
for a vehicle utilization rate of 70% during the hours of the day. Another study made for New
York City by MIT has showed that introducing shared vehicles can diminish the vehicle fleet
by 80 percent [37]. Noting that decreasing the number of vehicles leads to increasing safety
by reducing the potential accidents. Diminishing the number of vehicles in a city has many
other benefits like less traffic jam, wasted time, and air and noise pollution.
2.3.2.2 Mobility and Quality of Life
Level 5 of the CAV could even lead to eliminating the need for driver's licenses. For the
long term, one imagines that children could go alone to the school in autonomous shuttles and
disabled people will benefit from increased mobility.

Chapter 2: CAV: influences and challenges
37
2.3.3 Ethical impact
The arrival of "smart vehicles" also raises ethical questions. Due to its high technicality and
the wide diffusion, autonomous and connected vehicles poses the traditional questions usually
related to technology and digitization in the society: security, responsibility, decision-making
by AIs, security of the communications, respect for privacy and personal data, etc...
2.3.3.1 Ethics of driving
If it were necessary to enact a first ethical principle of CAV, it could be expressed as
follows: the development of autonomous and connected vehicles is justified only if it results
in a substantial reduction in the number and severity of road accidents.
Even if the perception of the environment and risks by a CAV, given the technologies
already available, would become better than that of humans, it will still be impossible to
completely prevent accidents. The deployment of automated vehicles will create a new
situation to which governments, enterprises and society as a whole must prepare.
2.3.4 The ethical dilemma
The crucial ethical question for a CAV is already clear. When a vehicle is confronted with
two driving options that both pose a risk to human life - for example, hitting another vehicle
or changing direction at the risk of mowing pedestrians - what will the decision be and how
should it be made? Can we entrust AIwith the task of settling this dilemma?
A decision made by a CAV, without human intervention, is ultimately only the result of the
execution of a computer program: who will define the ethical rules included in this program?
Who will verify that the databases used for learning AIs are sufficient and do not induce bias?
The problem is similar to the one that already arises for robots or for AIprograms, but with
consequences, in the case of CAV, which can be dramatic. No one today has answers to these
questions. However, it is now necessary to ask them.
Chapter 2: CAV: influences and challenges
38
For this purpose, The Ethics Commission of the Federal Minister of Transport and Digital
Infrastructure in Germany, proposed a set of twenty ethical rules to follow for the development
of CAVs, under the name of “Ethical rules for automated and connected vehicular traffic”
[40].
2.3.5 Legal impact
When an autonomous vehicle automatically takes, without human intervention, decisions that
engage the safety of passengers, pedestrians and other vehicles, who is responsible for the
consequences? The transfer of responsibility for driving from the driver to manufacturers or
manufacturers of "smart" components of the CAV is a new issue for not only lawyers, but also
for insurers.
However, even with the many questions cited above which have no clear answers, we could
expect many other economic and social benefits of CAVs such as:
- Creating new jobs, in automotive manufacturing, as example in UK by 2030,the global
economic benefits of CAVs are expected to £51 billion per year, and the economic
revenue of adjacent industries such as digital services, telecoms, technology, and freight
will be £16 billion yearly [30].
- Saving lives and preventing serious crashes, the use of technology such as, low-speed
autonomous emergency braking (AEB), has led to a 38% reduction in real world rear-
end accident [41].
- Cleaner mobility and reduced emissions of at least 20% of CO2 by using connected
cars [42].
- Improved traffic flow and efficiency and reduced fuel consumption [43].

Chapter 2: CAV: influences and challenges
39
2.4 The technological and scientific challenges of CAV
The design and development of autonomous and connected vehicles with an increasingly
high level of autonomy poses tremendous technological and scientific challenges.
Mathematics, system engineering, software engineering, AIand dependability including
reliability and cybersecurity are among the major areas of digital science involved. We can
group the different areas related to the development of CAVs into three distinct categories:
- Autonomous navigation: algorithms and functions necessary for decision-making and
navigation, from sensor to locomotion should be dependable and ensure road safety.
- Reliability of the Integrated and embedded systems: aspects related to the practical
integration of software, functional architectures, and real-time connectivity taking into
consideration the cybersecurity risks.
- Modeling - wide scale integration: modeling of traffic and interactions between CAV
and users. Aspects of data collection and data mining, remote diagnosis, large-scale
simulation, intelligent mobility, etc…
It should be noted beforehand that to meet most of these challenges, a reliable wireless
network coverage and high QOS guarantee would be required. Without minimal bandwidth
and especially limited latency, a CAV will not work properly. This problem will most certainly
be limited in urban areas but crucial in areas which lack effective network coverage. Of course,
the 5G new technologies deployment will be one of the main motives for the connected car,
and it will increase the performance, but having a reliable communication is a much more
complex. In the below sections, we tackle the main scientific and technological challenges
related to the CAV.
2.4.1 Challenges related to autonomous navigation
In order to navigate autonomously, without a pilot, CAV must do the below:

Chapter 2: CAV: influences and challenges
40
1) Perception: perceive the environment using multiple sensors [44].
2) Planning: analyze and interpret the received data based on perception, and localization
and mapping information [45].
3) Decision Making and Vehicle Control: make decisions related to driving the vehicle to
do the appropriate action such as acceleration or steering [46].
Achieving these functions faces multiple scientific and technological challenges related
mainly to the constraints of real time processing.
2.4.1.1 Sensors
Currently available sensors should have sufficient reliability, even in rough environments
such as bad weather conditions (snowy roads, rainy or dusty weather), to enable fully
autonomous driving. Many challenges concerning the sensors face the CAV development.
A. Multisensory perception
CAV must be able to detect and identify all the fixed or moving objects in its environment:
vertical (traffic lights, signs,) and horizontal signs (zone markings, stop lines, etc...),
pedestrians, other vehicles, any objects on the road ... CAV should also follow and predict the
changes of locations of objects and people over time. It must finally establish a map of the
environment, and locate its own position on a local and global map [47].
These functions are achieved through multiple sensors, and algorithms to analyze the scene
from the data collected.
B. Data storing and processing in real time
In order to assure a certain degree of autonomy, a vehicle should be equipped with multiple
sensors: radars, ultrasonic sensors, several cameras, LIDAR, and GPS. A first challenge will
be to be able to process and store, in real time, the large amount of data generated by the

Chapter 2: CAV: influences and challenges
41
multiple sensors of the vehicle.
C. Reliability of the sensors:
The reliability of the sensors remains a major challenge today. All sensors have limitations
that make them unusable under certain conditions: masking, reduced range, bias, inaccuracies,
bad weather ... In addition, the failure of a sensor can arise at any time.
We explain in the next chapter diversified redundancy and multisensory fusion, which
combines data provided by different sensors to obtain relevant global information,
multisensory fusion is an effective way of addressing this problem.
2.4.1.2 Environment interpretation
Environment interpretation through multiple sensors remains a difficult issue in the
development of navigation systems. As the sensors are imperfect, it is necessary to develop
reliable and efficient multi-sensor fusion schemes, in order to achieve a geometric modeling
of the vehicle environment, and a semantic modeling (the identification of perceived objects:
tapes and traffic lane, signs, pedestrians, other vehicles ...) allowing a complete understanding
of the scene.
The advancement of AI algorithms will be one of the main driving forces for CAVs,
particularly the deep learning methods (DL). It is common for the perception and the
interpretation of the scene for CAVs to be built using machine language (ML) methods that
are used for decision making at different levels. However, ML/DL techniques have been
recently found vulnerable to carefully crafted adversarial perturbations and lack on the vision
system of autonomous cars [48].
A. Objects and obstacles detection
To understand the environment, CAV must first recognize objects and obstacles. Whatever
the objects to be detected (pedestrians, vehicles, panels); it is the Machine Learning techniques
Chapter 2: CAV: influences and challenges
42
that currently give the best results. Deep learning is considered very promising, provided it
has a sufficiently important learning base. Many databases already exist for various types of
objects including vehicles, pedestrians, and road signs. Among those devoted to pedestrians,
we find that of Daimler (Daimler Pedestrian Detection Benchmark), Caltech, and Inria [24].
B. Local and global localization
The fusion of GNSS (satellite location), inertial unit, and odometers and / or magnetic
compass data is currently quite widespread. Methods have been developed to refine the
location by relying on onboard sensors [22]. Localization in urban environments is a problem
now almost solved by means of Simultaneous Localization and Mapping (SLAM), which
consists of building or improving a map of its environment and simultaneously locating it [49].
On the other hand, locating a vehicle in an open environment like a highway remains a
challenge. Research is moving towards methods that combine proprioceptive (that perform
local measurements) and exteroceptive (that measure the global environment) sensors [50].
The challenge is to provide a localization solution with a precision at the scale of meter, or
even decimeter.
2.4.1.3 Planning routes
Today, route planning is based on well-mastered techniques. However, it is now necessary
to take into account new optimization criteria:
• The traffic model, for better estimation and forecasting of travel times;
• The consumption of each vehicle according to the topology of each segment of the journey
and the state of the traffic, in order to optimize energy consumption and the emission of
pollutants.
• Passenger comfort, for example by minimizing traffic in "at-risk" locations, rough roads,
or with many intersections and roundabouts.

Chapter 2: CAV: influences and challenges
43
2.4.1.4 Planning maneuver
The autonomous vehicle must decide on the maneuvers to be undertaken according to the
planned route, the current road situation and the condition of the driver or the vehicle. For
example, it will decide whether to overtake and whether to trigger an emergency stop (driver
in distress, breakdown, impending collision).
Several approaches exist to develop decisions. Fuzzy logic, for example, is often used to
develop decision trees, usually based on established or learned rules. Decision schemes can
also be developed using multi-criteria optimization techniques.
Work on maneuver planning is beginning to yield interesting results even if they are still
limited. Thus, they are generally only for multi-route roads with a single direction. On two-
way roads, the profiles of vehicles arriving in the opposite direction should be taken into
account and, therefore, added to the risk assessment calculation. It is also necessary to work
on even more restrictive road configurations, such as intersections and roundabouts, which
require more elaborate decision patterns. This will likely involve the integration of behavioral
patterns of motorists arriving at these intersections.
2.4.1.5 Vehicle-user interactions
When an autonomous vehicle passes on an urban road with more or less dense traffic, it is
necessary to take into account the interactions with its users. AIwill allow developing better
behavioral models and human-machine interfaces in the future, which can be integrated into
vehicle decision systems.
2.4.1.6 Trajectory planning
The planning of geometric trajectories of autonomous vehicles has greatly benefited from
the methodologies developed for autonomous mobile robots. However, not all methods

Chapter 2: CAV: influences and challenges
44
developed for robots are immediately transferable to the autonomous vehicle, but should be
subject to additional constraints. Thus, more and more planning methods are based on the
modeling of behaviors and not on purely geometric prediction of trajectories.
The learning-based techniques (deep learning and others) are then implemented, with the
idea of learning typical behaviors corresponding to different road configurations.
These learning techniques should also make it possible to develop typical driving profiles of
the human driver in order to reproduce them during the development of the trajectories and the
associated controls. Different profiles will be loaded into the central unit of the vehicle
according to its intended use: school buses, private vehicles on the motorway, low speed urban
shuttles, etc.
2.4.1.7 High level control-command
The control-command methods, inspired by those developed for mobile robots, are put at
the service of a vehicle control, which must optimally ensure:
• The stability of the vehicle;
• Passenger comfort, with constraints on longitudinal and lateral acceleration;
• Avoidance or catching of slips, control of skating.
The kinematic and dynamic models are different from those of a robot, but the theoretical
frameworks are the same: control of non-linear systems, robust control, optimal control, fuzzy
adaptive control, predictive control MPC (Model Predictive Control), etc. Specific control was
also developed for convoy driving. Finally, the specific development of electric vehicles
requires the development of corresponding models as well as adapted control laws in order to
manage and handle charging needs for these vehicles [51].
Chapter 2: CAV: influences and challenges
45
2.4.2 Challenges related to integration and dependability
In CAV, the software component will make up the bulk of production costs. The integration
of software in a highly automated vehicle is therefore a major issue. Many points should be
studied before a CAV is on the road:
2.4.2.1 The design of embedded architectures
CAV equipped with multiple sensors, must have real-time processing capabilities. Specific
treatment units based on multicore processors are studied. However, designing and developing
efficient on-board solutions remains a challenge.
2.4.2.2 The formal proofs of the algorithms
Algorithms are the basis of decision-making architecture. The validation of these
algorithms, by means of formal proof methods, will be a legal and economic necessity (in
particular, to reduce the costs during the prototyping and deployment phases).
2.4.2.3 Hardware and software optimization
Today, the few systems deployed in vehicles (for example at Tesla) incorporate only very
few software components, compared to a global navigation or decision-making architecture.
When millions of lines of code are embedded, it will be necessary to optimize the hardware
and software architectures, and probably design dedicated hardware architectures.
2.4.2.4 Resilience, fault tolerance, uncertainty management
No system existing today, in a vehicle, knows how to handle failures and errors, whether
they come from hardware, software or sensors. For an intelligent system to be reliable, the
embedded architecture will have to be resilient. It will therefore be necessary, for example, to
ensure a duplication of the functions performed by the embedded systems. This will require

Chapter 2: CAV: influences and challenges
46
not only the development of multiple solutions to perform the tasks, but also effective tools of
supervision and scheduling.
2.4.2.5 Physical systems security and reliability
The security of computer and physical systems is an obligation. It is also necessary to secure
the on-board telecommunications means in order to avoid any intrusion. Since the advent of
the first advanced driver assistance systems (ADAS) on the market, many failures have led to
"repatriations" of vehicles. These problems, due to a lack of quality, have led the automotive
industry to seriously study ways to improve the quality of software development. This is the
objective of ISO 26262, which establishes a formal framework for the implementation of this
reform.
2.4.3 Reliable communication between vehicles
The deployment of CAV cannot be done without a deep adaptation of telecommunications
networks, and without their security. The explosion of the number of communicating agents -
the vehicles, or the computer servers of network management - will have a strong impact on
the occupation of the communication channels, which are already largely saturated. In this
perspective, the IEEE decided to allocate a frequency band around 5.9 GHz dedicated to
vehicular applications (IEEE 802.11p).
Road safety requires a highly responsive and reliable exchange of information between
neighboring vehicles, under any traffic conditions. The challenge, therefore, is to design
reliable wireless communications in high-density scenarios.
Among the solutions currently studied, VLC (Visible Light Communication) technology
provides wireless communication using visible light. Very well adapted to short distances, it
was very quickly considered for autonomous vehicle applications traveling in convoy.
However, for a more general use, it will be necessary to take into account the heterogeneity of
Chapter 2: CAV: influences and challenges
47
the networks of communication: cellular networks, mesh networks of weak power, WiFi
(weak consumption) and Bluetooth (weak power) can answer various needs of communication
of an autonomous and connected vehicle. Each, however, uses different tradeoffs between
reliability, power consumption and throughput [52]. It is therefore necessary to study the
limitations of each technology and to develop clear criteria for selecting the one that best suits
each use.
The heterogeneity of communication networks also imposes the question of the transition
from one technology to another ("handover"). This problem must be studied in the context of
a dynamic and dense environment.
Finally, to avoid saturation of the networks, a possible solution is to better target the
messages, thanks to geo-localized networking (or GeoNetworking: Geographic Addressing
and Routing). It consists of restricting and disseminating the information communicated to a
limited geographical area and optimized thanks to dedicated routing techniques.
2.4.4 Cybersecurity
One of the major problems facing telecommunications today is that of vulnerability to
attacks. For connected vehicles, the question of the integrity and confidentiality of information
circulating on networks is a critical issue. The worst scenario that could be considered would
be, for example, the remote control of a connected vehicle. Since CAV is planned to provide
road safety, which is life-critical, thus ensuring the security of such vehicular systems is
crucial.
This is why cybersecurity is becoming a priority for the transport industry. Means of
protection already exist, but now they must be integrated into the vehicle development process.
Different types of attacks can affect CAV networks at different layers. In the application
layer, attacks can threaten the integrity, confidentiality, authenticity, and availability of a
specific vehicular application [53]. Moreover, CAV is vulnerable to denial of service (DoS)
Chapter 2: CAV: influences and challenges
48
or distributed denial of service (DDoS) attacks, by channel jamming that causes disconnection
in the communications network over a geographic area [54].
Cyber security solutions must ensure:
• Firewall functions in interfaces with external networks, intrusion detection and protection;
• securing internal communications, communications between the vehicle and information
systems, or communications between vehicles, by encryption [55]. To protect them against
unauthorized use and to ensure messages’ integrity, digital signatures can be used [56].
• The "hardening" of embedded computers (data and program protection);
• Preserving the privacy of vehicles and drivers is very important for this vehicular system.
Otherwise, a passive hacker can exploit the vehicle identities and other critical information by
attempting eavesdropping. The pseudonymous can be used to hide the identity of the vehicle.
More generally, securing the information systems involved in the circulation of autonomous
and connected vehicles.
2.4.5 The Big Data Processing
CAV systems will produce huge amounts of data of different types: data provided by
onboard sensors on vehicles, location data, image flows, emails, SMS, and entertainment data.
CAV could thus produce up to 1 GB of data per second. Based on an expected deployment of
hundreds of thousands of connected vehicles, all this data will have to be stored, managed,
and processed automatically by research centers, operators, and users for various purposes.
The storage and processing of these masses of data are yet to be defined and represent a
challenge, both economically and technically, without neglecting ethical aspects related to the
confidentiality of personal data.
Big Data techniques (processing very large volumes of data) and data analytics will be used
to extract exploitable information from embedded data sources. The exploitation of data by
Chapter 2: CAV: influences and challenges
49
data-mining methods should first lead to a better knowledge of the habits, preferences and
needs of the user of the vehicle. It will then contribute to the development of many driver
assistance applications, or serve as a support for services to consumers, or operators. Many
applications are expected; in particular:
• High priority security data, even in real time (emergency situations, incidental events,
collision avoidance, etc.);
• Consumer service information (insurance, self-diagnosis, detection / prevention of
failures ...);
• Data useful to the comfort of the driver, the driver or the passengers (availability of
parking spaces, geographic data, adapted advertising, etc.);
• Energy management and optimization (optimization of the speed profile)
• Traffic management (congestion, lane closures ...);
• Assistance to make driving more comfortable (choice of driver profile or automatic driver,
setting of vehicle control ...).
In addition, this big data can be used for analytics purposes to evaluate the reliability of the
CAV. Having an accurate and detailed data concerning the CAV performance diffidently
could help in designing intelligent vehicles that are more reliable, safer and more efficient.
Using this data will improve strategic decision making in the business, which should increase
the penetration of this vehicles into market
2.4.6 Validation of the CAV system
An autonomous and connected vehicle, like any automated system, must go through a
validation and certification phase. To evaluate the reliability of an autonomous vehicle, real
data should be available representing the many scenarios that it may face. These data are
missing, and it is impossible to perform travels for millions of kilometers that would be needed

Chapter 2: CAV: influences and challenges
50
to assess its failure rate under multiple conditions. The design of CAV will therefore
necessarily involve virtual prototyping and simulation.
The simulation of CAV is a particularly difficult problem. Indeed, even if each subsystem
could individually be validated by simulation, we would still need to validate the complexity
of the integrated system in real use on the road. It would be necessary to simulate the operation
of all the technological bricks simultaneously, while adding the complexity of road scenes, the
behavior of other drivers and their reactions to foreseeable situations, and taking into account
the simultaneous operation of a large number of autonomous vehicles.
The conclusion is that today there is no simulator adapted to all the features of the
autonomous and connected vehicle. The future simulator dedicated to the CAV will have to
include, among others, traffic models, behavioral models of various drivers, kinematic and
dynamic models of the vehicles, models of the sensors (including the inaccuracies and
uncertainties of measurement), models of realistic environment with urban scenes, peri-urban
or highway, models of weather environment (rain, snow, fog, etc...), and models of
communication.
The simulators available today only take into account some of these aspects. The development
of tools capable of simultaneously simulating all technological bricks, including the behavior
of humans and different weather conditions - for instance - remains a real challenge.
2.4.7 The modeling of large systems: road traffic and fleet management
With a large number of connected vehicles crisscrossing roads, traffic modeling will be
enriched with data collected by vehicles acting as moving sensors. The evolution of traffic on
a road network can be described by microscopic models (where we follow the trajectory of
each vehicle, the formation of traffic jams, etc...), mesoscopic or macroscopic (traffic
prediction), where the traffic is treated as a fluid circulating on the network.
Traffic can be studied and modeled as a large "random" system, relying on various

Chapter 2: CAV: influences and challenges
51
mathematical approaches. For example, by the exploitation of probabilistic methods or from
statistical physics.
Several recent works in applied mathematics and transportation engineering are studying
the impact of the introduction of autonomous and connected vehicles into road traffic. For
example, this research aims to exploit inter-vehicle communications to increase throughput,
efficiency and traffic safety. In fact, optimal management of lane changes and intersections
could lead to a better use of space on the roads, and thus reduce the capacity drop due to
intersections. To go even further, one can imagine controlling autonomous and connected
vehicles to stabilize traffic by preventing the appearance of "stop-and-go" waves, and thus
improve the flow of traffic. Several studies have shown very promising results, even for low
penetration rates of this type of vehicle: congestion can be completely eliminated with only
25% of vehicles running with ACC.
Modeling also has an important role to play in managing fleets, for example a set of shared
vehicles, where one of the main problems is the reallocation of vehicles on an increasingly
dense and dynamic urban network.
This is typically a problem of multi-criteria optimization, where the number of vehicles and
their distribution by station depends on many aspects: the distances traveled, the energy
autonomy of the vehicles, the topology of the segments of the road network, etc.
2.5 State of arts
The California Department of Motor Vehicles (CA DMV) is the state agency that
registers motor vehicles and issues driver's licenses in the U.S. state of California, and is
responsible for permitting and monitoring the testing of autonomous vehicles. At the time of
writing (June 2019), 61 AV testing permit holders acquired permission from the DMV to begin
testing on California public roads (CA DMV, 2018). DMV published reports concerning AV

Chapter 2: CAV: influences and challenges
52
failures or disengagement, which is the failure event where the autonomous car failed to take
the right decision. DMV defines Autonomous Miles Driven per Disengagement as an indicator
to measure failure and reliability of CAV. Waymo is one of the satkeholders doing test in
California. Waymo experienced a reduction, from 0.8 per thousand miles of autonomous
driving in 2015 to 0.2 disengagements in the current 2016, which mean a 75 % reduction in
disengagement rate [57]. However, Waymo did not mention the reliability of each individual
car, or the probability of failures for each vehicle.
The fault tree is commonly used to evaluate the reliability of complex systems in many
fields. It identifies the possible causes of an undesired event, which leads to a failure, and can
lead to safety hazards. The FTA studies the impact of a particular component failure on the
overall performance of a system [58].
Some researchers used fault trees to analyze the impact of sensor failure on overall system
[59]. In 2013, Duran identified basic hazards using FTA, the causes and effects of these
hazards as related to 2 main sensors in the Autonomous Ground Vehicles (AGV): the LIDAR
and the computer vision systems. The author did not combine the impacts of failures for all
the different vehicle components and telecommunication system on the whole system
[60].With the same approach, Swarup and Rao analyzed the reliability ACC, which is an
automotive feature that allows a vehicle's cruise control system to adapt the vehicle's speed to
the traffic environment. The authors used FMEA and FTA to explore basic potential cause of
failures for the RADAR and for the speed sensor. In this study, a qualitative safety analysis of
the ACC was considered. However, the failure probability value of the overall system was not
calculated [61].
How many miles of driving would it take to demonstrate autonomous vehicle reliability?
In order to answer this question, a study using a statistical approach demonstrated that a CAV
would have to be driven hundreds of billions of miles to demonstrate their reliability in terms

Chapter 2: CAV: influences and challenges
53
of fatalities and injuries, which is not reasonable [62]. For all the CAV manufactures, scientists
are using simulators that can replay the real-world miles and can build completely new realistic
virtual scenarios. The simulations provide feedback to the designer in order to evaluate the
car, do the necessary modifications in the design and maybe create a new generation of self-
driving vehicles. This process is referred to as safety through Iterative design [63].
Some researchers suggest the simulation method to validate the CAV reliability and
performance in various situations [64]. However, simulation and test procedures should
include all road conditions and run a lot of regression testing in order to identify the critical
reliability gap [65]. This advanced simulator should be able to run a lot of structure tests and
virtual tests to give the confidence that the CAV is safe and reliable enough to be deployed on
the road.
Safety and reliability features include a fault-tolerant computing system. For that, a set of
redundant sensors with over lapping viewing areas is necessary to create a reliable
representation from the autonomously driving vehicle’s surroundings [66]. However,
redundancy is not always an affordable solution.
Reliability also tackles advanced navigation, environment perception, object detection and
fusion, and machine learning strategies, smooth and intuitive autonomous-manual switching
and the ability to fully disengage and power down the drive-by-wire and computing system
upon E-stop [67]. As mentioned by Waymo, the reaction times, which is the time needed for
a driver to take control on the vehicle in case of a disengagement event (autonomous failure),
was 0.91 seconds on average for all measurable events [68]. Further, with increased vehicle
miles travelled, the reaction times were found to increase, which suggests an increased level
of trust [69]. However, as proved later, for better safety in level 3 (conditional automation)
and even in level 4 (highly automated Level) the reaction time of the back-up driver should be
minimized.

Chapter 2: CAV: influences and challenges
54
Many things can affect the safety of CAVs and can be reasons for the unreliability of CAV.
Significant sensor noise can exist whereby computer vision systems exiting in CAV may not
properly realize low error rates for autonomous navigation. Visual or perception systems can
fail in poor visibility conditions or in low illumination environments [70]. Moreover, in
complex circumstances, such as accident areas, construction zones and unexpected scenarios,
reaching human-level precisions and reliability in the higher-level perception, planning, and
decision-making is still a doubt.
For more reliable decision-making, Berger et al., provided the prospect of applying
software engineering to achieve safe and reliable driving on urban environments with an
anticipatory CAV. They present the combination of sensor-gathered and wirelessly received
information to retrieve information from obstructed and non-visible scenarios [71].
CAV may cause many accidents and some of them lead to fatalities due to failures of the
autonomous system. A study investigates the crash rate of CAV compared to the police-
reported rate estimated from the Second Strategic Highway Research Program (SHRP 2) and
Naturalistic Driving Study (NDS). The results show that self-driving cars estimated at a rate
per million miles are reported to have a lower crash rate than regular cars, especially for severe
crashes [72].
Adouane et al. proposed the design and development of appropriate Multi-controller
Architectures (MCAs) and mechanisms to manage these controllers’ interactions, and enhance
the metrics/criteria concerning the overall control reliability in complex and dynamic
environments [73].
Shi et al., utilizes generalized stochastic Petri nets to model the reliability of Redundant
Vehicle Management Computer System and efficient fault monitoring device designs [74].
Several researches focused on reliability of perception of CAV [75]. Data fusion from
multiple sensors can minimize shortcomings of individual sensors and increase the reliability

Chapter 2: CAV: influences and challenges
55
and robustness of the system [76]. Bresson et al., proposed a cooperative fusion architecture
based on two main algorithms: a laser-based Simultaneous Localization and Mapping process
and a lane detection and tracking approach [77].
Concerning the reliability of communication between the CAVs: vehicles to vehicle (V2V)
or vehicle to infrastructure (V2I), most of research focused on reliability of communication
protocols used in VANET such as Dedicated Short Range Communication (DSRC) and
Wireless Access in Vehicular Environments (WAVE). Moreover, most of them emphasized
on reliability in terms of successful packet delivery and the optimization of the number of
packet drops.
For example, in 2011, Kazerooni examined the connectivity as a function of traffic load. In
2012, Ma et al. investigated additional metrics, such as reliability in terms of packet reception
ratio, and effective range of coverage [78]. Lann presents the safety and reliability for
Intelligent Vehicular Networks (IVN) for platoons and cohorts. To avoid failure, he introduces
diversified functional redundancy, giving a replacement in case of telemetry failures as an
example [79].
Many researches focus on finding reliable routing in connected vehicles, and on classifying
routing protocols.
In 2008, He et al., present a new algorithm with two notations: virtual equivalent node
(VEN) and differentiated reliable path (DRP) to solve the problem of link failures, Road Side
Unit (RSU) will play the role of VEN if the route failed [80]. In 2007, Kihl introduced a routing
protocol ROVER (Robust Vehicular Routing) based on positions of location-aware vehicles
to define the zones [81]. The protocol broadcasts control packets and works as Ad hoc On-
Demand Distance Vector (AODV) protocol to discover the best routing path. A classification
is described in Gongjun in 2010 to classify the existing VANET routing protocols into five
categories according to their used routing metrics [82]. In 2016, Dharmaraja calculated the
Chapter 2: CAV: influences and challenges
56
reliability of the On Board Unit (OBU) in function of hardware reliability and channel
availability without taking hardware security into consideration and by using simulations
instead of real data [83]. Ahmad et al, listed all papers working on the reliability of
communication networks and classified them according to the modeling and analysis
techniques. For each paper listed in their work, authors provided a survey of each application
in communication networks mentioning the strong and weak points of different approaches
[84]. As for VANET applications, only the research of Dharmaraja et al., (2016) mentioned
above is listed.
Other studies focused only on the connected vehicles’ security challenges and their possible
related solutions. In 2013, Dhamgaye et al., presented the most recent challenges for VANET
security and presents proper solutions [85]. In another paper, the authors presented a recent
classification of VANET attacks and provided possible cryptographic solutions to the security
challenges of VANETs [86].
Despite of this, the intersection between dependability and security attributes while
studying the security of CAV is not enough since dependability is defined as an umbrella that
covers other attributes including maintainability [87].
Many researchers used a Markov chain model to estimate the reliability and the
performance of IEEE 802.11P. In [88], the author proposed a Markov chain model to analyze
the back-off procedure of beacon and emergency messages, and then he evaluated the
probability and throughput of packets. Yao et al. proposed two Markov chains to study the
performance and the reliability of the IEEE 802.11P safety communication on the Control
Channel (CCH). Safety-related messages were classified as four ACs with different priorities
based on the degree of emergency. The Packet Reception Rate (PRR) and packet delay were
analyzed in detail by using virtual collisions [89].
Chapter 2: CAV: influences and challenges
57
2.6 Conclusion
A strategic concern with automated driving at this phase of its growth is that it is not yet
reliable and safe enough. This fast growing area provides great opportunities but also poses
significant challenges from a dependability point of view
In all aforementioned articles, we notice that the quantitative and qualitative reliability
analysis for the CAV system as whole was ignored in realizing their functions. Hence, we
propose to analyze the reliability of CAV in terms of functions reliability, of the whole system
based on real data gathered from a professional database called Quanterion Automated
Databook (QAD) that uses Electronic Parts Reliability Data (EPRD).
Currently, in connected cars, most of the researches and works carried out relate to the
evaluation of the communication performance and for routing protocols, without taking into
consideration dependability and operational safety of the system as whole. Given that this
problem is relatively new for applications in the mobile environment using ad-hoc networks,
the development of methods and models to assess the reliability of smart vehicles by the
approaches of reliability and dependability analysis, that evaluate quantitative and qualitative
measures characterizing the dependability of AV, has become indispensable.
The valuation of these problems is the subject of quantitative and qualitative reliability
analysis for the CAV that enables the designers of CAV to ensure that the selected system is
well suited to fulfill the dependability requirements.
Chapter 3: Global qualitative study of dependability of CAV.
58
CHAPTER 3 - GLOBAL QUALITATIVE STUDY OF DEPENDABILITY OF CAV ........................58
3.1 INTRODUCTION ................................................................................................................................... 59
3.2 DEPENDABILITY OVERVIEW ................................................................................................................. 61
3.3 THE PROPOSED APPROACH .................................................................................................................... 63
3.4 PRELIMINARY RISK ANALYSIS (PRA) ......................................................................................................... 64
3.4.1 Definition .................................................................................................................................. 64
3.4.2 Functional Architecture of CAV ................................................................................................ 65
3.4.3 Severity, Frequency and Controllability .................................................................................... 69
3.5 EXTERNAL FUNCTIONAL ANALYSIS ........................................................................................................... 71
3.5.1 Bull chart .................................................................................................................................. 72
3.5.2 Octopus diagram ...................................................................................................................... 73
3.5.2.1 Manufacturing and transportation ................................................................................................ 74
3.5.2.2 Maintenance .................................................................................................................................. 75
3.5.2.3 Use ................................................................................................................................................. 75
3.5.2.4 End of life ....................................................................................................................................... 76
3.6 INTERNAL FUNCTIONAL ANALYSIS ............................................................................................................ 76
3.6.1 The functional block diagram ................................................................................................... 77
3.6.2 Global functional block diagram .............................................................................................. 78
3.6.2.1 Functional block diagram of sensors .............................................................................................. 79
3.6.3 Functional analysis table .......................................................................................................... 81
3.7 FAILURE MODE, EFFECTS AND CRITICALITY ANALYSIS (FMECA) .................................................................... 82
3.7.1 The "project" benefit FMECA .................................................................................................... 82
3.7.2 The "system" objectives of FMECA product .............................................................................. 83
3.7.3 The FMECA "Product" ............................................................................................................... 84
3.8 CONCLUSION ...................................................................................................................................... 86
Chapter 3 - Global Qualitative Study of Dependability of CAV

59
3.1 Introduction
Before the twenty-first century, researchers and industrial leaders have been competing to
develop the first fully autonomous vehicle that is robust, reliable, and safe enough for real-
world and high-speed driving environments. Major contributions to early CAV research were
limited to CAV tests and competitions held around the world. Those however, identified major
difficulties and shortcomings in CAV software and hardware, some of which remain
unresolved especially in terms of safety and reliability.
The user should trust the vehicle and accept the remaining risk; it cannot be deployed in
the market before having a suitably sufficient level of reliability [62].
To gain a better understanding of these radical changes, imposed by these intelligent
vehicles, we first need to understand the specific features of a CAV. Collaboration between
many different aspects of research, and sciences should occur, including safety and reliability
engineering, automation techniques, AI, geo-location, mathematical modeling, robotic
techniques, processing and multisensory fusion, telecommunications, networks,
cybersecurity, and others…
Koopman et al., [90] mentions that the reliability of CAV is affected by multi-disciplinary
interaction with all levels of functional hierarchy. These interactions include hardware fault
tolerance, software architectures, resilient machine learning, communication between humans
and vehicles, cooperation with humans driving conventional vehicles, perception in highly
dynamic environments, regulatory approaches, testing and validation of systems operation in
different environments, etc. The apparent risks associated with these new technologies begin
to multiply thus making the dependability analysis process more important than ever.
Currently, a major concern is unsafe driving by drivers who are not aware of how the
intelligent vehicle functions on the road. Furthermore, in order for autonomous vehicles to
have significant improvements to safety and efficiency, the driver must be aware of the

Chapter 3: Global qualitative study of dependability of CAV.
60
capabilities of the technology. This includes critical factors such as the limitations of the
technology, the application of the technology, and the suitable situations to use this technology
[91].
In general, robust and reliable perception and localization (fed from the sensors) leads to a
reliable AI decision for vehicle control. However, the driver needs to fully understand how
and when a CAV can fail and the causes of such failure.
After several fatal accidents, such as Uber on March 18, 2018, and Tesla’s on May 2016
[92] [93], it was concluded that more reliability is needed, and more constraints should be
introduced on the certification of level 3 autonomous vehicles. In the Uber accident, the self-
driving car killed a woman in Arizona because of a failure in the perception system to identify
a pedestrian thus not decelerating swerving to avoid crashing into the pedestrian. Whereas in
the Tesla accident, the autonomous system failed to apply the brakes. Many manufactures have
adopted the idea of ignoring conditional automation (Level 3). These automakers intend to go
directly for full automation (Level 5) which they think is a safer alternative [94] .
With this strategic decision, a new generation of vehicles will be on the road, thus
increasing the challenge of safety and of dependability. However, the questions remain the
same: what are the guarantees? What are the risks of this step? What are the failure modes and
effects analysis of using full-unrestricted automation of vehicles on the roads for every driving
scenario?
Complex electronic systems failures or even small failures such as vehicle operating system
failures, faulty sensors, distorted signals, or software errors can have catastrophic results. Self-
driving vehicles will certainly have failures that contribute to crashes; the question is their
frequency compared to human drivers. For that, in this chapter we utilize the reliability
analysis to identify the potential hazard sources and accident scenarios and to assess the
potential impact these can have on human life, environment, and technology.
This chapter aims to provide a comprehensive reliability and functional analysis of CAVs

Chapter 3: Global qualitative study of dependability of CAV.
61
to address a lack of synthesized information about sensor, hardware, and algorithm
requirements for effective CAV deployment. Furthermore, this chapter performs a failure
analysis to evaluate how reliable the system would be. Therefor an internal and external
functional analysis, Preliminary risk analysis (PRA) and failure modes and effects criticality
analysis (FMECA) were done to analyze the reliability and possible failures.
The purpose of this research is also to identify the threats associated with CAV. Reliability
analysis is a potential source of information for all stakeholders in transportation sector such
as vehicle manufacturers, equipment manufacturers, transport operators, software publishers
or manufacturers of electronic components to evaluate the regulations and the policies needed
for CAV mass utilization.
3.2 Dependability Overview
Dependability and safety are one of the key issues in CAV development. The shift from
traditional vehicles to intelligent vehicles poses fundamental challenges concerning the
security and the reliability of such systems.
The dependability of a system is a set of properties or attributes such as reliability,
maintainability, safety, availability, and security. Dependability is the ability of a system to
perform its desired functions or tasks correctly in a certain environment at a certain point in
time. In other words, dependability is the ability to deliver a service that can justifiably be
trusted. The service delivered by a system is its behavior as perceived by its user(s); where a
user is the entity interacting with the system [95]. Some of these attributes, such as reliability
and availability, are quantitative whereas others are qualitative, for instance, safety and
security [96].
Reliability is defined as the ability of a functional unit to perform a required function under
given conditions for a given time interval [97]. In CAVs, reliability is the probability that the
CAV will work without failure during its running time under the specified operating

Chapter 3: Global qualitative study of dependability of CAV.
62
conditions. Reliability analysis of autonomous CAVs identifies undesirable events and
sequences of events leading to autonomous navigation failure, which could lead to road
crashes, vehicle damage, fatalities or injuries. It is important to differentiate between
availability and reliability concepts; reliability refers to failure-free operation during an
interval, while availability refers to an operation which is free of failure at a given instant of
time and how quickly it can be repaired, restored, or recovered [98] .
Dependability is a global concept, which includes various notions that can be grouped into
three classes: the threats, the attributes, and the means by which dependability is attained.
The threats to dependability are: faults, errors, and failures that might affect the service(s)
delivered by the system. They are undesired, but not in principle unexpected circumstances
causing or resulting from lack of dependability.
Fault: An incorrect step, process, hypothesize, or data definition, which causes the system
to perform in unanticipated manner and cause an error. It is an inherent weakness of the design
or implementation, which might result in a failure.
Failure: occurs when the delivered service no longer complies within the specified
requirements.
Error: is the part of the system state that may lead to its subsequent service failure.
Failure Cause: Could be a defect or broken part, which is the underlying cause of a failure
Failure Mode: “A single event, which causes a functional failure.” (SAE JA 1011/SAE JA
1012)
Failure Effect: Effect due to a failure mode
Faults are the cause of errors that may lead to failures.
Failure Cause Failure Mode Failure Effect.
In order to evaluate failures and manage or predict reliability of a CAV, we used some

Chapter 3: Global qualitative study of dependability of CAV.
63
common methods such as Time to Failure (TTF), Failure Mode and Effect Analysis (FMEA)
and Failure Mode Effects and Criticality Analysis (FMECA).
3.3 The proposed approach
For any complex system such as the connected autonomous vehicle (CAV), it is essential
to focus the analysis on the most critical components.
To detect the potential risks related to a system, first we should divide our CAV system
into subcomponents. A comprehensive behavior study for each single component was
achieved to establish the relationships between the components and overall system function.
An analysis of the more critical components helps in developing a complete reliability
analysis.
This chapter presents the functional and dysfunctional analyzes of the system. The
proposed analysis focuses on the reliability attribute of dependability. Hence, the analytical
tools dedicated to the forecast reliability must be implemented. Those commonly used tools
are: [99]:
a- Preliminary Risk Analysis (PRA): It identifies the risks associated with different system
failure scenarios. This analysis is particularly necessary for the integration of security
objectives into the design of a system. This is a qualitative analysis.
b- External Functional Analysis (EFA): It aims to identify the main functions and expected
constraints related to the system environment. It is independent of the operation of the
system. It is expressed by the functional specifications. It is a qualitative analysis.
c- Internal Function Analysis (IFA): It analyzes the way in which the system responds to
the functions identified in external functional analysis. It is expressed on the basis of the
architecture of the system, by the technical specifications.
d- Failure Mode, Effects and Criticality Analysis (FMECA): Its objective is to list the
consequences of all modes of failure of the studied system and to prioritize them. This

Chapter 3: Global qualitative study of dependability of CAV.
64
measure evaluates the criticality of failure modes.
e- Fault Tree: For a dreaded event identified in PRA or FMECA, a fault tree is used to analyze
the sequence of causes that can cause this event. This qualitative analysis can be used
quantitatively to estimate the predictive reliability. The fault tree starts from a complete
system failure and moves backwards to identify all possible causes.
These different tools must be used according to a defined methodology such as that
presented in Fig. 3-1 [100]. We propose to adopt the following method: first, it is necessary to
define the system to study. This is a technical definition but also an environmental one. The
second step is to analyze how the system works in order to study potential malfunctions. Then
comes the modeling of the system, which is realized here by the development of fault trees.
Figure 3-1 Qualitative analysis approach of dependability
3.4 Preliminary risk analysis (PRA)
3.4.1 Definition
This approach begins with the functional analysis of the system in which the functional
safety of the autonomous vehicle is integrated. In order to ensure a safe response to the system,

Chapter 3: Global qualitative study of dependability of CAV.
65
the identification of potential hazards is carried out even before the beginning of the functional
analysis.
Preliminary Hazard Analysis (or PRA) “is a hazard identification and analysis technique
that can be used in the early stages of design to identify hazards and assess their criticality”
according to the IEC-300-3 standard of 1995. Its purpose is to identify sources and scenarios
that pose danger to the person, and to assess the severity of the consequences. Hazard
identification is carried out with the experience and knowledge of the experts. By field of
application, the analysis is based on lists of dangerous situations. A Preliminary Hazard
Analysis usually includes an estimate of the probability of occurrence of hazardous situations
and potential accidents as well as their effects and consequences. This analysis helps suggest
measures to remove those hazards. These measures can then be translated into security
objectives.
The main advantages of this tool are that it is economic in terms of the time spent and that
it does not require a very detailed level of description of the system studied.
On the other hand, the preliminary analysis of the risks alone does not enable identifying
the chain of events likely to lead to a major accident for complex systems such as autonomous
vehicles. The integration of results in terms of safety objectives when setting the specifications
ensures that they are taken into account in the early design phases. However, in simple systems
where the working group has sufficient experience, the PRA method can be enough. This
analysis can be updated at key points of the design progress. It can also be a support for the
writing of user or operating guides.
In order to carry out our preliminary risk analysis, we have chosen the simplified schema
below that represents how an autonomous vehicle works [101].
3.4.2 Functional Architecture of CAV
A functional architecture is an architectural model that identifies a system’s functions and
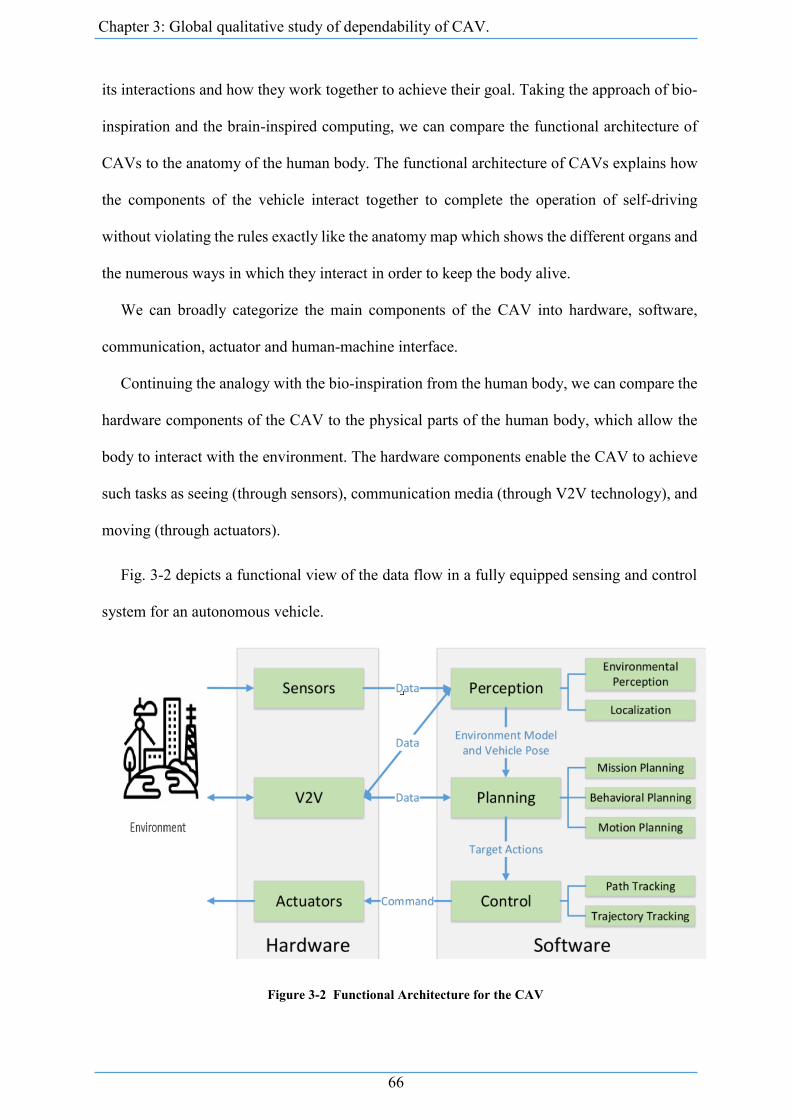
Chapter 3: Global qualitative study of dependability of CAV.
66
its interactions and how they work together to achieve their goal. Taking the approach of bio-
inspiration and the brain-inspired computing, we can compare the functional architecture of
CAVs to the anatomy of the human body. The functional architecture of CAVs explains how
the components of the vehicle interact together to complete the operation of self-driving
without violating the rules exactly like the anatomy map which shows the different organs and
the numerous ways in which they interact in order to keep the body alive.
We can broadly categorize the main components of the CAV into hardware, software,
communication, actuator and human-machine interface.
Continuing the analogy with the bio-inspiration from the human body, we can compare the
hardware components of the CAV to the physical parts of the human body, which allow the
body to interact with the environment. The hardware components enable the CAV to achieve
such tasks as seeing (through sensors), communication media (through V2V technology), and
moving (through actuators).
Fig. 3-2 depicts a functional view of the data flow in a fully equipped sensing and control
system for an autonomous vehicle.
Figure 3-2 Functional Architecture for the CAV
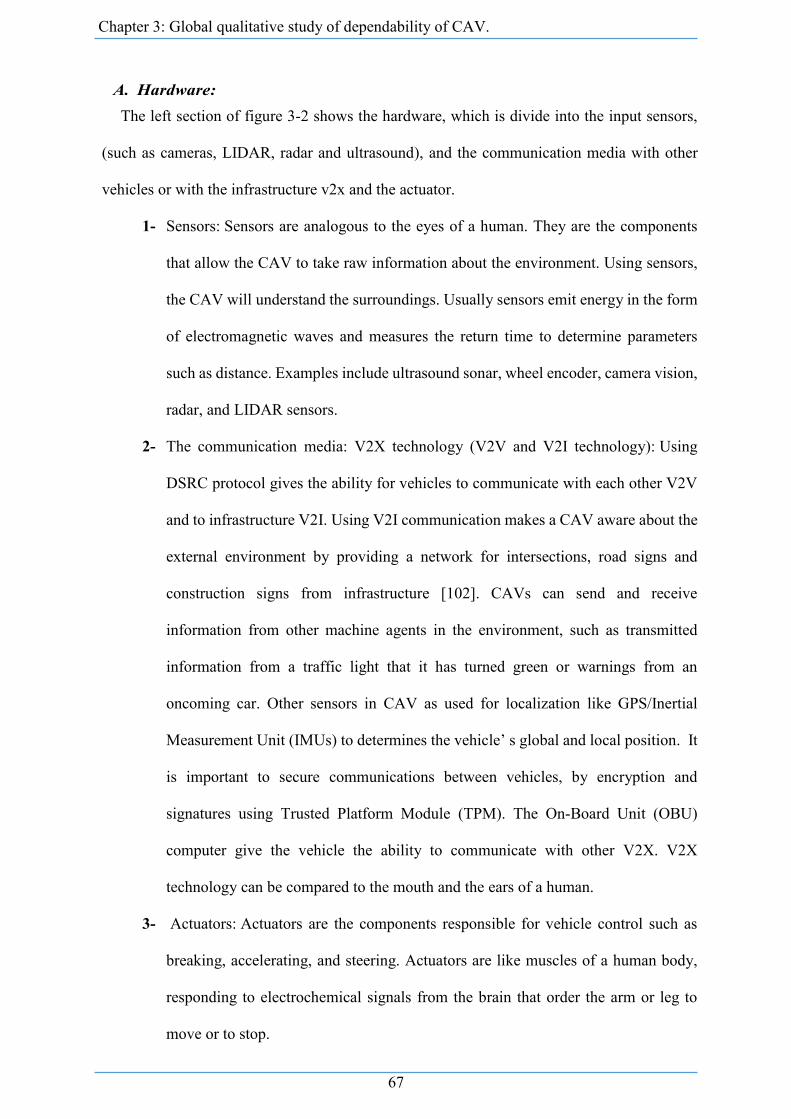
Chapter 3: Global qualitative study of dependability of CAV.
67
A. Hardware:
The left section of figure 3-2 shows the hardware, which is divide into the input sensors,
(such as cameras, LIDAR, radar and ultrasound), and the communication media with other
vehicles or with the infrastructure v2x and the actuator.
1- Sensors: Sensors are analogous to the eyes of a human. They are the components
that allow the CAV to take raw information about the environment. Using sensors,
the CAV will understand the surroundings. Usually sensors emit energy in the form
of electromagnetic waves and measures the return time to determine parameters
such as distance. Examples include ultrasound sonar, wheel encoder, camera vision,
radar, and LIDAR sensors.
2- The communication media: V2X technology (V2V and V2I technology): Using
DSRC protocol gives the ability for vehicles to communicate with each other V2V
and to infrastructure V2I. Using V2I communication makes a CAV aware about the
external environment by providing a network for intersections, road signs and
construction signs from infrastructure [102]. CAVs can send and receive
information from other machine agents in the environment, such as transmitted
information from a traffic light that it has turned green or warnings from an
oncoming car. Other sensors in CAV as used for localization like GPS/Inertial
Measurement Unit (IMUs) to determines the vehicle’ s global and local position. It
is important to secure communications between vehicles, by encryption and
signatures using Trusted Platform Module (TPM). The On-Board Unit (OBU)
computer give the vehicle the ability to communicate with other V2X. V2X
technology can be compared to the mouth and the ears of a human.
3- Actuators: Actuators are the components responsible for vehicle control such as
breaking, accelerating, and steering. Actuators are like muscles of a human body,
responding to electrochemical signals from the brain that order the arm or leg to
move or to stop.

Chapter 3: Global qualitative study of dependability of CAV.
68
A- Autonomous Vehicle Software
Self-driving software is the “brain” of a CAV, which processes all the information coming
from the sensors and the communication media about the environment and uses that
information to make the best driving decisions for each situation.
thanks to AI, self-driving software can detect the presence of other objects, understand what
an object is, how it is likely to behave, and how that should affect CAV’s behavior on the road.
Autonomous vehicle software can be categorized into three systems: perception, planning, and
control [103].
1- Perception: Perception is the part of the software that detects and classifies objects on
the road, while also estimating their speed, direction, and acceleration over time. The
software takes the myriad of details coming from sensors and V2x, and turns those into
a cohesive real-time view of the world. Perception helps a CAV differentiate vehicles,
motorcyclists, cyclists, pedestrians, or other objects. It also distinguishes the color of
traffic lights. Perception enables the vehicle to understand the situation around it,
whether a light is green and clear for the vehicle to proceed, or whether a lane is blocked
because of the cones ahead [50]. This process is analogous to how the brain processes
the information obtained through sight into meaningful information. The
photoreceptors of our eyes (the sensors) absorb light waves emanating from the
environment and convert those light waves into electrochemical signals. Networks of
neurons pass these electrochemical signals all the way back to the visual cortex of the
brain, where the brain processes what these electrochemical signals mean. In this way,
the brain can understand whether a certain light pattern hitting retina represents a
person, a vehicle, or another object.
2- Planning system: considers all the information gathered from perception, and plots out
a path for the CAV. Planning can also think several steps ahead. Planning identifies
multiple paths per second, and constantly chooses the best one to meet changing road

Chapter 3: Global qualitative study of dependability of CAV.
69
conditions and events [104]. The planning system in CAV works in the same way of
the frontal lobe of the human brain, which enables us to reason and make decisions.
3- Control: the control competency converts intentions into planned actions. It refers to
the autonomous vehicle’s ability to execute the planned actions that have been
generated by the higher level processes. Its main purpose is to execute the planned
intentions by providing necessary inputs to the hardware level (the actuators) that will
generate the desired motions. As an example, slowing down when approaching a red
light by applying the brakes [50]. Cerebellum in human brain process in the same way.
The cerebellum in the human brain works in a similar manner. The cerebellum is
responsible for the important function of motor control. For example, it enables us to
chew when the desired intention is to eat.
3.4.3 Severity, Exposure and Controllability
Now we can find in the table below the main elements of the preliminary risk analysis.
The three indices “Severity, Exposure and Controllability” referred in Table 3-1 as S, E,
and C, are scored on a scale from 0 to 10, 0 for a very low level and 9 being the highest degree
of the characteristic. Thus, a severity ranking of 0 means that the initiating event is not
dangerous. Whereas, a or exposure ranking of 0 indicates that the event will never take place.
Finally, a controllability or detectability ranking of 0 indicates that the event is easily
controllable if it occurs.
Risk is the combination of probability, severity, and criticality – also known as risk priority
number (RPN) - is calculated as the multiplicity of all three rankings “Severity, Exposure and
Controllability”.
The numbers between 0 and 10 in the table are chosen according to a logical way based on
Automotive Safety Integrity Level (ASIL) which is a risk classification scheme defined by
the ISO 26262 - Functional Safety for Road Vehicles standard.

Chapter 3: Global qualitative study of dependability of CAV.
70
Each hazardous event is classified according to the severity (S) of injuries it can be
expected to cause:
Severity Classifications (S):
S0: No Injuries; refer to numbers: 0, 1 and 2.
S1: Light to moderate injuries; refer to numbers: 3, 4 and 5.
S2: Severe to life-threatening (survival probable) injuries; refer to numbers: 6, 7
and 8.
S3: Life-threatening (survival uncertain) to fatal injuries; refer to numbers: 9 and
10.
Within the hazard analysis and risk assessment process of this standard, the likelihood of
an injurious hazard is further classified according to a combination of: exposure (E) (the
relative expected frequency of the operational conditions in which the injury can possibly
happen) and control (C) (the relative likelihood that the driver can act to prevent the injury).
Exposure Classifications (E):
E0 Incredibly unlikely; refer to numbers: 0, and 1.
E1 Very low probability (injury could happen only in rare operating conditions);
refer to numbers: 2, and 3.
E2 Low probability refer to numbers: 4 and 5.
E3 Medium probability refer to numbers: 6, 7 and 8
E4 High probability (injury could happen under most operating conditions) refer to
numbers: 9 and 10
Controllability Classifications (C):
C0 Controllable in general; refer to numbers: 0, 1 and 2.
C1 Simply controllable; refer to numbers: 3, 4 and 5
C2 Normally controllable (most drivers could act to prevent injury); refer to
numbers: 6, 7 and 8.

Chapter 3: Global qualitative study of dependability of CAV.
71
C3 Difficult to control or uncontrollable; refer to numbers: 9 and 10.
Table 3-1 preliminary risk analysis
According to Table 3.1, we can notice that all failures are dangerous, especially those
related to the control system.
3.5 External Functional Analysis
The external functional analysis considers the system in a global and unitary way; it studies
the functions that the system must be able to perform with respect to its external environment,
regardless of the technical solution envisaged for the system [105].
To do this, we will separate the external analysis into two different parts illustrated by two
types of diagram:
- Bull chart (Fig. 3-3).
- Octopus diagrams (Fig. 3-4).
Initiating event Effect on system Scenario description Dreaded event for
the user
S F C RPN Safety goal
Sensor failure Lack of
information
about
environment
- Defect in the
manufacture of the sensor
-Low illumination
environments
- Poor visibility
conditions
- Heavy traffics
- Attack (intentional
noise, jamming
and spoofing)
Vehicle and
property damage
6 7 4 168 sensor fusion,
diversified functional
redundancy
V2V and V2I
components
failure
Lack of
information
about the other
vehicles and
about Road side
unit
- Defect in the
manufacture
-congestion in channel
- loss of packets
Vehicle and
property damage
4 7 5 140 Add more
components in
standby, diversified
functional
redundancy
Control system
failure
Software system
failure
-Programming problem in
AI and machine learning.
-lack of reinforcement
learning and semantic
reasoning
shock and serious
injury or victim
9 3 9 243 Simulation and test
procedures in all
road conditions.
Actuators failure loss of
controllability
Defect in the manufacture shock and serious
injury
7 4 8 224 Periodic and
preventive
maintenance
Chapter 3: Global qualitative study of dependability of CAV.
72
First, the bull chart is essential as it identifies the main functions in relation to customers.
Then, the octopus diagram allows identifying the main functions and constraints in different
phases of the life of the product.
3.5.1 Bull chart
Figure 3-3 Blue chart for CAV
After having realized our Bull chart, we answered three questions about the existence of
the product. They are detailed below:
Why this product exists?
CAVs exist to allow the user to move autonomously with minimal or no human assistance
in a safe way.
What could make it disappear?
We believe that two main things make CAVs fail:
1- CAVs hold the promise of saving millions of lives. Nonetheless, CAVs will inevitably have
some accidents. Thus, CAVs must be able to prevent many more accidents than those
caused by conventional vehicles, otherwise they will disappear.
2- An external environment too aggressive due to product liability litigation, which is widely
perceived as one of the largest obstacles to autonomous consumer vehicles. Challenges

Chapter 3: Global qualitative study of dependability of CAV.
73
facing the CAV production are many such as cyber security cost and impact. Crippling
suits could force manufacturers to exit the market because of a belief that the sales cost are
not worth the risk.
What could change it?
New types of control and improvement in the pilot program allowing it to be more efficient.
We can conclude from the Bull chart that a main function can be highlighted for this
product; we will tackle that in the octopus diagram.
3.5.2 Octopus diagram
In order to express the different functions, we will start by highlighting the contexts of use
and life cycle of the product.
The life cycle is the set of phases the product goes through and all the situations during the
life of the product. The object is in contact with a number of elements of its environment. The
"external environment of use" is composed of all these elements.
The different phases associated with our product life cycle are the following:
- Manufacturing
- Transportation
- Use
- Maintenance
- End of life
In addition, the functions are relations between the object to be designed and the external
environment. They are the behavior necessary for the product to fulfill the goals previously
expressed in the objective specifications and they are in the form of operations on the flows
(energy, material, and signal). When using the product, functions are services that the object
must render to the customer. They are characterized in terms of goals. It is important to note
that functions are expressed without any hint to a solution.

Chapter 3: Global qualitative study of dependability of CAV.
74
3.5.2.1 Manufacturing and transportation
CAVs will quickly solve many transportation problems. Manufactures predict that such
vehicles will be sufficiently convenient and affordable to displace most human-operated
vehicles. Providing many savings and benefits to users and society overall. However,
manufacturing of CAVs should respect a lot of standards and regulation.
Figure 3-4 Octopus diagram for manufacturing and transportation of CAV
Details of the functions:
FC1: Keeping the operator safe
FC2: Ability to be controllable by machines
FC3: Ability to be manufactured using standard tools
FC4: Respecting standards: The National Highway Traffic Safety Administration (NHTSA)
within the Department of Transportation (DOT) specifies minimum safety performance
requirements for motor vehicles and equipment.
FC5: Adapting to the environment of the manufacturing workshop, knowing that CAVs
reduce traffic/congestion, which decreases air pollution through efficient traffic flow.
FC6: Ability to be manufactured using "standard" material keeping in mind that the

Chapter 3: Global qualitative study of dependability of CAV.
75
manufacturing of CAVs needs many innovative materials.
3.5.2.2 Maintenance
The predictive and preventive maintenance of vehicles definitely will be improved by
reading and analyzing the data collected from the sensors. However, CAV may require further
maintenance standards, in roadway infrastructure, such as clearer line painting and special
traffic signals [106] .
Shared autonomous vehicles will reduce vehicle ownership. Thus the responsibility for
maintenance, repairs, and updates should be defined. Second, the warranties and the
indemnifications should have a well-clarified scope and responsibility. Moreover, liability
between automaker, technology company and vehicle owner/operator should be distinct.
Finally, responsibility for compliance with federal, state, and local laws and regulations should
be described.
3.5.2.3 Use
Figure 3-5 Octopus diagram for manufacturing and transportation of CAV.

Chapter 3: Global qualitative study of dependability of CAV.
76
The use of CAV should respect many functions. In the Fig. 3-5, the red line that connects
the user with the movement represents the main function. However, the other lines represent
the constraint functions.
Details of the functions:
FP1: Allow the user to move safely from one place to another without the need for human
interaction (partially or fully) in a safe way.
FC1: Be controllable by the user: The user can safely take over the vehicle’s control, when
the system faces some difficulties.
FC2: Be able to move and operate safely using automated driving mode
FC3: Respect the standards: Automakers must certify compliance before selling vehicles.
FC4: Adapting to the environment
3.5.2.4 End of life
The CAV material should be recyclable when it reaches the end of its life.
The external functional analysis allows us to identify the different functions that the
autonomous vehicle must perform in the different phases of its life. Indeed, it is necessary to
start with external functional analysis to identify the various important points which will be
used to do the internal functional analysis as discussed in the following section. These points
will also be used to make Failure Modes, Effects and Criticality Analysis (FMECA).
3.6 Internal functional Analysis
The external functional analysis must be supplemented by the internal functional analysis
(or analysis of the functioning). For this analysis, the knowledge of the operation of the system
is necessary. The functioning of the autonomous vehicle corresponds substantially to the
operations conventionally encountered as shown in Fig. 3-2. The internal functional analysis
examines how the proposed solution responds to the functions identified in the external
Chapter 3: Global qualitative study of dependability of CAV.
77
functional analysis. In other words, how each of the functions identified above are provided
by the different components of the system. In order to set up the system architecture, one must
remain open to the fact that the functional architecture may be different from the physical
layout of the components. Indeed, the analysis is generally carried out before the final design
of the system.
Each of the subsystems does not necessarily intervene in the response to all the functions
identified in external functional analysis. It is therefore useless to analyze the failure modes in
a systematic way for all the functions of each of the subsystems. This internal functional
analysis thus finds its full interest in targeting further study of the system. However, by its
simplification, it must also be carried out meticulously because, once again, an oversight at
this level may hide a potential failure whose effects and causes would not be taken into account
in the calculation of the achievement of the objective.
The internal functional analysis is divided into two parts:
- The functional block diagram
- The functional analysis table
3.6.1 The functional block diagram
The functional block diagram allows us to analyze the components present in the system
that will make it possible to respond to the main functions. In addition, it allows linking the
"loop" functions of the system. The loop function, which is represented by the green line, can
be seen on the general functional block diagram with a system looped between different
components.
Indeed, we have made two functional block diagrams, the first is for the overall operation
of the system named “Global Functional Block Diagram” (Fig. 3-6) and the second is the
“Functional Block Diagram of Sensors (Fig. 3-7).

Chapter 3: Global qualitative study of dependability of CAV.
78
3.6.2 Global functional block diagram
Figure 3-6 Global functional block diagram for CAV
Loop functions:
Fb1: The Automated control system should control actuators (steering, braking, signals,
etc.)
Fb2: The perception system analyses the data from the sensors and from the V2X, to plan
the vehicle actions. The proprioceptive sensors that are responsible for sensing the vehicle’s
state, and the exteroceptive sensors that are responsible for sensing the surroundings of
vehicle, should give all data to the perception system. Machine Language (ML) will have a
predominant role in building the perception algorithm and the plain system of CAV.
Fb3: the perception after collecting information and extract relevant knowledge from the
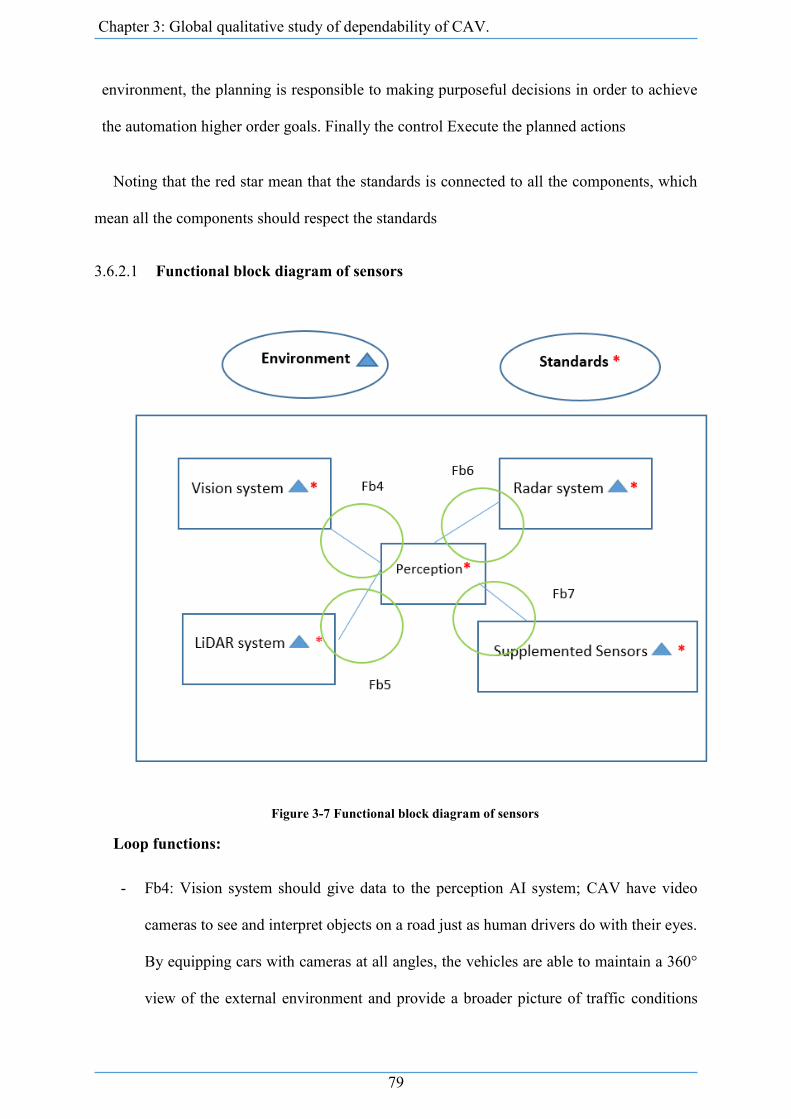
Chapter 3: Global qualitative study of dependability of CAV.
79
environment, the planning is responsible to making purposeful decisions in order to achieve
the automation higher order goals. Finally the control Execute the planned actions
Noting that the red star mean that the standards is connected to all the components, which
mean all the components should respect the standards
3.6.2.1 Functional block diagram of sensors
Figure 3-7 Functional block diagram of sensors
Loop functions:
- Fb4: Vision system should give data to the perception AI system; CAV have video
cameras to see and interpret objects on a road just as human drivers do with their eyes.
By equipping cars with cameras at all angles, the vehicles are able to maintain a 360°
view of the external environment and provide a broader picture of traffic conditions
Chapter 3: Global qualitative study of dependability of CAV.
80
around. Today, 3D cameras are available to display highly detailed realistic images.
Image sensors automatically detect objects, classify them, and determine the distance
to them. For example, the cameras can identify other cars, pedestrians, cyclists, traffic
signs and signals, road markings, bridges, and guardrails.
- Fb5: LIDAR system should give data to the perception; Lidar stands for Light Detection
and Ranging (LiDAR), acts as an eye of the CAV providing them a 360-degree view.
It work similar to radar systems. However, Lidar use light in the form of a pulsed laser
to measure different distances from its airborne location to earth, instead of
electromagnetic and radio waves. Apart from measuring the distances to various objects
on the road, lidar allows creating 3D images of the detected objects and mapping the
surroundings. Moreover, lidar can be configured to create a full 360-degree map around
the vehicle rather than relying on a narrow field of view. These two advantages make
it, as the most widely used sensor for CAV
- Fb6: Radar system should give data to the perception software; Radar (Radio Detection
and Ranging) sensors make a crucial contribution to the overall function of autonomous
driving: they send out radio waves that detect objects and gauge their distance and speed
in real time. Short- and long-range radar sensors are usually deployed all around the
car for different purposes like adaptive cruise control, Lane-Keeping Assist (LKA),
blind spot warning collision warning, Automatic Emergency Braking (AEB), and
collision avoidance.
- Fb7: Supplemented sensors such as ultrasound sensors are used for object detection at
close range (less than 2 m from the vehicle) should give data to the perception
algorithm. In addition, the wheel encoder is used to keep track of an autonomous car’s
direction, speed and the distance a wheel travels.
Same as the red star, the small blue triangle means that the environment is related to all the
listed sensors showed in the functional block diagram.
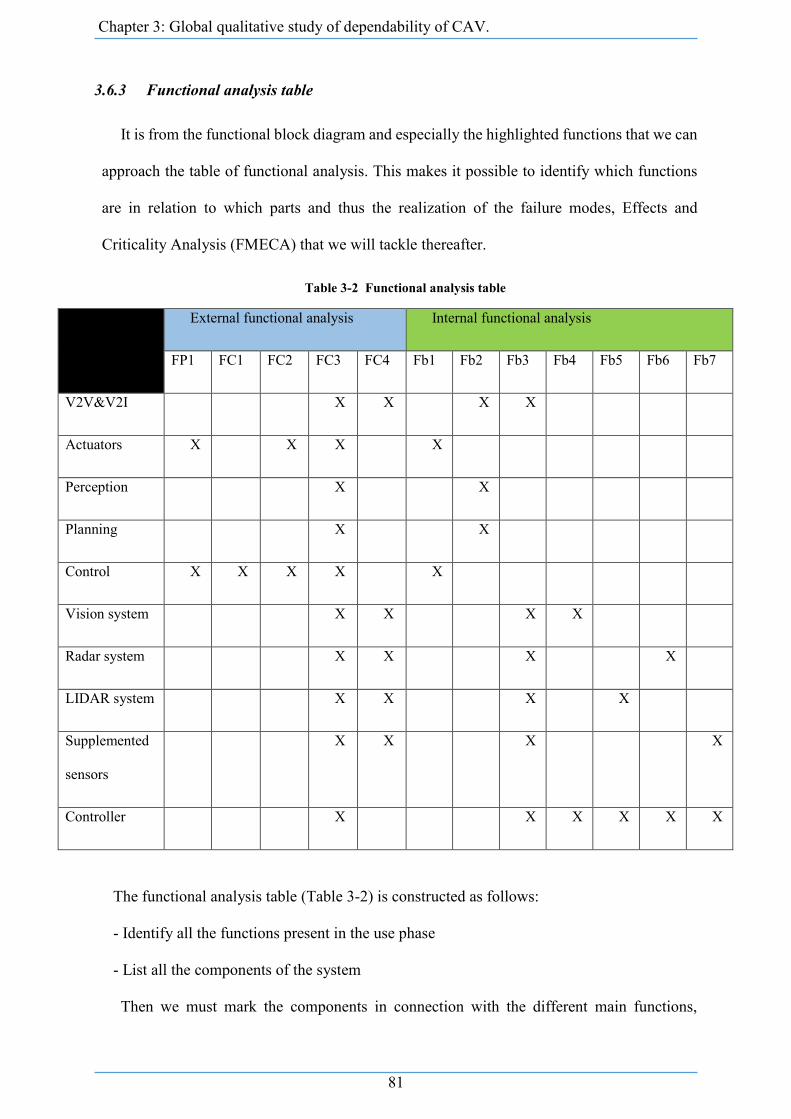
Chapter 3: Global qualitative study of dependability of CAV.
81
3.6.3 Functional analysis table
It is from the functional block diagram and especially the highlighted functions that we can
approach the table of functional analysis. This makes it possible to identify which functions
are in relation to which parts and thus the realization of the failure modes, Effects and
Criticality Analysis (FMECA) that we will tackle thereafter.
Table 3-2 Functional analysis table
External functional analysis Internal functional analysis
FP1 FC1 FC2 FC3 FC4 Fb1 Fb2 Fb3 Fb4 Fb5 Fb6 Fb7
V2V&V2I X X X X
Actuators X X X X
Perception X X
Planning X X
Control X X X X X
Vision system X X X X
Radar system X X X X
LIDAR system X X X X
Supplemented
sensors
X X X X
Controller X X X X X X
The functional analysis table (Table 3-2) is constructed as follows:
- Identify all the functions present in the use phase
- List all the components of the system
Then we must mark the components in connection with the different main functions,

Chapter 3: Global qualitative study of dependability of CAV.
82
constraints, and loops. The objective of this step is to make the connection between the
external and internal analysis in order to be able to realize the FMECA
3.7 Failure Mode, Effects and Criticality Analysis (FMECA)
Thanks to the previous studies, and the Internal Functional Analysis, we are able to develop
a FMECA: Analysis of failure modes, their effects, and criticality. FEMCA’s purpose is to
determine the failure modes of the CAV components for different main functions and
constraints listed above, as well as the expected effects. For that, a system disintegration is
needed, i.e. dividing the whole system into basic components.
The FMECA identifies and evaluates how the system may not respond to the functions
identified in the functional analysis (failure mode). The FMECA analysis lists exhaustively all
system failures [107]. The analysis of technological developments installed in CAV could be
a way to figure out the sensitive components of these vehicles.
The key components of CAV are the sensors. For vehicle automation, sensors based on
camera and radar and LIDAR technology are used. They allow the vehicle to see and sense
everything on the road, as well as to collect information needed to drive safely. The purpose
of sensing is to build a 360-degree environmental model around the vehicle for detection of
different kinds of objects. The information collected with sensors, including the actual path,
traffic jams, and obstacles on the road, are shared between the connected cars (V2V
communication) in order to improve driving automation.
3.7.1 The "projected" benefit FMECA
Beyond the main objective of identifying the weak points of a system, FMECA obliges and
forces the different experts to have the same level of knowledge of the system and thus avoid
the risk of "sectoring" the system. In other words, FMECA is an opportunity for the different
experts working on the same system not to be confined to their own field of expertise, but to
have common objectives which converge towards a solution that achieves these goals.
Chapter 3: Global qualitative study of dependability of CAV.
83
3.7.2 The "system" objectives of FMECA
Above all, it is necessary to specify different FMECA orientations with different objectives,
among which we distinguish the following:
1- The FMECA "Project”: it aims to analyze the risks of a project as a whole. This is a
permanent job throughout a project.
2- The FMECA "Product" / "System": it aims to ensure the reliability of a product / system
by improving its design. is carried out during the design of the product. This is the focus
of the FMECA used in this study.
3- The FMECA "Process": helps ensure the quality of a product by improving the production
operations of the product. This work is done during the development phase of the product.
4- The "Tool" FMECA: makes it possible to ensure the availability and the safety of a means
of production by improving the conception, the exploitation or the maintenance.
5- The FMECA "Product" (or "System"): is produced for this study and makes it possible to
identify the potential weaknesses of the system: likely modes of failure, possible causes
for each mode, and the effects of each failure according to the phase of the mission or life
cycle in which it occurs.
One of the risks of using the FMECA tool is that it is time-consuming if it is done without
respecting the homogeneity of the level of the analysis set. In addition, the completion of the
FMECA level-by-level study highlights the causal linkages of identified failures. The failure
trees associated with this system, which are developed below, are based on these links. On the
other hand, the determination of the criticism at each line of the analysis aims at establishing
a hierarchy of the failures in order to consider only the most "critical" for the continuation of
the study.
In our FMECA, we started by defining the possible failure modes of the CAV components.
Then we studied the different causes of these failures, as well as their effects on the system.
Then we evaluated them with a note according to the severity of the failure, the frequency of

Chapter 3: Global qualitative study of dependability of CAV.
84
the failure occurrence, as well as its detection (of 1 to 10, 1 the lowest, 10 the highest).
Finally, thanks to these three notes listed above, we were able to determine the criticality
of each failure, by multiplying the notes between them.
3.7.3 The FMECA "Product"
In Table 3-3 columns labelled S, F, D and C refer respectively to the severity of the failure,
the frequency of occurrence of the failure, the detectability of failure, and the criticality of the
failure.
The numbers between 0 and 10 in the table are chosen according to a logical way based on
ISO 26262 and a professional database called Electronic Parts Reliability Data (EPRD).
ISO 26262 defines functional safety for automotive equipment applicable throughout the
lifecycle of all automotive electronic and electrical safety-related systems.
Table 3-3 FMECA for CAV
Component Mode of failure Effects S Causes of failure F Detection D C
Actuators One or more failed
actuators
Vehicle not
compliant with
use
6 Defect in the manufacture
/accident
7 Regular
maintenance
3
126
Control system -Non-compliance
with standards
-Bad control
-Not suitable
decision-making
Vehicle not
controllable/
Failure of
vehicle
9 -Defect in the manufacture.
-Fail to execute the planned
actions.
-Programming bugs in AI
-lack of reinforcement
learning.
-Bad or fault semantic
reasoning.
7 Error message 8 504
V2V&V2I -Non compliance
with standards
-Failure of V2X
components
Lack of
information
about the other
vehicles and
about road side
unit
6 -Defect in the manufacture
-Congestion in channel
-Connection lost
-Delayed or loss of packets
-Wrong or defective packet
received.
-Bandwidth or range too
small
- High signal to noise ratio
- Bad weather.
-DOS attack, Jammed
channel.
-Receiving or sending wrong
data.
8 Indicator light 5 240
Perception
system
Non-compliance
with standards
-Bad data
reception
-Vehicle not
compliant with
use
- Navigational
Failure
7 -incomplete information
-imprecise perception of the
environment.
- Machine Learning problem
in classification or
recognition
5 -Error message
-Return to
manual mode
7 245

Chapter 3: Global qualitative study of dependability of CAV.
85
- Misunderstanding of the
raw information form sensors
or V2X
Planning
system
Non-compliance
with standards
Vehicle not
compliant with
use
Navigational
Failure
7 Programming bugs in AI.
-Machine Learning problem
in classification or
recognition.
-object is beyond the training
data range
5 Error message
return to
manual mode
7 245
Vision system Non-compliance
with standards
-VS failure
Lack of
information
from the
environment
6 -Defect in the manufacture
Lens Damage,
-Misalignment, shockwave,
overvoltage, short-circuit,
vibration from
rough terrain,
-Improper Lighting
-Bad weather (rain, fog and
snow)
-low illumination
environments
-poor visibility conditions
-heavy traffics
8 Indicator light 5 240
Radar system -Electrical
components failure
-noise ratios
-Clutter Effect
-Lack of
information
from the
environment
-Random
variations on
the reflected
received signal
-Bad
performance
issues with
radar systems
6 -Hardware failure
-Noise affect the accuracy of
the radar as distance
increases
-Detection curves drawn with
respect to signal
-due to long waveguide
between the transceivers.
Very near measurement.
-Bad weather
8 Indicator light 5 240
LIDAR system Non-compliance
with standards
Electrical
components failure
-Unable to send
information
to the system
-Lack of
information
from the
environment
-Object cannot
be well
identified
6 Electrical Failure, Laser
malfunction, mirror motor
malfunction, position encoder
failure, over voltage, short-
circuit, Optical receiver
damages. ,bad weather
8 Indicator light 5 240
Supplemented
sensors
Non-compliance
with standards
Lack of
information
from the
environment
6 -Detection beyond the range.
-Defect in the manufacture
-Bad weather
8 Indicator light 5 240
Controller Non-compliance
with standards
Deterioration
Lack of
information
from the
environment
7 Defect in the manufacture 7 Indicator light 7 343
Note that the most critical failure is the failure of the control system. Indeed, it is the most
difficult failure to detect in the system and which is very crucial for the user because it leads
to the failure of vehicle.

Chapter 3: Global qualitative study of dependability of CAV.
86
3.8 Conclusion
This chapter introduced the concepts of reliability as well as the required background
information including some approaches and techniques for mobile-based environment
dependability evaluation, with a particular focus on CAVs.
Our work relies on modeling in order to provide a quantitative approach for evaluating the
dependability and forecasting the reliability.
An overview of a hierarchical and stepwise modeling approach aimed at the evaluation of
CAVs was discussed. This approach is based on the evaluation of the CAV at different
abstraction and decomposition levels using a combination of various evaluation techniques
and an integrated way in order to provide end-to-end evaluations. Therefore, to develop an
efficient and reliable approach to assessing the reliability of the CAV, the internal and external
functional analysis functional analysis for CAV are adopted to address a lack of synthesized
information about sensor, hardware, and algorithm requirements for effective CAV
deployment. Therefore, PRA and FMECA were done to analyze the reliability and possible
failures.
Finally, a detailed FMECA analysis of the CAV was performed in order to obtain a detailed
understanding of the vehicle failure modes. The FMEA is an engineering method that we used
to help identify weak points of CAVs (hardware and software). This qualitative analysis
showed how reliable the designed system is by identifying potential failures of CAV
components. Our goal is to prevent these failures as early as possible and before they happen.
Potential failures could then be avoided by alternative designs or redundancies. Hence, in the
next part, we will realize the Fault tree with “Failure of CAV” as the head event (the primary
fault or failure being analyzed).
The understanding gained from the FMECA is then used in the next chapter to construct
fault trees describing the failure of each subsystem.

Chapter 3: Global qualitative study of dependability of CAV.
87
CHAPTER 4 - A FAULT TREE ANALYSIS FOR THE RELIABILITY OF CAV .............................87
4.1 INTRODUCTION ................................................................................................................................ 88
4.2 COMPONENT OF V2X TECHNOLOGY ........................................................................................................ 89
4.2.1 Communication reliability of CV ............................................................................................... 89
4.2.1.1 On Board Unit (OBU) ...................................................................................................................... 90
4.2.1.2 Trusted Platform Module (TPM) .................................................................................................... 91
4.2.1.3 Road Side Unit (RSU) ...................................................................................................................... 92
4.2.2 RBD ........................................................................................................................................... 92
4.3 PROBABILISTIC MODELING OF THE FAULT TREE EVENTS ................................................................................ 95
4.3.1 Lifetime distributions ................................................................................................................ 95
4.3.2 The exponential distribution ..................................................................................................... 96
4.3.3 Reliability of OBU and RSU ....................................................................................................... 96
4.3.4 V2V Reliability ........................................................................................................................... 99
4.3.5 V2I Reliability .......................................................................................................................... 100
4.3.6 V2X Reliability ......................................................................................................................... 101
4.4 FAULT TREE FOR CAV ......................................................................................................................... 102
4.5 IMPROVEMENT PROPOSAL FOR THE FAULT TREE .............................................................................. 110
4.6 CONCLUSION FOR THE FAULT TREE ............................................................................................... 115
Chapter 4 - A Fault Tree analysis for the reliability of CAV

Chapter 4: A Fault Tree analysis for the reliability CAV
88
4.1 Introduction
The FMEA and the FTA are different procedures, but they are complementary. The FTA is a top
down approach that analyzes the details of the events at the top. However, The FMEA goes bottom
up and analyzes the effect chain of a failing part.
Constructing an FMECA is often one of the first steps in constructing a fault tree, as it help us in
determining the possible component failures, and thus the basic events.
In this chapter, in order to identify availability and reliability of the CAV, a fault tree was
developed and analyzed.
The methods and techniques designed to carry out reliability evaluations can be conducted in two
ways:
Ordinal evaluation: such as FMEA, uses methods and techniques to identify, list, and rank
failures.
Probabilistic evaluation: such as reliability block diagrams and fault tree analysis. It evaluates
in terms of probability the degree of reliability attributes of communication components in CAV as
an example [108].
The two types of evaluation techniques are complementary, since probabilistic evaluation
requires, as a first step, the identification of failure modes to be taken into account in the assessment
of the quantitative dependability measures.
Fault forecasting is performed using evaluation of the behavior of a system relative to the
occurrence of faults and their consequences. It aims at estimating the present number, the future
incidence, and the likely consequences of faults. By adopting a structural view of a system, evaluation
consists of reviewing and analyzing the failures of its components and their consequences on the

Chapter 4: A Fault Tree analysis for the reliability CAV
89
system’s reliability. The analysis can be performed iteratively by a fault tree, which considers
different levels of decomposition and abstraction of the system.
A fault tree study allows to graphically represent the causes of an identified fault event which
one wishes to control according to certain priorities. Hence, the main objective is to reveal the causes
or combination of causes that can produce the defined head element, using two approaches:
A. A deductive approach:
In contrast to an inductive approach of FMECA, the analysis is done top down.
B. A static approach:
Represents a sequence of causes leading to the failure that we want to describe for a state of the
system at a given moment.
This Fault Tree calculates the probability of occurrence of the head event, which in our case is
“CAV failure”.
4.2 Component of V2X technology
First, we study the subcomponents of the V2X technology, which consists of an OBU for CV
and an RSU on the infrastructure using Reliability Block Diagrams (RBD), which is an effective
technique for modeling reliability and availability of communication networks [84].
We present a design of RBD for: (1) the OBU based on Dedicated Short Range Communication
(DSRC) Standard, (2) the RSU and (3) the devices that are especially interesting for security
purposes such as Trusted Platform Module (TPM). TPM is often mounted on vehicles to offer
reliable storage (e.g. user credentials and keys) and to compute cryptography. TPM hardware is
assumed to be tamper resistant so that hackers can’t gain access, even with physical presence [109].
4.2.1 Communication reliability of CV
A reliable communication in connected vehicle is dependent upon reliable hardware involved in
communication.

Chapter 4: A Fault Tree analysis for the reliability CAV
90
4.2.1.1 On Board Unit (OBU)
An OBU is a mobile or portable wireless device that is located inside intelligent vehicles [52]. It
works as a communication device and allows DSRC communications with other OBUs or RSUs.
OBU includes other communication systems (e.g. GPS.), and other subcomponents like application
unit hardware, Human Machine Interface (HMI) and power supply. Each vehicle equipped with an
OBU collects data and information, (such as vehicle’s speed, position, brake status, signal status,
etc…) analyzes, processes and encrypts the data in order to send it as a safety message to other
vehicles (V2V) or RSUs (V2R) through the wireless medium;
An automated vehicle is equipped with an OBU system designed to ensure a number of functions.
In addition to processing, inputs/outputs, and storage functions, an OBU system provides other
major functions such space-time localization and scene recognition, longitudinal telemetry and
short-range omnidirectional communications.
The set of system components required for OBU are:
Resource Command Processor (RCP): It directs the operation of the other units by providing
timing and control signals. All other resources are managed by the RCP, which is the
processing unit of the system. It must permit a local elaboration of the data gathered from
the infrastructure and from the smart vehicle. The reliability of the RCP, shall be denoted
by 𝑅𝑅𝐶𝑃.
GPS system: 360° positioning and global time keeping in order to allow the vehicle to
communicate its own position to perform geo-location. The reliability of the GPS
communication module shall be denoted by 𝑅𝐺𝑃𝑆 .
Wireless communication: VANET uses DSRC to provide an omnidirectional 360° radio
wireless communication between moving vehicles. DSRC refers to 802.11p, which is an
improvement of IEEE 802.11a. The reliability of the DSRC, shall be denoted by𝑅𝐷𝑆𝑅𝐶 .

Chapter 4: A Fault Tree analysis for the reliability CAV
91
Antenna: used with a transmitter or a receiver in order to achieve the dedicated range of
wireless networks. The reliability of the antenna shall be denoted by 𝑅𝐴𝑛𝑡 .
HMI: an electronic display screen that is used for driver assistance in collision avoidance
applications. HMI shows awareness messages such as: indications, warnings, and advices
using different ways of interaction like visual (flashing light, image) and auditory (sound,
alarm). The reliability of the HMI, shall be denoted by 𝑅𝐻𝑀𝐼.
Vehicle services: interacts directly with the body chassis systems of the car doing a tactile
and kinesthetic functions such as the vibrations of the driver’s chair or the steering wheel.
The reliability of the vehicle services shall be denoted by 𝑅𝑉𝑠.
4.2.1.2 Trusted Platform Module (TPM)
In CV, data is broadcasted over shared communication media: a malicious node may easily
intercept, modify or inject data [110]. Data injection can provoke collisions in a vehicular system.
Weak security leads to many traffic problems putting human lives at risk. In Vehicle-Based
Security System (VBSS), the OBU generates the BSM that collect vehicle and road conditions data.
These BSM should be certificated and signed in order to preserve privacy and enhance essential
security services, such as authentication, integrity, confidentiality and nonrepudiation.
A secured vehicle needs some hardware requirements, such as TPM that can be integrated into
the OBU; TPM is the hardware module that forms the security issues such as encryption/decryption,
hashing and digital signature. It is able to protect and store data and keys in shielded locations.
From hardware point of view, a TPM contains the below components:
Assembled controller: A TPM contains a controller bus, for the connection and coordination
among its memory and peripherals. The reliability of the controller shall be denoted
by 𝑅𝐶𝑜𝑛𝑡 .
NVRAM: Non-volatile random-access memory is used for permanent storage of the

Chapter 4: A Fault Tree analysis for the reliability CAV
92
startup configuration that is writeable. It is also used for permanent storage of hardware
revision, identification information and the cryptographic keys. The reliability of the
memory shall be denoted by 𝑅𝑀𝑒𝑚
Crypto unit: as its name indicates, it is responsible for random number generation, public-
key cryptographic algorithm, cryptographic hash functions, symmetric-key algorithms,
digital signature generation and verification, and Elliptic Curve Cryptography (ECC). The
reliability of the crypto unit shall be denoted by 𝑅𝐶𝑟𝑦𝑝
4.2.1.3 Road Side Unit (RSU)
RSU is installed at the roadside [111]. It includes communication hardware (e.g. Wi-Fi, UMTS,
ITS G5, etc.), and serves as a gateway between OBUs and the communications infrastructure. It
could provide location based services and Internet access for mobile devices to improve the
communication connectivity. The main functions of RSUs are as follows:
- Network coverage extension of the Ad Hoc network and communication medium between
OBUs and RSUs.
- Source of safety and awareness information like weather status.
- Prioritize management messages to and from the OBU.
- Gateways that allow vehicles to establish connection with the internet.
The RSU is connected to the V2I communications network. Prioritization of messages is also
managed by the RSU to and from the vehicle. Similar to OBU, an RSU is composed of a
communication transceiver (802.11& 1609), GPS and a processor. RSU contains a router that acts
as an interface to the V2I cloud network. RSU is also connected to a local safety processor that is
related to traffic light signal controller.
4.2.2 RBD
The reliability of OBUs, RSUs and TPMs are explored using RBDs. RBD for the OBU (Fig. 4-

Chapter 4: A Fault Tree analysis for the reliability CAV
93
1) shows a graphical representation consisting of blocks representing system components and the
connection between these components. The system is functional, if at least one path of properly
functional components from input to output exists; otherwise, it fails [110].
An RBD construction can follow two main basic patterns of component connections:
1- Series connection: With a series design, the system will fail if any component fails.
Therefore, in the series connection all the components should be functional for the system
to be remain functional. Assuming that the components are independent, the reliability of
the series design can express as:
𝑅𝑆𝑒𝑟𝑖𝑒𝑠 = 𝑅1 𝑅2 … 𝑅𝑛
Simply by multiplying the probabilities. Since each reliability value is less than one, we may
conclude that a series design is less reliable than its least reliable component.
2- Active redundancy or standby redundancy (parallel): The components in active
redundancy, might be connected in a parallel design, the system will work as long as any
component works. Therefore, the reliability of the parallel design can express as
𝑅𝑝𝑎𝑟𝑎𝑙𝑙𝑒𝑙 = 1 − (1 − 𝑅1 ) (1 − 𝑅2 ) … (1 − 𝑅𝑛)
All the subcomponents of OBU are designed in series way, excluding the HMI and the vehicular
services that are designed in parallel, thus the reliability of an OBU, represented by ROBU, is given
below:
𝑅𝑂𝐵𝑈 = 𝑅𝐴𝑛𝑡 𝑅𝐷𝑆𝑅𝐶 𝑅𝐺𝑃𝑆 𝑅𝑃𝑆𝑅𝑅𝐶𝑃[(𝑅𝐻𝑀𝐼 + 𝑅𝑉𝐶) − 𝑅𝐻𝑀𝐼𝑅𝑉𝐶 ]𝑅𝑇𝑃𝑀 (4.1)
Where the reliability of the TPM is set below:
𝑅𝑇𝑃𝑀 = 𝑅𝐶𝑟𝑦𝑝 𝑅𝑀𝑒𝑚 𝑅𝐶𝑜𝑛𝑡 (4.2)

Chapter 4: A Fault Tree analysis for the reliability CAV
94
The RBD of RSU will be as show in Fig. 4-2
Consequently, the reliability of an RSU, represented by RRSU, is given by:
𝑅𝑅𝑆𝑈 = 𝑅𝐴𝑛𝑡 𝑅𝐷𝑆𝑅𝐶 𝑅𝐺𝑃𝑆 𝑅𝑃𝑆 𝑅𝑃𝑟𝑜𝑐𝑒𝑠𝑠 𝑅𝑆𝑇𝐿 (4.3)
Many quantitative data are needed in order to achieve this analysis; hence the necessity that the
data should be accurately targeted. QAD contains data fields of failure rates on a variety of
electrical, mechanical, electromechanical, and microwave parts and assemblies. It is used as a
source of reliability failure rate data. Data contained in EPRD reflects industry average failure rates,
especially the summary failure rates that were derived by combining several failure rates on similar
parts/assemblies from various sources. At t = 0, the population of parts has not experienced
operation. As operating time increases, parts in the original population are replaced and the failure
rate increases.
Probability of events is modeled from component failure rates. These are defined by the average
of failure rate (Failure rate Mean (λMean)), (Failure rate Lower (λMin)), Failure Rate Upper (λMax)),
and by standard deviation of failure rate (Failure rate SD (λSD)).
The component failures of the system follow an exponential distribution on a total duration of
Figure 4-2 Reliability block diagram for RSU
Figure 4-1 Reliability block diagram for OBU including the TPM
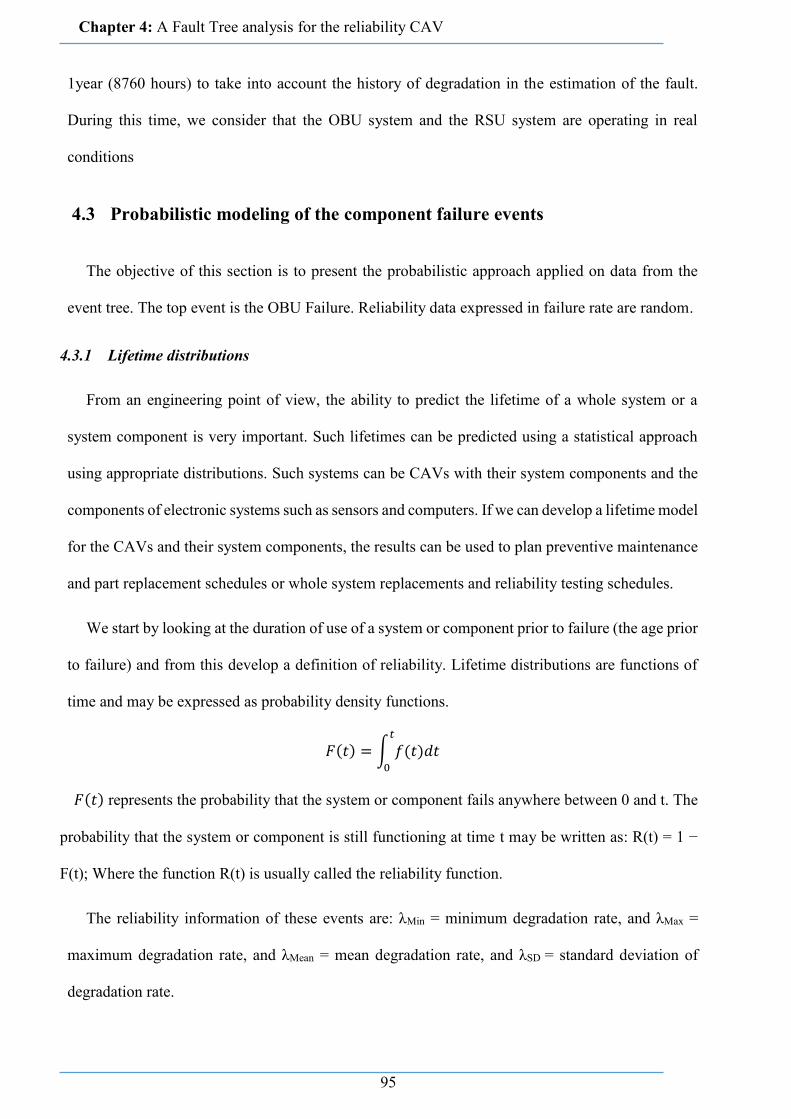
Chapter 4: A Fault Tree analysis for the reliability CAV
95
1year (8760 hours) to take into account the history of degradation in the estimation of the fault.
During this time, we consider that the OBU system and the RSU system are operating in real
conditions
4.3 Probabilistic modeling of the component failure events
The objective of this section is to present the probabilistic approach applied on data from the
event tree. The top event is the OBU Failure. Reliability data expressed in failure rate are random.
4.3.1 Lifetime distributions
From an engineering point of view, the ability to predict the lifetime of a whole system or a
system component is very important. Such lifetimes can be predicted using a statistical approach
using appropriate distributions. Such systems can be CAVs with their system components and the
components of electronic systems such as sensors and computers. If we can develop a lifetime model
for the CAVs and their system components, the results can be used to plan preventive maintenance
and part replacement schedules or whole system replacements and reliability testing schedules.
We start by looking at the duration of use of a system or component prior to failure (the age prior
to failure) and from this develop a definition of reliability. Lifetime distributions are functions of
time and may be expressed as probability density functions.
𝐹(𝑡) = ∫ 𝑓(𝑡)𝑑𝑡𝑡
0
𝐹(𝑡) represents the probability that the system or component fails anywhere between 0 and t. The
probability that the system or component is still functioning at time t may be written as: R(t) = 1 −
F(t); Where the function R(t) is usually called the reliability function.
The reliability information of these events are: λMin = minimum degradation rate, and λMax =
maximum degradation rate, and λMean = mean degradation rate, and λSD = standard deviation of
degradation rate.

Chapter 4: A Fault Tree analysis for the reliability CAV
96
4.3.2 The exponential distribution
CAVs are classified as “safety critical” because they are directly related to human safety. For this
reason, in this paper we used the exponential model, which is very conservative. Moreover the
exponential model is the widely used for electronics components such as in the OBU and the
sensors; even if it is a pessimistic scenario. The exponential distribution describing failure, met the
form:
𝑓(𝑡) = 𝜆𝑒−𝜆𝑡 , 𝑡 ≥ 0
𝑓(𝑡) = 1
𝜇𝑒−𝑡
𝜇⁄ , 𝑡 ≥ 0
Where 𝜆 the failure rate and μ is is the mean time to failure.
Exponential distributions, with failure rate 𝜆 and time-to-failure random variable, are used in order
to express the reliability or availability of these individual components of the OBU. The
dependability of each component is then used in order to determine the reliability of the overall
VANET system by utilizing mathematical expressions that are presented in eq.4.1. The failure λ
rate is considered as a random variable, which is defined between two limits. Its mean and standard
deviation are known.
4.3.3 Reliability of OBU and RSU
Table 4-1 depicts the failure events data for all the components of the OBU, obtained from a
professional database called Quanterion Automated Databook (QAD) that uses Electronic Parts
Reliability Data (EPRD). The power supply (E008) has the greater failure rate, and has a significant
influence on the reliability of the OBU, since the power supply is implemented in series in the RBD,
which means definitely, when the power supply of OBU fails the whole system will fail. As an
improvement, we suggest to use a dual power supplies in the OBU.

Chapter 4: A Fault Tree analysis for the reliability CAV
97
Table 4-1 Failure events data
Basic event Label λMin λMax λMean λSD
HMI E005 1.4E-06 1.8E-06 1.6E-06 1.8E-07
Vehicular services E006 4.2E-07 2.3E-06 1.2E-06 8.08E-07
RCP E007 2.8E-06 3.7E-06 3.3E-06 3.7E-07
Power Supply E008 4.7E-06 9.1E-06 6.3E-06 2.01E-06
GPS E009 1.4E-06 1.8E-06 1.6E-06 1.8E-07
DSRC E010 1.05E-06 1.2E-06 1.1E-06 8.18E-08
Antenna E011 4.8E-07 6.2E-07 5.5E-07 6.18E-08
Crypto Unit E012 2.8E-06 3.7E-06 3.3E-06 3.7E-07
Memory E013 4.6E-07 2.5E-06 1.1E-06 9.04E-07
Controller E014 1.2E-06 3.3E-06 2.1E-06 9.6E-07
The redundant power supply, shown in Fig. 4-3, might be connected in parallel. After the
redesigned RBD for the OBU, we noticed an improvement in reliability between the OBU having
a single power supply and the redesigned OBU having dual power supplies.
Figure 4-3 RBD for OBU2 using dual Power supply
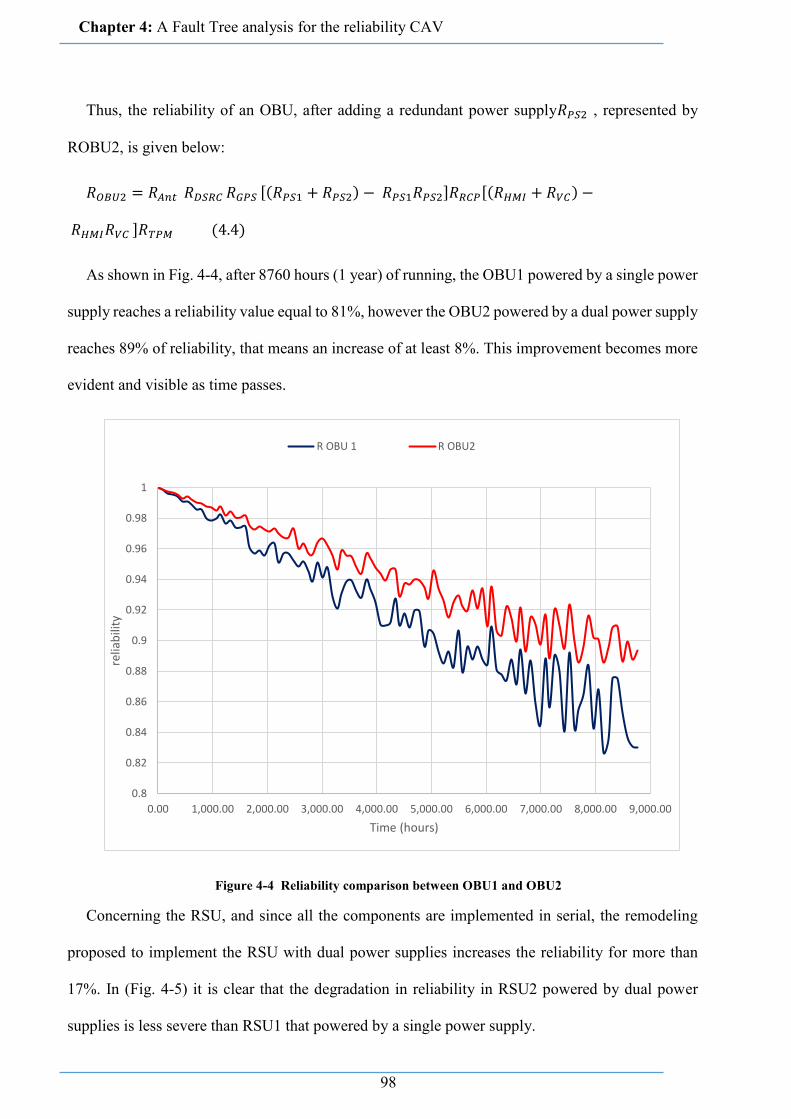
Chapter 4: A Fault Tree analysis for the reliability CAV
98
Thus, the reliability of an OBU, after adding a redundant power supply𝑅𝑃𝑆2 , represented by
ROBU2, is given below:
𝑅𝑂𝐵𝑈2 = 𝑅𝐴𝑛𝑡 𝑅𝐷𝑆𝑅𝐶 𝑅𝐺𝑃𝑆 [(𝑅𝑃𝑆1 + 𝑅𝑃𝑆2) − 𝑅𝑃𝑆1𝑅𝑃𝑆2]𝑅𝑅𝐶𝑃[(𝑅𝐻𝑀𝐼 + 𝑅𝑉𝐶) −
𝑅𝐻𝑀𝐼𝑅𝑉𝐶 ]𝑅𝑇𝑃𝑀 (4.4)
As shown in Fig. 4-4, after 8760 hours (1 year) of running, the OBU1 powered by a single power
supply reaches a reliability value equal to 81%, however the OBU2 powered by a dual power supply
reaches 89% of reliability, that means an increase of at least 8%. This improvement becomes more
evident and visible as time passes.
Figure 4-4 Reliability comparison between OBU1 and OBU2
Concerning the RSU, and since all the components are implemented in serial, the remodeling
proposed to implement the RSU with dual power supplies increases the reliability for more than
17%. In (Fig. 4-5) it is clear that the degradation in reliability in RSU2 powered by dual power
supplies is less severe than RSU1 that powered by a single power supply.
0.8
0.82
0.84
0.86
0.88
0.9
0.92
0.94
0.96
0.98
1
0.00 1,000.00 2,000.00 3,000.00 4,000.00 5,000.00 6,000.00 7,000.00 8,000.00 9,000.00
relia
bili
ty
Time (hours)
R OBU 1 R OBU2

Chapter 4: A Fault Tree analysis for the reliability CAV
99
Figure 4-5 Reliability comparison between RSU1 and RSU2
4.3.4 V2V Reliability
Communication in VANET is mainly between the CAVs. For a defined transmission range, the
reliability in V2V communication is evident if at least one connected car can communicate with one
or more cars. Therefore, within a transmission range V2V reliability is dependent upon the number
of OBUs working in this range. Let n the number of CAVs having OBUs operational within a
transmission range that can communication with our desired OBU. Supposing that all OBUs have
the same reliability.
𝑅𝑣2𝑣 = 𝑅𝑂𝐵𝑈 . [1 − (1 − 𝑅𝑂𝐵𝑈)𝑛] (4.5)
For the minimum scenario where n=1, only 1 CAV can communicate with our vehicle. However,
having more CAVs in the network will increase the reliability of V2V communication; we will
discuss the effect of density on the reliability in section 4.
𝑅𝑣2𝑣 = 𝑅𝑂𝐵𝑈 . 𝑅𝑂𝐵𝑈 (4.6)
0.65
0.7
0.75
0.8
0.85
0.9
0.95
1
0 1000 2000 3000 4000 5000 6000 7000 8000 9000
relia
bili
ty
Time(hours)
R RSU1 R RSU2

Chapter 4: A Fault Tree analysis for the reliability CAV
100
Figure 4-6 Reliability of V2V
The reliability V2V old represent the OBU1 powered by a single power, however the reliability
V2V new represent the OBU2 powered by a dual power.
A clear enhancement of 10% on the V2V reliability when we used the redesigned OU as showed
in Fig. 4-6
4.3.5 V2I Reliability
V2I communication could provide useful information about the infrastructure such as traffic light
information, road layout changes, and speed limits to CAVs [111]. For V2I communication, one or
more OBUs communicate through an RSU. Hence, the reliability of the RSUs is also a matter of
concern.
𝑅𝑣2𝐼 = 𝑅𝑅𝑆𝑈 . 𝑅𝑂𝐵𝑈 (4.6)
The reliability V2I old design represent the OBU and the RSU powered by a single power,
however the reliability V2I new design represent the OBU and RSU powered by a dual power.
0.6
0.65
0.7
0.75
0.8
0.85
0.9
0.95
1
0 1000 2000 3000 4000 5000 6000 7000 8000 9000
Rel
iab
ility
Time (hours)
Reliability V2V
Rv2V old Rv2v new

Chapter 4: A Fault Tree analysis for the reliability CAV
101
Evaluating the enhancement in reliability for V2I communications, is shown in Fig. 4-7
Figure 4-7 Reliability of V2I
4.3.6 V2X Reliability
In order for the CAVs to communicate with each other, V2V network or V2I network should
exist. For that, the V2X reliability can be written as the bellow:
𝑅𝑣2𝑋 = (𝑅𝑣2𝑣 + 𝑅𝑣2𝑖) − (𝑅𝑣2𝑣 . 𝑅𝑣2𝑖) (4.7)
There is a clear enhancement in the V2X reliability from 88% for the old design that represent
the OBU and the RSU powered by a single power, to 96% for the redesigned V2X that new design
represent the OBU and RSU powered by a dual power (Fig. 4-8).
0.5
0.55
0.6
0.65
0.7
0.75
0.8
0.85
0.9
0.95
1
0 1000 2000 3000 4000 5000 6000 7000 8000 9000
Rel
iab
ility
Time (hours)
V2I Reliability
Rv2i old Rv2i new

Chapter 4: A Fault Tree analysis for the reliability CAV
102
Figure 4-8 V2X Reliability
4.4 Fault tree for CAV
Fault Tree analysis is a graphical technique performed to know the probability of occurrence of
the top event; i.e., sensor failure can cause the whole system to fail. These causes of system failure
are represented in the form of a tree rooted by the top event as depicted in Fig. 4-9. Logic Boolean
gates are used to link two or more causes provoking one fault. The OR gate is presented when one
fault from any node is enough to cause a fault, OR gate used in series design. While the AND gate
is used when the fault (output) occurs when all inputs fail (inputs are independent), AND gate used
in parallel design.
0.82
0.84
0.86
0.88
0.9
0.92
0.94
0.96
0.98
1
0 1000 2000 3000 4000 5000 6000 7000 8000 9000
Rel
iab
ility
Time
V2X Reliability
Rv2x old Rv2x new

Chapter 4: A Fault Tree analysis for the reliability CAV
103
Figure 4-9 Standard Fault Tree Diagram
The failure of the CAV could be due to two main reasons: failures due to environment, or failures
due to of vehicular components (Fig. 4-10).
Figure 4-10 CAV Fault Tree

Chapter 4: A Fault Tree analysis for the reliability CAV
104
Concerning the crash due to environment and external factors such as mechanical vehicle
component’s failures, and weather; the National Motor Vehicle Crash Causation Survey
(NMVCCS), conducted from 2005 to 2007 a research which aimed at collecting on-scene
information about the events and associated factors leading up to crashes. Several facets of crash
occurrence were investigated during data collection. A weighted sample of 5,470 crashes was
investigated over a period of two and a half years, which represents an estimated 2,189,000 crashes
nationwide. About 4,031,000 vehicles, 3,945,000 drivers, and 1,982,000 passengers were estimated
to have been involved in these crashes. The critical reason, which is the last event in the crash causal
chain, was assigned to the driver in 94 percent (±2.2%) of the crashes. In about 2 percent (±0.7%)
of the crashes, the critical reason was assigned to a vehicle component’s failure or degradation, and
in 2 percent (±1.3%) of crashes, it was attributed to the environment (slick roads, weather, etc.)
[112]. Therefore, the external environment failures, which present less than 6% of crash, was
ignored. With this assumption, after a total penetration of CAVs that replace driver, 94% of crashes
can be avoided.
Autonomous vehicle components. In Chapter 3, the literature review presented automotive
features, which could convert a conventional vehicle into an autonomous vehicle. These automotive
features then led to the development of the necessary sensors and components of an autonomous
vehicle. All these sensors and components were categorized into three major subsystems: hardware,
software, and communication. The hardware system includes sensors and components, such as
LIDAR, radar, camera, GPS, and wheel encoders. The sensors in hardware system are utilized to
collect the surrounding information, whereas the software subsystem consists of the data processing
software required for autonomous navigation. The fault-tree model was developed (Fig. 4-11)
considering the failure of a CAV due to vehicular components. The failure of the whole system
could be due to the failure of one sensor. To ensure a reliable self-driving, and a safe transportation
system, the reliability analysis for each sensor is required.

Chapter 4: A Fault Tree analysis for the reliability CAV
105
Figure 4-11 FTA for sensors failures of CAV
Table 4-2 depicts the failure events data for all the sensors and the software.
Table 4-2: Failure events data for sensors and software
Failure Ratio Label min sup mean Standard Deviation
Radar E015 1.6E-06 2.0E-06 1.8E-06 1.8E-07
LIDAR E016 1.8E-06 2.0E-06 1.9E-06 7.2E-08
Camera E017 2.9E-06 3.5E-06 3.2E-06 2.4E-07
wheel encoder E018 4.4E-07 2.8E-06 1.3E-06 1.0E-06
Ultrasound
sensors E019 9.6E-07 1.2E-06 1.1E-06 1.2E-07
Software E20 9.3E-07 1.4E-06 1.1E-06 1.9E-07
Vehicle-to-vehicle (V2V) and vehicle to infrastructure (V2X) communication platforms are
included in the FT communication subsystem (Fig. 4-12).
Figure 4-12 FTA for communication failure of CAV

Chapter 4: A Fault Tree analysis for the reliability CAV
106
Usually the On-Board Unit (OBU) computers give the connect vehicle the ability to
communicate with other V2X. In Fig.4-13 we illustrate the subcomponent of the OBU using the
FT.
Figure 4-13 Fault Tree event of OBU in CAV
Fault tree mathematical formulation.
In the above FT (Fig. 4-13), the logical relationships are restricted to “OR” and “AND” gates.
An OR gate represents events that are mutually exclusive events, where one of the preceding events
could lead to the failure of the overall system. In “Set Theoretic” terms, this is equivalent to the
union of the basic and intermediate events. The probability of the OR gate output can be formulated
as follow:
𝑃(𝑋 𝑂𝑅 𝑌) = 𝑃(𝑋 ∪ 𝑌) = 𝑃(𝑋) + 𝑃(𝑌) − 𝑃(𝑋 ∩ 𝑌)
In our case and Since the components and sensors are independents, no intersection between
the component event failures, for that (𝑋 ∩ 𝑌) =0
On the other hand, an AND gate represents a combined failure of all events required to lead to a
whole system failure. This gate is related to the intersection of two sets in the “Set Theory.” The
mathematical formulation of AND gate is given below:
𝑃(𝑋 𝐴𝑁𝐷 𝑌) = 𝑃(𝑋 ∩ 𝑌) = 𝑃(𝑋) × 𝑃(𝑌)

Chapter 4: A Fault Tree analysis for the reliability CAV
107
Figure 4-14 Fault tree analysis for CAV

Chapter 4: A Fault Tree analysis for the reliability CAV
108
Calculation of probabilities:
𝑃(𝐸𝑅) = 𝑃(𝐸1) + 𝑃(𝐸2) (4.8)
𝑃(𝐸1) = 𝑃(𝐸3) + 𝑃(𝐴) (4.9)
𝑃(𝐸2) = 𝑃(𝐵) + 𝑃(𝐶) + 𝑃(𝐷) (4.10)
𝑃(𝐸3) = 𝑃(𝐸4) + 𝑃(𝐸5) (4.11)
𝑃(𝐸4) = 𝑃(𝐸) + 𝑃(𝐹) + 𝑃(𝐹1) + 𝑃(𝐺) + 𝑃(𝐻) (4.12)
𝑃(𝐸5) = 𝑃(𝐸6) ∗ 𝑃(𝐸7) (4.13)
𝑃(𝐸6) = 𝑃(𝐸8) + 𝑃(𝑌) (4.14)
𝑃(𝐸7) = 𝑃(𝐸12) + 𝑃(𝑍) (4.15)
𝑃(𝐸8) = 𝑃(𝐸9) + 𝑃(𝐸10) + 𝑃(𝐸11) (4.16)
𝑃(𝐸9) = 𝑃(𝑁) + 𝑃(𝑂) (4.17)
𝑃(𝐸10) = 𝑃(𝑃) + 𝑃(𝑄) + 𝑃(𝑅) + 𝑃(𝑆) + 𝑃(𝑇) (4.18)
𝑃(𝐸11) = 𝑃(𝑈) + 𝑃(𝑉) + 𝑃(𝑊) (4.19)
𝑃(𝐸12) = 𝑃(𝐼) + 𝑃(𝐽) + 𝑃(𝐾) + 𝑃(𝐿) + 𝑃(𝑀) (4.20)
Minimal cut sets
After the creation of our FT, minimal cut sets (MCSs) are usually obtained by performing
qualitative analysis. Each MCS could contain a single event or multiple events combined by logic
gates. The order of a minimal cut set defines the number of basic events that contribute to that
minimal cut set or to the system failure.
MCS provide important information about the vulnerabilities of a system. A cut set is a set of
components that can together cause the system to fail. Thus, if an FTA contains cut sets with just a
few elements, or elements whose failure is too likely, this could result in an unreliable system.
Reducing the failure probabilities of these cut sets is usually a good way to improve overall reliability.

Chapter 4: A Fault Tree analysis for the reliability CAV
109
Thanks to the complete FTA of CAV shown in Fig. 4-14, that illustrate all subcomponent of the
CAV, we can determine the most influential events and components of a planned failure, so we
will set up a nominal cut analysis as follows in (Fig. 4-15). This analysis method has the ability to
identify the shortest route (i.e., MCS) to failure of the top-level event. This mathematical method
was used to identify all combinations that are essentially the hierarchical sequence of events that
can result in the failure of the main event. The logical relationships between top level and basic
event are transformed using Boolean algebra, where all basic event failures are considered binary
in nature, i.e., either operational or failed.
Using the fault tree, we established the nominal cuts in order to determine which components
had to be corrected first. MCS cuts help to prioritize which components need to be addressed first
to improve the reliability and the safety performance of a CAV.
Figure 4-15 nominal cut analysis
In the diagram above, we did not show all the cuts to keep the scheme readable. We can carry
out the below orders:
- Order 1: 6 cuts of first order MCS that consist of a single basic event, which mean any failures
of one components in this 6 cuts lead directly to fail in the whole CAV. Therefore, this single

Chapter 4: A Fault Tree analysis for the reliability CAV
110
component becomes a candidate for upgrade or to replicate.
- Order 2: 54 cuts: which means two components of systems fails in this 54 cuts, lead to failure
of the vehicle.
- Order 3: 6 cuts: that mean 3 components of the systems fails in this 6 cuts of order 3, make
the CAV out of functions.
4.5 Improvement proposal for the fault tree
The autonomous function failures fall in two modes, recoverable failures and unrecoverable
failures. Recoverable failures are tolerable whenever, in due time masking or recovery is feasible
by other sensors. Unrecoverable failure is fatal whenever in due time, some function is lost, and no
other function can replace the lost function.
As noticed form the failure events data shown in Table 4-3, the power supply of the OBU has a
significant influence on the reliability of the communication system, since the power supply is
implemented in series, it lead to single point of failure. As an improvement, the first suggestion to
use a dual power supplies in the OBU.
In order to increase the reliability of CAVs, every autonomous function shall be implemented
out of diversified redundant sensors, data, and software capabilities, to avoid common cause
failures.
Any automation functions failure due to sensor failures may threaten the safety requirements
thus leading to crashes. In every safety-critical domain (e.g. in aircraft), the control system and
communication parts may be tripled or quadrupled [113]. The solution used in aircrafts could be
cloned into vehicles in order to provide distinct redundancy of hardware. Referencing aeronautics,
the design principles that have been used in that domain over the past years can be useful to CAVs.
We believe that the use of multi-sensor data fusion can limit the impact of sensors’ drawbacks
and exploit the advantages of each sensor through using the sensors complementarily and

Chapter 4: A Fault Tree analysis for the reliability CAV
111
redundantly. Combining these sensor technologies will reduce faults and improve the reliability and
the accuracy, and certainty provide the necessary redundancy for autonomous driving.
In this improvement, we doubled the camera. Indeed, we grouped a camera with the radar on the
one hand and a camera with the LIDAR on the other hand in order to have system vision 1
(combination between camera and radar) and a redundant system vision 2 (combination between
camera and Lidar) as shown in the tree of Fig. 4-16. This multisensory fusion is in fact a necessity
not only to increase the reliability of sensor and for the vision system, but also to carry out the
different tasks of perception for better detection and monitoring of obstacles. Increasing the
reliability of perception of CAVs will lead to making the right and safe decision by the vehicles.
Using more sensors and sources for sensor fusion provides the necessary diversity for
autonomous driving and definitely improves the reliability and the certainty to ensure safety without
increasing the cost.
Since we are planning for redundancy, we can replace the logical gate "or" by “and” in order to
decrease the probability of the head event. Hence, we can modify the fault tree as follows (Fig. 4-
17).
Figure 4-16 Redundant system vision by multisensory fusion

Chapter 4: A Fault Tree analysis for the reliability CAV
112
Figure 4-17 Improvement fault tree
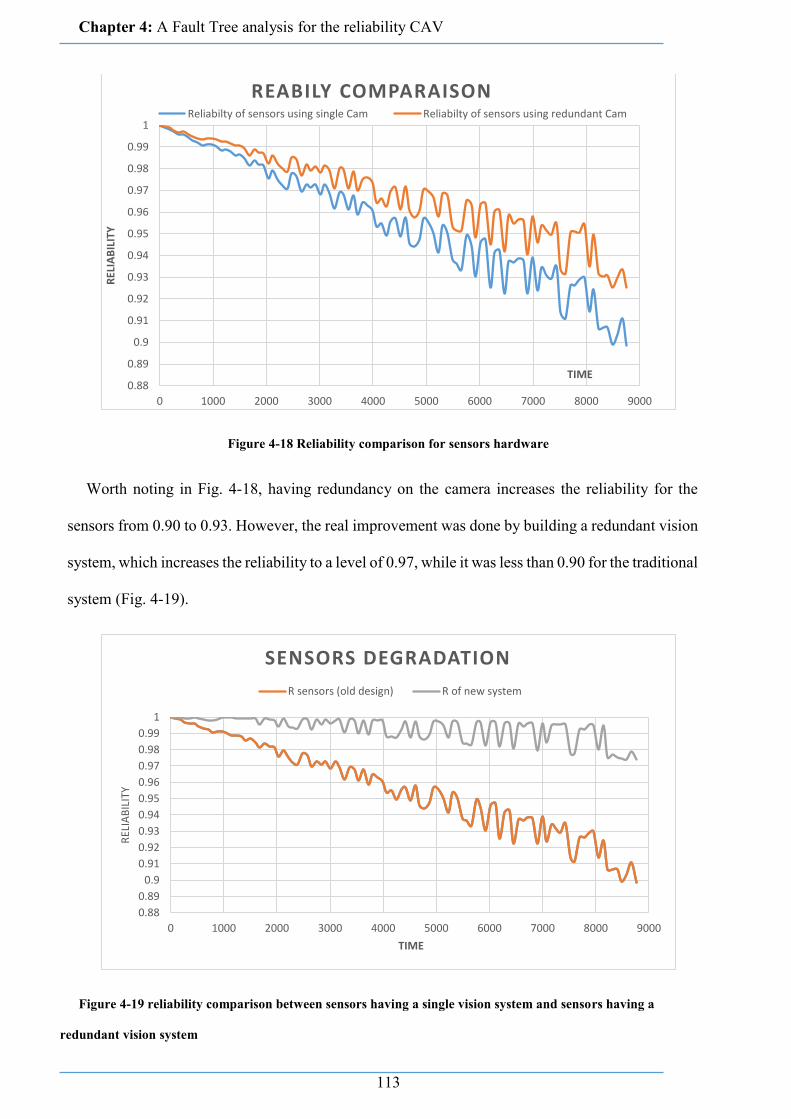
Chapter 4: A Fault Tree analysis for the reliability CAV
113
Figure 4-18 Reliability comparison for sensors hardware
Worth noting in Fig. 4-18, having redundancy on the camera increases the reliability for the
sensors from 0.90 to 0.93. However, the real improvement was done by building a redundant vision
system, which increases the reliability to a level of 0.97, while it was less than 0.90 for the traditional
system (Fig. 4-19).
Figure 4-19 reliability comparison between sensors having a single vision system and sensors having a
redundant vision system
0.88
0.89
0.9
0.91
0.92
0.93
0.94
0.95
0.96
0.97
0.98
0.99
1
0 1000 2000 3000 4000 5000 6000 7000 8000 9000
REL
IAB
ILIT
Y
TIME
REABILY COMPARAISONReliabilty of sensors using single Cam Reliabilty of sensors using redundant Cam
0.88
0.89
0.9
0.91
0.92
0.93
0.94
0.95
0.96
0.97
0.98
0.99
1
0 1000 2000 3000 4000 5000 6000 7000 8000 9000
REL
IAB
ILIT
Y
TIME
SENSORS DEGRADATION
R sensors (old design) R of new system

Chapter 4: A Fault Tree analysis for the reliability CAV
114
MCSs Improvement:
Now, as a result, we present the following nominal cut analysis for the improved FTA shown in
figures 4-17
Fig. 4-20 Nominal cut analysis improvement
In this diagram (Fig. 4-19), we can carry out 3 cuts with order 1, 55 cuts with order 2, 20 cuts in
order 3 and 2 cuts with order 4.
It is clear that the number of cuts with order 1 has decreased to 3 cuts. First, order MCS that consist
of a single basic event, i.e., a single failure event alone can cause failure CAV.
The number of cuts with order 2 and 3 has increased. In addition, the cuts with order 4 have
emerged. A fourth order MCS contains four basic events that should failed together, before that the
CAV fail. This result confirms the decrease of failure probability by increasing the number of
components in a path that leads to system failure.

Chapter 4: A Fault Tree analysis for the reliability CAV
115
Figure 4-21 Reliability comparison between old design CAV and enhanced design.
It is clear in Fig. 4-21, that we reached a reliability enhancement of 38% by redesigning the
system, therefore the reliability improvement is a cumulative process, enhancing the reliability for
many components such as the V2X communication and the system vision will directly affect the
reliability of the whole system.
4.6 Conclusion for the fault tree
The failure of a sensor can occur at any time; in addition, as analyzed by the FMECA, all sensors
have limitations that make them unusable under certain conditions: bad weather, masking, high
noise ratio, reduced range, bias, inaccuracies, etc…
Following FMECA done in chapter 3, the reliability of the CAV system is analyzed via FTA and
the vehicles reliability is evaluated using the exponential probabilistic method. By performing the
analysis, the acceptability of failure can be analyzed, and hence the service capability and potential
critical failure of the CAV system can be reviewed.
0.5
0.55
0.6
0.65
0.7
0.75
0.8
0.85
0.9
0.95
1
0 1000 2000 3000 4000 5000 6000 7000 8000 9000
Rel
iab
ilty
Time (hours)
CAV relaibilty Comparasion
CAV reliabilty before enhancement CAV reliabilty after enhancement

Chapter 4: A Fault Tree analysis for the reliability CAV
116
After constructing our fault tree model for the CAV, both qualitative and quantitative analysis
are carried out. A qualitative analysis in this context allows the identification of all combinations of
basic failure events, known as cut sets, which can cause the top event to occur. The MCSs are those
cut sets that do not contain any subset of the basic cause events that are still a cut set and are obtained
by applying boolean algebraic operations on these cut sets. The smaller the number of basic cause
events in these cut set, the modeled system is considered more resilient to failures. The results show
that the redesigned FTA lead to an effective cut analysis improvement.
The quantitative analysis is used to evaluate the probability of occurrence of top event by
considering these minimal cut sets, which significantly contribute to the system failures.
In this chapter, we demonstrated the importance of reliability analysis using mixed approach
between qualitative and quantitative methods. As a result, we detected that the reliability of a
communication system having a single point of failure such as the OBU system with serial
subcomponents - will immensely degrade with time. Using a very pessimistic exponential model
resulted in the degradation of the OBU‘s reliability by 16% over a short period of one year – the
failure rates of the OBU electronic components were in the range of E-07 to E-06.
However, a tradeoff between the disadvantages of redundancy (cost, weight, power saving and
design complexity...) and increasing the reliability, should always be considered. Moreover, one of
the most important advantages of vehicular networks is that there are no energy constraints, unlike
wireless sensor networks and other types of mobile devices used in MANETs where limited battery
life is a major concern. Taking into consideration this feature, we can implement the redundancy
components for the CAV without worrying about energy consumption.
Concerning the vision system, LIDAR, for example, is great at capturing information in various
types of ambient light (whether night or day), whereas cameras have difficulty in handling certain
occlusions caused by shadows or other poor lighting conditions. The combination of these two
sensors can be a complementary to each other, and give a system vision that can overcome the weak
point of each sensor working alone.

Chapter 4: A Fault Tree analysis for the reliability CAV
117
In order to increase the reliability of CAVs, every autonomous function shall be implemented
out of diversified redundant sensors, data, and software capabilities, to avoid common cause
failures.
Despite the fact that combining data provided by different sensors to obtain relevant global
information creates more complexity in system perception and increases the cost; the results show
that using multi-sensors fusion, is an efficient way of addressing sensor problems and failures. This
way can increase the reliability of the whole CAV system.
Chapter 5: Reliability and Connectivity Analysis for BSM in CAV
118
CHAPTER 5 - RELIABILITY AND CONNECTIVITY ANALYSIS FOR BSM IN CAV .................118
5.1 INTRODUCTION .............................................................................................................................. 118
5.2 RELIABILITY OF CONNECTED VEHICLES .................................................................................................... 119
5.2.1 Experimental results ............................................................................................................... 121
5.2.1.1 Reliability CAV connectivity against transmission range .............................................................. 121
5.2.1.2 Reliability CAV connectivity against Density ................................................................................ 123
5.2.1.3 Reliability for CAV connectivity against safety headway distance ............................................... 125
5.3 COMMUNICATION RELIABILITY ..................................................................................................... 126
5.3.1 BSM Fundamentals ................................................................................................................. 127
5.3.2 The Analytic Approach ............................................................................................................ 127
5.4 RELIABILITY OF BSM IN VANET ...................................................................................................... 129
5.5 RELIABILITY OF SAFETY APPLICATIONS IN DSRC ............................................................................. 133
5.6 ANALYTIC VALIDATION FOR THE NUMBER OF RETRANSMISSIONS ................................................. 135
5.7 CONCLUSION ................................................................................................................................. 140
Chapter 5 - Reliability and Connectivity Analysis for BSM in CAV
Chapter 5: Reliability and Connectivity Analysis for BSM in CAV
119
5.1 Introduction
Connected Vehicle research has emerged as one of the highest priorities in the
transportation systems because connected vehicle technology has the potential to improve
safety, mobility, and environment for the current transportation systems.
The 5.9 GHz DSRC is considered for wireless connectivity by the majority of the
international automakers [114]. DSRC-enabled Vehicle-to-Vehicle (V2V) communication
through broadcast of BSMs enables safety applications for crash warning and avoidance.
The wireless communication coverage is one of the major factors for event-driven
applications due to its impact on the distance of information propagation. In this chapter, we
present connected vehicle environment in order to assess the reliability of V2V
communication applications by proposing an analytical approach to evaluate reliability of
IEEE 802.11p-based vehicle-to-vehicle (V2V) safety-related broadcast services in DSRC
system on the highway.
Some researches study the influence of 1 or 2 parameters on connectivity, such as the
vehicle density [115], equipment reliability [52] or the transmission range [116]. Our proposed
model takes into account many factors that have an influence in VANET communication
environments such as transmission range, vehicle density, safety headway distance on the
highway, packet estimation error, noise influence and failure rates of DSRC hardware
equipment.
5.2 Reliability of connected vehicles
Connected vehicles use the network to travel from their departure points to their
destinations. By definition, a street is a linear traffic area connecting two separate points with
a fixed length. Moreover, a street can be separated into many lanes depending on the direction
of vehicles.

Chapter 5: Reliability and Connectivity Analysis for BSM in CAV
120
For example, the street in Fig. 5-1 is split into two lanes corresponding to two opposite
directions.
Figure 5-1 Street with two lanes
In these lanes, the average number of vehicles is given by the following equation:
𝑁𝐿 = 𝐿𝜈 (5.1)
Where 𝐿(𝑚) is the length of the lane and 𝜈(𝑣𝑒ℎ/𝑚) is the vehicle density.
It is well known that two vehicles can be considered connected if the transmission range is
greater than the distance between them. Mathematically, it means that
𝑥𝑖 ≤ 𝑅𝑡𝑟𝑎𝑛 (5.2)
Where 𝑥𝑖 is the distance between two vehicles and 𝑅𝑡𝑟𝑎𝑛 is the transmission range.
Now, according to literature in [117], [118], the reliability 𝑅𝑣2𝑣 of two connected vehicles
can be presented as exponentially distributed:
𝑅𝑣2𝑣 = 1 − 𝑒−𝜈𝑅𝑡𝑟𝑎𝑛 (5.3)
In order to guarantee the safety between vehicles, we consider a minimal headway distance
(𝐻𝑠) amongst vehicle. Then, the reliability becomes:
𝑅𝑣2𝑣 = 1 − 𝑒−𝜈(𝑅𝑡𝑟𝑎𝑛−𝐻𝑠) (5.4)
It follows that the reliability of a network is given by:
𝑅𝑁 = ∏ 𝑅(𝑣2𝑣)𝑖= (𝑅𝑣2𝑣)(𝑁𝐿−1)𝑁𝐿−1
𝑖=1 (5.5)
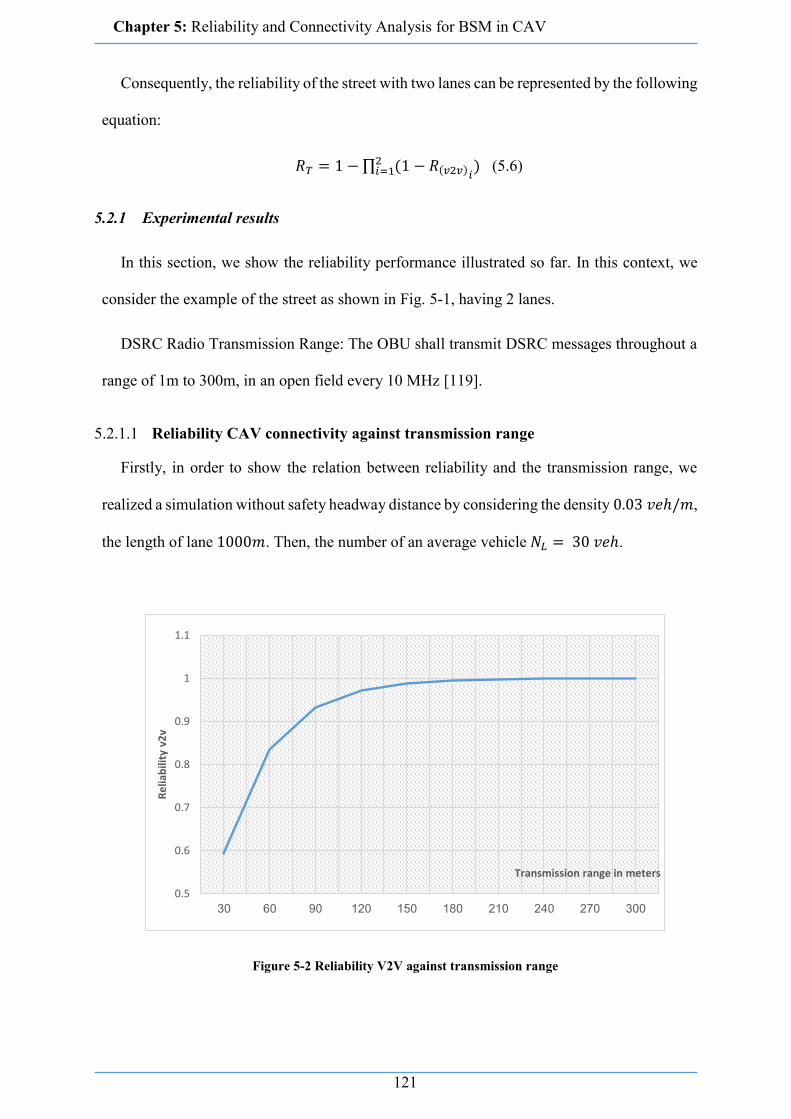
Chapter 5: Reliability and Connectivity Analysis for BSM in CAV
121
Consequently, the reliability of the street with two lanes can be represented by the following
equation:
𝑅𝑇 = 1 − ∏ (1 − 𝑅(𝑣2𝑣)𝑖)2
𝑖=1 (5.6)
5.2.1 Experimental results
In this section, we show the reliability performance illustrated so far. In this context, we
consider the example of the street as shown in Fig. 5-1, having 2 lanes.
DSRC Radio Transmission Range: The OBU shall transmit DSRC messages throughout a
range of 1m to 300m, in an open field every 10 MHz [119].
5.2.1.1 Reliability CAV connectivity against transmission range
Firstly, in order to show the relation between reliability and the transmission range, we
realized a simulation without safety headway distance by considering the density 0.03 𝑣𝑒ℎ/𝑚,
the length of lane 1000𝑚. Then, the number of an average vehicle 𝑁𝐿 = 30 𝑣𝑒ℎ.
Figure 5-2 Reliability V2V against transmission range
0.5
0.6
0.7
0.8
0.9
1
1.1
30 60 90 120 150 180 210 240 270 300
Re
liab
ility
v2
v
Transmission range in meters

Chapter 5: Reliability and Connectivity Analysis for BSM in CAV
122
Figure 5-3 Reliability of Network against transmission range
Figure 5-4 Reliability of route against transmission range
One can immediately observe that the reliability increases when the transmission range
increases. However, for V2V, when a vehicle is at least connected with one other vehicle, the
acceptable rate of reliability (0.99) cannot be reached until the transmission range is greater
than 180 meters. (Fig. 5-2)
Concerning the network, and for a density of 30 vehicles per 1 km, the radio transceiver
system of the connected vehicle should have a transmission range of less than 270m, to assure
communication with all the vehicles on the network, with a reliability of 99%. (Fig. 5-3).
0
0.1
0.2
0.3
0.4
0.5
0.6
0.7
0.8
0.9
1
1.1
30 60 90 120 150 180 210 240 270 300
Re
liab
ility
RL
Transmission range in meters
0
0.1
0.2
0.3
0.4
0.5
0.6
0.7
0.8
0.9
1
1.1
30 60 90 120 150 180 210 240 270 300
Re
liab
ility
RT
Transmission range in meters
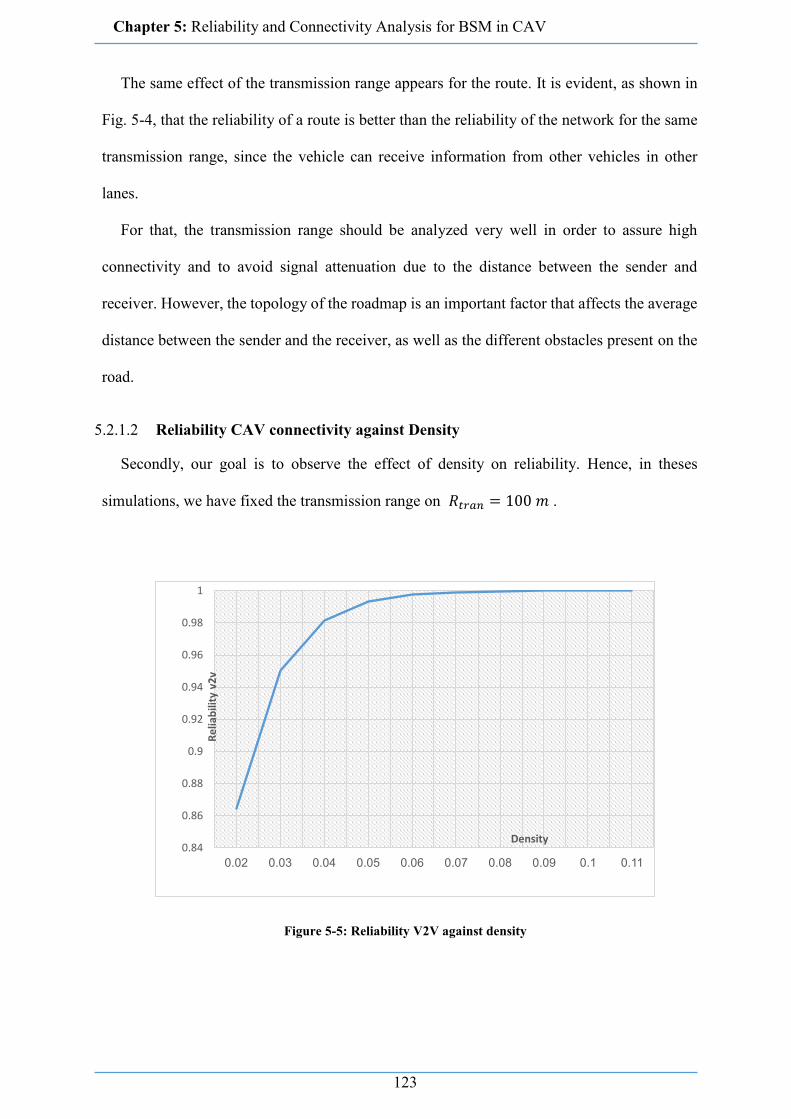
Chapter 5: Reliability and Connectivity Analysis for BSM in CAV
123
The same effect of the transmission range appears for the route. It is evident, as shown in
Fig. 5-4, that the reliability of a route is better than the reliability of the network for the same
transmission range, since the vehicle can receive information from other vehicles in other
lanes.
For that, the transmission range should be analyzed very well in order to assure high
connectivity and to avoid signal attenuation due to the distance between the sender and
receiver. However, the topology of the roadmap is an important factor that affects the average
distance between the sender and the receiver, as well as the different obstacles present on the
road.
5.2.1.2 Reliability CAV connectivity against Density
Secondly, our goal is to observe the effect of density on reliability. Hence, in theses
simulations, we have fixed the transmission range on 𝑅𝑡𝑟𝑎𝑛 = 100 𝑚 .
Figure 5-5: Reliability V2V against density
0.84
0.86
0.88
0.9
0.92
0.94
0.96
0.98
1
0.02 0.03 0.04 0.05 0.06 0.07 0.08 0.09 0.1 0.11
Re
liab
ility
v2
v
Density

Chapter 5: Reliability and Connectivity Analysis for BSM in CAV
124
Figure 5-6: Reliability of Network against density
Figure 5-7 Reliability of route against density
Fig.s 5-5, 5-6, 5-7 display the changes in reliability against density. We see that reliability
improves with the increase of density, since many CAVs can communicate.
For that in order to achieve a 99% reliable connectivity between two vehicles with a
transmission range of 100m, a density of 0.05 v/m (50 vehicles in the lane of 1 km) should be
presented on the highway. However, at night the density decreases and may reach a level less
than 0.05 v/m. (Fig. 5-5)
0.84
0.86
0.88
0.9
0.92
0.94
0.96
0.98
1
0.02 0.03 0.04 0.05 0.06 0.07 0.08 0.09 0.1 0.11
Re
liab
ility
RL
Density
0.97
0.975
0.98
0.985
0.99
0.995
1
1.005
0.02 0.03 0.04 0.05 0.06 0.07 0.08 0.09 0.1 0.11
Re
liab
ility
RT
Density
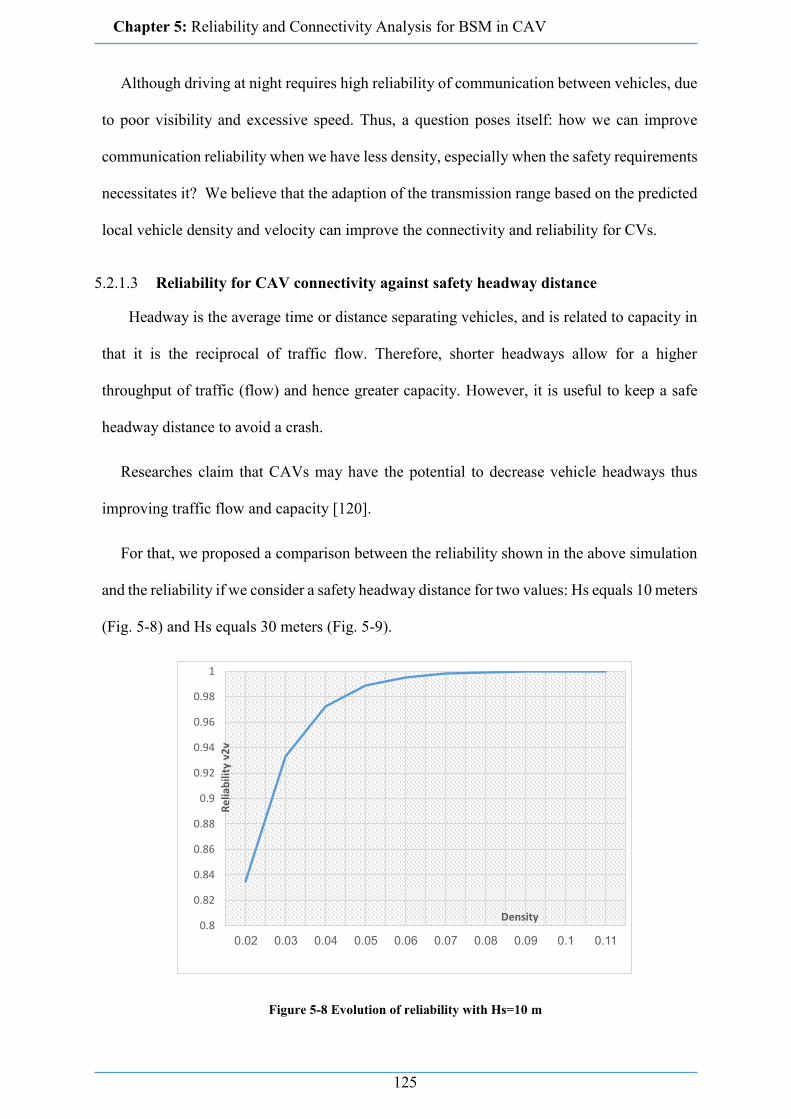
Chapter 5: Reliability and Connectivity Analysis for BSM in CAV
125
Although driving at night requires high reliability of communication between vehicles, due
to poor visibility and excessive speed. Thus, a question poses itself: how we can improve
communication reliability when we have less density, especially when the safety requirements
necessitates it? We believe that the adaption of the transmission range based on the predicted
local vehicle density and velocity can improve the connectivity and reliability for CVs.
5.2.1.3 Reliability for CAV connectivity against safety headway distance
Headway is the average time or distance separating vehicles, and is related to capacity in
that it is the reciprocal of traffic flow. Therefore, shorter headways allow for a higher
throughput of traffic (flow) and hence greater capacity. However, it is useful to keep a safe
headway distance to avoid a crash.
Researches claim that CAVs may have the potential to decrease vehicle headways thus
improving traffic flow and capacity [120].
For that, we proposed a comparison between the reliability shown in the above simulation
and the reliability if we consider a safety headway distance for two values: Hs equals 10 meters
(Fig. 5-8) and Hs equals 30 meters (Fig. 5-9).
Figure 5-8 Evolution of reliability with Hs=10 m
0.8
0.82
0.84
0.86
0.88
0.9
0.92
0.94
0.96
0.98
1
0.02 0.03 0.04 0.05 0.06 0.07 0.08 0.09 0.1 0.11
Re
liab
ility
v2
v
Density
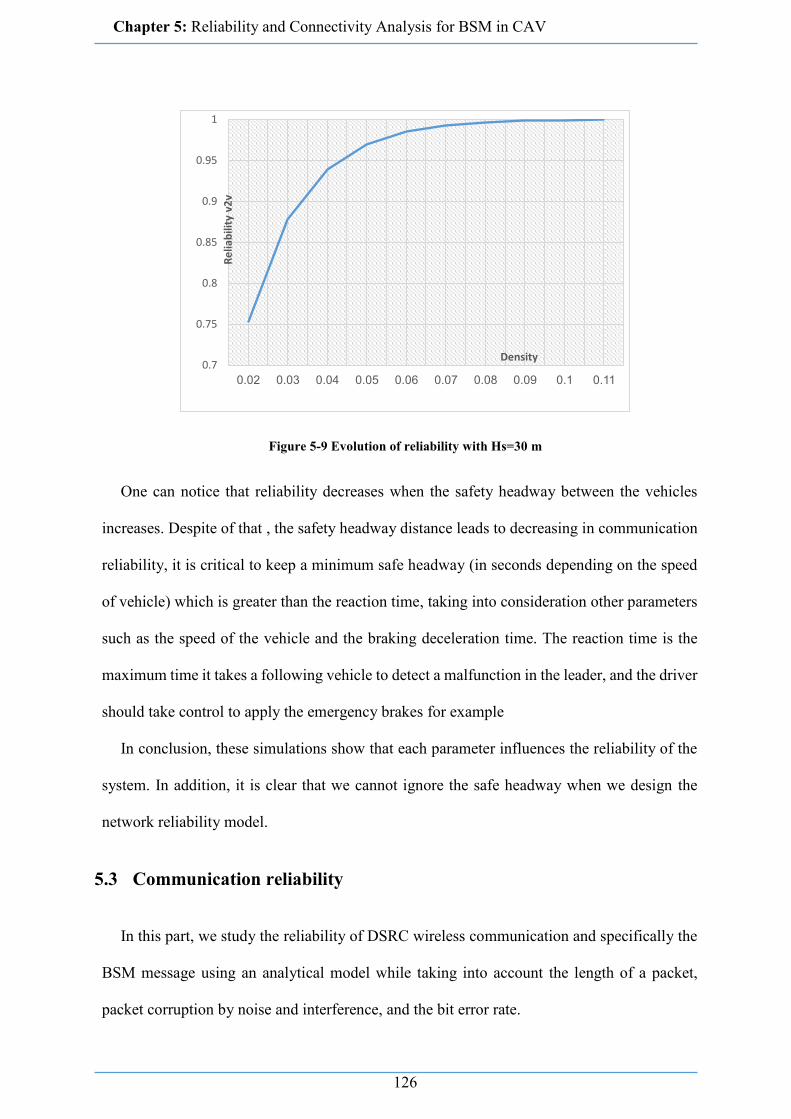
Chapter 5: Reliability and Connectivity Analysis for BSM in CAV
126
Figure 5-9 Evolution of reliability with Hs=30 m
One can notice that reliability decreases when the safety headway between the vehicles
increases. Despite of that , the safety headway distance leads to decreasing in communication
reliability, it is critical to keep a minimum safe headway (in seconds depending on the speed
of vehicle) which is greater than the reaction time, taking into consideration other parameters
such as the speed of the vehicle and the braking deceleration time. The reaction time is the
maximum time it takes a following vehicle to detect a malfunction in the leader, and the driver
should take control to apply the emergency brakes for example
In conclusion, these simulations show that each parameter influences the reliability of the
system. In addition, it is clear that we cannot ignore the safe headway when we design the
network reliability model.
5.3 Communication reliability
In this part, we study the reliability of DSRC wireless communication and specifically the
BSM message using an analytical model while taking into account the length of a packet,
packet corruption by noise and interference, and the bit error rate.
0.7
0.75
0.8
0.85
0.9
0.95
1
0.02 0.03 0.04 0.05 0.06 0.07 0.08 0.09 0.1 0.11
Re
liab
ility
v2
v
Density
Chapter 5: Reliability and Connectivity Analysis for BSM in CAV
127
5.3.1 BSM Fundamentals
Vehicles can exchange information to support safety applications, such as emergency
brake, cooperative collision avoidance, and automatic notification of crashes on the road. In
addition to non-safety applications, such as infotainment, Internet access, video streaming, etc.
[18].
The IEEE 802.11 working group proposed a family of standards for vehicular networks
called WAVE (Wireless Access in the Vehicular Environment). WAVE is composed of two
categories of standards: (i) 802.11p for the physical and medium access control layers and (ii)
IEEE 1609 for security, network management as well as other aspects of VANETs [121].
802.11p supports Intelligent Transportation Systems (ITS) applications such as cooperative
safety, traffic and accident control, intersection collision avoidance, and emergency warning.
During the CCH interval, nodes transmit safety-related messages and control messages.
The Enhanced Distributed Channel Access (EDCA) mechanism classifies the safety messages
into four Access Categories (ACs) with different priorities based on the degree of emergency
and according to their criticality for the vehicle’s safety. Non-safety massages are transmitted
during the SCH interval [122].
In DSRC protocol, OBU generates BSM messages that collect vehicle and road condition
data and provides them to the other OBU. BSM has two parts [123]:
Part 1: Contains core data elements, (vehicle size such as width and length, position, speed,
heading acceleration, brake system status, temporary ID, UTC time) and its default
transmission rate equals 10 Hz.
Part 2: Contains vehicle safety extensions and is dependent on events (e.g., ABS activated,
exterior lights, etc.).
5.3.2 The Analytic Approach
In this part, we study the reliability of DSRC wireless communication and specifically the
Chapter 5: Reliability and Connectivity Analysis for BSM in CAV
128
BSM message, and then we try to clarify the difference between BSM packet reliability and
safety application reliability.
In DSRC, each safety message is usually very short and thus usually mapped to a single
packet. DSRC systems should have high reliability and low delay so that all BSMs are well-
received [124].
V2V communication allows vehicles to share data, such as vehicle state, positioning, or
intention to change lanes, with other vehicles [125]. This type of communication suffers from
channel fading in DSRC, caused by multiple reflecting objects that lead to degrade the strength
and quality of the received signal. However, the Doppler Effect has a significant negative
influence due to high mobility, and since Orthogonal Frequency Division Multiplex (OFDM)
is used in DSCR, thus the Bit Error Rate (BER) becomes higher [27].
Connected vehicles operating in the DSRC band could cause significant interference to
BSM packet reception, leading to unknown and perhaps high Inter-Packet Gap (IPG) and
Packet Error Rate (PER). The channel fading is calculated by simply introducing packet error
probability [126].
𝑝𝑒 = 1 − (1 − 𝑝𝑏𝑒𝑟)𝑚 (5.7)
Where m is the length of the packet, and 𝑝𝑏𝑒𝑟 is the fixed BER probability. 𝑝𝑏𝑒𝑟 can be
numerically evaluated for a Rician fading channel [127] .
Mobility of nodes is one of the most important factors that can cause packet errors. BSM
packet size is usually between (85~365 bytes) [128]. Capture effect and propagation problems
are not considered in this calculation.
For 𝑝𝑏𝑒𝑟 = 10−4 and m is the size of BSM message we calculate the probability for the
packet that will be received 𝑝𝑟 correctly.

Chapter 5: Reliability and Connectivity Analysis for BSM in CAV
129
𝑃𝑟 = (1 − 𝑝𝑏𝑒𝑟)𝑚 (5.8)
Figure 5-10 probability of received packet against BSM length
As shown in Fig. 5-10, for BSM packet of maximum length 365 Bytes, the probability of a
correctly received packet is less than 0.75, which is considered low for critical applications. A
solution is needed to increase this probability.
5.4 Reliability of BSM in VANET
Reliability of VANET is a matter of contention since real time communication is involved
in this type of adhoc environment, which is time sensitive. In VANET, in order to ensure the
communication of V2V, the OBU should be available. Besides the hardware, reliability of
connection is also dependent upon transmission range, density, and packet loss by noise.
Hence, in this section, we explore the reliability of connection as a function of the transmission
range reliability, packet loss and hardware availability of OBU and RSU.
As discussed in the previous chapter, the time to failure of the components of an OBU are
assumed to follow an exponential distribution. The failure rate gathered from Quanterion
Automated Databook (QAD) for each component is mentioned in Table 5.1.
Over a period of 8760 hours (1 year) of running and after the improvements discussed in
the previous chapter, the OBU powered by a dual power supply reaches 89% of reliability.
0.7
0.75
0.8
0.85
0.9
0.95
1
0 50 100 150 200 250 300 350 400
pro
bab
ility
of
rece
ive
d p
acke
t
BSM length
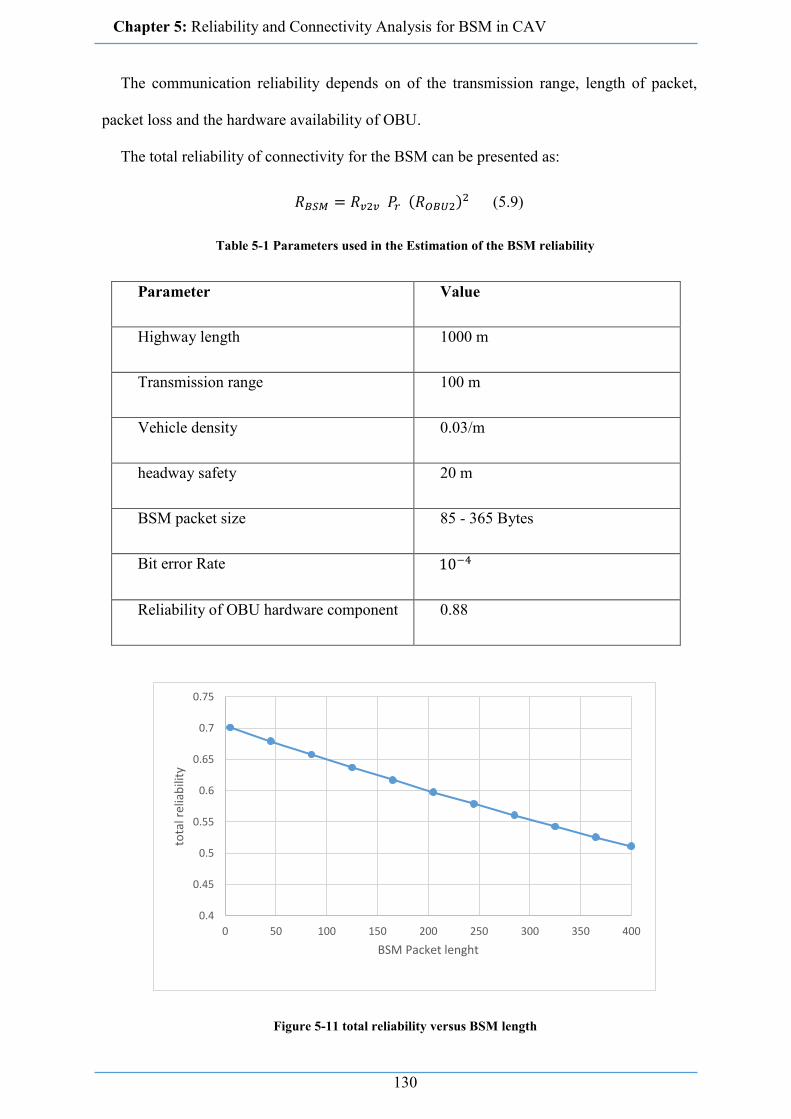
Chapter 5: Reliability and Connectivity Analysis for BSM in CAV
130
The communication reliability depends on of the transmission range, length of packet,
packet loss and the hardware availability of OBU.
The total reliability of connectivity for the BSM can be presented as:
𝑅𝐵𝑆𝑀 = 𝑅𝑣2𝑣 𝑃𝑟 (𝑅𝑂𝐵𝑈2)2 (5.9)
Table 5-1 Parameters used in the Estimation of the BSM reliability
Parameter Value
Highway length 1000 m
Transmission range 100 m
Vehicle density 0.03/m
headway safety 20 m
BSM packet size 85 - 365 Bytes
Bit error Rate 10−4
Reliability of OBU hardware component 0.88
Figure 5-11 total reliability versus BSM length
0.4
0.45
0.5
0.55
0.6
0.65
0.7
0.75
0 50 100 150 200 250 300 350 400
tota
l rel
iab
ility
BSM Packet lenght

Chapter 5: Reliability and Connectivity Analysis for BSM in CAV
131
As noticed in Fig. 5-11, due to BER, as the length of the packet increases, the probability
of successful delivery decreases. For a BSM of 365 Bytes, the probably of successful delivery
of a packet is less than 55%. Therefor that it is necessary to keep the BSM length as small as
possible. However, for security reasons, encryption should be done on this message thus
increasing in the size of BSM packets.
Now we want to study the influence of vehicle density on the total reliability for Different
BSM packet length.
Figure 5-12 Influence of density on the total reliability V2V for Different BSM packet length.
The message propagation process highly depends on the number of vehicles, since lower
densities can provoke message losses due to reduced communication capabilities. It is clear
that low density leads to the decrease of probability of receiving the BSM message (Fig. 5-
12).
0.4
0.45
0.5
0.55
0.6
0.65
0.7
0.75
0.8
0 50 100 150 200 250 300 350 400
tota
l rel
iab
ility
v2
v
BSM size
Density 0.02 Density 0.03 Density 0.05 Density 0.1

Chapter 5: Reliability and Connectivity Analysis for BSM in CAV
132
Figure 5-13 influence of density on the total reliability for the Network using Different BSM packet
length.
The reliability of the network is affected by the reliability of the OBU as show in Fig. 5-
13. Using high density, all OBUs must work properly in order to assure the reliability of the
Network.
Whereas, on the application layer, higher densities can provoke reduced message delivery
due to contention and massive packet collisions that cause broadcast storm problems [129]
which severely affect the resources due to re-broadcast. Therefore, many algorithms were
developed to reduce the number of redundantly received packets, by using certain parameters
like broadcast probability and hop counters [130].
Now we will study the influence of the transmission range on the reliability. As noticed,
even for a transmission range of 300 m and BSM packet length of 300 Bytes, reliability did
not reach more than 60% probability of successful reception. However, as the transmission
range decreases the reliability of BSM also decreases (Fig. 5-14).
0.4
0.45
0.5
0.55
0.6
0.65
0.7
0.75
0.8
0 50 100 150 200 250 300 350 400
Tota
l rel
iab
ilty
of
Net
wo
rk
BSM size in Byte
Density 0.02 Density 0.03 Density 0.05 Density 0.1
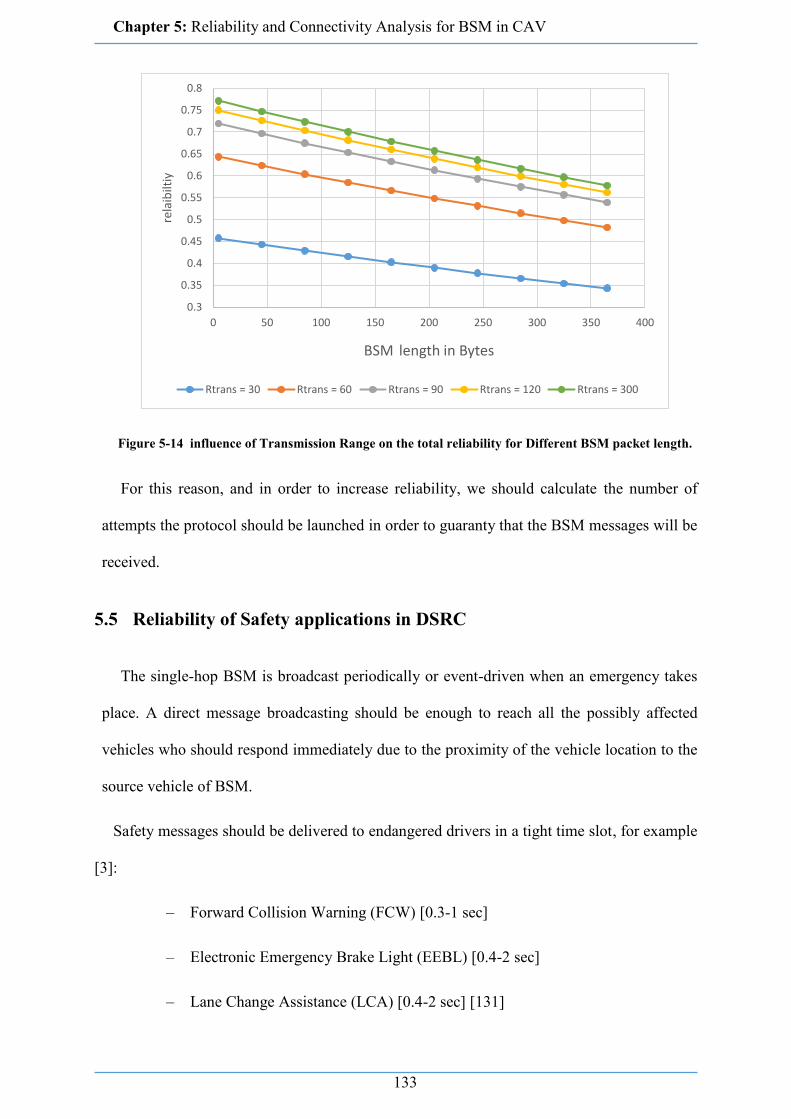
Chapter 5: Reliability and Connectivity Analysis for BSM in CAV
133
Figure 5-14 influence of Transmission Range on the total reliability for Different BSM packet length.
For this reason, and in order to increase reliability, we should calculate the number of
attempts the protocol should be launched in order to guaranty that the BSM messages will be
received.
5.5 Reliability of Safety applications in DSRC
The single-hop BSM is broadcast periodically or event-driven when an emergency takes
place. A direct message broadcasting should be enough to reach all the possibly affected
vehicles who should respond immediately due to the proximity of the vehicle location to the
source vehicle of BSM.
Safety messages should be delivered to endangered drivers in a tight time slot, for example
[3]:
– Forward Collision Warning (FCW) [0.3-1 sec]
– Electronic Emergency Brake Light (EEBL) [0.4-2 sec]
– Lane Change Assistance (LCA) [0.4-2 sec] [131]
0.3
0.35
0.4
0.45
0.5
0.55
0.6
0.65
0.7
0.75
0.8
0 50 100 150 200 250 300 350 400
rela
ibilt
iy
BSM length in Bytes
Rtrans = 30 Rtrans = 60 Rtrans = 90 Rtrans = 120 Rtrans = 300

Chapter 5: Reliability and Connectivity Analysis for BSM in CAV
134
– Stop Vehicle Ahead (SVA) [0.5-3 sec]
Due to the independency between packets in BSM communication, where each packet
contains full updates about the status of the car regardless of the previous packet; mobility
applications will not be affected even if several old packets are lost as long as a newer packet
is received within a certain time slot called S (multiple of 100 milliseconds). During this time
S, the vehicle safety application can take the right decision and do the needed reaction and
intervention without affecting safety.
Having 𝑃𝐵𝑆𝑀 the probability of losing a message and K the number of retransmissions of
independent BSM packets, we calculate the failure rate of the DSRC protocol as a function of
loss and 𝑘 the number of times. The failure rate of communication as a function of the variable
follows a binomial distribution, 𝑃𝑟 (receiving no packet among K repeated BSM packets)
Therefore,
𝑃𝑟 = (1 − 𝑃𝐵𝑆𝑀)𝐾 (5.10)
Calculating the probability of receiving all the messages without any loss, for K consecutive
BSM packet.
𝑃𝑟 = 1 − (1 − 𝑃𝐵𝑆𝑀)𝐾 (5.11)
Introducing the time slot S, which is determined by the requirement of specific safety
applications (such as: forward collision warning, emergency electronic brake light, blind spot
warning, lane change warning, control loss warning, intersection movement assist) leads us to
calculate the reliability of the system allowable transmission BSM loss.
𝑅𝑆𝐴(𝑑, 𝑡) = 1 − (1 − 𝑅𝐵𝑆𝑀(𝑑, 𝑡))𝑆
𝑝 (5.12)
Where:
• 𝑅𝑆𝐴: The reliability of the safety application at time t, and at distance d (depending on
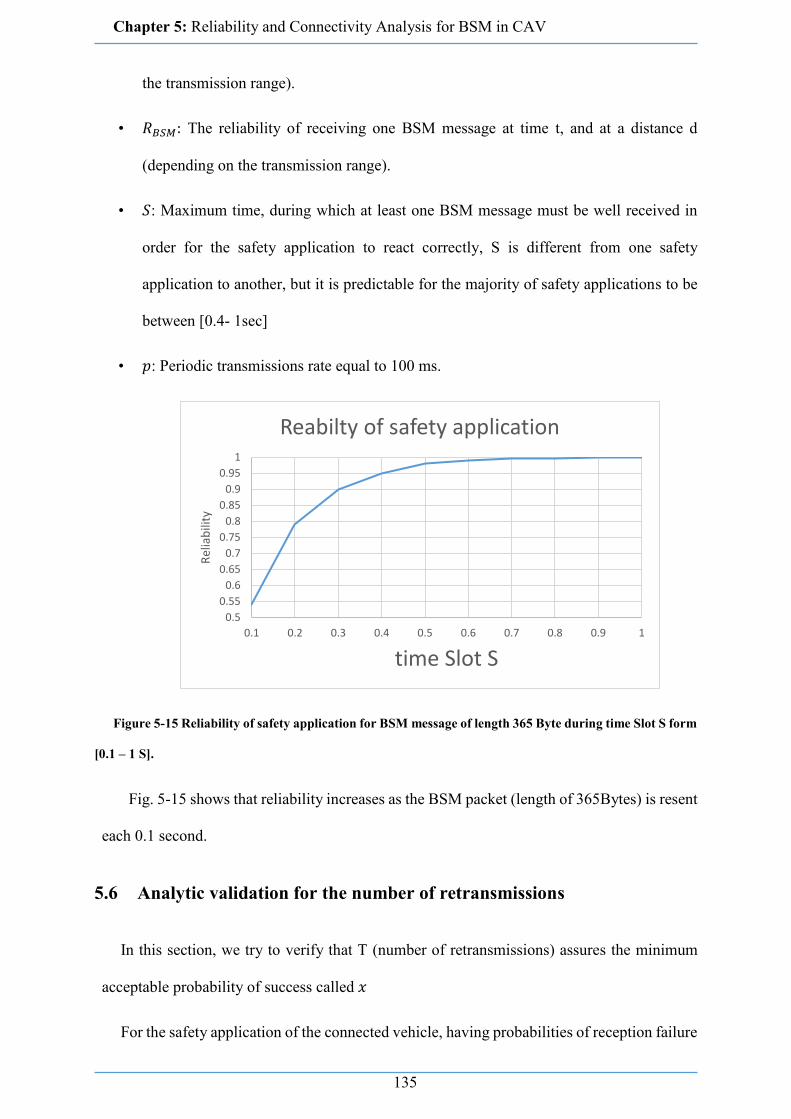
Chapter 5: Reliability and Connectivity Analysis for BSM in CAV
135
the transmission range).
• 𝑅𝐵𝑆𝑀: The reliability of receiving one BSM message at time t, and at a distance d
(depending on the transmission range).
• 𝑆: Maximum time, during which at least one BSM message must be well received in
order for the safety application to react correctly, S is different from one safety
application to another, but it is predictable for the majority of safety applications to be
between [0.4- 1sec]
• 𝑝: Periodic transmissions rate equal to 100 ms.
Figure 5-15 Reliability of safety application for BSM message of length 365 Byte during time Slot S form
[0.1 – 1 S].
Fig. 5-15 shows that reliability increases as the BSM packet (length of 365Bytes) is resent
each 0.1 second.
5.6 Analytic validation for the number of retransmissions
In this section, we try to verify that T (number of retransmissions) assures the minimum
acceptable probability of success called 𝑥
For the safety application of the connected vehicle, having probabilities of reception failure
0.5
0.55
0.6
0.65
0.7
0.75
0.8
0.85
0.9
0.95
1
0.1 0.2 0.3 0.4 0.5 0.6 0.7 0.8 0.9 1
Rel
iab
ility
time Slot S
Reabilty of safety application

Chapter 5: Reliability and Connectivity Analysis for BSM in CAV
136
of 1/1000 to 1/100 per message may be adequate [132].
For that having 𝑥 as the accepted reception probability, and 𝑅𝐵𝑆𝑀 the current probability;
and in order to increase the reliability of the safety application, the failure probability after T
retransmissions is (1 − 𝑅𝐵𝑆𝑀)𝑇
Hence,
(1 − 𝑅𝐵𝑆𝑀)𝑇 ≤ (1 − 𝑥) (5.13)
𝑒𝑇(1−𝑅𝐵𝑆𝑀) ≤ 𝑒(1−𝑥) (5.14)
Calculating the number of attempts that we have to resend the message in order to ensure
its delivery, we obtain:
𝑇 >ln (1−𝑥)
ln(1−𝑅𝐵𝑆𝑀) (5.15)
Where 0 < 𝑥 < 1 and 0 < 𝑅𝐵𝑆𝑀 < 1.
For example, in the case of the Maximum length of BSM, we have 𝑅𝐵𝑆𝑀 = 0,54
And the reception failure of is 1/100 per message,
𝑇 >ln (1 − 0.99)
ln(1 − 0.54)
𝑇 > 5.9
We need six attempts in order to guaranty that the message is properly delivered with a
probability greater than 99%. T=6
When BSM is transmitted 10 times per second, hence, after six transmissions (after 0.6
second); the probability of receiving at least one BSM packet will be greater than 99%.
Which means that after 600 milliseconds (six independent BSM packets were sent); it is
guaranteed that one of them should be well received with a probability greater than 99%. (Fig.

Chapter 5: Reliability and Connectivity Analysis for BSM in CAV
137
5-15).
For example, for FCW message, having P=0.1, S is varying in the range of [0.3-1 sec]. The
number of transmissions for the independent BSM packet “𝑆/𝑝” will be between 3 to 10
during the time slot S.
Remembering that the reliability is the ability of a system or component to perform its
required functions under stated conditions for a specified interval of time. Specifically, for
each given time t0, if at least one packet is received during the period, the BSM application is
said to perform its functionality, thus it is considered reliable at time t0.
Finally, to assure the mentioned level of reliability, the number of retransmission T, should
be less than or equal to the Time slot for each safety application divided by Periodic
transmission rates.
𝑇 ≤ 𝑆/𝑝 (5.16)
Table 5-2 Parameters used in the Estimation of the safety application reliability
Parameters Value
Highway length 1000 m
Transmission range 100 m
Vehicle density 0.03/m
headway safety 20 m
BSM packet size 85-365 Bytes
Bit error Rate 10−4
Reliability of OBU hardware component 0.88
BSM Periodic transmissions rate P 100 ms
time slot S 600 ms (6 packets retransmission BSM )

Chapter 5: Reliability and Connectivity Analysis for BSM in CAV
138
Figure 5-16 Reliability of safety application after 6 retransmissions
After this simulation shown in Fig. 5-16 for different BSM application length, we conclude
the below in order to increase the reliability of BSM transmission without having side effects
on the network.
1. BSM should always be packaged into a single packet.
2. BSM should have the smallest possible length, a smaller packet has higher reliability
3. BSM should be prioritized as per the criticality of the safety application.
4. The time slot S is dependent on the application and on the size of the message. For that,
reducing the number of BSM messages reduces the load in a vehicular network.
However, sending fewer BSM will affect the provision of safety information to CAVs
in a given time window. Therefore, adaptation of periodic transmission rates P should
be achieved with precaution.
5. We should have a compromise between keeping the message small, and securing the
BSM (certificate and signature) which increases the size of packet.
6. The loss of one BSM packet, can be overcome smoothly without affecting the reliability
0.5
0.55
0.6
0.65
0.7
0.75
0.8
0.85
0.9
0.95
1
1 2 3 4 5 6
relia
bilt
iy
nb of resending the BSM
Reliabilty for safety Appication
Reliabilty for BSM of 5 Bytes Reliabilty for BSM of 85 Bytes
Reliabilty for BSM of 165 Bytes Reliabilty for BSM of 285 Bytes
Reliabilty for BSM of 365 Bytes

Chapter 5: Reliability and Connectivity Analysis for BSM in CAV
139
of the safety application. In other words, losing of one or more BSM packets, does not
directly lead to loss of communication, if at least one BSM packet was well received
during the time slot S. Others lost BSM packets can be considered as allowable BSM
failures.
7. A direct relation exits between the time slot and the reaction time, which is the period
between a disengagement event where the CAV driver was alerted of a technology
failure, and the driver actually assuming manual control of the vehicle. However, time
slot for safety application should be less than reaction time, otherwise the deriver will
not trust the autonomous system and he will take the control when it is not needed.
Giving a short time slot for the safety application in CAV to automatically react,
decreases the probability of the safe operation done by the driver.
8. A relationship should be considered among the reaction time of the driver, head
distance, and the time slot of safety application. This safety margin can be calculated
depending on the speed of the vehicle. Headway distance reduces the transmission range
that leads to decreasing the communication reliability, however as shown previously,
and since BSM messages are independent and periodic, the reliability of receiving one
message will increase during the time slot of a safety message. On the other hand, it is
important to keep the headway distance (as time) greater than twice the reaction time.
9. At the application layer, a compromise should be done between the number of
redundantly received messages and reliability; while maintaining good latency and
reachability. Due to rebroadcasting, a tradeoff between reliability and efficiency under
different vehicle densities should be considered.
10. Having a fixed transmission range, in high vehicular density, the network would suffer
from a broadcast-storm, however at night while in low vehicular density the
connectivity could be lost frequently. A dynamic transmission range could be a solution
for this problem.

Chapter 5: Reliability and Connectivity Analysis for BSM in CAV
140
5.7 Conclusion
The main feature for the successful propagation of safety applications message in the V2V
communications is link connectivity. Generally, the transmission range, density of vehicles,
noise influence, hardware reliability, and the arrival rate of vehicles will affect the network
reliability performance. In this chapter, we design a reliability calculation scheme, which
considers the influence of the minimal safe distance amongst nearby vehicles under the tunnel.
The results obtained by simulations prove that the deviation of the safe distance will bring
substantial changes in the network reliability when transmission range of vehicles is less than
150m. Hence, while designing the network reliability models, the safe headway cannot be
ignored.
In this chapter, we evaluated the impact of different factors that affected the connectivity
and the reliability for connected vehicles. We analyzes the reliability of DSRC wireless
communication and reliability of DSRC-based safety applications, for freeway traffic
environment. We design a reliability calculation scheme for the DSRC wireless
communication based on metric packet receiving ratio probability, which considers the
influence of transmission range, vehicle density, safety headway distance, packet estimation
error, and the reliability of communication hardware equipment.
The results obtained by simulations prove that the reliability of communication is very
affected by the factors listed above, Therefore this parameters are well studied in order to
avoid reaching -in some case- an unacceptable level of reliability for the receiving of a single
BSM packet.
Moreover, we have developed an analytical model that related the DSRC communication
reliability and the safety application reliability. We proved using this analytical model the
independence between packet reliability and the safety application reliability. The safety

Chapter 5: Reliability and Connectivity Analysis for BSM in CAV
141
application can assure a high level of the reliability if at least BSM message is well received
during a time slot S, other failed packets can be considered as allowable transmission failures
during time slot S, depending on the safety application requirements. This model clearly
illustrates how communication reliability under different traffic environments will
significantly affect the corresponding safety application reliability, and provides a design input
on how to use DSRC wireless communication to improve the overall reliability of safety
applications.
The communication reliability of BSM helps us prioritize the safety-application and define
a suitable time slot for it, i.e. if the BSM is well received, during the defined time slot, then
the safety application could be considered reliable.
Finally, we list all the factors that should take into consideration in order to have a greater
probability the receiving of the BSM packet and we conclude our research with 10 key points
that increase the reliability of BSM applications without having side effects on the network.

142
CHAPTER 6 - CONCLUSIONS & PERSPECTIVES ............................................................................142
6.1 SUMMARY........................................................................................................................................ 143
6.2 FUTURE WORK .................................................................................................................................. 144
Chapter 6 - Conclusions & Perspectives

Chapter 6: Conclusions and Perspectives
143
6.1 Summary
Reliability of mobile-based environment has become a hot topic in the automotive domain
in the last recent years. As long as wireless networks, radio communication and other
embedded technology will enable our vehicles to sense traffic and stop accidents before they
happen, the use of such wireless and mobile technologies to improve traffic safety as well to
share and produce data for entertainment will become widespread. Ultimately, users expect
such services to achieve acceptable levels of dependability.
Ultimately, users expect such services to achieve acceptable levels of dependability.
This thesis focused on the development of modelling approaches aimed at the reliability
evaluation of CAV using a combination of V@V and V2I wireless and mobile
communications. To the best of our knowledge, this problem has been seldom addressed and
there is a lack of practical examples illustrating how dependability evaluation in this context
can be carried out.
CAVs will allow drivers to do non-driving related activities such as work, relax, access
digital media or shop online. However, under the unreliable situations of system failure, it is
important to ensure that the human driver reacts in an appropriate and timely manner to control
the vehicle and to resume driving manually. It is important to recognize the reasons for
disengagements and the resulting driver reaction times.
In this dissertation, we mainly focus on the combined modeling of connectivity dynamics
under various mobility scenarios and the integration of such information in higher-level
dependability models for the CAV.
In addition, in this dissertation, we demonstrated the importance of dependability analysis
using a mixed approach between qualitative and quantitative methods. For this reason, it is
very important to analyze each component functionality to identify its failure rate ratio in order
to redesign for redundancy, which leads to further innovation in vehicle automation and
Chapter 6: Conclusions and Perspectives
144
automobile engineering.
Connected vehicle technology, such as vehicle-to-infrastructure (V2I) and vehicle-to-
vehicle (V2V) communication, may be able to fill the gap resulting from heavy reliance on a
priori information and to resolve and increase the dependability of CAV.
In V2V communications, vehicles exchange safety-critical information (e.g., information
beacons, road and traffic conditions) among each other. This BSM communication, which can
be performed periodically or when triggered by some event, requires high reliability and is
sensitive to delay.
In this dissertation, we analyzed also some connectivity characteristics in dynamic
vehicular communication scenarios that are important for the design and the performance and
dependability assessment of such safety applications. We investigated the influence of each
parameters on different cases using the corresponding analysis technique (analytical,
simulation) and the main conclusions derived.
Concerning the BSM, we proved using the analytical model the independence between
packet reliability and the reliability of the safety application. The proposed model takes into
account many factors such as transmission range, vehicle density, safety headway distance on
highway, packet error rate, noise influence and failures rates of DSRC hardware equipment.
We tackled the dependability of the whole system in the operation mode for the full CAV,
and evaluated the reliability of communication from sender to receiver to include the reliability
of data transmission while using real network and traffic conditions on the proposed modeling
technique.
6.2 Future work
The safety-critical nature of CAVs clearly demands that the technology it uses should be
reliable against all kinds of potential failure, accidental, intentional, or adversarial. In this
work, we presented a comprehensive analysis of the reliability for CAVs.
Chapter 6: Conclusions and Perspectives
145
The application of wireless ad hoc networking is growing due to its easy connection
features. CAVs are examples of widely used areas that require adaptive communication
techniques to connect objects in dynamic environments. Our proposed approaches could be
easily applicable for other applications with some modifications. In the near future, we plan
to continue our research in the construction of hybrid networks where CAV networks could
connect to Internet and other services through the use of other infrastructure techniques.
Researchers from academia and industry are currently investigating vehicle to everything
communication where the vehicle will not only send information to other vehicles or to
infrastructure, but also to any entity such as V2P (vehicle-to-pedestrian), V2D (vehicle-to-
device) and V2G (vehicle-to-grid). V2X will be integrated with the Internet of Things (IoT),
and CAV will be a fundamental component of the internet of vehicles (IoV) [133]. Moreover,
future work will include more simulations with different scenario’s (highway and urban areas).
Some CAV OEM declare that 90% of development of CAV has already been done,
however the remaining 10% needs 90% of the efforts work to ensure the dependability and
the safety of the CAV.
CAVs require reliable, safe, secure, and highly responsive solutions to be able to make split-
second decisions based on a detailed understanding of the driving environment. Understanding
the driving environment requires an enormous amount of data to be captured by a myriad of
different sensors across the car. AI, especially machine language, neural networks and deep
learning have become an absolute necessity to make CAVs function properly and safely and
thus leading the way for the launch of Level 5 autonomous vehicles. Using the same approach
in analyzing dependability, we will continue our study to evaluate the reliability of AI in CAV
and find the proper method to enhance the reliability for this application.

146
[1] A. Dabboussi, R. Kouta, J. Gaber, M. Wack, B. El Hassan "Reliability Analysis for Basic
Safety Messages in Connected Autonomous Vehicles (CAV)" IEEE transactions on
Reliability, Submitted.
[2] A. Dabboussi, R. Kouta, J. Gaber, M. Wack, B. El Hassan, L. Nachabe “A New Approach
for The Reliability of Vehicular Ad hoc Networks” in The 2nd international conference
on smart applications and data analysis for smat cities, Casablanca, Morocco, February
2018.
[3] A. Dabboussi, R. Kouta, J. Gaber, M. Wack, B. El Hassan, L. Nachabe “Dependability
Overview for Autonomous Vehicles and Reliability Analysis for Basic Safety Messages
“in The Sixth International Conference on Digital Information, Networking, and Wireless
Communications (DINWC2018) Beirut, Lebanon , 2018.
[4] A. Dabboussi, R. Kouta, B. El Hassan, L. Nachabe, J. Gaber, M. Wack, “Reliability Block
Diagram and Fault Tree for on Intelligent Vehicular Network (IVN)” in IEEE Middle East
& North Africa COMMunications Conference MENACOMM; University of Kaslik
(USEK) Jounieh - Lebanon, April 2018
[5] A. Dabboussi, R. Kouta, J. Gaber, M. Wack, B. El Hassan, L. Nachabe” Reliability
Analysis of Connected Automated Vehicle (CAV)” in European Safety and Reliability
Conference ESREL, Trondheim, Norway, June 2018.
List of personal publications
147
Table 3-1 preliminary risk analysis ..................................................................................... 71
Table 3-2 Functional analysis table .................................................................................... 81
Table 3-3 FMECA for CAV ................................................................................................ 84
Table 4-1 Failure events data .............................................................................................. 97
Table 4-2 Failure events data for sensors and software..................................................... 105
Table 5-1 Parameters used in the Estimation of the BSM reliability ................................ 130
Table 5-2 Parameters used in the Estimation of the safety application reliability ............ 137
List of Tables

148
Figure 2-1 General view of CAV ........................................................................................ 31
Figure 3-1 Qualitative analysis approach of dependability ................................................. 64
Figure 3-2 Functional Architecture for the Autonomous Vehicle ...................................... 66
Figure 3-3 Blue chart for CAV ............................................................................................ 72
Figure 3-4 Octopus diagram for manufacturing and transportation of CAV ...................... 74
Figure 3-5 Octopus diagram for manufacturing and transportation of CAV. ..................... 75
Figure 3-6 Global functional block diagram for CAV ........................................................ 78
Figure 3-7 Functional block diagram of sensors ................................................................. 79
Figure 4-1 Reliability block diagram for OBU including the TPM .................................... 94
Figure 4-2 Reliability block diagram for RSU .................................................................... 94
Figure 4-3 RBD for OBU2 using dual Power supply ......................................................... 97
Figure 4-4 Reliability comparison between OBU1 and OBU2 .......................................... 98
Figure 4-5 Reliability comparison between RSU1 and RSU2 ........................................... 99
Figure 4-6 Reliability of V2V ........................................................................................... 100
Figure 4-7 Reliability of V2I ............................................................................................. 101
Figure 4-8 V2X Reliability ................................................................................................ 102
Figure 4-9 Standard Fault Tree Diagram......................................................................... 103
Figure 4-10 CAV Fault Tree ............................................................................................. 103
Figure 4-11 FTA for sensors failures of CAV................................................................... 105
Figure 4-12 FTA for communication failure of CAV ....................................................... 105
Figure 4-13 Fault Tree event of OBU in CAV .................................................................. 106
Figure 4-14 Fault tree analysis for CAV ........................................................................... 107
Figure 4-15 nominal cut analysis ...................................................................................... 109
Figure 4-16 Redundant system vision by multisensory fusion ......................................... 111
List of figures

149
Figure 4-17 Improvement fault tree .................................................................................. 112
Figure 4-18 Reliability comparison for sensors hardware ................................................ 113
Figure 4-19 reliability comparison between sensors having a single vision system and
sensors having a redundant vision system .............................................................................. 113
Fig. 4-20 Nominal cut analysis improvement ................................................................... 114
Figure 4-21 Reliability comparison between old design CAV and enhanced design. ...... 115
Figure 5-1 Street with two lanes ........................................................................................ 120
Figure 5-2 Reliability V2V against transmission range .................................................... 121
Figure 5-3 Reliability of Network against transmission range .......................................... 122
Figure 5-4 Reliability of route against transmission range ............................................... 122
Figure 5-5: Reliability V2V against density ...................................................................... 123
Figure 5-6: Reliability of Network against density ........................................................... 124
Figure 5-7 Reliability of route against density .................................................................. 124
Figure 5-8 Evolution of reliability with Hs=10 ................................................................. 125
Figure 5-9 Evolution of reliability with Hs=30 ................................................................. 126
Figure 5-10 probability of received packet against BSM length ....................................... 129
Figure 5-11 total reliability versus BSM length ................................................................ 130
Figure 5-12 Influence of density on the total reliability V2V for Different BSM packet
length. ..................................................................................................................................... 131
Figure 5-13 influence of density on the total reliability for the Network using Different BSM
packet length. ......................................................................................................................... 132
Figure 5-14 influence of Transmission Range on the total reliability for Different BSM
packet length. ......................................................................................................................... 133
Figure 5-15 Reliability of safety application for BSM message of length 365 Byte during
time Slot S form [0.1 – 1 S]. .................................................................................................. 135
Figure 5-16 Reliability of safety application after 6 retransmissions................................ 138

150
[1] N. Tran, "Global status report on road safety 2018," Organization, World Health,
2018.
[2] B. W. Smith, "Human error as a cause of vehicle crashes," Center for Internet and
Society at Stanford Law School, 2013.
[3] R. Naja, Wireless Vehicular Networks for Car Collision Avoidance., Eds
Springer., 2013..
[4] G. L. Lann., "Safe Fully Automated Driving on Roads and Highways," Séminaire
System X, Palaiseau, France, 2015..
[5] D. Fagnant and K. Kockelman, "Preparing a nation for autonomous vehicles:
opportunities, barriers and policy recommendations," Transp. Res. Part A: Policy
Pract, 2015.
[6] A. M. Khan, A. Bacchus and S. Erwin, "Policy challenges of increasing
automation in driving.," in IATSS Research., 35, 79-89 (2011).
[7] K. Bullis, "How Vehicle Automation will Cut Fuel Consumption," in MIT’s
Technology Review., 2011.
[8] Y. B. M. Olimjon, A. Nait Sidi Moh and J. Gaber, "Wireless sensor networks:
Basics and fundamentals.," 2016.
[9] SMMT, "Connected and Autonomous Vehicles: SMMT Position Paper," Society
of Motor Manufacturers and Traders, 2017.
[10] W. Wachenfeld, H. Winner, J. Gerdes, B. Lenz, M. Maurer, S. Beiker, E. Fraedrich
and T. Winkle, "Use Cases for Autonomous Driving.," in Autonomous Driving.
Springer,, Berlin, Heidelberg, 2016.
[11] SAE, "Taxonomy and Definitions for Terms Related to Driving Automation
Systems for On-Road Motor Vehicles," Warrendale: SAE International,
J3016_201806, 15 June 2018.
[12] Dorothy J. Glancy, " Autonomous and Automated and Connected Cars—Oh My!
First Generation Autonomous Cars in the Legal Ecosystem," vol. 16 Minn. J.L. Sci.
& Tech. 619, 2015.
[13] J. B. Kenney, "Dedicated Short-Range Communications (DSRC) Standards in the
United States," Proceedings of the IEEE, vol. 99, no. 7, pp. 1162-1182, 2011.
[14] S. E. Shladover., " Connected and automated vehicle systems: Introductionand
overview.," Journal of Intelligent Transportation Systems,22(3):190–200, 2018.
Literatures

151
[15] A. Bonyár, A. Géczy, O. Krammer, H. Santha, B. Illés, J. Kaman, Z. Szalay, P.
Hanak and G. Harsanyi, "A review on current eCall systems for autonomous car
accident detection," in 1-8. 10.1109/ISSE.2017.80009, 2017.
[16] K. Dar, M. Bakhouya, J. Gaber, M. Wack and P. Lorenz, "Wireless
communication technologies for ITS applications," IEEE Communications
Magazine, pp. 156-162, 2010.
[17] T. Nadeem, P. Shankar and L. Iftode, "A comparitive study of data dessimination
models for VANET," in the 2nd Annual International Conference on Mobile and
Ubiquitious Systems: Networking and Services, 2006.
[18] H. Hartenstein and K. Laberteaux, VANET: Vehicular Applications and Inter-
Networking Technologies, John Wiley & Sons Ltd., 2010.
[19] Y. Zhuang, J. Pan, Y. Luo and L. Cai, "Time and location-critical emergency
message dissemination for vehicular ad hoc networks," IEEE Journal on Selected
Areas in Communications, vol. 29, no. 1, pp. 187-196, 2011.
[20] M. Caliskan, D. Graupner and M. M., "Decentralized discovery of free parking
places," in VANET ’06: Proceedings of the 3rd ACM International Workshop on
Vehicular Ad Hoc Networks, Los Angeles, California, 2006.
[21] E. Uhlemann, "Introducing connected vehicles," IEEE Vehicular Technology
Magazine, vol. 10(1), p. 23–31, 2015.
[22] S. Kaviani, M. O’Brien, J. Van Brummelen, D. Michelson and H. Najjaran,
"Ins/gps localization for reliable cooperative driving," in IEEE Canadian Conference
Electrical and Computer Engineering (CCECE), Vancouver, Canada, 2016.
[23] NHTSA, "Summary of Motor Vehicle Crashes 2016," NHTSA’s National Center
for Statistics and Analysis, 2018.
[24] S. Rosenbloom, "The Mobility Needs of Older Americans: Implications for
Transportation Reauthorization," The Brookings Institution, 2003.
[25] Waymo, "Waymo Safety Report: On the Road to Fully Self-Driving," 2018.
[26] J. Peti and S. Shladover., "Potential Cyberattacks on Automated Vehicles.," IEEE
Trans. Intell.Transp. Syst., 16, 546–556., 2015.
[27] A. Dabboussi, R. Kouta, J. Gaber, M. Wack, B. E. Hassan and L. Nachabe,
"Dependability Overview for Autonomous Vehicles and Reliability Analysis for
Basic Safety Messages," in The Sixth International Conference on Digital
Information, Networking, and Wireless , Beirut, 2018.
[28] M. Alonso Raposo, B. Ciuffo, M. Makridis and C. Thiel, "The r-evolution of
driving: from Connected Vehicles to Coordinated Automated Road Transport (C-
ART),," no. Part I: Framework for a safe & efficient Coordinated Automated Road
Transport (CART), 2017.
[29] M. K. J. Alonso Raposo, J. Després, A. Mourtzouchou, B. Ciuffo, B. Saveyn, C.
Thiel, A. Krasenbrink, C. Galassi, L. Levati, M. Grosso and E. Fernández Macías,
"An analysis of possible socio-economic effects of a Cooperative, Connected and
Automated Mobility (CCAM) in Europe.," no. Effects of automated driving on the
economy, employment and skills. 211 p. doi: 10.2760/007773., 2018.
152
[30] KPMG, Connected and Autonomous Vehicles: The UK Economic Opportunity. ,
2015.
[31] ERTRAC, "Automated Driving Roadmap: Connectivity and Automated Driving,"
ERTRAC Working Group, 2017.
[32] R. Naja and R. Stanica, "Quality of Service Provisioning in Wireless Vehicular
Networks: Challenges and Mechanisms.," Vols. (eds) Wireless Vehicular Networks
for Car Collision Avoidance. Springer, New York, NY, 2013.
[33] CADMV, Article 3.7–Testing of Autonomous Vehicles,Title 13, Division 1,
Chapter 1, [Online]. Available:
https://www.dmv.ca.gov/portal/dmv/detail/vr/autonomous/testing. [Accessed 2019].
[34] D. Sherman, "Semi-autonomous cars compared! tesla model s vs. bmw 750i,
infiniti q50s, and mercedes-benz s65 amg," Feb 2016. [Online]. Available:
http://www.caranddriver.com/features/semi-autonomous-cars-compared-tesla-vs-
bmw-mercedes-and-infiniti-feature.
[35] ZOOX, "SAFETY INNOVATION," 2018.
[36] F. Lambert, "Tesla’s “vision” and autopilot chip efforts validated by intel’s $15
billion acquisition of mobileye.," Mar 2017. [Online]. Available:
https://electrek.co/2017/03/13/teslavision-autopilot-chip-intel-mobileye.
[37] L. BARREHAG, "The Future of Autonomous Cars: A Scenario Analysis of
Emergence and Adoption," Chalmers University of Technology, Sweden, 2018.
[38] N. Parker, A. Shandro and E. Cullen, "Autonomous and connected vehicles:
navigating the legal issues," Allen & Overy LLP, 2017.
[39] A. Andrew Keen, "“The Future of Travel: How Driverless Cars Could Change
Everything,”," CNN Business Traveler , 2013.
[40] BMVI, "Ethics Commission Automated and Connected Driving," the Federal
Minister of Transport and Digital Infrastructure, 2017.
[41] B. Fildes, "“Effectiveness of low speed autonomous emergency braking in real-
world rear-end crashes”," Accident Analysis & Prevention, vol. 81, pp. 24-9., 2015.
[42] J.-C. Pandazis and A. Winder, "Study of Intelligent Transport Systems for
reducing CO2 emissions for passenger cars," ERTICO – ITS Europe, Belgium, 2015.
[43] Atkins, "Research on the Impacts of Connected and Autonomous Vehicles
(CAVs) on Traffic Flow," Department for Transport , 2016.
[44] H. Cheng, Autonomous Intelligent Vehicles: Theory, Algorithms, and
Implementation, Springer Science & Business Media., 2011.
[45] C. Katrakazas, M. Quddus, W.-H. Chen and L. Deka, "Real-time motion planning
methods for autonomous on-road driving: State-of-the-art and future research
directions," Transp. Res. Part C: Emerg, vol. Technol. 60, p. 416–442, 2015.
[46] D. Gruyer, S. Demmel, V. Magnier and R. Belaroussi, "Multi-hypotheses tracking
using the dempstershafer theory, application to ambiguous road context," Information
Fusion, vol. 29, p. 40–56, 2016.
153
[47] H. Zhu, K.-V. Yuen, L. Mihaylova and H. Leung, "Overview of environment
perception for intelligent vehicles," IEEE Transportation, vol. Intelligence
Transportation system, p. 1–18, 2017.
[48] N. Papernot, P. McDaniel, S. Jha, M. Fredrikson, Z. B. Celik and A. Swami., "The
limitations of deep learning in adversarial settings," in IEEE European Symposium
on Security and Privacy (EuroS&P), pages 372–387., 2016.
[49] T.-W. Huang, C.-C. Hsu, W.-Y. Wang and J. Baltes, "ROSLAMa faster algorithm
for simultaneous localization and mapping (SLAM)," Robot Intelligence Technology
and Applications 4. Advances in Intelligent Systems and Computing, no. Springer, p.
65–74, 2017.
[50] B. Vanholme, "Highly automated driving on highways based on legal safety," PhD
thesis, University of Evry-Val-d’Essonne, 2012.
[51] A. Nait Sidi Moh, A. Ruzmetov, M. Bakhouya and Y. a. G. J. Nait Malek, "A
Prediction Model of Electric Vehicle Charging Requests," Procedia Computer
Science, vol. 141, no. 10.1016/j.procs.2018.10.158., pp. 127-134, 2018.
[52] A. Dabboussi, R. Kouta, J. Gaber, M. Wack, B. E. Hassan and L. Nachabe,
"Reliability Analysis of Connected Automated Vehicle (CAV)," in European Safety
and Reliability Conference ESREL, Trondheim, Norway, 2018.
[53] I. A. Sumra, H. B. Hasbullah and J.-l. B. Ab-Manan, "Attacks on security goals
(confidentiality, integrity, availability) in vanet: a survey," Vehicular Ad-Hoc
Networks for Smart Cities, no. Springer, p. 51–61, 2015.
[54] M. T. Gari, M. E. Gursoy, P. Reiher and M. Gerla, "Congestion attacks to
autonomous cars using vehicular botnets," in NDSS Workshop on Security of
Emerging Networking Technologies, San Diego, CA, 2015.
[55] M. Mejri, J. Ben-Othman and M. Hamdi., "Survey on VANET security challenges
and possible cryptographic solutions," Vehicular Communications, vol. 1(2), p. 53–
66, 2014.
[56] M. Amoozadeh, A. Raghuramu, C.-N. Chuah, H. M. Z. J. R. Dipak Ghosal and K.
Levitt, "Security vulnerabilities of connected vehicle streams and their impact on
cooperative driving," IEEE Communications Magazine, vol. 53(6), p. 126–132, 2015.
[57] Waymo, "Report on Autonomous Mode Disengagements For Waymo Self-
Driving Vehicles in California," 2016.
[58] J. Ansell and F. Wharton, Risk: Analysis, Assessment and Management,
Chichester: John Wiley & Sons, 1992.
[59] A. Dabboussi, R. Kouta, J. Gaber, M. Wack, B. E. Hassan and L. Nachabe, "A
New Approach for The Reliability of Vehicular Ad hoc Networks," in The 2nd
international conference on smart applications and data analysis for smat cities,
Casablanca, Morocco, 2018.
[60] D. R. Duran, E. Robinson, A. J. Kornecki and J. Zalewski, "Safety analysis of
Autonomous Ground Vehicle optical systems: Bayesian belief," in Computer Science
and Information, 2013.

154
[61] M. B. Swarup and M. S. Rao, Safety Analysis of Adaptive Cruise Control System
Using FMEA and FTA, International Journal of Advanced Research in Computer,
2014.
[62] N. Kalra and S. Paddock, "Driving to safety: How many miles of driving would it
take to demonstrate autonomous vehicle reliability?," Transportation Research Part
A: Policy and Practice, p. 94:182–193, 2016.
[63] J. Nielsen, "Iterative User Interface Design," IEEE Computer. 26 (11), p. 32–41,
1993.
[64] R. Kianfar, P. Falcone and J. Fredriksson, "Safety verification of automated
driving systems," IEEE Intelligent Transportation Systems Magazine, p. 5(4):73–86,
2013.
[65] D. Fagnant and K. Kockelman, "Preparing a nation for autonomous
vehicles:opportunities, barriers and policy recommendations," Transportation
Research Part A: Policy and Practice, p. 77:167–181., 2015.
[66] J. Wei, J. Snider and J. Kim, "Towards a viable autonomous driving research
platform," In Intelligent Vehicles Symposium (IV), IEEE, p. 763–770, 2013.
[67] M. Aeberhard, S. Rauch and M. Bahram, "Experience, results and lessons learned
from automated driving on Germany’s highways," IEEE Intelligent Transportation
Systems Magazine, p. 7(1):42–57., 2015.
[68] Waymo, "Report on Autonomous Mode Disengagements For Waymo Self-
Driving Vehicles in California," 2017.
[69] V. Dixit, S. Chand and D. Nair, "Autonomous vehicles: disengagements, accidents
and reaction times," PLoS one, p. 11(12), 2016.
[70] W. Schwarting, J. Alonso-Mora and D. Rus, "Planning and decision-making for
autonomous vehicles," Annual Review of Control, Robotics, and Autonomous
Systems, p. 1:187–210, 2018.
[71] C. Berger and B. Rumpe, "Autonomous driving-5 years after the urban challenge:
The anticipatory vehicle as a cyber-physical system," 2014.
[72] M. Blanco, J. Atwood, S. Russell, T. Trimble, J. McClafferty and M. Perez,
"Automated vehicle crash rate comparison using naturalistic data," Virginia Tech
Transportation Institute, 2016.
[73] Adouane L., "Toward fully autonomous vehicle navigation: From behavioral to
hybrid multi-controller architectures," in 11th International Workshop on Robot
Motion and Control, 2017.
[74] J. Shi, Y. Meng and S. Wang, "Reliability and safety analysis of redundant vehicle
management computer system," Chinese Journal of Aeronautic, p. 26(5):1290–302.,
2013.
[75] J. Marais, C. Meurie, D. Attia, Y. Ruichek and A. Flancquart, "Toward accurate
localization in guided transport: combining gnss data and imaging information.,"
Transp. Res. Part C: Emerg. Technol, pp. 43, 188–197, 2014.
[76] D. Gruyer, R. Belaroussi, X. Li, B. Lusetti, M. Revilloud and S. ,. Glaser, "A
central sensors fusion electronic control unit for the development of perception-based
155
ADAS," in 14th IAPR International Conference on Machine Vision Applications,
2015.
[77] G. Bresson, M. Rahal, D. Gruyer, M. Revilloud and Z. Alsayed, "A cooperative
fusion architecture for robust localization: Application to autonomous driving," in
IEEE 19th International Conference on Intelligent Transportation Systems (ITSC),
Rio de Jane, 2016.
[78] X. Ma, X. Yin and K. S. Trivedi, "On the reliability of safety applications in
VANETs," Int J Perform Eng, p. 8(2):115–30, 2012.
[79] G. L. Lann., " Integrated Safety and Efficiency in Intelligent Vehicular Networks,"
Transport Research Arena Europe, pp. Elsevier, 48, pp.951-961, 2012.
[80] R. He, H. Rutagemwa and X. Shen, "Differentiated reliable routing in hybrid
vehicular ad-hoc networks.," p. pp. 2353–2358., 2008.
[81] M. Kihl, M. Sichitiu, T. Ekeroth and M. Rozenberg, "Reliable Geographical
Multicast Routing in Vehicular Ad-Hoc Networks.," Springer Berlin Heidelberg,
2007.
[82] Y. Gongjun, N. Mitton and X. Li, "Reliable Routing in Vehicular Ad hoc
Networks," in The 7th International Workshop on Wireless Ad hoc and Sensor
Networking, Genoa, Italy, 2010.
[83] S. Dharmaraja, R. Vinayak and K. S. Trivedi, "Reliability and survivability of
vehicular ad hoc networks: An analytical approach.," Reliability Engineering &
System Safety, Volume 153, pp. pp. 28-38.4, 2016.
[84] W. Ahmad, O. Hasan, U. Pervez and J. Qadir, "Reliability modeling and analysis
of communication networks," Journal of Network and Computer Applications,
Volume 78, pp. 191-215, 2017.
[85] A. Dhamgaye and N. Chavhan, "Survey on security challenges in VANET," Int.
J. Comput. Sci. 2, p. 88–96, 2013.
[86] M. Nidhal, J. Ben-Othman and M. Hamdi, "Survey on VANET security challenges
and possible cryptographic solutions," Vehicular Communications. 1, 2014.
[87] A. Avizienis, J. Laprie, B. Randell and C. Landwehr, "Basic Concepts and
Taxonomy of Dependable and Secure Computing," IEEE Transactions on
Dependable and Secure Computing, pp. 1(1), 11-33., 2004.
[88] K. Hafeez, L. Zhao, Z. Liao and N. Ma, "Performance Analysis of Broadcast
Messages in VANETs Safety Applications," in In Proceedings of the 2010 IEEE
Global Communications Conference, Miami, FL, USA, 2010.
[89] Y. Yao, L. Rao and X. Liu, "Performance and Reliability Analysis of IEEE
802.11p Safety Communication in aHighway Environment.," IEEE Trans. Veh.
Technol, p. 4198–4212, 2013.
[90] P. Koopman and M. Wagner, "Autonomous vehicle safety: An interdisciplinary
challenge.," IEEE Intelligent Transportation Systems Magazine, vol. 9(1), p. 90–96,
2017.

156
[91] M. Kyriakidis, J. de Winter, N. Stanton, T. Bellet, B. van Arem, K. Brookhuis, M.
Martens, K. Bengler, J. Andersson and N. Merat, "A hum. Factors perspective on
automated driving," Theoret. Issues Ergon, p. 1–27., 2017.
[92] T. Krisher and D.-A. Durbin, "Tesla update halts automatic steering if driver
inattentive.," 2016.
[93] NHTSA, "Office of Defective Investigation–Preliminary Report Summary 2015
Tesla Model S Crash," 2016.
[94] A. Davies, "The Very Human Problem Blocking the Path to Self-Driving Cars,"
2017.
[95] A. Avizienis, J.-C. Laprie and B. Randell, "Fundamental concepts of
dependability," University of Newcastle upon Tyne, Computing Science Newcastle
upon Tyn, UK,, 2001.
[96] M. Al-Kuwaiti, N. Kyriakopoulos and S. ,. Hussein, "A comparative analysis of
network dependability, fault-tolerance, reliability, security, and survivability,"
Communications Surveys & Tutorials, pp. 106-124, 2009.
[97] P. Hoang., System Software Reliability, Eds Springer Series in Reliability
Engineering, 2006.
[98] K. S. Trivedi., Probability & statistics with reliability, queuing and computer
science applications, Eds John Wiley & Sons, 2008.
[99] A. G. Mihalache, "Mod´elisation et ´evaluation de la fiabilit´e des," 2007.
[100] Noyes and Pérès, "Analyse des systèmes sureté de fonctionnement," Techniques
de l’Ingénieur, ag3520, 2007.
[101] M. Maurer, J. Gerdes, B. Lenz and H. Winner, Autonomous Driving, Berlin,
Heidelberg: (Eds.),Springer, 2016.
[102] S. Ilgin Guler, M. Menendez and L. Meier, "Using connected vehicle technology
to improve the efficiency of intersections," Transportation Research Part C:
Emerging Technologies, vol. 46, no. ISSN: 0968-090X,, pp. 121-131, 2014.
[103] ISO26262, "Road Vehicles - Functional Safety," International Organization for
Standardization Information technology – Security techniques – Application security
– Part 2: Organization normative framework, 2016.
[104] D. Pendleton, "Perception, planning, control, and coordination for autonomous
vehicles," Machines, vol. 5, no. 1, p. p. 6, 2017.
[105] T. Douglas, "Structured analysis (sa) : Structured analysis for requirements
definition," p. 3 :6–15, 1977.
[106] S. Lawson, "Tackling the Transition to Automated Vehicles, Roads that Cars Can
Read Report III," European Road Assessment Association, 2018.
[107] W. Veseley and F. Goldberg, "Fault Tree handbook.," 1981.
[108] A. Dabboussi, R. Kouta, B. E. Hassan, J. Gaber, M. Wack and L. Nachabe,
"Reliability Block Diagram and Fault Tree for on Intelligent Vehicular Network
(IVN)," in EEE Middle East & North Africa COMMunications Conference
MENACOMM, Kaslik,Lebanon, 2018.

157
[109] I. Sumra, H. Halabi, J. Manan and M. Rehmam, "Trust and Trusted Computing in
VANET," Computer Science Journal Volume 1, Issue 1, 2011.
[110] W. Ahmed, O. Hasan and S. Tahar, "Formalization of reliability block diagramsin
higher-order logic," journal of Applied Logic 18, pp. 19-41, 2016.
[111] J. Barrachina, J. Sanguesa, M. Fogue, P. Garrido, F. Martinez, J.-C. Cano, C.
Calafate and P. Manzoni, "V2X-d: A vehicular density estimation system that
combines V2V and V2I communications," in IFIP Wireless Days (WD), Valencia,
2013.
[112] S. Singh, "Critical Reasons for Crashes Investigated in the National Motor Vehicle
Crash Causation Survey," 2015.
[113] J. R. Sklaroff., "Redundnacy Mangement Technique for Space Shuttle
Computers," IBM Journal of Research and Development, 1976.
[114] S. A. Ahmad, A. Hajisami, H. Krishnan, F. Ahmed-Zaid and E. Moradi-Pari, "V2v
system congestion control validation and performance," IEEE Transactions on
Vehicular Technology, Vols. 68, no. 3, p. 2102–2110, 2019.
[115] A. SanguesaJ, F. Naranjo, V. Torres-Sanz, M. Fogue, P. Garrido and F. Martinez,
"On the Study of Vehicle Density in Intelligent Transportation Systems," Mobile
Information Systems, vol. 2016, 2016.
[116] A. A. Almohammedi, N. K. Noordin and S. Saeed, "Evaluating the Impact of
Transmission Range on the Performance of VANET," International Journal of
Electrical and Computer Engineering (IJECE) , Vols. Vol. 6, No. 2, pp. 800-809,
2016.
[117] S. Yousefi, E. Altman and R. El-Azouzi, "Analytical model for connectivity in
vehicular ad hoc networks," IEEE Trans. Veh. Technol, pp. 3341-3356, 2008.
[118] M. Artimy, W. Roberston and W. Philips, "Connectivity in inter-vehicle ad hoc
networks," Proc.IEEE.Conf.Elect.Comput., 2004.
[119] F. Perry, K. Raboy, E. Leslie, Z. Huang and D. ,. Van Duren, "Dedicated short
range communications roadside unit specifications," U.S. Department of
Transportation, 2017..
[120] D. Bishop, S. Bevly and M. S. Boyd, "Evaluation and Testing of Driver Assistive
Platooning: Phase one results," ITS World Congress Bordeaux, 2015.
[121] F. A. Teixeira, V. F. e-Silva, J. L. Leoni, D. F. Macedo and J. M. Nogueira,
"Vehicular networks using the IEEE 802.11p standard: An experimental analysis,"
Vehicular Communications, Elsevier, vol. 1, pp. 91-96, 2014.
[122] J. R. Gallardo, D. Makrakis and H. T. Mouftah, "Performance analysis of the edca
medium access mechanism over the control channel of an ieee 802.11 p wave
vehicular network," in ICC’09. IEEE International Conference, 2009.
[123] C. Michaels, D. Kelley, R. Sumner and S. Chriss, "DSRC Implementation Guide
A guide to users of SAE J2735 message sets over DSRC," Communication, pp. 210,
2010., 2010.

158
[124] X. Ma, X. Chen and H. H. Refai, "Performance and reliability of dsrc vehicular
safety communication: A formal analysis," EURASIP J. Wirel. Comm, pp. pp. 1-13,
2009, 2009.
[125] K. Dey, A. Rayamajhi, M. Chowdhury, P. Bhavsar and J. Martin, "Vehicle-to-
vehicle (V2V) and vehicle-to-infrastructure (V2I) communication in a heterogeneous
wireless network – Performance evaluation," Transportation Research Part C:
Emerging Technologies, vol. 68, no. ISSN: 0968-090X, pp. 168-184, 2016.
[126] G. Beaulieu and i. N. C. Farhad, "Connectivity and bit error rate analysis of mobile
ad hoc wireless networks," in in Proceedings of the 64th IEEE Vehicular Technology
Conference, Montreal, Canada, 2006.
[127] X. Ma and X. Chen, "Saturation performance of IEEE 802.11broadcast network,"
IEEE Communications Letters, Vols. 11,no. 8, p. 686–688, 2007.
[128] B. Cronin., "Vehicle Based Data and Availability," Intelligent Transportation
Systems Joint Program Office Research and Innovative Technology Administration,
USDOT, 2015.
[129] S. Ni, Y. Tseng, Y. Chen and J. Sheu, "The Broadcast storm problem in a Mobile
Ad hoc Networks," in Proceedings of the 5th annual ACM/IEEE international
conference on Mobile computing and networking, Washington, 1999.
[130] S. Medetov, M. Bakhouya, J. Gaber, K. Zinedine, M. Wack and P. Lorenz, "A
Decentralized Approach for Information Dissemination in Vehicular Ad hoc
Networks," Journal of Network and Computer Applications, Elsevier, vol. 46, pp.
154-165, 2014.
[131] R. Dang, J. Ding, B. Su, Q. Yao, Y. Tian and K. Li, "A lane change warning system
based on v2v communication," in 17th Int. IEEE Conference Intelligent
Transportation Systems (ITSC)., 2014.
[132] X. Qing, M. Tony, J. K. and S. Raja, "Vehicle-to-vehicle safety messaging in
DSRC," in Proceedings of the 1st ACM international workshop on Vehicular ad hoc
networks, Philadelphia, PA, USA, 2004.
[133] N. Lu, N. Cheng, N. Zhang, X. Shen and J. W. Mark., "Connected vehicles:
Solutions and challenges," IEEE internet of things journal, vol. 1(4), p. 289–299,
2014.

159
Abbreviation Designation
ABC Artificial Bee Colony
ABS Automatic Braking System autonomous emergency braking
ABE Autonomous Emergency Braking
ACC Adaptive Cruise Control
ADAS Advanced Driver Assistance Systems
AI Artificial Intelligence
AV Autonomous Vehicle
BER Bit Error Rate
BSM Basic Safety Message
C2C Car to Car
CV Connected Vehicle
CA DMV California Department of Motor Vehicles
CAV Connected Autonomous Vehicle
DSRC Dedicated Short-Range Communications
DL Deep Learning
FMEA Failure Mode, Effects Analysis
FMECA Failure Mode, Effects and Criticality Analysis
FTA Fault Tree Analysis
EFA External Functional Analysis
ESC Electronic Stability Control
GPS Global Positioning System
IFA Internal Functional Analysis
Acronyms and Abbreviations

160
IMU Inertial Measurement Unit
ITS Intelligent Transportation Systems
LIDAR Light Detection and Ranging
LKA Lane-Keeping Assistance
ML Machine Language
MCS Minimal Cut Set
MOVE Mobility model generator for Vehicular networks
NHTSA National Highway Traffic Safety Administration
OSI Open Systems Interconnection
PRA Preliminary Risk Analysis
QOS Quality Of Services
RDT Random Delay Time
RSU Road Side Unit
SAE Society of Automotive Engineers
V2R Vehicle to Roadside
V2V Vehicle to Vehicle
V2X Vehicle to Everything
VANETs Vehicular Ad hoc Networks
VRC Vehicle-Roadside Communication
WAVE Wireless Access in the Vehicular Environment

Abstract:
Connected and Autonomous vehicles (CAV) must have adequate reliability and safety requirement in the uncertain environment with
complex circumstances. Sensor technology, actuators and artificial intelligence (AI) are constantly improving in their performance, which
enables continuous further development of self-driving vehicles, and increasing automation of the driving task. CAV shows many benefits
in human life such as increasing road safety, reducing pollution, and providing independent mobility to non-drivers. However, these advanced
components create a new set of challenges concerning safety and dependability. Hence, it is necessary to evaluate these technologies before
implementation.
We study in this thesis the reliability of CAV as a whole, focusing on the sensors and on the communication system. For that, a functional
analysis was done for the CAV system.
Our scientific approach for the analyzing the CAV reliability, was structured with methods that combine quantitative and qualitative
approaches such as functional analysis for both internal and external, Preliminary risk analysis (PRA) and failure modes and effects criticality
analysis (FMECA), etc.
In order to prove our result, a simulation was occurred using the Fault Tree analysis (FTA) probability and it has been conducted to
validate the proposed approach. The data (Failure ratio) used were from professional database concerning the type of components presented
in the system. From this data, a probabilistic model of degradation was proposed. The probability calculation was performed in relation to a
reference time of use. Thereafter a sensitivity analysis was suggested concerning the reliability parameters and redesign proposals are
developed for the components.
CAV provide communication services among one another: vehicles to vehicle (V2V) or with Road Side Infrastructure: vehicle to
infrastructure (V2I). Dedicated Short Range Communication (DSRC) employ multichannel to provide a variety of safety and non-safety
applications. Safety applications necessitate appropriate and reliable transmissions, while non-safety applications require performance and
high speed. Broadcasting of Basic Safety Messages (BSM) is one of the fundamental services in today’s connected vehicles. For that, an
analytical model to evaluate reliability of IEEE 802.11 based V2V safety-related broadcast services in DSRC system on highway was
proposed. Finally, an enhancement on the proposed model was made in order to increase the reliability of the V2V connection, taking into
consideration many factors such as transmission range, vehicle density, and safety headway distance on highway, packet error rate, noise
influence, and failures rates of communication equipment.
Evaluating these problems leads to a sensitivity analysis related to reliability parameters, which helps further innovation in CAV and
automobile engineering.
Keywords: Connected Autonomous vehicles, Dependability, Reliability, BSM, DSRC, VANET, wireless network, FMECA, Fault Tree.
Résumé
Les véhicules autonomes et connectés (VAC) doivent avoir une exigence de fiabilité et de sécurité adéquate dans un environnement
incertain aux circonstances complexes. La technologie des capteurs, les actionneurs et l'intelligence artificielle (IA) améliorent constamment
leurs performances, ce qui permet un développement continu des véhicules autonomes et une automatisation accrue de la tâche de conduite.
Les VAC présentent de nombreux avantages dans la vie humaine, tels que l’augmentation de la sécurité routière, la réduction de la pollution
et la fourniture d’une mobilité autonome aux non-conducteurs. Cependant, ces composants avancés créent un nouvel ensemble de défis en
matière de sécurité et de fiabilité. Il est donc nécessaire d’évaluer ces technologies avant leur mise en œuvre.
Nous étudions dans cette thèse la fiabilité du VAC dans son ensemble, en nous concentrant sur les capteurs et le système de
communication. Pour cela, une analyse fonctionnelle a été réalisée pour le système VAC. Notre approche scientifique pour l'analyse de la
fiabilité du VAC a été structurée avec des méthodes combinant des approches quantitatives et qualitatives (telles que l'analyse fonctionnelle
interne et externe, l'analyse préliminaire des risques (APR) et l'analyse des modes de défaillance, de leurs effets et de leur criticité (AMDEC),
etc. Afin de prouver nos résultats, une simulation a été réalisée à l'aide de la probabilité d'analyse d'arbre de défaillance (ADD) et elle a été
réalisée pour valider l'approche proposée. Les données (taux d'échec) utilisées proviennent d'une base de données professionnelle concernant
le type de composants présentés dans le système. À partir de ces données, un modèle probabiliste de dégradation a été proposé. Le calcul de
probabilité a été effectué par rapport à un moment d'utilisation de référence. Par la suite, une analyse de sensibilité a été suggérée concernant
les paramètres de fiabilité et des propositions de restructuration ont été élaborées pour les composants.
CAV fournit des services de communication entre véhicules : véhicules à véhicules (V2V) ou avec infrastructures côté rue : véhicules à
infrastructures (V2I). La technologie des « Communications dédiées à courte portée » (DSRC : Dedicated Short Range Communications)
utilise plusieurs canaux pour fournir une variété d'applications de sécurité. Les applications de sécurité nécessitent des transmissions
appropriées et fiables, tandis que les applications non liées à la sécurité exigent des performances et une vitesse élevée. Aujourd’hui, la
diffusion de messages de sécurité de base (Basic safety message, BSM) est l’un des services fondamentaux des véhicules connectés. Pour
cela, un modèle analytique destiné à évaluer la fiabilité des services de diffusion V2V relatifs à la sécurité basée sur IEEE 802.11 dans le
système DSRC sur autoroute a été proposé. Enfin, une amélioration du modèle proposé a été faite afin d'accroître la fiabilité de la connexion
V2V, en tenant compte de nombreux facteurs tels que la portée de transmission, la densité du véhicule, la distance de sécurité sur l'autoroute,
le taux d'erreur de paquets, l'influence de bruit et les taux de défaillants pour les équipements de communications.
L'évaluation de ces problèmes conduit à une analyse de sensibilité liée aux paramètres de fiabilité, ce qui contribue à davantage
d'innovation dans les domaines de l'ingénierie automobile.
Mots clés : Véhicule autonome et connecté, Sureté de fonctionnement, fiabilité, BSM, DSRC, VANET, Réseaux sans fil, AMDEC, arbre
de défaillance.