deploy faster without failing faster - metrics-driven - dynatrace user groups - june 2015
TRANSCRIPT

@Dynatrace
- More on http://blog.dynatrace.com
- Dynatrace Free Trial: http://bit.ly/dttrial
(R)Evolutionize APM
Hosted by: Andreas Grabner - @grabnerandi
DevOps


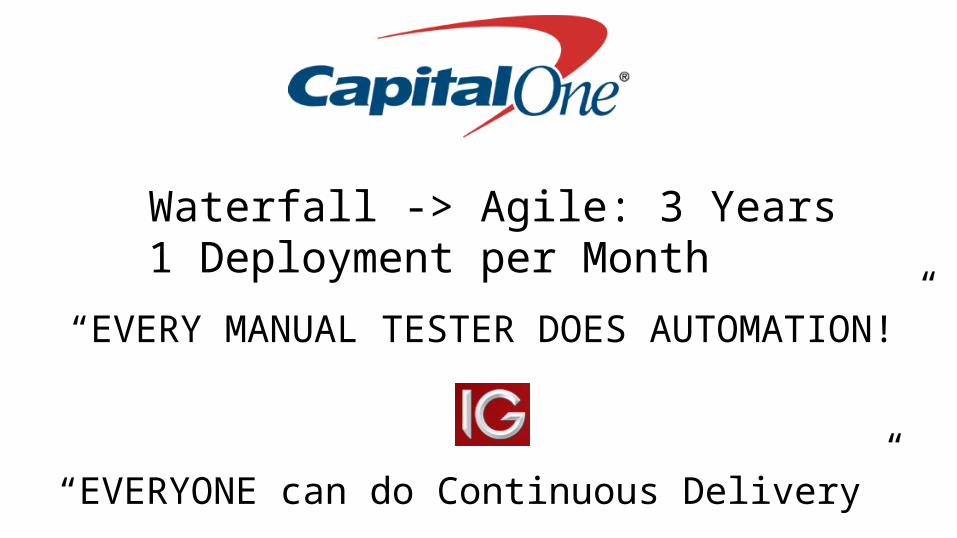
Waterfall -> Agile: 3 Years1 Deployment per Month
“EVERYONE can do Continuous Delivery”
“EVERY MANUAL TESTER DOES AUTOMATION!”


SO – Why did they do it?


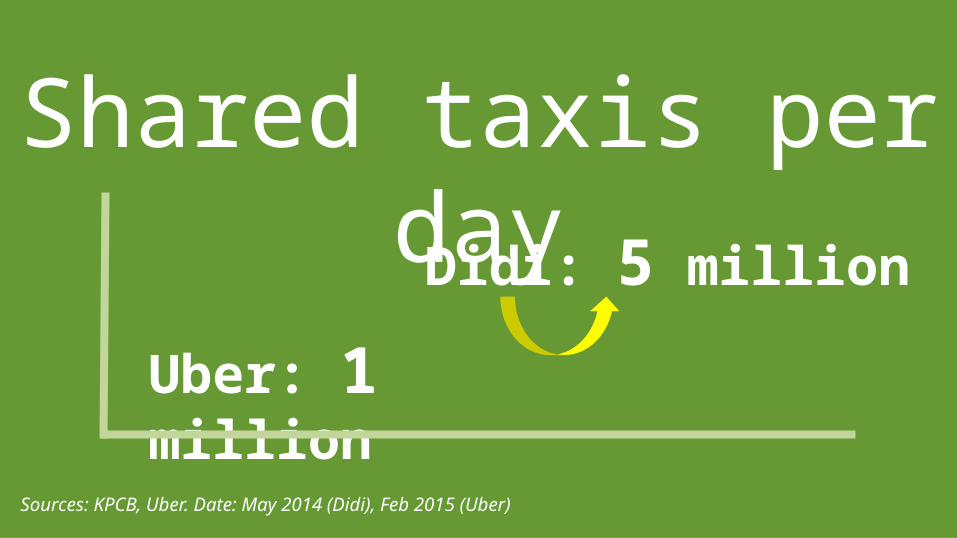
Uber: 1 million
Shared taxis per dayDidi: 5 million
Sources: KPCB, Uber. Date: May 2014 (Didi), Feb 2015 (Uber)

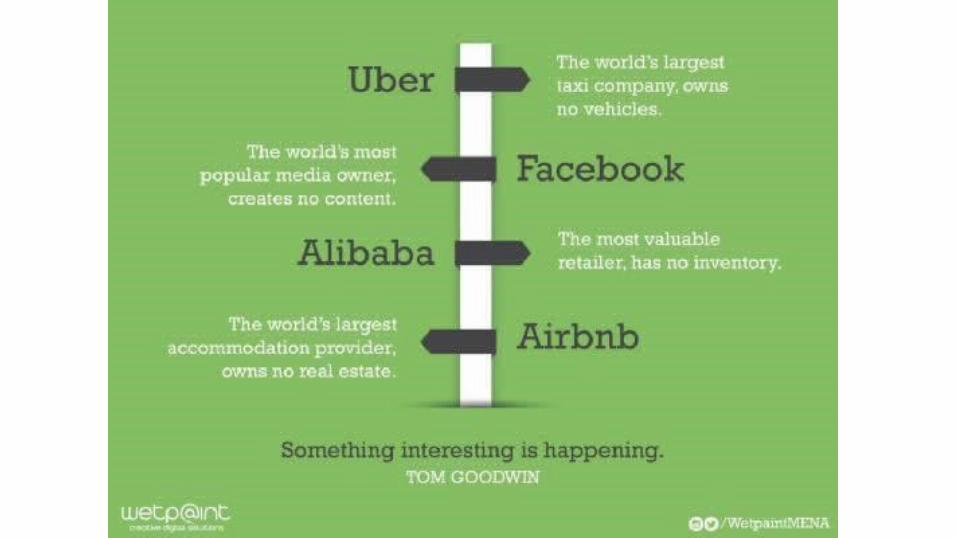
Rapidly Changing Markets,
Requirements & User Expectations

GOAL!
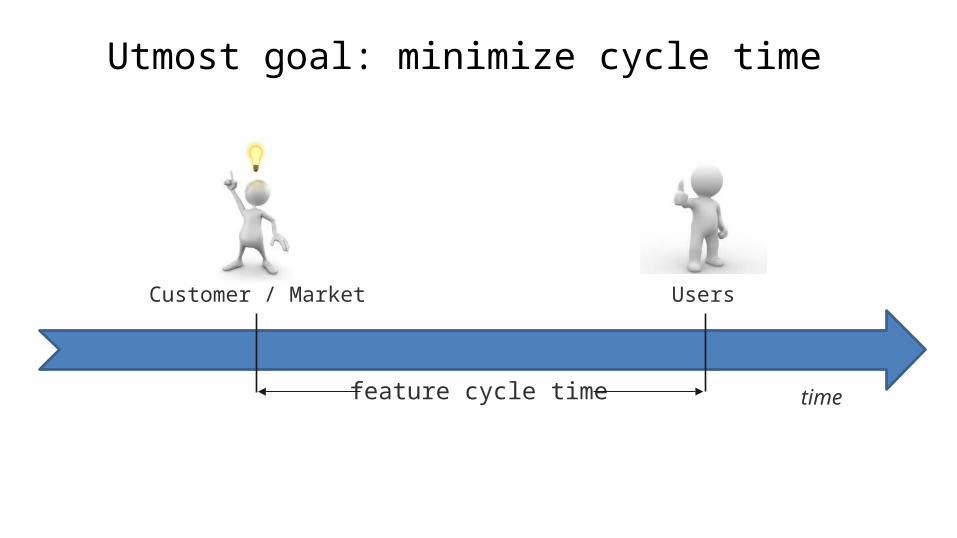
Utmost goal: minimize cycle time
feature cycle time time
Customer / Market Users

Utmost goal: minimize cycle time
feature cycle time time
minimize Users
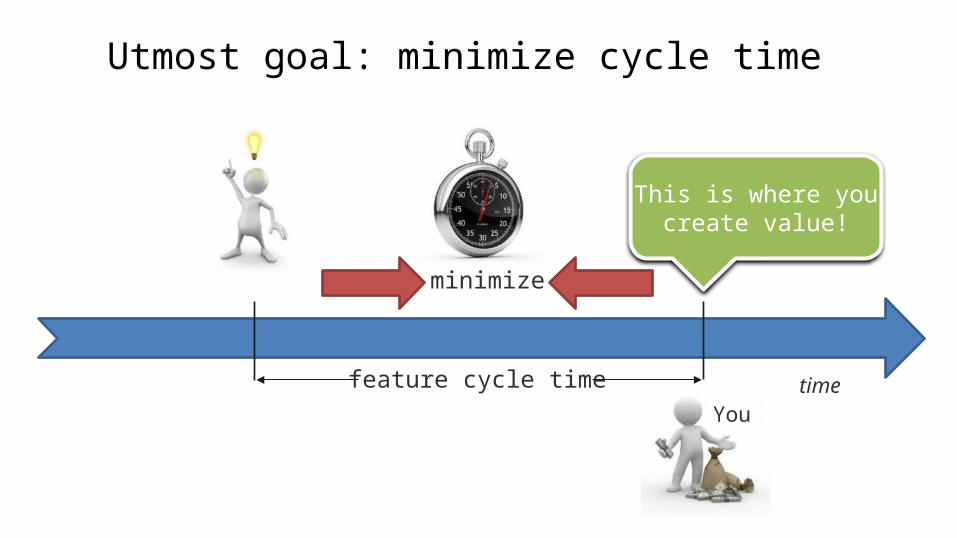
Utmost goal: minimize cycle time
feature cycle time time
This is where youcreate value!
minimize
You

ROI?

High Performers Are More Agile
30x 8,000xmore frequent deployments
faster lead times than their peers
Source: Puppet Labs 2013 State Of DevOps: http://puppetlabs.com/2013-state-of-devops-infographic
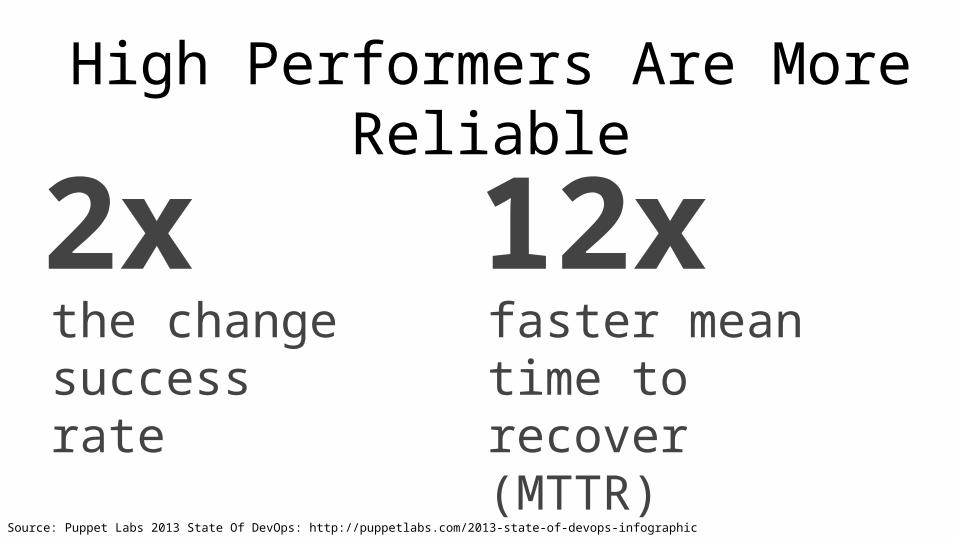
High Performers Are More Reliable
2x 12xthe change success rate
faster mean time to recover (MTTR)
Source: Puppet Labs 2013 State Of DevOps: http://puppetlabs.com/2013-state-of-devops-infographic

Challenges?

Deploy Faster!!

Fail Faster!!?

Right Focus?!
Metricsbased
Decisions!

Time of D
eployment
Availability dropped to 0%

Deployment Mistake!
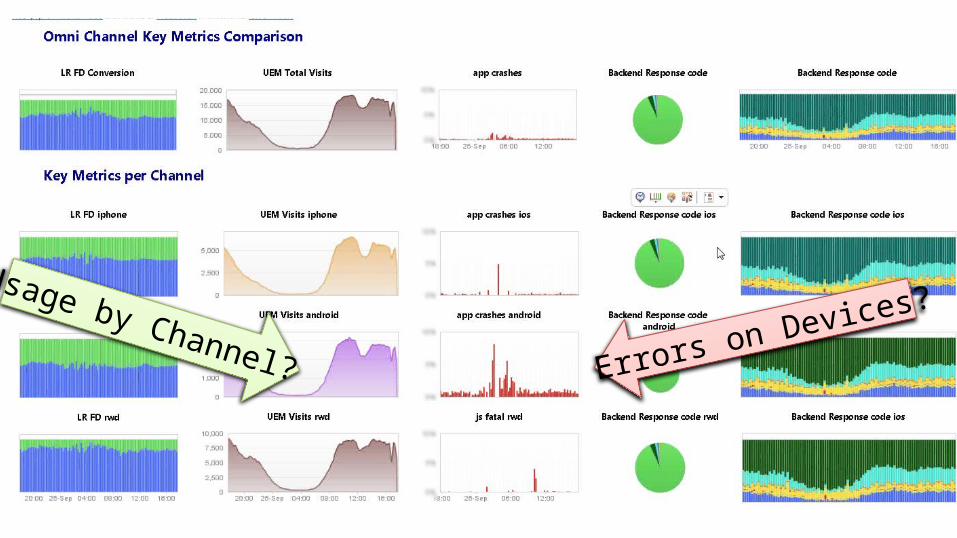
Usage by Channel? Errors on Devices?

Technical Debt!
80%$60B

Insufficient Focus on Quality

The “War Room”
Facebook – December 2012
The “War Room”
Facebook – December 2012


20%80%


Virtual War Room

Virtual NO War Room
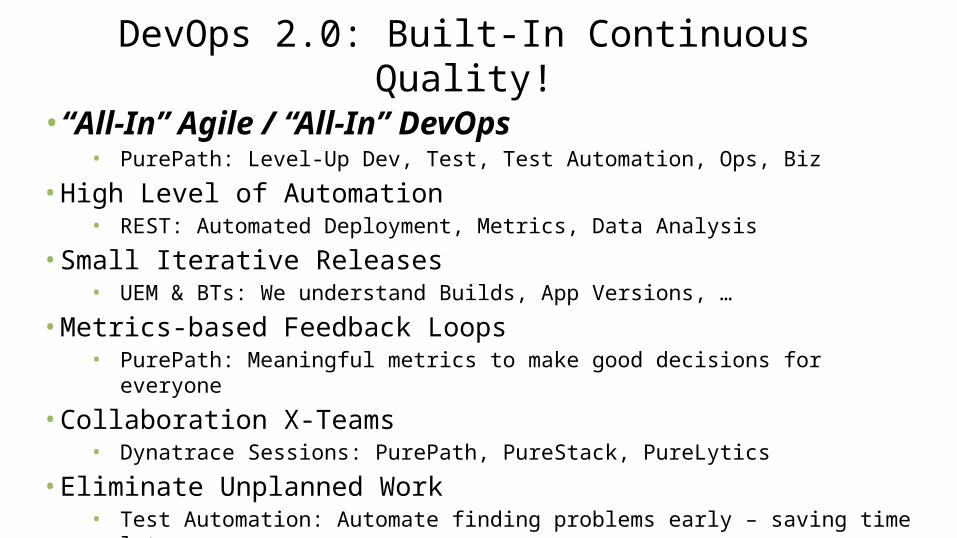
• “All-In” Agile / “All-In” DevOps• PurePath: Level-Up Dev, Test, Test Automation, Ops, Biz
• High Level of Automation• REST: Automated Deployment, Metrics, Data Analysis
• Small Iterative Releases• UEM & BTs: We understand Builds, App Versions, …
• Metrics-based Feedback Loops• PurePath: Meaningful metrics to make good decisions for everyone
• Collaboration X-Teams• Dynatrace Sessions: PurePath, PureStack, PureLytics
• Eliminate Unplanned Work• Test Automation: Automate finding problems early – saving time later
DevOps 2.0: Built-In Continuous Quality!
“All In” Agile / DevOps
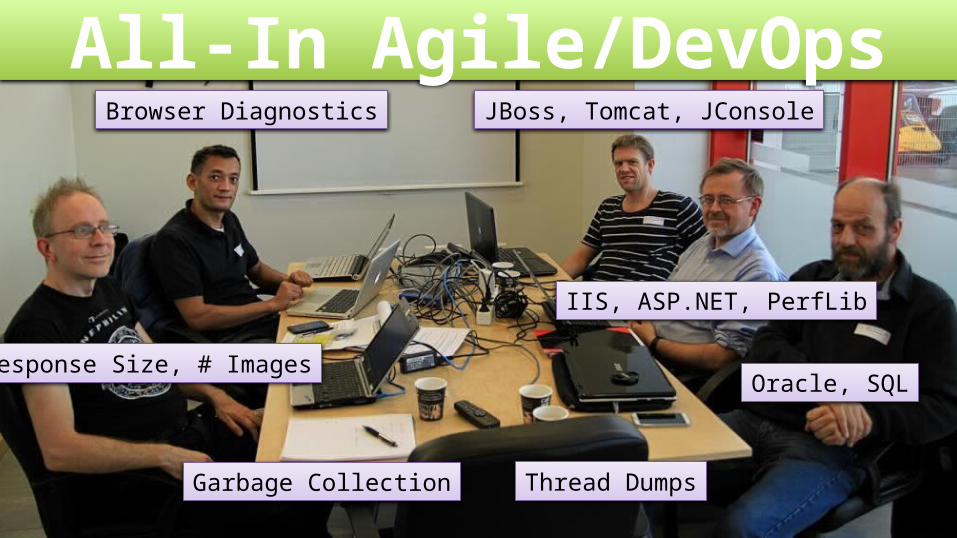
All-In Agile/DevOpsBrowser Diagnostics
Response Size, # Images
JBoss, Tomcat, JConsole
IIS, ASP.NET, PerfLib
Oracle, SQL
Garbage Collection Thread Dumps
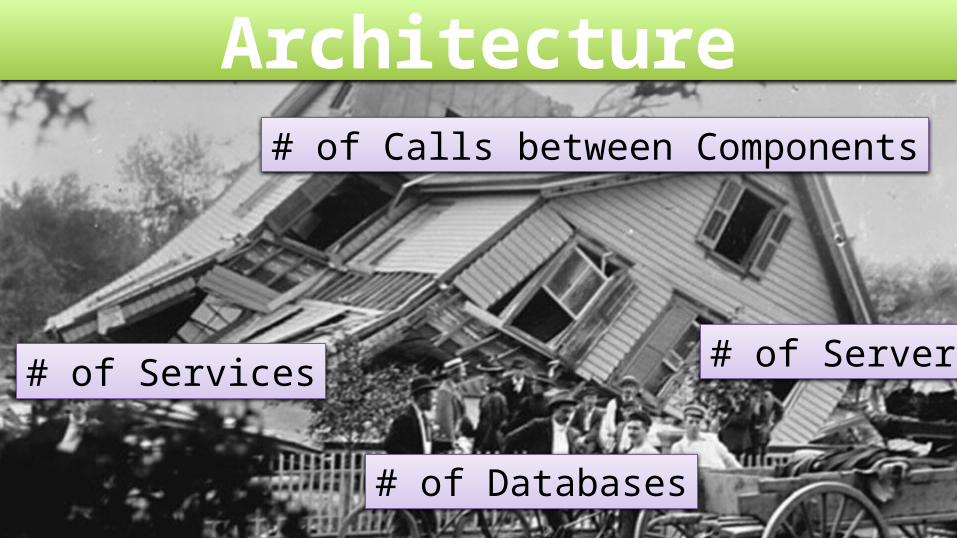
Architecture
# of Services
# of Databases
# of Servers
# of Calls between Components
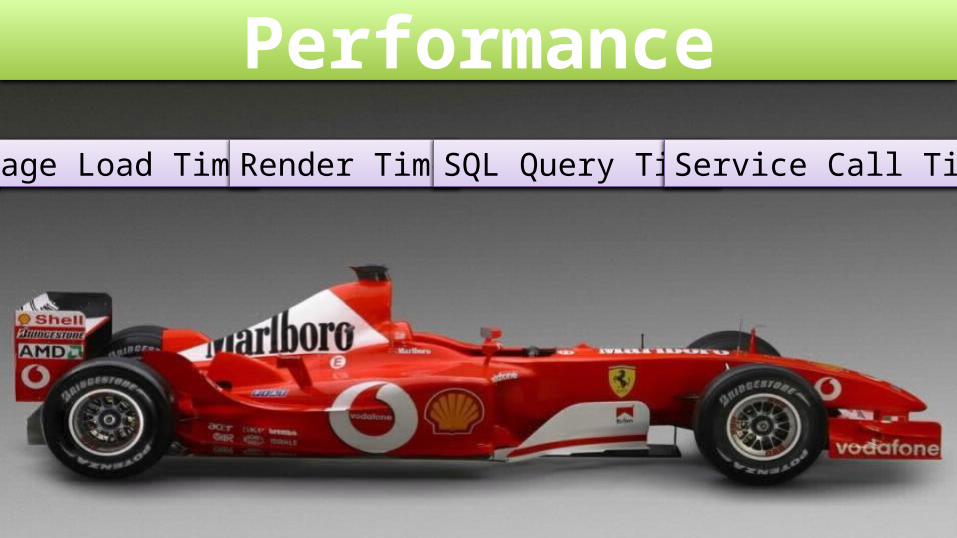
PerformancePage Load Time Render Time SQL Query Time Service Call Time
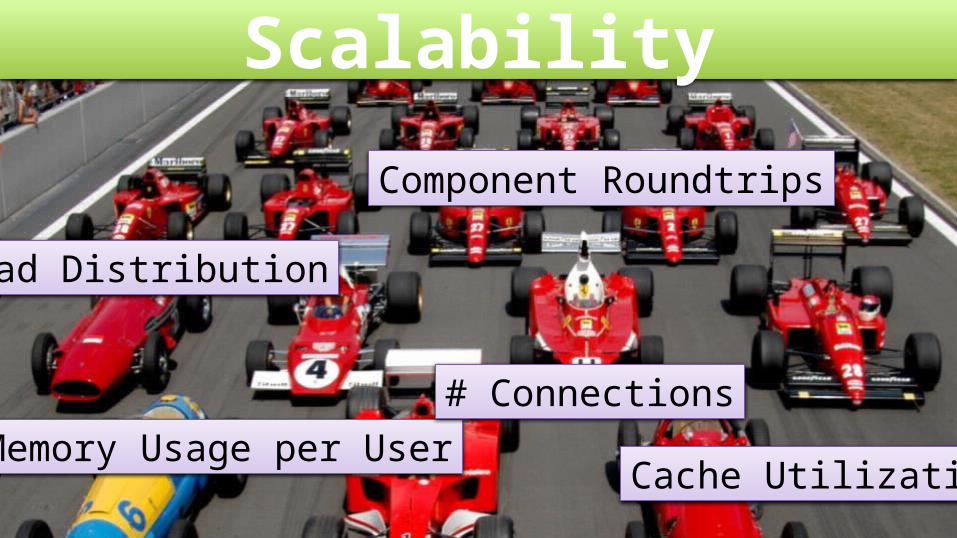
Scalability
Memory Usage per User# Connections
Cache Utilization
Load Distribution
Component Roundtrips
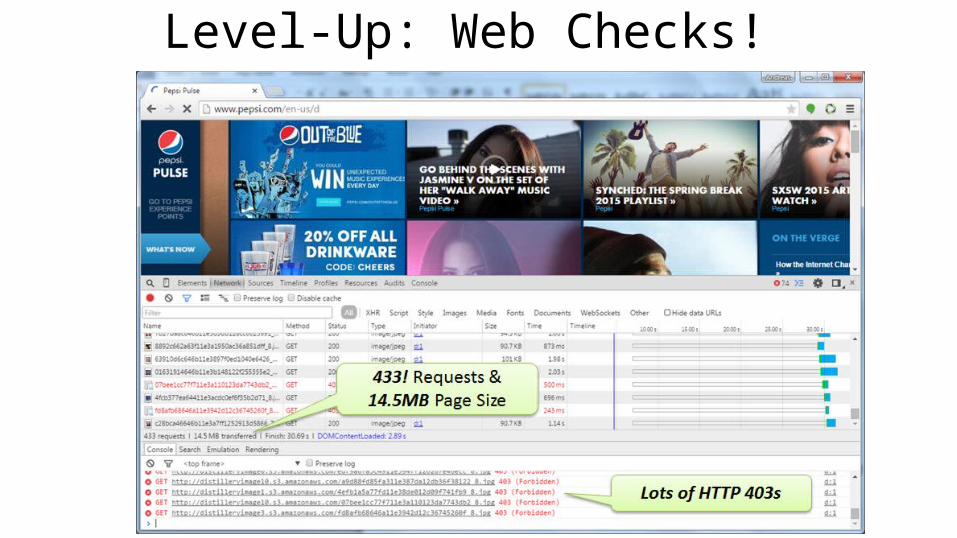
Level-Up: Web Checks!

Level-Up: Architectural Checks

Level-Up: End-To-End Checks

Level-Up: Share and Collaborate


Putting it into Continuous Deployment
12 0 120ms
3 1 68ms
Build 20 testPurchase OK
testSearch OK
Build 17 testPurchase OK
testSearch OK
Build 18 testPurchase FAILED
testSearch OK
Build 19 testPurchase OK
testSearch OK
Build # Test Case Status # SQL # Excep CPU
12 0 120ms
3 1 68ms
12 5 60ms
3 1 68ms
75 0 230ms
3 1 68ms
Test & Monitoring Framework Results Architectural Data
We identified a regresesion
Problem solved
Exceptions probably reason for failed testsProblem fixed but now we have an
architectural regressionProblem fixed but now we have an
architectural regressionNow we have the functional and architectural confidence
Let’s look behind the scenes
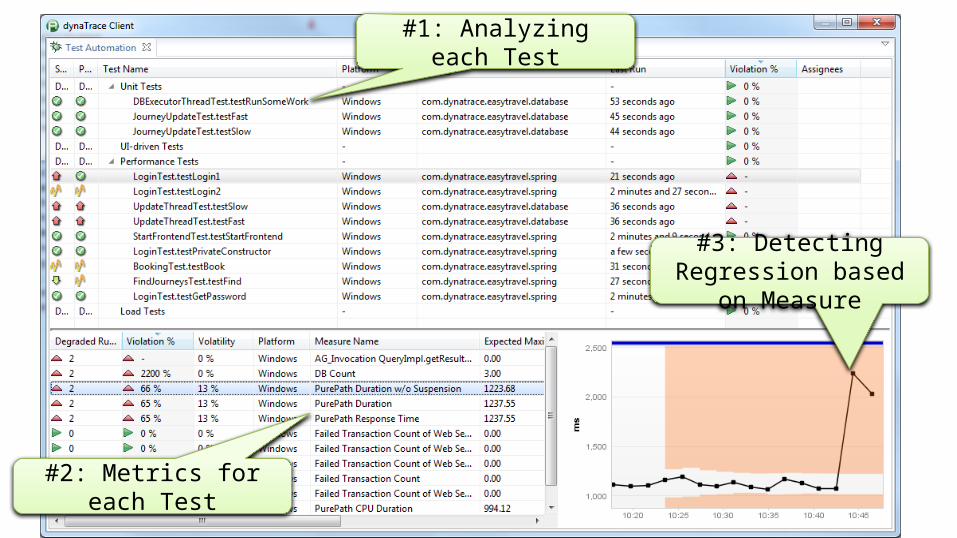
#1: Analyzing each Test
#2: Metrics for each Test
#3: Detecting Regression based on Measure


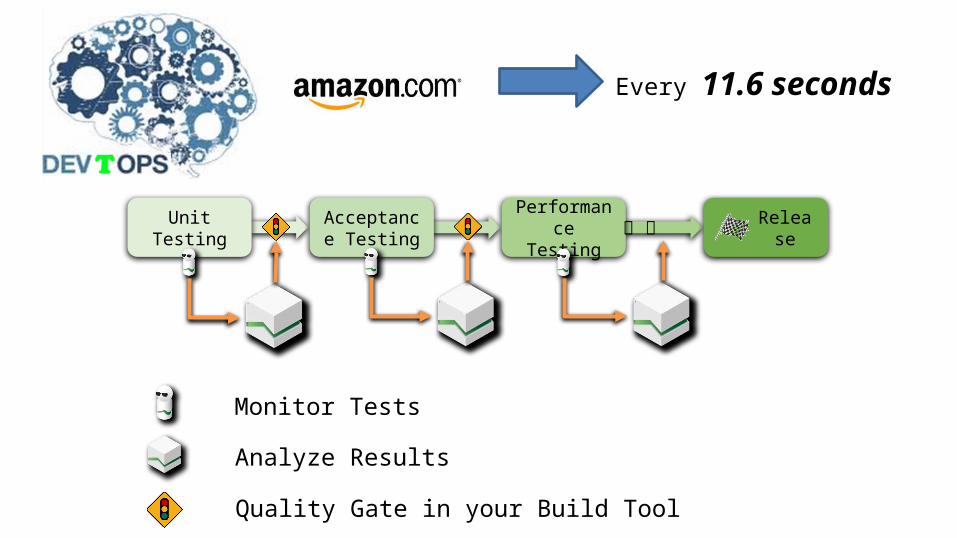
ReleaseAcceptance TestingUnit Testing Performance
Testing
Monitor Tests
Analyze Results
Quality Gate in your Build Tool
Every 11.6 seconds

Deploy Faster!!Without Failing!

$$
$$ $$
$$ $$
$$
$$

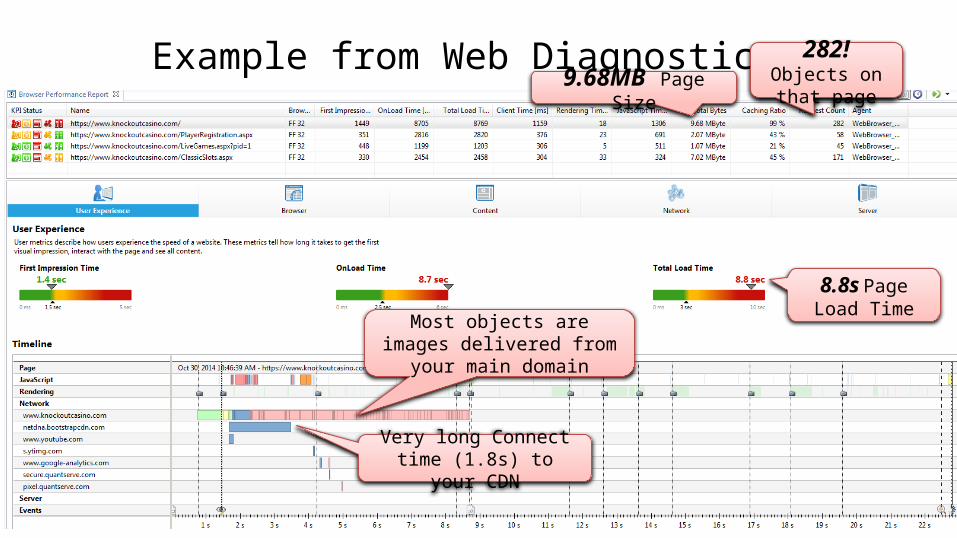
Example from Web Diagnostics 282! Objects on that page9.68MB Page Size
8.8s Page Load Time
Most objects are images delivered from your main
domain
Very long Connect time (1.8s) to your CDN
Online Performance Clinics
Every Other week @ bit.ly/onlineperfclinic

Your Benefits• Free Performance Review• Extended Dynatrace
License
“Share Your PurePath”
bit.ly/sharepurepathMy Benefits
• More blog material for next year
• Gratification that I could help you
68 @Dynatrace
Questions and/or Demo
Slides: slideshare.net/grabnerandi
Get Tools: bit.ly/dttrial
YouTube Tutorials: bit.ly/dttutorials
Contact Me: [email protected]
Follow Me: @grabnerandi
Read More: blog.dynatrace.com
69 @Dynatrace
Andreas GrabnerDynatrace Developer Advocate
@grabnerandi
http://blog.dynatrace.com