deposit system –estonia (epp)
TRANSCRIPT

1
Deposit System – Estonia (EPP)
28.01.2010 Vilnius, Lithuania
Various systems in the world
�Deposit�Non deposit or voluntary�Cash for cans�Green dot + cash for cans�Green dot + generic�Household and General mixedwaste stream�Combination of the above�None of the above

2
Deposit Systems used
� Norway
� Sweden
� Finland
� Denmark
� Iceland
� Netherlands
� Germany
� Slovenia
� Estonia
� Various USA states
In Europe more than 100 million people live in deposit system
countries as grand total
Facts
Environmental view – deposit systems can collect between 80-95%, conteiner
systems 40-60% as average.
Quality view – material coming from deposit systems are of highest value and
therefor guarantee 100% reusage of collected material
Consumer view – gives clear message and motivation to consumers, even non-
environmental consumers contribute
Social view – significant “after collection”, income for less fortunate people
Economical view – yes a bit more expensive, though also more effective in
terms of results

3
CAN recycling as an example
Material Quality issue –Deposit packaging PET

4
Material Quality issue –Non-deposit PET
Glas- Deposit system

5
Mixed glas from containers
Eesti Pandipakend (EPP) – since 2005
EPP is a producer responsibility organization
EPP organizes the nation-wide collection, reuse and recovery of
glass, plastic and metal packaging subject to deposit,
meaning packaging waste of soft drinks, beer, low-ethanol
alcoholic beverages, juice, juice concentrates and nectar
Acts in accordance with the accreditation of the Ministry of
Environment of Estonia (11.03.2005)

6
EPP shareholders
The Estonian Association of Brewers
The Estonian Association of Brewers
The Association of Producers of Soft Drinks
The Association of Producers of Soft Drinks
The Association of Importers of Soft Drinks and Beer
The Association of Importers of Soft Drinks and Beer
The Estonian Trade Association
The Estonian Trade Association
25%
25% 25%
25%
System participants
PACKAGING COMPANIES140 producers/importers
RETAILERS870 collection points+300 HoReCa (hotels, restaurants, cateringTotal 1170 collection points
7
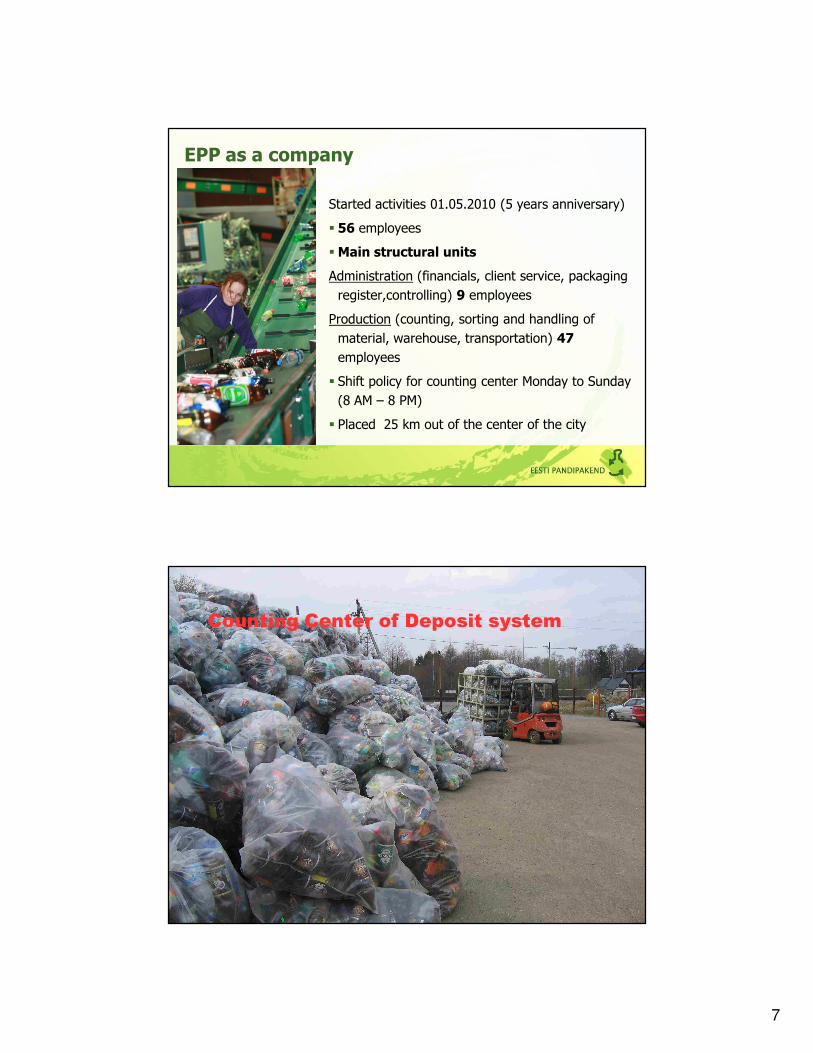
EPP as a company
Started activities 01.05.2010 (5 years anniversary)
� 56 employees
�Main structural units
Administration (financials, client service, packaging
register,controlling) 9 employees
Production (counting, sorting and handling of
material, warehouse, transportation) 47
employees
� Shift policy for counting center Monday to Sunday
(8 AM – 8 PM)
� Placed 25 km out of the center of the city
Counting Center of Deposit system

8
Counting Center of Deposit system
General data (1)
�Annual net revenue ca 17 million EUR (including deposit sum)
�Deposit values
1 EEK (glas, PET 1 l and more) ~ 0,064 EUR
0,50 EEK (CAN and 0,5 l PET) ~ 0,032EUR
�Collection structure
85% automated
15% manual
485 RVM machines, meaning reverse vending machines, meaning
package collection machines

9
General data (2)
Within 5 years we have collected 818 million oneway
packages
Return rates 2009
Oneway package2009
preliminary
Requirement by
law 2009
Sales, million units 255
Return, million units 187
PET plastic bottle return rate 90% 75%
CAN metal package return rate 56% 40%
OWG oneway glass return rate 87% 75%

10
Costs comparison
Conteiner collection multi-material recovery fees for sales packaging per kg
Material EEK/kg EUR/kg
Metal 4 0,2555911
Plastic 6,45 0,4121406
Glas 1,6 0,1022364
Service fees in Deposite sytem
If international EAN code used
Type of the Packaging/MaterialEEK per packaging
EUR per packaging
Average weight of packaging, kg
Service fee EEK/kg
Service fee EUR/kg
CAN metal 0,000 0 0,020 0 0
PET plastic bottle 0,470 0,030 0,037 12,702703 0,81167429
OWG-glas 0,470 0,030 0,300 1,5666667 0,10010650
Refill-glass 0,000 0,000 0,300
If country based EAN code used
Type of the Packaging/MaterialEEK per packaging
EUR per packaging
Average weight of packaging, kg
Service fee EEK/kg
Service fee EUR/kg
CAN metal 0,000 0 0,020 0 0
PET plastic bottle 0,390 0,025 0,037 10,540541 0,673517
OWG-glas 0,390 0,025 0,300 1,30000 0,0830671
Refill-glass 0,000 0,000 0,300
Main Keys to Success
Collection points – cooperation with retailers, RVM max useage (NB!
with efficient solutions, like pressing)
Packaging register – layer and foundation of the system, must be in
order and under constant work
Controlling – separate position, constant work through all the links of the
system (collection points, producer reports, transportation)
Production – automatization (minimum manpower, maximum
technology), constant optimization
Transportation – max efficient schemes, constant development, flexible
partners