depositional framework of the upper cretaceous mancos ... · chapter 10 depositional framework of...
TRANSCRIPT
Chapter 10
Depositional Framework of the Upper Cretaceous Mancos Shale and the Lower Part of the Upper Cretaceous Mesaverde Group, Western Colorado and Eastern Utah
By Ronald C. Johnson
Chapter 10 ofPetroleum Systems and Geologic Assessment of Oil and Gas in theUinta-Piceance Province, Utah and ColoradoBy USGS Uinta-Piceance Assessment Team
U.S. Geological Survey Digital Data Series DDS–69–B
U.S. Department of the Interior U.S. Geological Survey
Click here to return to Volume Title Page

U.S. Department of the Interior Gale A. Norton, Secretary
U.S. Geological Survey Charles G. Groat, Director
Version 1.0 2003
For sale by U.S. Geological Survey, Information ServicesBox 25286, Denver Federal CenterDenver, CO 80225
Any use of trade, product, or firm names in this publication is for descriptive purposes only and does not imply endorsement by the U.S. Government
Published in the Central Region, Denver, Colorado Manuscript approved for publication July 24, 2002
ISBN=0-607-99359-6

Contents
Abstract .......................................................................................................................................................... 1
Introduction ................................................................................................................................................... 1
Regional Tectonic Setting............................................................................................................................ 5
Stratigraphy and Depositional Setting of the Mancos Shale................................................................ 6
Stratigraphy and Depositional Setting of the Lower Part of the Mesaverde Group ......................... 8
Previous Studies on the Structural Development of the Douglas Creek Arch................................... 8 Overall Subsidence Trends During Deposition of the Mancos Shale and the Lowermost
Part of the Mesaverde Group ................................................................................................... 8
Subsidence and Infilling Patterns for Discrete Intervals in the Mancos Shale and the Lower Part of the Mesaverde Group..................................................................................... 10
Top of Dakota Sandstone to Base of Mancos “B” Interval ........................................................ 10
Base of Mancos “B” to Top of Castlegate Sandstone or Equivalent Interval ......................... 10
Subsidence and Sedimentation Patterns in the Northern Part of the Study Area .......................... 16
Top of Castlegate Sandstone and Equivalent to Top of Cozzette Member of Iles Formation and Equivalent....................................................................................................... 20
Discussion.................................................................................................................................................... 20
References Cited ........................................................................................................................................ 23
Plate
1. Detailed north-south cross section of interval from the Dakota Sandstone to the lower part of the Upper Cretaceous Mesaverde Group, Douglas Creek arch and western part of Piceance Basin.................................................................................................................................... 2
Figures
1. Map showing location of study area, Cretaceous seaway, and Sevier orogenic belt ......... 3
2. Map showing location of study area in western Colorado and eastern Utah ....................... 4
3. Stratigraphic chart of selected Upper Cretaceous and lower Tertiary units for the Uinta Basin, Piceance Basin, and Douglas Creek arch area, Utah and Colorado................ 5
4. Map showing seaward limits of regressive marine cycles in the lower part of the Upper Cretaceous Mesaverde Group ........................................................................................... 9
5–14. Isopach maps showing:5. Interval from the top of the Upper Cretaceous Dakota Sandstone to the top of the
Upper Cretaceous Castlegate Sandstone............................................................................ 11
III

6. Interval from the top of the Upper Cretaceous Dakota Sandstone to the base of the Mancos “B” zone of the Upper Cretaceous Blue Gate Member of the Mancos Shale ............................................................................................................. 12
7. Interval A of the lower part or pre-Mancos “B” part of the Upper Cretaceous Blue Gate Member of the Mancos Shale....................................................................... 13
8. Interval B of the lower part or pre-Mancos “B” part of the Upper Cretaceous Blue Gate Member of the Mancos Shale....................................................................... 14
9. Interval C of the lower part or pre-Mancos “B” part of the Upper Cretaceous Blue Gate Member of the Mancos Shale....................................................................... 15
10. Interval from the base of the Mancos “B” zone of the Upper Cretaceous Blue Gate Member of the Mancos Shale to the top of the Upper Cretaceous Castlegate Sandstone........................................................................................................ 16
11. Interval D or lowermost interval of the Mancos “B” zone of the Upper Cretaceous Blue Gate Member of the Mancos Shale ....................................................................... 17
12. Interval E of the Mancos “B” zone of the Upper Cretaceous Blue Gate Member of the Mancos Shale.......................................................................................................... 18
13. Interval F of the Mancos “B” zone of the Upper Cretaceous Blue Gate Member of the Mancos Shale .......................................................................................................... 19
14. Interval from the top of the Upper Cretaceous Castlegate Sandstone to the top of the Upper Cretaceous Cozzette Sandstone Member of the Mesaverde Formation or Group or Iles Formation in the lower part of the Mesaverde Group............................................................................................................... 21
IV

Depositional Framework of the Upper Cretaceous Mancos Shale and the Lower Part of the Upper Cretaceous Mesaverde Group, Western Colorado and Eastern Utah
By Ronald C. Johnson
Abstract
A detailed history of subsidence and of infilling patterns for part of the Upper Cretaceous Rocky Mountain foreland basin is revealed in this detailed subsurface study of the Mancos Shale and the lower part of the Mesaverde Group in western Colorado and eastern Utah. Rates of subsidence during deposition of the Mancos Shale increased toward the north and northwest, apparently toward a deep trough that formed along the east edge of an area of active thrusting within the Sevier orogenic belt in southwestern Wyoming. A relatively stationary, south- to southeast-sloping subsea ramp developed in this trough while accommodation space was being rapidly created due to thrust loading. Discrete intervals deposited on this ramp are lobate in form, with successive lobes apparently occupying topographic depressions developed during deposition of the previous lobe.
At about the beginning of Campanian time (Late Creta-ceous), a marine shelf prograded from south to north across the southern part of the study area where rates of subsidence were comparatively low. Sediments deposited on this prograding shelf were apparently derived from the south, although previ-ous studies have shown that the top of the shelf was subjected to west- to east-moving currents. This shelf eventually merged with a stationary ramp structure in the northern part of the study area and progradation stopped. Sandstone deposits built up within the topographic low between the south- to southeast-sloping stationary ramp on the north and the north-sloping shelf on the south.
The rate of subsidence decreased in the area of the sta-tionary ramp in middle to late Campanian time, and the deep trough was then filled with sediments eroded from the high-lands to the northwest. This was followed by a period of shoreline progradation from northwest to southeast represented by a series of regressive marine cycles in the lower part of the Mesaverde Group.
New subsidence patterns began to develop during this period of shoreline progradation in the late Campanian. Rates of subsidence increased towards the east and northeast in the eastern part of the study area. These trends are similar to subsidence trends that developed later during the Laramide deformation in the Piceance Basin, however, the west-thrusted
Laramide White River uplift, which forms the east margin of the Piceance Basin, was not actively rising at this time; thus it is unlikely that thrust loading caused this early stage of subsidence. This area of rapid subsidence may be part of a much larger downwarp, centered in the Hanna Basin area of south-central Wyoming, that developed in Late Campanian and Maastrichtian time.
Introduction
The purpose of this report is to present the results of a detailed study of subsidence and deposition within that part of the Rocky Mountain foreland basin that lay in western Colo-rado and eastern Utah (figs. 1, 2). Stratigraphic units studied include the Upper Cretaceous Mancos Shale and the lower part of the overlying Upper Cretaceous Mesaverde Group, a succession of strata as much as 6,500 ft thick. This is the first study to address the entire Mancos and lower part of the Mesaverde interval (fig. 3).
Geophysical logs were examined throughout the study area, and several detailed cross sections (one is shown on pl. 1) and isopach maps were constructed using these logs. The principal method of correlation was to trace distinctive patterns of the resistivity curves on electric logs. In low-resistivity shales such as the Mancos Shale, these patterns are most recognizable on the conductivity curves and can generally be correlated throughout the study area, particularly where well spacing is less than 3–4 mi. Asquith (1970) attributed these patterns to variations in bentonite content from volcanic ash and used such variations to establish time-stratigraphic correla-tions in the Cretaceous shales of Wyoming. A large number of correlation lines are shown on the cross section on plate 1, some of which could be recognized in nearly all wells, whereas others could be recognized only locally. Four general lithologies are shown on the cross section: (1) sandstone, (2) interbedded sandstone, siltstone and shale, (3) shale, and (4) calcareous shale. American Stratigraphic Company (AMSTRAT) sample description logs and mud logs were available for some of the wells shown, and these were used to calibrate geophysical log responses and generate the litholo-gies shown.
1

2 Petroleum Systems and Geologic Assessment of Oil and Gas in the Uinta-Piceance Province
Click on image below to bring up high-resolution image of plate 1.
Plate 1. Detailed north-south cross section of interval from the Dakota Sandstone to the lower part of the Upper Cretaceous Mesaverde Group, Douglas Creek arch and western part of Piceance Basin.

Depositional Framework of the Upper Cretaceous Mancos Shale and the Lower Part of the 3 Upper Cretaceous Mesaverde Group, Western Colorado and Eastern Utah
CR
ETAC
EOU
SEPEIR
ICS
EA
SEV
IER
OR
OG
ENIC
BELT
GULF
OF MEXICO
ATLANTI
C
OCE
AN
PAC
IFIC
OC
EAN
MEXICO
CANADA
AR
CTIC O
CEAN
GREENLANDALASKA
0 500 Miles
CUBA
Studyarea
Wasatchculmination
Figure 1. Locations of study area, Cretaceous seaway, and Sevier orogenic belt. Areas above sea level shaded green.
4 Petroleum Systems and Geologic Assessment of Oil and Gas in the Uinta-Piceance Province
Outcrops of UpperCretaceous rocks
36°
37°
38°
39°
40°
41°112° 111° 110° 109° 108° 107° 106°
0 50 100 150 200 Miles
Area of isopach maps shown in figures 5, 6, 10, and 14
Area of isopach maps shownin figures 7–9 and 11–13
White
River uplift
Piceance
Basin
Uinta Basin
Uinta uplift
Sev
ier
oro
gen
icb
elt
San
Raf
ael S
wel
l
Uncompahgre
uplift San Juan volcanic field
COLORADOUTAH
ARIZONANEW MEXICO
San Juan Basin
Figure 2. Location of study area in western Colorado and eastern Utah. Areas of isopach maps (figs. 5–14) are shown.

Depositional Framework of the Upper Cretaceous Mancos Shale and the Lower Part of the 5 Upper Cretaceous Mesaverde Group, Western Colorado and Eastern Utah
Offshore lacustrineshale
Marginal lacustrine
Fluvial (Tertertiary)
Fluvial (Cretaceous)
Coastal plain
Shoreface
Marine shale
Braided stream
Sandy marine shale
EXPLANATION
Selected WesternInterior zone
fossils
Selected WesternInterior zone
fossils
Age inm.y.
Age inm.y.Age Age
Hiatus
CE
NO
ZO
IC (
par
t)
TE
RT
IAR
Y (
par
t)
PALE
OC
EN
E
Ear
lyLa
te
EO
CE
NE
Ear
lyM
idd
leL a
t e
Olig
.
E.
Castlegate Sandstone
Lower Castlegate
Bluecastle Tongue
Blackhawk Fm.
Emery Ss. Mbr.
Blue Gate Member of Mancos Shale
Blue Gate Member of Mancos Shale
Mancos "B" interval of Kopper (1962)
Sego Ss.Neslen Fm.
Tuscher and Farrer Fms.
Ferron Ss. Mbr.of Mancos Shale Frontier Formation
Mowry Shale
Dakota and Cedar Mountain Formations
RollinsSs. Mbr.
Hunter Canyon and Mount Garfield Fms
Cameo zone
Dark Canyon beds Unnamed Paleocene conglomerates
Wasatch and Fort Union Fms.
Cow Ridge Mbr.
o. m.
Base of R-4 zone
Top of Mahogany oil-shale bed
c. m.
Base of R-4 oil-shale zone
Parachute Creek Member
Douglas Creek Member
l. p.
Flagstaff Limestone Member
San Rafael Swell
Douglas Creek arch
Wasatch Formation
Price River Fm.
Duchesne River and UintaFormations
Uinta Fm.
B. clinolobatusB. baculusB. reesideiB. compressusB. jenneyiD. nebrascenseB. scottiB. perplexus (late)B. perplexus (early)B. obtususS. hippocrepis III
S. hippocrepis I
C. choteauensis
D. albertense
S. depressusS. preventricosus
S. warreni
A. amphibolumA. granerosenseN. americanusN. cornutus
40
45
50
55
60
65
70
75
80
85
90
95
ME
SO
ZO
IC (
par
t)
CR
ETA
CE
OU
S (
par
t)
Late
Cen
.Tu
r.C
amp
ania
nM
aast
.
Colton Formation
North HornFormation
Co
n.S
ant.
Tununk and Juana Lopez Mbrs. of Mancos Sh.
Buck Tongue
Mes
aver
de G
roup
Piceance Basin
Douglas Creek archUinta Basin
l. p.
CE
NO
ZO
IC (
par
t)
TE
RT
IAR
Y (
par
t)
PALE
OC
EN
E
Ear
lyLa
te
EO
CE
NE
Ear
lyM
idd
leL a
t e
Olig
.
E.
B. clinolobatusB. baculusB. reesidei
B. compressusB. jenneyi
D. nebrascenseB. scotti
B. perplexus (late)B. perplexus (early)B. obtusus
S. hippocrepis III
S. hippocrepis I
C. choteauensis
D. albertense
S. depressusS. preventricosus
S. warreni
A. amphibolumA. granerosense
N. americanusN. cornutus
40
45
50
55
60
6565.4
7071.3
83.5
86.3
88.7
93.3
75
80
85
90
95
ME
SO
ZO
IC (
par
t)
CR
ETA
CE
OU
S (
par
t)
Late
Cen
.Tu
r.C
amp
ania
nM
aast
.C
on
.San
t.
Figure 3. Stratigraphic chart of selected Upper Cretaceous and lower Tertiary units for the Uinta Basin, Piceance Basin, and Douglas Creek arch area, Utah and Colorado. Abbreviations: o. m., orange marker; c. m., carbonate marker; l. p., Long Point Bed.
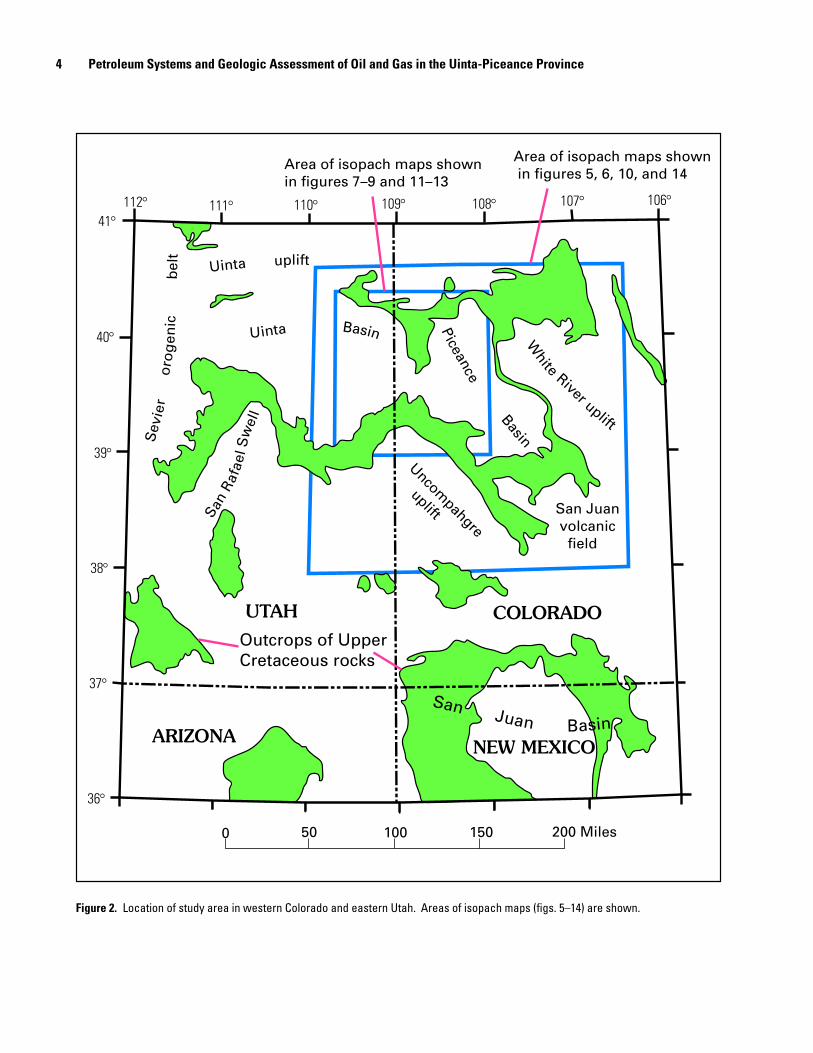
Two sets of isopach maps were generated (fig. 2). The first set (figs. 7–9, 11–13) are regional isopach maps for thick intervals in the Mancos Shale and the lower part of the Mesaverde Group that were defined using a combination of geophysical log markers, surface stratigraphic information, and fossil information. These maps cover the entire study area and are used to study regional subsidence trends and general patterns of infilling. The second set of isopach maps (figs. 5, 6, 10, 14) is of thinner intervals within the Mancos Shale defined using distinctive resistivity log variations. These isopach maps cover a limited area around the Douglas Creek arch (fig. 2) where abundant drill-hole data are available for detailed geophysical log correlations.
Regional Tectonic Setting
The Rocky Mountain foreland basin, a continent-long area of downwarping that stretched from the arctic to Mexico, developed as a result of active thrusting along the Sevier orogenic belt to the west (fig. 1). Deposition of the uppermost part of the Mancos–lower Mesaverde interval, how-ever, appears to overlap in time with the early stages of the
Laramide orogeny in the area. Beginning in latest Cretaceous time, rising Laramide uplifts segmented the central part of the foreland basin, from Montana to New Mexico, into smaller, discrete basins. The study area includes most of the Piceance Basin in western Colorado, the eastern part of the Uinta Basin in eastern Utah, and the Douglas Creek arch that separates the two basins (fig. 2).
The Sevier orogeny was characterized by eastward thrust-ing along the Sevier orogenic belt. Thrusting occurred in response to active subduction along the west margin of the North American continent. Subsidence, related to thrust loading (Price, 1973; Jordan, 1981; Beaumont, 1981; Beck, 1985; Beck and others, 1988) and possibly subduction-induced mantle flow (Mitroveca and others, 1989; Gurnis, 1992; Stern and Holt, 1994; Pysklywec and Mitrovica, 1998, 2000), cre-ated the Rocky Mountain foreland basin east of the thrust belt. The response to thrust loading is generally considered as geologically nearly instantaneous (Jordan, 1981), thus it is generally assumed that the history of active thrusting can be studied by examining the subsidence histories of adjacent sedimentary basins.
Thrusting began in the western part of the orogenic belt and generally progressed eastward with time. Maximum struc-tural and topographic relief occurred along the older, western

6 Petroleum Systems and Geologic Assessment of Oil and Gas in the Uinta-Piceance Province
part of the thrust belt in large part because of repeated periods of passive uplift and the further displacement of older thrust sheets riding “piggy back style” on the hanging walls of younger thrust sheets (DeCelles, 1994). Thrusting along the Sevier orogenic belt is generally thought of as “thin skinned” because of the low angle of the thrust faults and because the thrusting generally does not involve Precambrian crystalline rocks. This is particularly true in the eastern, younger part of the thrust belt; however, Precambrian basement is clearly involved in some of the older thrusts to the west. A cross section constructed by DeCelles (1994) across the western part of the thrust belt in north-central Utah, in an area known as the Wasatch culmination (fig. 1) that consists of thickly stacked thrust sheets, clearly indicates considerable involvement of Precambrian crystalline rocks in the thrusting.
The Wasatch culmination is immediately northwest of the study area (fig. 1) and undoubtedly had a profound impact on strata of the Mancos Shale and Mesaverde Group. Accord-ing to DeCelles (1994, p. 53), the Wasatch culmination has amassed about 25 km (16 mi) of structural relief by Paleocene time and produced at least 50 times more sediment than was eroded off the frontal, younger parts of the thrust sheets. DeCelles also suggested that topographic relief averaged sev-eral kilometers, with a maximum of about 5 km (3 mi); by contrast, topographic relief along the younger, eastern thrusts was generally less than about a kilometer.
The Laramide orogeny, which is characterized by “thick skinned” deformation manifested by reverse faults extending deep into basement rocks, affected only the central part of the Rocky Mountain region. In this area, rising Laramide uplifts divided the foreland basin into smaller Laramide basins from latest Cretaceous through Eocene time, including the Uinta and Piceance Basins. Several tectonic models related to changes in subduction along the western margin of the North American continent have been proposed to explain why compressional forces of the Laramide were concentrated in a fairly restricted area of the central Rocky Mountain region. The style of deformation appears to have occurred during a time of unusually rapid convergence between the Farallon and North American plates (for summaries, see Hamilton, 1988; Beck and others, 1988).
The deep troughs of Laramide basins typically developed adjacent to thrust-bounded uplifts, and thrust loading has been proposed as the principal mechanism for inducing subsidence (Beck, 1985; Beck and others, 1988). A deep trough formed to the south of the southward-thrusting Laramide Uinta uplift, creating the Uinta Basin while the deep trough of the Piceance Basin formed adjacent to the west-thrusting White River uplift (fig. 2). Evidence presented here suggests, however, that the deep trough of the Piceance Basin began to form prior to the onset of uplift on the White River uplift, casting doubt on the thrust-loading mechanism for all of the downwarping that occurred in that as well as other Laramide basins. The problems with attributing all subsidence in Laramide basins to thrust loading have been pointed out in the past (see Keefer, 1970, p. D28).
Stratigraphy and Depositional Setting of the Mancos Shale
The Mancos Shale is the name given to an Upper Creta-ceous, largely marine shale that is many thousands of feet thick in western Colorado and eastern Utah (fig. 3). The formation is part of a widespread sequence of thick Upper Cretaceous marine shales that blanket the entire Western Interior of North America. The Mancos overlies the Upper Cretaceous Frontier Formation, where the Frontier is recognized in the study area. Elsewhere, the Mancos Shale overlies the Mowry Shale or Dakota Sandstone (Molenaar and Wilson, 1990; Molenaar and Cobban, 1991). The Mancos Shale intertongues with mar-ginal-marine rocks in the overlying Mesaverde Group.
The Mowry Shale is a distinctive organic-rich, hard, dark-gray, siliceous mudstone with abundant fish scales and benton-itic layers that was deposited after a major transgression of the Cretaceous seaway in late Albian time (Burtner and Warner, 1984). The Mowry grades into nonmarine rocks of the Dakota Sandstone in the southwestern part of the study area (Molenaar and Cobban, 1991, plate 1, C-C'). This transition occurs between wells 3 and 4 on the detailed cross section (pl. 1). To the northeast, the Mowry thickens to nearly 300 ft (Burtner and Warner, 1984; Molenaar and Wilson, 1990).
Four members of The Mancos Shale are recognized in the study area, in ascending order: (1) the Tununk Member, (2) the Juana Lopez Member, (3) the Blue Gate Member, and (4) the Buck Tongue. The Tununk and Juana Lopez Mem-bers consist largely of offshore marine shales except for the Coon Springs Sandstone bed of the Tununk Member, which is a marine shelf to coastal sandstone (Molenaar and Cobban, 1991). The Tununk and Juana Lopez Members are recognized mainly in the central part of the study area (pl. 1, well 11), whereas the name Frontier Formation is generally applied to this interval in the northern part of the study area (Molenaar and Cobban, 1991, pl. 1) and in the southeastern part (Sharp, 1963). The age of the Tununk and Juana Lopez Members and equivalent Frontier Formation is upper Cenomanian to upper Turonian (Molenaar and Cobban (1991). The Blue Gate Member is by far the thickest member of the Mancos Shale and extends from the top of the Juana Lopez Member or equivalent Frontier Formation to the base of the Castlegate Sandstone (fig. 3; pl. 1). The Buck Tongue extends from the top of the Castlegate Sandstone to the base of the Sego Sandstone.
The Blue Gate Member of the Mancos Shale consists largely of offshore marine shales; however, a sandy interval occurs in the middle part (fig. 3; pl. 1). In geophysical logs the base of the sandy interval is marked by an abrupt shift from low-resistivity shale below to higher resistivity silty and sandy shales above. This interval, which was originally referred to as the Mancos “B” zone of the Mancos Shale by Kopper (1962) and later as the Mancos B Formation by Kellogg (1977), is shown on the detailed cross section (pl. 1). Most recently, the Mancos “B” of Kopper (1962) and Kellogg (1977) was

Depositional Framework of the Upper Cretaceous Mancos Shale and the Lower Part of the 7 Upper Cretaceous Mesaverde Group, Western Colorado and Eastern Utah
included in the Prairie Canyon Member of the Mancos Shale of Cole and others (1997), who then subdivided that member into lower, middle, and upper parts. The top of the middle part corresponds approximately to the top of the Mancos B Forma-tion as used by Kellogg (1977). Thus, the Prairie Canyon Member as defined by Cole and others (1997) includes a considerable thickness of strata above the Mancos B of Kel-logg (1977). The Mancos B Formation of Kellogg (1977) and the Prairie Canyon Member of Cole and others (1997), however, occur entirely within the Blue Gate Member of the Mancos Shale. Such units are therefore considered in the pres-ent report to be informal zones within the Blue Gate Member.
Kellogg (1977) interpreted the Mancos “B” zone to have been deposited in an offshore marine environment about 100 mi east of the generally north-south trending Cretaceous shore-line during deposition of the Emery Sandstone Member of the Mancos Shale farther to the west (fig. 3). Paleontological data obtained during later studies indicate that the age of the Mancos “B” interval may be latest Santonian to late-early Campanian (Fouch and others, 1983; Chan and others, 1991; Cole and others, 1997) and hence may overlap in age with only the uppermost part of the Emery Sandstone Member. Much of the Mancos “B” interval may instead correlate with the lower part of the overlying Blackhawk Formation, which overlies the Emery farther to the west. Many previous workers have suggested various detailed correlation schemes between the Mancos “B” interval and Emery Sandstone and Blackhawk Formation (Kellogg, 1977; Fouch and others, 1983; Swift and others, 1987; Chan and others, 1991; Taylor and Lovell, 1995; Pattison, 1995; Hampson and others, 1999), but these efforts have been hindered by poor exposures, a lack of correlatable units, and poor biostratigraphic control (see Hampson and others, 1999, fig. 14).
Kellogg (1977, p. 171–172) subdivided the Mancos “B” into five intervals that he labeled A through E in ascending order on a generalized cross section (his fig. 3). Only three of the five subdivisions that could be identified with certainty are labeled on the detailed cross section on plate 1. Kellogg (1977) recognized that the Mancos “B” interval was deposited on an east-west-trending northward-prograding “fore slope” that trended nearly perpendicular to the shoreline to the west. The slope prograded from south to north, suggesting to Kel-logg (1977) that sediment transport was also from south to north, although he suggested that the source area may have been to the west or southwest. This northward progradation of the Mancos “B” interval can be seen on his south to north cross section drawn along the Douglas Creek arch (Kellogg, 1977, fig. 3). Based on isopach maps, Kellogg (1977, p. 172) suggested that this foreslope maintained a gradient of 20–40 ft/mi during deposition of his Unit A and lower part of Unit B; subsequently there was an abrupt decrease in the angle. Kellogg (1977) also recognized the sharp nature of the lower contact of the Mancos “B” with the underlying lower part of the Mancos Shale. On geophysical logs the base of the Mancos “B” interval is marked by an abrupt shift from low-resistivity shale below to higher resistivity silty and sandy
shales above. Kellogg (1977) defined the top of the Mancos “B” interval as the base of a widespread silty zone called the “silt marker.” The silt marker could be identified on some of the well logs shown on plate 1.
In the northernmost part of the study area, there is no change to silty and sandy shale above the base of the Mancos “B” interval, and the basal surface is difficult to trace. The electric log markers in the interval that appears to correlate with the Mancos “B” interval diverge to the north and do not display the south to north progradation that is typical of the Mancos “B” farther to the south (pl. 1). Kellogg (1977) recognized this difference and suggested that erosion may have occurred in this area during deposition of the Mancos “B” interval, creating an east-west-trending topographic low. Kel-logg (1977, p. 172) pointed out that one of the sandiest parts of the Mancos “B” occurs in the area of his hypothesized topographic low. The implications of this shift in sedimenta-tion patterns in the northernmost part of the study area will be discussed in more detail later.
Environments of deposition of the Mancos “B” interval have been recently studied in outcrops by Cole and Young (1991), Cole and others (1997), and Hampson and others (1999). These studies have concentrated on the middle and upper parts of the Prairie Canyon zone, which is better exposed and more amenable to detailed study than the lower part. Cole and Young (1991) and Cole and others (1997) interpreted the Prairie Canyon as entirely marine in origin. Hampson and others (1999), however, found several erosion surfaces in this interval. Channels filled with what was inter-preted as tidally influenced fluvial deposits occur along these surfaces. They (Hampson and others, 1999) suggested that the erosion surfaces were developed during relative sea level falls whereas the channel fills were deposited during the subse-quent sea level rises and cited evidence for paleosol develop-ment along one surface. Although relatively clean shoreface sandstones were deposited during highstands in the area, they (Hampson and others, 1999) were unable to trace these low-stand erosion surfaces into contemporaneous sandy shoreline deposits. Hampson and others (1999) suggested that the decrease in sand deposition during lowstands was due to a combination of reworking of fine-grained shelf sediments and entrapment of sand in estuaries by tidal currents. The lower wave energy when compared to highstands was related to changes in basin paleogeography.
The northward regional progradational nature of the Mancos “B” zone, based on subsurface data (Kellogg 1977), appears to conflict with paleocurrent readings from outcrop studies that indicate a general east to southeast flow direction (Cole and Young, 1991; Cole and others, 1997; Hampson and others, 1999). These readings are mainly from small-scale ripple foresets in the upper 300–400 ft of the Prairie Canyon interval, which led Cole and Young (1991) and Cole and others (1997) to suggest that the Prairie Canyon was sourced by deltaic centers to the northwest in southern Wyoming, or nearly from the opposite direction of regional progradation. The northward progradation, documented by Kellogg (1977),

8 Petroleum Systems and Geologic Assessment of Oil and Gas in the Uinta-Piceance Province
occurs largely in the poorly exposed lower part of the Prairie Canyon interval that was not studied in detail by Cole and Young (1991), Cole and others (1997), and Hampson and others (1999).
Stratigraphy and Depositional Setting of the Lower Part of the Mesaverde Group
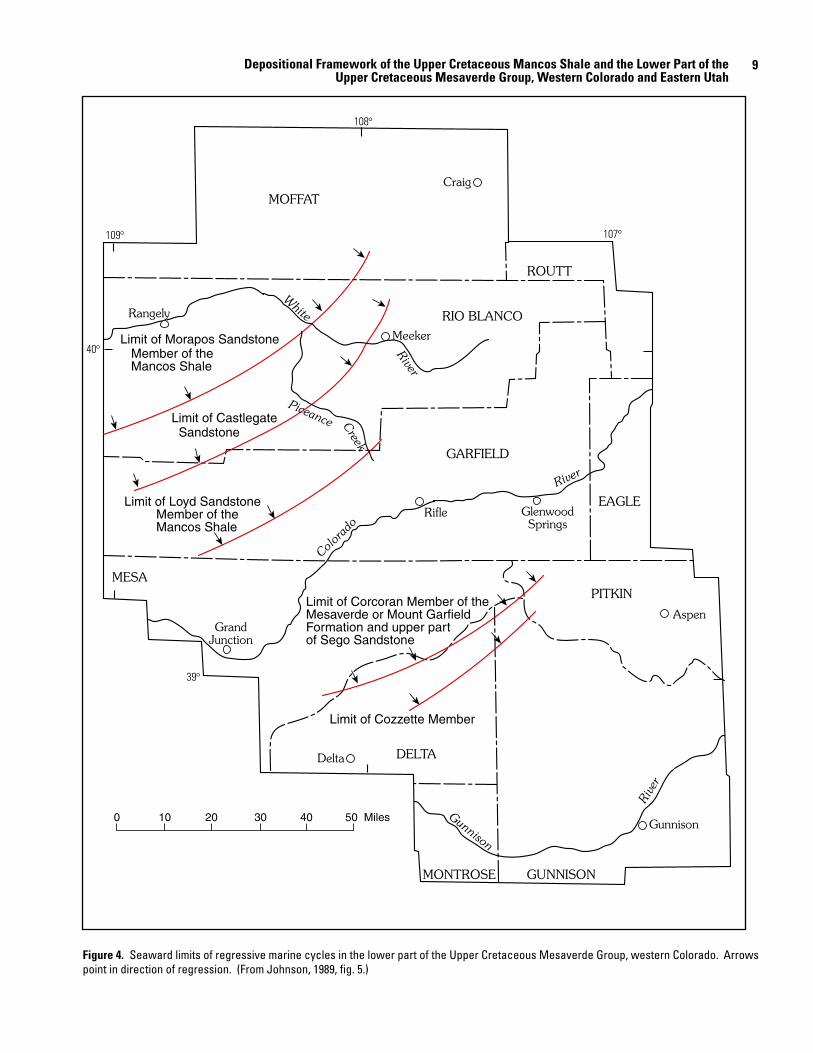
Nine major, regressive marine cycles have been identified in an intertonguing sequence of marginal marine rocks in the lower part of the Mesaverde Group and marine Mancos Shale (fig. 3; pl. 1). Not all of the cycles are shown in the stratigraphic chart (fig. 3) and not all are present along the line of cross section shown on plate 1. A summary of stratigraphic nomenclature and a general description of these cycles was given by Johnson (1989). Marine flooding surfaces cap each regressive marine cycle, and electric log markers in the overly-ing marine shales suggest that marine flooding was rapid at the end of each regressive cycle. Thus subsidence trends during deposition of the lower part of the Mesaverde Group can be studied by examining isopach maps of the intervals between flooding surfaces. The oldest regressive marine cycle in the study area is the Morapos Sandstone Member of the Mancos Shale (pl. 1; fig. 4). The next oldest is the Castlegate Sand-stone, which is the basal Mesaverde unit and is also the low-ermost widespread regressive marine cycle in the study area. The shoreline moved generally from northwest to southeast across the study area during these regressions (fig. 4). In general, the seaward limit of each succeeding cycle extended farther to the southeast than that of the previous cycle, and after the last cycle, nonmarine fluvial deposition dominated in the study area throughout the remainder of the Cretaceous. Interestingly, the landward limit of each transgressive cycle trended north-northeast rather than northeast as with the limits of regression. This interval in the Mesaverde Group has been extensively studied in the past, and the results of a recent detailed investigation of this interval are presented by Het-tinger and Kirschbaum (Chapter 12, this CD-ROM).
Previous Studies on the Structural Development of the Douglas Creek Arch
Structural development of the Douglas Creek arch and its effect on sedimentation during deposition of the Mancos Shale, particularly with respect to deposition of the Mancos “B” and Prairie Canyon zones, have been controversial. It has long been noted that the north-south-trending Douglas Creek arch and Rock Springs uplift in southwest Wyoming are
aligned, and it is generally believed that they formed one con-tinuous north-south-trending structure prior to being broken into two structures by the rise of the Uinta uplift (Ritzma, 1955; Gries, 1983; Gries and others 1992; Pang and Num-mendal, 1995). Cole and others (1997, p. 17) cited regional burial-history modeling by Pang (1993) and Pang and Num-mendal (1995) that indicates continuous structural movement on the Douglas Creek arch beginning in Coniacian time and continuing throughout the remainder of the Cretaceous. The arch has generally been considered as part of an area with comparatively low rates of subsidence during the Late Creta-ceous but not a positive topographic feature. Nevertheless, Cole and others (1997, p. 17) suggested that the low rates of subsidence on the arch during deposition of the Prairie Canyon zone “would have produced sediment winnowing (mud defla-tion) and an increase in sand concentration over the arch.” The generalized east-west cross section across the Douglas Creek arch presented by Pang and Nummendal (1995, fig. 3e) does show significant thinning across the arch from 90 to 80 Ma, which corresponds approximately with the time period when the Mancos Shale was deposited. Pang and Nummendal (1995) did not cite a source for the thicknesses shown on their cross section.
The cross section of Pang and Nummendal (1995, fig. 3e) clearly conflicts with a much more detailed east-west cross section constructed approximately parallel to theirs by Johnson and Johnson (1991) as well as published isopach maps in the area (Kellogg, 1977; Johnson and Finn, 1986, figs. 6, 7) that show little or no thinning in the vicinity of the Douglas Creek arch during deposition of the lower part of the Blue Gate Member and Mancos “B” zone. Isopach maps of discrete intervals in the Mancos “B” zone published by Kellogg (1977, figs. 4–7) show little evidence of a north-south-trending struc-ture in the vicinity of the present-day Douglas Creek arch and instead display east-west thickening trends related to the south to north progradation documented for the interval.
Overall Subsidence Trends During Deposition of the Mancos Shale and the Lowermost Part of the Mesaverde Group
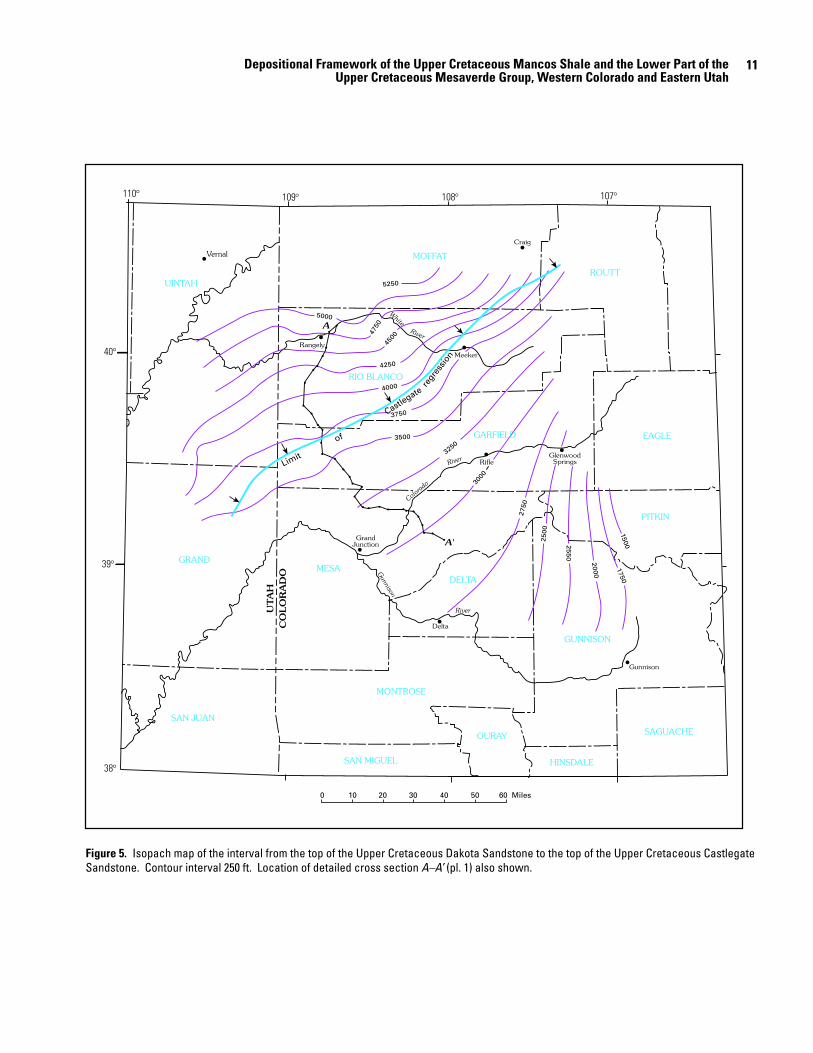
Figure 5 is an isopach map of the interval from the top of Dakota Sandstone to the top of the Castlegate Sandstone, a regressive marine sandstone near the base of the Mesaverde Group. The isopach interval includes all but the uppermost part of the stratigraphic sequence studied during the present investigation. The Dakota Sandstone is late Albian to Ceno-manian in age and was deposited during the initial transgres-sion of the Cretaceous seaway across the study area (Molenaar and Wilson, 1993). The Castlegate Sandstone was deposited during a major regression of the seaway in the Baculites
Depositional Framework of the Upper Cretaceous Mancos Shale and the Lower Part of the 9 Upper Cretaceous Mesaverde Group, Western Colorado and Eastern Utah
0 10 20 30 40 50 Miles
108°
107°
39°
40°
109°
MOFFAT
RIO BLANCO
GARFIELD
PITKIN
EAGLE
ROUTT
MESA
DELTA
MONTROSE GUNNISON
Craig
RangelyW
hite
RiverPiceance C
reek
Meeker
Rifle GlenwoodSprings
Color
ado
River
Riv
er
Gunnison
GrandJunction
Delta
Aspen
Gunnison
Limit of Morapos SandstoneMember of theMancos Shale
Limit of Castlegate Sandstone
Limit of Loyd Sandstone Member of the Mancos Shale
Limit of Corcoran Member of theMesaverde or Mount GarfieldFormation and upper part of Sego Sandstone
Limit of Cozzette Member
Figure 4. Seaward limits of regressive marine cycles in the lower part of the Upper Cretaceous Mesaverde Group, western Colorado. Arrows point in direction of regression. (From Johnson, 1989, fig. 5.)

10 Petroleum Systems and Geologic Assessment of Oil and Gas in the Uinta-Piceance Province
asperiformis ammonite zone of the late Campanian (Gill and Hail, 1975). The Castlegate is capped by a marine flooding surface throughout the study area, and the ammonite Baculites perplexus was collected in the marine shale a short interval above the flooding surface (Gill and Hail, 1975). Marine flooding surfaces bracket the interval, thus there was little topographic relief at the onset and the close of the time period represented by the isopach map (fig. 5). Thickness variations should therefore be closely related to differences in tectonic subsidence rates during this time period. A change in eustatic sea level during the time period would add or subtract accom-modation space evenly across the study area and thus would affect the total thickness of sediments, but not cause thickness variations.
The interval from the top of the Dakota Sandstone to the top of the Castlegate Sandstone thickens toward the northwest from less than 1,500 ft in the southeastern part of the study area to more than 5,250 ft in the northwest. The thickening trend is almost due north in the northernmost part of the study area, which is oblique to the 20°–30° east trend of the Sevier orogenic belt west of the study area. The northwest thickening is similar to that shown on a regional isopach map of Upper Cretaceous rocks by Gries and others (1992, fig. 7).
Subsidence and Infilling Patterns for Discrete Intervals in the Mancos Shale and the Lower Part of the Mesaverde Group
The Mancos Shale and the lower part of the Mesaverde Group in western Colorado were divided into three major units: (1) top of Dakota Sandstone to base of Mancos “B” interval of Blue Gate Member of Mancos Shale, (2) base of Mancos “B” interval to top of Castlegate Sandstone or equiva-lent, and (3) top of Castlegate Sandstone or equivalent to top of Cozzette Sandstone Member of Mount Garfield Formation or equivalent strata (pl. 1).
Top of Dakota Sandstone to Base of Mancos “B” Interval
Figure 6 is an isopach map of the stratigraphic interval from the top of the Dakota Sandstone to the base of the Mancos “B” interval, which includes the Mowry Shale, the Frontier Formation, and all of the Niobrara-age strata. A general distribution of marine shale and marine calcareous shale during deposition of the Niobrara interval is shown on the map. The isopach interval thins toward the southeast from more than 3,000 ft to less than 1,000 ft. The thinning was accompanied by a transition from predominantly shale to
mainly calcareous shale toward the southeast that is marked by an increase in resistivity on electric logs (pl. 1). Although the average carbonate content of the shales in this interval increases toward the southeast, chalk beds that characterize the Niobrara Formation farther to the east do not occur in the study area. It is interesting to note that electric log markers are much more distinctive in marine shale than in calcareous marine shale.
Pre-Mancos “B” strata were subdivided into three units (figs. 7–9) labeled intervals A, B, and C on plate 1. The lowest of these, interval A (fig. 7) extends from the top of the Dakota Sandstone stratigraphically upward to a readily recognizable resistivity log marker (pl. 1). The interval thins from more than 2,000 ft in the northwestern part of the study area to less than 1,200 ft in the southeast, following a thickness pattern that is generally similar to the overall interval from the Dakota Sandstone to the base of the Mancos “B” interval (fig. 6). The strata grade from largely gray shale in the northwest to predominantly calcareous shale toward the southeast.
Interval B has a maximum thickness of 675 ft in an east-trending bulge in the central part of the study area near the Utah-Colorado State line and thins to the northeast and southeast (fig. 8). The area of thickening can be seen on the left (north) side of the detailed cross section (pl. 1). The thickening to the northwest trend seen on the total pre-Prairie Canyon isopach map (fig. 6) is not apparent in this isopach interval. Interval B also grades from shale into calcareous shale in the southeast corner of the isopach area.
The youngest sequence of pre-Mancos “B” strata, interval C, varies from 50 to 150 ft thick over the southern part of the isopach area and thickens markedly toward the north to more than 625 ft (fig. 9). The area of thickening corresponds to the area where interval B thins to the north as previously mentioned. The overall impression is that a topographic low formed north of the bulge from the previous time interval, and that this depression was filled in during the time period represented by interval C. In general, the style of infilling during the pre-Mancos “B” interval suggests deposition in a deep sea basin with considerable topographic relief rather than on a shallow shelf. The locus of sedimentation appears to have shifted through time in response to the creation of topographic lows.
Base of Mancos “B” to Top of Castlegate Sandstone or Equivalent Interval
Figure 10 is an isopach map of the stratigraphic sequence extending from the base of the Mancos “B” interval to the top of the Castlegate Sandstone, the lowest widespread regressive marine unit in the lower part of the Mesaverde Group. The isopach interval thickens from less than 750 ft in the southeast to more than 2,750 ft in the north (fig. 10). The pattern of thickening is similar to the trend shown for all of the Mancos Shale through Castlegate Sandstone interval in figure 5, but
Depositional Framework of the Upper Cretaceous Mancos Shale and the Lower Part of the 11 Upper Cretaceous Mesaverde Group, Western Colorado and Eastern Utah
0 10 20 30 40 50 60 Miles
White
River
Limit
of
Castlegate
regr
essio
n
110° 109° 108° 107°
40°
39°
Vernal
Rangely
Meeker
Rifle
GrandJunction
Delta
Gunnison
GlenwoodSprings
Craig
5250
5000
4500
4750
4250
4000
3750
3500
3250
3000
2750
A
A' 2500
25
50
2000
17501500
UTA
HC
OLO
RA
DO G
unnison
River
Colora
do
River
MONTROSE
OURAY
SAN MIGUEL
DELTA
HINSDALE
GUNNISON
MESA
GARFIELD
PITKIN
EAGLE
RIO BLANCO
MOFFAT
ROUTTUINTAH
GRAND
SAN JUAN
SAGUACHE
38°
Figure 5. Isopach map of the interval from the top of the Upper Cretaceous Dakota Sandstone to the top of the Upper Cretaceous Castlegate Sandstone. Contour interval 250 ft. Location of detailed cross section A–A’ (pl. 1) also shown.

12 Petroleum Systems and Geologic Assessment of Oil and Gas in the Uinta-Piceance Province
ShaleCalcareousshale
EXPLANATION
0 10 20 30 40 50 60 Miles
110° 109° 108° 107°
Craig
GlenwoodSprings
Gunnison
Delta
GrandJunction
Vernal
Rangely
UTA
HC
OLO
RA
DO
3000
2750
2500
2250 2000
175015
00
1250
1000
Rifle
Meeker
White
RiverC
olor
ado
River
Gunnison
River
40°
39°
38°
MESA
DELTA
MONTROSE
SAN MIGUEL
OURAY
HINSDALE
GUNNISON
SAGUACHE
PITKIN
EAGLE
GARFIELD
RIO BLANCO
MOFFATROUTT
SAN JUAN
GRAND
UINTAH
Figure 6. Isopach map of the interval from the top of the Upper Cretaceous Dakota Sandstone to the base of the Mancos “B” zone of the Upper Cretaceous Blue Gate Member of the Mancos Shale. Contour interval 250 ft.

Depositional Framework of the Upper Cretaceous Mancos Shale and the Lower Part of the 13 Upper Cretaceous Mesaverde Group, Western Colorado and Eastern Utah
40°00'
109°30' 109°00' 108°30' 108°00'
39°00'
39°30'
0 5 10 15 20 25 Miles
UINTAH
UTA
HC
OLO
RA
DO
RIO BLANCO
GARFIELD
MESA
Grand Junction
Debeque
Parachute
MOFFAT
GRAND
Rangely20
00
1900
1800
1700
1500
1500
1600
1400
1300
1200
Control point
ShaleCalcareousshale
EXPLANATION
Figure 7. Isopach map of interval A of the lower part or pre-Mancos “B” part of the Upper Cretaceous Blue Gate Member of the Mancos Shale. Contour interval 100 ft.

14 Petroleum Systems and Geologic Assessment of Oil and Gas in the Uinta-Piceance Province
250
UINTAH
UTA
HC
OLO
RA
DO
RIO BLANCO
GARFIELD
MESA
Grand Junction
Debeque
Parachute
MOFFAT
GRAND
Rangely
109°30' 109°00' 108°30' 108°00'
39°00'
39°30'
40°00'
250
375
375
500
375
675
625
500
375
125
A'
A
0 5 10 15 20 25 Miles
Control point
ShaleCalcareousshale
EXPLANATION
Figure 8. Isopach map of interval B of the lower part or pre-Mancos “B” part of the Upper Cretaceous Blue Gate Member of the Mancos Shale. Contour interval 25 ft. Location of detailed cross section A–A’ (pl. 1) also shown.

Depositional Framework of the Upper Cretaceous Mancos Shale and the Lower Part of the 15 Upper Cretaceous Mesaverde Group, Western Colorado and Eastern Utah
50
UINTAH
UTA
HC
OLO
RA
DO
RIO BLANCO
GARFIELD
MESA
Grand Junction
Debeque
Parachute
MOFFAT
GRAND
Rangely
109°30' 109°00' 108°30' 108°00'
39°00'
39°30'
40°00'
625
500
375
250
12537
5
75
75
150125
125
0 5 10 15 20 25 Miles
Control point
ShaleCalcareousshale
EXPLANATION
Figure 9. Isopach map of interval C of the lower part or pre-Mancos “B” part of the Upper Cretaceous Blue Gate Member of the Mancos Shale. Contour interval 25 ft.

16 Petroleum Systems and Geologic Assessment of Oil and Gas in the Uinta-Piceance Province
Lim
itof
Cas
tlega
teeq
uiva
lent
Limitof
regression
Castlegate
0 10 20 30 40 50 60 Miles
110° 109° 108° 107°
39°
38°
Craig
GlenwoodSprings
Gunnison
Delta
GrandJunction
Vernal
Rangely
UTA
HC
OLO
RA
DO
Rifle
Meeker
2750
2500
2250
2000
1750
1500
1250
750
1000
White
River
Col
orad
o
River
Gunnison
River
40°
GARFIELD
MESA DELTA
MONTROSE
OURAY
SAN MIGUEL HINSDALE
SAN JUAN
GRAND
UINTAH
MOFFAT
RIO BLANCO
ROUTT
EAGLE
PITKIN
GUNNISON
SAGUACH
Figure 10. Isopach map of the interval from the base of the Mancos “B” zone of the Upper Cretaceous Blue Gate Member of the Mancos Shale to the top of the Upper Cretaceous Castlegate Sandstone. Contour interval 250 ft.
instead of a gradual increase across the study area, the Mancos “B” through Castlegate interval gains 1,000 ft of strata over a distance of 70–100 mi in the south and another 1,000 ft in only 20 mi in the north.
The Mancos “B” zone was subdivided into three intervals using distinctive electric log markers (intervals D, E, and F, pl. 1). Interval D (fig. 11), the lowest interval in the Mancos “B”, is approximately equivalent to Unit A of Kellogg (1977). It thickens southward from a wedge-edge in the central part of the isopach area to more than 475 ft in the southern part (fig. 11). This thickening occurs over a distance of 12–25 mi at a rate of 19–40 ft/mi, which led Kellogg (1977) to suggest that the prograding wedge had a topographic slope of 20–40 ft/mi. The south-to-north progradation of the Mancos “B” continued throughout deposition of intervals E and F. Interval E (fig. 12) reaches its maximum thickness of about 525 ft near the line
of pinch out of the underlying interval D, and interval F (fig. 13) reaches a maximum thickness of almost 625 ft in the area where the underlying interval E is thinnest.
Subsidence and Sedimentation Patterns in the Northern Part of the Study Area
Subsidence and sedimentation patterns are distinctly dif-ferent in the northernmost part of the study area (pl. 1) as compared to those in the central and southern parts. In this limited area, it is difficult to trace the basal surface of the Mancos “B” interval, largely because there is no discernible

Depositional Framework of the Upper Cretaceous Mancos Shale and the Lower Part of the 17 Upper Cretaceous Mesaverde Group, Western Colorado and Eastern Utah
UINTAH
UTA
HC
OLO
RA
DO
RIO BLANCO
GARFIELD
MESA
Grand Junction
Debeque
Parachute
MOFFAT
GRAND
Rangely
109°30' 109°00' 108°30' 108°00'
39°00'
39°30'
40°00'
0 5 10 15 20 25 Miles
250
350
125
250
375
475
0
Control pointEXPLANATION
Figure 11. Isopach map of interval D or lowermost interval of the Mancos “B” zone of the Upper Cretaceous Blue Gate Member of the Mancos Shale. Interval D is bracketed by two electric log markers shown on plate 1. Contour interval 25 ft.

18 Petroleum Systems and Geologic Assessment of Oil and Gas in the Uinta-Piceance Province
UINTAH
UTA
HC
OLO
RA
DO
RIO BLANCO
GARFIELD
MESA
Grand Junction
Debeque
Parachute
MOFFAT
GRAND
Rangely
109°30' 109°00' 108°30' 108°00'
39°00'
39°30'
40°00'
0 5 10 15 20 25 Miles
100125
250
375
500
300
450
375
525
375
250
Control pointEXPLANATION
Figure 12. Isopach map of interval E of the Mancos “B” zone of the Upper Cretaceous Blue Gate Member of the Mancos Shale. Interval E is bracketed by two electric log markers shown on plate 1. Contour interval 25 ft.

Depositional Framework of the Upper Cretaceous Mancos Shale and the Lower Part of the 19 Upper Cretaceous Mesaverde Group, Western Colorado and Eastern Utah
UINTAH
UTA
HC
OLO
RA
DO
RIO BLANCO
GARFIELD
MESA
Grand Junction
Debeque
Parachute
MOFFAT
GRAND
Rangely
109°30' 109°00' 108°30' 108°00'
39°00'
39°30'
40°00'
0 5 10 15 20 25 Miles
425
500
600
500
125
250
375
Control pointEXPLANATION
Figure 13. Isopach map of interval F of the Mancos “B” zone of the Upper Cretaceous Blue Gate Member of the Mancos Shale. Interval F is bracketed by two electric log markers shown in figure 4. Contour interval 25 ft.

20 Petroleum Systems and Geologic Assessment of Oil and Gas in the Uinta-Piceance Province
change from shale below the contact to more silty and sandy shale above. The position of the base of the Mancos “B” in this area as shown on plate 1 appears to be the same as that used by Kellogg (1977) on his more generalized north-south cross section. The base of the Mancos “B” in this area appears to trace into the middle of a marine shale sequence that thick-ens markedly toward the north. Kellogg (1977) recognized this thickening and suggested that erosion may have largely removed this thickening to the north interval farther to the south. Kellogg (1977, p. 172) noted that one of the sandiest parts of the Mancos “B” interval occurs in this area and sug-gested that the sand was trapped in a topographic low formed by erosion.
Electric log markers were traced with some difficulty through this thickening to the north interval (pl. 1), but they appear to diverge toward the north and do not appear to be truncated. The divergence of electric log markers in this area begins at about the base of interval C (pl. 1) and is largely responsible for the thickening of interval C from less than 125 ft in the central part of the study area to more than 625 ft in the northern part (fig. 9). The unusually sandy interval described by Kellogg (1977, lower part of his Unit D) can readily be seen on the cross section (pl. 1, wells 3–7). This sandy interval apparently traces laterally into the upper part of interval F, but correlation is poor. An alternative interpretation to the one shown on plate 1 is that the sandstone lenses out in a north-south direction. This second interpretation would suggest that the sands were deposited comparatively rapidly as a slumped mass at the base of a slope or as a valley fill on the floor of the seaway. The south to north progradation then appears to have resumed for a time, depositing sediments over the top of this sandstone then continuing northward (pl. 1).
Top of Castlegate Sandstone and Equivalent to Top of Cozzette Member of Iles Formation and Equivalent
Figure 14 is an isopach map of the interval between flooding surfaces at the top of the Castlegate Sandstone and the top of the Cozzette Sandstone Member of the Iles Forma-tion. The interval was deposited in the Baculites perplexus through Didymoceras stevensoni ammonite zones (Gill and Hail, 1975). The Cozzette Sandstone Member occurs only in western Colorado; hence the isopach map covers only the Colorado portion of the study area. The interval thickens to the east and northeast from less than 1,000 ft along the crest of the Douglas Creek arch to more than 2,000 ft where it is exposed along the Grand Hogback on the east margin of the Piceance Basin; it is more than 3,000 ft thick at a single surface location on the White River uplift, a thrust-faulted Laramide uplift east of the deep trough of the Laramide Piceance Basin. The subsidence trends indicated by this iso-pach map are very similar to those of the Laramide Piceance
Basin (Johnson and Finn, 1986) and make this the oldest inter-val in which subsidence appears to follow Laramide trends in the study area.
Discussion
The rate of subsidence increased toward the north to northwest across western Colorado and eastern Utah during deposition of the Upper Cretaceous Mancos Shale. This same thickening trend persisted during the depositional periods rep-resented by each of the major stratigraphic intervals studied in the Mancos Shale. Furthermore, there is no indication of incipient movement on the Douglas Creek arch during deposi-tion of the Mancos “B” interval as was suggested by some previous authors. This north to northwest thickening trend is apparent in isopach intervals of both the lower Mancos, from the top of the Dakota Sandstone to the base of the Mancos “B” interval (fig. 6), and of the upper Mancos, from the base of the Mancos “B” to the top of the Castlegate Sandstone (fig. 10). Only in isopach maps of discrete intervals within the Mancos Shale do other trends, related to variations in sediment supply, become apparent (figs. 7–13).
Subsidence trends are oblique to the more north-south trend of the Sevier orogenic belt to the west. Subsidence generally increased toward the area that was later occupied by the east-west-trending Laramide Uinta uplift, which did not begin to rise until late Paleocene time (Gries and others, 1992). Variations in the amount of thrust loading along the Sevier orogenic belt could have created a rapidly subsiding trough in the vicinity of the Uinta uplift in Late Cretaceous time owing to an unusually thick stacking of thrust sheets directly to the west that has been referred to as the Wasatch culmination (DeCelles, 1994). Five major thrust systems are recognized in the Wasatch culmination area: from west to east, the Willard, Ogden, Crawford, Absaroka, and Hogsback thrusts. Accord-ing to DeCelles (1994), the ages of the Willard and Ogden thrusts are poorly constrained but are probably largely Early Cretaceous. Thrusting occurred on the Crawford thrust from Coniacian though early Campanian (89–80 Ma), on the Absa-roka thrust from early Campanian through late Campanian (84–75 Ma) and from late Maastrichtian through early Paleo-cene (69–62 Ma), and on the Hogsback thrust from latest Paleocene thorough early Eocene (56–50 Ma) (DeCelles, 1994). Thus thrusting on the Crawford and Absaroka thrusts from 89 to 75 Ma roughly brackets the time interval rep-resented by the Mancos Shale and the lower part of the Mesaverde Group.
The pre-Mancos “B” interval was apparently deposited in an offshore deep-sea basin setting of unknown water depth but with a significant amount of topographic relief on the sea floor. Interval B in the lower part of the Mancos displays a distinct bulge or westward thickening in the north-central part of the study area (fig. 7), indicating a possible point source for sediments west of the bulge. Interval B may have been

Depositional Framework of the Upper Cretaceous Mancos Shale and the Lower Part of the 21 Upper Cretaceous Mesaverde Group, Western Colorado and Eastern Utah
trans
gres
sion
Surface control
Subsurface control
EXPLANATION
110° 109° 108° 107°
0 10 20 30 40 50 60 Miles
VernalCraig
Meeker
RifleGlenwood
Springs
Rangely
Delta
Gunnison
2100
2300
2400
2200
1400
2200
2100
2000
1900
1800
170016001500
13001200
1100
1000
Limit of Castl
egatere
gress
ion
White
River
GrandJunction
Western limit ofRollins-Trout Creek
Sandstones
Col
orad
o
Gunnison
River
River
Lim
itof
Cas
tlega
teeq
uiva
lent
Limit
of
C
ozzette
regression
UTA
HC
OLO
RA
DO
Lim
it
o
f
C
ozze
tte-R
ollin
s
3000
40°
39°
38°
MONTROSE
SAN MIGUEL
OURAY
DELTA
MESA
GARFIELD
RIO BLANCO
ROUTT
EAGLE
PITKIN
GUNNISON
SAGUACHE
HINSDALE
SAN JUAN
GRAND
UINTAH
MOFFAT
Dou
glas
Cre
ekar
chG
rand
Hogback
Figure 14. Isopach map of the interval from the top of the Upper Cretaceous Castlegate Sandstone to the top of the Upper Cretaceous Cozzette Sandstone Member of the Mesaverde Formation or Group or Iles Formation in the lower part of the Mesaverde Group. Contour interval 100 ft. Limits of transgressive and regressive marine cycles from Johnson (1989).

22 Petroleum Systems and Geologic Assessment of Oil and Gas in the Uinta-Piceance Province
deposited as a deep-sea fan, possibly at the base of a shelf break that lay farther to the west. Interval C, the next youngest interval, thickens on the north flank of this bulge, indicating that the sediment source shifted to fill in a topographic low that formed during the previous time period. The entire interval of marine shale thins and becomes increasingly calcareous toward the southeast.
The base of the Mancos “B” interval marks the onset of south to north progradation across the study area. The basal surface could mark an episode of relative sea level rise that initiated a period of slow rates of sedimentation, in which case the Mancos “B” would represent a shelf-building event during the next relative sea level fall. Conversely, the surface could simply mark the arrival of a rapidly prograding shelf into the study area and have nothing to do with relative sea level changes. Recent work by Catuneanu and others (1997a, b) indicates that in third-order transgressive-regressive sequences in the upper Campanian–lower Maastrichtian Bearpaw Shale in southern Alberta and Saskatechewan, transgressions along the west margin of the Cretaceous seaway occurred at the same time as regressions along the east margin. They (Catu-neanu and others, 1997a, b) cited this “reciprocal stratigraphy” as evidence that tectonism rather than sea level changes is the dominant mechanism in the generation of even compara-tively minor third-order sequence boundaries in the Cretaceous seaway.
The south to north prograding character of the Mancos “B” strata indicates that the source of sediments was from the south as Kellogg (1977) had suggested. Paleocurrent read-ings obtained from outcrops west of the study area by Cole and Young (1991), Cole and others (1997), and Hampson and others (1999) on the topset part of this prograding shelf (inter-val F of this report) indicate that longshore currents moved toward the east and southeast, thus pointing to a western source of sediments in the area studied by those authors. Detailed outcrop studies by Hampson and others (1999) on the topset part of this shelf indicated periodic subaerial exposure, although the authors could not locate the shorelines that cor-respond to these periods of exposure.
The oldest unit that was unequivocally deposited near sea level across much of the study area is the regressive, marginal-marine Castlegate Sandstone. The interval from the base of the Mancos “B” to the top of the Castlegate Sandstone thickens from east to west and northwest from 750 to 2,750 ft across the study area or in the general direction of increasing regional subsidence. Thus, although the source of sediments for the Mancos “B” interval was apparently from the south, the rapidly subsiding trough of the basin remained to the north.
The rate of thickening of the stratigraphic interval from the base of the Mancos “B” to the top of the Castlegate Sandstone interval increases toward the northernmost part of the study area. This acceleration, which may have begun during deposition of interval C or the interval immediately preceding the Mancos “B” interval, possibly was caused by a period of active thrust loading along the Sevier orogenic belt to the northwest. The northward divergence of electric log
markers in the northernmost part of the study area indicates deposition on a south- or southeast-sloping ramp that remained in approximately the same position throughout the period of rapid subsidence. The geometry of this possible ramp is similar to that proposed by Posamentier and Allen (1999, fig. 2.8, example a) for foreland basins during periods of active thrust loading.
The sandiest part of the Mancos “B” interval occurs between this hypothesized south- to southeast-sloping ramp on the north, and the northward-prograding shelf on the south. It is suggested that this area was a topographic low between the ramp and the prograding shelf. Kellogg (1977) hypothesized a similar topographic low in the same area; however, there is little evidence that this low was created by erosion as he suggested. Sand could have reached this low area from either the north or south or from both directions by mass movement processes, turbidity currents, or other sedimentation processes.
The period of rapid subsidence to the northwest was followed by a period of shoreline progradation from the north-west represented by the regressive marine cycles in the lower part of the Mesaverde Group, possibly indicating that once active thrusting had largely ended, subsidence rates declined and the seaway was pushed back by sediments eroded from the highlands created during the thrusting.
The marked thickening of the lower part of the Mesaverde Group toward the east and northeast in the area of the Laramide Piceance Basin (fig. 14) represents a major realign-ment of subsidence trends. This realignment occurred between Baculites perplexus and Didymoceras stevensoni baculite zones of the middle to late Campanian, or about 75–78 Ma using the Cretaceous biozone calibration of Obradovich (1993, fig. 2). This new trend is similar to subsidence trends found in the Laramide Piceance Basin (see Johnson and Finn, 1986, figs. 8, 9; Johnson and others, 1987, fig. 4); however, there does not appear to be any thrust loading to initiate the subsid-ence. The White River uplift, the west-thrusting Laramide uplift just east of the trough of the Piceance Basin, was not actively rising during deposition of the lower part of the Mesaverde Group. Instead, the isopach interval in the lower part of the Mesaverde Group thickens markedly across the area later occupied by the White River uplift.
Clearly the realignment of subsidence trends in Late Cre-taceous time was not caused by thrust loading along rising Laramide uplifts, but it may be part of a broader, more regional realignment of subsidence trends during that period. Isopach maps of Upper Cretaceous rocks in the Western Inte-rior recently constructed by Roberts and Kirschbaum (1995) indicate that a rapidly subsiding trough began to develop in south-central Wyoming in Campanian time, considerably east of the trough that formed in Coniacian-Santonian time in north-central Utah and southwest Wyoming. The existence of this subsidence center has long been known (Haun and Weimer, 1960; McGookey and others, 1972), but prior to Roberts and Kirschbaum (1995) it was dated only as Late Cretaceous. By Maastrichtian time, this subsidence center had grown to cover much of southern Wyoming and northern
Depositional Framework of the Upper Cretaceous Mancos Shale and the Lower Part of the 23 Upper Cretaceous Mesaverde Group, Western Colorado and Eastern Utah
Colorado (Roberts and Kirschbaum, 1995, fig. 21), including the Laramide Piceance Basin’s southwest margin. Thus the northeast-thickening trend seen in figure 14 probably contin-ued into the main part of this subsidence center in south-central Wyoming.
The eastward- and northeastward-thickening trends for the lower part of the Mesaverde are nearly perpendicular to the shoreline trends that prevailed during the regressive cycles recorded by these strata (fig. 4). Sediment supply rather than creation of accommodation space was apparently the dominant factor controlling the direction of regression during this period. This ample supply of sediment was apparently coming largely from highlands along the Sevier orogenic belt in southwestern Wyoming and adjacent parts of Utah and Idaho. Shoreline trends during transgressive cycles, in contrast, more closely parallel subsidence trends, suggesting that variations in subsid-ence rates did have an effect on shoreline trends during relative sea level rises.
References Cited
Asquith, D.O., 1970, Depositional topography and major marine envi-ronments, Late Cretaceous, Wyoming: American Association of Petroleum Geologists Bulletin, v. 54, no. 7, p. 1184–1224.
Beaumont, C., 1981, Foreland basins: Geophysical Journal of the Royal Astronomical Society, v. 55, p. 471–498.
Beck, R.A., 1985, Syntectonic sedimentation adjacent to Laramide basement thrusts, Rocky Mountain foreland; timing of deformation: Ames, Iowa, Iowa State University M.S. thesis, 88 p.
Beck, R.A., Vondra, C.F., Filkins, J.E., and Olander, J.D., 1988, Syntec-tonic sedimentation and Laramide basement thrusting, Cordilleran foreland; timing of deformation, in Schmidt, C.J., and Perry, W.J., Jr., eds., Interaction of Rocky Mountain foreland and the Cordil-leran Thrust Belt: Geological Society of America Memoir 171, p. 465–487.
Burtner, R.L., and Warner, M.A., 1984, Hydrocarbon generation in Lower Cretaceous Mowry and Skull Creek shales of the northern Rocky Mountain area, in Woodward, Jane, Meissner, F.F., and Clay-ton, J.L., eds., Hydrocarbon source rocks of the greater Rocky Mountain region: Rocky Mountain Association of Geologists, p. 449–467.
Catuneanu, O., Beaumont, C., and Waschbusch, P., 1997a, Interplay of static loads and subduction dynamics in foreland basins—Recipro-cal stratigraphies and the “missing” peripheral bulge: Geology, v. 25, no. 12, p. 1087–1090.
Catuneanu, O., Sweet, A.R., and Miall, A.D., 1997b, Reciprocal archi-tecture of Bearpaw T-R sequences, uppermost Cretaceous, West-ern Canada Sedimentary Basin: Bulletin of Canadian Petroleum Geology, v. 45, no. 1, p. 75–94.
Chan, M.A., Newman, S.L., and May, F.E., 1991, Deltaic and shelf deposits in the Cretaceous Blackhawk Formation and Mancos Shale, Grand County, Utah: Utah Geological Survey Miscellaneous Publication 91-6, 83 p.
Cole, R.D., and Young, R.G., 1991, Facies characterization and archi-tecture of a muddy shelf-sandstone complex—Mancos B interval of the Upper Cretaceous Mancos Shale, northwest Colorado– northeast Utah, in Miall, A.D., and Tyler, N., eds., The three-
dimensional facies architecture of terrigenous clastic sediments and its implications for hydrocarbon discovery and recovery: Soci-ety of Economic Paleontologists and Mineralogists, Concepts in Sedimentology and Paleontology, v. 3, p. 277–286.
Cole, R.D., Young, R.G., and Willis, G.C., 1997, The Prairie Canyon Member, a new unit of the Upper Cretaceous Mancos Shale, west-central Colorado and east-central Utah: Utah Department of Natu-ral Resources Miscellaneous Publication 97-4, 19 p.
DeCelles, P.G., 1994, Late Cretaceous–Paleogene synorogenic sedi-mentation and kinematic history of the Sevier thrust belt, northeast Utah and southwest Wyoming: Geological Society of America Bul-letin, v. 106, p. 32–56.
Fouch, T.D., Lawton, T.F., Nichols, D.J., Cashion, W.B., and Cobban, W.A., 1983, Patterns and timing of synorgenic sedimentation in Upper Cretaceous rocks of central and northeast Utah, in Reynolds, M.W., and Dolly, E.D., eds., Mesozoic paleogeography of the west-central United States: Society of Economic Paleontologists and Mineralogists, Rocky Mountain Section, Denver, Colo., p. 305–336.
Gill, J.R., and Hail, W.J., 1975, Stratigraphic sections across Upper Cretaceous Mancos Shale–Mesaverde Group boundary, eastern Utah and western Colorado: U.S. Geological Survey Oil and Gas Investigations Chart OC–68, 1 sheet.
Gries, R., 1983, North-south compression of Rocky Mountain foreland structures, in Lowell, J.D., ed., Rocky Mountain foreland basins and uplifts: Rocky Mountain Association of Geologists, p. 9–32.
Gries, R., Dolson, J.C., and Raynolds, R.G.H., 1992, Structural and stratigraphic evolution and hydrocarbon distribution, Rocky Moun-tain Foreland, in MacQueen, R.W., and Leckie, D.A., eds., Foreland basins and fold belts: American Association of Petroleum Geolo-gists Memoir 55, p. 395–425.
Gurnis, M., 1992, Rapid continental subsidence following the initiation and evolution of subduction: Science, v. 255, p. 1556–1558.
Hamilton, W.B., 1988, Laramide crustal shortening: Geological Society of America Memoir 171, p. 27–39.
Hampson, G.J., Howell, J.A., and Flint, S.S., 1999, A sedimentological and sequence stratigraphic re-interpretation of the Upper Cre-taceous Prairie Canyon Member (“Mancos B”) and associated strata, Book Cliffs area, Utah, U.S.A.: Journal of Sedimentary Research, v. 69, no. 2, p. 414–433.
Haun, J.D., and Weimer, R.J., 1960, Cretaceous stratigraphy of Colo-rado, in Guide to the geology of Colorado: Rocky Mountain Asso-ciation of Geologists, p. 58–65.
Johnson, R.C., 1989, Geologic history and hydrocarbon potential of Late Cretaceous-age low-permeability reservoirs, Piceance Basin, western Colorado: U.S. Geological Survey Bulletin 1787, 51 p.
Johnson, R.C., Crovelli, R.A., Spencer, C.W., and Mast, R.F., 1987, An assessment of gas resources in low-permeability sandstones of the Upper Cretaceous Mesaverde Group, Piceance Basin, Colorado: U.S. Geological Survey Open-File Report 87–357, 165 p.
Johnson, R.C., and Finn, T.M., 1986, Cretaceous through Holocene his-tory of the Douglas Creek Arch, Colorado and Utah, in Stone, D.S., ed., New interpretations of northwest Colorado geology: Rocky Mountain Association of Geologists, p. 77–95.
Jordan, T.E., 1981, Thrust loads and foreland basin evolution, Creta-ceous, western United States: American Association of Petroleum Geologists Bulletin, v. 65, p. 2506–2520.
Keefer, W.R., 1970, Structural geology of the Wind River Basin, Wyo-ming: U.S. Geological Survey Professional Paper 495–D, 35 p.
Kellogg, H.E., 1977, Geology and petroleum of the Mancos B Forma-tion, Douglas Creek Arch, Colorado and Utah, in Veil, H. K., ed.,

24 Petroleum Systems and Geologic Assessment of Oil and Gas in the Uinta-Piceance Province
Exploration frontiers of the central and southern Rockies: Rocky Mountain Association of Geologists 1977 Symposium, p. 167–179.
Kopper, P.K., 1962, Douglas Creek Anticline and adjoining area, in Amuedo, C.L., and Mott, M.R., eds., Exploration for oil and gas in northwestern Colorado: Rocky Mountain Association of Geolo-gists, p. 108–110.
McGookey, D.P., Haun, J.D., McCubbin, D.G., Hale, L.A., Weimer, R.J., Goodell, H.G., and Wulf, G.R., 1972, Cretaceous system; Geologic Atlas of the Rocky Mountain Region, United States of America: Rocky Mountain Association of Geologists, p. 190–228.
Mitrovica, J.X., Beaumont, C., and Jarvis, G.T., 1989, Tilting of conti-nental interiors by the dynamic effects of subduction: Tectonics, v. 8, p. 1079–1094.
Molenaar, C.M., and Cobban, W.A., 1991, Middle Cretaceous stratigra-phy on the south and east sides of the Uinta Basin, northeastern Utah and northwestern Colorado: U.S. Geological Survey Bulletin 1787–P, 34 p.
Molenaar, C.M., and Wilson, B.W., 1990, The Frontier Formation and associated rocks of northeastern Utah and northwestern Colorado: U.S. Geological Survey Bulletin 1787–M, 21 p.
———1993, Stratigraphic cross section of Cretaceous rocks along the north flank of the Uinta Basin, northeastern Utah, to Rangely, northwestern Colorado: U.S. Geological Survey Miscellaneous Investigations Series Map I–1797–D, 1 sheet.
Obradovich, J.D., 1993, A Cretaceous time scale, in Caldwell, W.G.E., and Kauffman, E.G., eds., Evolution of the Western Interior Basin: Geological Society of Canada Special Paper 39, p. 379–396.
Pang, M., 1993, Analysis of subsidence patterns in the Cretaceous Western Interior basin, U.S.A., [abs.]: American Association of Petroleum Geologists Annual Convention Abstracts (New Orleans), v. 2, p. 163.
Pang, M., and Nummendal, D., 1995, Flexural subsidence and base-ment tectonics of the Cretaceous Western Interior basin, United States: Geology, v. 23, p. 173–176.
Pattison, S.A.J., 1995, Sequence stratigraphic significance of sharp-based lowstand shoreface deposits, Kenelworth Member, Book Cliffs, Utah: American Association of Petroleum Geologists Bul-letin, v. 79, p. 444–462.
Posamentier, H.W., and Allen, G.P., 1999, Siliciclastic sequence stratig-raphy—Concepts and applications: Society for Sedimentary Geol-ogy, Concepts in Sedimentology and Paleontology 7, 204 p.
Price, R.A., 1973, Large-scale gravitational flow of supracrustal rocks, southern Canadian Rockies, in Delong, K.A., and Scholten, R., eds., Gravity and tectonics: New York, John Wiley and Sons, p. 491–502.
Pysklywec, R.N., and Mitrovica, J.X., 1998, Mantle flow mechanisms for the large-scale subsidence of continental interiors: Geology, v. 26, no. 8, p. 687–690.
———2000, Mantle flow mechanisms of epeirogeny and their pos-sible role in the evolution of the Western Canada Sedimentary Basin: Canadian Journal of Earth Science, v. 37, p. 1535–1548.
Ritzma, H.R., 1955, Early Cenozoic history of the Sand Wash Basin, northwest Colorado, in Ritzma, H.R., and Oriel, S.S., eds., Guidebook to the geology of northwest Colorado: Intermountain Association of Petroleum Geologists, and Rocky Mountain Association of Geol-ogists, p. 36–40.
Roberts, L.N., and Kirschbaum, M.A., 1995, Paleogeography of the late Cretaceous of the western interior of middle North America—Coal distribution and sediment accumulation: U.S. Geological Survey Professional Paper 1561, 115 p.
Sharp, J.V.A., 1963, Unconformities within basal marine Cretaceous rocks of the Piceance Basin, Colorado: Boulder, Colo., University of Colorado Ph. D. thesis, 170 p.
Stern, T.A., and Holt, W.E., 1994, Platform subsidence behind an active subduction zone: Nature, v. 368, p. 233–236.
Swift, D.J.P., Hudelson, P.M., Brenner, R.L., and Thompson, Peter, 1987, Shelf construction in a foreland basin—Storm beds, shelf sand bodies, and shelf-slope depositional sequences in the Upper Creta-ceous Mesaverde Group, Book Cliffs, Utah: Sedimentology, v. 34, p. 423–457.
Taylor, D.R., and Lovell, R.W.W., 1995, High-frequency sequence stra-tigraphy and paleogeography of the Kenilworth Member, Black-hawk Formation, Book Cliffs, Utah, U.S.A., in Van Wagoner, J.C., and Bertram, G.T., eds., Sequence stratigraphy of foreland basin deposits—Outcrop and subsurface examples from the Cretaceous of North America: American Association of Petroleum Geologists Memoir 64, p. 257–275.
Click here tV
o returolume T
n to itle Page