depth & data - informa
TRANSCRIPT

Depth & DataInforma Group Annual Report and Accounts 2020

C O N T E N T S I N F O R M A I N 2 0 2 0
Strategic Report Governance Report Financial Statements
Company Information
Informa in 2020 1Informa at a Glance 2Why Invest 3
Chair’s Introduction 4Group Strategy 8COVID-19 Action Plan 10Group Chief Executive’s Review 12Business Model 20Trends in our Markets 22The Heart of Informa 28Section 172 Statement 45Divisional Snapshot 48Divisional Review 50– Informa Markets, Informa Connect, Informa Tech 50– Informa Intelligence 56– Taylor & Francis 60Key Performance Indicators 64Risk Management 66Principal Risks and Uncertainties 71Viability Statement 78Financial Review 82
Chair’s Introduction to Governance 94Board of Directors 98Corporate Governance Report 100Nomination Committee Report 106Audit Committee Report 110Directors’ Remuneration Report 116Other Statutory Information 132Statement of Directors’ Responsibilities 135
Independent Auditor’s Report 136Consolidated Income Statement 147Consolidated Statement of Comprehensive Income 148Consolidated Statement of Changes in Equity 149Consolidated Balance Sheet 150Consolidated Cash Flow Statement 151Notes to the Consolidated Financial Statements 152Parent Company Balance Sheet 220Parent Company Statement of Changes in Equity 221Notes to the Parent Company Financial Statements 222Glossary of Terms and Alternative Performance Measures 228Five-Year Summary 230
Shareholder Information 231Advisers 232
COVID-19 Action Plan Read more on pages 10 and 11
Knowledge and connections at virtual events Read more on pages 54 and 55
Chair succession Read more on page 109
Delivering for colleagues and customers Read more on pages 30 to 34 and 38 and 39
Informa AllSecure Read more on pages 18 and 19
Group statutory revenue
£1,661m(2019: £2,890m)
Adjusted operating profit*
£268m(2019: £933m)
Statutory operating (loss)/profit
£(880m)(2019: £538m)
Free cash flow*
£(154m)(2019: £722m)
Adjusted diluted earnings per share*
9.9p(2019: 51.0p)
* In this report, we include IFRS measures and alternative performance measures. For clarity, each alternative performance measure is marked by an asterisk the first time it is used. Definitions are listed on page 227.
45–47Section 172 Statement
10–11COVID-19 Action Plan
42–44Sustainability at Informa
12–19Group Chief Executive’s Review
48–63Our Divisions
100–105Corporate Governance Report
28–44The Heart of Informa
INFO
RM
A P
LC A
NN
UA
L RE
PO
RT A
ND
AC
CO
UN
TS 2
02
0
1
ST
RA
TE
GIC
RE
PO
RT
INFO
RM
A P
LC A
NN
UA
L R
EP
OR
T A
ND
AC
CO
UN
TS
20
20
I N F O R M A A T A G L A N C E W H Y I N V E S T
At Informa we’re here to champion the specialist, connecting people with knowledge to help them learn more, know more and do more.
We deliver:• Specialist content• Must-have data and analytics• Targeted connections
for buyers, sellers and professionals through physical and virtual events
• Advanced peer-reviewed research
• Specialist marketing services• Digital workflow solutions• Networking and
partnering platforms• Expert consultancy• Specialist accredited training
To specialists in markets including:• Pharma & Biotech• Tech• Health & Nutrition• Finance• Humanities & Social Sciences• Aviation• Licensing• Maritime• Science & Medicine• Beauty & Aesthetics• Fashion• Construction & Real Estate
What makes us different is:• The talent of 10,000 colleagues• International breadth and
reach across 30+ countries• Our culture, purpose and
guiding principles• The strength, position and
quality of our brands• Our focus on specialist
markets and customers
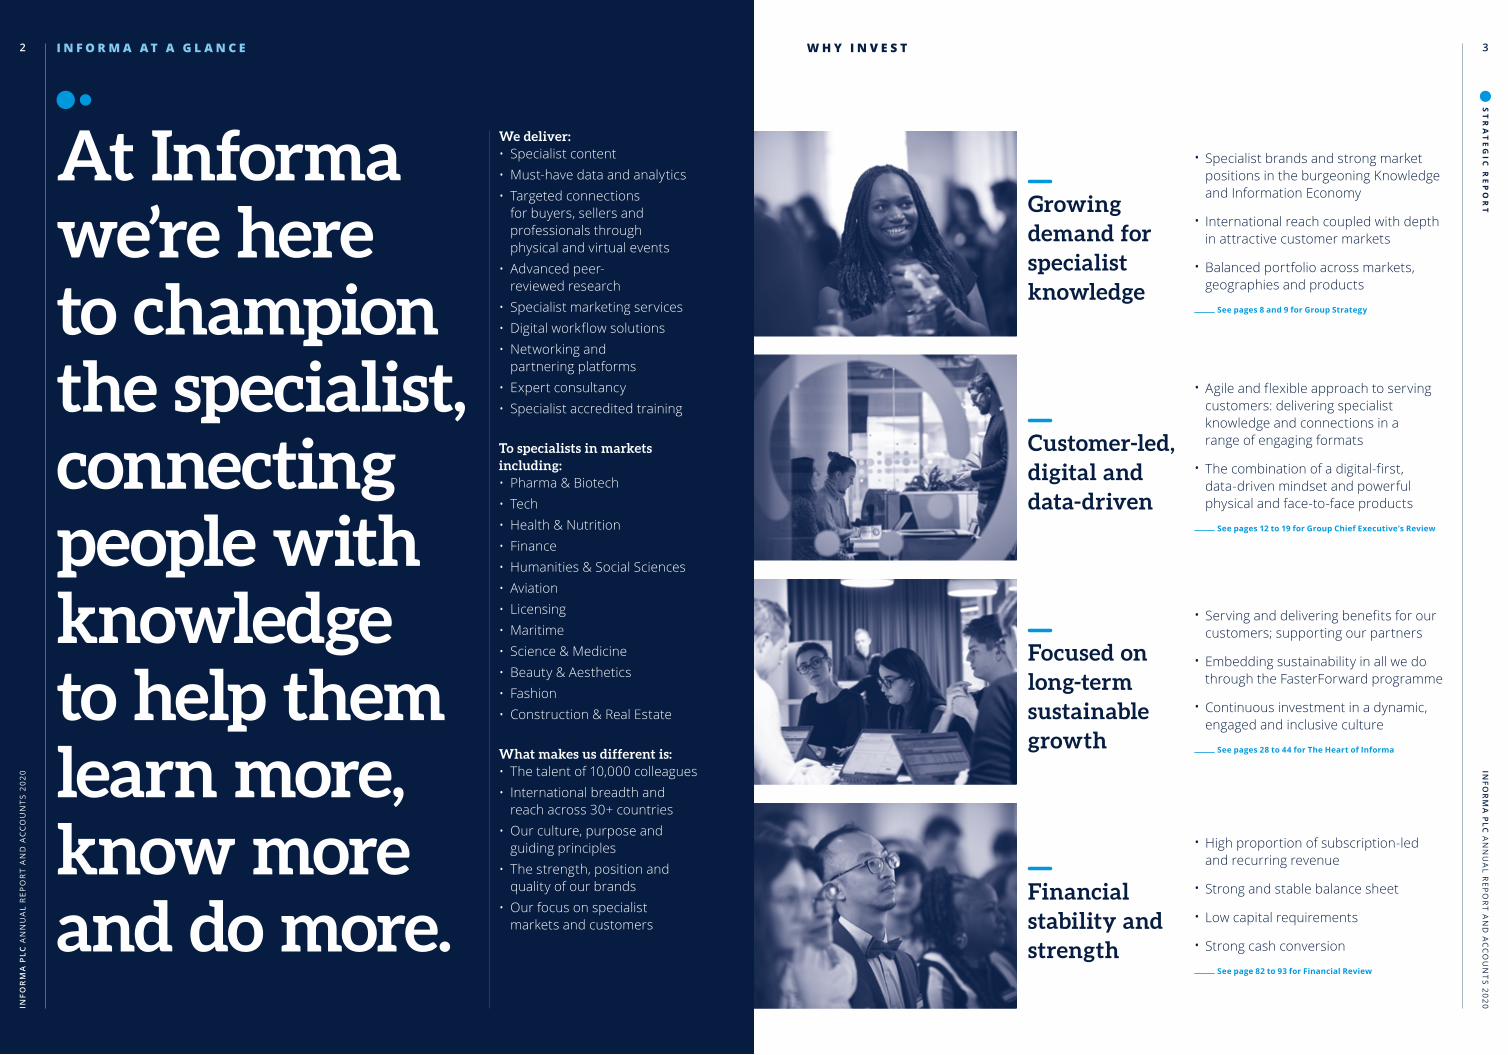
• Specialist brands and strong market positions in the burgeoning Knowledge and Information Economy
• International reach coupled with depth in attractive customer markets
• Balanced portfolio across markets, geographies and products
See pages 8 and 9 for Group Strategy
• Agile and flexible approach to serving customers: delivering specialist knowledge and connections in a range of engaging formats
• The combination of a digital-first, data-driven mindset and powerful physical and face-to-face products
See pages 12 to 19 for Group Chief Executive’s Review
• Serving and delivering benefits for our customers; supporting our partners
• Embedding sustainability in all we do through the FasterForward programme
• Continuous investment in a dynamic, engaged and inclusive culture
See pages 28 to 44 for The Heart of Informa
• High proportion of subscription-led and recurring revenue
• Strong and stable balance sheet
• Low capital requirements
• Strong cash conversion
See page 82 to 93 for Financial Review
Growing demand for specialist knowledge
Customer-led, digital and data-driven
Focused on long-term sustainable growth
Financial stability and strength
INFO
RM
A P
LC A
NN
UA
L RE
PO
RT A
ND
AC
CO
UN
TS 2
02
0
3
ST
RA
TE
GIC
RE
PO
RT
INFO
RM
A P
LC A
NN
UA
L R
EP
OR
T A
ND
AC
CO
UN
TS
20
20
2

C H A I R ’ S I N T R O D U C T I O N
Building stability and securityFrom the outset, your Board and leadership team were clear that the Group should focus on making decisions for the long-term value of the Company’s brands, colleagues and customer relationships. This guided the development of Informa’s COVID-19 Action Plan, which can be seen in detail on pages 10 and 11.
This plan was established through a COVID Executive Leadership Group, comprising Divisional and functional leaders, that could facilitate real-time decision making and fast-track implementation. The Board was updated regularly, including through weekly Board calls during the initial period of the crisis, in addition to the schedule of regular Board meetings.
The Group prioritised the safety and wellbeing of colleagues and customers, ensuring we adhered to local rules and provided full guidance and support. As the virus spread, there was a smooth transition to remote working around the world, aided by excellent IT support and a regular schedule of colleague communications and engagement, which we discuss in more detail on pages 30 to 34 and in our Section 172 statement starting on page 44.
One of the foundations for building stability and security has been the strength of Informa’s subscription-led businesses. Taylor & Francis, Informa Intelligence and the Omdia brand within Informa Tech were resilient throughout, demonstrating the strength of Informa’s brands, the value of our specialist data and content and the power of digital subscriptions.
Within the event-led businesses, the response and experience of our teams in China, which were dealing with the impact of COVID-19 from January, helped to shape the broader response of the Group. We quickly launched a major Postponement Programme across our events portfolio, rescheduling shows to alternative dates wherever possible. The Postponement Programme has since been extended to late spring and early summer 2021, with the 2021 events calendar outside of Mainland China aligned with the progressive roll out of vaccine programmes across the world.
As part of this work, our teams collaborated with industry peers, venue partners and associations to develop the AllSecure standard for events, a best practice playbook for organisers and authorities to ensure the highest standards of safety and hygiene as physical shows return.
In the absence of physical events, and considering the interests of our customers, the events teams found other ways to provide support, promoting the Group’s specialist media and marketing services and launching more than 500 virtual events. This shift to digital delivery ensured our brands remained visible and customers engaged, while also providing some valuable revenue.
Costs, cash and financingThe full impact of the pandemic on Informa’s physical events business is reflected in the reduction in Group revenues reported for 2020, which were over £1bn lower at £1,661m.
At a statutory level, the Group made an operating loss of £880m. However, adjusted operating profit was £268m (2019: £933m), supported by the launch of a major £600m cost management programme. This included over £400m of direct cost savings through the recovery of venue fees and marketing costs from events that were postponed or cancelled. In addition, the COVID-19 Action Plan delivered more than £200m of annualised cost savings by year end, largely achieved through the removal of discretionary costs, pausing non-essential projects, minimising travel and reducing our real estate footprint. As it affected colleagues, savings were
One year ago, it would have been impossible to predict the professional and personal challenges that lay ahead.
It has been inspiring to witness the resilience and commitment of Informa colleagues through this period that so strongly contributed to ensuring the Company remains stable and secure, and on behalf of the Board, I would like to take this opportunity to express our deepest gratitude to every colleague.
I would also like to thank our Shareholders for their support through the year, as well as all our customers, partners and suppliers. It is through periods such as these that the strength and depth of relationships become clear and it is testament to all of Informa’s key stakeholders and partnerships that the Group is in the position it is today.
I am also very grateful to my fellow Board colleagues, who committed substantial time and energy to Informa through 2020 when just under 20 formal Board meetings and calls were held, as we sought to establish a position of stability and security.
I extended my own tenure as Chair through this period, allowing the Board to pause the Chair succession process and focus on the response to COVID-19. Following the resumption of this process later in the year, I was delighted that John Rishton was appointed as Chair Elect and I know John shares my sentiment about the tremendous resilience demonstrated by all connected with Informa over the last 12 months.
It is a great pleasure to address Shareholders after what was an extraordinary year for Informa and for all businesses around the world, following the unprecedented circumstances of the COVID-19 pandemic.
Derek MappChair
Stability and Strength
INFO
RM
A P
LC A
NN
UA
L RE
PO
RT A
ND
AC
CO
UN
TS 2
02
0
5
ST
RA
TE
GIC
RE
PO
RT
INFO
RM
A P
LC A
NN
UA
L R
EP
OR
T A
ND
AC
CO
UN
TS
20
20
4

C H A I R ’ S I N T R O D U C T I O N c o n t i n u e d C H A I R E L E C T ’ S I N T R O D U C T I O N
The combination of our cost, cash and financing actions ensured your Company established stability and security in 2020 and entered 2021 with more than £1bn of available liquidity.
achieved through actions including a sabbatical programme, a voluntary severance programme and delayed or highly controlled recruitment. As a largely international business, the Group took the decision not to access government furlough or other support schemes in the UK, relying on our own actions and initiatives.
Another major priority for the Board and the Group through the period was the preservation of cash. This included a strong focus on working capital management, as well as a series of financing activities to reduce interest costs and strengthen the balance sheet. With the full support and encouragement of Shareholders, this included the placing of new shares to raise fresh equity, the issue of Euro bonds, the redemption of our US private placement notes and the pause to dividends.
The Board was fully supportive of these actions and participated in a number of discussions and deliberations on different financing options, always seeking to balance the need for additional liquidity and flexibility, with the interests of other stakeholders.
The combination of our cost, cash and financing actions ensured your Company established stability and security in 2020. The Group entered 2021 with more than £1bn of available liquidity – which is further detailed in the Financial Review – no financial covenants, no debt maturities before 2023 and with the business trading cash positively, even without a broader recovery in physical events.
Depth and digitalThe experience of the pandemic has underlined the importance of digital technology and digital capabilities, as well as the value of digital revenue.
With customers unable to travel and predominantly working online, the adoption of virtual events and digitally focused lead generation and marketing services has accelerated and we believe this is unlikely to fall away as physical events return. This creates an exciting opportunity for Informa, building on work that was already underway before the pandemic, with the potential to further extend the reach of our brands and deepen our relationship with customers.
There is much to do here but the Board is aligned with the leadership team that committing and investing in this area is both a necessity and a major opportunity for the Group, and there is more on Informa’s digital plans in the Group Chief Executive’s Review starting on page 12.
Board developmentThe appointment of John Rishton as my successor followed an extensive search process led by the Senior Independent Director Gareth Bullock on behalf of the Nomination Committee and wider Board, supported by external adviser Spencer Stuart. While I was not part of this process, which is described in more detail on page 109, I was delighted with the outcome, as John is an outstanding successor, given his extensive and varied non-executive and executive experience, and his existing knowledge and understanding of Informa.
John will formally take over the role at the Annual General Meeting (AGM) in June, after a sensible handover period and to enable him to complete the 2020 full-year reporting process as the current Chair of the Audit Committee. He will be succeeded in this role by Gill Whitehead, who has made many valuable contributions since joining the Board as a Non-Executive Director in 2019, including as a member of the Audit Committee.
After the close of 2020, in March 2021 we also announced Gareth Bullock would not be standing for re-election at the June 2021 AGM in order to focus on other interests. Gareth joined the Board in 2014 and has served as Senior Independent Director since that year, during which time he has provided
many valuable contributions, most recently leading the Chair succession process. It was also confirmed that Patrick Martell, Group Chief Operating Officer, has joined the Board as an Executive Director, and we look forward to his future contributions.
Engaging and supporting stakeholdersThe level of engagement between the Board, Senior Management and colleagues was more intense than ever in 2020, with nearly 20 Board meetings and calls and many more individual interactions.
As part of this, the Board received regular detailed updates on colleague engagement, helping it to monitor the breadth of communications across the business and gauge the impact of the pandemic on morale and the Group’s culture. This included the results of colleague surveys, which encouragingly recorded high levels of engagement and strong support for the actions taken by management in response to COVID-19.
The Board also engaged frequently with Shareholders through 2020. Before the pandemic, in January we ran our annual Chair investor roadshow, meeting with the majority of our top 30 Shareholders for an open discussion on a breadth of matters.
Later in the year, once the Group had established stability and security, the Board consulted with nearly 70% of our Shareholder base on the 2021-2023 Equity Revitalisation Plan, an updated remuneration policy relevant to the current situation and the very different position the Group now finds itself in.
Introducing the Chair Elect
QWhat experiences will you draw on in this role?
AI am lucky to have worked in several different industries for over 40 years, both as an Executive and Non-Executive Director, and the highs and lows of that experience provide a lot to draw on when guiding and supporting the leadership team. Having joined the Informa Board and been the Chair of the Audit Committee since 2016, I also have a strong understanding and empathy for Informa and its strong culture, which I think is equally valuable and important.
QWhat excites you about the Company’s future opportunities?
AInforma works in what we call the Knowledge and Information Economy, which is a rich space for innovation and growth. The demand for intelligence you can trust, data that is specific to your market and connections with exactly the right customers and audiences is only increasing. Informa has a tremendous portfolio of brands serving these specialist markets, many with decades of pedigree. This provides all the ingredients for future growth and continued success.
John RishtonChair ElectChair from June 2021 AGM
This input was invaluable in shaping the final policy, which was approved by Shareholders in December and is detailed on page 116.
Return and revitalisationAfter a year that nobody could have predicted, it is a real achievement that your Company enters 2021 in a position of stability and security. This provides a solid foundation on which to build, in a year that is likely to remain highly uncertain.
At the time of writing, the roll out of vaccine programmes provides optimism that the beginning of the end of the pandemic is in sight, but the Group is not relying on this and, in any case, it will clearly take time for broader confidence to rebuild, suggesting 2021 is likely to be a year of staged return rather than full rebound for Informa’s event-led businesses.
Importantly, the challenges of the pandemic have not influenced the Group’s commitment to become a more sustainable business. As is detailed on pages 42 to 44, following the launch of FasterForward in 2020, we have made good progress towards our five-year commitments this year, becoming a certified CarbonNeutral® Company and achieving a record position in the Dow Jones Sustainability Index (DJSI).
As I step away from Informa, I can reflect on a Company that made great strides over the years. Informa is unique, and at its heart lie its colleagues and its engaging and collaborative culture.
It has been a privilege to be associated with such a Group and I look forward to watching it continue to grow and develop over many years to come.
The challenges faced in 2020 and the way in which colleagues and the leadership team have dealt with them have only strengthened my belief the Group’s best days are still to come.
Derek Mapp Chair 22 April 2021
QWhen you take up the role of Chair, what are the immediate priorities?
AHaving been on the Board since 2016, there is a strong sense of continuity, so I would expect the near-term priorities to remain very similar. I am looking forward to working with the leadership team on the continued response to the COVID-19 pandemic, as well as the further development of the Group’s digital and data capabilities, which will be key to our long-term growth potential. With Derek’s departure, another area of focus will be to ensure the Board continues to have the right mix and diversity of experience, skills and knowledge.
INFO
RM
A P
LC A
NN
UA
L RE
PO
RT A
ND
AC
CO
UN
TS 2
02
0
7
ST
RA
TE
GIC
RE
PO
RT
INFO
RM
A P
LC A
NN
UA
L R
EP
OR
T A
ND
AC
CO
UN
TS
20
20
6

Deepening our portfolio of business-to-business (B2B) knowledge-based products and services, with a focus on new and enhanced digital and data-enabled products and services offerings
Read more about our progress in the Divisional Reviews (pages 50 to 63)
Championing sustainability within our business and across the markets we serve and accelerating Informa’s position as a sustainable business
Learn about our 2020-2025 FasterForward programme and achievements (pages 42 to 44)
Pursuing targeted additions and partnerships that deepen our connections and add new capabilities in our delivery methods and chosen markets
Details of recent partnerships are in our Divisional Reviews (pages 50 to 63)
Building on the stability and security achieved in 2020 to support the balance sheet, providing flexibility for investment and expansion
See the Financial Review for more detail on our 2020 financing action plan (pages 82 to 93)
Continuously improving and simplifying our operating systems while strengthening our product capabilities
See the Group Chief Executive’s Review for information on our operational improvements (pages 12 to 19)
Investing in colleagues, culture and the working environment, including through extending balanced and flexible working, to enable individual and collective success
Read about how we support colleagues and invest in culture (pages 30 to 34)
Security and Specialisation
Since the conclusion of the 2018-2019 Accelerated Integration Plan, Informa has followed a consistent strategy, focused on six elements, through which we seek to provide high quality, must-have knowledge and connections to our specialist customers.
In 2020, certain elements took precedence as we focused on ensuring the Company’s financial stability and security, preserving the long-term value of Informa’s brands and supporting colleagues and customers.
In 2021 and beyond, expanding our portfolio with digitally focused products and services is a particular focus, as we look to deliver on our purpose and champion our specialist customers in an enhanced and expanded range of ways.
Expanding our portfolio
of B2B products and services
Enhancing our positions
and partnerships
Strengthening our operating
capability
Advancing our commitment
to sustainability
Improving financial
fitness
Maintaining a dynamic
and engaged culture
G R O U P S T R A T E G Y
INFO
RM
A P
LC A
NN
UA
L R
EP
OR
T A
ND
AC
CO
UN
TS
20
20 IN
FOR
MA
PLC
AN
NU
AL R
EP
OR
T AN
D A
CC
OU
NT
S 20
20
8 9
ST
RA
TE
GIC
RE
PO
RT

1. 2. 3. 4. 5.
Supporting colleagues
Championing customers
Operating flexibility
Cost and cash management
Stable and secure financing
C O V I D - 1 9 A C T I O N P L A N
Informa’s Response to COVID-19As the impact of COVID-19 began to emerge in January and early February 2020, we moved at pace to establish a comprehensive plan designed to respond to, and where possible get ahead of, the effect of the pandemic on our business, markets and key partners.
There was a clear strategy: to secure the stability and strength of the business in order to preserve the long-term value of Informa’s brands, customer relationships and culture. In what was a fast-moving environment, we prioritised quick Group decision making with clear guidance and continuous communications, so that teams around the business could successfully apply this strategy to their own markets and products in an agile way.
Our approach was led by a COVID Executive Leadership Group comprising the Executive Management Team (EMT) and specialists from HR, Health & Safety, Technology, Property and Communications, which reported to the Informa Board weekly.
Health and safety• Guidance and advice
on government and safety directives
• Offices adapted for enhanced hygiene
• Rapid, seamless shift to remote working
Wellbeing and support• Enhanced pastoral
support• Focus on mental health
and wellbeing services• Dedicated colleague
support fund established• Voluntary sabbatical and
severance offered• Flexible working formally
made available for everyone under the balanced working programme
Open engagement• Frequent leadership
engagement• Multi-channel
communications• Direct colleague input
through Pulse surveys
See more in Colleagues and Talent (pages 30 to 34)
8,500Colleagues participated in June Inside Informa Pulse survey
86% Colleague engagement score
Service resilience• Maintained service levels
and quality• Continuity of all digital
products
Pandemic response• Accelerated publication
of virus-related scientific research
• Provided open access to critical research and clinical trial information
Market support• Continued focus on
connecting customers with timely, specialist knowledge and helping businesses make decisions and trade through digital services
• Established $5m Natural Products Expo West fund to support small businesses disrupted by the pandemic
• Expanded volunteering options to enable colleagues to support their communities
The Postponement Programme• Proactive programme
to reschedule 250+ physical events
• Detailed customer and partner engagement
• Adapting physical events for safety and effectiveness and expanding virtual and digital services
Enhanced safety• Led industry collaboration
on post-pandemic event safety and hygiene standards
• Created Informa AllSecure to enhance security of all Informa physical events
Digital acceleration• Accelerated virtual events
and digital product development
Event savings• Systematic capture
of savings from postponed events
Cost management• Non-essential
expenditure halted e.g. projects and advisory services
Phasing and flexibility• Recruitment activity
paused• Annual salary
reviews deferred
Management actions• Salary/fee sacrifice by
CEO, Group Finance Director, EMT and Non-Executive Directors
Adapted structures• Balanced working
programme with office space consolidation
• Targeted mandatory redundancy programme in impacted businesses
Cash retention• Strong management
of working capital
Short-term liquidity• Increased short-term
liquidity• Access to £750m surplus
credit facility• Eligibility for Bank of
England Covid Corporate Financing Facility
• Dividend suspension
Equity and debt capital• Additional Euro bond
debt issuance• Oversubscribed £1bn
equity placing
Financing flexibility• Actions taken to remove
all financial covenants
Secure long-term funding• No debt maturities
until 2023• Available liquidity of £1bn
See more in Customers (pages 38 and 39)
See more in the Divisional Reviews (pages 50 to 63)
See more in the Financial Review (pages 82 to 93)
See more in the Financial Review (pages 82 to 93)
10Informa AllSecure biosafety commitments
500+ Virtual events in 2020
4,000+COVID-19 clinical trials tracked
$5mNatural Products Expo West customer fund
33%Executive Director salary sacrifice
£600msavings from 2020 cost management programme
£2bn+ Refinancing activity in 2020
£1bnAvailable liquidity
INFO
RM
A P
LC A
NN
UA
L R
EP
OR
T A
ND
AC
CO
UN
TS
20
20 IN
FOR
MA
PLC
AN
NU
AL R
EP
OR
T AN
D A
CC
OU
NT
S 20
20
10 11
ST
RA
TE
GIC
RE
PO
RT
Our subscription-led businesses, Informa Intelligence and Taylor & Francis, performed resiliently during 2020, with a strength and consistency that valuably underpinned the Group’s portfolio and position.
G R O U P C H I E F E X E C U T I V E ’ S R E V I E W
It has been an exceptional and demanding 12 months at Informa. Every business, and indeed every part of society, was impacted by the COVID-19
pandemic in some way during 2020. In our Company, this was most acutely felt in our event-led businesses, as international travel and the ability to gather in person at scale became constrained in most of the world for most of the period.
The Group’s headline results illustrate the significant financial impact this had across the year. In spite of the scale of the impact in these businesses, however, we successfully secured the stability of the Company through a comprehensive plan that both responded to the immediate disruption and laid the foundations for revitalisation and a return to sustainable, long-term growth.
In doing so, we were well served by the attributes and characteristics fostered in the Group over the last seven years.
The breadth and balance of Informa’s portfolio by region, customer market and the mix between consistent and recurring subscription revenues and event-led revenues helped underpin the Group’s stability and resilience during 2020.
The investments made under the 2014-2017 Growth Acceleration Plan in digital products and technology platforms, particularly in Informa Intelligence and Taylor & Francis, supported continued customer demand and a consistent performance by these businesses.
In an exceptional and demanding year, we successfully secured the stability of the Group through a comprehensive programme, which both responded to the immediate disruption of the pandemic and laid the foundations for revitalisation and a return to sustainable, long-term growth.
Stephen A. CarterGroup Chief Executive
Agility and Specialisation
A track record of financial discipline, with a focus on cash generation and cash conversion, allowed us to take decisions for the long term.
Informa’s focus on championing specialist customers which, as we described in detail in last year’s report, is at the heart of the Company’s purpose, combined with a culture built on partnership and working with freedom and agility, enabled us to act quickly and take decisions based on maintaining the long-term value of our brands, our customer relationships and our colleagues.
Two groups were particularly critical to the Company’s ability to weather the disruption of 2020. On behalf of the Board, I would like to put on record a deep appreciation for the outstanding contribution and commitment shown by Informa colleagues. In what was a personally and professionally demanding time, teams throughout the business went above and beyond to support the Company, support each other and keep serving our customers.
We are also appreciative of the continued, active engagement of our Shareholders and the support shown for our COVID-19 Action Plan, during what has been a volatile and uncertain period.
Consistency in subscriptionsThe Group’s 2020 financial results reflect the trading performance of our five Operating Divisions, combined with the comprehensive programme of activity undertaken to ensure Informa’s stability and security through the year and strength moving into 2021 and beyond.
Our subscription-led businesses, Informa Intelligence and Taylor & Francis, performed resiliently during 2020, with a strength and consistency that valuably underpinned the Group’s portfolio and position and continue to provide us with strong market positions in scholarly research, advanced learning and specialist business-to-business information services.
Informa Intelligence recorded revenues of just over £300m and underlying revenue growth* of 1.8% as customer demand for trusted, specialist data and intelligence remained strong. Among other markets, we have built a
particularly established position in the pharma and clinical trial communities, with recognised specialist brands and deep customer relationships. This was an especially active market during the year and an area in which we continue to develop our intelligence services through enhancing our products, creating new services based on our specialist data sets and investing in product delivery and application programming interfaces (APIs).
In our three largest Intelligence businesses, renewals for digital subscription products stood at over 90% by value and stayed strong through the important fourth quarter renewal period.
In our scholarly research and advanced learning business Taylor & Francis, despite the pandemic causing disruption to university campuses and some sales channels, the business delivered a strong performance throughout the year.
Revenues were just under £560m and underlying revenue growth was broadly flat at (0.2%). Subscriptions to journals and digital research products comprise around 60% of Taylor & Francis’s portfolio and renewal levels remained strong, driven by our depth of specialist research content and the strength of our brands.
We saw particular growth in our open access research business, with article submissions rising by 30% on 2019 and continued work to offer customers choice and flexibility in access to content and how research is published. Where printed book products were affected by disruption in the supply chain, largely in the second quarter, this was balanced by an acceleration in demand for ebooks. Ebooks accounted for 40% of books sales in 2020 compared with just over 30% in 2019.
INFO
RM
A P
LC A
NN
UA
L RE
PO
RT A
ND
AC
CO
UN
TS 2
02
0
13
ST
RA
TE
GIC
RE
PO
RT
INFO
RM
A P
LC A
NN
UA
L R
EP
OR
T A
ND
AC
CO
UN
TS
20
20
12

G R O U P C H I E F E X E C U T I V E ’ S R E V I E W c o n t i n u e d
In Informa Markets, Informa Connect and Informa Tech... we moved quickly during the year to switch the focus to serving customers through virtual events and digital services.
Physical events disruptionInforma Markets, Informa Connect and Informa Tech generate a majority of revenues from activities linked to events that match sellers with buyers in specialist markets, enable businesses to showcase and source products, deliver high quality content and training or facilitate networking and learning.
While in-person events performed well through January and February, the emergence of COVID-19 with worldwide travel restrictions and lockdown measures led us to implement a Group-wide Postponement Programme from March 2020. Informa held virtually no physical events of any nature anywhere in the world during the second quarter. Many were rescheduled to later in the year, and postponements have since been extended to late spring and early summer 2021.
As a result, these businesses saw a significant reduction in revenues in 2020. Informa Markets had revenues of just under £525m (2019: £1,438m); Informa Connect’s revenues were just under £125m (2019: £286m); and Informa Tech had revenues of just over £150m (2019: £256m).
We moved quickly during the year to switch the focus to serving customers through virtual events and digital services, maintaining the profile of our brands and maximising the non-events revenue these businesses generate from specialist digital media and marketing services. As well as participating in these digital formats, we have encouragingly seen a strong commitment from customers to take part in rescheduled editions of physical events, evidenced by continued positive trends in forward bookings.
The flexibility of our teams in Mainland China and effectiveness of national virus control measures meant we could resume in-person physical events there from June. This included successful editions of several major brands during the second half, with strong domestic participation but limited attendance from international businesses due to ongoing travel restrictions.
Group stability and securityThe combination of strength in subscription and digital products, and disruption to physical events, meant the Informa Group generated revenues of just under £1.7bn (2019: £2.9bn) in 2020.
Adjusted operating profit was just under £270m, with free cash outflow of £154m reflecting the impact of postponed physical events as well as one-off costs associated with securing our balance sheet and reducing costs.
It is testament to the breadth and depth of the business, and the effectiveness of the financing and cost and cash management measures taken as part of our COVID-19 Action Plan, that despite an underlying Group revenue decline of just over 40% and operating loss of £880m at a statutory level, the business achieved stability and security. We entered 2021 with a cash positive run-rate, even without the broader return of physical events, and have available liquidity of over £1bn and no debt maturities before the first half of 2023.
The goal of our COVID-19 Action Plan was to respond quickly to and stay alongside, if not anticipate, the impact of the pandemic. The panel opposite describes some of the specific actions taken to manage our costs and cash and secure the balance sheet, with a full overview of what was a comprehensive programme of actions and support to our key communities on pages 10 and 11.
The principal decision taken by the management team, and fully endorsed by the Board, was that all decisions and actions would be taken through the lens of what would best preserve the long-term value of the Company and our most important assets: our brands, our customer relationships and our colleagues. This focus has, we believe, ensured that the Informa Group starts 2021 with all the strength and quality of positions, capabilities and relationships to return to long-term sustainable growth.
Colleague supportWithin Informa, supporting each other, ensuring everyone can do their best work and develop their careers, and maintaining an open and continuous flow of communication are permanent features of the way we work.
Supporting, informing and engaging colleagues everywhere became an even greater leadership focus in 2020. In a unique and fast-moving environment, we placed particular emphasis on colleagues’ physical safety as well as broader wellbeing, the preservation of roles and salaries, and frequent communication and engagement.
As the pandemic started to lock down locations, we quickly and successfully shifted to remote working at scale. Thanks to previous investments in cloud-based technology, all colleagues retained full access to the systems and tools they needed with extra equipment provided where required.
At all times during the year, we emphasised and strictly followed official authority guidance on health and safety precautions inside and outside of work. When offices reopened in some countries during the second half, every location put in place enhanced hygiene practices and distancing measures to ensure a safe working environment.
To respond to the particular challenges of 2020, we enhanced the personal and professional services and assistance available to colleagues. This included introducing a dedicated sabbatical programme for those wanting to take a temporary period of time out to manage personal circumstances. We also created a dedicated colleague support fund as a critical back stop for households facing financial difficulties caused by the pandemic.
Day to day, we aimed to provide all teams with as much flexibility as possible in adapting to changing circumstances, such as through flexible hours and adapted work objectives. To respond to instances where the pandemic had changed colleagues’ ambitions or circumstances, we introduced a voluntary severance programme in the third quarter to help colleagues transition to a new career or stage of life.
Preserving long-term strength and value Under our COVID-19 Action Plan, shown in full on pages 10 and 11, our immediate priority was to secure the Group’s financial position so we could take the right decisions for the long-term strength of our brands, customer relationships and colleagues regardless of the path of the pandemic.
The financing pillar of our Action Plan included:
• Strengthening short-term liquidity, through securing access to a £750m surplus credit facility
• Securing additional long-term funding with two successful Euro and sterling bond issuances of just under £780m in total with five and six-year maturities
• Following detailed Board and management discussion and the support of Shareholders, issuing £1bn of new equity in an oversubscribed share placement completed in May
• Enhancing financing flexibility by repaying our US private placement loan notes in November and cancelling the previously arranged short-term credit facility, removing all financial covenants from our balance sheet
• Confirming eligibility for the Bank of England’s Covid Corporate Financing Facility, although this support was not accessed
• Suspending dividend payments in 2020
These financing actions were complemented by a comprehensive cost and cash management programme, including:
• A review of all in-flight projects and tight controls on new project expenditure
• Removing all non-essential spend, including on travel and new service procurement
• Engaging with venue partners and contractors to align contracts and payments to postponed physical events
• Adapting marketing and promotional activity and expenditure
• Reassessing and adjusting software licences to the shape and needs of the business
• Closing smaller offices and resizing space in other locations to suit a greater future balance between home and office working
A large proportion of our investment each year is in colleagues. Our cost management focus in this area was to sensibly manage spend while providing colleagues with flexibility and preserving roles and salaries as far as possible, including through:
• Tight controls on new recruitment activity and role replacements
• A deferral of 2020 annual salary increases in the most impacted businesses
• A 33% salary sacrifice by the Executive Directors and a 25% salary/fee sacrifice by the Non-Executive Directors and Executive Management Team
• Three and six-month sabbatical schemes for colleagues
• A voluntary severance programme with support package for colleagues seeking to change careers or move into a new life phase
£1.66bn2020 Group revenues (2019: £2.9bn)
£600m+Cost savings delivered in 2020
INFO
RM
A P
LC A
NN
UA
L R
EP
OR
T A
ND
AC
CO
UN
TS
20
20 IN
FOR
MA
PLC
AN
NU
AL R
EP
OR
T AN
D A
CC
OU
NT
S 20
20
14 15
ST
RA
TE
GIC
RE
PO
RT
G R O U P C H I E F E X E C U T I V E ’ S R E V I E W c o n t i n u e d
Discussion and engagementColleagues received near weekly updates on Company business developments throughout the year, with multiple opportunities to ask questions about our response to the pandemic, discuss important issues and provide input into decisions. It was encouraging that in a mid-year Pulse survey, over 90% of colleagues thought the Company had provided clear direction and information on Informa’s response to the pandemic, with positive commentary on the range of practical and support measures put in place.
Before the pandemic, around 10% of our colleagues were permanent home workers and we have long provided the technology, support and flexibility to allow teams to work in the places and ways that best suit them. 2020 brought home working to a much wider range of colleagues, and based on that accelerated experience and subsequent feedback and learnings, we are establishing balanced working as our principal way of working post pandemic. This involves making a balance of remote and office working a permanent feature for everyone, adapting our practices to better support this blend and reimagining our office space so that our office hubs become focal points for collaborative work.
A broader guiding principle at the heart of the way we work at Informa is that success is a partnership. We believe that we get to better answers, and make the business a more enjoyable place to work, when we combine our talents and embrace ideas wherever they come from. This belief in the value of a mix of backgrounds and talents, and in fostering an inclusive working environment, is at the bedrock of our culture.
We established the AllInforma diversity and inclusion programme three years ago and have since welcomed two colleague-led AllInforma networks under this umbrella: AllInforma Balance, focused on gender balance, and AllInforma Rainbow, which supports and celebrates the LGBTQIA+ community.
Outside of the pandemic, 2020 saw increased discussion about what more we could be doing to advance diversity and inclusion. We were delighted to support the expansion of our networks, including the launch of AllInforma Nations, which focuses on supporting colleagues from ethnic minorities and celebrating different cultures, and are preparing for the introduction of two additional networks in 2021 focused on awareness of disabilities and on supporting early-career talent.
As our networks expand, we have taken the step of appointing one of our most successful business leaders to the new position of Chief Diversity and Inclusion Officer, to better co-ordinate existing activities and accelerate our ambitions at a Company-wide level, and look forward to sharing updates and progress in the future.
Close to customersAll of the brands and businesses that make up the Informa Group share the same fundamental focus to help specialist customer communities learn more, know more and do more in their businesses and professions.
This purpose grounds all our decision making. In 2020, it led us to prioritise preserving the strength of our brands and customer relationships by putting safety at the heart of our physical events, maintaining the quality of our products and continuity of our platforms and remaining focused on serving customers. This included intensive customer communications and engagement in the areas where event postponements meant changing arrangements and schedules.
Informa was deeply involved in a collaboration with industry associations, major contractors and venue owners, and our peers in the events industry, to develop enhanced international safety and hygiene measures for the benefit of everyone involved in physical events, from our own colleagues and customers to suppliers and partners. From this we created Informa AllSecure, described on pages 18 and 19, our blueprint for how these standards apply to Informa events and how we are striving to make our event experiences even safer and more effective in the future.
Several of our digital intelligence and scholarly research brands serve the pharma, medical and scientific communities. These teams worked intensively during 2020 to ensure critical, quality insight related to combating COVID-19 was made widely available in a timely way. This included both a free coronavirus intelligence hub from Pharma Intelligence and more sophisticated dashboards and analytics for subscribers working in the field of clinical trials. Taylor & Francis made around 5,000 relevant articles and a range of books free to access, supporting its customers as well as contributing to the broader response to managing the pandemic.
Accelerating digitalLooking into 2021 and the years beyond, we are confident that the Knowledge and Information Economy remains an attractive market to be in. Demand for high quality, trusted and specialist connections, intelligence and information services from customers working in different individual markets will, we believe, endure as they seek to grow, advance, learn more and do business on the other side of the pandemic.
A range of indicators suggest that customer demand for physical events continues to be robust, particularly for leading brands that take place in major hubs and enable businesses to connect, source product and transact. These include relatively low levels of refund requests from customers of postponed events in 2020, a strong rate of participation in events in markets that have reopened, including Mainland China, and continuing customer enquiries and bookings.
As more major physical event brands return outside of Mainland China, just as we have seen in that country, it is likely that these events will attract a largely domestic rather than international audience in the short term. It is also possible that a certain number of smaller physical event brands, located in less well-connected hub cities, are replaced with virtual events and digital products and services in the medium term.
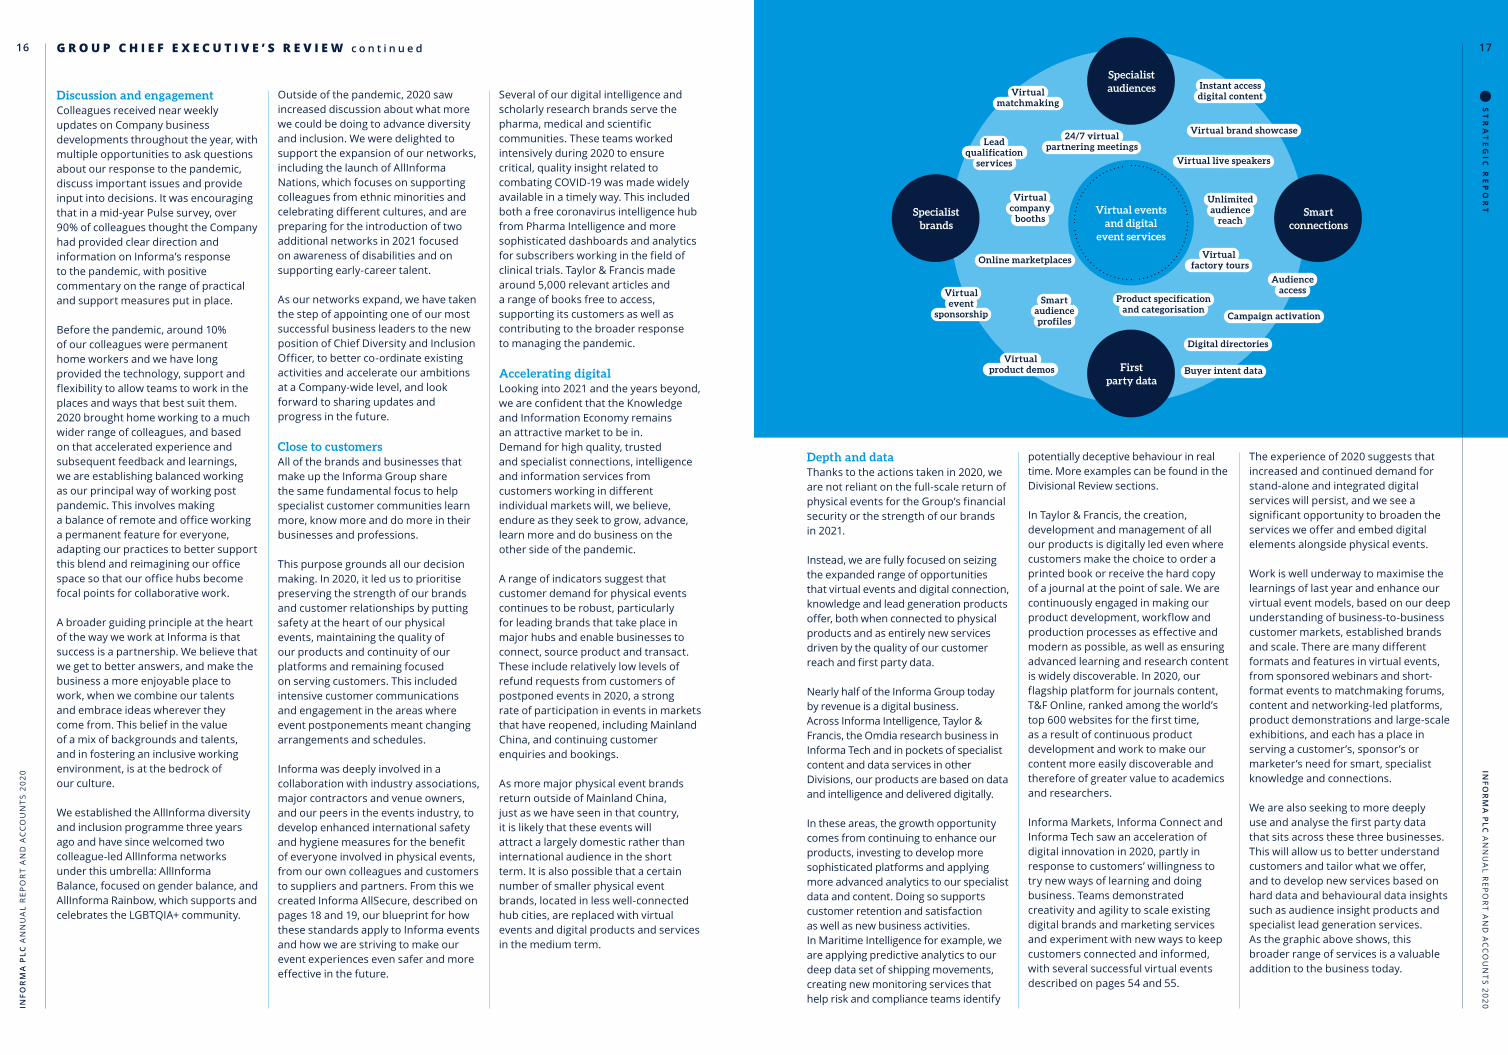
Depth and dataThanks to the actions taken in 2020, we are not reliant on the full-scale return of physical events for the Group’s financial security or the strength of our brands in 2021.
Instead, we are fully focused on seizing the expanded range of opportunities that virtual events and digital connection, knowledge and lead generation products offer, both when connected to physical products and as entirely new services driven by the quality of our customer reach and first party data.
Nearly half of the Informa Group today by revenue is a digital business. Across Informa Intelligence, Taylor & Francis, the Omdia research business in Informa Tech and in pockets of specialist content and data services in other Divisions, our products are based on data and intelligence and delivered digitally.
In these areas, the growth opportunity comes from continuing to enhance our products, investing to develop more sophisticated platforms and applying more advanced analytics to our specialist data and content. Doing so supports customer retention and satisfaction as well as new business activities. In Maritime Intelligence for example, we are applying predictive analytics to our deep data set of shipping movements, creating new monitoring services that help risk and compliance teams identify
potentially deceptive behaviour in real time. More examples can be found in the Divisional Review sections.
In Taylor & Francis, the creation, development and management of all our products is digitally led even where customers make the choice to order a printed book or receive the hard copy of a journal at the point of sale. We are continuously engaged in making our product development, workflow and production processes as effective and modern as possible, as well as ensuring advanced learning and research content is widely discoverable. In 2020, our flagship platform for journals content, T&F Online, ranked among the world’s top 600 websites for the first time, as a result of continuous product development and work to make our content more easily discoverable and therefore of greater value to academics and researchers.
Informa Markets, Informa Connect and Informa Tech saw an acceleration of digital innovation in 2020, partly in response to customers’ willingness to try new ways of learning and doing business. Teams demonstrated creativity and agility to scale existing digital brands and marketing services and experiment with new ways to keep customers connected and informed, with several successful virtual events described on pages 54 and 55.
The experience of 2020 suggests that increased and continued demand for stand-alone and integrated digital services will persist, and we see a significant opportunity to broaden the services we offer and embed digital elements alongside physical events.
Work is well underway to maximise the learnings of last year and enhance our virtual event models, based on our deep understanding of business-to-business customer markets, established brands and scale. There are many different formats and features in virtual events, from sponsored webinars and short-format events to matchmaking forums, content and networking-led platforms, product demonstrations and large-scale exhibitions, and each has a place in serving a customer’s, sponsor’s or marketer’s need for smart, specialist knowledge and connections.
We are also seeking to more deeply use and analyse the first party data that sits across these three businesses. This will allow us to better understand customers and tailor what we offer, and to develop new services based on hard data and behavioural data insights such as audience insight products and specialist lead generation services. As the graphic above shows, this broader range of services is a valuable addition to the business today.
Lead qualification
services
Virtual matchmaking
Online marketplaces
Virtual brand showcase
Audience access
Product specification and categorisation
Virtual company
booths
Campaign activation
Buyer intent data
Virtual event
sponsorship
Smart audience profiles
Virtual product demos
Digital directories
Virtual factory tours
Instant access digital content
24/7 virtual partnering meetings
Virtual live speakers
Virtual events and digital
event services
Specialist audiences
Specialist brands
First party data
Smart connections
Unlimited audience
reach
INFO
RM
A P
LC A
NN
UA
L R
EP
OR
T A
ND
AC
CO
UN
TS
20
20 IN
FOR
MA
PLC
AN
NU
AL R
EP
OR
T AN
D A
CC
OU
NT
S 20
20
16 17
ST
RA
TE
GIC
RE
PO
RT

2.1. 3. 4.
G R O U P C H I E F E X E C U T I V E ’ S R E V I E W c o n t i n u e d
Equity revitalisationThrough focusing on the further development of digital knowledge and connections products and services, adding capabilities and forming new partnerships, the goal is to build from the experience of 2020, exploring new areas of growth while continuing to serve customers.
Notwithstanding the exceptional impact of the COVID-19 pandemic, Informa continues to focus on delivering sustainable, long-term growth to Shareholders, with digital products likely to play a steadily increasing role in the Group’s revenue mix.
Having established stability and security through 2021 and beyond, the ambition is to return to growth and revitalise our equity over the next three to four years to drive value that benefits all Shareholders.
The Board and whole Senior Leadership Team are fully aligned with and committed to the goal of equity revitalisation. And as we drive towards
that value and goal, one of the contributing factors is likely to be our continued position as a sustainable and responsible business.
Sustainability performance and accelerationSince 2014 and our Growth Acceleration Plan, we have been steadily investing in our sustainability capabilities and enhancing our environmental, social and governance (ESG) practices, in everything from the sustainability of our business operations and events to the creation and delivery of products and the way we work with our communities.
As a consequence, before the pandemic Informa had established itself as an increasingly sustainable business with strong rankings in key ESG indices and benchmarks. We entered the DJSI World Index for the first time in 2018 and have retained this position, scoring in the 99th percentile most recently. In 2019, we were first certified by the Science Based Targets Initiative for our ambitious commitments to managing our carbon emissions.
In early 2020 we launched FasterForward, a five-year programme designed to further accelerate our progress towards becoming a more sustainable, positive impact business and seize an opportunity to support our customers and markets to advance their own sustainable practices.
The pandemic has not paused our progress. In 2020 we achieved CarbonNeutral Company status in line with The CarbonNeutral Protocol and were awarded an A- by CDP for action on environmental initiatives. Indeed, we have found that our customers and markets are interested in building back better from this period in part by embedding sustainability and a greater consideration for environmental and social impact into their business and operations.
Board leadership and cultureI would like to take this chance to thank the Board for its considerable support during 2020, especially for the greatly increased time, focus and guidance given to the Executive Directors, leadership team and the Company as a whole. In particular, my thanks go to the Chair, Derek Mapp, for extending his time with the Company for a further 12 months to provide continuity as we managed the response to the pandemic.
I am delighted that, at the AGM in June, John Rishton will take up the role of Informa Group Chair, having previously served as Chair of the Audit Committee. I have worked with John as a Board colleague for nearly four years, and am certain that his broad commercial experience and deep understanding of Informa’s position and culture, combined with the fresh perspective he will bring, will serve the Company and all its stakeholders very well indeed.
Our culture as a Company is arguably one of the reasons why we were able to respond to the impacts of COVID-19
with speed and secure the long-term stability, strength and value in the business.
That tone is firmly set from the top, through the Board and the leadership team. Informa has an established and collaborative culture, with low levels of hierarchy, that allows us to work at pace and share information, gather feedback and take decisions in an effective way. We have established and successful ways of engaging within the business and with our customers, partners and Shareholders outside of Informa, which were put to full use in 2020. We value the trust we have built up in our markets, and we prize agility and encourage teams to act on opportunities as they arise.
All of these characteristics will, I believe, support the Company as we look to return to growth and build back from 2020 with renewed momentum and vitality.
Stephen A. Carter Group Chief Executive
I would like to take this chance to thank the Board for its considerable support during 2020, especially for the greatly increased time, focus and guidance given to the leadership team and the Company as a whole.
Top 600T&F Online one of world’s top 600 sites
A-Informa scored A- from CDP for performance on environmental issues
Cleaning and hygieneWorking with venue partners, our events undertake enhanced deep cleaning before and afterwards, with continuous sanitisation during the event in all areas including stands, booths and around equipment. Additional personal hygiene facilities are made available and, where possible, we pursue accredited external validation of cleanliness and biosafety standards
Physical distancingWe facilitate physical distancing through non-contact registration, minimising queuing, managing the density and flow of customers through the event space during the day, discouraging the exchange of printed materials and ensuring food and beverage facilities allow for space and sanitisation
Protect and detectOur events follow the latest, relevant official authority guidance on screening, including pre- and onsite testing where available and practical, and all locally recommended processes around track and trace services. Participants are asked to wear face masks and have access to qualified health assistance and quarantine areas onsite
Effective communicationsAll our measures are supported by effective communications to participants and event partners, both onsite and before the event, to prepare customers for what to expect and how to plan the most effective experience, and to create confidence
Informa AllSecure is our approach to enhanced health and safety standards at our physical events. It was developed based on a collaboration with major events associations, industry peers and partners such as major venues and contractors. Informa AllSecure comprises a comprehensive range of standards and practices, designed to provide confidence that everyone who comes to an event will find the highest standards of safety, hygiene, cleanliness and quality.
18 19
ST
RA
TE
GIC
RE
PO
RT
INFO
RM
A P
LC A
NN
UA
L R
EP
OR
T A
ND
AC
CO
UN
TS
20
20 IN
FOR
MA
PLC
AN
NU
AL R
EP
OR
T AN
D A
CC
OU
NT
S 20
20

Championing the specialist
Championing the specialist
Ou
r su
bsc
ript
ion
-led
busi
ness
es
Our event-led businesses
Taylor & Francis Informa Connect
Info
rma
Mar
ket
s
Informa Tech
Inform
a Intelligence
B U S I N E S S M O D E L
Informa has a resilient business model centred around our purpose: to champion the specialist by connecting people with knowledge and helping them learn more, know more and do more.
We draw strength from the attractive long-term prospects of the Knowledge and Information Economy and consistent demand for intelligence and connections.
The Group has an international breadth and reach and serves a diverse range of specialist customer markets.
$1.8tnSize of information industry
300m+Under 35s from OECD countries will hold higher education qualifications by 2030
3.5bnInternet searches made via Google every day
11tnToday’s computer chips execute 11tn operations per second
175zbZettabytes of data predicted to exist by 2025
$1.7tnGlobal spend on research and development
Colleagues and cultureWe draw on the skills, application and engagement of 10,000 colleagues. Our culture and principles are designed to help colleagues thrive
Leading brandsWe operate through dozens of product brands, each of which serves a specialist customer market
Relationships and partnershipsWe rely on strong, long-term relationships with business partners and the continued support of our customers
Technology and platformsOur business operations and digital products and services require resilient platforms and technology that is continuously advancing
FinancingWe seek the support of investors and access to financial capital at effective terms, including equity and debt funding
Natural resourcesOur offices, events and products use natural resources to different extents. We seek to do this responsibly and are progressing towards becoming a zero waste and net zero carbon business by 2030
Specialist data, high quality content and actionable industry insight delivered digitally
Transaction-focused physical exhibitions and digital platforms that connect buyers and sellers, generate leads, showcase products and drive sales
Advanced peer-reviewed research delivered digitally and via print-on-demand
Large-scale events in physical, digital and hybrid formats that convene professional communities and provide a platform for sharing insight
Effective sponsorship and marketing services products based on deep customer data and audience reach
Expert research, market intelligence and consultancy services
Accredited training in specialist topics
For Shareholders• Long-term capital growth
through share price value and dividend payments
For customers• Knowledge and connections that
help professionals and businesses achieve more
• Financial returns that enable us to reinvest in products and platforms
For colleagues• Rewards, benefits and investments
in culture and working environment from financial returns
• Professional opportunities from strength of brands and product success
For business partners• Commercial opportunities from
growth and success of products and services
For local communities• Tax contributions that fund
national infrastructure and benefit local communities
• Charity and community partnerships, including volunteer time and financial donations
• Continuous work to reduce carbon and waste footprint
We operate in the Knowledge and Information Economy and serve a range of specialist markets
We are structured into five Operating Divisions, united by a common purpose and guiding principles
Our businesses draw on To provide knowledge-based products and services
That deliver benefits for our communities
Think Big, Act Small Trust must be Earned
Success is a Partnership More Freedom, Fewer Barriers
How Informa operates
Our four guiding principles
Our products include an increasing number of digital and data-based services and Informa takes a structured approach to embedding sustainability in our business and helping customers to do the same.
We invest in our most important assets and relationships, and seek to deliver results and benefits for Shareholders, colleagues, customers and our other partners and communities.
See more in Trends in our markets, pages 22 to 27
Read more about our Divisions starting on page 50
See more on our key relationships in the Heart of Informa, pages 28 to 44
Read more about our Divisions starting page 50
INFO
RM
A P
LC A
NN
UA
L R
EP
OR
T A
ND
AC
CO
UN
TS
20
20 IN
FOR
MA
PLC
AN
NU
AL R
EP
OR
T AN
D A
CC
OU
NT
S 20
20
20 21
ST
RA
TE
GIC
RE
PO
RT

T R E N D S I N O U R M A R K E T S
Life Sciences · Aviation · Fashion · Enterprise Technology · Maritime · Finance · Brand Licensing · Telecoms · Science & Medicine · Pharma & Biotech · Media & Entertainment · Education · Artificial Intelligence · Construction · Agriculture · Health & Nutrition · Pop Culture · Beauty & Aesthetics · Information Security
Remote Control Eric KrapfGeneral Manager Enterprise Connect
Fast PharmaEleanor MaloneEditor in Chief, Commercial Insights Pharma Intelligence
Force of NatureAndrew KellyPortfolio ManagerTaylor & Francis
To seize the opportunities we see in the Knowledge and Information Economy, serve customers well and deliver long-term growth, Informa’s strategy has focused around market specialisation: building depth and international reach in a number of attractive, specialist markets.
While the markets may vary, each is typically international and dynamic, with a secular growth trend, and home to specialists who value high quality knowledge-based products.
Our colleagues are deeply embedded in these markets and have considerable insight into current developments and future trends. This section provides a snapshot of several of the markets Informa operates in, written by our own experts.
INFO
RM
A P
LC A
NN
UA
L R
EP
OR
T A
ND
AC
CO
UN
TS
20
20 IN
FOR
MA
PLC
AN
NU
AL R
EP
OR
T AN
D A
CC
OU
NT
S 20
20
22 23
ST
RA
TE
GIC
RE
PO
RT

Fast PharmaRemote Control2020 marked the quickest transformation in working practices in living memory. Almost overnight, millions of office-based employees were forced to work from home, with some not expecting to ever return to the office full time.
T R E N D S I N O U R M A R K E T S c o n t i n u e d
As COVID-19 swept around the world, threatening healthcare systems, locking down swathes of society and sending economies into recession, all eyes were on the pharmaceutical industry to get life back to a kind of normal.
Companies across the life sciences mobilised. Their task: to develop the diagnostics, therapeutics and vaccines required to
tame the disease.
From a standing start, the clinical pipeline exploded. By late March there were already around 100 different products in nearly 400 clinical trials worldwide and those numbers ballooned to around 675 products and more than 3,500 trials by November.
According to Pharma Intelligence’s TrialTrove, nearly 30% of all trials that were initiated in 2020 were for drugs and vaccines for COVID-19 and its complications.
Fortunately, modern communications technology, and the efforts of the IT professionals who support it, meant the mass
transition to remote working was less arduous for enterprises than it might have been just a few years ago.
The workplace surgeCommunication platforms such as Cisco’s WebEx, Microsoft Teams and Slack helped to keep team members in closer touch and fostered collaboration among employees unable to meet in offices.
The technology existed before the pandemic, but its use during 2020 skyrocketed. Time spent in meetings on Cisco’s WebEx platform tripled in the first month of the pandemic, while Microsoft reported that the number of daily active users on its Teams platform increased to 115m in October, up from 44m in March.
Unsurprisingly, with team members geographically dispersed, video became the go-to way to hold meetings. Before the pandemic, just 14% of enterprise employees used video to communicate often or very often, according to Recon Research. That had risen to 57% by the end of June 2020.
Beyond video conferencing, enterprise-grade collaboration platforms offered other tools, such as document sharing and desktop views, that helped dispersed workers remain productive, and ultimately meant businesses were able to serve their customers.
Call centres go virtualAnother business-critical function that turned to enterprise technology to accommodate the move to remote working was the call, or contact, centre.
Call centres had to transition quickly to home-based work, while maintaining access to the applications and networks needed to serve customers. Not only did advanced enterprise communications systems keep call agents connected but, continuing a longer-term trend, they provided enhanced capabilities that meant enterprises could provide even better customer service.
Technology improvements over the past few years have made call centres more efficient by using artificial intelligence-driven techniques such as speech analytics and chatbots to better screen calls, offer self-service, and deliver the most relevant customer data to the agent at the start of the call.
Despite the disruption to physical call centres, technologies such as these helped enterprises improve customer service metrics and win loyalty. These are critical goals at any time, but were even more important when demand was high, customers were stressed and interactions with agents were often challenging.
Where to post pandemic?Looking to the future of working practices, few organisations have announced plans to completely abandon their office footprint but many are exploring ways to accommodate the positive aspects of working from home, particularly the potential for better work–life balance, while also capturing targeted savings on office space.
According to a survey of US executives, 83% of employers consider remote work a success, yet their commitment to the office has remained, with 68% saying that to keep a strong culture, employees should be in the office at least three days a week.
Just as enterprise technology tools enabled businesses to carry on when offices emptied out, they will play an important part in the future of remote working. The use of video-based meetings is seen by enterprises as a long-term growth trend, not a temporary one. A survey by Nemertes Research found that more than half of enterprises expect to increase their spend on video meeting applications through mid-2021, outpacing anticipated spending on business-critical areas such as cyber security.
Beyond video, enterprises will be attracted to technology developments that continue to strengthen productivity and the employee experience. Colleagues in Omdia, Informa Tech’s research and data brand, report that augmented reality, already being used in customer facing applications, will likely expand to workplace activities.
Vendors will be happy to oblige; enterprise technology providers are banking on their platforms becoming the hubs from which knowledge workers conduct more of their daily work, and are busy integrating various applications that let users manage projects, customers, HR functions and more without leaving the platform or, potentially, home.
INFO
RM
A P
LC A
NN
UA
L R
EP
OR
T A
ND
AC
CO
UN
TS
20
20 IN
FOR
MA
PLC
AN
NU
AL R
EP
OR
T AN
D A
CC
OU
NT
S 20
20
24 25
ST
RA
TE
GIC
RE
PO
RT

T R E N D S I N O U R M A R K E T S c o n t i n u e d
A growing acceptance that climate change is an urgent global issue, with multiple causes and effects, has seen a sharp increase in the demand for high quality research into the environment and sustainability.
Governments across the world continue to make bold commitments about tackling climate change that are increasingly
informing national policy decisions. They, along with advisory groups and lobbyists, are increasingly looking to the scientific and research community for the latest thinking in how best to tackle the multi-sector challenges associated with global warming.
From a publishing perspective, to support the policy changes needed to alter humanity’s relationship with the environment for the better, research needs to be widely accessible and discoverable, both within academia and within advisory, policy and non-governmental communities.
International effortDemand for research in the fields of the environment and sustainability has seen output increase significantly, with 150,000 articles published in 2019, up 81% from 2015.
Tackling climate change requires a global response, and this is reflected in how international the distribution
Spirit of collaboration By mid-November, US pharma giant Pfizer and its German biotech partner BioNTech had announced very strong efficacy results from a late-stage trial of their experimental COVID-19 vaccine using a novel messenger RNA technology not previously used in an approved vaccine. In early December, the UK became the first country to issue an emergency use authorisation.
In short order, vaccines from Moderna and Oxford University/AstraZeneca, also tested in large efficacy trials, won similar approvals, and countries including Russia, China and India have approved seven more.
These products were developed in less than a year, 10 times faster than it would traditionally take a novel vaccine to progress to approval. Upon their arrival, hope bloomed and stock markets made record gains.
The co-operation across pharma, biotech, academic, governmental and non-profit organisations in 2020 was unprecedented in its scope and focus, but collaboration and cross-pollination have been driving growth and progress in the industry for years.
The interdependence of biotech – nimble, innovative, pioneering – and big pharma – deep-pocketed and experienced in late-stage studies, navigating the regulatory and reimbursement labyrinths and engaging with customers – is a key feature of the market and partnering is essential for all parties to prosper.
Investment upDespite lockdowns bringing an abrupt halt to most in-person networking and negotiation, partnering and M&A deals continued to be signed in 2020, some of them sizeable.
The money kept flowing too, with biotech companies raising record amounts of private and public capital. A total of 86 companies launched IPOs in the US, raising $17bn, compared with 50 companies raising $5.9bn in 2019. And nearly $30bn of venture capital was invested in the sector in the US alone, up from $17bn in 2019. The investment reflected confidence in biopharma’s potential not only to develop COVID-19 products but to continue delivering new drugs for cancer and other diseases as well.
But pharma also faced challenges. The impact of reduced patient–physician interactions as healthcare providers focused on caring for COVID-19 patients and minimising the spread of infection meant that drug prescriptions and revenues decreased. New drug launches were reassessed and, in some cases, postponed. Some clinical trial programmes faced problems of patient follow-up, and recruitment and supply chains had to be appraised and secured.
The flipside was that telehealth and online customer engagement, long hyped but slow to catch on, finally came into their own. Sales reps and medical science liaisons, blocked from clinics and hospitals, turned to the virtual environment to continue their engagement with healthcare professionals and it is expected that the shift towards digital will persist in the longer term.
Therapeutic advancesThe biopharma sector entered 2020 with a sense of purposeful optimism, given recent advances in areas as diverse as gene therapy and artificial intelligence.
Despite COVID-19, it continued to make good on its promise to improve the treatment of a wide spectrum of diseases. New products were approved to treat a range of cancers, serious rare diseases and other under-served conditions such as migraine.
Industry continued to work with regulatory agencies and reimbursement bodies to define appropriate review pathways and valuation models for complex new treatment modalities such as CAR-T therapies and one-time gene therapies, which are expected to proliferate in the coming years.
The top 100 companies in the pharmaceutical industry generate annual revenue of around $835bn and spend around a fifth of that on R&D.
With huge global unmet medical need in areas such as infectious diseases, rare syndromes, autoimmune conditions, cancer, cardiovascular disease and more, the target market is vast.
However, the scientific and regulatory barriers to entry are high, and reimbursement and pricing are increasingly challenging. Being able to navigate the pathways to serve the market in a way that is cost effective for both pharma companies and society will be essential if pharma is to retain the gains in public esteem and trust that it has accrued in tackling COVID-19.
of researchers in environment and sustainability is, and in the level of collaboration between research groups located in different parts of the world.
China has overtaken the US as the main producer of original research in recent years, with over 36,500 articles authored by researchers based in China in 2019, compared with 20,500 from US-based authors during the same year, while around 30% of research articles about environmental sciences involved international collaboration in 2019, compared with 27% in 2015.
Broadening impactsResearch into the environment and sustainability is becoming broader and more interdisciplinary, as the impact of climate change beyond the environment becomes clearer, reaching into areas such as social mobility, food security and access to quality education.
Growth areas range from longer-established disciplines, such as sustainable development, climate justice, land use and oceanography, to rapidly developing fields such as evaluating the wider impacts of human–nature relationships beyond the natural environment.
In hydrology and climatology, for example, research into the impact of climate change on the water cycle is helping to inform national policies around reducing water waste, improving water quality and sanitation processes and finding new approaches for water-resources management. This, in turn, will improve consumption patterns as climate change causes fluctuations in precipitation rates and extreme weather events, such as flooding, soil erosion
Fast Pharma continued Force of Nature
and drought. This kind of research and response will also be important in mitigating against non-ecological effects such as population displacement.
In environmental science, research into new technologies to help reduce greenhouse gas (GHG) emissions and the evolution of alternative clean-energy sources will help governments hit climate change targets.
Meanwhile, advances in technologies and the growing availability of data are helping to enhance the quality of research into the environment and sustainability. Over the next few years, the proliferation of drone technology at one end of the technology spectrum, and the installation of satellite constellations at the other, will significantly improve data-gathering capabilities. In remote sensing and geographic information science for example, having greater access to data from multiple sources is helping researchers influence areas as diverse as crop monitoring and climate forecasting.
INFO
RM
A P
LC A
NN
UA
L R
EP
OR
T A
ND
AC
CO
UN
TS
20
20 IN
FOR
MA
PLC
AN
NU
AL R
EP
OR
T AN
D A
CC
OU
NT
S 20
20
26 27
ST
RA
TE
GIC
RE
PO
RT

This section is about the people, communities, relationships and commitments that are important to Informa and the way we approach them.
Our focus is on all colleagues and talent within the business; our customers, who are at the heart of the Company’s purpose to champion the specialist; the business partners we work with to create and deliver products; our Shareholders, who provide the capital to invest and grow; and the broader communities and natural environment we work in.
T H E H E A R T O F I N F O R M A
Non-Financial Information StatementUnder the UK’s Non-Financial Reporting Directive, we are asked to summarise in a statement how the Group manages specific matters that are not principally financially focused. This page provides a summary of those matters as well as where to find more information.
Business model
Pages 20 and 21
Informa operates in the Knowledge and Information Economy. Our purpose is to connect people with knowledge to help them learn more, know more and do more. We draw on six key resources to provide products and services based on knowledge and connections to businesses and professionals working in specialist markets.
Colleagues and their contribution
Pages 30 to 34
The skills and application of all colleagues drive Informa’s business activities. Engaging colleagues, creating a positive and supportive culture and investing in talent are a continuous focus.
• Supporting policies: Include Code of Conduct, Diversity and Inclusion, Health and Safety statement• Key policy and due diligence: The Code of Conduct asks all colleagues to act in accordance with our guiding
principles and the law in areas such as respect, equality and safety. All colleagues are asked to complete and pass mandatory Code training. Rates are tracked and cases of non-completion are escalated to Senior Management. Refresher training was conducted in 2020 and completion stands at 95%
• Risks and risk management: Ability to attract and retain key talent (page 74)• Measurement: Colleague engagement is a Group KPI, measured through our engagement index (page 64)
Environmental impact
Pages 42 to 44
We aim to become an ever more sustainable, high impact business. Through the FasterForward programme, we have committed to being zero waste and net zero carbon by 2030, our two most material environmental impacts.
• Supporting policies: Principally Sustainability and Paper and Timber Sourcing• Key policy and due diligence: The Sustainability Policy asks that colleagues consider economic, social and
environmental impacts in business planning and decision making. The Sustainability team collects data from our offices and physical products, such as events and books, on energy and water use, carbon emissions and waste generation. Guidance on improvement opportunities is provided to colleagues with operational responsibilities and progress is monitored
• Risks and risk management: Climate change is an emerging risk with both impacts and opportunities (page 69)• Measurement: DJSI performance and GHG emissions are Group KPIs (page 64)
Social and community impact
Pages 42 to 44
We fully consider the interests of the local communities around our events and workplaces, the specialist communities our customers are part of and the broader societies we operate in around the world. Under the FasterForward programme, we seek to multiply the positive impact our work has.
• Supporting policies: Include Sustainability, Code of Conduct, Business Partner Code of Conduct, Tax, Responsible Advertising, Editorial Code, Sanctions, Health and Safety
• Key policy and due diligence: Our policies drive various initiatives that ensure we consider and maximise our social and community impact. One example is that all Informa events follow the 12 point Fundamentals programme, which includes requirements around forming community partnerships, embedding wellbeing initiatives and health and safety compliance. The Sustainability team collects results and scores each event, with scores published internally and teams achieving 100% on all criteria celebrated
• Risks and risk management: Related risks are on privacy regulation and inadequate response to major incidents (pages 75 and 76)
• Measurement: We are measuring the economic impact of more of our events on host cities, a FasterForward target
Respect for human rights
Pages 40 and 41
We support the UN’s Universal Declaration of Human Rights and seek to protect and promote the human rights of our customers, colleagues and communities through data privacy, health, safety and security programmes. We take steps to avoid modern slavery in the business and supply chain and publish an annual Modern Slavery Statement.
• Supporting policies: Code of Conduct, Business Partner Code of Conduct, Data Privacy, Health and Safety, Editorial Code, Diversity and Inclusion, Sustainability
• Key policy and due diligence: Our Codes of Conduct commit us and our business partners to ensuring the business and supply chain operate free of modern slavery, and child and forced labour as far as possible. Our framework for managing this includes site and labour checks by operational and audit teams, due diligence on our business partners plus contractual clauses and communications
• Risks and risk management: Related risks include health and safety incidents and ineffective regulatory compliance (pages 75 and 76)
• Measurement: Through audit checks and monitoring whistleblowing reports
Anti-corruption and anti-bribery measures
Pages 40 and 41
We are committed to acting without corruption in all dealings, and to choosing to work only with partners who make the same commitment.
• Supporting policies: Anti-Bribery and Corruption, Gifts and Entertainment, Code of Conduct and Business Partner Code of Conduct
• Key policy and due diligence: The Anti-Bribery and Corruption Policy states a zero tolerance for any form of bribery or corruption. On joining, all colleagues read and agree to the Policy and complete anti-bribery training. Gifting and entertainment is required to be recorded and these records are regularly reviewed and audited
• Risks and risk management: inadequate regulatory compliance (page 76)• Measurement: Through audit checks and monitoring whistleblowing reports
Our relationships and engagement with these groups are considered material because they contribute to Informa’s business model and strategy, and therefore to long-term growth.
They are also important because we believe they are the heart of Informa: what makes us tick and what makes us different.
The Heart of Informa
INFO
RM
A P
LC A
NN
UA
L RE
PO
RT A
ND
AC
CO
UN
TS 2
02
0
29
ST
RA
TE
GIC
RE
PO
RT
INFO
RM
A P
LC A
NN
UA
L R
EP
OR
T A
ND
AC
CO
UN
TS
20
20
28

T H E H E A R T O F I N F O R M A c o n t i n u e d
The importance of colleagues and talentThe development and delivery of our products and services rely on the ideas, expertise and application of all colleagues. This makes talent central to our business model. Ensuring everyone can do their best work, contribute and develop their skills is critical to our performance, as is creating a culture that is open and supportive.
How we understand, respond and engageThe management team: interacts with many other colleagues day to day. Undertakes dedicated engagement activities such as town halls. Monitors engagement levels. Receives informal feedback from colleague advisory boards and formal feedback via surveys. Trends in grievance and whistleblowing are monitored. Colleague feedback is responded to directly and addressed through business initiatives.
The Board: has regular direct interaction with Senior Management and the broader colleague base. The designated Non-Executive Director for colleague engagement, Helen Owers, monitors activities and feedback trends. Updates on engagement activities and outcomes and talent retention data are provided in Board papers and regularly discussed in Board meetings.
What colleagues look forFulfilling work with fair and transparent reward • Flexible working practices • Career development opportunities • To understand business context and have a voice in business developments • A culture of inclusivity and good support infrastructure
Colleagues receive Fair reward packages including flexible benefits and share investment scheme options • Balanced working as standard • Recognition programmes • Multi-format training and development courses • Regular, transparent communications and variety of engagement forums • Platforms to connect and share views • Investment in culture • Support facilities
Colleagues and Talent
At Informa, our colleagues are specialists: highly qualified in a role, whether that is
editorial, sales, marketing, technology or product development, or expert in a market, whether that is nutritional ingredients, artificial intelligence, open access publishing or one of many other areas.
Colleagues are among the Company’s most important strengths. We aim to attract great talent from a range of backgrounds, retain and engage colleagues through many different means, and help everyone make the most of their skills, make a mark and enjoy worklife as fully as possible.
We invest to make Informa’s workplace as open, dynamic, supportive and inclusive as possible, and the Group’s purpose and guiding principles provide colleagues with clear direction. There are many Company-wide services and schemes that all colleagues can access, and each Division complements these with engagement and support programmes tailored to their business priorities and the needs of their teams.
Clear communications, open discussionWe run a dedicated Company-wide communications programme that ensures all colleagues are continuously informed about important developments and business trends and have channels through which they can ask questions and provide input. The aim is to communicate in an open and clear way that builds trust and engagement.
The Group CEO’s proactive engagement programme includes regular Company blogs, town halls, videos, meetings with specific groups including new Graduate Fellows and corresponding directly with colleagues all over the world.
The frequency and range of communications increased in 2020 to reflect the pace of business developments and colleagues’ desire for as regular guidance as possible. Blog and email updates were issued nearly weekly. There was increased use of video to maintain visibility and connection at a time of widespread remote working, and virtual town halls attracted large audiences, with colleagues posing questions live online.
Communications covered financial performance, market trends, the business’ COVID-19 Action Plan, colleague support measures, safety measures in offices, guidance on remote working, the introduction of new digital initiatives and launch of new diversity networks. We continue to focus on accessibility so that communications are as widely understood as possible, such as through video captions and transcripts.
Each Division runs complementary communications programmes for leadership and business. In Informa Connect this includes Ask Me Anything: an open-agenda, two-way discussion forum between Senior Managers and colleagues. News digests were introduced for line managers in Informa Markets to convey critical information succinctly. These have now been expanded to the whole Division and are delivered in English, Portuguese and Chinese.
All colleagues have access to Informa’s social intranet platform, Portal, on desktop and via a mobile app and we continue to invest in new features that enhance connection and sharing.
Portal allows colleagues to blog about personal and professional topics, find, follow and connect with others and start discussions, as well as access Company news, documents and app links.
Having a sayEveryone at Informa is encouraged to share their views and suggestions. There are multiple ways colleagues can ask questions, receive answers and provide input that is incorporated into business planning and decision making.
One of our formal engagement brands is Inside Informa Pulse, a regular Company-wide survey that allows everyone to have a say on topical matters and Company life.
In the June 2020 Pulse survey, colleagues gave views on the Company’s response to the pandemic and what returning to normal might look like. 8,500 colleagues took part and over 90% reported the management team had led by example during the period.
We also used this edition of Pulse to understand how colleagues in different countries and teams felt about future
working patterns. Regardless of location, there was a clear preference for permanently blending office with home working in the future. This has informed the development of our balanced working programme, which will ensure everyone has greater flexibility in how and where they work from after the pandemic.
We also gather formal feedback by surveying new joiners on their onboarding experience as well as colleagues leaving the business. Speak Up is Informa’s third party-run confidential whistleblowing service that is available in over a dozen languages. We actively promoted Speak Up to a greater extent during 2020 to ensure colleagues remained aware of the service even when working from home. In response to questions on how the whistleblowing process works, we developed additional explainer materials to provide detail on the process and foster confidence in its rigour.
INFO
RM
A P
LC A
NN
UA
L R
EP
OR
T A
ND
AC
CO
UN
TS
20
20
30 31
ST
RA
TE
GIC
RE
PO
RT
INFO
RM
A P
LC A
NN
UA
L RE
PO
RT A
ND
AC
CO
UN
TS 2
02
0

Sharing a purposeIn mid-2019, we launched the Informa Constitution: a new articulation of our Company-wide business purpose, to champion the specialist, and a refreshed set of four guiding principles.
In a February 2020 Inside Informa Pulse survey, everyone had a chance to feed back on the Informa Constitution and share what they would like to see next. Over 80% of colleagues reported they were proud to work for a company with Informa’s purpose, with many wanting to learn more about incorporating the principles into day-to-day life.
Informa’s Code of Conduct, along with several other key Company policies, were updated to embed the Company’s new purpose and explain the everyday behaviours that reflect our guiding principles. In April, we ran a campaign called How we work at Informa, featuring a set of engaging, mandatory online training modules and quizzes around key policies.
The importance of these ways of working was set from the top. The first 150 colleagues to successfully complete the training received a personal message from the CEO, who also provided a video introduction to the Health and Safety training module to explain its significance.
Accelerating diversity and inclusionWe believe that Informa is at its best and most successful when everyone can be themselves at work, develop their skills and contribute, whatever their background.
Across the Company, we are seeking to accelerate our work on diversity and inclusion. This will include the first Informa Colleague Census in 2021, a voluntary survey in the US and the UK, to generate data and a deeper snapshot of colleagues’ identities and backgrounds and help guide where future work should focus.
Connecting with the communityWe pride ourselves on being deeply engaged in local and customer communities. Walk the World is Informa’s key annual charity and community event that has raised $1m for good causes over five years and is highly popular among colleagues.
In 2020 Walk the World went virtual to celebrate its fifth anniversary. When most offices could not hold a collective walk, everyone was encouraged to Take 5 for Walk the World: undertake five of any physical
activity, share a picture on the Company intranet and challenge five other people, with the best examples winning a weekly prize for their charity.
Everyone at Informa can typically take up to four days each year to volunteer. The policy was relaxed in 2020 to enable participation in a wider range of community activity, including helping those in need during the pandemic, and give everyone more time to do so subject to manager approval.
Career support and developmentOpportunities to learn and progress are important to colleagues at nearly every stage of their career, and developing our talent helps the business to keep progressing too.
Training is tailored to different roles and Divisions, and there is an increasing focus on allowing everyone to enhance their digital skills. In Informa Markets, a dedicated IM Digital programme delivers over 30 training modules matched to role types, and in Informa Connect, a hybrid events task force runs regular digital marketing, sales and product workshops to share learnings and best practice on enhancing our digital products. All colleagues also have access to thousands of on-demand training courses through LinkedIn Learning.
Making sure colleagues can move to different roles and teams helps us retain experienced talent. All vacancies are advertised internally and secondment and redeployment opportunities were offered in 2020 to help teams with high workload and allow others to learn new skills. For example, over 20 colleagues in Taylor & Francis temporarily moved to help the UK customer services team respond to increased enquiries, as customers adjusted to accessing products off campus.
To attract great early-career talent, we continue to operate several dedicated apprenticeship schemes including a newly launched US and UK Digital Marketing Apprenticeship programme in Taylor & Francis, and a central UK-based Graduate Fellowship Scheme, now in its sixth year.
Rewards and recognition Colleagues everywhere want to feel recognised, fairly rewarded and supported for the energy, effort and dedication they bring to work each day. As well as offering competitive salaries, we provide a comprehensive range of benefits, some of which are Company-wide and others which are tailored to suit regions and countries.
Colleagues in eight countries can participate in equity ownership schemes that offer free matching or discounted Informa shares, providing potential rewards while connecting colleagues more deeply to Informa’s direction and progress. We continue to invest in these schemes. For our ShareMatch scheme, an improved portal and mobile app were introduced in 2020 to make it easier to invest and monitor plans, and for the tax year starting April 2021, the Company has doubled the level of matching shares awarded to colleagues.
T H E H E A R T O F I N F O R M A c o n t i n u e d
Colleagues and Talent continued
Our diversity and inclusion programme AllInforma aims to support all colleagues at work and celebrate different cultures and identities, and we have policies and procedures in place to maintain an inclusive working environment.
There was a particularly deep engagement with matters of diversity and social justice during 2020 sparked by the Black Lives Matter movement, with discussions taking place during town halls, on our intranet and directly with management teams.
In response to a widespread enthusiasm for more forums dedicated to specific communities and cultures, the AllInforma Nations colleague-led network was launched, focusing on supporting colleagues from ethnic minority backgrounds. The network is sponsored by two EMT members, Gareth Wright and Annie Callanan, to provide senior support and ensure ongoing feedback to and from the leadership team.
In Informa Connect, mandatory conscious inclusion training has been rolled out, and in Informa Tech, Senior Management were mentored by members of our partner organisation, Colour in Tech, to better understand key inclusion issues. Taylor & Francis held LGBTQIA+ inclusion training and its Women in Publishing team held an informational event on menopause in the workplace.
We believe Informa is at its best and most successful when everyone can be themselves at work, develop their skills and contribute, whatever their background.
INFO
RM
A P
LC A
NN
UA
L R
EP
OR
T A
ND
AC
CO
UN
TS
20
20 IN
FOR
MA
PLC
AN
NU
AL R
EP
OR
T AN
D A
CC
OU
NT
S 20
20
32 33
ST
RA
TE
GIC
RE
PO
RT

Outstanding achievements are celebrated through the annual Informa Awards, which are live streamed across the Company. A special colleague vote category was introduced in 2020 to enable greater participation, which was won by the Technology Support team for helping everyone to switch to working from home successfully. Recognition for good work and going the extra mile day to day is also encouraged, with shout outs posted on the intranet.
Working balanceFlexible working has long been a feature of worklife at Informa, and we have invested in cloud-based technology infrastructure that allows everyone to work from different locations easily and securely.
Balanced working, which reflects a balance of remote and office working and the principle of balancing work and life commitments, is becoming our principal way of working in the future, in response to colleague input and to help us better attract and retain talent.
To enable this, we started to adapt our infrastructure in 2020, including enhancing ways to get IT support remotely no matter the time zone, changing how we use office space and reviewing our ergonomic assessments and equipment catalogues to cater for safe and effective remote working.
2020 brought specific challenges for colleagues looking to balance work with personal commitments or changes to circumstances. Colleague support measures introduced in the year included two sabbatical programmes, which offered a chance to take time out from work, and a voluntary severance programme that provided an option for colleagues looking for a career change.
T H E H E A R T O F I N F O R M A c o n t i n u e d
Colleagues and Talent continued
Safety and wellbeingThe safety and wellbeing of our teams are a permanent priority, and we ensure colleagues can access a range of resources and services that help them thrive in all aspects of their lives.
In the UK, the US and India colleagues have on-demand access to an independent employee assistance programme, which offers advice and support on topics such as money, family and health, with similar support available through HR teams in other locations.
In 2020, we recognised the heightened demands and uncertainty experienced by colleagues due to the pandemic by significantly stepping up wellbeing and pastoral support.
This included the introduction of a dedicated colleague support fund, providing targeted financial assistance to colleagues whose households or families faced hardship due to the impact of the pandemic.
Many wellbeing activities were delivered to colleagues at home, including Workout Wednesday instructor-led fitness sessions in Informa Tech and weekly wellbeing talks with experts for our support teams covering topics including managing and communicating change.
Curated wellbeing information and advice were published on our intranet and the Informa Intelligence management team held a town hall dedicated to mental health to discuss risks and empower and signpost colleagues to seek support wherever needed.
Colleague snapshot Informa has 10,000 permanently employed colleagues plus 1,200 contractors as at December 2020.
95% of colleagues work full time and 10% of colleagues were permanent home workers before the pandemic.
Colleagues work in 30+ countries and our largest bases are the UK (33% of colleagues), the US (30%) and China (10%).
See page 108 for further breakdowns of gender by colleague group.
59:41Female: Male colleague ratio
39Average colleague age
c£50,000Average remuneration
Where colleagues work
Investors We put significant resource into our ongoing, two-way engagement programme with
Shareholders, debt holders and related advisory bodies such as ratings agencies and proxy advisers.
There is a high degree of involvement from the Executive Directors and Board Directors and we aim to be open, accessible and helpful in our engagement style, providing clear, balanced and comprehensive information through Company communications and building constructive long-term relationships.
The balance of communications channels and formats shifted in 2020 and the overall frequency of dialogue increased, as we sought to keep investors updated on fast-moving developments and gain their support for measures that secured the Group’s financial stability.
Managing our engagementInvestor engagement is co-ordinated and led by a dedicated Investor Relations (IR) team, which seeks to develop strong relationships with institutional investors, buyside and sellside analysts and individual Shareholders as well as relevant advisory bodies. Additional support with debt holders and fixed income analysts is provided by the Group Treasury team.
The CEO and Group Finance Director frequently speak with investors as part of this programme, as do members of the Board on request. Every January, the Chair undertakes an additional investor roadshow that invites Informa’s top 30 Shareholders to meet and discuss any matter they would like.
The Director of Investor Relations is a member of the Group’s EMT and attends Board meetings to ensure investor matters are shared in all critical decision-making forums.
The Company Secretary engages with Shareholders on specific matters of relevance and the Company Secretary team is a first point of contact on Shareholder administration-related matters, as well as ensuring all legal and reporting requirements are met.
The importance of our investorsOur Shareholders are the ultimate owners of the Company, and along with our debt holders they provide the financial capital that funds the business. We depend on their confidence and support to operate and invest, and in turn to deliver sustainable long-term growth.
How we understand, respond and engageThe management team: is available to discuss Company matters at times of scheduled market updates and as part of ongoing engagement programmes. Information is shared and feedback gathered directly at individual and roundtable meetings, at times of formal Company presentations and through direct correspondence. Investor feedback is also provided through advisers.
The Board: has direct interaction through the Chair’s annual investor roadshow and on-request meetings at other times, direct correspondence and at forums including the AGM and results presentations. Directors receive a written and verbal IR update at all Board meetings and receive feedback from advisers.
What investors look forClear strategy to deliver long-term business growth • Regular connection • Capital returns through dividends and equity/debt price appreciation • Dynamic and motivated management team • Engaged and supportive Company culture • Sustainable and responsible business practices
Informa providesClear, timely and balanced information and updates • Professional investor relations including frequent discussion forums • Long-term growth-focused strategy • ESG performance commitments
UK 33%
US 30%
APAC 27%
EMEA (ex UK) 7%
Americas (ex US) 3%
INFO
RM
A P
LC A
NN
UA
L R
EP
OR
T A
ND
AC
CO
UN
TS
20
20 IN
FOR
MA
PLC
AN
NU
AL R
EP
OR
T AN
D A
CC
OU
NT
S 20
20
34 35
ST
RA
TE
GIC
RE
PO
RT

Individual engagement and discrete forumsInstitutional investors comprise 95% of our Shareholder base. Our top 10 Shareholders own 43% of Informa’s equity. To meet the particular needs of this group, we run a dedicated institutional investor engagement programme that involves the CEO, Group Finance Director and investor relations team holding one-to-one meetings and group meetings, and attending larger roundtable events organised directly and through our brokers.
The majority of these meetings shifted seamlessly to video conference calls in 2020 and in total over 400 meetings took place.
This was a marked increase on previous years as we sought investor feedback on and support for key corporate actions. As part of the equity fundraising undertaken in April and May for example, the Group CEO, Group Finance Director and Director of Investor Relations held over 30 meetings and spoke with over 20 Shareholders over five days.
In November and December we also undertook a detailed consultation with Shareholders to gather input and views on a new Remuneration Policy, details of which can be found in the Directors’ Remuneration Report on page 116.
We also regularly receive formal correspondence, via letter, from Shareholders and groups representing Shareholder interests. These are considered and responded to, and key correspondence is summarised and provided to the Board either immediately or as part of the next scheduled Board meeting. In 2020, topics we received feedback on included employer support to colleagues through the pandemic, ESG ambitions and commitments, raising capital to support the response to the COVID-19 pandemic and the suspension of dividends.
Getting to know the GroupTo help investors gain a deeper understanding our products and services, and how they deliver benefits to our customers, Informa holds Investor Days that include the chance to see our products and meet a wider range of management and colleagues.
These are typically held every other year and we aim to rotate locations to provide access to different teams and events. Most recently, this has included Washington DC (2015), at a London external venue (2017) and in one of our London offices (2019).
We also provide trial logins for our subscription products and free access to physical and virtual events on request.
Debtholder engagementInvestors in Informa debt are able to join all of our public results forums and access a full range of materials online.
We undertook particularly frequent and deep engagement with our debt investors in 2020 as we proactively moved to reshape the Group’s debt profile. This included exchanges with the holders of our US private placement notes, as we took the option to repay these ahead of time in November.
In October and November we issued new Euro bond debt, which brought new debt investors into the Company, and the Group Finance Director and Group Treasurer held 10 meetings with over 20 potential investors to provide insight into the Company and take questions.
T H E H E A R T O F I N F O R M A c o n t i n u e d
Open discussion and public channelsOur General Meetings are a key way for all eligible Shareholders to provide feedback on the Company and hold an open discussion with the CEO, Group Finance Director and all Board Directors.
We value holding these meetings in person, often at our offices, as a way to speak to individual Shareholders, and as a time to better understand investor views through correspondence and voting.
One Annual General Meeting and two General Meetings were held in 2020. Unfortunately government restrictions
on gatherings meant these could not be held in person or with virtual participation. We instead encouraged questions to be submitted by email, and full explanatory information was sent out in advance via email and in hard copy where preferred, including a personal foreword from the Chair.
We provide scheduled public updates on the Group’s financial performance typically four times per year. There is a live presentation and Q&A session at the full-year and half-year results, which is simultaneously broadcast digitally if the presentation is not fully an online one. In 2020, we adjusted the dates of
these updates to align with the points in the Company calendar when the most insightful view and guidance could be provided.
Significant news, materials from key presentations and background on the Company are freely available to all Shareholders and interested parties on the Informa website, wherever they are and whatever the size and nature of their holding in Informa.
Investorscontinued
Chair’s annual investor roadshowIn-person and broadcast presentation for full-year resultsFollow-on meetings with institutional investors, individually and at key conferences110+ meetings held
Online presentation and individual Q&A sessions to provide information on equity placingGeneral Meeting to approve allotting sharesAnnual General Meeting130 meetings held
CEO and Group Finance Director held a series of virtual investor roundtables at key industry eventsOnline presentation for half-year results and virtual presentationVirtual debt investor roadshow for bond issuance75+ meetings held
CEO and Group Finance Director held a series of virtual investor roundtables at key industry eventsBoard Chair and Chair of the Remuneration Committee investor roadshowGeneral Meeting to approve Remuneration Policy80+ meetings held
JAN–MAR
APR–JUN
JUL–SEPT
OCT–DEC
INFO
RM
A P
LC A
NN
UA
L R
EP
OR
T A
ND
AC
CO
UN
TS
20
20 IN
FOR
MA
PLC
AN
NU
AL R
EP
OR
T AN
D A
CC
OU
NT
S 20
20
36 37
ST
RA
TE
GIC
RE
PO
RT

T H E H E A R T O F I N F O R M A c o n t i n u e d
Championing Specialist Customers
Informa’s purpose – to champion the specialist – puts customers at the heart of every part of our business and reflects our primary focus on creating
successful outcomes for customers.
What is common among our customers is that they tend to be businesses or individual professionals who work deeply in a particular market and look for knowledge, intelligence or connections that move their business or career forward.
How we serve customers is tailored by business area because the nature of our relationships varies, as does the market. Customers may be individual users of a data product or an institution-level subscriber, an exhibitor at one or more events, a researcher whose work we publish, a marketer or sponsor that we help to reach a specialist audience, an attendee at a virtual festival, a team we provide consulting services to or a reader of our content.
We seek to work, invest, do business and engage in a way that builds strong, long-term relationships.
Connecting people with knowledgeHaving a customer-led purpose, to connect people with knowledge, means that as demand for different types of knowledge changes, our teams respond and adapt to make sure the knowledge we provide and how we deliver it are as relevant and effective as possible.
Several Informa brands and businesses serve healthcare and pharmaceutical customers, while also contributing to broader public health, by providing data and knowledge on scientific and clinical advances in understanding and treating disease.
Many of these communities focused their efforts on responding to the COVID-19 pandemic in 2020, and we worked rapidly to enable our customers, as well as other interested parties, to access trustworthy data and research related to coronaviruses and their treatment as easily as possible.
By early April, our Pharma Intelligence business had launched a free content hub, openly accessible to anyone to understand the progress of different COVID-19 clinical trials and treatments. A more detailed custom analytics dashboard was rapidly developed for subscribers to help drug companies understand how best to design trials in this new area. Additionally, our Skipta network created a COVID-19 UNITE forum for US physicians from different specialisms to access and share trusted knowledge on treating patients.
In Taylor & Francis all relevant journal articles and book chapters were centralised in a free-to-access coronavirus research hub, with new research being prioritised for peer review and fast-tracked through the publication process once approved. A dedicated Disease Outbreaks research gateway was created by the
and exhibitors. Sponsors and exhibitors reported the benefits of being able to reach a wider audience online than at an event venue and the value of participant data, but also the challenges of building rapport onscreen.
Attendees reported that their primary objective was to learn, with the relevance of the content and the organiser’s expertise in their market as top factors in choosing an event. 43% said socialising and 31% said networking was a particular difficulty online. Informa Tech’s virtual events scored 4.1 out of five for overall attendee satisfaction.
Based on these results and to address improvements that would bring value for customers, our focuses for virtual events in 2021 include providing high quality attendee data more frequently to sponsors and developing more effective online networking capabilities.
Long-term relationshipsOur focus on building trusted, long-term relationships drove several initiatives to support customers in challenging circumstances in 2020.
With access to libraries and therefore to physical copies of books severely limited, where institutions had purchased ebooks for single users, Taylor & Francis opened up access to unlimited users during the second quarter, and also offered discounts for libraries to upgrade their access or buy additional electronic copies during this time.
Within our Health & Nutrition business, Natural Products Expo West is a major opportunity for smaller producers of natural and organic products to showcase their goods to major retailers, distributors and investors. When the March 2020 event was cancelled at short notice, in recognition of the considerable business impact and potential effect on the community, Informa Markets created a $5m fund to be distributed among smaller businesses and emerging brands, with recipients chosen by an independent advisory council.
The importance of our customersCustomers are at the centre of purpose as a business. We exist to champion the specialist customers we serve by connecting them with knowledge. The value they place in our brands and products, our continued ability to help them learn more, know more and do more, and the long-term strength of our customer relationships are central to our business model.
How we understand, respond and engageDay to day: colleagues at various levels interact with customers daily and receive ongoing feedback on products and service levels. Formal feedback is through formats such as post-event surveys and market research and informs product development. Data on areas including satisfaction metrics, product use, content readership, marketing effectiveness, renewal levels and new sales are tracked to understand customer success.
The Board: receives updates on customer trends, major relationships and KPIs from the Executive Directors and via presentations and discussions with Divisional CEOs and Finance Directors.
What customers look for Expert, timely and trustworthy knowledge and data that address their specialist market • Services that help them achieve more in their businesses or professional role • Continuous product enhancement and development • Responsive customer service and proactive account management • Good value
What Informa providesHigh quality knowledge-based products • Ongoing investment in products, technology and digital delivery • Engaged colleagues who understand customers’ markets • Dedicated customer service and account teams • Resilient services • Value and choice in packages
F1000 Research team within Taylor & Francis, enabling research findings to be shared rapidly and including a wider range of formats that might be useful to researchers and clinicians, including slides and policy briefings.
In the Aviation industry, customers were facing the challenge of replanning business strategies as global travel ground to a halt. Our Aviation Week Network team quickly responded and shifted its editorial focus.
Between mid-March and the end of 2020, the team produced more than 30,000 digital articles related to the pandemic, with over 5,000 of them features, how-to, opinion or forecast pieces assisting with situational awareness and future planning. Over the same period, we held over 100 Aviation industry webinars, attracting over 165,000 registrations in total.
Enhancing products through customer feedbackCustomer data and feedback are important to informing how we assess our impact, develop existing products and create new services. One way is through formal surveying and in May 2020 Informa Tech commissioned research to understand how customers viewed virtual events to help assess fair future pricing models.
Around 2,000 attendees were surveyed online with additional in-depth telephone interviews with 20 sponsors
INFO
RM
A P
LC A
NN
UA
L R
EP
OR
T A
ND
AC
CO
UN
TS
20
20 IN
FOR
MA
PLC
AN
NU
AL R
EP
OR
T AN
D A
CC
OU
NT
S 20
20
38 39
ST
RA
TE
GIC
RE
PO
RT

T H E H E A R T O F I N F O R M A c o n t i n u e d
Successful Business Partnerships
From technology providers to travel partners, exhibition venues and professional advisers and many more, we work with a
range of partners to create and deliver the specialist knowledge, data and connections our customers rely on to be successful in their businesses.
We set out to ensure that our partnerships are sustainable and of mutual benefit to all parties. In all cases, we expect suppliers to work in a way that aligns with our own standards, guiding principles and goals.
Trusted partnershipsTaking into account each of our Divisions and locations around the world, Informa works with over 30,000 suppliers and partners of different types and sizes.
Our Business Partner Code of Conduct applies to all business partners including suppliers, contractors and agents. It sets out the standards we expect in areas such as treating all of their employees fairly, equally and with respect, practising ethical business and treating data and information responsibly, while complying with relevant laws and regulations.
The Code was revised in 2020 to incorporate Informa’s updated guiding principles and to enhance sections on data privacy, sustainability and modern slavery, reflecting changes to the law and Informa’s strengthened commitments. It is available on the Informa website and all partners are expected to follow its principles and communicate them to any team engaged in work for Informa. We reserve the right to terminate any contract with a business partner if non-compliance with our policies is discovered and is repeated, severe or cannot be resolved.
Third parties also have access to our whistleblowing service Speak Up and are encouraged to report any behaviour that violates the law or does not meet the requirements of the Code. Issues can be reported confidentially in multiple languages by phone or online, and there is a strict no-retaliation policy.
Additional processes are in place for significant partners and relationships. We carry out due diligence on a
risk-assessed basis and, where appropriate, partners categorised as strategic due to their size or because their service is considered business critical undergo enhanced due diligence that includes checks on compliance, social responsibility and anti-exploitation of labour.
Acting responsibly Before engaging with new business partners or suppliers, we ask them to provide strict guarantees with respect to data security and the handling of personal information and all contracts with third parties must include specific data privacy obligations. This is handled through the OneTrust privacy management platform that helps us to manage and control our vendor information centrally.
We have a zero-tolerance approach to any form of bribery and corruption. It is our policy to do business with integrity and according to the law, without the use of bribery or corrupt practices to gain an unfair advantage. Our Anti-Bribery and Corruption Policy and Gifts and Entertainment Policy provide clear guidance in this area. All colleagues undertook training on these topics in 2020, with specific training for line managers which included guidance on gifting and entertainment. New joiners receive anti-bribery training to complete within 30 days.
As an international business with operations in multiple territories, we are committed to complying with all applicable economic and trade sanction laws. In 2020, targeted sanctions training took place for colleagues in positions most likely to encounter sanctions rules. We also developed Division-specific guidance to support the Company Sanctions Policy which, among other things, makes clear where exemptions apply that make it possible to continue to work with customers in a compliant way; for example, individual academics based in restricted countries looking to publish their research internationally.
We have an ongoing commitment to respecting internationally recognised human rights standards, including the UN Universal Declaration of Human Rights, and report annually in our Modern Slavery Statement on action taken by Informa and our subsidiaries to prevent modern slavery and human
trafficking within our business and supply chain.
Overall, Informa’s exposure to the risk of modern slavery is considered relatively low. In 2020, less than 6% of our expenditure was with suppliers located in countries rated high or very high risk. In the limited instances where we work with partners in locations or sectors that could be exposed to the risk of labour abuses, such as in timber or paper production or hospitality, we put additional mitigations in place, including specific anti-modern-slavery contractual clauses, mid-contract human rights audits and onsite monitoring for physical events.
Effective relationships In all areas, we want suppliers and partners to be able to do business with us as easily as possible, including being paid in line with our agreed terms. In this respect we aim to deliver efficient payment practices and operate a clear procurement process.
Despite changes to working practices caused by the pandemic, we maintained
The importance of business partnersWe work with many partners when developing and delivering our products and services. Our aim is to build strong and sustainable relationships that help us provide a great service to customers and reflect our guiding principles; in particular, that success is a partnership and trust must be earned. We also take steps to mitigate the possibility that a reliance on key counterparties disrupts our operations; see page 73 for more on this principal risk.
How we understand, respond and engageDay to day: colleagues at various levels interact with business partners and suppliers daily around ongoing service delivery and new engagements and initiatives. Key strategic partnerships are overseen by management to ensure strong two-way dialogue and large engagements receive additional support from procurement and compliance.
The Board: receives updates on significant strategic partnerships and material supplier engagement and policies through reports from the Executive Directors and discussions with the Chief Operating Officer and Divisional CEOs. Reviews and approves key Company policies and statements, including the annual Modern Slavery Statement, and receives updates on policy training rates and whistleblowing trends through the Risk Committee.
What business partners look forCollaborative relationships that deliver mutual benefit and value • Aligned goals and clear expectations • Open and regular communications • Prompt payment and efficient account handling
What we provideClose working relationships • Clear policies and expectations on ways of working • Prompt service and efficient processes • Fair payment terms
a fully remote service for all supplier payments and queries throughout 2020 and also converted many of our suppliers from cheque payment processes onto electronic fund transfers to speed up payment time and to reduce the risk of cheques going missing.
During 2020, we were alive to both the impact of the pandemic on our requirements and its impact on our partners’ businesses. As part of our cost management programme, where our business requirements changed, we worked with suppliers to adapt the nature of our contracts, such as reducing the number of licences taken for systems where they were no longer being used.
We also worked closely with key partners to understand their position and collaborate on ensuring service continuity. When working with partners that are significant to the business but perhaps smaller in size, we continue to have a practice of extending our expertise in areas such as information security and data privacy to strengthen the partnership and overall service.
INFO
RM
A P
LC A
NN
UA
L R
EP
OR
T A
ND
AC
CO
UN
TS
20
20 IN
FOR
MA
PLC
AN
NU
AL R
EP
OR
T AN
D A
CC
OU
NT
S 20
20
4 0 41
ST
RA
TE
GIC
RE
PO
RT

T H E H E A R T O F I N F O R M A c o n t i n u e d
Sustainability at Informa
Informa is an increasingly high performing business when it comes to sustainability and to incorporating strong ESG practices into everything we do.
As a provider of knowledge, information and connections to businesses and professionals in specialist markets, we also believe we can further serve our customers, support our communities and create benefits for the business by embedding sustainability more deeply into our products and services.
After five years of progressive investments and improvements in our approach to sustainability, we launched FasterForward in March 2020: a structured programme to accelerate the pace and scope of our activities between 2020 and 2025 and achieve a series of ambitions and targets.
FasterForward is focused on the areas where we believe Informa can have the most significant, positive impact: in our operations and the delivery of our products, in the content and knowledge we provide, and in the communities in which we work.
Informa’s sustainability efforts are increasingly recognised by independent parties. We have now been named in the DJSI World Index for three consecutive years, a key performance indicator for the Company. The Group was ranked second in the global media sector in 2020, scoring in the 99th percentile, and we were named as an industry mover for strong year-on-year improvement. In 2020 we were also rated A- by CDP for progress and action on environmental matters compared with an average score of C for companies based in Europe.
Moving faster to zero carbonAs a knowledge and information provider, and a company that is increasingly digital in its services and product delivery, Informa’s direct environmental footprint and use of natural resources are relatively small. We aim to continuously improve the impacts of our business operations, however, and to help customers and partners to do the same.
Under the Faster to Zero pillar, FasterForward commits us to becoming carbon neutral as a business and across
our products by 2025, which means reducing or offsetting emissions from our operations and from the creation and use of our products.
We are also committed to becoming a net zero carbon company by 2030 at the latest. This means reducing emissions associated with our business, supply chain and the use of our products and services by customers as far as practical, and compensating for any residual carbon emissions by purchasing high quality carbon offsets.
In 2020, we achieved CarbonNeutral Company status in line with The CarbonNeutral Protocol thanks to the success of a series of energy efficiency initiatives, including the increased use of renewable energy in our offices, as well as carbon offsetting.
97% of office electricity used now comes from either buying renewable electricity from suppliers or generating our own renewable power, as we do through solar panels installed on our Boulder, US and Colchester, UK offices. Overall office energy consumption reduced in 2020 where colleagues were asked to work from home by local authorities, as described on page 64.
We now offset 100% of the carbon produced by our own business travel, including from flights and hotel stays by colleagues. While business travel was lower than usual in 2020 due to pandemic restrictions, where business travel happens we compensate for the emissions produced by partnering with Natural Capital Partners to fund
certified, audited projects around the world that absorb or avoid GHGs being emitted.
Our GHG emissions KPI can be seen on page 64. In 2020, taking into account the use of renewable energy and carbon offsets, we had zero residual carbon emissions, More detail on all of these developments can be found in the full Sustainability Report online.
Reducing carbon and waste in our productsOur FasterForward commitments include ensuring that Informa’s products are carbon neutral and, by 2025, that they generate half the waste they produced in 2019.
2020 saw the launch of Better Stands, an initiative that aims to significantly reduce the waste associated with physical events. It encourages exhibitors in EMEA to phase out disposable exhibition booths by 2024 and replace them with reusable stands made from high quality sustainable materials. This both significantly reduces waste from the event supply chain and brings real benefits to customers, as reusable stands are often more cost effective and quicker to assemble and disassemble, reducing set-up time and cost. Based on learnings in EMEA, we hope to expand Better Stands to other regions in the future.
Where our physical products create emissions from the materials and packaging they use or their storage and distribution, we are working to reduce or compensate for these emissions.
The importance of sustainabilityBecoming an ever more sustainable, positive impact business is part of Informa’s business strategy. It matters to many of our stakeholders and we believe we have a responsibility to help meet the urgent challenges of a changing world, and an opportunity to use our brands and products to support our customers and their markets to do the same. Our business model makes a relatively limited, direct use of natural resources, and we are continually working to reduce the impact of this.
How we understand, respond and engageDay to day: a dedicated central Sustainability team oversees strategy and reporting. It also supports business teams with embedding and improving performance in their fields and identifying new commercial opportunities. Tools and engagement programmes encourage and enable all colleagues to participate in sustainability initiatives that are relevant to their office, community, brand or role.
The Board: approves strategy, including the FasterForward programme. The full Board receives updates and discusses progress at least twice a year, including presentations from the Head of Sustainability covering FasterForward metrics. Directors participate in Company community and charity initiatives where practical.
What stakeholders look forUnderstand and manage risks from climate change • Seize business opportunities from sustainability and the shift to a low carbon economy • Support the UN’s Sustainable Development Goals (SDGs) • Minimise carbon emissions and waste • Contribute positively to society and local communities • Ensure products and services support sustainable development • Perform well in relevant sustainability indices • Report on progress
What Informa delivers Clear commitments, activities and public targets to accelerate sustainability and more sustainable business practices • Knowledge and content on sustainability embedded into products and brands • Initiatives that support local communities, charities and the supply chain
In Taylor & Francis for example, colleagues have trialled removing the biodegradable plastic wraps used for mailing journal copies and using no packaging at all. This so-called naked packaging has proved popular with customers with little impact on the quality of the mailed copy.
As digital products and services become more significant components of what we provide, Informa is part of an industry collaboration with the University of Bristol to better understand the carbon footprint of digital content so it can be similarly mitigated, and initial results from this collaboration are expected in 2021.
Sustainability Inside Many of our customers are looking to become more sustainable in the way they do business. By embedding relevant sustainability content and knowledge into our brands we can serve customers in expanded ways, support the sustainable development of their markets and, we believe, find new opportunities for growth.
Our Sustainability Inside commitment is to embed sustainability in all our brands by 2025. The way this is done varies depending on the market the brand serves and its format.
In our events portfolios, the Informa Sustainable Events Management System is a structured programme to help embed sustainability content, communications and broader responsible practices inside their brands. At its heart are the Fundamentals, a 12
INFO
RM
A P
LC A
NN
UA
L R
EP
OR
T A
ND
AC
CO
UN
TS
20
20 IN
FOR
MA
PLC
AN
NU
AL R
EP
OR
T AN
D A
CC
OU
NT
S 20
20
42 43
ST
RA
TE
GIC
RE
PO
RT

point checklist of features all events are asked to work towards achieving, and in its second year of running in 2020, more than 25% of submitted events scored 11 or 12 out of 12.
Specifically, the team behind the Interior Design Show in Canada incorporated talks on sustainable design and the relationship between architecture and community life into its 2020 event, and hosted a tour of a manufacturing facility that uses more sustainable, durable materials to inspire the use of longer-lasting products.
Taylor & Francis also provides a curated online research collection dedicated to helping researchers, businesses and governments support the UN’s SDGs. Called SDG Online, the collection has grown since its launch in 2019 and is regularly updated with new content, with a proportion of the collection always free to access.
To help inspire and engage colleagues to embed sustainability into products they work on, we ran a series of FasterForward internal webinars in 2020. One such webinar saw teams from our Asia Pacific Leather Fair, London Tech Week, MAGIC, Routes brands and Taylor & Francis sharing what they had done, their learnings and the outcomes, and providing a chance to ask questions.
Community impact, multipliedOur content, intelligence, connections and data have a positive impact on the specialist markets we serve and the communities in which we operate. That impact is multiplied when we improve access to our brands and products and invest back into our communities. Through our Impact Multiplier programme, Informa has committed to connecting over 1m people to our expert knowledge and networks by 2025 who would not usually have access.
Where teams find accessibility gaps, they get to work on innovative solutions. For example, within our Fashion business in Informa Markets, the team introduced a Fashion for Change incubator programme in 2020 to reduce the barriers to entry Black talent can face, by providing 10 up-and-coming Black-owned brands with marketing promotion and mentorship from a
leading fashion executive, as well as access to our digital Fashion events.
In Informa Intelligence, improvements have been made to our Primal Pictures 3D anatomy software to improve usability for those with disabilities by adding screen reader compatibility, keyboard navigation, audio narration, subtitles, text and interface scaling and colour preference tools.
Another positive impact Informa has on the world is through the economic value our events bring to the cities they are held in. Spending during our events supports local businesses and jobs and generates revenues for local authorities.
Our aim is to contribute $5bn per year to event host cities and we have been piloting tools that measure this economic impact and indicate areas of potential growth. In 2019, we estimated that Informa events held in Las Vegas, a major exhibitions hub, contributed over $600m to the city’s economy, including around $25m in direct state and local taxes.
Policies and reporting In 2020 we created our first stand-alone Sustainability Policy to help colleagues understand Informa’s commitments at a Company level. It sets out how we expect everyone who works at Informa to act with regard to the environment and society and choose outcomes that improve our positive impacts across the economy, society and the environment.
The Policy also provides transparency for external parties, and the Group Sustainability team spends time engaging with investors, industry bodies and index providers to understand their interests when it comes to information and performance data, enhance our disclosures and answer questions. Responding to these discussions, we will publish an online report in 2021 aligning to the framework of the Sustainability Accounting Standards Board (SASB).
Informa is committed to meeting the recommendations of the Task Force on Climate-related Financial Disclosures (TCFD) and much of our ongoing work to more deeply understand and measure the risks and opportunities from climate change prepares us well for future disclosures under TCFD. See page 69 for information on this work and progress.
T H E H E A R T O F I N F O R M A c o n t i n u e d
Section 172 Statement
Board Directors in the UK have a formal duty, under Section 172 of the Companies Act 2006, to consider and balance the interests of a range of stakeholders as part of working to promote the success of the Company. This section shares how Informa’s Directors acted to ensure this outcome in 2020.
Long-term thinking for our stakeholdersInformation on how the Board has considered Informa’s stakeholders, maintained high standards of conduct and fully considered the likely long-term consequences of business decisions is included here, as an addition to the Company’s wider stakeholder activities described in detail in the preceding Heart of Informa section.
The tables on pages 30, 35, 38, 40 and 42 set out the Group’s key stakeholders, why they are important to the Company and how the Board engages with each community. This follows an assessment of the role different groups play in Informa’s business model and in implementing strategy, and a determination of who or what may be impacted by the decisions the Company takes. This helps ensure we operate a responsible business with high standards of conduct.
Informa’s critical stakeholders are colleagues within the business; investors and the access to capital markets they provide; and customers and the strength of relationships with them. The Board therefore focuses its direct and indirect engagement on these groups, closely monitoring feedback and relevant trends and applying these insights to decision making.
The Directors are also alive to the potential impacts and contributions the Group can make to the natural environment, and to societies and
communities related to the work Informa does. These are important groups in their own right, and colleagues, investors and customers are increasingly indicating they are important to their interests too.
In 2020, the Group formalised its approach in this area through the launch of FasterForward, a five-year programme of activities to make Informa a more sustainable, positive impact business. We closely monitor this programme’s progress and are regularly updated on metrics and initiatives.
Other groups play an important role on specific matters. While Informa’s products and services are not regulated, the Group considers and works with government bodies and regulators from time to time, for example with HMRC on UK tax matters, or with pension scheme trustees on Informa’s remaining legacy defined benefit pension schemes.
Engaging and understanding stakeholder interestsWhile certain forums and channels are permanent features of Board engagement, our approach is deliberately flexible to suit what is effective and practical for the business at the time. Typically, our understanding of stakeholder interests is built and maintained through a mixture of direct engagement and business-led interaction that is effectively reported to the Board, and is the product of many years of cumulative discussion and consideration.
The Directors enjoy engaging with colleagues directly while receiving regular formal updates throughout the year on talent trends and activities, including Inside Informa Pulse survey feedback, diversity initiatives and engagement index KPIs.
In 2020, the Board’s direct engagement with the Senior Management team increased significantly as part of supporting the Company’s response to the COVID-19 pandemic, while the Board’s established in-person colleague town hall schedule was unfortunately curtailed due to restrictions on meetings and gatherings. Nearly 20 formal Board meetings and calls were held with Senior Management through the year, on top of scheduled day-to-day interactions and exchanges.
Our nominated colleague engagement Director held additional meetings with the HR and Compliance teams to supplement the Board’s understanding of colleague trends through the pandemic, with particular focus on monitoring feedback, colleague engagement and whistleblowing activity. The importance of supporting colleagues in the workplace through such a challenging period led the Board, through the Risk Committee, to request an assessment of the wellbeing and personal support measures on offer and a review of what other measures might be appropriate.
Key sustainability highlights
99thRanked in 99th percentile of sustainable companies by DJSI
A-2020 CDP score
DISCLOSURE INSIGHT ACTION
97%Office electricity from renewable sources
100%Business travel is carbon offset
Carbon Neutral CompanyCertified in accordance with The CarbonNeutral Protocol
INFO
RM
A P
LC A
NN
UA
L R
EP
OR
T A
ND
AC
CO
UN
TS
20
20 IN
FOR
MA
PLC
AN
NU
AL R
EP
OR
T AN
D A
CC
OU
NT
S 20
20
4 4 45
ST
RA
TE
GIC
RE
PO
RT

S E C T I O N 1 7 2 S T A T E M E N T c o n t i n u e d
Recognising Informa is a largely international business, the Board and leadership team took the decision not to access furlough or other support schemes in the UK, relying on our own actions and initiatives. These were largely focused on the removal of all discretionary costs, minimising travel, pausing non-essential projects and further reducing the Group’s real estate footprint.
As it affected colleagues, the vast majority were achieved through a sabbatical programme, a voluntary severance programme and delayed or highly controlled recruitment.
Board decision making: equity placingThe Board is fully involved in all matters relating to the Group’s capital structure, and in 2020 this included the decision and final approval to pursue a non-pre-emptive placing of shares representing just under 20% of Informa’s equity.
The path that led to this decision involved a wide range of detailed discussions between the Non-Executive Directors, the Executive Directors, the Group’s Senior Management team and external advisers.
These were centred on the various options open to the Company to build stability and security in financing and the balance sheet, given the ongoing
disruption and uncertainty created by COVID-19, ensuring management could focus on managing the business, its brands and customer relationships for the long term.
In addition to the ongoing assessment of the Group’s operating and financial position, the Board took advice from the IR team and external advisers on investor sentiment towards the Group and more generally towards capital raisings in the current climate.
This included direct feedback and encouragement from some Shareholders to consider raising capital to secure the Group’s position. Together, this provided reassurance and strong indications of support for an equity raise.
The Board assessed the different options available for raising equity and considered the scale of capital that might be required, weighing up trading scenarios for the remainder of 2020 and the implications on profits, cash and leverage.
It was concluded that it was in the best interests of the Company, colleagues and Shareholders to act at speed to minimise uncertainty and to issue up to 20% of share capital to ensure the Company had ample liquidity and financial flexibility to the other side of the COVID-19 pandemic.
Board engagement with investors is led by the Chair, the Senior Independent Director and, where relevant, the Chair of the Remuneration Committee. Each year we undertake a dedicated Chair’s investor roadshow in January and all members of the Board are available to meet Shareholders on request and engage directly at the Group AGM.
The Board also receives an update from the IR Director at each meeting and a report that includes data on Shareholder movements, feedback from meetings and sellside analyst recommendations. We spent additional time with investors in 2020 to discuss actions taken in response to the COVID-19 pandemic such as the Group’s equity fundraising, and specific governance matters such as the new Remuneration Policy and Chair succession process.
Informa is a diverse business, working in dozens of specialist markets and providing a range of products and services. As such, we believe customer engagement is most effectively carried out by the operational teams that specialise in those markets and areas. The Board gains an understanding of customer trends and feedback through briefings by the Executive Directors and Divisional management teams and by tracking financial metrics and trends.
In July, the Board received detailed presentations from the CEOs of the event-led businesses to better understand customers’ response to COVID-19 disruption, forward indicators and virtual and digital product development. Data on subscription activity and renewals, and commitments and refund requests for events were also discussed in weekly management team meetings. In previous years, Board Directors have met customers in person at Informa events, and this is something we hope to be able to return to soon.
The Group Finance Director oversees supplier payment policies, reviewing performance and effectiveness with the Finance team periodically and sharing any material updates with Board colleagues. Informa continues to submit supplier payment data to the UK payment practices portal.
Critical decisions and long-term thinkingInforma’s Directors appreciate the framework Section 172 provides for making balanced and long-term focused decisions. It is our belief that synthesising different interests, acting fairly, balancing the interests of different stakeholders and taking decisions that support the Company’s long-term success are embedded into the way we work, and that all decisions are looked at in the round.
Equally, we seek to set an appropriate tone and monitor the Group’s culture and the consistent application of its purpose to ensure that decisions taken throughout the Company support high standards of conduct and reputation.
Directors are given guidance and reminded of their duties under Section 172 when they join the Board and at the beginning of each Board meeting. Each Director brings their own experience and expertise to decision making.
Some Company matters are better suited to discussion at a committee level, but in practice, key decisions that impact stakeholders, or affect the long-term success of the Company, are typically issues discussed and deliberated by the whole of the Board. It is the Chair’s responsibility to ensure this decision-making process reflects the responsibilities set out in Section 172.
Many of the critical matters considered at Board level in 2020 involved understanding and weighing up the interests of different groups, based on recent and historical feedback, and acting in the long-term interests of all parties. These include the decisions to restructure, refinance and reschedule the Group’s debt, raise new equity, pause dividends, take cost and cash management measures that impacted the business’ operations, formalise the FasterForward sustainability plan and introduce a new Remuneration Policy.
Some examples that illustrate our approach follow.
Board decision making: colleague supportThe importance of talent to Informa cannot be overstated. Levels of colleague engagement are tracked as a KPI and an inability to retain talent is identified as one of the Group’s principal risks.
As shown on pages 10 and 11, the Group introduced a range of measures to manage the effects of the pandemic, with a key priority being to provide support to colleagues throughout. As a responsible employer, this reflects the Board’s duty of care for colleagues’ wellbeing and supporting livelihoods, while recognising colleague expertise is essential to serving customers and delivering products.
As part of weekly COVID-19 management calls, the Board discussed and approved the introduction of colleague support measures, including enhanced information and support services, as well as the creation of a ring-fenced fund for colleagues whose households faced particular financial difficulties as a result of the pandemic.
In June, colleagues were asked directly for their views on future cost saving measures in an Inside Informa Pulse survey, with the results informing the Board and management’s future actions, including the introduction of a balanced working model which enabled the Group to manage its real estate more effectively. This model offers colleagues greater flexibility in the future to balance time spent working from home with office-based work.
The Board maintained a close focus on the Group’s financial position, the success of virtual events products and broader customer feedback and market data throughout the year.
As the full disruption to Informa’s events schedule unfolded, the Board and leadership team were clear there was a need to further reduce costs to match the business’ position, with a clear priority to minimise the impact on colleague roles or salaries.
In adopting this approach, the Directors considered pros and cons for Shareholders, the advantage being that all institutional Shareholders were eligible to participate, but the nature of the placing, managed through an accelerated book build, meaning that there would be a relatively limited window for investors to make a decision. In addition, at the time, there was no established mechanism for enabling retail Shareholders to participate.
On balance, the need to act quickly was considered paramount, and this approach was prioritised over other structures that were likely to create significant uncertainty in the trading of Informa shares, which would be detrimental to the value of all investors’ shareholdings as well as to confidence in the Company.
Derek Mapp Chair
INFO
RM
A P
LC A
NN
UA
L R
EP
OR
T A
ND
AC
CO
UN
TS
20
20 IN
FOR
MA
PLC
AN
NU
AL R
EP
OR
T AN
D A
CC
OU
NT
S 20
20
4 6 47
ST
RA
TE
GIC
RE
PO
RT

Taylor & Francis 34%
Informa Markets 32%
Informa Intelligence 18%
Informa Tech 9%
Informa Connect 7%
2020 2019
19%
50%
12%
9%
10%
D I V I S I O N A L S N A P S H O T
A snapshot of our five Divisions
Additional detail on each Division’s performance follows in this section and can also be found in the Financial Review (starting on page 82) and Financial Statements (starting on page 146).
Where alternative performance measures are used, definitions can be found in the glossary (page 227).
Revenue by Division
Informa Connect delivers major, branded, content-driven in-person and virtual events and digital platforms.
These allow professionals working in Finance & Investment, Biotech & Pharma, and several more specialist markets to connect, learn and share knowledge in different ways, all year round.
Informa Markets creates opportunities for international markets to meet, trade, innovate and grow.
We serve businesses working in one of more than 10 specialist markets, helping them research trends, find and showcase products, generate leads and complete sales through large-scale physical exhibitions, virtual events, specialist digital content and data solutions.
Informa Tech helps businesses in the technology market and professionals interested in tech to connect, learn more and do more.
We are a market-led business, providing knowledge and connections around technologies including enterprise IT and cyber security, and in sectors including entertainment and service providers, delivered through events, training, data and research, digital media and consultancy.
Informa Intelligence provides high quality and critical intelligence and data services to businesses and professionals working in complex and fast-moving markets, including Pharma, Finance and Maritime.
We help customers make better informed decisions, spot opportunities and gain competitive edge.
Taylor & Francis commissions, curates, produces and publishes scholarly research and advanced learning in specialist subject categories.
By working with leading authors, researchers, scholars and professionals, we enable critical knowledge to be discovered and shared and help academic and research communities make new breakthroughs.
Read more on pages 50 to 55 Read more on pages 56 to 59 Read more on pages 60 to 63
£124m2020 revenue
£524m2020 revenue
£151m2020 revenue
£305m2020 revenue
£556m2020 revenue
£(24m)Adjusted operating loss
£(26m)Adjusted operating loss
£(2m)Adjusted operating loss
£103mAdjusted operating profit
£216mAdjusted operating profit
INFO
RM
A P
LC A
NN
UA
L R
EP
OR
T A
ND
AC
CO
UN
TS
20
20 IN
FOR
MA
PLC
AN
NU
AL R
EP
OR
T AN
D A
CC
OU
NT
S 20
20
4 8 49
ST
RA
TE
GIC
RE
PO
RT

D I V I S I O N A L R E V I E W : E V E N T - L E D B U S I N E S S E S
Event-led Businesses
Informa has three Divisions whose brands connect professionals and businesses with one another, convene communities and markets and
deliver specialist knowledge through physical and virtual events, as well as through an increasing range of smart, digital services and specialist content.
Informa Markets connects buyers and sellers, helping them discover products and trade, and supporting the flow of business and commerce in over a dozen specialist international markets, including Pharma Ingredients, Health & Nutrition, Aviation and Brand Licensing. Informa Markets’ brands deliver physical exhibitions, virtual events, specialist digital content and data solutions.
In Informa Connect, our brands serve professionals who come to meet, network, discuss and learn. We deliver specialist content and live experiences at in-person physical events and through digital platforms, and work deeply in markets including Finance & Investment and Biotech & Pharma.
Smart, specialist connections, in person and digitally
Informa Tech is a market-led business, championing specialists who work in technology and those who want to apply the latest technology to their business. We have leading brands in areas such as cyber security, artificial intelligence and enterprise IT, that deliver specialist connections and high quality content, research and training through subscription products, digital services, in-person and virtual events and festivals.
Informa Markets, Informa Connect and Informa Tech are each home to strong, established brands, many of which are a focal point for the specialist market, audience or community they serve. They operate at scale, with international reach and depth.
Their revenues are generated through a variety of products and services built around specialist brands, often with an event as the focus. Here, exhibitors purchase stand space to showcase their products, attendees may pay to attend and sponsors and marketers pay for ways to reach their target audiences and promote their brands effectively.
We are increasingly delivering connections and benefits to our customers, markets and audiences through a broader range of formats and services, including high quality media, specialist digital content and data-driven marketing services.
Business performance in 2020Informa Markets, Informa Connect and Informa Tech were significantly impacted by the COVID-19 pandemic in 2020, with physical events of all types unable to take place in most regions for the majority of the year.
January and February are typically busy periods for physical events in EMEA and North America, and a quieter period in China due to the seasonal break for the new year. Through this period, a number of major brands delivered strong performances, including Informa Markets’ Arab Health in Dubai and World of Concrete in Las Vegas, and Informa Connect’s SuperReturn International in Berlin.
As the scale of COVID-19’s disruption became clear, we shifted our focus to prioritise the health and safety of customers and colleagues and focus on preserving the long-term value of our brands and customer relationships.
In March, we launched the Postponement Programme across Informa Markets, Informa Connect and Informa Tech. This saw us proactively reschedule over 250 in-person events and look for opportunities to reformat physical events into virtual events and create new digital services, maintaining the visibility of our brands and our offering to customers. Between March and June, we ran virtually no physical events anywhere in the world.
INFO
RM
A P
LC A
NN
UA
L RE
PO
RT A
ND
AC
CO
UN
TS 2
02
0
51
ST
RA
TE
GIC
RE
PO
RT
INFO
RM
A P
LC A
NN
UA
L R
EP
OR
T A
ND
AC
CO
UN
TS
20
20
50

D I V I S I O N A L R E V I E W : E V E N T - L E D B U S I N E S S E S c o n t i n u e d
businesses, sellers and buyers, and sponsors and marketers with their commercial activity and career development. In aggregate, virtual events, digital services and digital, media, data, research and marketing services delivered over £300m in revenue across the three Divisions in 2020.
Informa Tech’s performance was also supported by resilience in its specialist content, data and research businesses. Its subscription research business, which accounted for nearly 50% of Divisional revenue in 2020, was rebranded as Omdia early in the year, following the combination of our Ovum, Tractica and Heavy Reading brands with the majority of IHS Markit’s Technology portfolio in 2019.
Following its relaunch, Omdia has been steadily establishing its new brand in the market and growing its reach with customers, supported by the launch of an improved research portal providing access to all Omdia knowledge in one place.
Seizing market trendsLike many industries, the exceptional experience of the pandemic has accelerated the adoption of digital services among our customers, creating demand for virtual products that can deliver smart connections and specialist knowledge.
A Global Exhibitions Insights Recovery survey conducted by Explori in July 2020 showed that over half of exhibitors from Asia, the Middle East, Europe and the Americas had been involved with virtual events since the onset of the pandemic. Over 80% of exhibition visitors from these regions also reported interest in attending hybrid events that mixed physical and digital elements.
Virtual events lack the intimacy and immediacy offered by physical events but offer other advantages that provide complementary and additional sources of value. They are not constrained by venue capacity and can attract a wider audience across multiple time zones, expanding the brand’s reach and attracting attendees who would not normally travel to attend an event. Virtual events can also generate deep pools of data from tracking how people
interact at a granular level, providing valuable insights into customer behaviour and preferences.
Over recent years, Informa Markets, Informa Connect and Informa Tech have steadily expanded the range of complementary digital services that connect customers and deliver content and product opportunities year round.
We are now increasing this commitment through our Smart Connections programme, a series of initiatives designed to significantly accelerate the development of virtual events and digital and data-enabled products. By leveraging our scale, the strength of our brands, customer relationships and knowledge of specialist markets, we see an opportunity to create a range of new smart solutions to complement our physical events and expand the way we serve customers.
Work to enhance our digital capabilities and expand our virtual events portfolio does not diminish our commitment to physical events. There remains strong demand for a safe return to physical events at scale, with the Explori survey indicating over 60% of exhibitors from Europe and the Americas plan to attend events as often as or more frequently than before the pandemic.
One way we are preparing for this is through our Informa AllSecure standards, providing authorities and participants with confidence that as events return, they offer high standards of hygiene and safety. We are continuously looking at ways to develop these measures, such as by trialling rapid COVID-19 onsite testing.
Ensuring physical events are sustainable as well as innovative experiences is also important to customers and a key element of our Company-wide FasterForward commitments.
This has led to the launch of initiatives such as Better Stands, which seeks to reduce waste at exhibitions, and Sustainability Inside, through which customers of every Informa event can expect to find relevant content or programming about sustainable developments in their own market embedded into the product (see pages 42 to 44 for more).
Progressing in 2021Outside of Mainland China, 2021 is likely to be a year of staged return for physical events rather than full rebound and recovery, as vaccine and testing programmes progress, markets gradually reopen and the confidence to meet and travel starts to return. Our Postponement Programme has been extended to late spring and early summer 2021, with the majority of physical events outside Mainland China currently weighted from September onwards.
While a small number of secondary events may not return after the pandemic, the shape of our portfolio and its focus on major brands in major international hubs leave us well placed overall. This is illustrated by continued customer interest and commitments to these major brands, and encouraging rebooking trends in Mainland China.
Our event-led businesses are focused on making the most of opportunities to hold physical events as they arise, by remaining flexible in our approach to dates, venues and customers.
At the same time, we are simultaneously focused on maximising the reach of our specialist media, content and marketing services and the revenues they generate, while carefully managing costs and preserving cash, and using this time
to strengthen our digital capabilities and accelerate the development of virtual events and smart digital services.
On the other side of the pandemic, we believe customers will increasingly demand deeper integration of data and digital technology into and alongside physical event products. This presents an opportunity to deepen customer relationships and improve both the quality and quantum of revenue from major brands.
Our Smart Connections programme is focused on this area, developing digital platforms and product development capabilities, securing technology partners and further developing the skills and capabilities of our colleagues. It also includes a project to enhance data collection and data management and establish greater data consistency across the businesses.
In Informa Tech, Informa Connect and specific areas of Informa Markets, the relevance and quality of our specialist content and research remain key for retaining customers and expanding our audience reach. Maintaining this depends on the continued strength of our subject matter experts, who provide differentiated views, unique insights and deep knowledge of their specialist areas of focus.
As public health conditions improved in Mainland China and government restrictions eased, there was a progressive return to physical events in the country from June. Informa Markets, which has a strong presence in the region, ran a range of events during the second half. This included successful editions of major brands such as China Beauty Expo, where strong domestic participation balanced the limited number of international attendees due to ongoing travel restrictions.
In the last few months of 2020, Informa Markets also restarted some physical events in Thailand, Hong Kong, Taiwan, Egypt and Japan, as well as the outdoor Fort Lauderdale International Boat Show in Florida, US. All locations followed Informa AllSecure’s enhanced safety and hygiene measures described on pages 18 and 19.
The inability to hold physical events in multiple markets had a significant impact on Divisional revenues. Informa Markets’ 2020 revenue was £524m, an underlying revenue decline of 63%. Informa Connect’s revenue for the year was £124m, down 55% on an underlying basis and in Informa Tech, underlying revenue declined 46% to £151m.
We put considerable focus on customer engagement and customer service over this period. Requests for refunds as a result of postponed events were relatively low, indicating continued strong support for our event brands and the return of physical events as circumstances permit.
Outside of Mainland China and some other parts of Asia, the absence of physical events led to greater focus on developing our virtual events portfolio and expanding our range of digital content and marketing services.
We held over 500 virtual events of different sizes and formats during the year. As the examples on the following pages show, these ranged from multi-day and multi-week international festivals based around specialist content, online networking and product tours and showcases, to expert-led webinars and facilitated matchmaking events, supporting professionals,
60%+Exhibitors from Europe and the Americas plan to attend physical events as or more frequently post-pandemic
£300m+2020 revenues from virtual events, digital marketing services, digital media, data and research
INFO
RM
A P
LC A
NN
UA
L R
EP
OR
T A
ND
AC
CO
UN
TS
20
20 IN
FOR
MA
PLC
AN
NU
AL R
EP
OR
T AN
D A
CC
OU
NT
S 20
20
52 53
ST
RA
TE
GIC
RE
PO
RT

A festival of natural products For the team behind Natural Products Expo West and Expo East in Informa Markets, 2020 provided a chance to revisit what the brands provide to the organic and natural food, supplements, personal care and other consumer packaged goods community – connections, specialist content and product discovery – and rethink how to deliver that through technology.
This led to the creation of Spark Change, a 12-week digital festival to help natural products brands connect and promote their products to retail buyers and distributors, investors and influencers, and to enable marketers and sponsors to reach this specialist audience.
Jessica Rubino, New Hope Network’s Executive Director of Content, said: ‘The challenges we faced in 2020 allowed us to be truly innovative in how we deliver value to our industry, creating new ways to support product discovery, networking and education in the natural products community.’
A key element was the Spark Change Product Discovery Zone, a way for participants to discover brands, talk to companies and learn about product sourcing virtually. The festival also incorporated Pitch Slam, where emerging brands pitched for a $90,000 investment, and the Spotlight Brand Podium that saw young brands, with a particular focus on those from Black, Indigenous and people of colour (BIPOC) communities, share their stories via live stream video with buyers trying samples from home. Industry insight was delivered through keynotes and high quality sponsored content.
To make the festival easy to navigate and relevant to every part of the community, there were specialist streams around regenerative agriculture, modern health and mission-driven business. All the while, video tutorials were provided to help attendees and exhibitors make the most of the experience. Spark Change’s team at New Hope Network reported on key developments from the festival throughout, extending its reach and maintaining its profile.
D I V I S I O N A L R E V I E W : E V E N T - L E D B U S I N E S S E S c o n t i n u e d
Virtual Events: A World of Possibilities
2020 saw Informa Markets, Informa Connect and Informa Tech expand and enhance their virtual events portfolio, with major brands maximising the possibilities provided by new formats and fast-evolving features to connect and serve our markets and customers.
Making critical partnerships, onlineBIO-Europe, an Informa Connect brand, helps biotech companies find partners and connect with investors who can support them in bringing innovative products to market. Its showcase spring event is typically held in March in a major European city, but as the reach and seriousness of COVID-19 became clear, BIO-Europe Spring was one of the first large-scale events we transformed, at pace, into a fully digital experience.
Pam Putz, Managing Director for EBD, said: ‘The meetings that take place at BIO-Europe Spring drive valuable dealmaking for the rest of the year. Customers told us they wanted the partnering activity that takes place onsite still to happen, and serving that need became our overriding priority.’
In less than three weeks, the team built a virtual event designed to enable the industry to connect and for investment and funding to continue. Our advanced partnering software partneringONE had registered thousands of meeting requests. Through a secure video conferencing facility, these were converted into digital meetings.
With companies distributed all over the world, the team extended the event’s duration, making meeting slots available earlier and later in the European day and adding extra days. This allowed US West Coast and Asia-based companies to be involved more easily and increased the partnership opportunities available to biotech companies. BIO-Europe Spring Digital also featured live panel discussions and company showcase pages, allowing businesses to upload video and presentations for attendees to access according to their own schedules.
More accessible than everInforma Tech’s Black Hat events are among the leading, specialist cyber security event series in the world, providing the global security community with the latest research, trends and best practices through high quality content, training and demonstrations of new infosecurity technology.
In May, three months ahead of its flagship Black Hat USA event, the team announced its full focus on a comprehensive virtual event and received strong support from sponsors, speakers and thousands of delegates from the Black Hat community.
This allowed for planning a high quality digital experience that reflected the breadth and depth for which Black Hat is known.
Over six days, Black Hat USA delivered over 90 conference sessions and 60 open source demonstrations in 18 tracks of content. A virtual business hall featured themed product zones, a vendor showcase and nearly 50 sessions led by sponsors and partners. A separate virtual classroom environment provided nearly 80 technical courses led by experts from around the world and delivered concurrently to Black Hat’s global audience.
With much content delivered via video, the team prioritised working with technology partners well equipped to handle the large volume of concurrent content, with resilient live video broadcasting capabilities and a video-on-demand service. These were stress tested and underwent rigorous security screening to minimise the risk of disruption, and audiences had access to real-time IT support in case of issues.
Steve Wylie, General Manager at Black Hat, said: ‘We found that the virtual event made Black Hat even more accessible to our global audience. The virtual environment also provided delegates with tremendous value, with the ability to access the content on demand for 30 days following the event. Seeing the entire event come to life and the active engagement from people all over the world was very gratifying.’
INFO
RM
A P
LC A
NN
UA
L RE
PO
RT A
ND
AC
CO
UN
TS 2
02
0
55
INFO
RM
A P
LC A
NN
UA
L R
EP
OR
T A
ND
AC
CO
UN
TS
20
20
54
ST
RA
TE
GIC
RE
PO
RT

Informa Intelligence
D I V I S I O N A L R E V I E W : I N F O R M A I N T E L L I G E N C E
vehicles and other infrastructure assets. Through brands such as EquipmentWatch, PriceDigests and FleetSeek we serve construction businesses, government and state departments and those who sell, lease, finance and insure equipment, helping them make high value decisions in investment projects.
Each of the markets we serve is large, complex and international. Generalist data and historical information are not enough; businesses want specialist insight, real-time data and expert analysis based on deep sector knowledge, at the touch of a button.
Our subscription-based, digital intelligence and data brands help customers understand trends, review their competitive positioning, inform their business and go-to-market strategy, shape new products and make investments with confidence.
Informa Intelligence in 2020Informa Intelligence entered 2020 as a more focused and streamlined business, following the sale of our Agribusiness Intelligence portfolio and Industry & Infrastructure media brands in 2019.
The Division performed consistently well, delivering another year of good growth, with underlying revenue growth of 1.8% (2019: 3.3%) and a steady improvement in profitability, with an underlying adjusted operating profit growth of 4.7%.
Specialist data and intelligence
This performance was despite the impact of the Division’s small portfolio of event brands, mainly comprising industry award ceremonies affiliated with an intelligence brand. These were postponed due to the COVID-19 pandemic, affecting revenues, but increased portfolio focus and cost management meant a minimal impact on Divisional profit.
Digital subscriptions are the backbone of Informa Intelligence, accounting for over 90% of Divisional revenue, with remaining revenue from complementary marketing services and specialist consulting in areas such as Pharma and Finance. Subscription renewal rates have remained high at more than 90% by value across the portfolio. Our UK construction intelligence business, Barbour ABI, fell slightly below this rate due to lower levels of industry activity.
To understand customer trends, engagement and value we track a range of KPIs including pre- and at-expiry subscription renewal rates, the annualised value of customer contracts, product usage, sales pipelines and new business activity. Across the portfolio, annualised contract values were positive and new business activity healthy throughout 2020, including in the final quarter.
Each of Informa Intelligence’s four main businesses performed well in 2020. This included particularly strong demand for Pharma Intelligence
Informa Intelligence provides critical data and specialist intelligence to businesses looking for trusted, up-to-the-minute knowledge to inform
their decision making.
We focus on four main specialist markets: Pharma, Finance, Maritime and Infrastructure assets. Our Pharma Intelligence business provides data and expert insight on clinical trials and drug development through leading brands such as Trialtrove, Citeline and Scrip.
Our Financial Intelligence business delivers intelligence and benchmarking data to retail banks under the FBX brand, and real-time data and analysis on international investment fund flows through the EPFR brand.
Maritime Intelligence is a leading platform for high quality data, analytics and intelligence on global shipping. Through the Lloyd’s List brand, we serve the range of businesses tracking the movement of freight and vessels in maritime trade, from ship builders and operators to commodity producers and traders, banks, insurers, lawyers and governments.
Our Asset Intelligence business provides pricing data and information on heavy construction equipment, commercial
INFO
RM
A P
LC A
NN
UA
L RE
PO
RT A
ND
AC
CO
UN
TS 2
02
0
57
ST
RA
TE
GIC
RE
PO
RT
INFO
RM
A P
LC A
NN
UA
L R
EP
OR
T A
ND
AC
CO
UN
TS
20
20
56

•
D I V I S I O N A L R E V I E W : I N F O R M A I N T E L L I G E N C E c o n t i n u e d
Going Deeper in Clinical Trials
products, reflecting the quality of our brands, continued investment in our platforms and a buoyant market backdrop. In late 2020, our clinical trial intelligence portfolio expanded with the addition of TrialScope, a platform used by pharma companies to disclose trial results, ensure compliance and engage trial patients. As described on pages 38 and 39, Pharma Intelligence supported the global race for COVID-19 vaccines and treatments by creating new packages, formats and dashboards to deliver critical insight to subscribers and broader interested parties.
Financial Intelligence launched the FBX brand as a single proposition for all our retail consumer banking-related services, enabling us to more effectively promote the business and connect individual products into packaged solutions for customers. FBX and EPFR continue to grow strongly, balanced by a less consistent performance in our wealth management and fixed income information businesses.
Seizing market trendsThe opportunity for continued growth is influenced by how our customer markets grow and evolve, and the opportunity for data and specialist intelligence to help inform critical business decisions.
In recent years, we have taken steps to focus our intelligence portfolio on markets we believe are attractive and where we have strong brands and positions, such as in pharma and retail financial services. Maritime is another example. Despite the short-term impact on global trade from the pandemic in 2020, the United Nations Conference on Trade and Development (UNCTAD) expects maritime trade to return to growth quickly and forecasts nearly 5% growth in 2021.
Across Informa Intelligence, a key factor in serving customers well, attracting new subscribers and delivering consistent growth is the level and quality of product development.
Customers expect continuous product improvements and enhancements: in how products are delivered and how they integrate with their systems through APIs, in upgrades to dashboards, data visualisation tools
Informa Intelligence in numbers
• Subscription focused: over 90% of 2020 revenues were from subscriptions, with 4% from marketing services. We have over 25,000 subscribers with us and over 111,000 active users across our products
• Digital: 99% of Divisional revenue is from digital products
• Deep data sets: in Pharma Intelligence our data is drawn from over 350,000 clinical trials in 180 countries. In Maritime Intelligence we receive, standardise, verify and enhance 310m automated identification system (AIS) messages daily, and our database tracks information on 240,000 maritime companies and 190,000 ship owners and operators. EPFR Fund Flows tracks over $45tn in assets
• Expert: over 550 analysts and editors work in the business
and content platforms and in the addition of new content and data sets.
There are also opportunities to develop new products by extracting deeper insights from our data, applying more sophisticated processing tools to large data sets and using artificial intelligence-based analytics to create predictive intelligence services.
We have continuously invested in our intelligence products since Informa’s 2014-2017 Growth Acceleration Plan and ongoing product development is a major focus across all our brands.
In 2020 FBX launched its Digital Banking Hub, which provides intelligence on how consumers use digital finance services from over 200 product providers, enabling banks and credit card companies to benchmark themselves and develop their services.
In Maritime, we are upgrading and expanding products to help customers manage compliance risk and reduce compliance costs. This includes real-time monitoring services that detect deceptive shipping practices and predictive analytics that can identify likely risk and abnormal behaviour.
Progressing in 2021Informa Intelligence is entering 2021 in a strong financial position, with high subscription renewal rates, positive annualised contract values and strong new business pipelines. Together, this should help the business deliver continued improvement in underlying revenue growth.
We will continue to invest in our products and digital and data capabilities, deepen our market positions and enhance the value we provide customers, further embedding our solutions in their workflows.
As in other areas of the Company, Informa Intelligence relies on attracting and retaining talent and making the most of colleagues’ expertise. In 2021, recruitment activities will focus on more sales and customer facing talent in several areas, and in Pharma Intelligence, leadership development programmes and succession planning work will help us engage colleagues and ensure opportunities to learn.
In 2020, with research institutes and pharma companies around the world racing to find vaccines and treatments for COVID-19, the importance of safe and effective clinical trials found a much wider public audience.
Pharma Intelligence has long been a trusted provider of data and intelligence in this area, helping pharma, medical and research organisations with their clinical, commercial and market access strategies and, in turn, contributing to their work on improving healthcare and patient outcomes.
We are increasingly focused on deepening our capabilities and supporting our customers at every stage of a clinical trial, from the data
and intelligence that help them identify a market, design a successful trial, select a site and recruit patients, to reporting and disclosing results, meeting regulatory requirements and bringing a drug to market.
In 2019, Pharma Intelligence launched Citeline Engage, which helps connect those looking for appropriate trial patients with a wide online network of US healthcare professionals, ultimately driving quicker and more successful patient recruitment.
In late 2020, we welcomed TrialScope to Pharma Intelligence, an innovative platform used by pharma companies to gather, report and disclose their trial results, ensuring regulatory compliance and transparency. Its newest service, TrialScope Connect, uses an innovative crowdsourced model to recruit suitable trial patients at speed.
The addition of TrialScope represents an expansion into compliance services and an extension to our workflow and patient recruitment capabilities. Going into 2021, Pharma Intelligence is seeking to make the most of its international footprint and increasing breadth and depth of services, building on these recent additions and product launches and strengthening our relationships, reach and value to customers.
INFO
RM
A P
LC A
NN
UA
L RE
PO
RT A
ND
AC
CO
UN
TS 2
02
0
59
INFO
RM
A P
LC A
NN
UA
L R
EP
OR
T A
ND
AC
CO
UN
TS
20
20
58
ST
RA
TE
GIC
RE
PO
RT

Taylor & Francis
D I V I S I O N A L R E V I E W : T A Y L O R & F R A N C I S
Taylor & Francis is one of the world’s leading publishers of specialist, advanced research and knowledge.
Taylor & Francis curates and publishes high quality peer-reviewed research conducted by scientists, professionals and leading thinkers at universities, research and development labs and institutions. This research helps other specialists learn more and make advances in their field of study, contributing to progress in broader society.
We publish knowledge in dozens of categories across the Humanities, Social and Behavioural Sciences, Science, Technology and Medicine under well-known brands including Routledge, CRC Press and Dove Medical Press.
Taylor & Francis is involved at every step in the process of disseminating expert knowledge: from commissioning research and assessing submissions, co-ordinating expert reviews, editing, producing and publishing knowledge in various formats, digitising and meta-tagging content to make it discoverable, delivering technology that maximises its reach and use, promoting collections and the latest findings, working with customers to make the most of their subscriptions, and supporting authors, editors and reviewers in their work.
What makes Taylor & Francis different is the depth of our content, reputation of our publishing brands, global reach of our partnerships with researchers, societies and institutions, investment in our digital infrastructure and growing position in newer areas such as open access (OA) and open research.
Taylor & Francis in 2020Taylor & Francis performed resiliently despite the COVID-19 pandemic causing disruption to university campuses and our supply chain.
Taylor & Francis delivered underlying revenue growth that was broadly flat, with a decline of 0.2% versus an increase of 2.4% in 2019. These results were underpinned by strong digital subscription renewals, where subscriptions represent nearly 60% of revenue. Customer service satisfaction levels also increased to 82% from 78% in 2019.
Growth was impacted by disruption to our printed advanced learning products in the second quarter, with travel restrictions and lockdown measures affecting production sites and distribution and leading to the closure of university bookshops. These issues
Knowledge that advances society
improved steadily through the second half with stock availability and customer ordering patterns returning to more normal trends, and revenue from ebooks also growing significantly. These now account for 40% of book sales.
2020 saw developments and good growth in our OA research business. Taylor & Francis added F1000 Research to its portfolio in January, marking our expansion into open research and publishing services. OA article submissions grew 30% over the year and we continued to work with customers on more flexible agreements, which provide a blend of access to subscription content with the ability to pay to publish OA articles. Taylor & Francis signed its first such read and publish agreement in North America, securing a three-year deal with the Ohio State University Libraries.
INFO
RM
A P
LC A
NN
UA
L RE
PO
RT A
ND
AC
CO
UN
TS 2
02
0
61
ST
RA
TE
GIC
RE
PO
RT
INFO
RM
A P
LC A
NN
UA
L R
EP
OR
T A
ND
AC
CO
UN
TS
20
20
60

D I V I S I O N A L R E V I E W : T A Y L O R & F R A N C I S c o n t i n u e d
Open Research: Leaps and Bounds
Our commitment to high quality research was reflected through several new partnerships with learned societies. These included an agreement to publish journals for the American Real Estate Society and the Clinical and Experimental Optometry journal for Optometry Australia. The agreements add valuable specialist content to our portfolio while providing the societies with an international distribution platform, ensuring their research and brand reaches the widest possible audience.
Taylor & Francis also contributed to the global response to COVID-19 by providing free access to coronavirus-related knowledge and ensuring all relevant research was prioritised in peer-review and production processes; see pages 38 and 39 for more.
Seizing market trendsAdvances in technology and data analytics provide opportunities to make research discoverable by more people and allow it to be used in new ways. This increases its impact and delivers deeper reach for authors and greater utility for subscribers.
Taylor & Francis has made significant technology investments in recent years, including in digitising and meta-tagging content to a more granular level, improving search engine optimisation and working with reference indices such as Google Scholar.
In late 2020 we released a major upgrade to our ebooks platform. It now incorporates OA books and book chapters and has improved search and filtering functions and page types that allow for content collections to be better promoted. Following ongoing updates to our journals platform T&F Online, the Alexa website ranking placed it in the top 600 most visited websites globally.
Interest in OA publishing continues to grow and is an increasing feature of academic research, but the shape and speed of the trend varies by country and subject category. Taylor & Francis provides a growing range of OA choices and offers flexibility to libraries, consortia and funders.
In 2020 we worked to improve the pathways through which academically sound articles that are not accepted by the author’s first-choice journal are matched to a relevant OA journal, ensuring more high quality research can be discovered. This work, plus a series of focused digital marketing campaigns, drove a 30% increase in OA articles submitted to our journals.
English language research in science and engineering is increasingly being generated in China and India. In 2020 we expanded our relationships, signing memoranda of understanding with the Faculty of Education of Beijing Normal University and the All India Institute of Medical Sciences. Providing training and guidance to their researchers will create deeper networks with authors and reviewers and bring high quality content onto our platforms.
Progressing in 2021Taylor & Francis is in a good position to build on 2020’s resilient performance, supported by the strength of our brands and specialist content and growing range of OA products and services.
In some regions, disruption to university schedules is continuing and this is likely to create budget pressures among some customers. Many of Taylor & Francis’s subscription agreements are multi-year contracts and we have sought to work flexibly with other customers, giving annual subscribers the opportunity to lock in 2019 rates for 2021 by renewing early.
Continuing to invest and expand our OA business remains a significant focus and growth opportunity, including by expanding customer choice. We also see opportunities from new types of specialist content, including greater use of video, data notes and more advanced ebooks.
As part of FasterForward, Taylor & Francis is accelerating initiatives focused on reducing waste and carbon emissions. These include the removal of plastic packaging for printed journals (pages 42 to 44) and increasing the number of titles that can be printed on demand, reducing storage costs and wastage.
Taylor & Francis in numbers
• Depth of content: we publish 2,500 journals and have a books backlist of 160,000 titles. In 2020 we published nearly 7,000 new book titles and saw 275m articles downloaded from T&F Online
• Open access options: over 99% of journals offer OA publishing options and we have 275 OA journals. 17% of 2020 published articles were OA
• A digital publisher: nearly 60% of revenue came from digital products and platforms in 2020 and ebook orders now account for 40% of book sales
• Global business: 50% of revenues come from North America with 24% from the UK and Europe and 6% from China
As part of expanding our portfolio of specialist products and strengthening our industry partnerships, Taylor & Francis jumped deeper into several exciting emerging areas of open research and OA publishing in 2020.
In January we added F1000 Research to our portfolio, which provides fully managed open research publishing products directly to funders, learned societies and institutions. In 2020, this led to a collaboration with Japan’s University of Tsukuba to create the first ever open research platform to publish content bilingually in Japanese and English, as well as a contract to create and manage the OA platform for the European Commission and its Horizon 2020 research and innovation project.
F1000 Research’s own platform also provides open research capabilities to authors, providing another option for researchers looking to publish OA with Taylor & Francis. This allows for rapid publication of scientific research – typically within a week – while maintaining research quality and providing end-to-end transparency for authors by undertaking peer review after first publication, with revised versions of record published as peer review progresses.
The knowledge, experience and industry relationships within the F1000 Research team are informing and supporting the Taylor & Francis teams in developing and expanding other OA products, including in the books business. OA books currently represent a relatively small segment of the books market but, we believe, have the potential for growth over time.
With this in mind, we are trialling a new approach to commissioning OA books by proactively approaching authors, working with them to match their work to potential funds and fast-tracking books through the production process.
Taylor & Francis has now published nearly 150 OA books and made a further 89 book chapters openly available.
63
INFO
RM
A P
LC A
NN
UA
L R
EP
OR
T A
ND
AC
CO
UN
TS
20
20
62
INFO
RM
A P
LC A
NN
UA
L RE
PO
RT A
ND
AC
CO
UN
TS 2
02
0 S
TR
AT
EG
IC R
EP
OR
T

Measuring stability and strength
K E Y P E R F O R M A N C E I N D I C A T O R S
Underlying revenue growth(%)
Adjusted operating profit(£m)
Adjusted diluted earnings per share (pence)
This measures the underlying financial performance and growth of the business. It refers to revenue adjusted for acquisitions and disposals, phasing of events including biennials, impact from new accounting standards and accounting policy changes, and the effects of currency changes. See page 227 for a full definition and page 85 for reconciliation to statutory measures.
2020 saw a resilient revenue performance from the Group’s subscription-led businesses, with revenues in Informa Markets, Informa Connect and Informa Tech significantly affected by the widespread postponement of physical events due to the pandemic.
An alternative measure of the Group’s operating performance, representing profit before tax, interest and adjusting items in a way that is comparable to prior year and Informa’s peers. See page 227 for definitions and page 85 for reconciliation to statutory measures.
The cost and cash management measures taken in 2020 as part of our COVID-19 Action Plan helped limit the flow through of reduced revenues to adjusted operating profit.
This is one measure of profitability and the value created for Shareholders, adjusted for equity issuance.
The 2019 and 2018 figures have been restated to reflect the new shares issued in 2020.
See page 227 for definitions and page 89 for reconciliation to statutory measures.
Free cash flow(£m)
Leverage ratio*(times)
Dividend per share(pence per share)
This is cash flow generated by the business before cash flows relating to acquisitions, disposals and their related costs, dividends and new equity issuance or purchases. See page 227 for definitions and page 90 for reconciliation to statutory measures.
In 2020, cash conversion rates remained high but absolute levels of cash flow were lower due to the disruption caused by the pandemic. Operating cash flow* was positive at £230.8m but free cash flow included one-off costs related to refinancing and cost management initiatives. These actions are expected to ensure the Group is cash positive from the start of 2021, even without a broader recovery in physical events.
The leverage ratio is the ratio of closing net debt to covenant-adjusted EBITDA*. See page 227 for definitions and page 93 for calculation.
Following steps taken under the COVID-19 Action Plan in 2020, Informa no longer has financial covenants on any of its borrowings. However, the Group continues to manage its balance sheet sensibly, with the aim of reducing the leverage ratio over time. At the end of 2020, the Group’s net debt had reduced to £2bn and available liquidity was over £1bn.
Dividend per share represents the total of the interim and the final dividend for the financial year and is one measure of the value created for Shareholders through business performance and growth.
The 2019 and 2018 figures have been restated to reflect the new shares issued in 2020.
The Board suspended dividends in 2020 and withdrew the 2019 final dividend as part of the Group’s COVID-19 Action Plan. This approach will be kept under review during 2021.
Informa’s Directors and management team use six financial and three non-financial measures to track the Group’s strength and performance, and the delivery of strategy.
Some Group KPIs are alternative performance measures, chosen because we believe they provide a useful and appropriate explanation of the Group’s business performance. These are defined on page 227 and their reconciliation to statutory measures explained in the Financial Review.
Read more:
Pages 8 and 9: Group strategy
Pages 20 and 21: Business model
Page 82 to 93: Financial Review
Business sustainability: Dow Jones Sustainability Index (DJSI)
99th/742020 percentile/absolute score
92nd/652019 percentile/absolute score
Definition: The DJSI is a leading indicator of company sustainability. It assesses listed companies on 23 individual economic, social and environmental criteria, including some we target under the FasterForward programme, and provides an aggregate absolute score plus sector and all-company rankings.
Performance: Our absolute score improved, partly driven by advances in social and environmental reporting. We maintained our position in the DJSI World Index, the top 10% of participating companies, for the third year running and were ranked second in our sector globally.
Target: Under the FasterForward programme, we have set specific targets that measure our progress towards becoming an ever more sustainable, positive impact business. We also seek to maintain our position in DJSI World Index as a recognised indicator of overall business sustainability.
Use of natural resources: Greenhouse gas emissions
2020 2019*
UK ROW UK ROW
Energy consumption (kWh) 5,254,684 19,356,624 7,406,783 25,368,690
Scope 1 emissions (tCO2e) 669 2,153 811 3,324
Scope 2 location-based emissions (tCO2e) 574 4,731 1,052 5,974
Scope 2 market-based emissions (tCO2e) 0 233 0 397
Total Scope 1 & 2 location-based emissions (tCO2e) 1,243 6,884 1,863 9,298
Intensity ratio total location-based Scope 1 & 2 emissions (tCO2e/colleague) 0.35 0.93 0.54 1.21
Total Scope 1 & 2 market-based emissions (tCO2e) 669 2,386 811 3,721
Carbon offsets used to compensate for remaining emissions (tCO2e) 669 2,386 811 3,721
Residual carbon emissions post renewable energy and offsets (tCO2e) 0 0 0 0
* 2019 data has been updated as part of improvements to calculation methodology
Definition: Levels of carbon dioxide (CO2) or GHG emissions measure our use of natural resources, part of our business model, and impact on the environment. Calculations are based on GHG Protocol and Defra guidelines. Scope 1 emissions arise from natural gas heating, refrigerant gases and vehicle and generator fuel use. Scope 2 emissions are from electricity consumption. Location-based emissions are calculated as the average emissions intensity of electricity grids where we have offices, and market-based emissions take into account renewable energy purchasing. We compensate for unavoidable emissions by purchasing certified carbon offsets.
Performance: Significant energy consumption decreases are partly due to certain office closures and lower than usual occupancy levels at other locations because of COVID-19 working restrictions. We actively put many larger offices into hibernation mode to lower their energy footprint. The 700+ solar panels installed in our Boulder office had their first full year of operating and generated 274 MWh during 2020, 63% of the office consumption. In 2020 we achieved CarbonNeutral Company certification in accordance with The CarbonNeutral Protocol. More information on our emissions reductions programmes can be found in the separate full Sustainability Report.
Target: Under our FasterForward programme we are committed to becoming net zero carbon by 2030 and also have certified Science Based Targets on reducing absolute Scope 1 & 2 emissions. See pages 42 to 44 or the 2020 Sustainability Report for more details of initiatives to reduce absolute GHG emissions, which include by self-generating renewable power, smart meter roll outs and refitting offices with more efficient technology. Informa’s balanced working programme means that as part of providing more flexible work patterns, offices are being adapted for more effective use, including some consolidation at our Oxford, London and New York buildings, which should create lower office energy consumption compared with 2019.
Colleague support and participation: Engagement Index
86% 80%2020 2019Definition: Our business model relies on colleagues’ contribution and retaining key talent, and engagement indices provide a measure of colleague participation and satisfaction. All colleagues (except contractors) are invited to participate in the confidential Inside Informa survey and the index is the average favourable response to five key questions, including belief in the goals of the business.
Performance: Two Inside Informa Pulse surveys were conducted in 2020. The most recent took place in June 2020 and attracted record participation (78%) and high levels of engagement with the Company.
Target: To maintain participation rates of over 50% and a strong overall score by engaging and supporting colleague effectively. See pages 30 to 34 for examples.
(41.0) 3.5 3.72020 2019 2018
(153.9) 722.1 503.22020 2019 2018
267.8 933.1 732.12020 2019 2018
5.6 2.5 2.92020 2019 2018
9.9 51.0 48.82020 2019 2018
0.0 7.50 21.752020 2019 2018
Group Financial KPIsFollowing the disruption caused by the COVID-19 pandemic, the Group’s focus in 2020 was to secure the strength and stability of the Company for 2021 and beyond. While we continue to target the measures below as key financial performance indicators for the Group’s sustainable, long-term growth and the delivery of Shareholder value, balance sheet strength, liquidity and cost and cash management were significant priorities during the year. For commentary on these metrics and the steps taken in 2020, see the Group Chief Executive Review (pages 12 to 19) and Financial Review (starting on page 82).
INFO
RM
A P
LC A
NN
UA
L R
EP
OR
T A
ND
AC
CO
UN
TS
20
20 IN
FOR
MA
PLC
AN
NU
AL R
EP
OR
T AN
D A
CC
OU
NT
S 20
20
6 4 65
ST
RA
TE
GIC
RE
PO
RT

Guidance and direction
Audit and Board reports
Group risk register
Principal risk reviews
Audit and Board reports
Divisions and functions risk registers
• Sets tone from the top• Positions risk appetite and tolerance• Challenges lines of defence• Accounts to Shareholders
• Independently checks and challenges 1st and 2nd lines of defence• Provides assurance to the Board
• Provides advice and guidance to the 1st line of defence• Considers emerging risks• Accountable to Audit Committee and Board
• Identify and manage risks• Receive guidance• Report to Risk Committee
Board oversight
Audit Committee
(Non-Executive) 3rd line of
defence
Risk Committee (Executive) 2nd line of
defence
Divisions (Executive)
1st line of defence
Risk and Resilience
R I S K M A N A G E M E N T
Risk management governance framework
Function OutputsGovernance
The pandemic has had a deep and far reaching impact on all societies and businesses. At Informa, it affected colleagues, customers, communities and business operations in different ways, and significantly disrupted the operation of our physical events.
The Company acted swiftly at the beginning of 2020, putting in place a range of measures to successfully secure stability, strength and future viability, support colleagues and customers and adapt our operations. Informa’s COVID-19 Action Plan is described in full on pages 10 and 11 and discussed in the Group Chief Executive’s Review (pages 12 to 19).
Pandemic risk was separated into a stand-alone principal risk during 2020 to better allow us to assess, manage, and monitor the performance of the response strategy. This principal risk was closely monitored as the nature of the pandemic and authority responses in different markets developed and unfolded throughout the year. The pandemic has, by its nature, also changed other aspects of the Company’s risk profile, with details included throughout this section. Subsequent risks and opportunities continue to be addressed through established channels including the three-year planning process, and by the Risk Committee and Board.
The Company’s risk culture continues to mature, with Informa’s guiding principles allowing colleagues the freedom to pursue opportunities in the service of championing our specialist customers. They also emphasise the importance of building trust and long-term partnerships, which in turn help ensure we conduct activities in an informed, risk-based manner.
We work to continuously improve what we do through a balanced approach that enables us to take risks where there are good commercial opportunities, while being transparent about the risks that need closer management. Examples of a positive and proactive approach to managing risk include the development of the Informa AllSecure health and safety standards for physical events (see pages 18 and 19) and the smooth shift to remote working in 2020, which reflects successful IT resilience planning.
Role of the BoardThe Board plays an important role in effective risk management and oversees a governance model that incorporates an integrated assurance model through three lines of defence. It also formally articulates the Company’s overarching appetite and tolerance for risk, which is to balance economic reward with the specific and overall risk necessary for pursuing the Group’s strategy, as follows:
• Risks should be managed consistently and in line with the Group’s strategy, financial objectives and guiding principles
• Opportunities should only be pursued where the scope for appropriate reward is supported by an informed assessment of risk
• Risks should be actively managed and monitored through the appropriate allocation of management and other resources
Through our risk governance structures, policies, frameworks, processes and reporting mechanisms, Directors are provided with the information and insight needed to make a robust assessment of the Company’s most material risks and understand how they are being mitigated and managed in line with this stated risk appetite and tolerance. The Board also plays a role in monitoring the Company’s culture and setting a strong tone from the top, which directly supports effective risk management.
Risk identification and reviewThe Risk Committee follows a clear, simple and robust process to identify the Group’s most significant risks, incorporating both top down and bottom up assessments:
• Each Operating Division and Group function presents their material risks in a register to each quarterly Risk Committee meeting
• We use a risk categorisation framework to analyse these risk registers. The risks identified through this mechanism that are considered most significant, in terms of their materiality to the Group, are recorded on the Group risk register
• Emerging risks are discussed at each quarterly Risk Committee meeting and with each Division and function. Dedicated workshops are held to assess emerging risks and identify which should be monitored on risk registers
• The most significant risks on our Group risk register are linked to our principal risks for better insight and management
Every principal risk is assessed to see whether it could have a material strategic or commercial impact, either on its own or as part of a multiple risk scenario. Principal risks with material commercial impacts then form part of Company viability modelling and testing.
The Risk Committee ensures principal risks are understood, managed appropriately, monitored and reported internally and externally. During 2020, the Committee held detailed reviews on each principal risk with the named EMT-level risk owner accountable for the overall management of that risk and with subject matter experts.
At each review, we consider and challenge whether the risk is being managed to the tolerance approved by the Board, using principal risk reports to monitor how far material financial, operational and compliance controls and mitigations have been implemented, their effectiveness, and how close the current net risk rating is to our risk tolerance. Where risks are outside tolerance, they are reported and actions agreed to manage the risk. The outcomes of review meetings are reported at the quarterly Risk Committee meetings, then to the Audit Committee and Board. Principal risk reviews also support the Board in monitoring and reviewing the effectiveness of the Group’s internal control framework.
As with any company, at Informa, risk arises both as a natural consequence of doing business and in the pursuit of our strategy. Within this context, we aim to manage rather than avoid risk, and specifically:
• To identify and understand business risks, to ensure we are being curious, conscious and open about the risks we choose to take according to our risk appetite
• To develop and deploy appropriate and effective risk strategies to address these risks and take
advantage of opportunities, where these are present and appropriate
• To clearly report on risk statuses through governance and management channels
This work is guided through our risk policy and enterprise risk framework.
Day to day, the aim is that colleagues and leaders make informed risk-based decisions as part of business planning and execution, and adjust those decisions where circumstances or objectives change. This approach seeks
to deliver better results by knowing what actions we need to take and what resources are necessary to deliver them.
The key context for the Company’s risk management programme in 2020 was the COVID-19 pandemic. The risk of a pandemic was previously thought to be extremely rare. It was however recognised as part of our emerging risk practices, which meant the potential impact of a major disease outbreak was recognised within the principal risk of inadequate response to a major incident.
INFO
RM
A P
LC A
NN
UA
L R
EP
OR
T A
ND
AC
CO
UN
TS
20
20 IN
FOR
MA
PLC
AN
NU
AL R
EP
OR
T AN
D A
CC
OU
NT
S 20
20
66 67
ST
RA
TE
GIC
RE
PO
RT

2 1
3
5
12
11
9
10
8
4
7
6
13
R I S K M A N A G E M E N T c o n t i n u e d
1. Economic instability2. Market risk3. Acquisition and integration risk4. Ineffective change management5. Reliance on key counterparties6. Technology failure7. Data loss and cyber breach8. Inability to attract and retain key talent9. Health and safety incidents10. Inadequate response to major incidents11. Inadequate regulatory compliance12. Privacy regulation13. Pandemic risk
Relative net risk ratings of principal risks
Lik
elih
ood
Impact
Rating riskWe rate risks by considering their potential financial and non-financial impacts and the likelihood that they will happen, using a consistent rating grid to compare and prioritise risks.
Each risk has two ratings. The first is a gross risk rating, which assesses the maximum potential exposure if nothing is done to manage or mitigate the risk, and forms a baseline risk rating. The second is a net risk rating. This takes into account the controls and mitigations in place to reduce the likelihood and/or impact of the risk, its implementation status and effectiveness.
Gross and net risk ratings are regularly reviewed to consider whether the external or internal context, strategy, business objectives or resources available to manage the risk have changed.
Changes to principal risksWe added pandemic risk as a separate principal risk during 2020 to better allow us to assess, respond, manage and monitor its risk profile and the subsequent activity required. Over time, as effective vaccines and treatments become widely available, we expect this risk will recede and once again become rare.
The pandemic has impacted the net risk ratings of several other principal risks and may leave a longer tail of elevated uncertainty around some of these risks. Movements and the Company’s response to managing and mitigating risk are described in the principal risk spotlights on pages 71 to 77 and in summary:
• The risk of economic instability has increased due to the global economic impact of the pandemic, and the effect of economic challenges and uncertainty on consumer behaviours, and some businesses elevate the risk from reliance on key counterparties
• Market risk evolved during the year. Changes in the market for physical events meant this risk increased, but opportunity has also emerged as we moved to accelerate the development of new digital products and virtual events in particular
• The risks relating to data privacy have slightly increased, as we use customer and personal data in new ways to develop new products and enhance existing services
• We have reformulated our talent-related risk to include the ability to attract as well as retain talent. The acceleration of our digital and data-enabled products will require new capabilities in some areas and attracting the right talent will be as critical to our success as retaining the key talent we have. As a result of this realignment and the focus on accelerating digital products and capabilities, this risk has also increased (continued on page 70).
Climate change and sustainabilityAdvancing our commitment and performance on sustainability is part of Informa’s business strategy (pages 8 and 9). We believe being a responsible and sustainable business presents opportunities for the Company, our customers and our communities, and it also allows us to manage a range of emerging risks and stakeholder expectations, particularly in the area of climate change.
Climate change has been identified as an emerging risk for several years. The risk is assessed, monitored and reported on as part of Informa’s routine risk management and governance processes.
In 2020 we continued to deepen our understanding of the nature of climate change risk and opportunity in our business and markets. A cross-functional climate change working group was established, chaired by a member of the EMT and reporting to the Risk Committee, and the group conducted a series of risk workshops and interviews on sustainability and climate change during the year.
Ongoing work from this group will help ensure we meet expectations from the Task Force on Climate-related Financial Disclosures (TCFD) on measuring and disclosing any material financial impacts from climate change. We are publicly committed to meeting TCFD recommendations and a task force has been established to deliver this, chaired by the Group Finance Director and Director of IR. We intend to publish additional information on our approach to TCFD on the Informa website during 2020.
We consider both the physical risks from climate change in the short and long term and the impacts from the process to transition to a lower carbon world, called transition risks, which tend to be short to medium term in nature.
Physical impacts of climate changeIn assessing the impacts of climate change on Informa’s business, we have considered physical assets that could be exposed to increasing extreme weather, drought and sea level rises:
• The Company owns and relies on few physical assets. Our office operations can be easily relocated and colleagues are able to work remotely for extended periods
• Informa’s products and services do not depend on large physical supply chains
• For our physical events, apart from a small number of instances, we do not have commitments to specific locations, such as venues or host cities, that stretch beyond five years. We also have the capabilities to relocate and adapt events where needed, as proved in 2020
Further work will be conducted over the next year to more precisely define climate change scenarios and update the analysis on the timing and frequency of extreme weather, assess risk mitigations against these scenarios and then move to model any financial impacts.
Based on our present assessment, we believe Informa’s ability to move, relocate and reorganise how we operate the business manages the physical impact of climate change risk over the medium and long term. Our immediate focus will be on ensuring we can respond to short-term disruptions in specific locations that might occur with limited notice, and understanding which locations are more likely to experience extreme weather over the longer term. This includes strengthening business continuity and major incident response plans accordingly.
Managing transition risk and opportunityThe transition-related risks of climate change include potential shifts within the specialist markets we serve, changes in customer behaviour related to travel patterns, meeting the growing expectations of stakeholders including colleagues, customers and investors, carbon taxation and emerging legislation. We believe these areas are more significant and relevant to our business than physical climate change impacts at present.
In 2020 Informa launched a new five-year sustainability programme called FasterForward, and many of the initiatives and commitments addressed in FasterForward will help us both manage transition risk and its potential costs, and make the most of the customer and commercial opportunity from being a champion of sustainability across our products and markets.
One such way is by embedding relevant sustainability content into every Informa brand by 2025. In every market, businesses and governments are increasingly looking to understand their own sustainability challenges and find solutions. Ensuring high quality, actionable sustainability knowledge is embedded in all our information products and services, and not only as part of dedicated
INFO
RM
A P
LC A
NN
UA
L R
EP
OR
T A
ND
AC
CO
UN
TS
20
20 IN
FOR
MA
PLC
AN
NU
AL R
EP
OR
T AN
D A
CC
OU
NT
S 20
20
68 69
ST
RA
TE
GIC
RE
PO
RT

sustainability brands, will ensure we continue to deliver value to customers, meet their expectations and enhance our brands.
When attending our physical events, customers generally use transport to travel to a venue or single area where all activities take place. Our large-scale, branded events can convene whole international communities in one major hub at the same time. This allows attendees to connect, transact and share knowledge that supports the sustainable development of their market in a highly efficient way, and saves the time, cost and carbon associated with making the multiple business trips to separate locations that would otherwise be needed.
Trends towards reducing business travel, for reasons of cost management, higher environmental taxes on flights or flight shaming, may present some risk to attendance at some events and may increase the strength of larger events that demonstrate their effectiveness. It could improve the quality of audience should only committed buyers and sellers attend and support demand for the virtual events we are increasingly investing in. It may also present an opportunity to demonstrate and further promote the efficiencies of physical events. Additional work to quantify these scenarios and manage risk and opportunity will take place as physical event schedules return.
Sustainability at Informa, pages 42 to 44
Full 2020 Sustainability Report via the Informa website
R I S K M A N A G E M E N T c o n t i n u e d
• The likelihood and impact of a health and safety incident was lower in 2020 as physical events were fewer and business travel and office occupancy rates reduced due to government restriction measures
• Acquisition and integration risk was lower in 2020 due to lower levels of acquisition and divestiture activity in the business
Assessment of emerging risksAs well as assessing ongoing risks, we continue to consider how the business could be affected by emerging risks over the longer term and how strategic, market and product initiatives might manage risk and seize any new opportunities. It is often possible to predict the potential impacts of emerging risks, but it is more challenging to predict their likelihood, timing and velocity.
For every Risk Committee meeting, each Committee member highlights any new or emerging risks that could either impact the Group or one or more Divisions. Additional sessions are held with Senior Management teams and as part of Risk Committee meetings to scan for significant emerging risks.
Additional risks monitoredWe monitor and manage a full range of risks on an ongoing basis, which are not currently considered to have the scale of impact, significance or materiality to be principal risks to the Company.
This includes the developing demand for open access in research publishing, which we recognise is both an emerging risk and opportunity to our Taylor & Francis business. As described in the Divisional Review (pages 60 to 63) we continue to invest in expanding and strengthening our OA capabilities, working flexibly with customers and offering choice in publishing models.
Informa conducted a risk assessment on the effects of Brexit based on assessing the most impactful no-deal Brexit scenario at a Group, Divisional and functional level. Following this assessment in the context of business strategy, Brexit was considered not to be a principal risk to the Group.
As an internationally diversified company with a low reliance on moving physical goods between the EU and the UK border, the potential commercial and strategic impacts are considered immaterial. Where it does present a risk, such as in the physical supply of books to customers in the EU, detailed contingency planning has taken place to minimise business disruption. Here, we now have increased facilities for printing books on demand in Europe, supporting overall business resilience.
In areas of potential financial risk, the Group takes an ethical and low risk approach to tax, which limits the likelihood of disputes with tax authorities and makes unexpected material tax liabilities unlikely. Risks from currency fluctuations exist, particularly in the relative value of sterling and the US dollar. This is managed by the Group Treasury team and we seek to ensure the currency of the Group’s borrowings is aligned with the currency of our largest sources of cash generation.
Overall assessmentWe confirm that, through the processes and governance described above, we have performed a robust assessment of the Company’s emerging and principal risks, and the Group’s principal risks are presented in the following pages.
P R I N C I P A L R I S K S A N D U N C E R T A I N T I E S
Economic instability Market risk
1. 2.
The stability of the wider economy affects customers, particularly consumer behaviour and the appetite to acquire and access products and services in a local, global or market-specific downturn. This could impact business revenues and growth; however, it could also present an opportunity to acquire businesses at a lower cost, develop new products and services and gain access to new markets. Fluctuations in currencies due to the relative positions of economies can positively or negatively affect financial results.
EMT owner: Group Finance DirectorLatest movement: Economic instability materialised as a risk in 2020 and we took steps to maintain the Company’s stability, future viability and security
Risk appetiteWe have a moderate risk appetite to seek growth by extending into emerging and new markets.
How we manage and mitigate risk• Economic risk and opportunity are considered in the
three-year planning process, and Board, EMT and Division-level review and planning meetings constantly review the macro-economic environment
• Trading results are monitored against budgets through the monthly reporting process, highlighting any effects from economic instability and informing ongoing commercial decision making
• Over the last seven years, the balance and depth of Informa’s portfolio have increased. Having globally diversified operations, operating in multiple specialist markets and maintaining a mix of revenue sources between subscriptions and events builds resilience and helps us manage more localised market- or country-specific economic downturn or recovery
• We align the currency of the Group’s borrowing with the currency of the Group’s largest sources of cash generation to manage currency fluctuations
• During 2020 we took a significant range of measures as part of our COVID-19 Action Plan to build stability and security in the Company through 2021 and beyond, as shown on pages 10 and 11
• Informa entered 2021 with a strengthened financial position and additional balance sheet resilience against any prolonged impact from the global economic downturn. Our focus on accelerating our digital and data capabilities, particularly in our event-led businesses, should provide further portfolio diversification and business opportunity
Informa works deeply in a number of specialist markets. These markets can experience growth, decline, change or disruption, which in turn can alter customer behaviour, needs and preferences and change the competitive environment for our product and service offerings, impacting growth, revenues and margins.
EMT owner: Divisional CEOsLatest movement: This risk increased during 2020 due to the pandemic’s impacts on our physical events, balanced by the emerging opportunity offered by digital services and virtual events
Risk appetiteWe are comfortable with taking market risk and maximising the opportunity it presents for growth, including growth through developing new products and acquiring capabilities and positions.
How we manage and mitigate risk• Market risk is considered in strategy and investment
decision making. It is also regularly considered by the Board, addressed as part of Informa’s three-year planning cycle and monitored through our financial reporting process. In 2020 we employed greater stress and scenario testing across our strategy and assumptions to ensure awareness of potential downside risk, in addition to continued monitoring and oversight of our strategy and business models
• The breadth of our portfolio and our depth in multiple specialist markets provides some resilience to disruption in individual markets, as does the quality of our brands and customer relationships when maintaining competitive position and developing new services
• Market research is undertaken and customer feedback gathered and considered when entering into new markets and developing or enhancing products, as described on pages 38 and 39 with virtual events
• Divisional management teams meet regularly with Group management to consider market trends and risk and ongoing product development plans. While these are typically formal quarterly meetings, this consideration and engagement was much more frequent in 2020 due to faster changes to market opportunities and risks following the pandemic’s impact
• We are continuing to closely assess the landscape for virtual events as we accelerate our digital and data capabilities in 2021, and are investing across talent, technology and new products to meet evolving customer needs, minimise market risk and maximise business opportunities
INFO
RM
A P
LC A
NN
UA
L R
EP
OR
T A
ND
AC
CO
UN
TS
20
20 IN
FOR
MA
PLC
AN
NU
AL R
EP
OR
T AN
D A
CC
OU
NT
S 20
20
70 71
ST
RA
TE
GIC
RE
PO
RT

Acquisition and integration risk
Ineffective change management
Part of Informa’s strategy is to expand its portfolio of products and enhance our positions and partnerships. Acquiring and integrating businesses is one of the ways the Company has historically achieved this. How acquired businesses perform can vary from expectations due to market conditions or integration complexity, which can impact overall growth and returns, the strength of our brands and Company culture.
EMT owner: Director of Strategy and Business PlanningLatest movement: This risk reduced as the business focused on its COVID-19 response and acquisition activity temporarily slowed
Risk appetiteInforma is prepared to take reasonable risk to acquire new assets, talent, capabilities, products, brands and innovation, for the benefit of all stakeholders.
How we manage and mitigate risk• We allocate capital to the markets and Divisions with
the best long-term value creation opportunity and make investment decisions according to set financial parameters
• We actively monitor the market to identify suitable acquisition targets. Targets are analysed by the Group Corporate Development team and assessed according to strategic and cultural fit, with experts from multiple functions involved in due diligence
• A value creation register is used for each proposed acquisition, assigning individual ownership for all aspects of execution. All acquisitions have formal governance, leadership and project management to ensure successful integration, with significant acquisitions receiving heightened governance
• Divisional integration plans receive ongoing integration monitoring and oversight from the Group for at least two years post close
• Post-acquisition performance is reported annually to the Board, including an assessment of any variation to the expected return on investment
• 2020 saw limited acquisition activity and therefore this risk has not incrementally increased. We continued to oversee and closely monitor the integration and performance of additions from recent years
Seizing business opportunities, expanding our portfolio and implementing new strategies involve change. When change is not managed effectively, it can create operational challenges and impact the ability to achieve strategy, deliver projects or realise benefits to their fullest extent. Business fatigue from change that is managed ineffectively can impact colleague engagement and the retention of key talent.
EMT owner: Group Chief Operating OfficerLatest movement: No change in risk likelihood or impact
Risk appetiteWe have a high appetite for change in order to grow, innovate and respond to new challenges and opportunities.
How we manage and mitigate risk• Informa has a track record of assimilating change
over the last seven years. The EMT oversees and independently or collectively sponsors key change initiatives across Informa. Specific governance structures are set up for sizeable projects and all large-scale strategic changes, funding and investment programmes or acquisitions include change management disciplines and have defined governance and reporting structures
• The interests of and impacts on colleagues, customers and Shareholders from change are closely considered, and decisions are guided by our purpose, to champion specialist customers, our strategy and guiding principles
• All large-scale investments are approved through the Capital Investments Committee
• Informa has stability in key leadership roles which allows a culture of continuous learning and improvement
• Regular colleague engagement surveys are carried out to understand trends in sentiment and spot and address any issues. Colleague engagement is monitored as a Group KPI and is currently strong, standing at 86% in the last Company survey
• Certain projects around commercial systems and platforms were paused during 2020 to ensure a level of business stability. These will be resumed on a case by case basis as more normal working conditions return
• Managing change from our increased focus on digital services and capabilities will be a focus of ongoing monitoring in 2021
We work with key strategic partners to support certain areas of our business and deliver commercial objectives. A failure in key counterparty relationships or services could affect the delivery of specific products and disrupt business activities and trading, as well as impact customer satisfaction and colleague engagement. Periods of extreme economic instability and disruption can create additional financial or operational pressures on partner businesses.
EMT owner: Group Finance DirectorLatest movement: The likelihood of this risk has increased due to the impact of the pandemic on businesses, our strategic partners and customers
Risk appetiteCounterparties are necessary for delivering some of our products, services and events, particularly in specialist areas or where suppliers are market leaders, and we therefore have a reasonable appetite to take managed risk.
How we manage and mitigate risk• Each Division and function identifies its key strategic
counterparties, articulates the nature and extent of their risk exposure and confirms the mitigations and continuity processes in place. This is formally reviewed and reported to the Risk Committee
• Additional mitigations and measures were taken in 2020 to manage the risk that key counterparties experience a failure which affects their relationship with Informa. Divisional assessments were conducted with ongoing monitoring of the impact of the pandemic on key counterparties. We worked with specific partners to ensure continuity should their services be impacted by Brexit
• When entering new relationships with strategic partners and counterparties, our due diligence includes but is not limited to requiring counterparties to have robust and tested business plans, financial stability and business continuity plans. Contracts and service level agreements are put in place and when onboarding, we ensure the service incorporates performance and risk indicators to assist us to govern the relationship and manage risk. We seek to manage key relationships proactively and ensure suppliers are paid on time so services are not suspended
• When engaging with small or specialist service providers, we extend our expertise in critical areas of risk such as cyber security and data privacy into their business
• Our Treasury Policy ensures the Company is not over-reliant on any single financing partner, and we took proactive steps to further broaden our financing in 2020
Technology underpins our digital products, services and business operations. A prolonged loss of critical systems, networks or similar services could inhibit the delivery of events, products and services, increase costs and result in poor customer experience and reputational damage. Serious disruption could impact the day-to-day operation of our businesses and potentially colleague engagement.
EMT owner: Chief Commercial OfficerLatest movement: No change in risk likelihood or impact
Risk appetiteWe seek to minimise the likelihood and impact of any business-critical technology failure.
How we manage and mitigate risk• A range of IT governance, standards, maturity targets
and controls are in place across the Company to manage technology risk
• Our Group-wide strategy is to deploy cloud computing, which provides resilience for our products and services and the capacity for scalable solutions
• We continuously work to reduce complexity in our technology landscape by streamlining legacy systems and those from acquired businesses
• Technology service providers are assessed and selected on their capability to deliver the required service, reducing the risk of downtime
• We provide secure cloud desktop services that allow colleagues to work securely and productively from anywhere. Their effectiveness was proved when the vast majority of colleagues moved to work remotely for some or most of 2020, with very few issues, and these capabilities will assist further as the Company introduces balanced working practices as standard in the future
• 2020 saw notable improvements in IT service delivery and the resilience plans for critical systems. As the Company moves to expand its depth and capability in commercial digital products and services, the resilience of our technology and technology failure risk will be kept under close review
3. 4.
P R I N C I P A L R I S K S A N D U N C E R T A I N T I E S c o n t i n u e d
5. 6.
Reliance on key counterparties
Technology failure
INFO
RM
A P
LC A
NN
UA
L R
EP
OR
T A
ND
AC
CO
UN
TS
20
20 IN
FOR
MA
PLC
AN
NU
AL R
EP
OR
T AN
D A
CC
OU
NT
S 20
20
72 73
ST
RA
TE
GIC
RE
PO
RT

P R I N C I P A L R I S K S A N D U N C E R T A I N T I E S c o n t i n u e d
7. 8.
Data loss and cyber breach Ability to attract and retain key talent
9. 10.
Health and safety incidents Inadequate response to major incidents
We use data within our business operations and in commercial activities. A loss of sensitive or valuable data, content or intellectual property could lead to losses for our stakeholders, Company fines, investigations and business interruption. Managing such impacts could also divert significant management time away from delivering on business strategy and create reputational damage if not adequately handled.
EMT owner: Chief Commercial OfficerLatest movement: No change to the likelihood or impact of this risk
Risk appetiteWe seek to protect our data robustly and in line with privacy regulations and recognised practice.
How we manage and mitigate risk• Informa has a central Information Security team
which determines strategy and implements initiatives Company-wide. We aim to protect the confidentiality, availability and integrity of key systems by employing a layered defence-in-depth approach. This comprises administrative, technical and physical controls that are continuously monitored and adapted according to developing threats, including the ability to mitigate attacks initiated through human error
• Performance and progress are reviewed by the Risk Committee. The continued growth in maturity of our cyber controls was noted during the year, including enhancements made to system authentication measures
• We have internal and external assurance programmes that assess compliance with Company security policies, standards and controls and provide reports to the Audit Committee and EMT
• There is a well-defined incident management and response to cyber breaches
• We run awareness programmes to encourage a security-aware culture among colleagues, including mandatory training modules, intranet communications and simulated phishing exercises. In 2020 updates were increased and we focused on cyber threats relating to the pandemic and working remotely
• Attempts to steal data are broadly becoming more frequent and sophisticated. While there are general reports of increased criminal cyber activity since the start of the pandemic, we have not detected any material increase in attempts towards our business
People are at the heart of Informa’s culture, strategy and business model. We aim to attract great talent and retain key talent by making Informa a great place to work, engaging colleagues and supporting them to make the most of their skills. The loss of key talent in critical functions and inadequate succession planning for Senior Managers could impact our ability to serve customers, grow and deliver on our strategy and key initiatives.
EMT owner: Group Chief Operating OfficerLatest movement: This risk now includes attracting as well as retaining key talent, and has increased as we look to add capabilities that support the acceleration of our digital products and services
Risk appetiteWe have a reasonable degree of risk appetite, and aim to manage this risk to a sustainable level through a range of methods.
How we manage and mitigate risk• Colleague engagement is a focus for management
teams. As described on pages 30 to 34, we seek to communicate and engage with all colleagues, understand and respond to their needs and create a culture and environment that encourage talent to stay within our businesses. Engagement levels are tracked as a Company KPI with results to feedback surveys analysed and used to inform team and Company plans
• The EMT and Board review talent trends and there are succession plans for critical roles, including appropriate incentive packages
• HR leadership and the Risk Committee monitor where general attrition rates are above target levels, with management teams required to report on measures taken to reduce the loss of key talent. Voluntary leavers decreased in 2020 while colleague engagement levels rose. When surveyed, the level of colleagues saying they intend to leave the business is on a downward trend, standing at 8% in mid-2020
• Where it is not possible to retain key talent in commercially critical roles, we manage potential impact through the appropriate use of post-termination restrictions
• As we increasingly develop and accelerate our digital products and data capabilities, particularly in our events businesses, we are building a dedicated programme to ensure colleagues can develop their skills, our businesses have the right mix of talent and we attract and retain talent in critical areas, including through appropriate reward and recognition
When delivering events, engaging with venues and managing facilities, we aim to operate a safe and healthy environment. A serious failure has the potential to cause life-changing injuries and, at worst, fatalities. The mismanagement of health and safety can also result in reputational damage, investigations, fines and claims for damages.
EMT owner: Group Chief Operating OfficerLatest movement: Temporary reduction in risk likelihood due to fewer physical events and reduced business travel and office use
Risk appetiteOur first priority is the safety and wellbeing of colleagues, customers and business partners and we take a proactive approach to managing health and safety risks.
How we manage and mitigate risk• Our focus is on prevention through establishing good
health and safety operating standards. This is led by a central Health, Safety and Security team with regional experts who help embed consistent approaches, validate standards and provide targeted support
• The Risk Committee monitors progress on health and safety and holds regular reviews each year
• Events and Informa’s facilities are subject to audit and required actions are monitored until complete
• We have a Company-wide travel management system to ensure accommodation and travel are booked to acceptable safety standards. It also provides support to colleagues in the event of an emergency
• Mandatory online training was rolled out across the Company for the first time in 2020 to establish good practices and prevent issues occurring and Senior Management received updated training on their responsibilities. Work also continued to improve and document our standards and framework
• Specific health and safety impacts from the pandemic were assessed and addressed. This included communication and support for colleagues around remote working, including physical and mental wellbeing. Informa also led an industry collaboration to develop enhanced AllSecure health and safety standards for physical events, and deployed these in our business as Informa AllSecure (see pages 18 and 19)
Operating internationally means we are exposed to major incidents, such as those caused by extreme weather or natural disasters, military action or terrorism, or disease outbreaks. These can harm people, venues and facilities and severely interrupt business. Companies can rarely control the cause of major incidents but can ensure an effective response that reduces their impacts. Inadequately responding to a major incident could result in reputational damage and potentially criminal and civil investigations.
EMT owner: Group Chief Operating OfficerLatest movement: Risk likelihood was increased at the start of 2020 due to the pandemic and is since stable
Risk appetiteWe have a low appetite for this risk and proactively manage it.
How we manage and mitigate risk• Informa has a central Health, Safety and Security team
that provides expertise on incident management and supports teams in the event of an emergency
• In severe circumstances, a specific Crisis Council convenes to direct the Company’s response and in 2020 a dedicated COVID Executive Leadership Team was formed to manage the pandemic response (see page 10)
• We enhanced the governance and management of incident response risk in 2020, establishing a Business Resilience Council to co-ordinate key functions and areas of response and beginning the implementation of a new business resilience programme. A global security business impact analysis was also developed to map where we operate against key risk factors
• Each Informa event has an incident response plan specific to its location, format and operational team. These were reviewed in 2020 to assess and confirm coverage of digital events
• Each Division considers known extreme weather patterns when planning event schedules. Our understanding of longer-term weather impacts has been deepened through a dedicated climate change risk assessments (see pages 69 and 70)
• The Group considers terrorism threats, proximity to likely targets and potential unrest or protests in event planning. Where operations are deemed high risk, we conduct enhanced security risk assessments so that appropriate measures can be taken to protect customers, colleagues and business partners
INFO
RM
A P
LC A
NN
UA
L R
EP
OR
T A
ND
AC
CO
UN
TS
20
20 IN
FOR
MA
PLC
AN
NU
AL R
EP
OR
T AN
D A
CC
OU
NT
S 20
20
74 75
ST
RA
TE
GIC
RE
PO
RT

P R I N C I P A L R I S K S A N D U N C E R T A I N T I E S c o n t i n u e d
11. 12.
Inadequate regulatory compliance
Privacy regulation
13.
Pandemic risk
The Group’s licence to operate is partly determined by compliance with national and international regulation and the support of our stakeholders, who increasingly favour companies that work in an ethical way. Failure to comply with applicable regulations could lead to fines or imprisonment, damage reputation and impact the ability to trade in some countries.
EMT owner: Group General Counsel and Company SecretaryLatest movement: No change in likelihood or impact in 2020
Risk appetiteWe are committed to ethical and lawful behaviour in all we do. Colleagues and business partners who support us or act on our behalf are expected to take appropriate steps to comply with applicable laws and regulations.
How we manage and mitigate risk• Informa’s commitment to acting responsibly and
upholding a culture of transparency, integrity and respect is articulated in our guiding principles and the Company’s Code of Conduct and Business Partner Code of Conduct. These also set out the behaviour expected of all colleagues and business partners
• The Group has a compliance programme designed to ensure we meet our obligations under material legislation. This is monitored to ensure continuous improvement. It incorporates a sanctions programme that includes internal controls, risk-based screening of vendors and customers, training and communications
• New starters receive compliance training modules promptly and are required to accept the core Group policies relevant to their roles. Training is on areas including Code of Conduct, Anti-Bribery, Sanctions, Tax, Modern Slavery, Data Privacy, Acceptable Use of Technology and Information Security standards. Completion is required within a set timeframe and this is monitored and followed up where necessary
• All colleagues received refresher training on our updated Code of Conduct in 2020, with additional training for some colleagues on Sanctions and Tax
• We provide whistleblowing and speak-up facilities to enable anyone inside or outside the business to raise concerns confidentially. Retaliation for raising genuine concerns is not tolerated. All reports of breaches of our Code of Conduct and policies are investigated promptly and actions taken to remedy any breaches
We use data on current and prospective customers to market brands, develop and personalise products and create new services. The use of personal information is governed by privacy legislation. Tighter legislation could limit our access to and use of such data and non-compliance can lead to fines, damage reputation and trust and impact the ability to trade in some countries. Over-compliance, by taking the strictest individual country rules and applying them internationally, could impact our competitiveness.
EMT owner: Group General Counsel and Company SecretaryLatest movement: The risk has slightly increased due to the use of personal data in new ways for product development and potential risks from increased remote working
Risk appetiteWe respect and value personal information and privacy and seek to comply with regulatory requirements.
How we manage and mitigate risk• We have central and Divisional resources dedicated to
ensuring data privacy compliance. This is led by the Group Data Protection Officer with Divisional Privacy Managers embedded into business operations
• Our data privacy programme is re-evaluated each year to ensure the impacts of business priorities, new initiatives and emerging privacy regulation are addressed and incorporated. There is also ongoing monitoring of external factors and changes in data protection laws, with any operational impacts communicated and considered
• The global trend is towards more rigorous privacy laws and our planning takes this into account, so that marketing strategies can still operate successfully under stricter regulations
• All colleagues receive mandatory training on their data privacy responsibilities. Online refresher training took place in 2020, with a fail mark leading to retaking the full training
• As our events businesses increase their use of data and new platforms to create more virtual events and additional digital services, they continue to be closely supported and guided by our data privacy experts on best practice
• We are continuously working to strengthen our privacy management practices and processes, including through automating and enhancing our prevention and detection control environments
A pandemic is an infectious disease outbreak that spreads across large regions and affects substantial numbers of people. It can have a significant impact on public health, including the safety of colleagues and customers, as well as impacting global economies. A pandemic may curtail in-person gatherings and physical events in one or more markets. Taken together, this can challenge business operations and stability and impact our event revenues.
EMT owner: Group Chief Executive OfficerLatest movement: This is a newly recognised principal risk, which has materialised and is rated with a high impact
Risk appetiteWhile there is no risk appetite for pandemics, we recognise the need to ensure the Company’s resilience and ability to tolerate its impacts.
How we manage and mitigate risk• Informa moved swiftly to manage the impact of the
COVID-19 pandemic. The strategy and approach were led by a COVID Executive Leadership Team, focused on fast and agile decision making and effective communication to the Company and other stakeholders, including investors and customers. Executive Directors were in continuous contact with the Board on actions
• We implemented a wide-ranging COVID-19 Action Plan (see pages 10 and 11) that included the Postponement Programme to reschedule physical events, financing actions to ensure the Company’s financial stability and security through 2021 and beyond, cost and cash management measures and a range of support for colleagues and customers
• The COVID Executive Leadership Team assessed and managed health and safety impacts throughout the year as a priority. In all locations, we followed and directed teams to follow the advice of official authorities. Teams received clear guidance on safe and effective working from home and colleagues had access to individual wellbeing and financial support
• Biosecurity measures were introduced in offices. As described on pages 18 and 19 we developed Informa AllSecure, a set of enhanced health and safety standards for all Informa physical events to deliver hygienic and high quality event experiences and provide confidence to customers and business partners
INFO
RM
A P
LC A
NN
UA
L R
EP
OR
T A
ND
AC
CO
UN
TS
20
20 IN
FOR
MA
PLC
AN
NU
AL R
EP
OR
T AN
D A
CC
OU
NT
S 20
20
76 77
ST
RA
TE
GIC
RE
PO
RT

V I A B I L I T Y S T A T E M E N T
As discussed by the Chair in his introduction and in the Section 172 statement on page 45, Informa’s Directors are focused on promoting the sustainable, long-term success of the Group for the benefit of Shareholders, colleagues, customers and our other key communities and groups.
We assess the Group’s viability over a three-year period and its longer-term prospects in a structured way, based on Informa’s business model, trends in the markets in which we work, the Group’s strategy and our principal risks.
How long-term prospects are assessedThe Group’s prospects are assessed primarily through the business planning and strategy process. Informa’s current position, Group-level strategy, business model and the risks related to the business model are all inputs into this assessment.
In response to the uncertainty caused by the COVID-19 pandemic and the
Assessing long-term prospects and viability
fast-changing nature of the pandemic’s disruption, we have adapted the business planning and strategy process to be more dynamic. This includes a continual reassessment of the pandemic’s impact and the potential timing and pace of recovery in our physical events portfolio in particular, based on current circumstances and known information. In addition, it continues to cover planning for growth initiatives and investment in our products, platforms and brands across the Company.
This dynamic business planning process considers each Division’s assessment of the factors influencing their performance, from external factors such as customer demand, peer activity, broader market trends and risks to internal factors including talent trends, product development and technology platforms.
From this process, business objectives are set based on what is known about market trends, market demands,
emerging risks and opportunities over that period, plus an analysis of what the business needs to do to achieve those objectives, whether that is launching new activities, adapting our technological capabilities, securing additional capabilities or continuing existing programmes.
From these objectives and planned initiatives, a financial plan is established for each Division, including financial forecasts and a clear explanation of key assumptions and risks. Plans are updated at key dates and for significant events and are reviewed regularly in detail by the Group Chief Executive, Group Finance Director, Chief Operating Officer and the Director of Strategy and Business Planning.
These financial forecasts are also used as a basis for the annual impairment review and the viability analysis. This in turn informs the Group’s assessment of its funding requirements and is used to evaluate the resources and liquidity
available for organic investment and for returning capital to Shareholders.
How viability and going concern are assessed In assessing the viability and going concern basis for preparing the financial statements, the Directors have considered the future trading prospects of the Group’s businesses and the Group’s available liquidity and debt maturities.
As discussed in the Group Chief Executive’s Review and described in the COVID-19 Action Plan overview on pages 10 and 11, Informa moved quickly in 2020 to implement a plan to secure the stability and strength of the Group and preserve its long-term value.
In terms of the viability and going concern assessment, the most relevant and significant outcomes from the COVID-19 Action Plan include: Informa’s strengthened liquidity, following the oversubscribed £1bn equity issue; its flexible financing mix following the issuance of €700m in additional Euro bonds and £150m in additional sterling bonds as well as the cancellation of US private placement notes; and its effective cost and cash management
Factors used to assess long-term prospectsInforma’s current position Strategy and business model Principal risks
• A broad and international business, with deep positions in dozens of specialist markets and a diversified customer base
• A product portfolio that includes a range of business-to-business knowledge-based products and services delivered in multiple formats
• Brands that have strong positions in their markets
• Material proportion of subscription-led and recurring revenues
• Customer led and focused on serving customers in flexible ways
• Flexible cost structure• Focus on preserving long-term
value through the COVID-19 pandemic
• The Group’s focus on long-term sustainable growth through market specialisation
• A strategy that includes deepening Informa’s business-to-business product portfolio, enhancing digital capabilities and strengthening operating capabilities
• A reliance on people, talent and culture, strong brands, robust technology, forming successful partnerships and access to financing
• Enhanced commitments and accelerated progress on sustainability
• The principal risks directly related to Informa’s business model plus emerging risks being monitored
• Principal risks relate to: growth, including broader global economic instability and market disruption; people, including attracting and retaining key talent and health and safety; and culture, including regulatory compliance
measures, with over £600m of savings secured by the end of 2020.
Viability and going concern testing is carried out against Informa’s existing debt facilities, with an assumption that the Group’s current debt structure remains unchanged and there is no refinancing of current facilities during the forecast period.
The Group has a strong available liquidity position as at 31 March 2021 with £350m of cash and undrawn committed credit facilities of £1,050m and, following the actions taken in 2020, has no financial covenants on its borrowings. In addition, the fact that the Group is a well-established borrower provides the Directors with confidence that the Group could further increase liquidity by raising additional debt finance should it be required or desired.
Viability assessment The Directors have assessed Informa’s viability over the three-year period to 31 December 2023. We believe this is an appropriate timeframe because it is consistent with the near-term visibility of market trends, the nature of Informa’s business and the previous time horizons we have planned for and
assessed performance against. We recognise future assessments are subject to a level of uncertainty that increases further out in time and, therefore, future outcomes cannot be guaranteed or predicted with certainty.
The viability assessment starts by taking each of the Group’s principal risks and considers a severe but plausible scenario. Where a severe but plausible scenario creates a potential financial impact of over 5% of the average EBITDA across 2018, 2019 and 2020, the principal risk is modelled against the Group’s financial plan to test whether it would adversely impact the Group’s viability on a stand-alone basis.
In this year’s assessment, we have modelled the Group’s financial plan against four severe but plausible scenarios: a considerably worse economic backdrop; a weaker performance than anticipated in certain key markets; the impact of a continued global economic downturn including a continued delay to the return of the majority of physical events due to the pandemic; and the impact of a significant external event on our business. The potential financial impacts of these risks are also modelled together as a single scenario, to understand their combined financial impact.
Principal risk Risk assessed
Risk above 5% average annual
EBITDA
Impact on viability
modelledMulti-scenario
test
Economic instability √ √ √ √
Market risk √ √ √ √
Acquisition and integration risk √ x x x
Ineffective change management √ x x x
Reliance on key counterparties √ x x x
Technology failure √ x x x
Data loss and cyber breach √ x x x
Ability to attract and retain key talent √ x x x
Health and safety incidents √ x x x
Inadequate response to major incidents √ √ √ √
Privacy regulation √ x x x
Inadequate regulatory compliance √ x x x
Pandemic risk √ √ √ √
INFO
RM
A P
LC A
NN
UA
L R
EP
OR
T A
ND
AC
CO
UN
TS
20
20 IN
FOR
MA
PLC
AN
NU
AL R
EP
OR
T AN
D A
CC
OU
NT
S 20
20
78 79
ST
RA
TE
GIC
RE
PO
RT

V I A B I L I T Y S T A T E M E N T c o n t i n u e d
Specific scenarios we have tested against include:
• That no indoor physical events are held until 2022 outside of the parts of the world where such events are already and currently operating
• That physical indoor events in 2021 show a lower participation rate than normal, due to ongoing restrictions in the number of people able to travel and gather and the continued impact on customer confidence
• That there is a slower recovery of physical event-related businesses from 2022 than anticipated
• That subscription-related revenues in 2021 are affected by unfavourable market and macro-economic conditions, impacting revenues and profit margins
The Group is considered viable if, after this assessment, there is available headroom on the Group’s financing facilities for cash liquidity to fund operations and repay debts as they fall due.
In the latest viability risks assessments, the Group remains viable including when modelling the four largest risks together, with no additional cost mitigations assumed.
Directors’ Viability StatementHaving completed the viability assessment, the Directors have concluded that it is unlikely, but not impossible, that a single risk could test the future viability of the Group.
Subject to these risks and on the basis of the analysis undertaken, however, the Directors have a reasonable expectation that the Group will be able to continue to operate and meet its liabilities as they fall due over a period of three years to 31 December 2023.
Going concern The restrictions adopted by authorities worldwide to limit the spread of COVID-19 have created a degree of uncertainty around forecasting Informa’s physical events revenues.
In response, the Directors have considered the Company’s ability to be a going concern over the assessment period to June 2022 based on the Group’s financial plan, a downside scenario and a reverse stress test case.
The Group’s financial plan assumes physical events outside of Asia start to return from June 2021 and there is a slower recovery for physical events compared with GDP forecasts for the same period in those geographies. In this scenario, the Group maintains liquidity headroom of more than £1.3bn.
For the downside case, the Directors took the Group’s financial plan and also assumed the following:
• No indoor physical events are held until 2022 outside of the parts of the world where such events are already and currently operating
• A slower recovery of physical event-related businesses with lower levels of participants
• Subscription-led revenues are affected by unfavourable market and macro-economic conditions, impacting revenues and profit margins
In this scenario, the Group maintains liquidity headroom of more than £1.1bn.
For the reverse stress test, the Directors assessed the Group’s liquidity position if it had no gross profit between May 2021 and June 2022 and all physical event-related cash collected as at 31 March 2021 was refunded to customers. The Directors believe the assumptions applied in this reverse stress test are extremely remote, given that the Group’s subscription-led businesses continue to generate profit. However, in this test, the Group still maintains a minimum liquidity headroom of over £200m.
Based on these results, the Directors believe that the Group is well placed to manage its financing and other business risks satisfactorily. The Directors have been able to form a reasonable expectation that the Group has adequate resources to continue in operation for at least 12 months from the signing date of the Annual Report and Accounts, and therefore consider it appropriate to adopt the going concern basis of accounting in preparing the financial statements.
Multi-year Group strategy plan
Outcomes assessed against available Group liquidity headroom
Plan tested against the four principal risks where, in a severe but
plausible scenario, impact of risk is valued
at over 5% of average EBITDA
Multi-year Divisional strategic
plans created
Group is viable if sufficient liquidity
headroom is maintained
Viability modelling
Tested against economic
instability
Tested against market risk
Tested against inadequate
response to major incidents
Tested against pandemic risk
Tested against economic instability, market risk, inadequate response to major incidents and pandemic risk simultaneously
INFO
RM
A P
LC A
NN
UA
L R
EP
OR
T A
ND
AC
CO
UN
TS
20
20 IN
FOR
MA
PLC
AN
NU
AL R
EP
OR
T AN
D A
CC
OU
NT
S 20
20
80 81
ST
RA
TE
GIC
RE
PO
RT

F I N A N C I A L R E V I E W
Ensuring Stability and Security
Over recent years, we have steadily and deliberately built a portfolio of specialist businesses and brands
with international reach and scale. Our broad geographic mix meant we were alive to the challenges of the COVID-19 pandemic early in 2020, enabling us to respond quickly to the challenges it presented to our business and the wider world.
From the outset, our response to the pandemic was built around a focus on preserving and protecting the long-term value of our brands and businesses, whilst, critically, providing strong support to colleagues and customers.
Our agile response provided the Group with stability and security through 2020 and has ensured we are well placed for 2021 and beyond, with a secure balance sheet, no maturities until 2023 and ample liquidity to support our brands and customer relationships as they begin to recover. We remain confident in our ability to deliver long-term sustainable growth and Shareholder value in the years to come.
Attractive long-term operational and financial characteristicsOne of the strengths of the Informa Group has always been the high proportion of revenues which are forward booked and recurring in nature. Our portfolio of resilient subscription-led businesses has proved particularly robust through the pandemic, providing a solid, predictable revenue base in the face of significant disruption in events.
The quality of our brands, depth of knowledge of specialist markets and strength of our customer relationships
Markets’ revenue was generated within Mainland China in 2020, almost double that in 2019.
The international nature of our business means we make tax contributions in multiple countries. Our approach to tax planning continues to be low risk, recognising the importance of tax contributions to the economies and communities in which we operate. The Group’s effective tax rate* decreased in 2020 to 15.0% (2019: 19.0%).
The Group has six defined benefit schemes, with all schemes closed to future accruals. We reported a small net pension liability of £71.4m (2019: £30.1m) which we continue to address through recovery payments.
Stability and security in financingThe impact of the pandemic on Informa Markets, Informa Connect and Informa Tech, partly offset by predictable performance across our subscription-led businesses, led to a decrease in reported revenue to £1,660.8m in 2020 representing an underlying decline of 41.0% (2019: growth of 3.5%) adjusting for the effects of currency movements, acquisitions, disposals and phasing. Reported revenue was in line with the guidance issued at our half-year results.
Encouragingly, the demand for our brands and strength of our customer relationships has meant refunds have remained low, at around 25% of the gross cash we had collected before the pandemic. Many customers have rolled credit into the rescheduled events. A similar approach was adopted by our venue partners. Together, these mitigated the impact on working capital through 2020.
As the impact of the pandemic on our revenues became more apparent, we
progressively expanded the cost measures deployed. Alongside the direct savings from events that were unable to run, we launched a programme to reduce our indirect costs, beginning with the removal of all discretionary expenditure, pausing non-essential projects, recruitment and pay review, before turning to our real estate portfolio, consolidating space where possible. We introduced voluntary sabbaticals for colleagues and also offered a voluntary severance programme in the third quarter, with some targeted compulsory redundancies in certain areas of the business during the fourth quarter.
In total, the Group delivered £400m of direct cost savings to adjusted operating profit and a further £200m of annualised indirect cost savings by the end of 2020, that helped to limit the year-on-year reduction in adjusted operating profit (2020: £268m, 2019: £933m), while also ensuring the Group entered 2021 with an appropriate level of costs for the year ahead.
The statutory operating loss was £880.4m (2019: profit £538.1m), largely driven by the non-cash impairment of goodwill within the three event-led businesses and the reduction in adjusted operating profit, as well as reduced trading partly offset by cost saving measures.
In February, we secured a £750m surplus credit facility, which was not drawn, and confirmed access to a further £300m from the Bank of England Covid Corporate Financing Facility. This provided short-term liquidity should it have been required. In the event, neither facility was used, with the surplus facility cancelled later in the year following two successful issuances in the Euro bond market for a combined £790m and a £150m increase to our revolving credit facility.
Earlier in the year, we received strong support from our Shareholders, both in pausing dividends and also in the issue of £1bn of fresh equity in May. This immediately strengthened our balance sheet, reducing our net debt and leverage, enabling us to keep making decisions for the long-term strength of our business, rather than to satisfy a short-term covenant requirement. In November, we
redeemed all outstanding US private placement notes, removing all financial covenants. Following the Euro bond issues this provided us with liquidity of over £1bn and extended our earliest debt maturity to 2023.
Our cost of debt reduced to 3.3% and average maturity was 4.8 years. We expect to be within our targeted leverage range of 2–2.5x by the end of 2022.
Looking forward to 2021 and beyondOur actions in 2020 have put the Group in a strong and stable financing position for 2021 and beyond. The combination of our cost activities and refinancing actions mean the Group will be cash positive from the start of 2021, regardless of a broader recovery in physical events.
Our subscription-led businesses remain a solid foundation for the Group, representing 52% of Group revenue in 2020, and delivering another solid performance, underpinned by strong renewal rates and positive annualised contract values.
As vaccine programmes progress around the world, we are planning for the progressive return of physical events beyond Mainland China from late spring 2021, although we remain flexible in our approach.
The events of 2020 provided an opportunity for us to experiment with digital innovation and virtual events, generating deep pools of data and providing unique insights into our customers’ needs and experiences. As we move into 2021 we look to further develop our digital offerings through organic investments where these make sense.
We continue to view the Knowledge and Information Economy as a growing market, where we have strong, established brands across our information services, advanced learning and events businesses, providing potential for future growth and expansion as the world recovers from the impact of the pandemic.
Gareth Wright Group Finance Director
£600m+ Annualised total savings in 2020
£1bn+ Cash and available facilities
Gareth WrightGroup Finance Director
enabled us to adapt quickly to the absence of physical events, rolling out virtual events and digital products to complement the many specialist marketing services and media products our event-led businesses offer. This opened up new revenue streams for the Group, helping to offset some of the revenue lost from physical events. As a Group we continue to see around half of our revenue coming from North America, about 20% from Asia, about 20% from the UK and Europe and 10% from the rest of the world.
Whilst the international mix of our subscription-led businesses was largely unchanged in 2020, the differing impact of the pandemic around the world is reflected in the currency mix of events revenue. Physical events ran to schedule in January and February before the impact of COVID-19 spread around the world and lockdown restrictions began to be imposed. Events later restarted in Mainland China and in a handful of other locations. The quicker recovery here meant that around 30% of Informa
INFO
RM
A P
LC A
NN
UA
L RE
PO
RT A
ND
AC
CO
UN
TS 2
02
0
83
ST
RA
TE
GIC
RE
PO
RT
INFO
RM
A P
LC A
NN
UA
L R
EP
OR
T A
ND
AC
CO
UN
TS
20
20
82

F I N A N C I A L R E V I E W c o n t i n u e d
Income StatementThe 2020 financial year was dominated by the impact of COVID-19, which led to enforced lockdown and major travel restrictions in most countries around the world for much of the year, severely disrupting many industries. At Informa, we demonstrated resilience and strength in our subscription-led businesses and the power of our data and relationships in our specialist B2B media, marketing services and virtual events activities. Our physical events portfolio started the year positively before being severely disrupted by COVID-19. Our response was to launch a major Cost Management Programme, a range of financing initiatives and an extended Postponement Programme, including the launch of more than 500 virtual events. Our COVID-19 Action Plan helped to limit the overall impact on the Group’s financial performance but revenues and profits were significantly lower than 2019.
Adjusted results*
2020 £m
Adjusting items*
2020 £m
Statutory results
2020 £m
Adjusted results
2019 £m
Adjusting items2019
£m
Statutory results
2019 £m
Revenue 1,660.8 – 1,660.8 2,890.3 – 2,890.3
Operating profit/(loss) 267.8 (1,148.2) (880.4) 933.1 (395.0) 538.1Loss on disposal – (8.4) (8.4) – (95.4) (95.4)Net finance costs (97.4) (153.5) (250.9) (111.7) (12.3) (124.0)
Profit/(loss) before tax 170.4 (1,310.1) (1,139.7) 821.4 (502.7) 318.7Tax (charge)/credit (25.6) 127.7 102.1 (156.1) 83.5 (72.6)
Profit/(loss) for the period 144.8 (1,182.4) (1,037.6) 665.3 (419.2) 246.1
Adjusted operating margin 16.1% 32.3%Diluted EPS1 9.9p (73.4p) 51.0p 17.8p
1. 2019 restated for share placement
Statutory Income Statement resultsThe disruption to our physical events portfolio led to a 42.5% decrease in reported revenue to £1,660.8m.
The Group reported a statutory operating loss of £880.4m compared with an operating profit of £538.1m for the year ended 31 December 2019. This reflects the reduction in revenue as well as an increase in adjusting items, with a significant proportion relating to a non-cash goodwill impairment of £592.9m.
This impairment reflected the impact of COVID-19 on the long-term trading outlook for our physical events portfolio within Informa Markets, Informa Connect and Informa Tech. The impairment review was based on forecasts as at 30 June, when the continued inability to run physical events in our largest market, North America, and most other locations, was expected to significantly impact the full-year outcome in 2020, before the assumption of a gradual recovery over the next few years.
For modelling purposes, it was assumed that the Group returns to 2019 levels of operating cash flow by 2025. This resulted in a non-cash impairment of £231.1m for Informa Markets, £105.9m for Informa Connect and £255.9m for Informa Tech.
Since 30 June, the expected outlook in Mainland China has improved with physical events operating throughout the second half of 2020 and in 2021. In addition, a number of other regions, including the US, are expected to gradually see physical events return in the second half of 2021, as the progressive rollout of COVID-19 vaccines leads to a relaxation in restrictions and permissions to hold face-to-face events return. The annual impairment review performed at 31 December 2020 showed no further impairment being required.
Statutory net finance costs increased by £126.9m to £250.9m, comprising £266.2m of finance costs and £15.3m of finance income. The main driver of the increase was one-off costs associated with the restructuring and rescheduling of debt.
The combination of all these factors led to a statutory loss before tax of £1,139.7m, compared with a profit before tax of £318.7m in the prior year. This statutory loss led to a tax credit for the year of £102.1m, compared with a tax charge of £72.6m in the prior year.
The statutory operating loss flowed through to a statutory diluted loss per share of 73.4p, compared with an earnings per share of 17.8p for the year ended 31 December 2019. The difference primarily reflected the impact of the COVID-19 pandemic on trading and the related non-cash impairment charge, partially offset by the favourable tax charge for the year. There was also a 155.5m increase in the weighted average number of shares used for calculating diluted earnings per share compared with 2019, reflecting the impact of the equity addition in April/May 2020, which saw 250.3m new shares being issued.
Measurement and adjustmentsIn addition to statutory results, adjusted results are prepared for the Income Statement. These include adjusted operating profit, adjusted diluted earnings per share and other underlying measures. A full definition of these metrics can be found in the glossary of terms on page 228. The Divisional table on page 86 provides a reconciliation between statutory operating profit and adjusted operating profit by Division.
Underlying revenue and adjusted operating profit growth on an underlying basis are reconciled to reported growth in the table below. For the calculation of underlying growth, where an event originally scheduled for 2020 was either cancelled or postponed to 2021, no adjustment to 2019 revenue was made.
Underlying (decline)/
growthPhasing and other items
Acquisitions and disposals
Currency change
Reported (decline)/
growth
2020Revenue (41.0%) (0.6%) (0.6%) (0.3%) (42.5%)Adjusted operating profit (70.8%) (0.8%) (0.2%) 0.5% (71.3%)2019
Revenue 3.5% 0.2% 15.3% 3.0% 22.0%Adjusted operating profit 6.5% 2.1% 12.1% 6.8% 27.5%
Adjusting itemsThe items below have been excluded from adjusted results. The total adjusting items in the period increased to £1,148.2m (2019: £395.0m), largely due to the non-cash impairment of goodwill, one-off COVID-19-related onerous contract costs and one-off costs relating to the Group’s voluntary severance programme and some targeted redundancies.
2020 £m
2019£m
Intangible amortisation and impairment Intangible asset amortisation1 291.8 312.4 Impairment – goodwill 592.9 0.9 Impairment – acquisition-related intangible assets 38.5 3.8 Impairment – right of use assets 36.1 4.6 Impairment – property and equipment 8.8 – Impairment – investments 3.9 –Acquisition costs 2.8 3.3Integration costs 46.3 56.4Restructuring and reorganisation costsRedundancy and reorganisation costs 47.6 6.4Vacant property and finance lease modification costs 30.0 2.2Onerous contracts associated with COVID-19 47.3 –Other items associated with COVID-19 5.3 –Subsequent remeasurement of contingent consideration (3.1) 3.2VAT charges – 1.8
Adjusting items in operating profit 1,148.2 395.0Loss on disposal businesses 8.4 95.4Finance income (8.3) (1.2)Finance costs 161.8 13.5
Adjusting items in (loss)/profit before tax 1,310.1 502.7Tax related to adjusting items (127.7) (83.5)
Adjusting items in (loss)/profit for the year 1,182.4 419.2
1. Excludes acquired intangible product development and software amortisation
Intangible amortisation of £291.8m relates to the historical additions of book lists and journal titles, acquired databases, customer and attendee relationships and brands related to exhibitions, events and conferences. As it relates to acquisitions, it is not treated as an ordinary cost. By contrast, intangible asset amortisation arising from software assets and product development is treated as an ordinary cost in the calculation of operating profit, so is not treated as an adjusting item.
INFO
RM
A P
LC A
NN
UA
L R
EP
OR
T A
ND
AC
CO
UN
TS
20
20 IN
FOR
MA
PLC
AN
NU
AL R
EP
OR
T AN
D A
CC
OU
NT
S 20
20
8 4 85
ST
RA
TE
GIC
RE
PO
RT

Non-cash impairment of goodwill of £592.9m arises from the impact of the COVID-19 pandemic on the carrying value of our physical events portfolio as noted in the Statutory Income Statement results section. See Note 10 to the Consolidated Financial Statements for further details.
Impairment of acquisition-related intangibles of £38.5m reflects impairment for assets where businesses are no longer expected to trade or where the impairment review has shown the carrying value was not supportable.
Impairment of right of use assets of £36.1m, together with the vacant property and finance lease modification costs of £30.8m, arose from our Balanced Working Programme and the decision to permanently vacate a number of office properties from June 2020.
Integration costs of £46.3m include £27.5m relating to the acquisition of UBM, consisting mainly of process, property and colleague-related reorganisation costs. The remaining £18.8m of integration costs includes one-off costs relating to the addition of IHS Markit’s TMT Research and Intelligence portfolio.
Redundancy and reorganisation costs of £47.6m include the one-off costs relating to our voluntary and targeted severance programmes that were undertaken in the second half of 2020.
Onerous contracts associated with the pandemic were £47.3m through the period, arising from costs for events which were cancelled or postponed due to COVID-19, where the costs could not be recovered, typically related to venues and event set-up. The other items associated with COVID-19 of £5.3m are one-off indirect costs largely relating to contractual commitments to the owner of an event that was cancelled.
The table below shows the results and adjusting items by Division, highlighting a robust performance by our subscription-led businesses, Informa Intelligence and Taylor & Francis, offset by the impact of COVID-19 on physical events at Informa Markets, Informa Connect and Informa Tech.
Informa Markets
£m
Informa Connect
£m
Informa Tech
£m
Informa Intelligence
£m
Taylor & Francis
£mGroup
£m
Revenue 524.4 124.2 150.9 305.3 556.0 1,660.8Underlying revenue (decline)/growth (62.7%) (55.1%) (45.9%) 1.8% (0.2%) (41.0%)
Statutory operating (loss)/profit (597.4) (175.8) (316.7) 63.4 146.1 (880.4)Add back:Intangible asset amortisation1 185.7 16.8 20.7 16.6 52.0 291.8Impairment of goodwill 231.1 105.9 255.9 – – 592.9Impairment – acquisition-related intangible assets 24.1 4.5 6.2 2.7 1.0 38.5Impairment – right of use assets 15.0 5.3 2.5 7.0 6.3 36.1Impairment – property and equipment 4.2 1.3 0.8 1.0 1.5 8.8Impairment – investments – 2.5 – 1.4 – 3.9Acquisition costs 0.9 – 0.4 1.3 0.2 2.8Integration costs 24.0 1.6 16.9 3.0 0.8 46.3Redundancy and reorganisation 26.9 6.4 9.6 2.9 1.8 47.6Vacant property & finance lease modification costs 12.6 5.3 2.2 3.6 6.3 30.0Onerous contracts associated with COVID-19 41.0 3.3 2.9 0.1 – 47.3One-off costs associated with COVID-19 5.3 – – – – 5.3Remeasurement of contingent consideration 0.9 (0.7) (3.3) – – (3.1)Adjusted operating (loss)/profit (25.7) (23.6) (1.9) 103.0 216.0 267.8Underlying adjusted operating profit (decline)/growth (106.7%) (153.4%) (103.3%) 4.7% 1.3% (70.8%)
1. Intangible asset amortisation is in respect of acquired intangibles, and excludes amortisation of software and product development
F I N A N C I A L R E V I E W c o n t i n u e d
Adjusted Net Finance CostsAdjusted net finance costs, consisting of the interest costs on our US private placement loan notes and our corporate bonds and bank borrowings, decreased by £14.3m in the year to £97.4m. The decrease primarily relates to lower interest rates following the refinancing of a US dollar bond and certain private placement notes in October 2019 and February 2020.
Adjusting items for finance costs of £161.8m and finance income of £8.3m primarily relate to our COVID-19 Financing Action Plan, which removed financial covenants from our balance sheet, pushed our earliest debt maturity out to 2023 and improved available liquidity to north of £1bn. The costs and income associated with this restructuring and rescheduling of debt, which included make-whole interest payments to debt holders, was £161.7m.
The reconciliation of adjusted net finance costs to the statutory finance costs and finance income is as follows:
2020 £m
2019£m
Finance income (15.3) (10.1)Finance costs 266.2 134.1Add back: Adjusting items relating to finance income 8.3 1.2Add back: Adjusting items relating to finance costs (161.8) (13.5)
Adjusted net finance costs 97.4 111.7
TaxationApproach to taxThe Group continues to recognise that taxes paid are part of the economic benefit created for the societies in which we operate, and that a fair and effective tax system is in the interests of taxpayers and society at large. We aim to comply with tax laws and regulations everywhere the Group does business. Informa has open and constructive working relationships with tax authorities worldwide and our approach balances the interests of stakeholders including Shareholders, governments, colleagues and the communities in which we operate.
The Group’s effective tax rate reflects the blend of tax rates and profits in the jurisdictions in which we operate. In 2020, the adjusted effective tax rate was 15.0% (2019: 19%).
The calculation of the adjusted effective tax rate is as follows:
2020 £m
2019£m
Adjusted tax charge 25.6 156.1Adjusted profit before tax 170.4 821.4
Adjusted tax rate % 15.0% 19.0%
INFO
RM
A P
LC A
NN
UA
L R
EP
OR
T A
ND
AC
CO
UN
TS
20
20 IN
FOR
MA
PLC
AN
NU
AL R
EP
OR
T AN
D A
CC
OU
NT
S 20
20
86 87
ST
RA
TE
GIC
RE
PO
RT

Tax paymentsDuring 2020, the Group paid £32.9m (2019: £100.6m) of corporation and similar taxes on profits, with the year-on-year reduction reflecting the lower profit before tax reported in the year.
A breakdown of the main geographies in which the Group paid tax is as follows:
2020 £m
2019£m
UK 4.5 25.8Continental Europe 2.7 10.7US 1.6 19.9China 14.1 21.8Rest of world 10.0 22.4
Total 32.9 100.6
The reconciliation of the adjusted tax charge to cash taxes paid is as follows:
2020 £m
2019£m
Tax charge on adjusted profit before tax per Consolidated Income Statement 25.6 156.1Movement in deferred tax including tax losses 2.8 (27.1)Net current tax credits in respect of adjusting items (3.0) (20.1)Movement in provisions for uncertain tax positions (1.1) 4.3Taxes paid in different year to charged 8.6 (12.6)
Taxes paid per statutory cash flow 32.9 100.6
At the end of 2020, the deferred tax assets relating to US and UK tax losses were £124.9m (2019: £69.2m) and £42.3m (2019: £9.5m) respectively. These are expected to be utilised against future taxable profits.
Goodwill is not amortised as it is subject to impairment review, and as a result there is no charge to adjusting items for goodwill amortisation. However, there can be an allowable tax benefit for certain goodwill amortisation in the US and elsewhere. Where this benefit arises, it reduces the tax charge on adjusted profits.
The amortisation of intangible assets is considered an adjusting item. Therefore, the £13.4m (2019: £14.4m) of current tax credits taken in respect of the amortisation of intangible assets is also treated as an adjusting item, and is therefore included in the tax credits in respect of adjusting items.
Tax contributionThe Group’s total tax contribution, which comprises all material taxes paid to, and collected on behalf of, governments globally was £257.2m in 2020 (2019: £375.2m). The geographic split of taxes paid by our businesses was as follows:
UK£m
US£m
Other£m
Total£m
Profit taxes borne 4.5 1.6 26.8 32.9Employment taxes borne 20.1 18.9 8.1 47.1Other taxes 6.1 0.9 0.8 7.8
Total tax contribution 30.7 21.4 35.7 87.8
In addition to the above, in 2020 we collected taxes on behalf of governments (e.g. employee taxes and sales taxes) amounting to £169.4m (2019: £209.9m).
F I N A N C I A L R E V I E W c o n t i n u e d
Earnings per shareAdjusted diluted earnings per share (EPS) decreased to 9.9p (2019: 51.0p). This reflects the decrease in adjusted earnings to £140.9m (2019: £644.7m), combined with a 12.8% increase in the weighted average number of shares. In April, as part of our COVID-19 Financing Action Plan, an equity addition led to the issue of 250.3m new shares, priced at 400p per a share, a 4% discount to the previous closing share price of 416.8p on 15 April 2020. The weighted average number of shares for the prior year has been restated to reflect the new shares issued, leading to a restatement of EPS and dividends per share as well. The restated EPS figures are detailed below.
An analysis of adjusted diluted EPS and statutory diluted EPS is as follows:
2020 £m
2019£m
Statutory (loss)/profit for the year (1,037.6) 246.1Add back: Adjusting items in (loss)/profit for the year 1,182.4 419.2
Adjusted profit for the year 144.8 665.3Non-controlling interests (3.9) (20.6)
Adjusted earnings 140.9 644.7Weighted average number of shares used in adjusted diluted EPS (m) 1,426.5 1,264.2
Adjusted diluted EPS (p) 9.9p 51.0p
2020 £m
2019£m
Statutory (loss)/profit for the year (1,037.6) 246.1Non-controlling interests (3.9) (20.6)
Statutory earnings (1,041.5) 225.5Weighted average number of shares used in diluted EPS (m) 1,419.7 1,264.2
Statutory diluted EPS (p) (73.4p) 17.8p
DividendsIn April 2020, as part of the Group’s response to the COVID-19 pandemic through our COVID-19 Action Plan, and following consultation with Shareholders, the Board announced the temporary suspension of dividends, including the withdrawal of the 2019 final dividend.
Currency impactOne of the Group’s strengths is its international reach and balance, with colleagues and businesses located in most major regions of the world. This means the Group generates revenues and costs in a mixture of currencies, with particular exposure to the US dollar, as well as some exposure to the Euro and the Chinese renminbi.
In 2020, approximately 63% (2019: 59%) of Group revenue was received in USD or currencies pegged to USD, with 5% (2019: 7%) received in Euro and around 9% (H1 2019: 8%) in Chinese renminbi.
Similarly, we incurred approximately 48% (2019: 53%) of our costs in USD or currencies pegged to USD, with 2% (2019: 3%) in Euro and around 7% (2019: 7%) in Chinese renminbi.
Each one cent ($0.01) movement in the USD to GBP exchange rate has a circa £8m (2019: circa £13m) impact on annual revenue, and a circa £3m (2019: circa £5m) impact on annual adjusted operating profit.
The following rates versus GBP were applied during the year:
2020 2019
Closing rate Average rate Closing rate Average rate
US dollar 1.37 1.29 1.32 1.28Euro 1.11 1.13 1.17 1.14Chinese renminbi 8.94 8.88 9.17 8.80
INFO
RM
A P
LC A
NN
UA
L R
EP
OR
T A
ND
AC
CO
UN
TS
20
20 IN
FOR
MA
PLC
AN
NU
AL R
EP
OR
T AN
D A
CC
OU
NT
S 20
20
88 89
ST
RA
TE
GIC
RE
PO
RT

Free cash flowCash generation remains a key priority and focus for the Group, providing the funds and flexibility for paying down debt, future organic and inorganic investment, and consistent Shareholder returns. Our businesses typically convert adjusted operating profit into cash at an attractive rate, reflecting the relatively low capital intensity of the Group. In 2020, absolute levels of cash flow were significantly lower and conversion rates reflected the impact of COVID-19 on our event-led businesses.
The following table reconciles statutory operating (loss)/profit to operating cash flow and free cash flow. See the glossary of terms for the definition of free cash flow and operating cash flow.
2020 £m
2019£m
Statutory operating (loss)/profit (880.4) 538.1Add back: Adjusting items 1,148.2 395.0
Adjusted operating profit 267.8 933.1Depreciation of property and equipment 16.8 17.2Depreciation of right of use assets 30.3 33.1Software and product development amortisation 41.1 41.9Share-based payments 11.2 10.4Loss on disposal of other assets 0.9 –Adjusted share of joint venture and associate results (0.8) (1.5)
Adjusted EBITDA1 367.3 1,034.2Net capital expenditure (48.4) (49.8)Working capital movement2 (81.9) (13.6)Pension deficit contributions (6.2) (5.4)
Operating cash flow 230.8 965.4Restructuring and reorganisation (35.6) (9.9)Onerous contracts and one-off costs associated with COVID-19 (44.6) –Net interest3 (271.6) (132.8)Taxation (32.9) (100.6)
Free cash flow (153.9) 722.1
1. Adjusted EBITDA represents adjusted operating profit before interest, tax, and non-cash items including depreciation and amortisation
2. Working capital movement excludes movements on restructuring, reorganisation, COVID-19 costs and acquisition and integration accruals as the cash flow relating to these amounts is included other lines in the free cash flow and reconciliation from free cash flow to net funds flow. The variance between the working capital in the Free Cash Flow and the Consolidated Cash Flow Statement is driven by the non-cash movement on these items.
3. Amount includes £161.7m (2019: £13.5m) of make-whole interest paid in respect of the early repayment of private placement and bond debt
The decrease in cash generated compared with 2019 is largely driven by the impact of COVID-19 on operating profit, together with the one-off costs associated with COVID-19 and its adverse impact on working capital movement. The calculation of operating and free cash flow conversion is as follows:
Operating cash flow conversion* Free cash flow conversion
2020£m
2019£m
2020£m
2019£m
Operating cash flow/free cash flow 230.8 965.4 (153.9) 722.1Adjusted operating profit 267.8 933.1 267.8 933.1
Operating cash flow conversion/Free cash flow conversion 86.2% 103.5% (57.5%) 77.4%
Net capital expenditure was £48.4m (2019: £49.8m), equivalent to 2.9% of 2020 revenue (2019: 1.7%).
The working capital outflow of £81.9m was £68.3m higher than the £13.6m outflow in 2019, reflecting the impact of COVID-19 on working capital phasing within the event-led businesses. This was primarily driven by lower cash collections in the year due to the cancellation of events in 2020 and, hence, lower levels of rebooking. It also reflects a small amount of refunds paid to customers in the year, where events were cancelled and lower forward commitments to events scheduled for H1 2021, due to ongoing COVID-19 uncertainty.
The Group continues to hold cash in advance of events, with £466m of cash relating to future events and services held as at 31 December 2020. The strength of our brands and demand for our products led to relatively few customers asking for refunds of cash committed to events that were postponed or cancelled, with only £102m requested during the year.
F I N A N C I A L R E V I E W c o n t i n u e d
Net cash interest payments of £271.6m were £138.8m higher than the prior year, largely reflecting the payments made to US private placement note holders in November 2020, as part of the restructuring and rescheduling of our debt. In 2020 borrowing fees of £17.6m were paid relating to new financing facilities, following the successful issuances in the Euro bond market for a combined £790m and the increase in our revolving credit facility (RCF) of £150m to total £1,050m.
The following table reconciles net cash inflow from operating activities, as shown in the consolidated cash flow statement to free cash flow:
2020 £m
2019£m
Net cash (outflow)/inflow from operating activities per statutory cash flow (139.5) 719.6Interest received 5.7 5.5Borrowing fees paid (17.6) –Purchase of property and equipment (10.7) (17.5)Purchase of intangible software assets (23.8) (25.3)Product development cost additions (13.9) (7.0)Add back: Acquisition and integration costs paid 45.9 46.8
Free cash flow (153.9) 722.1
Net cash from operating activities decreased by £859.1m to record an outflow of £139.5m, principally driven by the reduction in adjusted operating profit and the increased interest payments associated with the restructuring and rescheduling of our debt.
The following table reconciles cash generated by operations, as shown in the consolidated cash flow statement, to operating cash flow shown in the free cash flow table above:
2020 £m
2019£m
Cash generated by operations per statutory cash flow 153.1 958.5Capex paid (48.4) (49.8)Add back: Acquisition and integration costs paid 45.9 46.8Add back: Restructuring and reorganisation costs paid 35.6 9.9Onerous contracts and one-off costs paid associated with COVID-19 44.6 –
Operating cash flow per free cash flow statement 230.8 965.4
The following table reconciles free cash flow to net funds flow and net debt, with net debt reducing by £628.0m to £2,029.6m during the year ended 31 December 2020, primarily due to the net receipt of £973.7m from the proceeds of the equity addition, partly offset by the free cash outflow of £153.9m, acquisitions investment of £176.3m and £59.9m unfavourable movement in exchange rates, mainly driven by the movement in the USD to GBP exchange rates.
2020 £m
2019£m
Free cash flow (153.9) 722.1Acquisitions (176.3) (311.1)Disposals 10.4 179.3Dividends paid to Shareholders (0.2) (280.0)Dividends paid to non-controlling interests (13.6) (17.5)Issuance of shares 973.7 –Purchase of shares (1.3) (15.9)
Net funds flow 638.8 276.9Non-cash movements 61.3 5.7Foreign exchange (59.9) 87.4Net finance lease additions in the year1 (12.2) (16.5)IFRS 16 leases at 1 January 2019 – (343.6)IFRS 16 finance lease receivable at 1 January 2019 – 14.4Net debt b/f (2,657.6) (2,681.9)
Net debt (2,029.6) (2,657.6)
1. Amount excludes finance lease cash repayments or receipts
INFO
RM
A P
LC A
NN
UA
L R
EP
OR
T A
ND
AC
CO
UN
TS
20
20 IN
FOR
MA
PLC
AN
NU
AL R
EP
OR
T AN
D A
CC
OU
NT
S 20
20
90 91
ST
RA
TE
GIC
RE
PO
RT

Financing and leverageNet debt was £2.0bn at 31 December 2020 (2019: £2.7bn), with the year-on-year improvement reflecting positive funds flow, supported by the equity addition in April/May. Unutilised committed financing facilities relating to the Group’s RCF were £1,050.0m (2019: £843.1m). Combined with £299.4 of cash, this resulted in available liquidity at 31 December 2020 of £1,349.4m.
On 24 February 2020, we made an early repayment to US private placement holders of the $200.5m debt maturing in December 2020.
On 6 October 2020, we issued a Euro Medium Term Note (EMTN) of €700m with a maturity of October 2025. Additionally, on 3 November 2020 we issued an EMTN of £150m with a maturity of July 2026.
On 6 November 2020, as part of the Group’s COVID-19 Financing Action Plan, we made an early repayment to the US private placement holders of $1,387.1m, with the associated fees being recognised in the Income Statement.
On 26 November 2020, the Group’s RCF was increased by £150m to £1,050m. On 14 December 2020, there were extensions to the RCF resulting in facilities of £30m (2019: £30m) maturing in February 2023, £420m (2019: £270m) maturing in February 2024, £60m (2019: £60m) maturing in February 2025 and £540m (2019: £540m) maturing in February 2026.
Following the proactive management of our financing structure, the average debt maturity on our drawn borrowings is currently 4.8 years (5.5 years as at 31 December 2019), with no significant maturities until July 2023.
Net debt and committed facilities2020
£m2019
£m
Cash and cash equivalents (299.4) (195.1)Private placement loan notes – 1,212.8Private placement fees – (2.7)Bond borrowings 2,111.1 1,279.1Bond borrowing fees (15.3) (11.0)Bank borrowings – revolving credit facility (RCF) – 56.9Bank borrowing fees (2.6) (2.2)Derivative assets associated with borrowings (44.6) (3.9)Derivative liabilities associated with borrowings 7.5 22.4
Net debt before leases 1,756.7 2,356.3Finance lease liabilities 280.8 316.6Finance lease receivables (7.9) (15.3)
Net debt 2,029.6 2,657.6
Borrowings (excluding derivatives, leases and fees) 2,111.1 2,548.8Unutilised committed facilities (undrawn portion of RCF) 1,050.0 843.1
Total committed facilities 3,161.1 3,391.9
Following the repayment of the US private placement loan notes in November 2020, there are no financial covenants on our debt facilities in issue at 31 December 2020. Based on previous calculations, our covenant leverage ratio at 31 December 2020 was 5.6 times (31 December 2019: 2.5 times), and the interest cover* ratio was 3.6 times (31 December 2019: 9.4 times). Both are calculated in accordance with our historical note purchase agreements which no longer applied at 31 December 2020.
See the glossary of terms on page 228 for the definition of leverage ratio and interest cover.
F I N A N C I A L R E V I E W c o n t i n u e d
The calculation of the leverage ratio is as follows:
2020 £m
2019£m
Net debt as reported 2,029.6 2,657.6Adjusted EBITDA 367.3 1,034.2
Leverage 5.5x 2.6xAdjustment to EBITDA for covenant calculation1 0.8x 0.2xAdjustment to net debt for covenant calculation1 (0.7x) (0.3x)
Leverage ratio per previous debt covenants 5.6x 2.5x
1. Refer to the glossary for details of the nature of previous debt covenant adjustments to EBITDA and net debt for leverage ratio
The calculation of interest cover is as follows:
2020 £m
2019£m
Adjusted EBITDA 367.3 1,034.2Adjusted net finance costs 97.4 111.7
Interest cover 3.8x 9.3xInterest cover covenant EBITDA adjustment to ratio1 (0.2x) 0.1x
Interest cover per previous debt covenant 3.6x 9.4x
1. Refer to the glossary for details of the nature of previous debt covenant adjustments to EBITDA for interest cover
Share placement As part of our COVID-19 Action Plan, on 15 April 2020 the Company announced a share issue of 250,318,000 new ordinary shares, representing approximately 19.99% of the Company’s existing issued share capital. 125,159,000 new ordinary shares were issued on 20 April 2020 and, as part of the same process, a further 125,159,000 on 5 May 2020. The share issue placing price was 400p per share, representing a discount of 4% to the closing share price of 416.8p on 15 April 2020. The gross proceeds raised through the placement were £1,001.3m, with net proceeds of £973.7m.
Corporate development Informa has a proven track record in creating value through identifying, executing and integrating complementary businesses effectively into the Group. In 2020, cash invested in acquisitions was £176.3m (2019: £311.1m), with £84.6m relating to acquisitions including £7.3m of cash paid for business assets (2019: £227.1m), £45.9m (2019: £46.8m) relating to acquisition and integration costs, £28.1m (2019: £32.2m) relating to the cash settlement on the exercise of an option relating to minority interests in certain Fashion shows in the US, £16.8m (2019: £nil) relating to the settlement of options relating to a 4.1% minority holder of certain parts of our ASEAN businesses and £0.9m (2019: £5.0) relating to other investments. Net proceeds from disposals amounted to £10.4m (2019: £179.3m).
AcquisitionsOn 9 January 2020, the Group acquired F1000 Research Limited for cash consideration of £14.9m. The business is an open research publishing company and forms part of the Taylor & Francis business.
On 2 October 2020, the Group acquired the business of TrialScope Inc. for cash consideration, net of cash acquired, of £54.1m. TrialScope is a pharmaceutical subscription software business and forms part of the Informa Intelligence Division.
PensionsThe Group continues to meet all commitments to its pension schemes, which include six defined benefit schemes. At 31 December 2020, the Group had a net pension liability of £71.4m (31 December 2019: £30.1m). Gross liabilities were £786.8m at 31 December 2020 (31 December 2019: £730.8m). The increase in liabilities is predominantly driven by the decrease to the discount rates used for calculating the present value of the pension liability.
The net deficit remains relatively small compared with the size of the Group’s balance sheet. All schemes are closed to future accrual.
Gareth Wright Group Finance Director 22 April 2021
INFO
RM
A P
LC A
NN
UA
L R
EP
OR
T A
ND
AC
CO
UN
TS
20
20 IN
FOR
MA
PLC
AN
NU
AL R
EP
OR
T AN
D A
CC
OU
NT
S 20
20
92 93
ST
RA
TE
GIC
RE
PO
RT

Firstly, on behalf of the Board, I would like to thank all Shareholders for their invaluable support throughout what has been
the most challenging period the Company has faced during my time as Chair.
Your Company has been quick to respond to the challenges of the COVID-19 pandemic, building a position of stability and security through 2020, with a clear focus on protecting and preserving the long-term value of Informa’s brands and businesses. This was only possible with the strong support of all the Company’s stakeholders and for this we are very grateful.
At the heart of the Group’s resilience, and something that is key to long-term success, is the strong and unique culture at Informa. This thrives on collaboration, working together to find solutions and acting and taking decisions quickly. Combined with appropriate governance and oversight, and a relentless ambition to do more, your Board is confident the Group is well placed to return and rebound on the other side of the pandemic.
In accordance with the principles and provisions of the 2018 UK Corporate Governance Code, the Board continues to monitor the Group’s culture and ensure a supportive tone is set from the top. Further details on this are provided in the Strategic and Directors’ Reports, including our Section 172 statement on page 45.
Stability and securityAs my introduction on page 4 outlines, a foundation of the Group’s stability and security in 2020 was the resilience and strength of our subscription-led businesses. Taylor & Francis and Informa Intelligence both performed well, underlining the strength of our brands and value of our specialist content and data.
Informa Markets, Informa Connect and Informa Tech all faced material disruption from the pandemic, reflecting widespread lockdown measures and travel restrictions across the world, which made running physical events impossible for much of the year. In response, we deployed a major Postponement Programme across our events portfolio.
In the absence of physical events, we continued to support customers through specialist media and marketing services products and more than 500 virtual events. As in many industries, digital adoption has accelerated through the pandemic. Virtual events and digital services offer the potential to augment, extend and enhance our established physical event brands and we are excited about these opportunities.
As the impact of the pandemic became clear, the Group moved quickly to manage costs and preserve cash, deploying a £600m cost management programme. In addition, we undertook a series of initiatives to strengthen the Group’s balance sheet, including extending credit facilities, redeeming US private placement notes and issuing debt and equity.
An engaged and effective Board The Board continues to play an important role in providing advice, challenge and scrutiny to management, and its overall governance, conduct and engagement therefore contributes to the delivery of Group strategy. In 2020, this was particularly important given the fast-moving situation and necessary actions required to ensure the long-term health of the Company.
As Chair, I am responsible for the overall effectiveness of the Board and aim to ensure there is a constructive relationship with management, allowing each Director to fully contribute.
Informa has a clear governance structure for decision making, with Board decisions made collectively, following input from each Director. Access to management and Company information is provided at every Board meeting and through updates and reports on important matters, and Directors are encouraged to spend time with colleagues and Shareholders outside of Board meetings
In 2020, the pandemic led to more frequent interaction and engagement with the Executive Directors and the Senior Management team. The extensive demands put on the Directors demonstrated their commitment to Company matters and capacity to meet their duties to the Board.
As part of our triennial cycle, in January 2021 the Board appointed an independent consultant to carry out an external evaluation of its effectiveness. Details of the initial findings of this Board evaluation can be found on page 105.
Chair succession and evolution of the Board In January 2020, the Group confirmed that a Chair succession process was underway, with the intention to have it completed by year end. Subsequently, I agreed to extend my tenure to allow the Board to focus on the response to COVID-19, and will now step down at the Annual General Meeting in June 2021.
This follows the appointment of John Rishton as Chair Elect, which is discussed in more detail on page 109. John’s significant non-executive and international executive experience, combined with his deep understanding and knowledge of Informa and its culture, make him an outstanding successor.
It has been my pleasure to serve the interests of Informa’s Shareholders, colleagues and other stakeholders. I leave confident in the knowledge that the Group has an exciting future, supported by a first-class leadership and Board.
This partly reflects the continual evolution of the Board to match the Company’s growth and international expansion. We have a strong belief in the value of diversity, from diversity of gender and background to diversity of knowledge and experience, to ensure as broad a range of perspectives as possible. As of the end of 2020, 30% of our Board Directors were women, over 20% were from outside of the UK and there is a wide range of relevant industry experience and expertise.
For example, Gill Whitehead, appointed to the Board in 2019, has brought significant experience in digital, data and analytics. This has proved particularly valuable as the Group has deepened its commitment to digital development, and Gill is acting as a Non-Executive adviser to several important virtual and digital event service initiatives. Gill, who has served on the Audit Committee over the last year, will also become Chair of the Audit Committee when John takes up the role of Board Chair.
C H A I R ’ S I N T R O D U C T I O N T O G O V E R N A N C E
Derek MappChair
It has been my pleasure to serve the interests of Informa’s Shareholders, colleagues and other stakeholders, and I leave confident in the knowledge that the Company has an exciting future, supported by a first-class leadership and Board.
The Chair’s 2020 Review
INFO
RM
A P
LC A
NN
UA
L R
EP
OR
T A
ND
AC
CO
UN
TS
20
20 IN
FOR
MA
PLC
AN
NU
AL R
EP
OR
T AN
D A
CC
OU
NT
S 20
20
94 95
GO
VE
RN
AN
CE
RE
PO
RT

Supporting colleaguesInforma is a people business, built on the work and contributions of 10,000 colleagues across the world. By colleagues and workforce, we mean anyone who works in the Group on a full or part time basis and we give consideration to temporary and contract-based colleagues as well as those who are permanently employed by Informa.
The Heart of Informa, on pages 28 to 44, provides more details of how colleagues and Informa’s other stakeholders contribute and engage with the Group. Helen Owers is the Non-Executive Director with designated responsibility for colleague engagement but all members of the Board take responsibility for, and indeed enjoy, connecting with colleagues, ensuring the Board is widely visible and enabling each of us to understand the interests of colleagues, whether Senior Managers or from any part of the Company.
In 2020, Board engagement with management increased significantly as the normal Board schedule was supplemented with weekly Board calls to support the response to the pandemic. In total, 18 Board meetings, calls and sub-committee meetings took place through the year.
We believe there is no better way to understand the views of colleagues than meeting directly and so, in previous years, Board meetings have been rotated around Informa’s offices. This enabled the Board to host town halls and have informal conversations with colleagues over lunch. For obvious reasons, this approach had to be put on hold in 2020 and a conscious decision was taken not to initiate an additional virtual Board programme. The Company prioritised maintaining the well-developed, multi-format Group and Divisional communications programmes described on pages 30 to 34.
There was much focus on the response to the pandemic, with management openly sharing the challenges and thinking behind decisions as well as discussing what action might need to be taken in the future. Another key topic was diversity and inclusion, as racial equality and justice in particular were rightly thrust into the spotlight. This generated many open
C H A I R ’ S I N T R O D U C T I O N T O G O V E R N A N C E c o n t i n u e d G O V E R N A N C E R E P O R T
conversations and debates and led to the launch of AllInforma Nations, an addition to our existing group of colleague-led networks, to specifically support ethnic minority colleagues and be a focus for celebrating different cultures.
The Board received regular updates from the Executive Directors on their own communication and engagement programmes in 2020. In 2021, with stability and security established, the Board’s engagement with colleagues will use a range of digital and virtual formats, along with reinstating in-person town halls and location visits when it is possible to do so.
We continue to spend time assessing and monitoring the Company’s culture to ensure it remains aligned with the Group’s values and purpose.
As mentioned earlier, this culture is very much based on open engagement and discussion, and providing colleagues with authority to take informed risk-based decisions as part of business planning and daily work, and is encapsulated in the Company’s four guiding principles.
The Heart of Informa section and the Board’s Section 172 statement describe the variety of ways we engage with and receive feedback from stakeholders. This provides the Board with a regular temperature check on how effective the Company’s culture is and if it remains true to the Company’s principles. This alignment was never more important than in 2020. The Company’s response to the pandemic – establishing business stability and security while supporting each other, customers and our communities – ably demonstrates a strength of culture and values.
Strong Shareholder relationships The Directors receive regular detailed reports and verbal updates on the Company’s Investor Relations programme at each Board meeting, as described on page 35.
In addition, the Board maintains direct relationships with major Shareholders through regular one-on-one meetings via formal events and programmes. This includes a Chair’s annual investor roadshow, which was launched four years ago and runs every January.
In 2020, this included Shareholder meetings representing around two thirds of the Group’s issued share capital. Fellow Non-Executive Directors, Stephen Davidson, Gareth Bullock and John Rishton, joined me for a number of these meetings, with no subject off the table for discussion.
In addition, in November, the Chair of the Remuneration Committee, Stephen Davidson, joined me to consult with Shareholders on the proposed new Remuneration Policy and the 2021-2023 Equity Revitalisation Plan. Feedback from meetings led to some material changes to the final proposals, which were subsequently approved by Shareholders in December.
The Equity Revitalisation Plan is a key component of Informa’s strategy to return to growth and drive value back into Informa’s equity following the pandemic, and more details are in the Directors’ Remuneration Report.
Looking forwardWhile the unprecedented circumstances of COVID-19 have impacted the Company’s short-term performance, the Board remains confident of the long-term attractions and potential of Informa. The Knowledge and Information Economy remains an attractive market for innovation and growth and our specialist brands, wealth of specialist talent and growing digital capabilities put us in a strong position to seize future opportunities.
Your Board will continue to closely monitor the Group to ensure it maintains stability and security through 2021 and beyond, while encouraging and supporting a broader recovery and rebound. It will also ensure the Group does not lose sight of its broader goals and responsibilities, including our ambition to become a more sustainable, positive impact business, through the FasterForward programme.
I would like to give a final thanks to my fellow Board members, the management team and all colleagues across the Group for their continued dedication to the Company, not just over the past year but during my entire tenure at the Group. It has been a pleasure and privilege to be a part of Informa and I look forward to following the Group’s future successes.
Compliance statementInforma’s Board is accountable to Shareholders for its standards of governance and is committed to the principles of corporate governance set out in the Financial Reporting Council (FRC) 2018 UK Corporate Governance Code (2018 Code), available on the FRC website.
The Board continues to apply the highest standards of corporate governance and is pleased to report that during 2020, except as set out below, Informa has complied with the provisions of the 2018 Code.
Provision 19 – Chair tenure The process to appoint a successor for the Chair was initiated in January 2020. The process was postponed in March 2020 in order to maintain continuity in leadership and allow management to focus on business stability, as the Group managed the immediate impacts of the COVID-19 pandemic. The Chair succession process was restarted in September and, in January 2021, John Rishton was appointed as Chair Elect, effective from the AGM in June 2021. Further details on the process followed are set out on page 109.
Provision 21 – external evaluation The triennial external Board review was due to take place during 2020. However, it was considered more appropriate for the evaluation to be postponed until the Chair succession process had been completed. The Board evaluation, led by No 4, therefore took place in early 2021 and further details on the process and initial findings are set out on page 105.
UK Corporate Governance CodeDetails of how Informa applied the main principles of the 2018 UK Corporate Governance Code be found as follows:
1. Board Leadership and Company Purpose
A Effective Board .............................................................................................................................................................................................. page 101
B Purpose, values and culture ................................................................................................................................................ page 101
C Governance framework ............................................................................................................................................................... page 100
D Stakeholder engagement .......................................................................................................................................................... page 103
E Workforce policies and practices ........................................................................................................... pages 30 to 34
2. Division of Responsibilities
F Role of the Chair ......................................................................................................................................................................................... page 100
G Independence ................................................................................................................................................................................................. page 104
H External commitments and conflicts of interest .......................................................................... page 104
I Board Resources ........................................................................................................................................................................................ page 104
3. Composition, Succession and Evaluation
J Appointments to the Board .................................................................................................................................................. page 105
K Board skills, experience and knowledge ..................................................................................................... page 108
L Annual Board evaluation ........................................................................................................................................................... page 105
4. Audit, Risk and Internal Control
M Financial reporting .................................................................................................................................................................................. page 112 External auditor & Internal audit .................................................................................................... pages 114 to 115
N Fair, Balanced and Understandable Review ........................................................................................... page 112
O Internal financial controls and Risk management ...................................................................... page 113
5. Remuneration
P Linking remuneration with purpose and strategy ......................................... pages 116 to 119
Q Remuneration Policy review .............................................................................................................. pages 116 and 117
R Performance outcomes in 2020 ....................................................................................................... pages 120 to 128
INFO
RM
A P
LC A
NN
UA
L R
EP
OR
T A
ND
AC
CO
UN
TS
20
20 IN
FOR
MA
PLC
AN
NU
AL R
EP
OR
T AN
D A
CC
OU
NT
S 20
20
96 97
GO
VE
RN
AN
CE
RE
PO
RT

Strength in Depth
B O A R D O F D I R E C T O R S
1. 2.
3. 4.
1. Derek Mapp N Chair
Appointed: March 2008
Skills and experience: Derek is an experienced Chair and entrepreneur who brings an abundance of commercial and governance experience within various sectors to the Group.
He joined Taylor & Francis Group in 1998 as a Non-Executive Director before becoming a Non-Executive Director at Informa in 2004 and Chair in 2008. Derek will retire from the Board at the conclusion of the 2021 AGM.
In 2017, Derek won the Quoted Companies Non-Executive Director of the Year award for his work as Chairman of Huntsworth plc, a position he held until March 2019. He founded and was Managing Director of several businesses including Tom Cobleigh PLC and Imagesound Plc.
He has a keen interest in sports and served as Chairman of the British Amateur Boxing Association.
Other current appointments: Derek is Chairman of Mitie Group plc and a private company.
2. Stephen A. Carter CBEGroup Chief Executive
Appointed: September 2013
Skills and experience: Stephen was appointed Group Chief Executive in 2013 after serving as a Non- Executive Director from 2010.
Stephen formerly held senior positions in Media and Technology businesses including President and Managing Director EMEA of Alcatel Lucent Inc. and Managing Director and COO of NTL (now Virgin Media). In the public sector, Stephen was the founding CEO of Ofcom before serving as Chief of Strategy to Prime Minister, The Right Hon. Gordon Brown, and as Minister for Telecommunications and Media.
In 2007 he was awarded a CBE for services to the Communications industry and was made a Life Peer in 2008.
Other current appointments: Stephen is a Non-Executive Board member of United Utilities PLC and Chairman of the Henley Music Festival.
3. Gareth WrightGroup Finance Director
Appointed: July 2014
Skills and experience: Gareth has extensive senior executive experience in finance roles. He has held various positions within Informa since joining in 2009, including Deputy Finance Director and Acting Group Finance Director, prior to his appointment as Group Finance Director in July 2014.
Gareth was previously the Head of Group Finance and Acting Group Finance Director at National Express Group PLC. He qualified as a chartered accountant with Coopers & Lybrand (now part of PwC), and worked in its audit function from 1994 to 2001.
Other current appointments: Gareth has no other appointments.
4. Gareth Bullock A R N Senior Independent Director
Appointed: January 2014
Skills and experience: Gareth brings over 40 years’ experience in the financial services industry. He retired from the Board of Standard Chartered PLC in 2010, where he was responsible for Africa, the Middle East, Europe and the Americas as well as chairing Risk and Special Assets Management. He has both wide functional and international experience, having been Head of Corporate Banking in Hong Kong, CEO Africa, Group Chief Information Officer and Head of Strategy. He has significant industrial and retail board experience in both the UK and China.
Gareth has held numerous board positions including Tesco PLC, Spirax-Sarco Engineering PLC, Fleming Family & Partners Ltd, the British Bankers’ Association and Global Market Group Ltd (in China).
Gareth holds an MA from St Catharine’s College, Cambridge University.
Other current appointments: Gareth is Chairman of The Development Bank of Wales PLC.
5. John Rishton A N
Non-Executive Director and Chair Elect
Appointed: September 2016
Skills and experience: John brings significant international experience to Informa. He was Chief Executive Officer of Rolls-Royce Group PLC from 2011 to 2015, having been a Non-Executive Director since 2007. Before joining Rolls-Royce, John was Chief Executive and President of the Dutch international retailer, Royal Ahold NV, and, prior to that, Chief Financial Officer. He also formerly held the position of CFO of British Airways PLC.
John will assume the role of Board Chair following the conclusion of the 2021 AGM.
John is a Fellow of the Chartered Institute of Management Accountants.
Other current appointments: John is Chair of Serco Group PLC and a Non-Executive Director at Unilever plc (retiring at the 2022 AGM) and Associated British Ports Holdings Ltd (stepping down on 30 April 2021).
6. Helen Owers R N Non-Executive Director
Appointed: January 2014
Skills and experience: Helen has extensive international senior executive experience within the Media sector, notably in business information from her role as President of Global Businesses and Chief Development Officer with Thomson Reuters.
Helen previously worked as a Media and Telecoms strategy consultant at Gemini Consulting and has expertise in professional publishing having worked at Prentice Hall.
Helen holds an MBA from IMD Business School and a BA from the University of Liverpool.
Other current appointments: Helen is Non-Executive Director of PZ Cussons PLC and Eden Project International Limited and an independent Governor of Falmouth University.
7. Mary McDowell R N
Non-Executive Director
Appointed: June 2018
Skills and experience: Mary joined the Board in June 2018 having previously been a Non-Executive Director of UBM plc. She has experience as a technology company CEO and has led both enterprise and consumer divisions of multi-national companies in the Technology industry. Mary was appointed as President and CEO of Mitel Networks Corporation in October 2019.
Mary was CEO of Polycom from 2016 until its acquisition by Plantronics in 2018. Prior to this, Mary was an Executive Partner at Siris Capital LLC, following nine years spent at Nokia, most recently as Executive Vice President in charge of Nokia’s Mobile Phones (feature phones) unit. Before joining Nokia, Mary served 17 years at HP-Compaq, including five years as SVP and General Manager in charge of the company’s industry- standard server business.
Other current appointments: Mary is a Non-Executive Director and Chair of the Compensation Committee at Autodesk, Inc.
8. Stephen Davidson R N
Non-Executive Director
Appointed: September 2015
Skills and experience: Stephen brings extensive media, telecommunications, corporate and financial market experience to the Informa Board having previously been CFO and Chief Executive of Telewest, Executive Chairman of Mecom Group PLC and Vice Chairman of Investment Banking at WestLB Panmure.
Stephen has held various positions in both industry and investment banking throughout his career. He has also held numerous Chairman and Non-Executive positions on the boards of Media, Telecoms and Technology companies.
Stephen holds an MA from the University of Aberdeen.
Other current appointments: Stephen is Chairman of Datatec Limited and Actual Experience PLC (retiring at the 2022 AGM) and a Non-Executive Director of MCB Group Ltd.
9. David Flaschen N A
Non-Executive Director
Appointed: September 2015
Skills and experience: David has over 20 years of executive and leadership experience in the Information Services industry, including roles at Thomson Financial and Dun & Bradstreet.
David has significant expertise in online companies, having held Non-Executive Directorships at TripAdvisor Inc. and BuyerZone.com amongst others. He is a frequent speaker on corporate governance having been cited as one of 10 Next Generation of Directors by Corporate Board Member Magazine.
A professional football player, David was a founding member of the Executive Committee of the North American Soccer League Players Association. He holds an MBA from Wharton School, University of Pennsylvania.
Other current appointments: David is Non-Executive Director and Audit Committee Chair at Paychex Inc.
10. Gill Whitehead N A
Non-Executive Director and Audit Committee Chair Elect
Appointed: August 2019
Skills and experience: Gill brings significant digital, data and analytics experience to the Group. She was Senior Director of Client Solutions & Analytics at Google UK for three years, where she led teams in data analysis, measurement, user experience, consumer segmentation and insights.
Previously Gill worked at Channel Four and BBC Worldwide in a range of strategy leadership and technology-driven roles. She began her career at the Bank of England and then at Deloitte Consulting. Gill was a Non-Executive Director at the Financial Ombudsman Service from 2015 to 2018.
Gill is a Fellow of the Institute of Chartered Accountants and holds a BSc from the University of Nottingham and is currently undertaking an MSc in Social Sciences of the Internet at the University of Oxford’s Internet Institute.
Other current appointments: Gill is a Non-Executive Director of Camelot, operator of the UK National Lottery.
5.
7. 8.
9. 10.
6.
Board appointments since 31 December 2020
Patrick Martell Group Chief Operating Officer
Appointed: 1 March 2021
Skills and experience: Patrick joined Informa as CEO of the Intelligence Division in 2014 and has also served as Chief Operating Officer since 2019. Prior to joining Informa, Patrick was CEO of St Ives plc.
Other current appointments: Patrick is a Non-Executive Director and Remuneration Committee Chair at RM plc.
Committee members
AuditJohn Rishton (Chair)Gareth BullockDavid FlaschenGill Whitehead
NominationDerek Mapp (Chair)Gareth BullockStephen DavidsonDavid FlaschenMary McDowellHelen OwersJohn RishtonGill Whitehead
RemunerationStephen Davidson (Chair)Gareth BullockMary McDowellHelen Owers
Key Board Committee Chair
N Nomination Committee
A Audit Committee
R Remuneration CommitteeINFO
RM
A P
LC A
NN
UA
L R
EP
OR
T A
ND
AC
CO
UN
TS
20
20 IN
FOR
MA
PLC
AN
NU
AL R
EP
OR
T AN
D A
CC
OU
NT
S 20
20
98 99
GO
VE
RN
AN
CE
RE
PO
RT

Responsible for the management, direction and performance of the Company. Provides leadership and delivers sustainable long-term success for Shareholders and other stakeholders. The Board sets the Company’s purpose, values and standards, making sure it leads by example and aligns strategic aims with the desired business culture. It also determines the risks faced by the business, gauges the level of risk it is prepared to take to achieve its strategy and ensures that systems of risk management and control are in place.
Details of matters reserved for the Board’s approval are set out on our website: www.informa.com
Board of Directors
Non-Executive Directors Executive Directors
Remuneration CommitteeNomination CommitteeAudit Committee
Chair
The Chair is responsible for leading the Board, setting the agenda and ensuring its effectiveness. This position is responsible for promoting a culture of openness and robust debate within the Board and setting the tone of the Group as a whole. The Chair ensures there is effective communication with Shareholders and other stakeholders and that the Board has a clear understanding of their views.
The Non-Executive Directors provide independent oversight and constructive challenge to the Executive Management Team, helping to develop proposals on strategy, scrutinising performance in meeting agreed goals and objectives. They play a primary role in succession planning, appointing and, where necessary, removing Executive Directors.The Senior Independent Director acts as a sounding board for the Chair and, where necessary, serves as an intermediary for the other Directors. This position is responsible for leading the Chair’s performance evaluation and is an additional point of contact for Shareholders and other stakeholders.
Group Chief Executive: Overall responsibility for day-to-day operational management of the Group. Responsible for proposing and implementing the Company’s strategy, driving performance and optimising Group resources. Leads engagement with various stakeholders: colleagues, Shareholders, partners and customers.
Group Finance Director: Responsibility for raising and servicing the Group’s financing, maintaining a financial control system capable of delivering robust financial reporting information. Leads the Finance, Tax, Treasury and Internal Audit functions and chairs the Risk Committee and Treasury Committee.
Responsible for the Executive Directors’ Remuneration Policy, sets the remuneration of the Chair, Executive Directors and Senior Management, and approves annual and long-term performance objectives and awards.
Committee Report on pages 116 to 131
Manages all operational aspects of the Group under the direction and leadership of the Chief Executive. Membership comprises both Executive Directors, CEOs of the Group’s five Operating Divisions and key central Group functions.
Responsible for recommending appointments to the Board, Committee membership, succession planning, diversity and inclusion. Ensures that the Board and Senior Management have the appropriate skills, knowledge and experience to operate effectively.
Committee Report on pages 106 to 109
Responsible for the oversight of financial and narrative reporting, providing assurance on the effectiveness of internal control, risk management systems, and the effectiveness and objectivity of external and internal auditors.
Committee Report on pages 110 to 115
Responsible for developing and implementing policies to identify and analyse the Group’s financial risks, set appropriate controls and limits and review compliance. The policies provide written principles on funding investments, credit risk, foreign exchange and interest rate risk.
See page 113
Executive Management Team
Treasury CommitteeRisk Committee
Corporate Governance Report
I N T R O D U C T I O N T O T H E G O V E R N A N C E R E P O R T
Informa PLC is the ultimate holding company of the Group and is controlled by its Board of Directors. This report has been prepared in accordance with the 2018 Code and the Company’s statement of compliance is on page 97.
The Company has an established governance structure that facilitates the effective management of the Group, focusing on the key areas affecting the sustainable, long-term success of the business.
Board1 Audit
Committee3
Remuneration
Committee
Nomination
Committee4Scheduled Additional2
Derek Mapp 7/7 6/6 n/a n/a 2/4
Stephen A. Carter 7/7 5/6 n/a n/a n/a
Gareth Wright 7/7 6/6 n/a n/a n/a
Gareth Bullock 7/7 6/6 4/4 8/8 4/4
Stephen Davidson 7/7 6/6 n/a 8/8 4/4
David Flaschen 7/7 6/6 4/4 n/a 4/4
Mary McDowell 7/7 6/6 n/a 8/8 4/4
Helen Owers 7/7 5/6 n/a 8/8 4/4
John Rishton 7/7 6/6 4/4 n/a 2/4
Gill Whitehead 7/7 5/6 4/4 n/a 4/4
1. In addition, several Board colleagues attended five sub-committee meetings to approve the Company’s full-year and half-year results, the placing and EMTN issuances
2. While Stephen A. Carter, Helen Owers and Gill Whitehead were unable to attend one Board meeting called at short notice to consider the EMTN issuance, they spoke with the Chair and Group Finance Director beforehand and gave their support
3. The Chair, Group Chief Executive and Group Finance Director attended each Audit Committee meeting by invitation and all Board members are invited to attend those meetings at which the full-year and half-year results are considered
4. Derek Mapp and John Rishton did not attend Nomination Committee meetings where the Chair succession process was considered
Board Leadership and Company Purpose
Informa’s purpose is to champion the specialist, by connecting people – typically businesses and professionals – with the expert knowledge that helps them learn more, know more and do more in their roles, work and companies.
The Board’s role is to lead the Company in establishing and achieving this purpose and, in doing so, to seek to promote the sustainable, long-term success of the Company for the benefit of Shareholders and wider society. The Board spends considerable time assessing Informa’s opportunities and the risks it faces, approving its strategic objectives and ensuring that the necessary financial and human resources are available for those objectives to be met.
As set out in the Chair’s introduction, Informa’s Board has a culture that reflects that of the Company. The Board receives regular reports from the Group IR and HR Directors on colleague-focused initiatives and engagement including diversity and inclusion, and the Audit Committee receives reports from the Head of Compliance on Speak Up whistleblowing reports. Within the Board, the Chair encourages full participation from each Director, open engagement and constructive debate and discussion, with collaborative decision making. The Chair arranges informal meetings and events to help build rapport and productive relationships between members of the Board and Senior Management.
Board and Committee meetings held in 2020Board colleagues are expected to attend all scheduled meetings of the Board and the Committees on which they serve. This year, due to the time-critical nature of assessing and responding to the impacts of the COVID-19 pandemic on the business, more frequent, and at times weekly, Board calls were arranged at short notice during the height of the pandemic. Every Director made a significant effort to join each call, despite increased obligations from other commitments at the same time. Where a Director was unable to attend, their opinions and comments on the matters being considered were sought in advance and shared.
Details of Board and Committee attendance during 2020 are set out in the table below:
INFO
RM
A P
LC A
NN
UA
L R
EP
OR
T A
ND
AC
CO
UN
TS
20
20 IN
FOR
MA
PLC
AN
NU
AL R
EP
OR
T AN
D A
CC
OU
NT
S 20
20
10 0 101
GO
VE
RN
AN
CE
RE
PO
RT

G O V E R N A N C E R E P O R T c o n t i n u e d
Key areas of Board focus in 2020At each scheduled Board meeting, reports are presented by the Group Chief Executive, the Group Finance Director and members of the Senior Management team, covering the operational and financial performance of the business, governance developments, investor relations, internal and external communications and corporate development. In addition, and where relevant, a verbal report is given by each of the Board Committees.
Specific areas of focus by the Board during 2020 included:
Topics Key items considered
Response to COVID-19 • Discussed and appraised all major developments in the Group’s response to the COVID-19 pandemic, with a particular focus on cash preservation and cash liquidity. The COVID-19 Action Plan is summarised on pages 10 and 11
• Promoted colleague wellbeing, including the creation of a dedicated support fund• Endorsed enhanced health and safety measures for colleagues and customers
Cash, debt and capital management
• Regularly reviewed the Group’s cash position and forward cash projections• Reviewed the Group’s debt, capital and funding arrangements and strategy• Approved a non-pre-emptive placing of new shares representing approximately 19.99% of the Company’s
existing issued share capital• Approved the issue of £790m equivalent Euro bonds• Approved the repayment of US private placement noteholders, removing financial covenants from the
Group’s debt structure
Strategy • Considered strategic opportunities for the Group • Received Divisional strategic updates
Financial performance • Reviewed and approved the Group’s full-year 2019 and half-year 2020 results together with the 2019 Annual Report
• Approved the reappointment of Deloitte LLP as auditor subject to Shareholder approval at the AGM• Reviewed pension arrangements within the Group• Approved the annual budget
Risk management and compliance
• Appraised the principal risks, mitigating actions and controls• Considered the Board’s risk appetite and tolerances• Approved renewal of insurance cover • Received update on the health, safety and security framework
Governance and compliance • Received regular updates on our compliance programme • Received and approved the 2019 Gender Pay Report and Modern Slavery Statement • Reviewed the breach management process• Undertook annual review of all conflicts of interest
Diversity and inclusion • Considered and discussed diversity and inclusion strategies and priorities within the Group and noted Divisional activity in this regard
• Received updates on colleague activities and colleague network launches
Stakeholder engagement • Received regular updates on the Group’s ongoing colleague engagement programme• Reviewed the results of the annual Inside Informa Pulse colleague survey• Received presentations from the Head of Sustainability and approved the Group’s five-year
FasterForward sustainability programme and its commitments
Board priorities for 2021The Board will continue to monitor the Group’s strength and stability whilst overseeing and supporting the acceleration of digital services and the data-enabled capabilities programme. As in previous years, risk management will continue to be a priority for the Board, including the emergence of new risks such as sustainability. Additionally, the Board will concentrate on ensuring a seamless transition between the departing and incoming Chairs, as well as enhancing the composition of the Board in relation to international diversity.
Relations with Shareholders and wider stakeholders As set out in the Heart of Informa section, Shareholders are among the Company’s most important stakeholders.
Informa has an active investor and Shareholder engagement programme designed to maintain positive and constructive relations with key financial audiences, including institutional investors, buyside and sellside analysts, debt holders and potential Shareholders in the UK and internationally. The Group also engages with the proxy agencies that advise certain Shareholders on governance and voting matters.
We aim to provide clear, timely and balanced corporate and financial information, both in person and digitally, creating ongoing dialogue and discussion between management and these audiences, and ensuring all applicable standards for public company disclosure are met.
Informa operates a Level I sponsored American Depository Receipts (ADR) programme through BNY Mellon to facilitate investment from US-based Shareholders, with ADR ownership accounting for 1.08% of Informa’s share capital at the end of December 2020.
For more information on how investor engagement is governed, and the way in which the Board receives the views of Shareholders on a regular basis directly and through reporting, see pages 35 to 37.
Shareholder meetingsShareholder meetings are usually a valuable forum for the Board to engage with investors, and retail investors in particular. In a normal year, all Directors would attend the AGM, and an update given on the Company’s performance. Unfortunately, due to government guidance and social distancing measures, Informa’s Shareholder meetings during 2020 were held as closed meetings with only the minimum number of Directors, and the Company Secretary, present to form a quorum.
As Shareholders were unable to attend in person and ask questions directly to the Board, they were instead encouraged to submit their questions to our Investor Relations team via email.
General Meeting – May 2020 On 4 May 2020, a General Meeting was held at 240 Blackfriars Road, London SE1 8BF to obtain Shareholder approval for the Directors to allot the Conditional Placing Shares, being 125,159,000 new ordinary shares.
The Conditional Placing was part of a larger placing, of approximately 19.99% of Informa’s existing issued share capital which was announced on 16 April 2020 and raised gross proceeds of £1bn. Further details of the placing can be found on page 47.
A poll was taken on the resolution put to the meeting and passed by the required majority.
AGM – June 2020 The 2020 AGM was held at Informa’s registered office at 5 Howick Place, London SW1P 1WG on Friday 12 June 2020. A poll was taken on each resolution and all were passed by the required majority.
The Board noted the voting outcome on the resolution to approve the Directors’ Remuneration Policy, which received 64.87% support from Shareholders. Investors’ main concerns related to the level of pension contributions for the Executive Directors and the lack of a post-employment shareholding requirement.
Both concerns were addressed in the Directors’ Remuneration Policy put to Shareholders at the General Meeting in December 2020.
General Meeting – December 2020On 23 December 2020, following an extensive consultation process with investors, a General Meeting was held to consider the adoption of a new Directors’ Remuneration Policy and Equity Revitalisation Plan (ERP).
Once again, voting on the resolutions was by way of a poll and they were passed by the requisite majority.
During the consultation process, the Board was pleased with the significant support shown for the overall rationale and principles for the revised Policy, with its focus on long-term equity ownership and equity value. Nevertheless, throughout the
consultation, some Shareholders indicated that they would not be able to support the Policy for a range of different technical, policy and principled reasons. This range of different preferences was reflected in the final voting outcome, with both resolutions receiving support of just under 60%.
While acknowledging the wide range of different views amongst some of its Shareholders, the Board believes that the new approach adopted through the ERP is the right approach for all stakeholders, and will continue to engage with all Shareholders to provide ongoing clarity and reassurance.
AGM – 2021The 2021 AGM will be held on 3 June 2021. The Notice of AGM will be dispatched as a separate document to all Shareholders and will also be available on the Informa website.
The Notice of AGM will set out the resolutions to be proposed at the AGM together with an explanation of each resolution. At least 20 business days’ notice of the AGM will be provided in order to allow Shareholders time to consider the resolutions being proposed. Details on how to appoint a proxy and the voting process will be set out in the Notice of AGM.
Facilities will be made available to allow Shareholders to participate and vote electronically at the 2021 AGM and to ask questions in real time should they wish to do so. Further information on how to join the meeting electronically can be found in the Notice of AGM.
Restrictions on public gatherings are expected to remain in place as at the date of the 2021 AGM. The health and safety of our Shareholders, colleagues and the wider community are important to the Board and we therefore strongly encourage Shareholders to participate in the 2021 AGM electronically and not to try to attend the meeting in person.
INFO
RM
A P
LC A
NN
UA
L R
EP
OR
T A
ND
AC
CO
UN
TS
20
20 IN
FOR
MA
PLC
AN
NU
AL R
EP
OR
T AN
D A
CC
OU
NT
S 20
20
102 103
GO
VE
RN
AN
CE
RE
PO
RT

C O M P O S I T I O N , S U C C E S S I O N A N D E V A L U A T I O N
Composition, Succession and Evaluation
Board composition During 2020, the Board comprised the Chair, two Executive Directors and seven independent Non-Executive Directors. Their biographies can be found on pages 98 and 99 and their responsibilities are summarised on page 100 and set out in full on the Company’s website.
Prior to recommending reappointments at the AGM, the Board considers whether each Non-Executive Director continues to be independent and to appropriately challenge management, as well as each other, in Board and Committee meetings. Following review, the Board has reaffirmed that each Non-Executive Director is able to offer an external perspective on the business, is able to constructively challenge and scrutinise activities, is independent in character and judgement, and has the required experience necessary to perform their role as an independent Director.
Board appointmentsThe Nomination Committee leads the formal, rigorous and transparent process in relation to Board appointments and its full report is on pages 106 to 109.
The Company appoints all Non-Executive Directors to the Board for an initial three-year term, subject to their election by Shareholders at the first AGM following their appointment and their subsequent re-election each year. The expectation is that two further three-year terms will follow, resulting in a total term of nine years from the first AGM.
Letters of appointment are provided to each Non-Executive Director and these are available for Shareholders to view at the Company’s registered office during normal business hours.
Induction and developmentAll Directors receive a formal induction to the Group on first joining the Board. It is designed to be both comprehensive and tailored, to provide new Directors with a good understanding of Informa’s business structure, Operating Divisions and markets. The induction is co-ordinated by the Company Secretary with oversight by the Chair and includes dedicated time with members of the EMT and, where possible, scheduled visits to Informa offices and events. The programme is tailored based on experience and background and the requirements of the new Director.
It is also important that all Directors regularly refresh and update their skills and knowledge and receive relevant training when necessary. During 2020, a series of knowledge and technical-focused presentations and discussions were provided to allow our Non-Executive Directors to deepen their knowledge of our business and the markets in which we operate. Subjects considered included a deep dive into the products delivered by the Financial Intelligence business, the positioning and prospects for the Pharma Intelligence business, as well as health and safety and sustainability including climate change-related matters. In addition, all Board members undertook our Code of Conduct training during the year.
Evaluation of the Board, its individual members and its CommitteesAs reported on page 97, our triennial external Board review took place in early 2021, having been postponed from 2020 due to the pandemic and Chair succession process. The review was carried out by No 4, an independent consultancy specialising in Board Effectiveness reviews, and which has no connection to the Company or any individual Director.
The review included a series of interviews with all Board colleagues, as well as the EMT and a number of key external advisers, including the lead external audit partner, the Group’s corporate broking and financial advisers, and our remuneration advisers. In addition, No 4 attended the February 2021 Board and Audit Committee meetings as an observer.
A full and thorough assessment was made, focusing on a wide range of topics, including the dynamics and inner workings of the Board and its Committees, the quality of information, discussions and access to management, the purpose and culture of the business, the quality and timeliness of stakeholder engagement, the relationships between Non-Executive Directors and Senior Management, and the composition and leadership of the Board. Initial findings were presented to the Board in April 2021 when actions to address areas for improvement were agreed.
The hard-line conclusion was that the Board of Informa PLC operates to high market standards, and is particularly well advanced on colleague engagement and colleague support, especially in light of the challenges presented by COVID-19. This is reflected in the strong relationship between the Board and Leadership Team, which strikes a good balance of challenge and support, and the culture of openness and transparency, which ensures all Board members contribute to discussions. The Chair is highly respected by all and is seen to manage meetings effectively. This makes the transition to the new Chair through 2021 particularly important and this process is well advanced, and progressing smoothly to plan.
Further details on outcomes and actions following the Board evaluation will be disclosed in the 2021 Annual Report.
D I V I S I O N O F R E S P O N S I B I L I T I E S
Division of Responsibilities
The roles of Chair and Group Chief Executive are exercised by separate individuals and have clearly defined responsibilities. The division of responsibilities between all Board members is reviewed annually by the Board and available on our website.
All Directors have access to the advice and service of our Company Secretary. The Company Secretary is also responsible for advising the Board, through the Chair, on all governance matters and supporting the Board in ensuring that the right policies, processes, information and resources are available to allow them to function effectively and efficiently.
CommitmentAs required by the 2018 Code, the Nomination Committee, on behalf of the Board, reviews the ability of all Non-Executive Directors to allocate sufficient time to the business in order to discharge their responsibilities effectively.
The Chair and Non-Executive Directors have letters of appointment which set out the average anticipated time commitment for their roles. The Directors are also expected to allocate sufficient additional time to meet the expectation of their roles, including spending time in the business and on the ongoing development of their knowledge of the business.
In 2020 particularly, the Chair and Non-Executive Directors showed sustained commitment to the Company in their willingness to attend Board, Committee and sub-committee meetings at short notice and the depth of ongoing support provided to the Executive Management Team (EMT) while the Company responded to the impacts of the COVID-19 pandemic.
The Remuneration Committee Chair, the Senior Independent Director and the Audit Committee Chair joined the Chair in his multi-day annual investor
roadshow in January. The Chair and Remuneration Committee Chair also consulted widely with our major Shareholders in November prior to the revised Remuneration Policy being proposed at the December 2020 General Meeting. Further details on this consultation are set out in the Directors’ Remuneration Report on pages 116 to 131.
All Directors are required to disclose any additional appointments or other significant commitments and these are detailed in the biographies on pages 98 and 99.
IndependenceInforma’s Board includes independent Non-Executive Directors who support and constructively challenge the EMT on their proposals and bring strong, independent judgement to the boardroom. The number of independent Directors, and their knowledge and experience, provides sufficient balance of views that carry significant weight in the Board’s decision-making process. The Board considers all of its Non-Executive Directors to be independent in character and judgement.
If Directors need to access independent advice about the performance of their duties, they are entitled to do so at the Company’s expense.
Directors’ conflicts of interestIn accordance with the Articles of Association the Company, the Board is able to authorise any matter that would otherwise result in a Director breaching their duty to avoid a conflict of interest.
The Board has procedures which require Directors to notify the Chair and Company Secretary of all new external interests and any actual or perceived conflicts of interest that may affect their role as a Director of the Company.
As part of this process, the Board:
• Considers each conflict situation separately according to the particular situation and in conjunction with the Company’s Articles
• Keeps records and Board minutes on authorisations granted by Directors and the scope of any approvals given
• Regularly reviews conflict authorisations
Each of the Directors has a non-material holding in the Company. Full details of the Directors’ shareholdings are set out in the Directors’ Remuneration Report on pages 116 to 131.
Information and supportThroughout the year, the Directors are regularly updated on the Group’s businesses and the environment in which it operates. These updates are provided by written briefings and meetings with Senior Management at every scheduled Board meeting.
The Board agenda is set by the Chair, in collaboration with the Group Chief Executive and Company Secretary. Each scheduled meeting includes a Management Report from the Group Chief Executive, a financial update from the Group Finance Director and executive reports from the Chief Operating Officer, Director of Investor Relations, Director of Strategy and Planning and on governance matters from the Group Company Secretary. The Chair of each Board Committee also provides an overview of the matters considered and decisions taken at their respective meetings.
Board and Committee members receive papers with the appropriate level of detail to enable a discussion of developments inside and outside the Group that may impact or have impacted the business. All papers are circulated in sufficient time prior to meetings using a secure Board portal.
INFO
RM
A P
LC A
NN
UA
L R
EP
OR
T A
ND
AC
CO
UN
TS
20
20 IN
FOR
MA
PLC
AN
NU
AL R
EP
OR
T AN
D A
CC
OU
NT
S 20
20
10 4 105
GO
VE
RN
AN
CE
RE
PO
RT

Male 70%
Female 30%
0–3 years 10%
3–6 years 40%
6–9 years 40%
Over 9 years 10%
44–49 20%
50–59 30%
60+ 50%
N O M I N A T I O N C O M M I T T E E R E P O R T
Nomination Committee Report
Dear ShareholderI am pleased to present the report of the Nomination Committee (the Committee) for the year ended 31 December 2020.
Committee membershipThe Committee membership is comprised of all of the independent Non-Executive Directors as follows:
Members
Derek Mapp (Chair)
Gareth Bullock
Stephen Davidson
David Flaschen
Mary McDowell
Helen Owers
John Rishton
Gill Whitehead
See page 101 for meeting attendance during the year
Stephen A. Carter attends Committee meetings by invitation.
Role of the CommitteeThe Committee’s responsibilities are set out in full in its terms of reference, available on the Informa website.
As a broad summary, the Committee is tasked to continuously assess and review how the Board is structured, considering whether any changes are required, and to monitor the engagement and retention of talent across the Group. In a business that is as focused on people and as reliant on the talent and skills of all colleagues as Informa is, this is a responsibility the Committee takes seriously. Indeed, the matters discussed at Committee meetings often become discussion points for all Directors at Board meetings.
The responsibilities of the Committee include:
• Reviewing the size, structure, composition and diversity of the Board, identifying and recommending suitable candidates for Board appointments, and their membership of the Board’s standing Committees
• Ensuring appropriate succession plans are in place for the Board and reviewing similar plans for Senior Executives
• Reviewing colleague engagement activities, monitoring diversity and inclusion initiatives across the Group and ensuring critical people reporting requirements such as in relation to the UK gender pay gap are met
• Reviewing and approving the Committee’s disclosures in the Annual Report and reviewing the Committee’s terms of reference on a regular basis
The verbal report on the outcome of Committee meetings is provided to the full Board and all Directors receive the minutes of Committee meetings for information.
Key activities during 2020Early in the year, the Board confirmed that it had commenced a Chair succession plan, with the initial expectation that a new Chair would be in place by the end of 2020. As the incumbent Chair, I was not involved in the appointment of my successor, with the process being led by our Senior Independent Director, Gareth Bullock, on behalf of the Committee. Spencer Stuart was appointed to assist with the search, as a reputable external adviser with no other connection to the Company or its Directors.
Following an extensive process, I am delighted that John Rishton has been selected to succeed me as Chair of the Company and agree wholeheartedly with the Senior Independent Director and the Committee’s conclusion that he is the ideal candidate. Further details on the process followed are set out on page 109.
Derek MappChairNomination Committee
In light of this appointment, John Rishton will step down as Chair of the Audit Committee at the AGM in June 2021, following the completion of the 2020 year end process, at which point Gill Whitehead will take on that responsibility. Further details on Gill’s experience and qualification for the role as Chair of the Audit Committee are set out on page 110.
Diversity and inclusionInforma seeks to recognise and encourage diversity in its broadest sense throughout the Group, including but not limited to gender, age, disability, ethnicity, education and social background. The Group also fosters a working environment based on respect, welcoming all talents and allowing all colleagues to participate on an equal basis, in line with Informa’s culture and strategy.
The Board has adopted a diversity policy which requires the Committee to regularly review the structure, size and composition of the Board, taking into account the balance of skills, experience, independence, international experience in key markets, diversity and knowledge of the Company and the industry in which we operate. While all Board appointments continue to be made on merit against objective selection criteria, diversity, including those of gender, age, ethnicity, nationality, social background, disability or any other distinction, will be a key area of focus for future appointments.
The Board continues to be guided by the targets set by the 30% Club, an international organisation working to increase the representation of women and diverse talent at all levels, and the Hampton-Alexander Review, and aspires for women to represent 33% of Board membership and to improving the gender balance of leadership teams and Senior Management. At 31 December 2020, three out of ten, or 30%, of the Board is female.
The Board also continues to support the findings of the Parker Review on the ethnic diversity of boards and notes the key findings of the 2020 Parker Review update. Enhancing board, senior management and colleague ethnic diversity is a matter of increasing focus for company boards in UK and in other
key markets. It also continues to be a significant matter of focus for the Board, particularly for any future changes to Board succession and composition.
2020 has been an extraordinary year due to the impact of the COVID-19 pandemic, and this has put considerable pressure on colleagues, both personally and professionally. The Committee has paid particular attention to how the Group has managed the disruption to work patterns and impact on colleague wellbeing, closely monitoring the wide range of actions taken to provide assistance, of which it has been fully supportive.
As described in the Heart of Informa on pages 30 to 34, Informa is a people business and our colleagues are our most important assets. Diversity, and maintaining a balanced mix of talent at all levels, brings competitive advantage to the Group and supports the business’ future growth and potential.
The Committee and the Board have continued to increase their focus on diversity and inclusion across the Company and within our communities. Informa wholeheartedly recognises the benefits of a diverse and inclusive culture. Hence, across the Group we strive to create a diverse mix of experience, styles of thoughts, gender, social and ethnic backgrounds, age, disability and education. This is equally important for the Board, as its effectiveness relies on the ability to draw on Directors with a range of relevant and valuable skills and experience.
Conversations on the Company’s inclusive culture, with additional focus on racial justice and equality, took place during full Board meetings rather than in Committee, allowing all Board colleagues and Senior Management to participate, share their knowledge and experience and agree next steps for the Group. The Board is supportive of the increased transparency of racial and ethnic diversity and of the activities and initiatives which have been enhanced or introduced.
Board balance
Board tenure
Board age
INFO
RM
A P
LC A
NN
UA
L R
EP
OR
T A
ND
AC
CO
UN
TS
20
20 IN
FOR
MA
PLC
AN
NU
AL R
EP
OR
T AN
D A
CC
OU
NT
S 20
20
106 107
GO
VE
RN
AN
CE
RE
PO
RT

Experience and skillsAs explained previously, the triennial external Board evaluation due to take place in 2020 was delayed, and instead took place during the first quarter of 2021. As part of that review, No 4 reviewed the balance of executive skills and experience on the Board.
Board balance by experience and skills
Media and publishing
Business-to-business operations
Digital and technology
Corporate governance
Risk management
Financial experience
Leadership experience in international business
Remuneration and talent
Business transformation and integration
Regulatory affairs
0 1 2 3 4 5 6 7 8 9 10
All Directors standing for re-election at the AGM continue to be independent and the overall balance of knowledge, skills, experience and diversity ensures that each makes a valuable contribution to the Board. The Directors’ commitment to Informa, and the value that their varied experience brings, was highlighted by their willingness to make time to attend the frequent additional ad hoc Board meetings, informal calls and other Board communication through 2020, which was considerably higher than in previous years due to the disruption caused by the COVID-19 pandemic.
Through this challenging period, access to, and oversight from, Board colleagues was particularly beneficial to Informa, providing valuable experience, reassurance and guidance. Beyond the additional time commitment and contributions to Board discussions, the Non-Executive Directors joined the Executive Directors and Senior Management in voluntarily sacrificing a portion of their fees, offering a 25% reduction through the full lockdown period of the second quarter, as well as taking their remaining fees during that period in the form of ordinary shares.
Succession planningThe Committee regularly reviews succession plans for the Board and Senior Management, with plans for the Executive Directors and members of the Senior Management team prepared on an immediate, medium- and long-term basis, reflecting their day-to-day responsibilities for business operations.
In early 2021, the Committee recommended that Patrick Martell, the Group Chief Operating Officer, be appointed as an Executive Director from 1 March 2020. Having successfully led the Intelligence Division since 2014, and previously led the integration of both Penton Information Services and UBM into Informa, the Committee believes that Patrick has the necessary skills to drive forward the Group’s strategy in relation to digital products and service acceleration.
Succession plans for the Non-Executive Directors reflect the nature of their roles and the 2018 Code requirement to regularly refresh the Board. Following Gareth Bullock’s decision not to stand for re-election at the 2021
Average over 2020 Average over 2019
Colleagues F 6,465M 4,480
F 59%M 41%
F 6,670M 4,568
F 59%M 41%
Senior Management and direct reports
F 60M 150
F 29%M 71%
F 65M 150
F 30%M 70%
Directors F 3M 7
F 30%M 70%
F 3M 7
F 30%M 70%
N O M I N A T I O N C O M M I T T E E R E P O R T c o n t i n u e d
AGM, a search is underway to appoint an additional Non-Executive Director to enhance the Board’s diversity and international experience in key markets.
Under the direction of the Group Chief Executive, the Committee also monitors the talent and performance management of Senior Executives across the Divisions.
UK colleagues and gender payOne of the reporting requirements that the Committee oversees relates to UK gender pay gap reporting. The Group recently published its latest Colleagues and Pay report, setting out any difference between the average pay of female and male colleagues in the UK as required under the relevant UK legislation.
As at April 2020, the Group’s UK gender pay gap stood at 21.3%, driven by a greater number of male than female colleagues in the upper quartile of pay, and with more balance evident in colleague numbers and pay within the other three quartiles. The comparative Group figure for 2019 is 22.3%. The median bonus pay gap was 39.0%. The comparative UK national average is 15.5%.
Details of the programmes and initiatives underway to ensure all colleagues can develop their careers in the Group on an equal basis are included in the Colleagues and Pay report on the Informa website.
Derek Mapp Chair
Nomination Committee 22 April 2021
Board and colleague balance by gender
Succession process for Chair of the BoardOn 7 January 2020, the Board confirmed that it had started a process to identify a successor to Derek Mapp as Chair of the Board. As the Company’s Senior Independent Director, I led the process on behalf of the Committee, with external advice being provided by Spencer Stuart. Spencer Stuart does not have any other connection with the Company or any individual Director.
In early March 2020, the Committee considered my initial report on Board succession planning, with neither Derek Mapp nor John Rishton participating in the discussions which followed. As part of this report, the Committee finalised the job description for the role of Board Chair and provided feedback on an initial long-list of candidates.
As the pandemic spread, and its impact on the business became clearer, the Board determined that its prime focus should be given to the COVID-19 Action Plan to deliver stability and strength to the Group and implement a range of measures to support colleagues around the world. The Committee concluded that continuity and stability would best be provided by asking Derek Mapp to continue as Chair of the Board, seeing the Group through to the other side of the pandemic.
In September, once the Group had established a position of stability and security, the Chair succession process resumed. It quickly became clear that one candidate in particular had the appropriate experience, skills and knowledge for the role, with the right attributes to be effective both during this extended period of disruption and to seize opportunities on the other side of the pandemic. As a result, the Committee recommended to the Board that John Rishton be appointed as the next Chair of the Board.
John has been a Non-Executive Director of Informa, and Chair of the Audit Committee, since September 2016. Since his appointment, John has been a highly regarded member of the Board, providing strong contributions to Board and Committee meetings, intellectual rigour and a mature, pragmatic and balanced style. He has developed a deep understanding of the Group’s business and strategy together with the challenges it currently faces, as well as a strong feel for Informa’s distinctive culture. He has developed strong relationships with the Executive and Non-Executive Directors alike, with whom his gravitas and style help to draw the very best from the Board.
In reaching the decision, the Committee acknowledged the wealth of experience John brought to the Board: as a former Chief Executive Officer of two large, complex, global listed businesses; as Chief Financial Officer of a global airline; and as a result of his directorships in a variety of UK listed and overseas businesses during his career. This combination of executive and non-executive experience, across several sectors and geographies, has resulted in an ability to be agile and successful in different environments and cultures and when facing significant strategic, operational and governance challenges.
John will assume the position of Board Chair at the conclusion of the Company’s AGM in June 2021 when Derek Mapp will retire.
On behalf of the Board and colleagues, the Committee would like to thank Derek for his diligence and unfailing support of the Company during his tenure as a Non-Executive Director and as Chair of the Board. His wise and experienced counsel, his effective management of the Board and his humour will be much missed, and we wish him and his family all the very best for the future.
Gareth Bullock Senior Independent Director 22 April 2021
INFO
RM
A P
LC A
NN
UA
L R
EP
OR
T A
ND
AC
CO
UN
TS
20
20 IN
FOR
MA
PLC
AN
NU
AL R
EP
OR
T AN
D A
CC
OU
NT
S 20
20
108 109
GO
VE
RN
AN
CE
RE
PO
RT

Audit Committee Report
Dear ShareholderI am pleased to present the report of the Audit Committee (the Committee) for the year ended 31 December 2020.
The report that follows details the role of the Committee, the significant matters considered during the year and how the Committee has carried out its responsibilities.
Committee membership, independence and experienceThe Committee membership is solely comprised of independent Non-Executive Directors namely:
Members
John Rishton (Committee Chair)*
Gareth Bullock
David Flaschen
Gill Whitehead (Committee Chair Elect)
* The Committee Chair is deemed to have recent and relevant financial experience as required by the 2018 Code
See page 101 for meeting attendance during the year
As announced in January 2021, I will step down as Committee Chair on my appointment as Board Chair following the conclusion of the Company’s 2021 AGM. At that time, Gill Whitehead will assume the role of Committee Chair. Gill is a Fellow of the Institute of Chartered Accountants in England and Wales and has significant financial and operational experience through her roles at the Bank of England, Deloitte Consulting, BBC, Channel 4 and Google. Gill is currently conducting research at Oxford’s Internet Institute into the uses of data and artificial intelligence in business. The Board has determined that Gill will meet the requirement for at least one member of the Committee to have recent and relevant financial experience.
In March 2021, Gareth Bullock advised that he would not stand for re-election
at the 2021 AGM and he will retire as a Director, and as a member of the Committee, at the conclusion of the AGM. Gareth has been a member of the Committee since his first appointment in January 2014 and I would like to thank him for his considered and thoughtful contributions to Committee discussions during his tenure. His insights will be missed and, on behalf of the Committee, I wish him well for the future.
The Board is currently reviewing the membership of the Committee and an appropriate announcement will be made in due course.
The Board has once again confirmed that it is satisfied that all members of the Committee are independent in judgement and have the broad commercial knowledge and competence in the business-to-business information services market and specialist industry markets in which Informa operates. The Committee members provide a mix of financial and business experience that allows for effective discussion, challenge where appropriate and oversight of critical financial matters, enabling each member to fulfil their responsibilities.
Meeting attendeesAll Board colleagues have access to Committee papers and an open invitation to attend Committee meetings. All colleagues are particularly encouraged to attend those meetings at which the full-year and half-year results are considered.
Members of Senior Management, including the Group Finance Director, Chief Operating Officer, Head of Internal Audit and Group General Counsel, are invited to attend each meeting together with representatives of the external auditor. During 2020, the Head of Group Finance, Head of Tax and former Chief Information Officer also attended one or more meetings to facilitate information-sharing and discussion.
John RishtonChairAudit Committee
A U D I T , R I S K A N D I N T E R N A L C O N T R O L
Committee meetings conclude with private meetings between the members and, either jointly or separately, the external audit partner and internal auditors. No member of management is present during these discussions.
I continue to hold regular meetings with the Board Chair, the Group Chief Executive and the Group Finance Director, as well as other members of Senior Management, to obtain a good understanding of issues affecting the Group and to identify matters which require meaningful discussion at Committee meetings.
I also meet the external audit partner and Head of Internal Audit privately to discuss any matter they wish to raise or concerns they may have.
Training and inductionCommittee members receive updates on legal and governance changes on an ongoing and timely basis. During 2020, the Committee received a presentation on the forthcoming regulatory initiatives including those arising from the Brydon Review, the Kingman Review and the FRC audit market reform principles.
Any new members of the Committee receive an induction on first appointment and all members are able to obtain training at the Company’s expense on any legal or accounting requirements required to carry out their roles.
The Committee’s terms of reference also set out that members of the Committee are able to obtain independent legal and professional advice at the Company’s expense. No such advice was obtained during 2020.
I would like to thank my fellow Committee and Board colleagues, Senior Management, the Finance team and other colleagues, as well as the internal and external auditors, for the hard work they have undertaken during this extraordinary year and during my tenure as Committee Chair. I wish Gill all the very best in her new role and know that she will receive the same support from colleagues as I have received.
John Rishton Chair
Audit Committee 22 April 2021
Role of the CommitteeThe principal responsibilities of the Committee are:
• Financial reporting: to monitor the integrity of the Company and the Group’s financial statements and any formal announcement relating to the financial performance, review significant financial reporting judgements, issues and estimates, and confirm whether, taken as a whole, the Annual Report and financial statements is fair, balanced and understandable
• Risk management and internal controls: on behalf of the Board, to review and monitor the effectiveness of the Group’s internal financial controls and risk management systems and procedures
• External audit: to assess the effectiveness of the external audit process, review and monitor the external auditor’s independence and objectivity, develop and implement a policy on the supply of non-audit services by the external auditor and make recommendations to the Board about the appointment, reappointment and removal of the external auditor and the remuneration and terms of engagement
Area of focus Matters considered
Financial reporting • The integrity and accuracy of the full-year and half-year financial results and the Annual Report and financial statements, including whether they were fair, balanced and understandable
• The appropriateness and disclosure of accounting policies and key judgements• Assessed whether the Group remained viable and that it remained appropriate to prepare financial
statements on a going concern basis (see pages 78 to 81 for further details)
Risk management and internal controls
• Considered the Group’s principal risks and the controls in place to mitigate those risks, the Group’s risk appetite and tolerance and the process to identify and manage emerging risks
• Reviewed the adequacy and appropriateness of the Group’s systems of internal controls and risk management together with their effectiveness
• Oversight of the work of the executive Risk Committee• Received reports on instances of fraud or attempted fraud and reviewed the development of processes
to identify, report and prevent fraud• Reviewed the business’ information security capabilities, particularly with regard to cyber security risks
External audit • Approved the plan for the audit of the Group’s 2020 financial statements and associated fees• Reviewed and approved non-audit services provided by the external auditor and related fees• Considered the effectiveness and independence of the external auditor
Internal audit • Approved the internal audit plan for 2020 and performance against the plan• Reviewed audit actions, ensuring resolution in a timely manner• Considered the effectiveness of the Internal Audit function
Governance • Considered the Group’s anti-bribery and corruption policies and procedures• Reviewed reports on whistleblowing by colleagues and other stakeholders• Received an update on the UK regulatory environment and forthcoming regulatory changes
Other key matters • Reviewed and approved a revised Group Treasury Policy• Considered and approved a Tax Governance Framework and reaffirmed the Group tax strategy• Undertook an annual review of Committee effectiveness
INFO
RM
A P
LC A
NN
UA
L R
EP
OR
T A
ND
AC
CO
UN
TS
20
20 IN
FOR
MA
PLC
AN
NU
AL R
EP
OR
T AN
D A
CC
OU
NT
S 20
20
110 111
GO
VE
RN
AN
CE
RE
PO
RT

A U D I T , R I S K A N D I N T E R N A L C O N T R O L c o n t i n u e d
• Internal audit: to monitor and review the effectiveness of the Internal Audit function and the annual internal audit plan
The Committee’s terms of reference are available on the Informa website.
The Board of Directors is responsible for preparing the Annual Report and financial statements for the Group, and the Directors’ Responsibilities Statement found on page 135 includes an explanation of how the Board has ensured that the Annual Report for the year ended 31 December 2020 is fair, balanced and understandable.
The Strategic Report on pages 4 to 93 provides details of the business model and how the Company generates value for stakeholders.
The Committee’s main areas of activity during 2020 are set out below:
Financial reportingThe Board of Directors of the Company has delegated authority to the Committee to review the content and tone of the preliminary results announcement, Annual Report and
Risk management and internal controlsThe Board has delegated responsibility for overseeing the effectiveness of the Group’s risk management and internal control systems to the Committee. The Committee has established and has oversight of an executive Risk Committee.
Informa’s internal control and financial risk management systems and procedures include:
• Business planning: each Division produces and agrees an annual business plan against which the performance of the business is regularly monitored
• Financial analysis: each Division’s operating profitability and capital expenditure are closely monitored. Management incentives are tied to annual and longer-term financial results. These results include explanations of variance between forecast and budgeted performance and are reviewed in detail by the EMT on a monthly basis. Key financial information is regularly reported to the Board
• Group Authority Framework: the framework provides clear guidelines on approval limits for capital and operating expenditure and other key business decisions for all Divisions
• Risk assessment: risk assessment is embedded into the operations of the Group and reports are provided to the EMT, Risk Committee, Audit Committee and the Board
• Compliance: compliance policies and procedures are based on the US Federal Sentencing Guidelines and address the wide variety of legislature and other requirements with which the Group has to comply. Regular reports are provided to the Board, EMT and Divisional management
The Board recognises that risks must be taken to achieve the Group’s business objectives and is responsible for ensuring that a sound system of internal controls is maintained and that regular reviews are undertaken to ensure their effectiveness. This includes consideration of financial, operational and compliance controls, risk management and the Group’s high level internal control arrangements.
financial statements and the half-year financial results. Drafts of the Annual Report are reviewed by the Committee Chair, and the Committee as a whole, prior to formal consideration and approval by the Board.
Fair, balanced and understandable reportingIn early 2021 the Committee reviewed the structure and content of the 2020 Annual Report and financial statements and considered the processes undertaken to prepare and verify the content.
As in previous years, the Committee considered the process for preparing the Annual Report, including the oversight of the steering committee, and the way in which the overall prospects and financial position of the Group are disclosed. In particular, the Committee considered:
• Whether the overall message of the narrative reporting was consistent with the primary financial statements, the industry as a whole and the wider economic environment, particularly as a result of the COVID-19 pandemic
The system of internal controls is designed to manage material risks, by addressing their cause and mitigating their potential impact, and can only provide reasonable, rather than absolute, assurance against material misstatement or loss, recognising that expected benefits should not exceed the cost of the control procedures.
The EMT, led by the Group Chief Executive, meets regularly to consider and review the Group’s overall operational and financial performance and material risks and mitigating actions, with each Division given operational autonomy within a robust internal control framework. Details of the activities of the Divisions are set out on pages 48 to 63.
As detailed in the Risk Management section on pages 66 to 70, the Board has adopted a risk management framework to identify, evaluate and manage the Group’s significant risks which is overseen by the Risk Committee.
Risk CommitteeThe executive Risk Committee is responsible for ensuring that Group risk is managed effectively, monitoring business risks and their impact on the Group and the minutes of all Risk Committee meetings are circulated to Audit Committee members. The findings of the Risk Committee are reported to the Committee at each meeting and consideration given to any significant matters raised.
Membership of the Risk Committee comprises the Group Finance Director (who has been appointed as Chair), the Chief Operating Officer, Group General Counsel, Head of Internal Audit, Head of Group Compliance, Chief Information Security Officer, Group HR Director, Chief Commercial Officer, Head of Group Health, Safety and Security, Group Risk Manager and a representative from each of the Operating Divisions.
The Risk Committee meets quarterly and its principal duties include:
• Overseeing the Group’s current risk exposures and recommending to the Committee, and the Board, which risks should be recognised as the Group’s principal and emerging risks
• Whether the Annual Report was consistent with information previously communicated to investors, analysts and other stakeholders
• The consistency of the Strategic Report and the financial statements
• The linkage between the Company’s performance, business model and its strategy
In addition, the Committee assessed whether suitable accounting policies had been adopted by the Group and reviewed accounting papers prepared by Senior Management on the main financial reporting judgements as well as the external auditor’s reports on the full-year and half-year results.
As a result, the Committee reported to the Board that it considered that the Annual Report, taken as a whole, was fair, balanced and understandable and that it provided the necessary information for Shareholders to adequately assess the Company’s position and performance, business model and strategy.
• Providing guidance to the Board and the Committee regarding the Group’s overall risk appetite, tolerance and strategy
• Ensuring that a regular robust assessment of the principal risks facing the Group is undertaken, including those risks that would threaten its business model, future performance, solvency or liquidity
• Reviewing the Group’s overall risk assessment processes, the parameters of the qualitative and quantitative metrics used to review the Group’s risks, and monitoring mitigating actions
• Reviewing the effectiveness of the Group’s internal control and risk management systems, including all material operational and compliance controls
• Reviewing the Group’s approach to, and management of, health and safety risks, including the Health and Safety Risk Appetite Statement
• Reviewing the adequacy and security of the Company’s whistleblowing arrangements for colleagues and contractors to raise concerns in confidence about possible wrongdoing in financial reporting or other matters
• Reviewing the Group’s instances of fraud and fraud reporting to the Committee
• Reviewing the Group’s insurance arrangements
During 2020, the Risk Committee reviewed the effectiveness of the Group’s response to the COVID-19 pandemic, including the challenges arising from the switch to home working, postponement and cancellation of events, digital transformation, colleague wellbeing and supply chain disruption. Further details on the Group’s response to the pandemic are set out on pages 10 and 11.
The Risk Committee reviewed the Divisional risk registers at least twice during 2020 as the COVID-19 pandemic affected the business of the event-led businesses in particular. In addition, Divisional risk reviews were undertaken with the Group Risk Manager to assess how risks were being managed and the mitigating actions being taken in relation to emerging risks.
Other significant matters considered during the year The key matters considered by the Committee during the year ended 31 December 2020 are set out below:
Impairment review At each half-year, the Company is required to carry out a review to assess whether there is any impairment to the value of goodwill and intangible assets shown on the balance sheet. The review considers both external and internal factors such as projected operating profits, future long-term growth rates, discount rates and, during 2020, the economic impact from the COVID-19 pandemic.
Management presented its assumptions around future operating profits, setting out the uncertainty relating to the depth of the economic impact from the pandemic, and the speed of any subsequent recovery, alongside the variability in the recovery across the geographies in which the Group operates. Further details on the assumptions used in the impairment analysis are set out in Note 16 to the Consolidated Financial Statements.
As a result of the impairment review undertaken at the half-year, a goodwill impairment charge of £592.9m was recorded in relation to the Group’s three event-led Divisions.
A further review was undertaken at year end which showed headroom in all Divisions, reflecting the improvement in forecast cash flows since 30 June 2020. Previously recognised impairments of goodwill cannot be reversed and so the charge remains in the results for the year ended 31 December 2020.
Information security In addition to the update provided by the Group Chief Operating Officer at each Board meeting, during the year, the Committee undertook a deep dive into the Group’s information security controls and cyber vigilance.
The review highlighted the progress made by management which, by enhancing security training, implementing a consistent response to incidents, addressing vulnerabilities in the Group’s systems including protection against viruses and malware and extending multifactor authentication on key systems, had resulted in a better understanding of information security within the business.
Principal risks – Pandemic During 2020, pandemic risk was separated into a stand-alone principal risk. The Risk Committee was responsible for assessing, managing and monitoring its risk profile and the actions Senior Management needed to take to mitigate its effect on the Group.
The Committee received an update on this principal risk at each meeting, providing support and guidance for management. Further details on principal risks are set out on pages 71 to 77.
Measurement of retirement benefit obligations
The Committee continues to monitor the Group’s retirement benefits obligations, particularly its six defined benefit schemes, the most significant of which is the UBM Pension Scheme.
Details of the Group’s defined benefit schemes, its pensions strategy, and the principal assumptions adopted following advice received from independent actuaries, are set out in Note 34 to the Consolidated Financial Statements.
INFO
RM
A P
LC A
NN
UA
L R
EP
OR
T A
ND
AC
CO
UN
TS
20
20 IN
FOR
MA
PLC
AN
NU
AL R
EP
OR
T AN
D A
CC
OU
NT
S 20
20
112 113
GO
VE
RN
AN
CE
RE
PO
RT

A U D I T , R I S K A N D I N T E R N A L C O N T R O L c o n t i n u e d
Divisional risks form part of the Group risk register from which the Group’s principal risks are identified and materiality calculated. Further information on the Group’s principal risks is available on pages 71 to 77.
External auditorDeloitte LLP (Deloitte) continues as the Group’s external auditor. Deloitte was first appointed in 2004 and reappointed in 2016 following an audit tender.
The Committee reviews the appointment of the external auditor annually and, in accordance with legislation and its own terms of reference, will undertake a competitive tender for external audit services every 10 years. In addition, companies listed on the London Stock Exchange are required to rotate auditors every 20 years. Therefore, in line with this requirement, Deloitte’s last eligible year to serve as the Group’s auditor will be the year ending 31 December 2023.
Anna Marks has acted as the audit engagement partner since August 2018. Anna is a senior audit partner with significant expertise in the areas of audit, due diligence and stock exchange and other regulatory reporting in the UK and US. She is also a member of the North and South Europe Board of Deloitte LLP.
The Committee takes its responsibility for the development, implementation and monitoring of the Group’s policy on external audit seriously. This policy assigns oversight responsibility for monitoring independence, objectivity and compliance with ethical and regulatory requirements to the Committee, and day- to-day responsibility to the Group Finance Director. It states that the external auditor is jointly responsible to the Board and the Committee, with the Committee as the primary contact. The policy also sets out which categories of non-audit services the external auditor will and will not be allowed to provide to the Group, subject to de minimis levels.
Non-audit servicesThe Committee believes that certain non-audit services should be able to be provided by the external auditor. This is because the external auditor’s existing knowledge of the business would result in the most efficient and effective way for these non-audit services to be carried out.
The Committee regularly reviews the Non-Audit Services Policy, and the resulting fees accrued, in order to safeguard the ongoing independence of the external auditor. In September 2020 the Committee reviewed and updated the policy to reflect changes to the FRC’s revised Ethical and Auditing Standards.
The policy defines the services that the external auditor is and is not permitted to provide. It also sets out the approvals required before the external auditor is authorised to undertake non-audit services:
• Pre-approval is required from the Chair of the Audit Committee for all non-prohibited proposed non-audit engagements where the fees would be greater than £25k, or if individual engagements in aggregate for any year would exceed £100k
• Pre-approval is required from the Chair of the Audit Committee for any proposed non-audit engagements which would take the ratio of current financial year non-audit fees compared to the average of audit fees for the previous three financial years over 70%
• The Group Finance Director provides each Committee meeting with a rolling analysis of non-audit services from the external auditor
Details of all fees charged by the external auditor during the year ended 31 December 2020 are set out in Note 7 to the Consolidated Financial Statements. During the year, the Group paid non-audit fees totalling £0.5m to Deloitte (2019: £0.3m), being 16% (2019: 9%) of the 2020 audit fee.
The non-audit fees consisted of £0.3m in relation to the half-year review and £0.2m for other services including assurance in respect of the EMTN programme annual update, the Q4 EMTN financing and other financing work and for specified procedures completed as part of the verification of Executive Directors’ Remuneration.
The non-audit fees incurred were disclosed and approved in accordance with Group policy.
External auditor effectivenessThe performance of the external auditor continues to be reviewed annually, in accordance with best practice, to assess the delivery of the external audit service and to identify areas for improvement. The review takes into account the quality of planning, delivery and execution of the audit (including the audit of subsidiary companies), the technical competence and strategic knowledge of the audit team and the effectiveness of reporting and communication between the audit team and management. Performance is assessed according to whether the audit exceeds, meets or is below expectations against a variety of factors.
The Committee specifically assessed the following items in performing the review:
• Level of auditing skills and technical accounting knowledge and the level of knowledge of the Group’s operations demonstrated by the audit team
• Integrity, independence and objectivity of the audit team
• Accessibility and interaction with the Committee, including briefings on significant and emerging issues
• Adequacy of audit scope, planning and use of relevant technology, including data analytics
• Quality of partner, lead manager and specialists (if required)
• Robustness and efficiency of the audit• Whether there was an appropriate
focus on the key risks facing the Group, including fraud
• Communications• Value of insights
The conclusion showed a continuing high degree of satisfaction in the effectiveness of the external audit, which is consistent with the performance in previous years. The Committee will discuss specific feedback with the external auditor and consider whether any action is required to be taken in response to the feedback.
In addition, the lead audit partner, Anna Marks, met with each member of the Committee to establish their expectations for the 2020 audit. Details on how the external auditor performed against these expectations was included in its year end briefing to the Committee.
Internal auditDuring 2020 the co-sourcing partnership between an in-house Internal Audit team and KPMG continued, with both teams reporting to a single Group Head of Internal Audit. Due to the COVID-19 pandemic, and subsequent cost savings implemented by the Group, a greater proportion of the work for 2020 was carried out by the in-house team. While KPMG continues to be available to provide additional expertise where required, is it unlikely that new specialist audit work will be commissioned during 2021.
At the beginning of each year the Committee approves the annual internal audit plan with an emphasis on the Group’s key risk areas and certain key financial controls. One of the effects of the pandemic was that the majority of audits undertaken during the year were done remotely, and it is highly likely that the majority of the 2021 internal audit work will continue to be performed remotely due to ongoing travel restrictions.
During 2020, an increasing number of requests were received from the business, both the Divisions and functions, to perform specific audits or reviews. These included financial control work, support for sustainability reporting, HR processes and ad hoc investigations. It is anticipated that these requests will continue in 2021.
The Head of Internal Audit attends each Audit Committee and Risk Committee meeting, tabling reports on:
• Any issues identified around the Group’s business processes and control activities during the course of their work
• The implementation of management action plans to address any identified control weaknesses
• Any management action plans where resolution is overdue
An Internal Audit effectiveness review is carried out each year to assess the delivery of the function and areas for improvement.
Committee effectivenessAt the end of 2020, the Committee Chair led an effectiveness review of the Committee’s performance with input from Committee colleagues, the Group Finance Director, Group Head of Internal Audit, KPMG and Deloitte. The review concluded that:
• Committee meetings were well organised with a disciplined approach
• Meeting papers contained the right balance of detail and summary, allowing engaged discussions with appropriate challenge
• Presentations from members of Senior Management provided insight into the business
• The diverse backgrounds of Committee colleagues brought an additional dimension to discussions, as did the attendance of other Board members
Areas for further attention remained including horizon scanning on new regulatory requirements and cyber matters and additional Divisional presentations. The use of virtual meetings during the year had been successful and consideration would be given to a mix of physical and hybrid meetings going forward.
The external evaluation undertaken by No 4 also reviewed the effectiveness of the Committee and the initial outcomes of that evaluation are set out on page 105.
INFO
RM
A P
LC A
NN
UA
L R
EP
OR
T A
ND
AC
CO
UN
TS
20
20 IN
FOR
MA
PLC
AN
NU
AL R
EP
OR
T AN
D A
CC
OU
NT
S 20
20
114 115
GO
VE
RN
AN
CE
RE
PO
RT

Statement from the Chair of the Remuneration Committee
Dear ShareholderOn behalf of the Remuneration Committee (the Committee), I am pleased to present the Directors’ Remuneration Report for 2020. As usual, this Report is split into two sections, my Annual Statement as Chair of the Committee, and the Annual Report on Remuneration.
Committee membershipThe Committee membership is comprised wholly of independent Non-Executive Directors as follows:
Members
Stephen Davidson (Committee Chair)
Helen Owers
Gareth Bullock
Mary McDowell
See page 101 for meeting attendance during the year
The Committee’s primary purpose is to incentivise Informa’s Directors and Senior Management by aligning their interests with the strategic priorities of the Group and the creation of long-term value for Informa’s Shareholders and other stakeholders.
The approach and structure of incentive plans is decided upon by considering a range of factors, including the international nature of the Group, the
underlying growth of the markets we serve, the Group’s strategic priorities and internal budgets, as well as market expectations, direct feedback from Shareholders and the wider macro and geo-political environment.
In 2020, the year was dominated by the extraordinary situation created by the COVID-19 pandemic. This put significant additional pressure on the business, our customers and colleagues, and led to severe disruption within Informa’s event-led businesses.
Against this backdrop, the Board determined that the primary objective in 2020 was to protect and support colleagues, whilst preserving the long-term value of the Group’s brands and customer relationships. This led to the development of a COVID-19 Action Plan, with an emphasis on managing costs and preserving cash, strengthening the balance sheet and increasing operating flexibility.
In implementing the Remuneration Policy for 2020, the Committee determined that the appropriate approach and performance measures should match the above key priorities, including a strong focus on cash management and cash preservation. The Group strategy resulted in deploying a Postponement Programme for the physical events portfolio through to late spring and early summer 2021. The Committee therefore also decided it would be prudent for the final determination of 2020 annual performance outcomes to be completed alongside an assessment of the trading environment in July 2021, when the extended 2020 Postponement Programme is scheduled to be completed.
2021-2023 Remuneration PolicyOne of the commitments of the outgoing Chair was to work with myself to establish an updated Remuneration Policy relevant to the current situation, reflecting the very different position the
Stephen DavidsonChair of the Remuneration Committee
D I R E C T O R S ’ R E M U N E R A T I O N R E P O R T
Group now finds itself in and the significant uncertainty ahead, at least in the near term.
Therefore, in the final quarter of 2020, once the Group had established stability and security, we consulted extensively with Shareholders on the 2021-2023 Equity Revitalisation Plan (ERP). This new Remuneration Policy was subsequently approved by Shareholders at a General Meeting on 23 December and implemented from 1 January 2021.
The ERP is an important component of the Group’s strategy to return to growth and drive value back into Informa’s equity in the aftermath of the COVID-19 pandemic. It offers a more straightforward approach to remuneration through the use of restricted shares, providing management with greater flexibility in restoring the Company to health over the next few years, without the potential limitations that historical multi-metric long-term incentive awards might present. The ERP will also act as a strong retention tool for the broader Senior Management team, to whom it will also apply.
The Chair and I consulted with around 30 institutional Shareholders on the ERP, representing nearly 70% of Informa’s equity. As ever, there were many different and sometimes conflicting views on the detail of the proposals, making it difficult to create a framework that met everyone’s institutional and individual preferences. However, there was strong support for the overall rationale of the ERP, a fully aligned three-year plan for all Senior Management, using restricted share awards rather than multi-metric long-term incentive awards through a period of expected volatility, and closely aligned to Shareholders, focused on driving growth into the business and value back into Informa’s equity.
The ERP also incorporates updates to market best practice in two key areas,
where thinking has evolved significantly over the period since the last policy review: Executive Directors’ pension entitlements and post-employment shareholding obligations.
On pensions, Informa’s Executive Directors have agreed with the Committee that existing contractual pension entitlements will be rewritten and reduced to reflect the relevant colleague community contribution level by the end of 2022.
On Executive Director shareholding requirements, our existing Policy already included a two-year post-vest holding requirement for Directors and this has been maintained within the ERP. In addition, the in-employment shareholding requirement has been increased to 400% of salary for the Group Chief Executive and 275% for the Group Finance Director, further raising the commitment to equity ownership and equity value within the new Policy.
Further, the ERP introduces an additional holding requirement when Executive Directors leave the Group, with the commitment to a two-year post-employment holding obligation of at least 150% of salary.
These changes, along with others, ensure the Policy incorporates the latest market practice, as well as complying with the six pillars set out in paragraph 40 of the 2018 Code.
Performance and incentive outcomesThe reach and depth of the COVID-19 pandemic led to severe disruption in the Group’s event-led businesses, putting greater dependence on the performance of Informa’s subscription-led businesses. The COVID-19 Action Plan was therefore focused on managing costs and preserving cash, strengthening the balance sheet and protecting and supporting colleagues whilst maintaining digital product development and delivering a material commercial event Postponement Programme running through to late spring and early summer 2021.
The operational cost initiatives were carefully planned to minimise any impact on colleagues, focusing in the main on removing discretionary costs, reducing our real estate footprint,
recovering direct event costs, minimising travel, renegotiating contracts, and the tight control of marketing and promotion expenditure. As it affected colleagues, the vast majority were achieved through a sabbatical programme, a voluntary severance programme, a number of flexi-time offers and delayed or highly controlled recruitment.
The savings also included a direct contribution from Executive Directors and the Senior Management team. Firstly, the Executives voluntarily waived the increase in base salary that had previously been approved prior to the onset of COVID-19. The Executives and leadership team then voluntarily sacrificed 33% and 25% of their salaries respectively for the full COVID-19 lockdown period of the second quarter, a contribution that was also matched by the Chair and all of the Non-Executive Directors of the Board. Subsequently, it was also agreed that a 33%/25% reduction would be applied to any annual performance incentives that may be earned by Executive Directors and the Senior Management team for 2020.
While a significant UK employer and a UK listed company, as a largely international business, the Group decided not to use government furlough or other support schemes in the UK, including not accessing funds within the Bank of England’s Covid Corporate Financing Facility. Instead, we focused on our own actions and initiatives, including those outlined above, as well as a significant refinancing programme and support from Shareholders, which included a temporary dividend postponement (duly reflected in the salary sacrifice and applied discount to any annual incentives).
This response and range of initiatives introduced to support colleagues and protect the business proved highly effective, and I have no doubt that the leadership team rightly worked harder and contributed more than ever in 2020 to keep your Company stable and secure. Without their swift and decisive action, the Group would undoubtedly be in a much more challenging position today. On behalf of the Committee, I would like to put on record our thanks for their relentless commitment.
Informa owns and operates a portfolio of businesses with five Operating Divisions. The Group’s remuneration approach is designed to incentivise colleagues on the objectives and performance of the individual operating units for which they work, balanced with a relevant portion of shared, Group compensation incentives. This approach uses a mixture of in-year variable compensation and long-term equity compensation.
In 2020, this remained the remuneration approach, ensuring colleagues within the two subscription-led businesses were appropriately motivated and incentivised. In the three event-led businesses, which were materially disrupted by the exceptional circumstances of COVID-19, a different approach to retention and incentivisation was designed and implemented.
For the Senior Management team and the Executive Directors, the approach to remuneration in 2020 also continued to reflect the breadth of the portfolio, with management held accountable for the performance of each of the businesses, as well as the overall effectiveness of the COVID-19 pandemic Action Plan. These measures were then assessed within the context of the significant overall impact of COVID-19 on the Group and the impact this has had on Shareholders and its wider stakeholder group.
Beyond the salary sacrifice outlined and further contributions detailed below, this led to the suspension of all previously agreed cost of living increases for the Executive Directors and Senior Management team, as well as the broader colleague community within the event-led businesses and Group functions significantly impacted by the COVID-19 pandemic.
2020 Short-Term Incentive Plan (STIP)In line with the 2020 remuneration approach outlined, annual incentives in our two subscription-led businesses, Taylor & Francis and Informa Intelligence, were set against appropriate 2020 targets for these businesses, ensuring as full a contribution as possible to support the rest of the Group. Despite some disruption from COVID-19, both these IN
FOR
MA
PLC
AN
NU
AL
RE
PO
RT
AN
D A
CC
OU
NT
S 2
02
0 INFO
RM
A P
LC A
NN
UA
L RE
PO
RT A
ND
AC
CO
UN
TS 2
02
0
116 117
GO
VE
RN
AN
CE
RE
PO
RT

D I R E C T O R S ’ R E M U N E R A T I O N R E P O R T c o n t i n u e d
businesses performed well, delivering resilient revenues and growth in underlying profits, and triggering appropriate incentive awards for those eligible.
In the Group’s three event-led businesses, a benefit of having a significant presence in Mainland China was that we recognised the potential impact of COVID-19 in late January. This enabled appropriate 2020 targets to be set for teams in these businesses early in the year, focusing on the immediate priorities such as managing costs, preserving cash, rescheduling our events portfolio, pivoting into virtual events, maintaining brand visibility and data currency and, finally, most critically, supporting colleagues and customers.
A consistent approach was applied to 2020 annual incentives for the Senior Management team and the 2020 STIP for the Executive Directors, with the focus put on the immediate priorities for the Group and the Board.
The Committee therefore set performance targets in four key areas:
1. Cost and Cash Management – 25%2. Corporate Financial Security and
Financing – 25%3. Colleague and Customer
Communication and Engagement – 25%
4. Colleague and Customer Leadership – 25%
These four measures will be assessed on a balanced scorecard basis by the Committee, using a combination of quantitative and qualitative analysis, based around the five key objectives for each category, with each being worth 5% of the total.
On Cost and Cash Management, the objectives include the effective implementation of a stepped cost programme that minimises colleague departures and meets indirect cost tolerance targets for the year. This also includes the implementation of cash control and cash retention measures, including a customer management programme to manage customer impacts.
On Corporate Financial Security and Financing, the objectives include the implementation of a flexible financing programme that builds stability and security into the Group’s balance sheet. This includes the addition of bank credit lines, the extension of debt maturities and the effective management of the Group’s credit rating, as well as the assessment and effective delivery of other appropriate forms of equity and debt financing that further secure the balance sheet.
On Colleague and Customer Communication and Engagement, objectives include the delivery of an effective, innovative and compelling international colleague communications programme using a range of engagement channels, including regular town halls, videos and blogs. This also includes the development of a mechanism to identify and support colleagues experiencing particular challenges due to the pandemic.
Finally, and importantly, on Colleague and Customer Leadership, objectives focus on effective leadership through the crisis, with an emphasis on protecting long-term value for colleagues, customers and other stakeholders. This includes the implementation of a major events Postponement Programme, the development of safety protocols for events to ensure customer safety and the effective management of colleague morale and protection of Group culture.
The Executive Directors and the Senior Management team have voluntarily proposed to apply the same 33% and 25% reductions that were applied to their salary for the full COVID-19 lockdown period of the second quarter, to any annual incentives that might be earned for 2020 under this balanced scorecard.
In the second half of 2020, the Company extended its events Postponement Programme to late spring or early summer 2021. The Committee therefore decided it would also be prudent for the final determination of 2020 annual performance outcomes to be completed alongside an assessment of trading in July 2021, when the extended Postponement Programme is scheduled to be completed.
Long-Term Incentive Plan (LTIP)2018-2020 LTIP awardThe three-year 2018-2020 LTIP award completed on 31 December 2020. For this award, there were two measures for both Executive Directors: total shareholder return (TSR) compared to the FTSE 51–150 peer group, excluding financial services and natural resources companies (50%); and the three-year annual growth rate in adjusted diluted earnings per share (EPS) (50%).
The 2018-2020 LTIP award performed strongly in 2018 and 2019 on both the TSR and the EPS growth measures.
However, the final outcome of the 50% TSR element is determined by the TSR measurement on the last day of the three-year period, and so is a cliff-edge outcome. The unique COVID-19 disruption to the physical events market in 2020 therefore had a significant impact on this overall TSR outcome. Having been tracking at 80% after two years, it resulted in a zero performance calculation after three years, reflecting the very different stock market reaction to those companies like Informa that operate in sectors directly impacted by COVID-19, compared with those operating in sectors that have been unaffected, or indeed that benefited. Despite the significant negative impact of these exogenous circumstances on the overall TSR outcome, the Committee determined that no change to the TSR calculation was appropriate.
In relation to the second 50% of the 2018-2020 award, based on EPS performance, the Committee had already recorded the actual EPS growth over the first two years of the performance period (2018 and 2019). In 2018 this was 6.7% and in 2019 it was 4.3%.
Aligning its thinking with the approach taken to the 2020 STIP, the Committee decided that for the final 2020 year of the 2018-2020 LTIP, it should use a different, more relevant performance measure that would focus the management team on the necessary priorities for the Group through the year. Given the critical focus on cash management and preservation, the Committee adopted the same cash measures within the 2020-2022 LTIP grant: operating cash flow
generation and operating cash flow conversion. Appropriate 2020 targets were set for each of these cash measures, including a range of £80m to £190m for the former and 35% to 55% for the latter. In aggregate, performance against these two cash measures represented one sixth of the total 2018-2020 LTIP outcome, with the 2018 and 2019 EPS performances representing a further two sixths, such that these measures in total represented three sixths or 50% of the total outcome of the 2018-2020 LTIP.
Combining the outcome of this 50% of the award with the 0% outcome on the 50% shareholder return measure (TSR) resulted in 36.6% of the overall 2018-2020 LTIP award vesting.
Colleague share plansThe Board continues to support and encourage broader equity ownership amongst all colleagues in the Group, as a highly effective way to connect and align everyone to the Company’s strategy, performance and progress.
Whilst the short-term reduction in Informa’s share price due to the COVID-19 pandemic has affected the current value of colleagues’ equity holdings, this mirrors the impact on Shareholders and has the potential to recover over time.
Encouragingly, there has continued to be a consistent commitment to the Group’s main share plan, ShareMatch, which was launched six years ago and provides colleagues with one free share for every share purchased, subject to a holding period. Participation has grown to over 27% of eligible colleagues in countries where ShareMatch is available. This compares with around 2% equity ownership pre-launch.
In addition, our US Employee Stock Purchase Plan, a share ownership programme tailored to local regulations, has continued to grow since its launch in January 2019, with 16% of eligible colleagues participating to date.
As part of the ERP, which reduces the focus on short-term rewards and puts greater emphasis on long-term equity commitment, the terms of ShareMatch have been further improved. From April 2021, colleagues who elect to participate in the plan will receive two Company-
funded shares for every colleague-funded share bought, up to the annual investment limit of £1,800. This will increase carried equity interest, encourage greater levels of participation and further improve Shareholder alignment.
Shareholder engagementThe Board believes regular engagement with Shareholders is important, ensuring there are established channels of communication and providing an opportunity to gauge views on the Company’s strategy, management and governance.
The Executive Directors and Investor Relations team were particularly active through 2020, reflecting the unprecedented circumstances brought about by COVID-19, undertaking more than 500 investor engagements through the year.
It was an equally busy year of engagement for the Non-Executive Directors. In January, I accompanied the Group Chair on his annual investor roadshow, meeting with 25 of our largest Shareholders to discuss a wide range of topics. We were joined by the Senior Independent Director and the Chair of the Audit Committee for several of these meetings.
As outlined, later in the year, as we formulated plans for the new Remuneration Policy, we consulted extensively with Shareholders to gauge views and input on our thinking. In total, we met with around 30 institutions, representing nearly 70% of our issued share capital. This input led to some material changes to the final proposals within the ERP, which was subsequently approved by Shareholders at a General Meeting in December.
Looking ahead: 2021-2023 Equity Revitalisation Plan 2020 was as challenging a year as many of us will ever face, both personally and professionally, and I have huge admiration for the commitment and resilience that all colleagues at Informa have demonstrated.
The impact of COVID-19 will continue to be felt in our markets and our businesses over the coming years and, like many industries, as activity returns
Remuneration Policy
The Remuneration Policy we are reporting against was approved by Shareholders in June 2018 and extended for a further year at the AGM in June 2020.
The 2021-2023 Remuneration Policy, approved at a General Meeting on 23 December 2020, has been implemented from 1 January 2021 and will be reported on in next year’s Annual Report.
Both Remuneration Policies can be found on the Company’s website at: www.informa.com/investors/corporate-governance/terms-of-reference
and recovers, some aspects will have evolved through the experience of 2020. For Informa, the importance of data, and the increased use of digital technology across all our businesses and products, have undoubtedly accelerated through the period.
We were already investing to strengthen our capabilities in these areas but will need to continue to adapt and evolve our offering to meet these changing customer needs. The 2021-2023 ERP speaks to this, with its simplified approach to remuneration aligned directly to value growth, which will be applied across the broader leadership team that will lead the Group through this critical period.
The ERP ensures closer alignment with Shareholders across the Group over the next three critical years, with a focus on driving growth into the business and value back into Informa’s equity.
As always, we would like to thank Shareholders and all our stakeholders for their continued support and welcome any comments and feedback.
Stephen Davidson Chair
Remuneration Committee 22 April 2021
INFO
RM
A P
LC A
NN
UA
L R
EP
OR
T A
ND
AC
CO
UN
TS
20
20 IN
FOR
MA
PLC
AN
NU
AL R
EP
OR
T AN
D A
CC
OU
NT
S 20
20
118 119
GO
VE
RN
AN
CE
RE
PO
RT

Annual Report on Remuneration
D I R E C T O R S ’ R E M U N E R A T I O N R E P O R T c o n t i n u e d
This section of the Report sets out details of the remuneration outcomes for 2020 across Informa and specifically for the Executive and Non-Executive Directors, with comparison to remuneration outcomes for 2019.
Directors’ remuneration in 2020 was operated in line with the Remuneration Policy approved by Shareholders at the 2018 AGM as detailed on our website: www.informa.com.
Any information contained in this section of the Report that is subject to audit has been highlighted.
Single total figure of remuneration for Executive Directors (audited)
(£) Salary1Benefits and
allowances
Payment in lieu of
pensionTotal fixed
pay
Short-term incentive
awards2
Long-term incentive
awards3
Total variable
pay
Total fixedand variable
pay
Stephen A. Carter 2020 772,407 51,536 210,465 1,034,408 – 442,300 442,300 1,476,7082019 841,860 68,505 210,465 1,120,830 1,068,405 923,107 1,991,512 3,112,342
Gareth Wright 2020 440,416 17,344 120,005 577,765 – 189,144 189,144 766,9092019 480,018 15,931 120,005 615,954 495,187 394,760 889,947 1,505,901
1. Both Stephen A. Carter and Gareth Wright made a voluntary salary sacrifice of 33% for the full COVID-19 lockdown period of April to June 2020 inclusive
2. The Committee has decided that it would be prudent for the final determination of any 2020 STIP outcome to be made alongside an assessment of trading in July 2021, when the extended Postponement Programme is scheduled to be completed. Under the Remuneration Policy in operation during 2020 and 2019, any STIP awards in excess of 100% of base salary are deferred into shares for a further three years in line with the Company’s Deferred Share Bonus Plan (DSBP)
3. The LTIP award granted in 2018 will vest and become exercisable at 36.64% following the announcement of the Company’s 2020 full-year results on 22 April 2021. The estimated value of the LTIP award (including accrued dividend shares) has been calculated using the average share price over the three-month period to 31 December 2020, being 499.39p. Pages 121 and 122 set out more information on the performance achieved, how vesting was determined and how the value shown above was calculated, including how much of the value is attributable to share price growth during the period from grant to vesting. The value of the 2017 LTIP awards included in the single total figure of remuneration for 2019 has been updated to reflect the actual share price on vesting (being 477.90p on 16 March 2020) rather than the average for the three months to 31 December 2019 which was used in the 2019 Annual Report. The share price at grant was 651.50p
Notes to the single total figure of remuneration table (audited)Fixed paySalaryIn line with our overall remuneration philosophy to put the emphasis on performance-related pay ahead of fixed pay, following a review in early 2020, it was proposed that Executive Directors’ base salaries would increase by 1%. As the range and impact of the COVID-19 pandemic became clear, the Executive Directors voluntarily agreed to waive this increase in 2020. Additionally, the Executive Directors made a voluntary salary sacrifice of 33% for the full COVID-19 lockdown period of April to June 2020 inclusive.
2020
Salary2019
Salary
Stephen A. Carter £841,860 £841,860
Gareth Wright £480,018 £480,018
Benefits and allowancesThe benefits received by the Executive Directors include one or more of: private healthcare, car allowance or driver costs in lieu, ShareMatch matching share awards, professional advice, life assurance, travel insurance and travel expenses incurred for accompanied attendance at certain corporate events.
PensionDuring 2020, the Company made a cash payment of 25% of basic salary to the Executive Directors in lieu of pension contributions. Neither Executive Director is a member of the defined benefit schemes provided by the Group or any of its subsidiaries, and accordingly they have not accrued entitlements under these schemes. As part of the 2021-2023 Remuneration Policy, pension contributions for any new Executive Directors will be aligned with the relevant colleague community on appointment, whilst the pension contributions of the incumbent Executive Directors will be aligned with the relevant colleague community by the end of 2022. Further details are summarised on page 129 and set out in full in the 2021-2023 Remuneration Policy on our website: www.informa.com.
Variable payShort-Term Incentive PlanThe maximum STIP opportunity for 2020 was 175% of salary for Stephen A. Carter and 150% of salary for Gareth Wright.
The unique circumstances of the pandemic and impact it had on the Group through 2020 led to a shift in priorities for Informa and its management teams, with a clear focus on supporting colleagues and customers, managing costs, preserving cash and protecting the long-term value of our brands and businesses. Therefore, the Committee concluded that the Executive Directors should be measured against a balanced scorecard of targets relevant to the delivery of an effective response to the pandemic. Performance targets were set in four key areas:
• Cost and Cash Management • Corporate Financial Security and Financing• Colleague and Customer Communication and Engagement• Colleague and Customer Leadership
These four areas would be independently assessed on a balanced scorecard basis by the Committee, based around five key objectives for each category, with each objective being worth 5% of the total, and each category therefore with a maximum payout equivalent to 25% of the respective STIP maximum.
In the second half of 2020, the Company extended its Postponement Programme to late spring or early summer 2021. The Committee therefore decided it was also prudent that the final determination of 2020 annual performance outcomes be completed alongside an assessment of trading in July 2021, on the other side of the extended Postponement Programme. As set out in the Remuneration Committee Chair’s Statement on pages 116 to 119, the Executive Directors have voluntarily proposed to apply the same 33% reduction that was applied to their salary for the full COVID-19 lockdown period in the second quarter, to any annual incentives that might be earned, following the Committee’s determination.
Details of the Committee’s assessment of the 2020 STIP will be provided in the 2021 Annual Report.
Long-Term Incentive Plan awardsThe LTIP awards granted on 22 March 2018 to Stephen A. Carter and Gareth Wright included two equally weighted performance conditions, being the Group’s equity performance, measured through the TSR vs. the FTSE 51–150 peer group (excluding financial services and natural resources companies), and the Group’s financial performance, measured through the three-year compound annual growth rate (CAGR) in adjusted EPS.
In relation to the 50% of the award focused on TSR, 20% of this element of the award would vest if Informa is ranked at median, increasing on a straight line basis to full vesting if Informa ranks at or above the 80th percentile, while a ranking below median would result in the lapsing of the TSR element of the LTIP. The TSR measurement is completed on the last day of the three-year period and so is a cliff-edge outcome. Therefore, the unique disruption to the physical events market from the pandemic had a significant impact on the final year of the performance period and, hence, the overall outcome. Having been tracking strongly after two years, the Company’s remuneration consultant has confirmed that Informa’s TSR over the period was ranked at the 24th percentile vs. the peer group, resulting in a zero performance outcome after three years. The Committee determined that, despite the significant negative impact of these circumstances on the overall outcome, no change to the TSR calculation was appropriate.
In relation to the 50% of the award focused on EPS performance, 3% EPS growth each year would result in 20% of this element of the award vesting, with full vesting at 8% or higher growth (and on a straight line basis between these points). In 2018, EPS growth was 6.7% and in 2019 it was 4.3%, leaving the LTIP tracking just above the mid-point of the range outlined above after two of the three years of the performance period. For the final year, 2020, as with the STIP, the Committee decided that given the Group’s priorities had necessarily switched to cost management and cash preservation, it would use different, more relevant performance measures and so it adopted the same cash measures within the 2020 LTIP grant of operating cash flow and free cash flow conversion. These cash targets were achieved in full and this outcome was then proportionately adjusted to represent one of the three years of the LTIP performance period.
INFO
RM
A P
LC A
NN
UA
L R
EP
OR
T A
ND
AC
CO
UN
TS
20
20 IN
FOR
MA
PLC
AN
NU
AL R
EP
OR
T AN
D A
CC
OU
NT
S 20
20
120 121
GO
VE
RN
AN
CE
RE
PO
RT

Combining the outcome of this 50% of the award with the 0% outcome on the 50% TSR measure resulted in 36.64% of the overall 2018 LTIP award vesting, as detailed in the table below. These awards will vest and become exercisable on or shortly after 22 April 2021, when the Company’s full-year results for the year ended 31 December 2020 are announced:
Performance targets
MeasureWeighting (% of maximum) Threshold Maximum
Actual outcome
Payout (% of maximum)
TSR against comparator group 50% Median 80th percentile
24thpercentile vs.
peer group
0%
EPS CAGR 33.3% 3% 8% 5.5% 19.94%
Cash returns 16.7%
2020 operating cash flow £80m £190m £230.8m 8.35%
2020 free cash flow conversion 35% 55% 86.2% 8.35%
Total LTIP 36.64%
The performance outcomes above have resulted in the following LTIP vesting levels:
Value of shares expected to vest (£000s)
Director
Face value of award on date of grant (£000)
Number of LTIP options
granted
Proportion expected to
vest
Face value of vested options
on date of grant
Impact of share price
appreciation/ (depreciation)
since grant1
Value of dividend
shares on vesting
Total value of vesting awards
Number of shares
exercisable2
Stephen A. Carter 1,651 228,848 36.64% £604,753 (£186,019) £23,566 £442,300 88,568
Gareth Wright 706 97,865 36.64% £258,615 (£79,549) £10,078 £189,144 37,875
1. Calculated by subtracting the face value at the time of grant of the proportion of the award that vested from the value of the award on the date of vesting. For the purposes of this table, and the single total figure table on page 120, the LTIP award has been valued using the average share price for the three months ended 31 December 2020, being £4.9939. The share price at grant was £7.2124
2. Including accrued dividends to 31 December 2020
Share scheme interests awarded during the year (audited)2020 LTIP
Type of award
Number of options
awarded
Value as a percentage of
base salary
Face value at date of
award (£000)2
Stephen A. Carter LTIP (option) 649,9171 300% £2,526
Gareth Wright LTIP (option) 277,9311 225% £1,080
1. The performance conditions attached to this award are (i) TSR vs. FTSE 51–150 (50%); (ii) absolute cash generation for each of 2020, 2021 and 2022 (25%); and (iii) cash conversion for each of 2020, 2021 and 2022 (25%). Both cash metrics are calculated using the Group’s defined operating cash flow or operating cash conversion metrics which will be disclosed at the conclusion of the performance period due to commercial sensitivities. The performance conditions will be measured over the three years to 31 December 2022 and 25% of the award will vest in the event that threshold performance is achieved. In addition, the awards are subject to a share price cap on vesting of £12 per share
2. The face value of the awards granted on 24 March 2020 were calculated using the closing price on the day prior to the grant date (being 388.60p)
All options granted in 2020 are subject to an additional two-year holding period following vesting. During the two-year holding period, Executive Directors are only allowed to dispose of shares to meet income tax, National Insurance or other regulatory obligations.
Executive Directors’ shareholdings and share interests (audited)Shareholding requirementsThe Committee believes that equity ownership by the Executive Directors, wider management team and the colleague base is an important and effective way to align their interests with those of the Company’s Shareholders. Under the terms of the Remuneration Policy in operation during 2020, Executive Directors are required to hold a percentage of their salary in shares, or in exercisable options over shares, equivalent to their largest outstanding LTIP award. Executive Directors are expected to meet the guideline within five years of appointment or of 25 May 2018 (being the date of the 2018 AGM), whichever is the later, and to maintain this holding throughout their term of office.
ShareholdingsThe beneficial interest of each Executive Director in the Company’s shares (including those held by connected persons) as at 31 December 2020 and their anticipated beneficial interests as at 22 April 2021 are set out below:
Beneficial
holding1
Vested but unexercised
optionsShareMatch2
DSBPawards3
Total interests
as at 31 December
20204
Shareholding as % of salary
as at 31 December
20205
Value of total
interests as at 31
December 2020
2018 LTIPaward6
Total interests as
at 22 April 2021
Shareholding as % of
salary as at 22 April 20215
Value of total
interests as at
22 April 20215
Stephen A. Carter 167,349 461,685 3,911 134,674 767,619 455% £3,833,413 88,568 856,187 508% £4,275,712Gareth Wright 43,595 463,714 5,549 51,271 564,129 587% £2,817,204 37,875 602,004 626% £3,006,348
1. Stephen A. Carter’s beneficial shareholding receives share dividends through the Dividend Reinvestment Plan
2. Shares held under ShareMatch are made up of shares purchased by the Executive Director, shares ‘matched’ by the Group and dividend shares
3. Includes DSBP awards granted in 2016, 2018, 2019 and 2020 and accrued dividends to 31 December 2020
4. Total interests are shares held legally or beneficially, including those held by connected persons, exercisable options held in the LTIP and shares held in ShareMatch, in accordance with the Company’s Executive Shareholding Guidelines
5. The average share price for the three months to 31 December 2020 (being 499.39p) has been used to calculate the shareholding as a percentage of salary
6. The 2018 LTIP will vest and become exercisable on or shortly after 22 April 2021. Full details are set out on pages 121 and 122
Both Stephen A. Carter and Gareth Wright exceed the share ownership guidelines for 2020.
Stephen A. Carter Gareth Wright300%
508%
Shareholding requirement %
Shareholding % as at 22 April 2021
D I R E C T O R S ’ R E M U N E R A T I O N R E P O R T c o n t i n u e d
225%
626%
INFO
RM
A P
LC A
NN
UA
L R
EP
OR
T A
ND
AC
CO
UN
TS
20
20 IN
FOR
MA
PLC
AN
NU
AL R
EP
OR
T AN
D A
CC
OU
NT
S 20
20
122 123
GO
VE
RN
AN
CE
RE
PO
RT
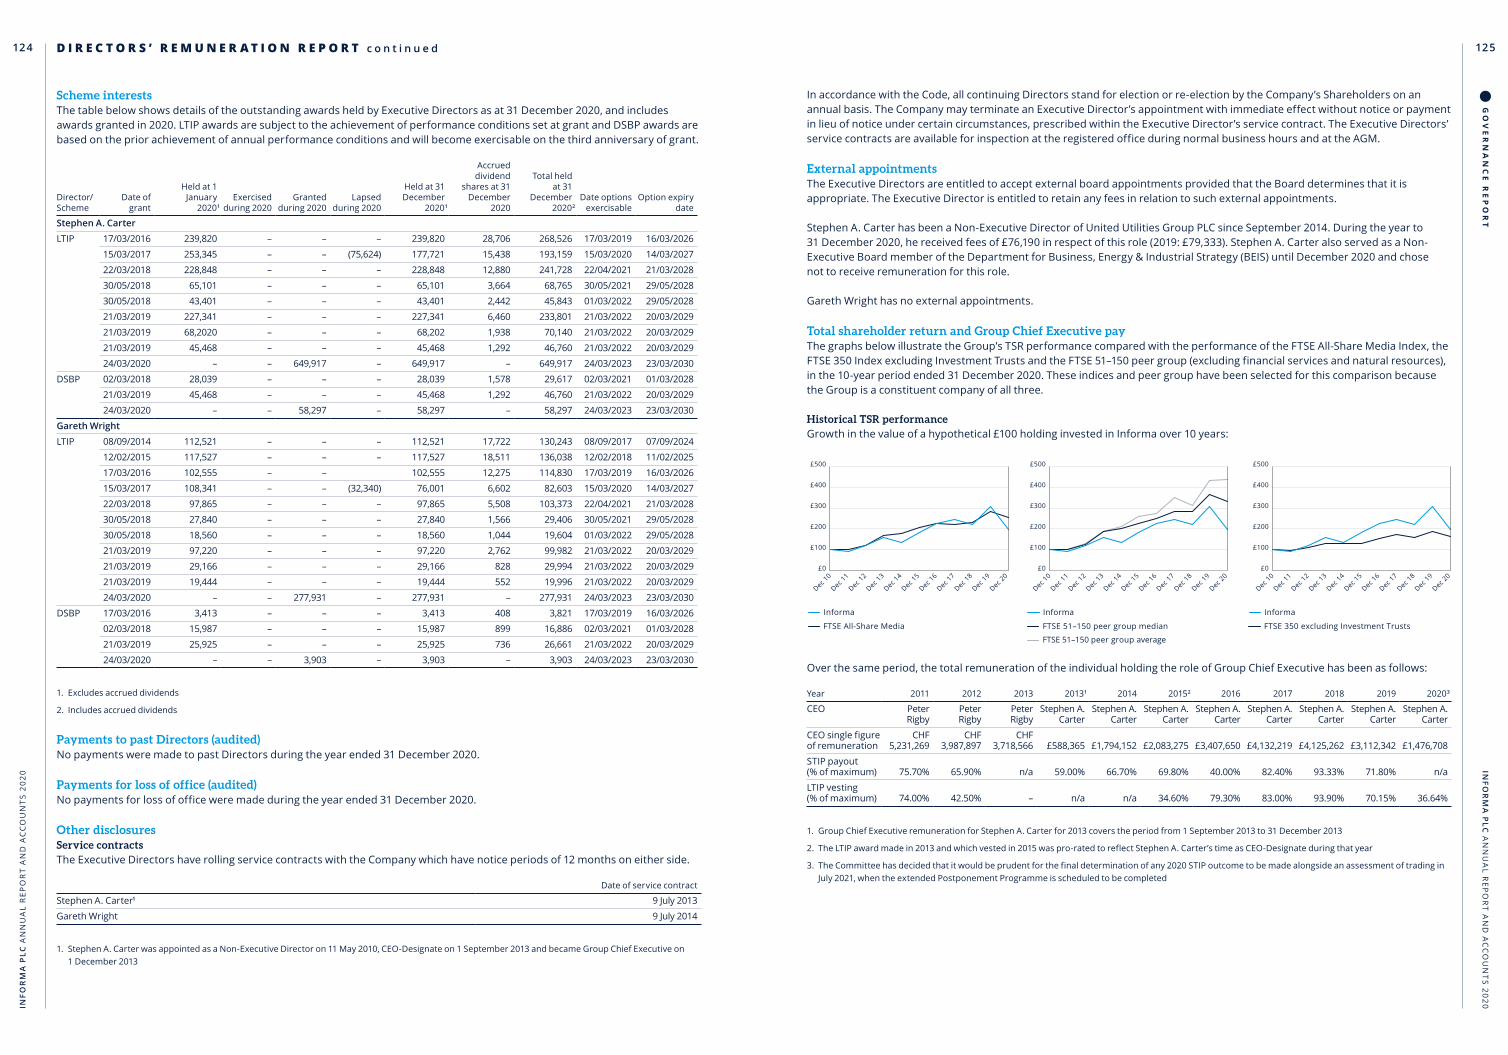
Scheme interestsThe table below shows details of the outstanding awards held by Executive Directors as at 31 December 2020, and includes awards granted in 2020. LTIP awards are subject to the achievement of performance conditions set at grant and DSBP awards are based on the prior achievement of annual performance conditions and will become exercisable on the third anniversary of grant.
Director/Scheme
Date of grant
Held at 1 January
20201Exercised
during 2020Granted
during 2020Lapsed
during 2020
Held at 31 December
20201
Accrued dividend
shares at 31 December
2020
Total held at 31
December20202
Date options exercisable
Option expiry date
Stephen A. Carter
LTIP 17/03/2016 239,820 – – – 239,820 28,706 268,526 17/03/2019 16/03/2026
15/03/2017 253,345 – – (75,624) 177,721 15,438 193,159 15/03/2020 14/03/2027
22/03/2018 228,848 – – – 228,848 12,880 241,728 22/04/2021 21/03/2028
30/05/2018 65,101 – – – 65,101 3,664 68,765 30/05/2021 29/05/2028
30/05/2018 43,401 – – – 43,401 2,442 45,843 01/03/2022 29/05/2028
21/03/2019 227,341 – – – 227,341 6,460 233,801 21/03/2022 20/03/2029
21/03/2019 68,2020 – – – 68,202 1,938 70,140 21/03/2022 20/03/2029
21/03/2019 45,468 – – – 45,468 1,292 46,760 21/03/2022 20/03/2029
24/03/2020 – – 649,917 – 649,917 – 649,917 24/03/2023 23/03/2030
DSBP 02/03/2018 28,039 – – – 28,039 1,578 29,617 02/03/2021 01/03/2028
21/03/2019 45,468 – – – 45,468 1,292 46,760 21/03/2022 20/03/2029
24/03/2020 – – 58,297 – 58,297 – 58,297 24/03/2023 23/03/2030
Gareth Wright
LTIP 08/09/2014 112,521 – – – 112,521 17,722 130,243 08/09/2017 07/09/2024
12/02/2015 117,527 – – – 117,527 18,511 136,038 12/02/2018 11/02/2025
17/03/2016 102,555 – – 102,555 12,275 114,830 17/03/2019 16/03/2026
15/03/2017 108,341 – – (32,340) 76,001 6,602 82,603 15/03/2020 14/03/2027
22/03/2018 97,865 – – – 97,865 5,508 103,373 22/04/2021 21/03/2028
30/05/2018 27,840 – – – 27,840 1,566 29,406 30/05/2021 29/05/2028
30/05/2018 18,560 – – – 18,560 1,044 19,604 01/03/2022 29/05/2028
21/03/2019 97,220 – – – 97,220 2,762 99,982 21/03/2022 20/03/2029
21/03/2019 29,166 – – – 29,166 828 29,994 21/03/2022 20/03/2029
21/03/2019 19,444 – – – 19,444 552 19,996 21/03/2022 20/03/2029
24/03/2020 – – 277,931 – 277,931 – 277,931 24/03/2023 23/03/2030
DSBP 17/03/2016 3,413 – – – 3,413 408 3,821 17/03/2019 16/03/2026
02/03/2018 15,987 – – – 15,987 899 16,886 02/03/2021 01/03/2028
21/03/2019 25,925 – – – 25,925 736 26,661 21/03/2022 20/03/2029
24/03/2020 – – 3,903 – 3,903 – 3,903 24/03/2023 23/03/2030
1. Excludes accrued dividends
2. Includes accrued dividends
Payments to past Directors (audited)No payments were made to past Directors during the year ended 31 December 2020.
Payments for loss of office (audited)No payments for loss of office were made during the year ended 31 December 2020.
Other disclosuresService contractsThe Executive Directors have rolling service contracts with the Company which have notice periods of 12 months on either side.
Date of service contract
Stephen A. Carter1 9 July 2013
Gareth Wright 9 July 2014
1. Stephen A. Carter was appointed as a Non-Executive Director on 11 May 2010, CEO-Designate on 1 September 2013 and became Group Chief Executive on 1 December 2013
In accordance with the Code, all continuing Directors stand for election or re-election by the Company’s Shareholders on an annual basis. The Company may terminate an Executive Director’s appointment with immediate effect without notice or payment in lieu of notice under certain circumstances, prescribed within the Executive Director’s service contract. The Executive Directors’ service contracts are available for inspection at the registered office during normal business hours and at the AGM.
External appointmentsThe Executive Directors are entitled to accept external board appointments provided that the Board determines that it is appropriate. The Executive Director is entitled to retain any fees in relation to such external appointments.
Stephen A. Carter has been a Non-Executive Director of United Utilities Group PLC since September 2014. During the year to 31 December 2020, he received fees of £76,190 in respect of this role (2019: £79,333). Stephen A. Carter also served as a Non-Executive Board member of the Department for Business, Energy & Industrial Strategy (BEIS) until December 2020 and chose not to receive remuneration for this role.
Gareth Wright has no external appointments.
Total shareholder return and Group Chief Executive payThe graphs below illustrate the Group’s TSR performance compared with the performance of the FTSE All-Share Media Index, the FTSE 350 Index excluding Investment Trusts and the FTSE 51–150 peer group (excluding financial services and natural resources), in the 10-year period ended 31 December 2020. These indices and peer group have been selected for this comparison because the Group is a constituent company of all three.
Historical TSR performanceGrowth in the value of a hypothetical £100 holding invested in Informa over 10 years:
Dec 10
Dec 11
Dec 12
Dec 13
Dec 14
Dec 15
Dec 16
Dec 17
Dec 18
Dec 20
Dec 19
£500
£300
£400
£100
£200
£0
Dec 10
Dec 11
Dec 12
Dec 13
Dec 14
Dec 15
Dec 16
Dec 17
Dec 18
Dec 20
Dec 19
£500
£300
£400
£100
£200
£0
Dec 10
Dec 11
Dec 12
Dec 13
Dec 14
Dec 15
Dec 16
Dec 17
Dec 18
Dec 20
Dec 19
£500
£300
£400
£100
£200
£0
Informa
FTSE 350 excluding Investment Trusts
Informa
FTSE 51–150 peer group median
FTSE 51–150 peer group average
Informa
FTSE All-Share Media
Over the same period, the total remuneration of the individual holding the role of Group Chief Executive has been as follows:
Year 2011 2012 2013 20131 2014 20152 2016 2017 2018 2019 20203
CEO Peter Rigby
Peter Rigby
Peter Rigby
Stephen A. Carter
Stephen A. Carter
Stephen A. Carter
Stephen A. Carter
Stephen A. Carter
Stephen A. Carter
Stephen A. Carter
Stephen A. Carter
CEO single figure of remuneration
CHF5,231,269
CHF3,987,897
CHF3,718,566 £588,365 £1,794,152 £2,083,275 £3,407,650 £4,132,219 £4,125,262 £3,112,342 £1,476,708
STIP payout (% of maximum) 75.70% 65.90% n/a 59.00% 66.70% 69.80% 40.00% 82.40% 93.33% 71.80% n/a
LTIP vesting (% of maximum) 74.00% 42.50% – n/a n/a 34.60% 79.30% 83.00% 93.90% 70.15% 36.64%
1. Group Chief Executive remuneration for Stephen A. Carter for 2013 covers the period from 1 September 2013 to 31 December 2013
2. The LTIP award made in 2013 and which vested in 2015 was pro-rated to reflect Stephen A. Carter’s time as CEO-Designate during that year
3. The Committee has decided that it would be prudent for the final determination of any 2020 STIP outcome to be made alongside an assessment of trading in July 2021, when the extended Postponement Programme is scheduled to be completed
D I R E C T O R S ’ R E M U N E R A T I O N R E P O R T c o n t i n u e d
INFO
RM
A P
LC A
NN
UA
L R
EP
OR
T A
ND
AC
CO
UN
TS
20
20 IN
FOR
MA
PLC
AN
NU
AL R
EP
OR
T AN
D A
CC
OU
NT
S 20
20
124 125
GO
VE
RN
AN
CE
RE
PO
RT

Relative importance of spend on payInforma is a people business, dependent on the contributions and expertise of its colleagues around the world. The Group believes in the importance of investing in colleagues and offering market competitive salaries, as well as flexible benefits and further opportunities such as ShareMatch. The table below shows the aggregate colleague remuneration, dividends paid, revenue and operating profit as stated in the financial statements, for the years ended 31 December 2020 and 31 December 2019:
2020 2019Percentage
change
Total number of colleagues1 10,945 11,174 (2.05%)
Aggregate colleague remuneration (£m)1 £553.8m £605.6m (8.55%)
Remuneration per colleague (£) £50,598 £54,197 (6.64%)
Dividends paid in the year (£m)2 £nil £280.3m (100%)
1. Figures taken from Note 9 to the Consolidated Financial Statements
2. Figures taken from Note 14 to the Consolidated Financial Statements
CEO pay ratiosThe table below sets out the ratios of the Group Chief Executive to the equivalent pay for the lower quartile, median and upper quartile UK employees (calculated on a full time basis). While the Group Chief Executive is based in the UK, his role and remit are international and the pay ratios required by the Companies (Miscellaneous Reporting) Requirements 2018 take no account of those colleagues based outside the UK (68% of total colleagues). The ratios are calculated using total pay and benefits for UK colleagues and the disclosure will build up over time to cover a rolling 10-year period.
Year Method1 25th percentile ratio Median ratio 75th percentile ratio
2020 Option A 46.8:1 34.5:1 22.6:1
20192 Option A 100.5:1 74.6:1 47.9:1
1. Calculated as total pay and benefits for all UK colleagues, using the same methodology that is used to calculate the Chief Executive’s single figure of remuneration
2. The 2019 ratio figures have been restated to reflect the actual value of the Group Chief Executive’s 2017-2019 LTIP award on vesting
Year 25th percentile ratio Median ratio 75th percentile ratio
2020 Salary £27,500 £37,020 £62,000
Total pay and benefits £31,574 £47,792 £65,298
The Committee selected Option A as the most appropriate for the Company on the basis that it provides the most robust and statistically accurate means of identifying the lower quartile, median and upper quartile colleagues and is consistent with the Group’s pay, reward and progression policies. Base salaries of all colleagues, including the Executive Directors, are set with reference to a range of factors including market comparators, individual experience and performance in role.
The total compensation calculations for UK colleagues include salary, bonus payments and benefits package, and, where appropriate, LTIP earnings. The CEO comparator figure is that of total fixed and variable pay as set out in the single total figure of remuneration on page 120.
The ratios for 2020 have decreased from those of 2019, largely as a result of the reduction to the Group Chief Executive’s total single figure of remuneration for 2020. This decrease reflects the combination of the 33% voluntary salary sacrifice made for the full COVID-19 lockdown period of the second quarter, the lower outcome on the Group Chief Executive’s 2018-2020 LTIP due to the significant impact the COVID-19 pandemic had on the physical events market, and, hence, the Company’s TSR performance compared to its peer group, and the Committee’s decision to make the final determination of any 2020 STIP outcome alongside an assessment of trading in July 2021, when the extended Postponement Programme is scheduled to be completed.
The following table shows the percentage change in salary, benefits and bonus from 2019 to 2020 for the Group Chief Executive and Group Finance Director together with the average percentage change from 2019 to 2020 for all colleagues in the Group:
Salary % Benefits % Bonus %
Stephen A. Carter (Group Chief Executive) (8.2%) (24.8%) n/a
Gareth Wright (Group Finance Director) (8.2%) 8.9% n/a
All colleagues 1.8% (3.2%) (37.4%)
Details of the percentage change in fees and benefits for the Non-Executive Directors are shown on page 127.
Single total figure of remuneration for Non-Executive Directors (audited)The remuneration of the Chair is determined by the Committee in consultation with the Group Chief Executive. The remuneration of the Non-Executive Directors is determined by the Chair and the Executive Directors within the limits set by the Articles.
Non-Executive Directors’ fees were reviewed in early 2020 and a 1% increase in fees proposed. As the implications of the COVID-19 pandemic started to become apparent, the Non-Executive Directors voluntarily agreed to waive this increase in 2020.
For the period from April to June 2020 inclusive, the Non-Executive Directors voluntarily agreed to reduce their fees by 25% and to take the remainder of their fees during this period in the form of ordinary shares.
The current fees for the Chair and other Non-Executive Directors are as follows:
Current fee (£)
Chair 378,750
Non-Executive Directors 65,295
Additional fees: Audit Committee Chair 13,965
Remuneration Committee Chair 10,525
Senior Independent Director 10,525
The table below shows the actual fees paid to the Non-Executive Directors for the years ended 31 December 2019 and 2020, together with the percentage change in fees and benefits:
2020 2019 Percentage change
Non-Executive DirectorTotal fees1
(£)Benefits2
(£)Total fees
(£)Benefits2
(£) Fees % Benefits %
Derek Mapp 355,078 5,209 377,813 6,462 (6.0) (19.4)
Gareth Bullock 71,081 127 75,632 2,572 (6.0) (95.1)
Stephen Davidson 71,081 950 75,632 3,120 (6.0) (69.6)
David Flaschen 61,214 6,863 65,134 12,073 (6.0) (43.2)
Mary McDowell 61,214 1,270 65,134 4,238 (6.0) (70.0)
Helen Owers 61,214 3,805 65,134 6,274 (6.0) (39.4)
John Rishton 74,306 619 79,064 3,530 (6.0) (82.5)
Gill Whitehead3 61,214 191 27,206 327 (6.0) (41.6)
1. The Chair and Non-Executive Directors voluntarily agreed to reduce their base salaries by 25% for the period April to June inclusive, and the net fees for that period were paid in the form of newly issued shares
2. Taxable benefits disclosed relate to the reimbursement of taxable relevant travel and accommodation expenses for attending Board meetings and professional advice and include tax which is settled by the Company. The 2019 comparative figures for Derek Mapp, Helen Owers and Gill Whitehead have been restated to include expenses incurred during 2019 but paid in 2020
3. Gill Whitehead was appointed to the Board on 1 August 2019; her fees for 2019 therefore only reflect the five months of her appointment for that year. For fair comparison, the percentage change in her fees between 2019 and 2020 has been calculated using the full time equivalent fee for 2019
D I R E C T O R S ’ R E M U N E R A T I O N R E P O R T c o n t i n u e d
INFO
RM
A P
LC A
NN
UA
L R
EP
OR
T A
ND
AC
CO
UN
TS
20
20 IN
FOR
MA
PLC
AN
NU
AL R
EP
OR
T AN
D A
CC
OU
NT
S 20
20
126 127
GO
VE
RN
AN
CE
RE
PO
RT

Non-Executive Directors’ shareholdings (audited)As announced on 26 March 2020, the Chair and Non-Executive Directors volunteered to reduce their fees by 25% for the period April to June 2020 and to receive shares in lieu of their net fees over the same period. Shares were newly issued at the closing share price on the last working day of each month.
Non-Executive Directors are not subject to a shareholding requirement.
Details of their interests in shares (including those held by connected persons) as at 31 December 2020 and 2019 are set out below:
Non-Executive Director
Shareholding as at
31 December 2020
Shareholding as at
31 December 2019
Derek Mapp 216,937 135,766
Gareth Bullock 18,013 13,576
Stephen Davidson 7,647 3,350
David Flaschen1 10,651 7,000
Mary McDowell 9,714 6,299
Helen Owers 8,049 3,976
John Rishton 19,716 15,163
Gill Whitehead 4,184 n/a
1. David Flaschen holds 3,651 ordinary shares and 3,500 American Depository Receipts (ADRs). One ADR is equivalent to two ordinary shares
There have been no changes to these holdings between 31 December 2020 and the date of this Report.
Non-Executive Directors are not eligible to participate in any of the Company’s share plans or join any Group pension scheme.
Letters of appointmentAll Non-Executive Directors have a letter of appointment with the Company, which are available for inspection at the registered office during normal business hours. The effective dates of appointment are shown below:
Non-Executive Director Effective date of appointment
Derek Mapp 17 March 2008
Gareth Bullock 1 January 2014
Helen Owers 1 January 2014
Stephen Davidson 1 September 2015
David Flaschen 1 September 2015
John Rishton 1 September 2016
Mary McDowell 15 June 2018
Gill Whitehead 1 August 2019
How we intend to implement the Directors’ Remuneration Policy in 2021A summary of how the Committee intends to apply the Directors’ Remuneration Policy (Policy) for the year ending 31 December 2021 is set out below.
Base salary and feesThe base salaries of the Executive Directors will remain the same and, for comparison, the typical range for salary increase for UK colleagues is 1%–3%.
Similarly, the fees payable to the Chair and the basic fees payable to the Non-Executive Directors will remain the same.
Retirement benefitsExecutive Directors appointed prior to 23 December 2020 will continue to receive a cash payment of 25% of basic salary towards retirement plan contributions. As set out in the Policy approved in December 2020, the retirement benefits for these incumbent Executive Directors will be reduced to the level of the relevant colleague community by the end of 2022. Any new Executive Director appointed after 23 December 2020 will receive retirement benefits in line with the relevant colleague community from appointment.
Annual bonusIn 2021, the maximum annual bonus opportunity for all Executive Directors has been reduced and reset to 100% of base salary, payable in cash, in line with the Equity Revitalisation Plan.
The same structural approach is proposed for 2021 as for the previous year, i.e. a balanced scorecard, with five objectives in each of four categories; where each objective is worth 5% and each category is worth a maximum of 25% of the award.
The categories for 2021 will be as follows:
• Cash Flow• Digital Growth Initiatives• Subscription Revenue and Cost Control• Colleague Communication and Engagement
The first three categories reflect the three main strategic operating objectives for the Group in 2021, whilst the final category is topically critical and consistently important to the Group.
There will be no payment of an annual bonus if performance falls below expected standards.
Equity Revitalisation PlanIn January 2021, and as set out in the circular to Shareholders dated 25 November 2020, the Committee made an ERP award for 2021, 2022 and 2023 to the Group Chief Executive and Group Finance Director. In line with the Policy approved in December 2020, the ERP awards were equal to 200% of base salary per annum for the Group Chief Executive and 135% of base salary per annum for the Group Finance Director.
The Executive Directors will gain a beneficial interest in the ERP award in three tranches, starting with the first tranche in 2021, the second in 2022 and the third in 2023. Each tranche has a three-year vesting period, followed by a two-year holding period, with the first tranche not vesting until January 2024, followed by the second tranche in January 2025 and third tranche in January 2026, subject to the following underpinning conditions:
• Shareholder value underpin: If when an award vests the Informa share price is not above £5.454 for the ERP award, the award will not vest until the share price exceeds that price for a period of at least three months. If this has not been achieved within two years from the original vesting date, no shares will vest and the award will lapse
• Shareholding commitment: The Group Chief Executive is required to hold shares or exercisable options equal to 400% of base salary and the Group Finance Director and any new Executive Directors are required to hold shares or exercisable options equal to 275% of base salary. Incumbent Executive Directors are expected to meet this shareholding requirement within five year of 23 December 2020. Any new Executive Director will be required to meet the shareholding requirement within five years of appointment
• Post-employment holding commitment: Executive Directors are required to retain a shareholding of 150% of their final base salary for two years after resignation
• Malus and clawback: Existing malus and clawback provisions continue to apply to restricted equity awards under the ERP, as do all good/bad leaver provisions
No further ERP awards will be granted to the Group Chief Executive or Group Finance Director until 2024.
D I R E C T O R S ’ R E M U N E R A T I O N R E P O R T c o n t i n u e d
INFO
RM
A P
LC A
NN
UA
L R
EP
OR
T A
ND
AC
CO
UN
TS
20
20 IN
FOR
MA
PLC
AN
NU
AL R
EP
OR
T AN
D A
CC
OU
NT
S 20
20
128 129
GO
VE
RN
AN
CE
RE
PO
RT

Remuneration Committee membership and responsibilitiesThroughout the year ended 31 December 2020, and as at the date of this report, the Committee was comprised wholly of independent Non-Executive Directors, being Stephen Davidson (Committee Chair), Helen Owers, Gareth Bullock and Mary McDowell.
Full biographies for the Committee members and their attendance at meetings during the year are shown on pages 98 and 99, and 101 respectively.
The Board Chair and the Group Chief Executive attend meetings of the Committee by invitation only and are not present when matters relating to their own fees or remuneration are discussed. In determining the Executive Directors’ remuneration, the Committee consulted the Board Chair about its proposals.
The Group HR Director, Group Company Secretary and the Company’s remuneration advisers attended meetings and provided assistance to the Committee during the year, other than for any item relating to their own remuneration.
There is regular communication between the Committee Chair, Board Chair, Group Chief Executive and Group HR Director on all aspects of remuneration within the Group. The Committee Chair is also available to the remuneration advisers to discuss matters of governance or the Remuneration Policy.
Key responsibilities of the Remuneration CommitteeThe Committee’s terms of reference are reviewed annually and are available on the Company’s website. The Committee’s key areas of responsibility are:
• Setting the Remuneration Policy for Executive Directors and the Company Chair• Reviewing the Remuneration Policy and strategy for members of Senior Management, whilst having regard to pay and
employment conditions across the Group• Determining the total remuneration package of the Executive Directors and Senior Management• Approving the design and implementation of all colleague share plans and pension arrangements• Approving the design of, determining targets and monitoring performance against conditions attached to all annual and
long-term incentive awards to Executive Directors and Senior Management and approving the vesting and payment outcomes of these arrangements
• Selecting, appointing and setting the terms of reference of any independent remuneration advisers
Activities of the Remuneration Committee during 2020The Committee met eight times in the year ended 31 December 2020 during which the following activities were undertaken:
• Drafted and proposed a new Remuneration Policy to Shareholders for approval• Approved the 2019 Directors’ Remuneration Report• Reviewed the base salaries of the Executive Directors and other members of Senior Management• Assessed the level of achievement of targets for the 2019 STIP and set targets for the 2020 STIP• Assessed the achievement of targets for the LTIP awards made in 2017 and set targets for the LTIP awards made in 2020• Reviewed and approved awards made under the STIP (including the DSBP) and LTIP• Received updates on corporate governance and remuneration matters from the independent remuneration consultant
D I R E C T O R S ’ R E M U N E R A T I O N R E P O R T c o n t i n u e d
Remuneration consultantsMercer Kepler was appointed as independent remuneration consultant by the Committee in May 2017 following a commercial tender and supported the Committee on remuneration-related matters in 2020. With the Committee’s lead adviser moving to Ellason LLP at the start of 2021, the Committee decided to appoint Ellason as its independent adviser from 1 January 2021 in order to obtain appropriate support and retain continuity.
Mercer Kepler and Ellason are members of the Remuneration Consultants Group and, as such, voluntarily operate under the Code of Conduct in relation to executive remuneration consulting in the UK. Mercer Kepler and Ellason do not have any other association with the Company and are considered independent by the Committee.
Fees paid to Mercer Kepler for the year ended 31 December 2020, charged on a time basis, amount to £41,610 (2019: £52,266) and relate to attendance at Committee meetings, Remuneration Policy review and advice to the Committee. The Committee has not requested advice from any other external remuneration advisory firm during the year ended 31 December 2020.
Result of voting at the 2020 AGM and the General Meeting in December 2020At the 2020 AGM, Shareholders approved the Remuneration Policy which was in place for 2020 together with the Annual Report on Remuneration for the year ended 2019. In addition, Shareholders approved the 2021-2023 Remuneration Policy at a General Meeting held on 23 December 2020. The results of those votes are shown below:
Votes for Votes against Total votes cast
Votes withheld (abstentions)Number % Number %
Approval of the Annual Report on Remuneration in 2020 1,193,382,105 97.48 30,858,424 2.52 1,224,240,529 25,051,568
Approval of the 2020 Directors’ Remuneration Policy 755,328,579 64.87 409,053,205 35.13 1,164,381,784 84,910,314
Approval of the 2021-2023 Directors’ Remuneration Policy 694,307,564 59.43 473,876,836 40.57 1,168,184,400 18,893,941
This Report was approved by the Board and signed on its behalf by
Stephen Davidson Chair
Remuneration Committee 22 April 2021
INFO
RM
A P
LC A
NN
UA
L R
EP
OR
T A
ND
AC
CO
UN
TS
20
20 IN
FOR
MA
PLC
AN
NU
AL R
EP
OR
T AN
D A
CC
OU
NT
S 20
20
130 131
GO
VE
RN
AN
CE
RE
PO
RT

Other Statutory Information
O T H E R S T A T U T O R Y I N F O R M A T I O N
Articles of AssociationThe Company’s Articles of Association (Articles) were last amended in June 2020 and contain, amongst others, provisions on the rights and obligations attached to the Company’s shares. The Articles may only be amended by special resolution at a general meeting of Shareholders and are available on the Company’s website at www.informa.com.
DirectorsThe names and biographical details of all Directors and details of their Board Committee membership are on pages 98 and 99.
In accordance with the Articles and the 2018 Code, all continuing Directors will offer themselves for election or re-election by Shareholders at the 2021 AGM. Both Derek Mapp and Gareth Bullock have advised that they will retire as Directors and as Chair of the Board (in the case of Derek Mapp) or Senior Independent Director (in the case of Gareth Bullock) at the conclusion of the 2021 AGM.
Colleague engagement and equal opportunitiesInforma runs ongoing and proactive internal communications and colleague engagement programmes, designed to support and inform colleagues and foster a dynamic and engaged culture throughout the Group, and based on a recognition that talent is one of the Group’s most important assets.
The Board is directly involved in engagement activities and also receives feedback and reporting on colleague matters, so that the Directors can weigh and consider the interests of colleagues in decision making. Full details are included in the Section 172 statement on pages 45 to 47.
Diversity, equality and inclusion are important matters to the Group, and Informa aims to attract and retain talented colleagues with a wide range of backgrounds, skills and experiences. This breadth is both an essential business need and, the Group believes, the only and right way to operate. More information on the Group’s inclusion initiatives can be found on pages 30 to 34 and details of diversity measures and commitments are set out in the Nomination Committee Report.
We recognise the value that differences bring, including but not limited to difference of gender, age, race, nationality, social background, professional and personal experiences and preferences. We comply fully with all national equal opportunities legislation and make recruitment and promotion decisions based solely on the ability to perform each role. Colleagues, and potential colleagues, receive the same treatment regardless of age, gender, sexual orientation, disability, ethnicity or religion. In the event that a colleague’s circumstances change, every effort is made to ensure that their employment with the Group continues including, where possible, providing specialised training and adjusting their working environment.
Engagement with customers, suppliers and other groups Informa’s Directors recognise the importance of successful, long-term partnerships with the Group’s
Appointment and replacement of DirectorsThe rules for appointing and replacing Directors are set out in the Articles. Directors can be appointed by ordinary resolution of the Company or by the Board. The Company can remove a Director from office by passing an ordinary resolution or by notice being given by all other Directors.
Directors’ interestsThe Directors’ Remuneration Report on pages 116 to 131 contains details of the remuneration paid to the Directors, their interests in the shares of the Company and any awards granted to the Executive Directors under any of the Company’s all-colleague or executive share schemes. The Directors’ Remuneration Report also summarises the Executive Directors’ service agreements and the Non-Executive Directors’ letters of appointment. These are also available for inspection at the Company’s registered office.
No Director had a material interest in any contract in relation to the Company’s business at any time during the year.
customers, suppliers and a range of other business partners, based on building trust, delivering mutual benefit and sharing a commitment to high standards of conduct.
Pages 38 to 41 describe how the business works with customers, suppliers and business partners to understand their needs and respond in a way that delivers value to them and helps the Company succeed in turn. The Board’s Section 172 statement on pages 45 to 47 describes how the Directors engage with these groups, understand their interests and consider and respond to them, particularly as part of key decision making.
Share capitalInforma PLC is a public company limited by shares, incorporated in England and Wales. It has a premium listing on the London Stock Exchange and is the holding company of the Informa Group of companies.
The Company has one class of shares being ordinary shares of 0.1p each, all of which are fully paid. As at 31 December 2020, the Company’s issued share capital comprised 1,502,137,804 ordinary shares of 0.1p each. During the year, the Company issued 250,339,270 new ordinary shares. Of those, 250,318,000 new ordinary shares were issued in the placing, while the remaining shares were issued to the Non-Executive Directors in lieu of fees for April to June 2020 inclusive. Further details on the Company’s share capital is set out in Note 35 to the Consolidated Financial Statements.
At the 2020 AGM, the Directors were granted authority to make market purchases of up to 150,210,000 ordinary shares, representing just under 10% of its issued share capital at that time. This authority, which was not exercised during 2020 or to the date of this report, will expire at the conclusion of the 2021 AGM, when the Directors intend to propose that the authority is renewed.
Rights and obligations attaching to sharesThe rights attaching to the Company’s ordinary shares are set out in the Articles available on the Company’s
Powers of the DirectorsThe powers of the Directors are set out in the Articles and allow the Board to exercise all the powers of the Company. The Company may by ordinary resolution authorise the Board to issue shares and increase, consolidate, sub-divide and cancel shares in accordance with its Articles and English law.
Directors’ indemnitiesTo the extent permitted by English law and the Articles, the Company has agreed to indemnify the Directors in respect of any liability arising from or in connection with the execution of their powers, duties and responsibilities as a Director of the Company, any of its subsidiaries or as a trustee of an occupational pension scheme for colleagues. The indemnity would not provide coverage where the Director is proved to have acted fraudulently or dishonestly. The Company purchases and maintains Directors’ and Officers’ insurance cover against certain legal liabilities and the costs of claims in connection with any act or omission by its Directors and Officers in the execution of their duties.
website. Subject to relevant legislation, any share may be issued with or have attached to it such preferred, deferred or other special rights and restrictions as the Company may decide by ordinary resolution, or, if no such resolution is in effect, as the Board may decide so far as the resolution does not make specific provision. No such resolution is currently in effect.
The Company may pass an ordinary resolution to declare that a dividend be paid to holders of ordinary shares, subject to the recommendation of the Board as to the amount. On liquidation, holders of ordinary shares may share in the assets of the Company. Holders of ordinary shares are also entitled to receive the Company’s Annual Report and, subject to certain thresholds being met, may requisition the Board to convene a general meeting or the proposal of resolutions at AGMs. None of the ordinary shares carry any special rights with regard to control of the Company.
Voting rightsHolders of ordinary shares are entitled to attend and speak at general meetings of the Company and to appoint one or more proxies, or, if the holder of shares is a corporation, to appoint a corporate representative.
On a show of hands, each holder of ordinary shares who is present in person, or if a corporation is present by a duly appointed corporate representative who is not themselves a member, shall have one vote. On a poll, every holder of ordinary shares present in person or by proxy shall have one vote for every share of which they are the holder.
Electronic and paper proxy appointments and voting instructions must be received no later than 48 hours before a general meeting. A holder of ordinary shares can lose the entitlement to vote at general meetings where that holder has been served with a disclosure notice and has failed to provide the Company with information concerning interests held in those shares.
This section contains the remaining matters the Directors are required to report on each year, which do not appear elsewhere in the Annual Report and Accounts.
Additional information incorporated into this section by reference, including information required in accordance with the Companies Act 2006 and Listing Rule 9.8.4R, can be found in the following sections:
Information Page
Future business developments 4 to 93
Risk factors and principal risks 66 to 77
Colleague policies and engagement 30 to 34
Engagement with suppliers, customers and others 35 to 41
Greenhouse gas emissions 64
Viability and going concern statements 78 to 81
Section 172 statement 45 to 47
Governance arrangements 94 to 135
Long-term incentive plans 116 to 131
Financial instruments, financial risk management objectives and policies 192 to 201
Post balance sheet events 219
Dividends 174
INFO
RM
A P
LC A
NN
UA
L R
EP
OR
T A
ND
AC
CO
UN
TS
20
20 IN
FOR
MA
PLC
AN
NU
AL R
EP
OR
T AN
D A
CC
OU
NT
S 20
20
132 133
GO
VE
RN
AN
CE
RE
PO
RT

D I R E C T O R S ’ R E P O R T A N D O T H E R S T A T U T O R Y I N F O R M A T I O N c o n t i n u e d
Statement of Directors’ Responsibilities
S T A T E M E N T O F D I R E C T O R S ’ R E S P O N S I B I L I T I E S
The Directors are responsible for preparing the Annual Report, the Directors’ Remuneration Report and the financial statements in accordance with applicable law and regulations.
Company law requires the Directors to prepare financial statements for each financial year. Under that law the Directors are required to prepare the Group financial statements in accordance with International Financial Reporting Standards (IFRS) as adopted by the European Union and Article 4 of the International Accounting Standard (IAS) Regulation and have elected to prepare the Parent Company financial statements in accordance with United Kingdom Generally Accepted Accounting Practice (United Kingdom Accounting Standards and applicable law), including FRS 102 The Financial Reporting Standard applicable in the UK and Republic of Ireland.
Under company law the Directors must not approve the financial statements unless they are satisfied that they give a true and fair view of the state of affairs of the Group and the Company and of the profit or loss of the Group and the Company for that period.
In preparing the Parent Company financial statements, the Directors are required to:
• Select suitable accounting policies and then apply them consistently
• Make judgements and accounting estimates that are reasonable and prudent
• State whether applicable UK Accounting Standards have been followed, subject to any material departures disclosed and explained in the financial statements
• Prepare the financial statements on the going concern basis unless it is inappropriate to presume that the Company will continue in business
Except as set out above and as permitted under applicable statutes, there are no limitations on voting rights of holders of a given percentage, number of votes or deadlines for exercising voting rights.
Restrictions on transfer of securities in the CompanyThere are no restrictions on the transfer of securities in the Company, except that:
• The Directors may from time to time refuse to register a transfer of a certificated share which is not fully paid, provided it meets the requirements given under the Articles
• Transfers of uncertificated shares must be carried out using CREST, and the Directors can refuse to register a transfer of an uncertificated share, in accordance with the regulations governing the operation of CREST
• Legal and regulatory restrictions may be put in place from time to time, for example insider-trading laws
• In accordance with the Listing Rules, the Directors and certain Company colleagues require approval to deal in the Company’s shares
• Where a Shareholder with at least a 0.25% interest in the Company’s certificated shares has been served with a disclosure notice and has failed to provide the Company with information concerning interests in those shares
• The Directors may decide to suspend the registration of transfers, for up to 30 days a year, by closing the register of Shareholders. The Directors cannot suspend the registration of transfers of any uncertificated shares without obtaining consent from CREST
There are no agreements between holders of ordinary shares that are known to the Company which may result in restrictions on the transfer of securities or on voting rights.
Shares held on trustFrom time to time, shares are held by a trustee in order to satisfy entitlements of colleagues to shares under the Group’s share schemes. Usually the shares held on trust are no more than sufficient to satisfy the requirements of the Group’s share schemes for one year. The shares held by these trusts do not have any special rights with regard to control of the Company. While these shares are held on trust, their rights are
not exercisable directly by the relevant colleagues. The current arrangements concerning these trusts and their shareholdings are set out in Note 36 to the Consolidated Financial Statements.
Substantial shareholdingsAs at 31 December 2020, the Company had received notice of the following notifiable interests in the Company’s issued share capital, in accordance with the FCA’s Disclosure and Transparency Rules (DTR 5). The information provided below was correct at the date of notification to the Company:
Shareholder%
Shareholding
BlackRock, Inc. 5.92%
FIL Limited 5.16%
Newton Investment Management Limited 5.12%
Generation Investment Management 4.89%
APG Asset Management N.V. 4.55%
Lazard Asset Management LLC 4.30%
Artemis Investment Manager LLP 3.59%
Invesco Ltd 3.55%
Between 31 December 2020 and the date of this Report, the Company has been notified of the following change in substantial shareholdings:
Shareholder%
Shareholding
Newton Investment Management Limited 4.93%
All notifications made to the Company under DTR 5 are published on the Regulatory Information Service and made available on the Investors section of our website.
Change of controlThere are no significant agreements to which the Company is a party that take effect, alter or terminate upon a change of control following a takeover bid, except for the Group’s principal borrowings described in Note 29 to the Consolidated Financial Statements.
The Company does not have agreements with any Director or colleague that would provide compensation for loss of office or employment resulting from a change of control on takeover, except that provisions in the Company’s share schemes and plans may cause options and awards granted to colleagues to vest on a takeover under such schemes and plans.
Political donationsNeither the Company nor the Group made any political donations during 2020 or 2019.
Overseas branchesThe Company operates branches in the following countries: Australia, China, France, Hong Kong, Ireland, Japan, Luxembourg, Malaysia, Netherlands, Singapore, South Africa, South Korea, Switzerland, Taiwan, the UAE, the US and Vietnam.
Audit and auditorEach of the Directors at the date of approval of this report confirms that:
• To the best of their knowledge there is no relevant audit information that has not been brought to the attention of the auditor
• They have taken all steps required of them to make themselves aware of any relevant audit information and to establish that the Company’s auditor was aware of that information
This confirmation is given and should be interpreted in accordance with the provisions of section 418 of the Companies Act 2006.
Deloitte LLP has indicated its willingness to continue in office as auditor and, on the recommendation of the Audit Committee, a resolution to reappoint Deloitte as the Company’s auditor will be proposed at the 2021 AGM.
The Directors’ Report was approved by the Board on 22 April 2021 and signed on its behalf by
Rupert Hopley Group General Counsel and
Company Secretary Informa PLC Company Number: 8860726
In preparing the Group financial statements, IAS 1 requires that Directors:
• Properly select and apply accounting policies
• Present information, including accounting policies, in a manner that provides relevant, reliable, comparable and understandable information
• Provide additional disclosures when compliance with the specific requirements in IFRS are insufficient to enable users to understand the impact of particular transactions, other events and conditions on the entity’s financial position and financial performance
• Make an assessment of the Company’s ability to continue as a going concern
The Directors are responsible for keeping adequate accounting records that are sufficient to show and explain the Company’s transactions and disclose with reasonable accuracy at any time the financial position of the Company and the Group. This enables them to ensure that the financial statements and the Directors’ Remuneration Report comply with the Companies Act 2006 and, as regards the financial statements, Article 4 of the IAS Regulation. They are also responsible for safeguarding the assets of the Company and the Group and hence for taking reasonable steps for the prevention and detection of fraud and other irregularities.
The Directors are responsible for the maintenance and integrity of the corporate and financial information included on the Company’s website. Legislation in the UK governing the preparation and dissemination of financial statements may differ from legislation in other jurisdictions.
The Directors consider the Annual Report and financial statements, taken as a whole, is fair, balanced and understandable and provides the information necessary for Shareholders to assess the Company and the Group’s position, performance, business model and strategy.
In addition, in accordance with DTR 4.1.12R, each of the Directors, whose names and roles appear on pages 98 and 99, confirm that, to the best of their knowledge:
• The Consolidated Financial Statements, which have been prepared in accordance with IFRS as adopted by the EU, give a true and fair view of the assets, liabilities, financial position and profit of the Group and the Parent Company
• The Management Report (which includes the Strategic Report and the Directors’ Report) includes a fair review of the development and performance of the business and the position of the Group, together with a description of the principal risks and uncertainties that it faces
Approved by the Board and signed on its behalf by
Gareth Wright Group Finance Director 22 April 2021
INFO
RM
A P
LC A
NN
UA
L R
EP
OR
T A
ND
AC
CO
UN
TS
20
20 IN
FOR
MA
PLC
AN
NU
AL R
EP
OR
T AN
D A
CC
OU
NT
S 20
20
134 135
GO
VE
RN
AN
CE
RE
PO
RT

Independent Auditor’s report to the members of Informa PLC
I N D E P E N D E N T A U D I T O R ’ S R E P O R T T O T H E M E M B E R S O F I N F O R M A P L C
Report on the audit of the financial statements1. OpinionIn our opinion:
• the financial statements of Informa plc (the Parent Company) and its subsidiaries (the Group) give a true and fair view of the state of the Group’s and of the Parent Company’s affairs as at 31 December 2020 and of the Group’s loss for the year then ended;
• the Group financial statements have been properly prepared in accordance with international accounting standards in conformity with the requirements of the Companies Act 2006, and International Financial Reporting Standards (IFRSs) as adopted by the European Union;
• the Parent Company financial statements have been properly prepared in accordance with United Kingdom Generally Accepted Accounting Practice, including Financial Reporting Standard 102 The Financial Reporting Standard applicable in the UK and Republic of Ireland; and
• the financial statements have been prepared in accordance with the requirements of the Companies Act 2006.
We have audited the financial statements which comprise:
• The Consolidated Income Statement• The Consolidated Statement of Comprehensive Income• The Consolidated and Parent Company Statements of Changes in Equity• The Consolidated and Parent Company Balance Sheets• The Consolidated Cash Flow Statement• The related Notes 1 to 42 to the Consolidated Financial Statements• The related Notes 1 to 12 to the Parent Company Financial Statements
The financial reporting framework that has been applied in the preparation of the Group financial statements is applicable law and IFRSs as adopted by the European Union. The financial reporting framework that has been applied in the preparation of the Parent Company financial statements is applicable law and United Kingdom Accounting Standards, including FRS 102 The Financial Reporting Standard applicable in the UK and Republic of Ireland (United Kingdom Generally Accepted Accounting Practice).
2. Basis for opinionWe conducted our audit in accordance with International Standards on Auditing (UK) (ISAs (UK)) and applicable law. Our responsibilities under those standards are further described in the auditor’s responsibilities for the audit of the Consolidated Financial Statements section of our report.
We are independent of the Group and the Parent Company in accordance with the ethical requirements that are relevant to our audit of the financial statements in the UK, including the Financial Reporting Council’s (the FRC’s) Ethical Standard as applied to listed public interest entities, and we have fulfilled our other ethical responsibilities in accordance with these requirements. The non-audit services provided to the Group and Parent Company for the year are disclosed in Note 7 to the Consolidated Financial Statements. We confirm that the non-audit services prohibited by the FRC’s Ethical Standard were not provided to the Group or the Parent Company.
We believe that the audit evidence we have obtained is sufficient and appropriate to provide a basis for our opinion.
3. Summary of our audit approach
Key audit matters The key audit matters that we identified in the current year were:
• The recoverability of the carrying value of goodwill• The timing of revenue recognition
Within this report, key audit matters are identified as follows:
Newly identified Increased level of risk
Similar level of risk
Decreased level of risk
Materiality The materiality that we used for the Group financial statements was £20m, which was determined on the basis of 5% of a three-year average profit before tax (PBT) adjusted for the amortisation of intangibles, impairment and one-off finance costs. The three-year average has been calculated to indicate an average financial performance, reflecting the significant impact of COVID-19 on 2020 performance and the expected short-term disruption as a result of the pandemic.
Scoping We performed full scope audits or an audit of specified balances and transactions at the principal business units, the majority of which use the services provided by the Group’s shared services centers in the UK, US, China, Hong Kong and Singapore. These in-scope business units account for 79% (2019: 73%) of the Group’s revenue and 76% (2019: 76%) of the Group’s adjusted operating profit. The current year percentage for Group adjusted operating profit has been calculated on an absolute basis, reflecting the impact of COVID-19 on the profitability, and in some cases loss making nature, of individual business units.
Significant changes in our approach
Our planned audit approach was discussed with the Audit Committee in September 2020 and December 2020, including our updated basis for determining materiality as discussed above.
The key audit matter in respect of the recoverability of goodwill has been refined to reflect the conditions present during the current year. Specifically, we have broadened the scope of the key audit matter to include the Informa Markets and Informa Connect businesses as well as Informa Tech which was a key audit matter in 2019.
Additionally, as a result of identifying the impact of COVID-19 as a trigger event for an impairment review, management assessed the recoverability of goodwill at 30 June 2020. This assessment was in addition to the annual impairment assessment at 31 December 2020. Our key audit matter therefore relates to management’s assessments at both 30 June 2020 and 31 December 2020.
The key audit matter in respect of the timing of revenue recognition has been refined to no longer include revenue resulting from unit sales as we consider the likelihood and magnitude of misstatement in relation to the cut off of unit sales to no longer present factors akin to a significant risk. The appropriate recognition of subscription revenue remains a key audit matter.
4. Conclusions relating to going concernIn auditing the financial statements, we have concluded that the Directors’ use of the going concern basis of accounting in the preparation of the financial statements is appropriate.
Our evaluation of the Directors’ assessment of the Group’s and Parent Company’s ability to continue to adopt the going concern basis of accounting included:
• An assessment of the reasonableness of management’s forecasting assumptions, considering the consistency of these assumptions with the Group’s principal risks and uncertainties and other assumptions taken by management in preparing the financial statements
• An assessment of the historical accuracy of forecasts prepared by management• Consideration of the level of liquidity headroom present in management’s base case and sensitised scenarios• Consideration of the financing facilities available, including the nature of these facilities and associated terms, the availability
of future financing and repayment terms of financing already in place• Testing of the clerical accuracy of the model used to prepare management’s forecasts• Consideration of the appropriateness of the disclosures included within the Consolidated Financial Statements in respect of
going concern
Based on the work we have performed, we have not identified any material uncertainties relating to events or conditions that, individually or collectively, may cast significant doubt on the Group’s and Parent Company’s ability to continue as a going concern for a period of at least 12 months from when the financial statements are authorised for issue.
In relation to the reporting on how the Group has applied the UK Corporate Governance Code, we have nothing material to add or draw attention to in relation to the Directors’ statement in the financial statements about whether the Directors considered it appropriate to adopt the going concern basis of accounting.
Our responsibilities and the responsibilities of the Directors with respect to going concern are described in the relevant sections of this report.
INFO
RM
A P
LC A
NN
UA
L R
EP
OR
T A
ND
AC
CO
UN
TS
20
20 IN
FOR
MA
PLC
AN
NU
AL R
EP
OR
T AN
D A
CC
OU
NT
S 20
20
136 137
FIN
AN
CIA
L S
TA
TE
ME
NT
S

5. Key audit mattersKey audit matters are those matters that, in our professional judgement, were of most significance in our audit of the financial statements of the current period and include the most significant assessed risks of material misstatement (whether or not due to fraud) that we identified. These matters included those which had the greatest effect on: the overall audit strategy; the allocation of resources in the audit; and directing the efforts of the engagement team.
These matters were addressed in the context of our audit of the financial statements as a whole, and in forming our opinion thereon, and we do not provide a separate opinion on these matters.
5.1. Recoverability of carrying value of goodwill
Key audit matter description
As at 31 December 2020, goodwill of £5,576.6m (2019: £6,144m) is recognised. The balance at 31 December is after an impairment charge of £593m recorded during the year.
Where goodwill exists, accounting standards require that management perform an annual impairment test, computing the ‘recoverable amount’ based on the higher of ‘value in use’ and ‘fair value less costs to sell’. The recoverable amount is then compared to the balance sheet carrying value of each cash generating unit or group of cash generating units (CGU).
Management performs its impairment assessment in respect of goodwill on a divisional basis by aggregating the CGUs at the Divisional level, reflecting the lowest level at which they monitor goodwill. This is discussed further in Note 3 to the Consolidated Financial Statements.
Management performs its annual assessment of the recoverability of goodwill ascribed to all CGUs using a 31 December valuation date. In addition to this annual assessment, accounting standards require an assessment of impairment indicators at each reporting date and, where such indicators exist, an impairment review to be undertaken.
At 30 June 2020, as a result of the economic disruption caused by the COVID-19 pandemic, management identified impairment indicators relevant to the CGUs within the Informa Markets, Informa Tech and Informa Connect divisions. Following the completion of this impairment review exercise an impairment charge of £593m was recorded. The CGUs within the Informa Markets, Informa Tech and Informa Connect divisions also represent those with the greatest risk of impairment at 31 December 2020 given the continued disruption to the markets in which they operate. In light of this, management has included a key source of estimation uncertainty relating to the depth of the economic impact from COVID-19, and the speed of any subsequent recovery.
The CGUs within the Informa Markets, Informa Tech and Informa Connect divisions will be collectively referred to as the ‘Relevant CGUs’ throughout this key audit matter.
In completing its impairment review at 31 December 2020, management prepared forecasts for five years, using the Group’s budget for year one and the Group’s forecast cash flows for years two to five. In completing its impairment review at 30 June 2020, management prepared a five and a half-year forecast using the Group’s budget for the initial six months and the Group’s forecast cash flows for the remaining five years. In both instances, a terminal value was then applied beyond the final year of the forecast using growth factors and discount rates applicable for each CGU.
There is inherent uncertainty, and therefore significant judgement, in the forecast cash flows for the period to December 2025.
The selection of long-term growth rates and the discount rate assumptions requires judgement and is important to this key audit matter. Management engages independent expert valuation advisers to assist in deriving appropriate long-term growth rates and discount rates.
We considered the recoverability of the carrying value of goodwill as a key audit matter due to the significant amount of audit resources and effort applied in respect of testing the impairment reviews of goodwill at both 30 June 2020 and 31 December 2020.
Management discusses the policies and processes followed in respect of the impairment review in Notes 3 and 16 to the Consolidated Financial Statements.
I N D E P E N D E N T A U D I T O R ’ S R E P O R T T O T H E M E M B E R S O F I N F O R M A P L C c o n t i n u e d
5.1. Recoverability of carrying value of goodwill continued
How the scope of our audit responded to the key audit matter
We assessed management’s impairment reviews of goodwill for the Relevant CGUs at both 30 June 2020 and 31 December 2020 using a range of audit procedures, including:
• Obtaining an understanding of the basis of preparation of the cash flow forecasts used in the impairment review, including the associated governance process for their compilation and approval, and assessing the design and implementation of relevant controls within the impairment review process
• Assessing the inherent control risk associated with management estimations, including the reliability of its data sources, assumptions, cash flow forecasts and impairment models
• Assessing recent forecasting accuracy against actual performance and, specifically with reference to the impairment review at 30 June 2020, challenging the basis on which management was able to forecast accurately given the uncertain environment
• Involving our internal valuation specialists to assess the appropriateness of the key assumptions including the discount rates and long-term growth rates prepared by management’s expert valuation advisers. Additionally our internal valuation specialists were involved in assessing management’s valuation model for compliance with the valuation principles of accounting standards
• Further challenging the cash flow forecasts used within the impairment model based on our understanding of the business and developments within the year. This included challenging the forecast future impact of COVID-19 on each division by reference to external data sources, market intelligence and the behaviour evident as the exhibitions market in China reopened in the second half of 2020
• In respect of the impairment review at 31 December 2020, performing breakeven analysis on the key assumptions within the impairment model for the CGU, and assessing whether the breakeven scenarios represented reasonably possible changes in the key assumptions
• In respect of the impairment review at 30 June 2020, understanding the sensitivity of the impairment charge to key assumptions within the impairment model, and assessing whether the sensitivity scenarios modelled by management resulted in a material change to the recorded impairment charge
• Challenging management to analyse, and provide evidence to support, the increase in value in use between 30 June 2020 and 31 December 2020• Challenging the accuracy and completeness of the goodwill disclosures included in Note 16 to the Consolidated Financial Statements, and the
associated critical judgements and key sources of estimation uncertainty included in Note 3 to the Consolidated Financial Statements
Key observations
Based on the audit procedures performed we concluded that the assumptions management had applied in their impairment reviews and the overall conclusions from their reviews were reasonable.
5.2. The timing of revenue recognition
Key audit matter description
A risk of material misstatement exists in respect of the recognition of subscriptions revenue totalling £671.3m (2019: £660.0m) across the Taylor & Francis, Informa Intelligence and Informa Tech Divisions. Specifically, we identified a risk that the deferral and release of subscription revenues may not appropriately match the subscription period in customer contracts. This risk was also identified as a potential area of fraudulent management manipulation.
The Group’s revenue recognition accounting policies are disclosed in Note 2 to the Consolidated Financial Statements with an analysis by revenue stream and by segment in Note 5 to the Consolidated Financial Statements.
How the scope of our audit responded to the key audit matterWe confirmed our understanding of the Taylor & Francis, Informa Intelligence and Informa Tech business models, as well as our understanding of the principles set out in customer contracts and the sales process.
We then obtained an understanding of the design and implementation of relevant controls by performing sample transaction walkthroughs of the revenue recording process, from order processing to invoice production through to cash collection.
These procedures enabled us to design and perform substantive audit procedures to respond to the specific risk identified. The procedures we performed across the entities within our audit scope included the following:
• Performed detailed testing of a sample of subscription transactions, obtaining and reviewing the relevant order confirmations and contracts to validate whether revenue was appropriately recorded across the term
• Used data analytics techniques to recalculate the deferred revenue in relation to subscription revenue for contracts spanning the year end
Key observations
Based on the audit procedures performed we concluded that timing of revenue recognition in respect of subscriptions was appropriate.
INFO
RM
A P
LC A
NN
UA
L R
EP
OR
T A
ND
AC
CO
UN
TS
20
20 IN
FOR
MA
PLC
AN
NU
AL R
EP
OR
T AN
D A
CC
OU
NT
S 20
20
138 139
FIN
AN
CIA
L S
TA
TE
ME
NT
S

6. Our application of materiality6.1. MaterialityWe define materiality as the magnitude of misstatement in the financial statements that makes it probable that the economic decisions of a reasonably knowledgeable person would be changed or influenced. We use materiality both in planning the scope of our audit work and in evaluating the results of our work.
Based on our professional judgement, we determined materiality for the financial statements as a whole as follows:
Group financial statements Parent Company financial statements
Materiality £20.0 million (2019: £34.0 million) £12.9 million (2019: £17.0 million)
Basis for determining materiality
Reflecting the statutory loss before tax of £1.0bn reported for the year ended 31 December 2020, our materiality is based on a percentage of the three-year average statutory pre-tax profit adjusted for amortisation of intangible assets acquired in business combinations, impairments of goodwill and one-off finance costs. Materiality of £20.0m represents 5% of this measure. In 2019 our materiality was 5% of the pre-tax profit measure in that year.
Given the quantum of the net assets on the Parent Company balance sheet we have capped materiality to 45% (2019: 35%) of Group materiality which equates to 0.1% of net assets (2019: 0.1% of net assets).
Rationale for the benchmark applied
We adjust for amortisation of intangible assets acquired in business combinations, losses on disposals and one-off finance costs to use a profit measure also used by analysts and other users of the financial statements, and because profits adjusted for these items more closely align with current cash flows.
In the year ended 31 December 2020, to reflect the significant impact of the COVID-19 pandemic on the performance of the Group’s event portfolio during the year our benchmark has changed to the three-year average statutory profit before tax adjusted for the items above reflecting the expected short-term disruption as a result of the pandemic.
Net assets is typically considered an appropriate benchmark for materiality as the Parent Company is a holding company.
Adjusted PBT (three-year average) £405m
Group materiality £20m
Component materiality range £12m to £9m
Audit Committee reporting threshold £1m
6.2. Performance materialityWe set performance materiality at a level lower than materiality to reduce the probability that, in aggregate, uncorrected and undetected misstatements exceed the materiality for the financial statements as a whole.
Group financial statements Parent Company financial statements
Performance materiality
70% (2019: 70%) of Group materiality 70% (2019: 70%) of Parent Company materiality
Basis and rationale for determining performance materiality
In determining performance materiality, we considered the outcome of our risk assessment and our assessment of the Group’s control environment including our plan to rely on the operating effectiveness of certain systems and controls, as well as the potential reduction in the effectiveness of the internal control environment during the year as a result of changes to working patterns. We also considered the value of uncorrected misstatements identified in previous years.
I N D E P E N D E N T A U D I T O R ’ S R E P O R T T O T H E M E M B E R S O F I N F O R M A P L C c o n t i n u e d
6.3. Error reporting thresholdWe agreed with the Audit Committee that we would report to the Committee all audit differences in excess of £1.0m (2019: £1.7m), as well as differences below that threshold that, in our view, warranted reporting on qualitative grounds. We also report to the Audit Committee on disclosure matters that we identified when assessing the overall presentation of the financial statements.
7. An overview of the scope of our audit7.1. Identification and scoping of componentsOur Group audit was scoped by obtaining an understanding of the Group and its environment, including Group-wide controls, and assessing the risks of material misstatement at the Group level. We specifically considered the impact of COVID-19 on the Group, including the differing impact of COVID-19 disruption on each segment and business unit.
The business units in scope for the current year audit were selected based on the relative contributions of individual business units to the consolidated Group revenue and adjusted operating profit, as well as the relative risks associated with each individual business unit. Accordingly there have been changes to the business units in scope compared with the prior year. These changes include a greater proportion of business units in scope being based in China, reflecting the faster recovery of the Chinese exhibitions market, and a greater proportion of business units from the Taylor & Francis Division given the lower relative disruption to its operations.
Based on our assessment, we performed either a full scope audit or an audit of specified balances and transactions at the principal business units within the shared services centres in Colchester (UK), Kent (UK), Sarasota (US), Florida (US), Cleveland, Ohio (US), New York (US), Singapore, Shanghai (China), and Hong Kong (China).
As a result of exhibitions reopening in China earlier than elsewhere we identified two business units in China which are not accounted for within one of the Group’s shared service centres which made a material contribution to the Group in the period. These business units are accounted for by local management teams and were subject to full scope audits.
The Parent Company is located in the UK and audited directly by the Group audit team.
The in-scope locations (those at which a full scope audit or an audit of specified balances and transactions were performed as part of the Group audit) represent 79% (2019: 73%) of the Group’s revenue and 76% (2018: 76%) of the Group’s adjusted operating profit. This is detailed further in the graphs below:
Full audit scope 65%
Specified audit procedures 14%
Review at Group level 21%
Revenue
Full audit scope 65%
Specified audit procedures 11%
Review at Group level 24%
Adjusted operating profit
The current year percentages for adjusted operating profit have been calculated on an absolute basis, reflecting the impact of COVID-19 on the profitability, and in some cases loss making nature, of individual business units.
The Group audit team directly audits the entirety of the Group’s goodwill and acquired intangible assets. Our audit work at all the locations in the Group audit scope was conducted to a materiality of between £9m to £12m, and therefore not exceeding 60% of Group materiality of £20.0m.
INFO
RM
A P
LC A
NN
UA
L R
EP
OR
T A
ND
AC
CO
UN
TS
20
20 IN
FOR
MA
PLC
AN
NU
AL R
EP
OR
T AN
D A
CC
OU
NT
S 20
20
14 0 141
FIN
AN
CIA
L S
TA
TE
ME
NT
S

7.2. Our consideration of the control environment IT specialists within the Group audit team tested the Group’s two main Enterprise Resource Planning systems centrally. Where IT access controls were found not to be operating effectively throughout the year, additional procedures were performed to mitigate the risk that access could have been gained to the financial reporting systems. As such, we were able to rely upon the IT controls associated with both Enterprise Resource Planning systems.
The Group’s two main Enterprise Resource Planning systems cover the majority of business units within the Group’s shared service centres; however, a number of other Enterprise Resource Planning systems are used by the Group, including by certain business units within the scope of our audit in both China and the US.
From our walkthroughs and understanding of the entity and the controls at the business cycle and account balance levels, we relied on controls within the purchase-to-pay cycle for those business units associated with the Group’s two main Enterprise Resource Planning systems.
7.3. Working with other auditorsGlobal travel restrictions implemented in response to COVID-19 meant that we were unable to physically visit any component teams. Through the use of video conferencing and other digital platforms we were, however, able to maintain regular communications with all component teams and have therefore continued to maintain appropriate direction and oversight.
For each component, we included the component audit team in our team briefings, to discuss the audit instructions and our Group risk assessment, including our assessment of the risk of fraud, to confirm their understanding of the business, and to discuss their local risk assessment. Throughout the audit, we maintained regular contact in order to support and direct their audit approach. We also attended (via video conference) local audit close meetings with local management, performed remote reviews of audit working papers where considered necessary, and reviewed component auditor reporting to us detailing the findings from their work.
At the Group level, we also tested the consolidation process and carried out analytical procedures to confirm our conclusion that there were no significant risks of material misstatement in the aggregated financial information of the remaining components not subject to audit.
8. Other informationThe other information comprises the information included in the Annual Report, other than the financial statements and our auditor’s report thereon. The Directors are responsible for the other information contained within the Annual Report. Our opinion on the financial statements does not cover the other information and, except to the extent otherwise explicitly stated in our report, we do not express any form of assurance conclusion thereon.
Our responsibility is to read the other information and, in doing so, consider whether the other information is materially inconsistent with the financial statements or our knowledge obtained in the course of the audit, or otherwise appears to be materially misstated.
If we identify such material inconsistencies or apparent material misstatements, we are required to determine whether this gives rise to a material misstatement in the financial statements themselves. If, based on the work we have performed, we conclude that there is a material misstatement of this other information, we are required to report that fact.
We have nothing to report in this regard.
9. Responsibilities of DirectorsAs explained more fully in the Directors’ responsibilities statement, the Directors are responsible for the preparation of the financial statements and for being satisfied that they give a true and fair view, and for such internal control as the Directors determine is necessary to enable the preparation of financial statements that are free from material misstatement, whether due to fraud or error.
In preparing the financial statements, the Directors are responsible for assessing the Group’s and the Parent Company’s ability to continue as a going concern, disclosing as applicable, matters related to going concern and using the going concern basis of accounting unless the Directors either intend to liquidate the Group or the Parent Company or to cease operations, or have no realistic alternative but to do so.
I N D E P E N D E N T A U D I T O R ’ S R E P O R T T O T H E M E M B E R S O F I N F O R M A P L C c o n t i n u e d
10. Auditor’s responsibilities for the audit of the financial statementsOur objectives are to obtain reasonable assurance about whether the financial statements as a whole are free from material misstatement, whether due to fraud or error, and to issue an auditor’s report that includes our opinion. Reasonable assurance is a high level of assurance, but is not a guarantee that an audit conducted in accordance with ISAs (UK) will always detect a material misstatement when it exists. Misstatements can arise from fraud or error and are considered material if, individually or in the aggregate, they could reasonably be expected to influence the economic decisions of users taken on the basis of these financial statements.
A further description of our responsibilities for the audit of the financial statements is located on the FRC’s website at: www.frc.org.uk/auditorsresponsibilities. This description forms part of our auditor’s report.
11. Extent to which the audit was considered capable of detecting irregularities, including fraudIrregularities, including fraud, are instances of non-compliance with laws and regulations. We design procedures in line with our responsibilities, outlined above, to detect material misstatements in respect of irregularities, including fraud. The extent to which our procedures are capable of detecting irregularities, including fraud, is detailed below.
11.1. Identifying and assessing potential risks related to irregularitiesIn identifying and assessing risks of material misstatement in respect of irregularities, including fraud and non-compliance with laws and regulations, we considered the following:
• The nature of the industry and sector, control environment and business performance including the design of the Group’s remuneration policies, key drivers for Directors’ remuneration, bonus levels and performance targets
• Results of our enquiries of management, Internal Audit and the Audit Committee about their own identification and assessment of the risks of irregularities
• Observations from our component audit partners as to any potentially heightened risks in their geographies• Any matters we identified having obtained and reviewed the Group’s documentation of their policies and procedures
relating to: – identifying, evaluating and complying with laws and regulations and whether they were aware of any instances of
non-compliance – detecting and responding to the risks of fraud and whether they have knowledge of any actual, suspected or alleged fraud – the internal controls established to mitigate risks of fraud or non-compliance with laws and regulations
• The matters discussed among the audit engagement team including significant component audit teams and relevant internal specialists, including tax, valuations, pensions, IT and analytics specialists regarding how and where fraud might occur in the financial statements and any potential indicators of fraud. These discussions were, in part, facilitated by a forensic specialist
As a result of these procedures, we considered the opportunities and incentives that may exist within the organisation for fraud and identified the greatest potential for fraud in the following areas: The recoverability of the carrying value of goodwill; the timing of revenue recognition; and the classification of items as ‘adjusting’ within the Income Statement. In common with all audits under ISAs (UK), we are also required to perform specific procedures to respond to the risk of management override.
We also obtained an understanding of the legal and regulatory frameworks that the Group operates in, focusing on provisions of those laws and regulations that:
• Had a direct effect on the determination of material amounts and disclosures in the financial statements. The key laws and regulations we considered in this context included the UK Companies Act, Listing Rules, pensions legislation and tax legislation
• Do not have a direct effect on the financial statements but compliance with which may be fundamental to the Group’s ability to operate or to avoid a material penalty. These included GDPR, anti-bribery legislation and anti-money laundering regulations
INFO
RM
A P
LC A
NN
UA
L R
EP
OR
T A
ND
AC
CO
UN
TS
20
20 IN
FOR
MA
PLC
AN
NU
AL R
EP
OR
T AN
D A
CC
OU
NT
S 20
20
142 143
FIN
AN
CIA
L S
TA
TE
ME
NT
S

I N D E P E N D E N T A U D I T O R ’ S R E P O R T T O T H E M E M B E R S O F I N F O R M A P L C c o n t i n u e d
11.2. Audit response to risks identifiedAs a result of performing the above, we identified both the recoverability of the carrying value of goodwill and the timing of revenue recognition as key audit matters with a potential risk of fraud. The key audit matters section of our report explains these matters in more detail and also describes the specific procedures we performed in response to those key audit matters.
In addition to the above, our procedures to respond to risks identified included the following:
• Reviewing the financial statement disclosures and testing to supporting documentation to assess compliance with provisions of relevant laws and regulations described as having a direct effect on the financial statements
• Enquiring of management, the Audit Committee and in-house legal counsel concerning actual and potential litigation and claims
• Performing analytical procedures to identify any unusual or unexpected relationships that may indicate risks of material misstatement due to fraud
• Reading minutes of meetings of those charged with governance, reviewing Internal Audit reports and reviewing correspondence with HMRC
• In addressing the risk of fraud in the classification of items as ‘adjusting’ within the income statement, we have assessed the reasonableness of management’s accounting policy regarding the classification of items as ‘adjusting’ and the judgements taken by management in the application of that policy to a sample of items
• In addressing the risk of fraud through management override of controls, testing the appropriateness of journal entries and other adjustments; assessing whether the judgements made in making accounting estimates are indicative of a potential bias; and evaluating the business rationale of any significant transactions that are unusual or outside the normal course of business
We also communicated relevant identified laws and regulations and potential fraud risks to all engagement team members including internal specialists and significant component audit teams, and remained alert to any indications of fraud or non-compliance with laws and regulations throughout the audit.
Report on other legal and regulatory requirements12. Opinions on other matters prescribed by the Companies Act 2006In our opinion the part of the Directors’ Remuneration Report to be audited has been properly prepared in accordance with the Companies Act 2006.
In our opinion, based on the work undertaken in the course of the audit:
• The information given in the Strategic Report and the Directors’ Report for the financial year for which the financial statements are prepared is consistent with the financial statements
• The Strategic Report and the Directors’ Report have been prepared in accordance with applicable legal requirements
In the light of the knowledge and understanding of the Group and the Parent Company and their environment obtained in the course of the audit, we have not identified any material misstatements in the Strategic Report or the Directors’ Report.
13. Corporate Governance StatementThe Listing Rules require us to review the Directors’ statement in relation to going concern, longer-term viability and that part of the Corporate Governance Statement relating to the Group’s compliance with the provisions of the UK Corporate Governance Code specified for our review.
Based on the work undertaken as part of our audit, we have concluded that each of the following elements of the Corporate Governance Statement is materially consistent with the financial statements and our knowledge obtained during the audit:
• The Directors’ statement with regard to the appropriateness of adopting the going concern basis of accounting and any material uncertainties identified set out on page 80
• The Directors’ explanation as to its assessment of the Group’s prospects, the period this assessment covers and why the period is appropriate set out on pages 78 to 83
• The Directors’ statement on fair, balanced and understandable set out on page 112• The Board’s confirmation that it has carried out a robust assessment of the emerging and principal risks set out on pages
66 to 70• The section of the Annual Report that describes the review of effectiveness of risk management and internal control systems
set out on pages 113 and 114• The section describing the work of the Audit Committee set out on pages 110 to 115
14. Matters on which we are required to report by exception14.1. Adequacy of explanations received and accounting recordsUnder the Companies Act 2006 we are required to report to you if, in our opinion:
• We have not received all the information and explanations we require for our audit; or• Adequate accounting records have not been kept by the Parent Company, or returns adequate for our audit have not been
received from branches not visited by us; or• The Parent Company financial statements are not in agreement with the accounting records and returns
We have nothing to report in respect of these matters.
14.2. Directors’ remunerationUnder the Companies Act 2006 we are also required to report if in our opinion certain disclosures of Directors’ remuneration have not been made or the part of the Directors’ Remuneration Report to be audited is not in agreement with the accounting records and returns.
We have nothing to report in respect of these matters.
15. Other matters which we are required to address15.1. Auditor tenureFollowing the recommendation of the Audit Committee, we were reappointed by the members of the AGM on 12 June 2020 to audit the financial statements for the year ending 31 December 2020. The period of total uninterrupted engagement including previous renewals and reappointments of the firm is 17 years, covering the years ending 31 December 2004 to 31 December 2020.
15.2. Consistency of the audit report with the additional report to the Audit CommitteeOur audit opinion is consistent with the additional report to the Audit Committee we are required to provide in accordance with ISAs (UK).
16. Use of our reportThis report is made solely to the Company’s members, as a body, in accordance with Chapter 3 of Part 16 of the Companies Act 2006. Our audit work has been undertaken so that we might state to the Company’s members those matters we are required to state to them in an auditor’s report and for no other purpose. To the fullest extent permitted by law, we do not accept or assume responsibility to anyone other than the Company and the Company’s members as a body, for our audit work, for this report, or for the opinions we have formed.
Anna Marks FCA (Senior statutory auditor) For and on behalf of Deloitte LLP Statutory Auditor London 22 April 2021
INFO
RM
A P
LC A
NN
UA
L R
EP
OR
T A
ND
AC
CO
UN
TS
20
20 IN
FOR
MA
PLC
AN
NU
AL R
EP
OR
T AN
D A
CC
OU
NT
S 20
20
14 4 145
FIN
AN
CIA
L S
TA
TE
ME
NT
S

Financial Statements
F I N A N C I A L S T A T E M E N T S C O N S O L I D A T E D I N C O M E S T A T E M E N T F O R T H E Y E A R E N D E D 3 1 D E C E M B E R 2 0 2 0
Notes
Adjusted results
2020£m
Adjusting items 2020
£m
Statutory results
2020£m
Adjusted results
2019£m
Adjusting items 2019
£m
Statutory results
2019£m
Revenue 5 1,660.8 – 1,660.8 2,890.3 – 2,890.3
Net operating expenses 7 (1,393.8) (1,148.2) (2,542.0) (1,958.7) (395.0) (2,353.7)
Operating profit/(loss) before joint ventures and associates 267.0 (1,148.2) (881.2) 931.6 (395.0) 536.6
Share of results of joint ventures and associates 20 0.8 – 0.8 1.5 – 1.5
Operating profit/(loss) 267.8 (1,148.2) (880.4) 933.1 (395.0) 538.1
Loss on disposal of subsidiaries and operations 21 – (8.4) (8.4) – (95.4) (95.4)
Finance income 11 7.0 8.3 15.3 8.9 1.2 10.1
Finance costs 12 (104.4) (161.8) (266.2) (120.6) (13.5) (134.1)
Profit/(loss) before tax 170.4 (1,310.1) (1,139.7) 821.4 (502.7) 318.7
Tax (charge)/credit 13 (25.6) 127.7 102.1 (156.1) 83.5 (72.6)
Profit/(loss) for the year 144.8 (1,182.4) (1,037.6) 665.3 (419.2) 246.1
Attributable to:
– Equity holders of the Company 15 140.9 (1,182.4) (1,041.5) 644.7 (419.2) 225.5
– Non-controlling interests 37 3.9 – 3.9 20.6 – 20.6
Earnings per share
– Basic (p)1 15 9.9 (73.4) 51.2 17.9
– Diluted (p)1 15 9.9 (73.4) 51.0 17.8
1. 2019 restated for share placement (see Note 4)
All amounts in 2020 and 2019 relate to continuing operations.
Consolidated Income Statement 147
Consolidated Statement of Comprehensive Income
148
Consolidated Statement of Changes in Equity
149
Consolidated Balance Sheet 150
Consolidated Cash Flow Statement 151
Notes to the Consolidated Financial Statements
152
Parent Company Balance Sheet 220
Parent Company Statement of Changes in Equity
221
Notes to the Parent Company financial statements
222
Glossary of terms: alternative performance measures
228
Five-year summary 230
INFO
RM
A P
LC A
NN
UA
L RE
PO
RT A
ND
AC
CO
UN
TS 2
02
0
147
FIN
AN
CIA
L S
TA
TE
ME
NT
SIN
FOR
MA
PLC
AN
NU
AL
RE
PO
RT
AN
D A
CC
OU
NT
S 2
02
0
14 6

C O N S O L I D A T E D S T A T E M E N T O F C O M P R E H E N S I V E I N C O M E F O R T H E Y E A R E N D E D 3 1 D E C E M B E R 2 0 2 0
C O N S O L I D A T E D S T A T E M E N T O F C H A N G E S I N E Q U I T Y F O R T H E Y E A R E N D E D 3 1 D E C E M B E R 2 0 2 0
Notes2020
£m2019
£m
(Loss)/profit for the year (1,037.6) 246.1
Items that will not be reclassified subsequently to profit or loss:
Remeasurement of the net retirement benefit pension obligation 34 (47.6) (1.6)
Tax credit relating to items that will not be reclassified to profit or loss 8.3 0.7
Total items that will not be reclassified subsequently to profit or loss (39.3) (0.9)
Items that have been reclassified subsequently to profit or loss:
Recycling of exchange gain arising on disposal of foreign operation – 1.2
Items that may be reclassified subsequently to profit or loss:
Exchange loss on translation of foreign operations (46.2) (233.5)
Exchange (loss)/gain on net investment hedge debt (13.0) 73.1
Loss on derivatives in net investment hedging relationships (42.0) (28.2)
(Loss)/gain on derivatives in cash flow hedging relationships (1.1) 3.8
Movement in cost of hedging reserve 1.3 3.2
Tax credit relating to items that may be reclassified subsequently to profit or loss 11.9 –
Total items that may be reclassified subsequently to profit or loss (89.1) (180.4)
Other comprehensive expense for the year (128.4) (181.3)
Total comprehensive (expense)/income for the year before initial application of IFRS 16 (1,166.0) 64.8
Effect of initial application of IFRS 16 that will not be reclassified subsequently to profit or loss – 4.1
Total comprehensive (expense)/income for the year (1,166.0) 68.9
Total comprehensive (expense)/income attributable to:
– Equity holders of the Company (1,169.8) 48.2
– Non-controlling interests 3.8 20.7
Share capital
£m
Share premium
account£m
Translationreserve
£m
Other reserves
£m
Retainedearnings
£mTotal
£m
Non- controlling
interests£m
Totalequity
£m
At 31 December 2018 1.3 905.3 63.3 1,974.5 2,933.8 5,878.2 193.4 6,071.6
Effect of initial application of IFRS 16 on 1 January 2019 – – – – 4.1 4.1 – 4.1
At 1 January 2019 as restated for initial application of IFRS 16 1.3 905.3 63.3 1,974.5 2,937.9 5,882.3 193.4 6,075.7
Profit for the year – – – – 225.5 225.5 20.6 246.1
Exchange loss on translation of foreign operations – – (233.6) – – (233.6) 0.1 (233.5)
Exchange gain on net investment hedge debt – – 73.1 – – 73.1 – 73.1
Loss arising on derivative hedges – – (21.2) – – (21.2) – (21.2)
Foreign exchange recycling of disposed entities – – 1.2 – – 1.2 – 1.2
Actuarial loss on defined benefit pension schemes – – – – (1.6) (1.6) – (1.6)
Tax relating to components of other comprehensive income – – – – 0.7 0.7 – 0.7
Total comprehensive (expense)/income for the year – – (180.5) – 224.6 44.1 20.7 64.8
Dividends to Shareholders – – – – (280.3) (280.3) – (280.3)
Dividends to non-controlling interests – – – – – – (17.5) (17.5)
Share award expense – – – 10.4 – 10.4 – 10.4
Issue of share capital – – – – – – – –
Own shares purchased – – – (15.9) – (15.9) – (15.9)
Transfer of vested LTIPs – – – (5.7) 5.7 – – –
Disposal of non-controlling interests – – – 1.3 – 1.3 (0.5) 0.8
At 31 December 2019 1.3 905.3 (117.2) 1,964.6 2,887.9 5,641.9 196.1 5,838.0Loss for the year – – – – (1,041.5) (1,041.5) 3.9 (1,037.6)Exchange gain on translation of foreign operations – – (46.1) – – (46.1) (0.1) (46.2)Exchange loss on net investment hedge debt – – (13.0) – – (13.0) – (13.0)Loss arising on derivative hedges – – (41.8) – – (41.8) – (41.8)Actuarial loss on defined benefit pension schemes – – – – (47.6) (47.6) – (47.6)Tax relating to components of other comprehensive income – – 11.9 – 8.3 20.2 – 20.2Total comprehensive (expense)/ income for the year – – (89.0) – (1,080.8) (1,169.8) 3.8 (1,166.0)Dividends to non-controlling interests – – – – – – (13.6) (13.6)Share award expense – – – 11.2 – 11.2 – 11.2Issue of share capital 0.2 973.5 – – – 973.7 – 973.7Own shares purchased – – – (1.3) – (1.3) – (1.3)Transfer of vested LTIPs – – – (4.9) 4.9 – – –Acquisition of non-controlling interest – – – – 9.3 9.3 (9.3) –At 31 December 2020 1.5 1,878.8 (206.2) 1,969.6 1,821.3 5,465.0 177.0 5,642.0
INFO
RM
A P
LC A
NN
UA
L R
EP
OR
T A
ND
AC
CO
UN
TS
20
20 IN
FOR
MA
PLC
AN
NU
AL R
EP
OR
T AN
D A
CC
OU
NT
S 20
20
14 8 149
FIN
AN
CIA
L S
TA
TE
ME
NT
S

C O N S O L I D A T E D B A L A N C E S H E E T A S A T 3 1 D E C E M B E R 2 0 2 0
Notes2020
£m20191
£m
Non-current assetsGoodwill 16 5,576.6 6,144.4Other intangible assets 17 3,094.5 3,437.4Property and equipment 19 49.1 69.0Right of use assets 38 209.9 264.4Investments in joint ventures and associates 20 20.0 19.8Other investments 20 7.3 10.1Deferred tax assets 22 8.4 6.7Retirement benefit surplus 34 – 4.9Finance lease receivables 38 6.4 13.0Other receivables 23 20.2 27.8Derivative financial instruments 24 44.6 3.9
9,037.0 10,001.4Current assetsInventory 25 31.3 38.5Trade and other receivables 23 358.1 476.1Current tax asset 4.9 8.9Cash and cash equivalents 28 299.4 195.1Finance lease receivables 38 1.5 2.3Derivative financial instruments – 1.0
695.2 721.9Total assets 9,732.2 10,723.3Current liabilitiesBorrowings 29 – (152.2)Lease liabilities 38 (33.4) (34.2)Derivative financial instruments 24 (0.2) (36.4)Current tax liabilities (78.0) (97.5)Provisions 30 (44.7) (35.0)Trade and other payables 31 (343.7) (482.8)Deferred income 31 (700.6) (746.5)
(1,200.6) (1,584.6)Non-current liabilitiesBorrowings 29 (2,093.2) (2,380.7)Lease liabilities (247.4) (282.4)Derivative financial instruments 24 (7.5) (22.4)Deferred tax liabilities 22 (406.4) (540.4)Retirement benefit obligation 34 (71.4) (35.0)Provisions 30 (44.8) (19.1)Trade and other payables 31 (16.2) (17.4)Deferred income 31 (2.7) (3.3)
(2,889.6) (3,300.7)Total liabilities (4,090.2) (4,885.3)Net assets 5,642.0 5,838.0Share capital 35 1.5 1.3Share premium account 35 1,878.8 905.3Translation reserve (206.2) (117.2)Other reserves 36 1,969.6 1,964.6Retained earnings 1,821.3 2,887.9Equity attributable to equity holders of the parent 5,465.0 5,641.9Non-controlling interest 177.0 196.1Total equity 5,642.0 5,838.0
1. Restated for updates to provisional acquisition accounting (see Note 4)
These financial statements were approved by the Board of Directors and authorised for issue on 22 April 2021 and were signed on its behalf by
Stephen A. Carter Gareth Wright Group Chief Executive Group Finance Director
C O N S O L I D A T E D C A S H F L O W S T A T E M E N T F O R T H E Y E A R E N D E D 3 1 D E C E M B E R 2 0 2 0
Notes2020
£m2019
£m
Operating activities
Cash generated by operations 33 153.1 958.5
Income taxes paid (32.9) (100.6)
Interest paid (259.7) (138.3)
Net cash (outflow)/inflow from operating activities (139.5) 719.6
Investing activities
Interest received 5.7 5.5
Purchase of property and equipment 19 (10.7) (17.5)
Purchase of intangible software assets 17 (23.8) (25.3)
Product development costs additions 17 (13.9) (7.0)
Purchase of intangibles related to titles, brands and customer relationships 17 (7.3) (59.4)
Acquisition of subsidiaries and operations, net of cash acquired 18 (77.3) (167.7)
Acquisition of investment 20 (0.9) (5.0)
Proceeds from disposal of subsidiaries and operations 10.4 179.3
Net cash outflow from investing activities (117.8) (97.1)
Financing activities
Dividends paid to Shareholders 14 (0.2) (280.0)
Dividends paid to non-controlling interests 14 (13.6) (17.5)
Proceeds from EMTN bond issuance 27 788.3 443.7
Repayment of loans 27 (61.3) (499.7)
New loan advances 27 – 41.2
Repayment of private placement borrowings 27 (1,227.8) (143.4)
Borrowing fees paid (17.6) (9.4)
Repayment of the principal lease liabilities 38 (37.1) (34.5)
Finance lease receipts 38 2.3 2.3
Acquisition of non-controlling interests 18 (44.9) (32.2)
Cash outflow from purchase of shares (1.3) (15.9)
Cash inflow from issue of shares 35 973.7 –
Net cash inflow/(outflow) from financing activities 360.5 (545.4)
Net increase in cash and cash equivalents 103.2 77.1
Effect of foreign exchange rate changes 1.1 (6.9)
Cash and cash equivalents at beginning of the year 28 195.1 124.9
Cash and cash equivalents at end of the year 28 299.4 195.1
INFO
RM
A P
LC A
NN
UA
L R
EP
OR
T A
ND
AC
CO
UN
TS
20
20 IN
FOR
MA
PLC
AN
NU
AL R
EP
OR
T AN
D A
CC
OU
NT
S 20
20
150 151
FIN
AN
CIA
L S
TA
TE
ME
NT
S

1. General informationInforma PLC (the Company) is a company incorporated in the United Kingdom under the Companies Act 2006 and is listed on the London Stock Exchange. The Company is a public company limited by shares and is registered in England and Wales with registration number 08860726. The address of the registered office is 5 Howick Place, London SW1P 1WG. The nature of the Group’s operations and its principal activities are set out in the Strategic Report on pages 4 to 93.
The Consolidated Financial Statements as at 31 December 2020 and for the year then ended comprise those of the Company and its subsidiaries and its interests in joint ventures and associates (together referred to as the Group).
These financial statements are presented in pounds sterling (GBP), which is the currency of the primary economic environment in which the Group operates and the functional currency of the Parent Company, Informa PLC. Foreign operations are included in accordance with the policies set out in Note 2.
2. Significant accounting policies Basis of accountingThe Consolidated Financial Statements have been prepared in accordance with international accounting standards in conformity with the Companies Act 20006 and International Financial Reporting Standards adopted pursuant to Regulation (EC) No 1606/2002 as it applies in the European Union.
The Directors have considered the Company’s ability to be a going concern over the assessment period to June 2022 based on the Group’s financial plan, a downside scenario and a reverse stress test case. The Group’s financial plan assumes physical events outside of Asia start to return from June 2021 and there is a slower recovery for physical events compared with GDP forecasts for the same period in those geographies. In this scenario, the Group maintains liquidity headroom of more than £1.3bn.
For the downside case, the Directors took the Group’s financial plan and also assumed the following:
• No indoor physical events are held until 2022 outside of the parts of the world where such events are already and currently operating
• A slower recovery of physical event-related businesses with lower levels of participants • Subscription-related revenues are affected by unfavourable market and macro-economic conditions, impacting revenues
and profit margins
In this scenario, the Group maintains liquidity headroom of more than £1.1bn.
For the reverse stress test, the Directors assessed the Group’s liquidity position if it had no gross profit between May 2021 and June 2022 and all physical event-related cash collected as at 31 March 2021 was refunded to customers. The Directors believe the assumptions applied in this reverse stress test are extremely remote, given that the Group’s subscription-led businesses continue to generate profit. However, in this test, the Group still maintains a minimum liquidity headroom of £0.2bn.
Based on these results, the Directors believe that the Group is well placed to manage its financing and other business risks satisfactorily. The Directors have been able to form a reasonable expectation that the Group has adequate resources to continue in operation for at least 12 months from the signing date of the Annual Report and Accounts, and therefore consider it appropriate to adopt the going concern basis of accounting in preparing the financial statements. Further detail is contained in the Strategic Report on page 80.
The Consolidated Financial Statements have been prepared on the historical cost basis, except for derivative financial instruments, pension assets, investments and a private placement loan which are measured at fair value. The principal accounting policies adopted are set out below, all of which have been consistently applied to all periods presented in the Consolidated Financial Statements.
The Group will take advantage of the audit exemption set out within section 479A of the Companies Act 2006 for the year ended 31 December 2020 for UK subsidiaries listed on page 226.
N O T E S T O T H E C O N S O L I D A T E D F I N A N C I A L S T A T E M E N T S F O R T H E Y E A R E N D E D 3 1 D E C E M B E R 2 0 2 0
Basis of consolidationThe Consolidated Financial Statements incorporate the accounts of the Company and all its subsidiaries. Control is achieved where the Company has the power to govern the financial and operating policies of an investee entity, has the rights to variable returns from its involvement with the investee and has the ability to use its power to affect its returns. The results of subsidiaries acquired or sold are included in the Consolidated Financial Statements from the effective date of acquisition or up to the effective date of disposal, as appropriate. Where necessary, adjustments are made to the results of acquired subsidiaries to bring their accounting policies into line with those used by other members of the Group.
All intra-Group transactions, balances, income and expenses are eliminated on consolidation. Non-controlling interests in the net assets of consolidated subsidiaries are identified separately from the Group’s equity and consist of the net assets of those interests at the date of the original business combination plus their share of changes in equity since that date.
Joint ventures are joint arrangements in which the Group has the rights to the net assets through joint control with a third party. Joint operations arise where there is the contractually agreed sharing of control of an arrangement, which exists only when decisions about the relevant activities require the unanimous consent of the parties sharing control, and where the joint operators have rights to the assets and obligations for the liabilities relating to the arrangement. Associates are undertakings over which the Group exercises significant influence, usually from 20%–50% of the equity voting rights, in respect of the financial and operating policies and is neither a subsidiary nor an interest in a joint venture.
The Group accounts for its interests in joint ventures and associates using the equity method. Under the equity method, the investment in the joint venture or associate is initially measured at cost. The carrying amount is adjusted to recognise changes in the Group’s share of profit or loss of the joint venture or associate since the acquisition date. The Income Statement reflects the Group’s share of the results of operations of the entity. The Statement of Comprehensive Income includes the Group’s share of any other comprehensive income recognised by the joint venture or associate. Dividend income is recognised when the right to receive the payment is established. Where an associate or joint venture has net liabilities, full provision is made for the Group’s share of liabilities where there is a constructive or legal obligation to provide additional funding to the associate or joint venture.
Foreign currenciesTransactions in currencies other than the entity’s functional currency are recorded at the rates of exchange prevailing on the dates of the transactions. Monetary assets and liabilities denominated in foreign currencies at the reporting date are retranslated at the rates ruling at that date. These translation differences are included in net operating expenses in the Consolidated Income Statement.
Non-monetary items carried at fair value that are denominated in foreign currencies are translated at the rates prevailing at the date when the fair value was determined. Non-monetary items that are measured in terms of historical cost in a foreign currency are not retranslated.
The balance sheet of foreign subsidiaries is translated into pounds sterling at the closing rates of exchange. The Income Statement results are translated at an average exchange rate, recalculated for each month at that month’s closing rate from the equivalent for the preceding month.
Foreign exchange differences arising from the translation of opening net investments in foreign subsidiaries at the closing rate are taken directly to the translation reserve. In addition, foreign exchange differences arising from retranslation of the foreign subsidiaries’ results from monthly average rate to closing rate are also taken directly to the Group’s translation reserve. Such translation differences are recognised in the Consolidated Income Statement in the financial year in which the operations are disposed. The translation movements on matched long-term foreign currency borrowings, qualifying as hedging instruments under IFRS 9 Financial Instruments, are also taken directly to the translation reserve.
Goodwill and fair value adjustments arising on the acquisition of a foreign entity are treated as assets and liabilities of the foreign entity and translated at the acquisition closing rate. This is then revalued at the year end rate with any foreign exchange difference taken directly to the translation reserve.
INFO
RM
A P
LC A
NN
UA
L R
EP
OR
T A
ND
AC
CO
UN
TS
20
20 IN
FOR
MA
PLC
AN
NU
AL R
EP
OR
T AN
D A
CC
OU
NT
S 20
20
152 153
FIN
AN
CIA
L S
TA
TE
ME
NT
S

N O T E S T O T H E C O N S O L I D A T E D F I N A N C I A L S T A T E M E N T S F O R T H E Y E A R E N D E D 3 1 D E C E M B E R 2 0 2 0 c o n t i n u e d
2. Significant accounting policies continued Business combinationsThe acquisition of subsidiaries and other asset purchases that are assessed as meeting the definition of a business under the rules of IFRS 3 Business Combinations are accounted for using the acquisition method. The consideration for each acquisition is measured at the aggregate of fair values of assets given, liabilities incurred or assumed, and equity instruments issued by the Group in exchange for control of the acquiree. If the accounting for business combinations involves provisional amounts, which are finalised in a subsequent reporting period during the 12-month measurement period as permitted under IFRS 3, restatement of these provisional amounts may be required in the subsequent reporting period. Acquisition and integration costs incurred are expensed and included in adjusting items in the Consolidated Income Statement.
If the business combination is achieved in stages, the acquisition-date fair value of the acquirer’s previously held equity interest in the acquiree is remeasured to fair value at the acquisition date through the Consolidated Income Statement.
Put option arrangements that allow non-controlling interest Shareholders to require the Group to purchase the non-controlling interest are treated as derivatives over equity instruments and are initially recognised at fair value within derivative financial liabilities, with a corresponding charge directly to equity. Interest rate swaps, forward exchange contracts, put options and other derivatives are classified as financial assets or financial liabilities at fair value through profit or loss and are measured at each reporting date at fair value. Changes in the fair values are included in profit or loss within financing income/expense unless the instrument has been designated as a hedging instrument.
Any contingent consideration to be transferred by the acquirer will be recognised at fair value at the acquisition date. Subsequent changes to the fair value of the contingent consideration, which is classified as a financial liability that is within the scope of IFRS 9, will be recognised in the Income Statement.
Goodwill is initially measured at cost, being the excess of the aggregate of the consideration transferred and the amount recognised for non-controlling interests over the net identifiable assets acquired and liabilities assumed. If this consideration is lower than the fair value of the net assets of the subsidiary acquired, the difference is recognised in the Income Statement. The Group recognises any non-controlling interest at the proportionate share of the acquiree’s identifiable net assets.
DisposalsAt the date of a disposal, or loss of control, joint control or significant influence over a subsidiary, joint venture or associate, the Group derecognises the assets and liabilities of the entity, with the carrying amount of any non-controlling interest and any cumulative translation differences recorded in equity. The fair value of consideration including the fair value of any investment retained is recognised. The consequent profit or loss on disposal that is not disclosed as a discontinued operation is recognised in profit and loss within ‘profit or loss on disposal of subsidiaries and operations’.
RevenueIFRS 15 Revenue from Contracts with Customers provides a single, principles-based, five-step model to be applied to all sales contracts. It is based on the transfer of control of goods and services to customers, and requires the identification and assessment of the satisfaction of delivery of each performance obligation in contracts in order to recognise revenue.
Where separate performance obligations are identified in a single contract, total revenue is allocated on the basis of relative stand-alone selling prices to each performance obligation, or management’s best estimate of relative value where stand-alone selling prices do not exist.
Revenue is measured at the fair value of consideration received or receivable and represents amounts receivable for goods and services provided in the normal course of business, net of discounts, VAT and other sales-related taxes, and provisions for returns and cancellations. Revenue for each category type of revenue is typically fixed at the date of the order and is not variable.
Payments received in advance of the satisfaction of a performance obligation are held as deferred income until the point at which the performance obligation is satisfied. Aside from an immaterial amount which is separately disclosed on the face of the balance sheet under non-current liabilities and relates to payment in advance received for biennial and triennial events and exhibitions, deferred income balances included in current liabilities at the year end reporting date will be recognised as revenue within 12 months. Therefore, the aggregate amount of the transaction price in respect of performance obligations that are unsatisfied at the year end reporting date is the deferred income balance which will be satisfied within one year.
Revenue type Performance obligations Revenue recognition accounting policy Timing of customer paymentsExhibitor and related services
Provision of services associated with exhibition and conference events, including virtual events.
Performance obligations are satisfied at the point of time that services are provided to the customer with revenue recognised when the event has taken place. In light of postponements due to COVID-19 the performance obligations and revenue recognition will align with the revised event dates.
Payments for events are normally received in advance of the event dates, which are typically up to 12 months in advance of the event date and are held as deferred income until the event date. In light of the COVID-19 situation, payments received may extend beyond 12 months before the event date where there have been postponements to events.
Subscriptions Provision of journals and online information services that are provided on a periodic basis or updated on a real-time basis.
Performance obligations are satisfied over time, with revenue recognised straight line over the period of the subscription.
Subscriptions payments are normally received in advance of the commencement of the subscription period which is typically a 12-month period and are held as deferred income.
Transactional sales Provision of books and specific publications in print or digital format.
Revenue is recognised at the point of time when control of the product is passed to the customer or the information service has been provided. Control is passed to the customer when the goods have been delivered to them.
Transactional sales to customers are typically on credit terms and customers pay accordingly to these terms.
Attendee revenue Provision of exhibition or conference events.
Performance obligations are satisfied at the point of time that the event is held, with attendee revenue recognised at this date.
Payments by attendees are normally received either in advance of the event date or at the event. In light of the COVID-19 situation, payments received may extend beyond 12 months before the event date where there have been postponements to events.
Marketing, advertising services and sponsorship
Provision of advertising, marketing services and event sponsorship.
Performance obligations are satisfied over the period of the advertising subscription or over the period when the marketing service is provided. Revenue relating to advertising or sponsorship at events is recognised on a point of time basis at the event date.
Payment for such services are normally received in advance of the marketing, advertising or sponsorship period.
Revenue relating to barter transactions is recorded at fair value and the timing of recognition is in line with the above. Expenses from barter transactions are recorded at fair value and recognised as incurred. Barter transactions typically involve the trading of show space or conference places in exchange for services provided at events or media advertising.
There are no material contract assets arising on work performed in order to deliver performance obligations. See Notes 5 and 6 for further details of revenue by type, business segment and geographic location.
Pension costs and pension scheme arrangementsCertain Group companies operate defined contribution pension schemes for colleagues. The assets of the schemes are held separately from the individual companies. The pension cost charge associated with these schemes represents contributions payable and is charged as an expense when incurred.
The Group also operates funded defined benefit schemes for colleagues. The cost of providing these benefits is determined using the Projected Unit Credit Method, with actuarial valuations being carried out at regular intervals. There is no service cost due to the fact that these schemes are closed to future accrual. Net interest is calculated by applying a discount rate to the opening net defined benefit liability or asset and is shown in finance costs, and the administration costs are shown as a component of operating expenses. Actuarial gains and losses are recognised in full in the period in which they occur, outside of the Consolidated Income Statement and in the Consolidated Statement of Comprehensive Income.
The retirement benefit obligation recognised in the Consolidated Balance Sheet represents the actual deficit or surplus in the Group’s defined benefit plans under IAS 19. Any surplus resulting from this calculation is limited to the present value of any economic benefits available in the form of refunds from the plans or reductions in future contributions to the plans.
INFO
RM
A P
LC A
NN
UA
L R
EP
OR
T A
ND
AC
CO
UN
TS
20
20 IN
FOR
MA
PLC
AN
NU
AL R
EP
OR
T AN
D A
CC
OU
NT
S 20
20
154 155
FIN
AN
CIA
L S
TA
TE
ME
NT
S

N O T E S T O T H E C O N S O L I D A T E D F I N A N C I A L S T A T E M E N T S F O R T H E Y E A R E N D E D 3 1 D E C E M B E R 2 0 2 0 c o n t i n u e d
Current and deferred tax are recognised in the Consolidated Income Statement, except when they relate to items that are recognised in other comprehensive income or directly in equity, in which case the current and deferred tax are also recognised in other comprehensive income or directly in equity respectively. Where current tax or deferred tax arises from the initial accounting for a business combination, the tax effect is included in the accounting for the business combination.
The Group is a multinational group with tax liabilities arising in many geographic locations. This inherently leads to complexity in the Group’s tax structure. Therefore, the calculation of the Group’s current tax liabilities and tax expense necessarily involves a degree of estimation and judgement in respect of items whose tax treatment cannot be finally determined until resolution has been reached with the relevant tax authority or, as appropriate, through a formal legal process. The resolution of issues is not always within the control of the Group and issues can, and often do, take many years to resolve.
Payments in respect of tax liabilities for an accounting period result from payments on account and on the final resolution of open items. As a result, there can be substantial differences between the tax charge in the Income Statement and tax payments. The final resolution of certain of these items may give rise to material profit and loss and/or cash flow variances. Any difference between expectations and the actual future liability is accounted for in the period identified.
GoodwillGoodwill arises from the acquisition of a subsidiary or business and is calculated as the excess of the purchase consideration over the fair value of identifiable assets and liabilities acquired at the date of acquisition. Goodwill also includes amounts corresponding to deferred tax liabilities recognised in respect of acquired intangible assets. It is recognised as an asset at cost, assessed for impairment at least annually and subsequently measured at cost less any accumulated impairment losses. Any impairment is recognised immediately in the Consolidated Income Statement and is not subsequently reversed. On disposal of a subsidiary or business, the attributable goodwill is included in the determination of the profit or loss on disposal. Fair value measurements are based on provisional estimates and may be subject to amendment within one year of the acquisition in line with IFRS 3 Business Combinations, resulting in an adjustment to goodwill.
Goodwill is tested for impairment annually, or more frequently when there is an indication that it may be impaired, at the segment level. This represents an aggregation of the CGUs and reflects the level at which goodwill is monitored in the business. At each reporting date, the Group reviews the composition of its CGUs to reflect the impact of changes to cash inflows associated with reorganisations of its management and reporting structure.
Where an impairment test is performed, the carrying value is compared with the recoverable amount which is the higher of the value in use and the fair value less costs to sell. Value in use is the present value of future cash flows and is calculated using a discounted cash flow analysis based on the cash flows of the CGU compared with the carrying value of that CGU, including goodwill. The Group estimates the discount rates as the risk-adjusted cost of capital for the particular CGU. If the recoverable amount of the CGU or group of CGUs is less than the carrying amount of the unit, the impairment loss is allocated first to reduce the carrying amount of any goodwill allocated to the unit and then to the other assets of the unit pro-rata on the basis of the carrying amount of each asset in the unit.
Intangible assetsIntangible assets are initially measured at cost. For intangible assets acquired in business combinations, cost is calculated based on the Group’s valuation methodologies. These assets are amortised over their estimated useful lives on a straight line basis, as follows:
Book lists 20 years1
Journal titles 20 years1
Brands and trademarks 5–30 yearsCustomer relationships databases and intellectual property 5–30 yearsSoftware 3–10 yearsProduct development 3–5 years
1. Or licence period if shorter
Software which is not integral to a related item of hardware is included in intangible assets. Capitalised internal-use software costs include external direct costs of materials and services consumed in developing or obtaining the software, and payroll and other direct costs for employees who devote substantial time to the project. Capitalisation of these costs ceases when the project is substantially complete and available for use. These costs are amortised on a straight line basis over their expected useful lives.
2. Significant accounting policies continuedShare-based paymentsThe Group issues equity-settled share-based payments to certain colleagues. These are measured at fair value at date of grant. An expense is recognised to spread the fair value of each award over the vesting period on a straight line basis, after allowing for an estimate of awards that will not vest. At each balance sheet date, the Group revises its estimate of the number of equity instruments expected to vest. The impact of the revision of the original estimates, if any, is recognised in the Income Statement such that the cumulative expense reflects the revised estimate.
For awards under the Long-Term Incentive Plan (LTIP), where the proportion of the award is dependent on the level of total shareholder return, the fair value is measured using a Monte Carlo model of valuation, which is considered to be the most appropriate valuation technique. The valuation takes into account factors such as non-transferability, exercise restrictions and behavioural considerations. Where the proportion of the award is dependent on earnings per share performance conditions, which are non-market-based measures, the fair value is remeasured at each reporting date to reflect updates for expected or actual performance. For awards issued under ShareMatch, the fair value is expensed on a straight line basis over the vesting period, based on the Group’s estimate of the number of shares that will eventually vest.
Own shares are deducted in arriving at total equity and represent the cost of the Company’s ordinary shares acquired by the Employee Share Trust (EST) and ShareMatch in connection with certain of the Group’s colleague share schemes.
Interest incomeInterest income is recognised on an accruals basis, by reference to the principal outstanding and at the effective interest rate applicable. Cash flows from interest income are included as part of investing activities in the Consolidated Cash Flow Statement
TaxationThe tax expense represents the sum of the current tax payable and deferred tax. Current tax is based on taxable profit for the year. Taxable profit differs from net profit as reported in the Consolidated Income Statement because it excludes items of income or expense that are taxable or deductible in other years and it further excludes items that are never taxable or deductible. The Group’s liability for current tax is calculated using tax rates that have been enacted or substantively enacted by the reporting date.
A current tax provision is recognised when the Group has a present obligation as a result of a past event and it is probable that the Group will be required to settle that obligation. The provision is the best estimate of the consideration required to settle the present obligation at the balance sheet date, taking into account the risks and uncertainties surrounding the obligation.
Deferred tax is the tax expected to be payable or recoverable on differences between the carrying amounts of assets and liabilities in the financial statements and the corresponding tax bases used in the computation of taxable profit, and is accounted for using the balance sheet liability method. Deferred tax liabilities are generally recognised for all taxable temporary differences and deferred tax assets are recognised to the extent that it is probable that taxable profits will be available against which deductible temporary differences can be utilised. Such assets and liabilities are not recognised if the temporary difference arises from the initial recognition of goodwill or from the initial recognition (other than in a business combination) of other assets and liabilities in a transaction that affects neither the tax nor accounting profit. To the extent that goodwill is tax deductible, where a taxable temporary difference arises from the subsequent tax deductible amounts, the associated deferred tax liability is recognised.
Deferred tax is calculated for all business combinations in respect of intangible assets and properties. A deferred tax liability is recognised to the extent that the fair value of the assets for accounting purposes exceeds the value of those assets for tax purposes and will form part of the associated goodwill on acquisition. Deferred tax liabilities are recognised for taxable temporary differences arising on investments in subsidiaries and associates except where the Group is able to control the reversal of the temporary difference and it is probable that the temporary difference will not reverse in the foreseeable future.
The carrying amount of deferred tax assets is reviewed at each reporting date and reduced to the extent that it is no longer probable that sufficient taxable profits will be available to allow all or part of the asset to be recovered. Deferred tax is calculated at the tax rates that are expected to apply in the period when the liability is settled or the asset is realised.
Deferred tax assets and liabilities are offset when there is a legally enforceable right to set off current tax assets against current tax liabilities and when they relate to income taxes levied by the same taxation authority and the Group intends to settle its current tax assets and liabilities on a net basis.
INFO
RM
A P
LC A
NN
UA
L R
EP
OR
T A
ND
AC
CO
UN
TS
20
20 IN
FOR
MA
PLC
AN
NU
AL R
EP
OR
T AN
D A
CC
OU
NT
S 20
20
156 157
FIN
AN
CIA
L S
TA
TE
ME
NT
S

N O T E S T O T H E C O N S O L I D A T E D F I N A N C I A L S T A T E M E N T S F O R T H E Y E A R E N D E D 3 1 D E C E M B E R 2 0 2 0 c o n t i n u e d
Discount rates are calculated on a lease by lease basis. For the majority of leases, the rate used is a portfolio rate, based on estimates of incremental borrowing costs. The portfolio of rates depends on the territory of the relevant lease, hence the currency used, and the weighted average lease term. As a result, reflecting the breadth of the Group’s lease portfolio, the transition approach adopted has required a level of judgement in selecting the most appropriate discount rate. For a small number of leases, the standard permits the adoption of a portfolio approach whereby a single group guarantee discount rate can be used for leases of a similar nature; therefore this practical expedient has been used where appropriate.
IFRS 16 defines the lease term as the non-cancellable period of a lease together with the options to extend or terminate a lease, if the lessee were reasonably certain to exercise that option. Where a lease includes the option for the Group to extend the lease term, the Group makes a judgement as to whether it is reasonably certain that the option will be taken and an assumed expiry date is determined. Where there are extension options on specific leases and the assumed expiry date is determined to have changed, the lease term is reassessed. This reassessment of the remaining life of the lease could result in a recalculation of the lease liability and the right of use asset and potentially result in a material adjustment to the associated balances of depreciation and finance lease interest.
The Group as lessorLeases for which the Group is a lessor are classified as finance or operating leases. Whenever the terms of the lease transfer substantially all the risks and rewards of ownership to the lessee, the contract is classified as a finance lease. All other leases are classified as operating leases.
When the Group is an intermediate lessor, it accounts for the head lease and the sub-lease as two separate contracts. The sub-lease is classified as a finance or operating lease by reference to the right of use asset arising from the head lease. Rental income from operating leases is recognised directly in the Consolidated Income Statement.
Amounts due from lessees under finance leases are recognised as finance lease receivables at the amount of the Group’s present value of the lease receipts. The finance lease receivable is subsequently measured by increasing the carrying amount to reflect interest on the finance lease receivable (using the discount rate used at commencement) and by reducing the carrying amount to reflect the lease payments received.
Impairment of tangible and intangible assetsAt each reporting date, the Group reviews the carrying amounts of its tangible and intangible assets to determine whether there is any indication that those assets have suffered an impairment loss. If any such indication exists, the recoverable amount of the asset is estimated in order to determine the extent of the impairment loss (if any). Where the asset does not generate cash flows that are independent from other assets, the Group estimates the recoverable amount of the CGU to which the asset belongs.
The recoverable amount is the higher of fair value less costs to sell and value in use. In assessing value in use, the estimated future cash flows are discounted to their present value using a pre-tax discount rate that reflects current market assessments of the time value of money and the risks specific to the asset, for which the estimates of future cash flows have not been adjusted.
If the recoverable amount of an asset (or CGU) is estimated to be less than its carrying amount, the carrying amount of the asset (or CGU) is reduced to its recoverable amount. An impairment loss is recognised as an expense immediately, unless the relevant asset is carried at a revalued amount, in which case the impairment loss is treated as a revaluation decrease.
Other investmentsOther investments are entities over which the Group does not have significant influence (typically where the Group holds less than 20% interest in the voting interests of the entity). Other investments are classified as assets held at fair value through profit and loss under IFRS 9, with changes in fair value reported in the Income Statement.
InventoryInventory is stated at the lower of cost and net realisable value. Cost comprises direct materials and expenses incurred in bringing the inventory to its present location and condition. Net realisable value represents the estimated selling price less marketing and distribution costs expected to be incurred. Pre-publication costs are included in inventory, representing costs incurred in the origination of content prior to publication. These are expensed systematically, reflecting the expected sales profile over the estimated economic lives of the related products (typically over four years).
Financial assetsFinancial assets are recognised in the Group’s Consolidated Balance Sheet when the Group becomes a party to the contractual provisions of the instrument.
2. Significant accounting policies continuedProduct development expenditure is capitalised as an intangible asset only if all of the certain conditions are met, with all research costs and other development expenditure being expensed when incurred. The capitalisation criteria are as follows:
• An asset is created that can be separately identified, and which the Group intends to use or sell• It is technically feasible to complete the development of the asset for use or sale• It is probable that the asset will generate future economic benefit• The development cost of the asset can be measured reliably
The expected useful lives of intangible assets are reviewed annually. The Group does not have any intangible assets with indefinite lives (excluding goodwill).
Property and equipmentProperty and equipment is recorded at cost less accumulated depreciation and provision for impairment. Depreciation is provided to write off the cost less the estimated residual value of property and equipment on a straight line basis over the estimated useful lives of the assets.
Freehold land is not depreciated. The rates of depreciation on other assets are as follows:
Freehold buildings 50 yearsLeasehold land and buildings including right of use assets Shorter of useful economic life or life of the leaseEquipment, fixtures and fittings 3–5 years
The gain or loss arising on the disposal or retirement of an asset is determined as the difference between the net sale proceeds and the carrying amount of the asset and is recognised in the Consolidated Income Statement.
LeasesThe Group as lesseeThe Group assesses whether a contract is or contains a lease at inception of the contract. The Group recognises a right of use asset and a corresponding lease liability with respect to all lease arrangements in which it is the lessee, except for short-term leases (defined as leases with a lease term of 12 months or less) and leases of low value assets (such as tablets and personal computers, small items of office furniture and telephones). For these leases, the Group recognises the lease payments as operating leases expensed directly to the Income Statement.
The lease liability is initially measured at the present value of the lease payments that are not paid at the commencement date, using the discount rate implicit with the lease. Where a discount rate is not implicit in the lease, we calculate an incremental borrowing rate reflecting the risk profile of the underlying asset and the term of the lease length. The lease liability is presented as a separate line in the Consolidated Balance Sheet. The lease liability is subsequently measured by increasing the carrying amount to reflect interest on the lease liability (using the discount rate used at commencement) and by reducing the carrying amount to reflect the lease payments made.
The Group remeasures the lease liability (and makes a corresponding adjustment to the related right of use asset) whenever:
• A lease contract is modified and the lease modification is not accounted for as a separate lease, in which case the lease liability is remeasured based on the lease term of the modified lease by discounting the revised lease payments using a revised discount rate at the effective date of the modification
• The lease payments change due to changes in an index or rate or a change in expected payments, in which cases the lease liability is remeasured by discounting the revised lease payments using a changed discount rate at the effective date of the modification
Right of use assets comprise the initial measurement of the corresponding lease liability, lease payments made at or before the commencement day, less any lease incentives received and vacant property provisions. They are subsequently measured at cost less accumulated depreciation and impairment losses. Right of use assets are depreciated over the expected lease term of the underlying asset. The depreciation starts at the commencement date of the lease. Right of use assets are presented as a separate line in the Consolidated Balance Sheet. The Group applies IAS 36 to assess whether a right of use asset is impaired and accounts for any identified impairment loss against the right of use asset.
IFRS 16 requires certain judgements and estimates to be made. The most significant of these relate to the discount rates used and the term of the lease life; however, these are not considered a critical accounting judgement or key source of estimation uncertainty.
INFO
RM
A P
LC A
NN
UA
L R
EP
OR
T A
ND
AC
CO
UN
TS
20
20 IN
FOR
MA
PLC
AN
NU
AL R
EP
OR
T AN
D A
CC
OU
NT
S 20
20
158 159
FIN
AN
CIA
L S
TA
TE
ME
NT
S

N O T E S T O T H E C O N S O L I D A T E D F I N A N C I A L S T A T E M E N T S F O R T H E Y E A R E N D E D 3 1 D E C E M B E R 2 0 2 0 c o n t i n u e d
2. Significant accounting policies continuedTrade and other receivablesTrade receivables and other receivables are measured on initial recognition at fair value, and are subsequently measured at amortised cost using the effective interest rate method, less any impairment. Further details on the Group’s loss allowance considerations can be found in Note 32(f).
Cash and cash equivalentsCash and cash equivalents comprise cash on hand and balances with banks and similar institutions. Cash equivalents comprise bank deposits and money market funds, which are readily convertible to known amounts of cash and have a maturity of three months or less and are subject to an insignificant risk of changes in value. Bank overdrafts that are repayable on demand and form an integral part of the Group’s cash management are included as a component of cash and cash equivalents for the purpose of the Consolidated Cash Flow Statement.
Impairment of financial assetsThe Group recognises lifetime expected credit losses (ECL) for trade receivables and lease receivables. The ECLs on these financial assets are estimated based on the Group’s historical credit loss experience, adjusted for factors that are specific to the debtors, general economic conditions and an assessment of both the current as well as the forecast direction of conditions at the reporting date, including time value of money where appropriate. The carrying amount is reduced by the ECL through the use of a provision account. When a trade receivable is considered uncollectible, it is written off against the provision account. Subsequent recoveries of amounts previously written off are credited against the provision account. Changes in the carrying amount of the provision are recognised in the Consolidated Income Statement.
For all other financial instruments, the Group recognises lifetime ECL when there has been a significant increase in credit risk since initial recognition. However, if the credit risk on the financial instrument has not increased significantly since initial recognition, the Group measures the loss allowance for that financial instrument at an amount equal to 12-month ECL.
Lifetime ECL represents the expected credit losses that will result from all possible default events over the expected life of a financial instrument. In contrast, 12-month ECL represents the portion of lifetime ECL that is expected to result from default events on a financial instrument that are possible within 12 months after the reporting date.
Financial liabilities and equity instruments issued by the GroupFinancial liabilities and equity instruments are classified according to the substance of the contractual arrangements entered into.
An equity instrument is any contract that evidences a residual interest in the assets of the Group after deducting all of its liabilities. Equity instruments issued by the Group are recorded at the proceeds received, net of direct issue costs.
BorrowingsInterest-bearing loans and overdrafts are recorded at the proceeds received, net of direct issue costs and stated at amortised cost using the effective interest rate method. The amortised cost calculation is revised when necessary to reflect changes in the expected cash flows and the expected life of the borrowings including the effects of the exercise of any prepayment, call or similar options. Any resulting adjustment to the carrying amount of the borrowings is recognised as finance costs in the Income Statement. Cash flows relating to finance costs are included in operating activities in the Consolidated Cash Flow Statement.
Net debtNet debt consists of cash and cash equivalents and includes bank overdrafts, borrowings, derivatives associated with debt instruments, finance leases and other loan receivables where these are interest bearing and do not relate to deferred consideration arrangements.
Debt issue costsDebt issue costs, including premia payable on settlement or redemption, are accounted for on an accrual basis in the Consolidated Income Statement using the effective interest rate method and are added to the carrying amount of the instrument to the extent that they are not settled in the period in which they arise.
Trade and other payablesTrade payables and other payables are initially measured at fair value, and are subsequently measured at amortised cost, using the effective interest rate method.
Other financial liabilitiesOther financial liabilities are initially measured at fair value, net of transaction costs. Other financial liabilities are subsequently measured at amortised cost using the effective interest rate method, as set out above, with interest expense recognised on an effective yield basis.
Derivative financial instruments and hedge accountingThe Group’s activities expose it primarily to the financial risks of changes in foreign currency exchange rates and interest rates. The derivative instruments utilised by the Group to hedge these exposures are interest rate swaps and cross currency swaps. The Group does not use derivative contracts for speculative purposes. Where an effective hedge is in place against changes in the fair value of borrowings, the hedged borrowings are adjusted for changes in fair value attributable to the risk being hedged with a corresponding income or expense included in the Income Statement within finance costs. The offsetting gains or losses from remeasuring the fair value of the related derivatives are also recognised in the Income Statement within finance costs.
Derivatives are initially recognised at fair value at the date a derivative contract is entered into and are subsequently remeasured to their fair value at each reporting date. The resulting gain or loss is recognised in profit or loss immediately unless the derivative is designated and effective as a hedging instrument, in which event the timing of the recognition in profit or loss depends on the nature of the hedge relationship. A derivative with a positive fair value is recognised as a financial asset whereas a derivative with a negative fair value is recognised as a financial liability. Derivatives are not offset in the financial statements unless the Group has both a legally enforceable right and intention to offset.
The Group designates certain derivatives as either:
• Hedges of a change of fair value of recognised assets and liabilities or firm commitments (fair value hedge)• Hedges of a particular risk associated with a recognised asset or liability or a highly probable forecast transaction
(cash flow hedge)• Hedges of a net investment in a foreign operation (net investment hedge)
The Group designates and documents at the inception of the transaction the relationship between hedging instruments and hedged items, as well as its risk management objectives and strategy for undertaking various hedging transactions. Furthermore, at the inception of the hedge and on an ongoing basis, the Group documents whether the hedging instrument is highly effective in offsetting changes in fair values or cash flows of the hedged item attributable to the hedged risk, which is when the hedging relationship meets all of the following hedge effectiveness requirements:
• There is an economic relationship between the hedged item and the hedging instrument • The effect of credit risk does not dominate the value changes that result from that economic relationship• The hedge ratio of the hedging relationship is the same as that resulting from the quantity of the hedged item that the Group
actually hedges and the quantity of the hedging instrument that the Group actually uses to hedge that quantity of hedged item
If a hedging relationship ceases to meet the hedge effectiveness requirement relating to the hedge ratio but the risk management objective for that designated hedging relationship remains the same, the Group adjusts the hedge ratio of the hedging relationship (i.e. rebalances the hedge) so that it meets the qualifying criteria again.
The Group elects to exclude foreign currency basis from the designation of the financial instrument, applying the cost of hedging approach. The amounts accumulated in the cost of hedging reserve is reclassified to profit or loss in line with the aligned hedged item.
Fair value hedgeChanges in the fair value of derivative financial instruments that are designated and qualify as fair value hedges are recorded in profit or loss immediately, together with any changes in the fair value of the hedged asset or liability that is attributable to the hedged risk. The change in the fair value of the hedging instrument and the change in the hedged item attributable to the hedged risk are recognised in the line of the Consolidated Income Statement relating to the hedged item.
INFO
RM
A P
LC A
NN
UA
L R
EP
OR
T A
ND
AC
CO
UN
TS
20
20 IN
FOR
MA
PLC
AN
NU
AL R
EP
OR
T AN
D A
CC
OU
NT
S 20
20
160 161
FIN
AN
CIA
L S
TA
TE
ME
NT
S

N O T E S T O T H E C O N S O L I D A T E D F I N A N C I A L S T A T E M E N T S F O R T H E Y E A R E N D E D 3 1 D E C E M B E R 2 0 2 0 c o n t i n u e d
2. Significant accounting policies continuedCash flow hedgeChanges in fair value of derivative financial instruments that are designated, and effective, cash flow hedges of forecast transactions are recognised in other comprehensive income, limited to the cumulative change in fair value of the hedged item from inception of the hedge. The gain or loss relating to the ineffective portion is recognised immediately in profit or loss. The cumulative amount recognised in other comprehensive income is reclassified into the Consolidated Income Statement out of other comprehensive income in the same period when the hedged item is recognised in profit or loss.
Hedges of net investment in foreign operationsHedges of net investment in foreign operations are accounted for similarly to cash flow hedges. Any gain or loss on the hedging instrument in relation to the effective portion of the hedge is recognised in other comprehensive income and accumulated in the foreign currency translation reserve. The gain or loss relating to the ineffective portion is recognised immediately in the Consolidated Income Statement. Gains and losses on the hedging instrument relating to the effective portion of the hedge accumulated in the foreign currency translation reserve are reclassified to profit or loss when the hedged item is disposed of.
Discontinuation of hedge accountingHedge accounting is discontinued when the hedge instrument expires or is sold, terminated or exercised, or no longer qualifies for hedge accounting; the discontinuation is accounted for prospectively. At that time, any cumulative gain or loss on the hedging instrument recognised in equity is retained in equity until the forecast transaction occurs. If a hedged transaction is no longer expected to occur, the net cumulative gain or loss recognised in equity is transferred to the Consolidated Income Statement in the period.
A derivative is presented as a non-current asset or a non-current liability if the remaining maturity of the instrument is more than 12 months and it is not expected to be realised or settled within 12 months. Other derivatives are presented as current assets or current liabilities. Further details of derivative financial instruments are disclosed in Notes 24 and 32.
ProvisionsProvisions are recognised when the Group has a present obligation (legal or constructive) as a result of a past event, and it is probable that the Group will be required to settle that obligation. Provisions are measured at the Directors’ best estimate of the expenditure required to settle the obligation at the reporting date, and are discounted to present value where the effect is material. Any difference between the amounts previously recognised and the current estimates is recognised immediately in the Consolidated Income Statement.
Restructuring provisions are recognised when the Group has a detailed formal plan for the restructuring that has been communicated to the affected parties or implementation has commenced.
Alternative performance measuresIn addition to the statutory results, adjusted results are prepared for the Income Statement, including adjusted operating profit and adjusted diluted earnings per share, as the Board considers these non-GAAP measures to be a useful and alternative way to measure the Group’s performance in a way that is comparable to the prior year. See the glossary on page 228 for definitions of non-GAAP measures, which includes adjusted measures shown in Notes 8 and 15.
Adoption of new and revised International Financial Reporting Standards (IFRSs)Standards and interpretations adopted in the current yearThe following amendments have been adopted in the current year:
• Amendment to IFRS 16 Leases: Covid-19-Related Rent Concessions • Amendments to IFRS 3 Business Combinations: Definition of a Business • Amendments to IFRS 9, IAS 39 and IFRS 7: Interest Rate Benchmark Reform • Amendments to IAS 1 and IAS 8: Definition of Material • Amendments to References to the Conceptual Framework in IFRS Standards
The adoption of these amendments has not led to any changes to the Group’s accounting policies or had any material impact on the financial position or performance of the Group. Other amendments and interpretations to IFRSs effective for the period ended 31 December 2020 have had no impact on the Group.
3. Critical accounting judgements and key sources of estimation uncertaintyIn the application of the Group’s accounting policies, which are described in Note 2, the Directors are required to make judgements, estimates and assumptions about the carrying amounts of assets and liabilities that are not readily apparent from other sources. The estimates and associated assumptions are based on historical experience and other factors that are considered to be relevant. Actual results may differ from these estimates.
Critical accounting judgementsIn addition to the judgement taken by the Group in selecting and applying the accounting policies set out above, the Directors have made the following judgements concerning the amounts recognised in the Consolidated Financial Statements.
Identification of adjusting itemsThe Group provides adjusted results and underlying measures in addition to statutory measures, in order to provide additional useful information on business performance trends to Shareholders. The Board considers these non-GAAP measures as the most appropriate way to measure the Group’s performance because it aids comparability to the prior year and is also in line with the similarly adjusted measures used by peers and therefore facilitates comparison.
The terms ‘adjusted’ and ‘underlying’ are not defined terms under IFRS and may not therefore be comparable with similarly-titled measurements reported by other companies. Management is therefore required to exercise its judgement in appropriately identifying and describing these items. These measures are not intended to be a substitute for, or superior to, IFRS measurements. In 2020, management has exercised judgement on the classification of items in relation to COVID-19, in particular onerous contract costs and other one-off costs associated with COVID-19.
The Financial Review provides reconciliations of alternative performance measures (APMs) to statutory measures and also provides the basis of calculation for certain APM metrics. These APMs are provided on a consistent basis with the prior year.
Identification of CGUsFor impairment testing purposes, judgement is used to allocate goodwill to the specific groups of CGUs that have benefited and are expected to benefit from this goodwill. When there are changes in business structure, judgement is required to identify any changes to the CGU groups, taking account of the lowest level of independent cash inflows being generated, amongst other factors. CGU groups are based on business segments as defined in Note 6.
Estimation uncertaintyAs at the year ended 31 December 2019, the Group noted two key sources of estimation uncertainty in relation to contingent consideration and measurement of retirement obligations. For contingent consideration, due to cash disbursements and the natural progression on these time limited consideration payments, the estimate in this regard has become less material, so management no longer views this to be a key source of estimation uncertainty at 31 December 2020. Further details of this can be found in Note 30. Retirement benefit obligations remain significant at 31 December 2020, and as such are discussed as a key source of estimation uncertainty in detail below. An additional key source of estimation uncertainty was identified relating to the cash flow forecasts for the impairment assessment of goodwill.
Judgements and estimates associated with the impairment assessmentFor the impairment review, management has estimated future cash flows for the Group. This is based on projected operating profits, future long-term growth rates and discount rates. Management views the key source of estimation uncertainty to be around future operating profits, with uncertainty relating to the depth of the economic impact from COVID-19, and the speed of any subsequent recovery, alongside variability in the recovery across the geographies in which the Group operates. Management’s approach for establishing these assumptions has been detailed in Note 16. Details of the impact of any uncertainties associated with the impairment assessment are provided in Note 16. Management has also made critical judgements relating to the weighted average cost of capital (WACC) rate and long-term growth rate (LTGR). The method for establishing these assumptions are detailed in the goodwill note (Note 16).
At 31 December 2020, the business forecast is subject to higher levels of uncertainty compared with prior years given the impact of COVID-19 on our event-led businesses. This drives increased uncertainty when considering future cash flow forecasts, as the shorter- and longer-term impacts of COVID-19 evolve. Operationally, this uncertainty relates to future COVID-19 containment policies, such as travel restrictions or limitations on physical events, the extent of the economic impact alongside the speed of the future recovery, delayed recovery to business confidence and variability in each of these factors across the various geographies the Group operates within. In our impairment assessment, management has considered these uncertainties whilst making the above key assumptions.
INFO
RM
A P
LC A
NN
UA
L R
EP
OR
T A
ND
AC
CO
UN
TS
20
20 IN
FOR
MA
PLC
AN
NU
AL R
EP
OR
T AN
D A
CC
OU
NT
S 20
20
162 163
FIN
AN
CIA
L S
TA
TE
ME
NT
S

N O T E S T O T H E C O N S O L I D A T E D F I N A N C I A L S T A T E M E N T S F O R T H E Y E A R E N D E D 3 1 D E C E M B E R 2 0 2 0 c o n t i n u e d
3. Critical accounting judgements and key sources of estimation uncertainty continuedMeasurement of retirement benefit obligationsThe measurement of the retirement benefit obligation and surplus involve the use of a number of assumptions. The most significant of these relate to the discount rate, the rate of increase in pension and mortality assumptions. The most significant scheme is the UBM Pension Scheme (UBMPS). Note 34 details the principal assumptions which have been adopted following advice received from independent actuaries and also provides sensitivity analysis with regard to changes to these assumptions. As at 31 December 2020, the Group had a total pension liability of £786.8m (31 December 2019: £730.8m), and a net pension deficit of £71.4m (31 December 2019: £30.1m).
4. RestatementFair value restatement Finalisation of the acquisition balance sheet of Centre for Asia Pacific Aviation Pty Ltd (CAPA)In 2020 the Group completed the IFRS 3 fair value exercise in relation to the acquisition of CAPA within the 12-month remeasurement period from the acquisition date. This has resulted in the following restatements to the balance sheet as at 31 December 2019, with no impact to the Income Statement for the year ended 31 December 2019:
• An increase of £0.7m in provisions and a corresponding increase in goodwill • Increase in accruals of £0.1m and a corresponding increase in goodwill• Impairment of £0.2m in fixed assets and a corresponding increase in goodwill
Fair value restatements to the acquisition balance sheet of the TMT Research and Intelligence portfolio from IHS Markit (TMT)An update to the provisional fair value 1 August 2019 acquisition balance sheet of TMT has resulted in the following restatements to the balance sheet as at 31 December 2019, with no impact on the Income Statement for the year ended 31 December 2019:
• A reduction in trade receivables of £0.3m, with a corresponding increase in goodwill
Restatement of EPS and dividends per share due to discount on the share placementOn 15 April 2020 the Company announced a share placement of 250,318,000 new ordinary shares, representing approximately 19.99% of the Company’s existing issued share capital. 125,159,000 new ordinary shares were issued on 20 April 2020 and a further 125,159,000 on 5 May 2020. The share placement price was 400p per share and represented a discount of 4% to the closing share price of 416.8p on 15 April 2020. The gross proceeds raised through the placement were £1,001.3m. The issue of shares at a discount required the restatement of prior years’ weighted average number of shares, earnings per share and dividends per share.
Year ended 31 December 2019
(Restated)
Year ended 31 December 2019
(as previously reported)
Basic EPS (p) 17.9 18.0Diluted EPS (p) 17.8 18.0Adjusted basic EPS (p) 51.2 51.5Adjusted diluted EPS (p) 51.0 51.3Weighted average number of shares used in basic EPS calculation 1,259,117,620 1,250,660,231Weighted average number of shares used in diluted EPS calculation 1,264,230,940 1,255,739,205Dividends per share (p) 7.50 7.55
Restatement of 2019 operating segments and revenue by typeThe operating segments results for the year ended 31 December 2020 were restated to reflect moves of certain businesses between operating segments with no impact on reported total income statement results.
2019 revenue by type disclosure has been restated to align revenue types with 2020 following the refinement to the classification. See Note 5 for restated amounts and amounts previously reported.
5. RevenueAn analysis of the Group’s revenue by type is as follows; refer to accounting policy in Note 2 on revenue for an explanation of the nature of revenue types, their timing and related expected cash flows and any uncertainties and significant payment terms.
Year ended 31 December 2020
Informa Markets
£m
Informa Connect
£m
Informa Tech
£m
Informa Intelligence
£m
Taylor & Francis
£mTotal
£m
Exhibitor 359.1 21.6 12.2 – – 392.9Subscriptions 26.1 1.6 59.3 279.4 316.2 682.6Transactional sales 12.9 4.1 30.5 13.1 239.2 299.8Attendee 26.7 54.7 17.3 0.2 – 98.9Marketing and advertising services 77.1 14.7 21.0 11.7 0.6 125.1Sponsorship 22.5 27.5 10.6 0.9 – 61.5Total 524.4 124.2 150.9 305.3 556.0 1,660.8
Year ended 31 December 20191
Informa Markets
£m
Informa Connect
£m
InformaTech
£m
Informa Intelligence
£m
Taylor & Francis
£mTotal
£m
Exhibitor 1,140.8 58.6 64.8 0.5 – 1,264.7
Subscriptions 23.9 2.0 38.2 293.9 302.0 660.0
Transactional sales 12.7 5.7 23.0 18.7 256.7 316.8
Attendee 80.7 138.7 76.8 2.0 – 298.2
Marketing and advertising services 101.2 21.1 16.8 33.0 0.9 173.0
Sponsorship 78.4 60.0 36.6 2.6 – 177.6
Total 1,437.7 286.1 256.2 350.7 559.6 2,890.3
1. Restated for restructure of operating segments and alignment of revenue types across the Group (see Note 4). Previously reported revenue is detailed below
Previously reported year ended 31 December 2019
Informa Markets
£m
Informa Connect
£m
InformaTech
£m
Informa Intelligence
£m
Taylor & Francis
£mTotal
£m
Exhibitor 1,213.6 53.6 71.2 – – 1,338.4
Subscriptions – – 42.0 296.0 302.5 640.5
Transactional sales – – – 18.9 257.1 276.0
Attendee 71.2 142.3 84.3 – – 297.8
Marketing and advertising services 91.5 21.4 18.5 33.8 – 165.2
Sponsorship 73.9 58.3 40.2 – – 172.4
Total 1,450.2 275.6 256.2 348.7 559.6 2,890.3
6. Business segmentsThe Group has identified reportable segments based on financial information used by the Directors in allocating resources and making strategic decisions. We consider the chief operating decision maker to be the Executive Directors.
The Group’s five identified reportable segments under IFRS 8 Operating Segments are as described in the Strategic Report. There is no difference between the Group’s operating segments and the Group’s reportable segments.
INFO
RM
A P
LC A
NN
UA
L R
EP
OR
T A
ND
AC
CO
UN
TS
20
20 IN
FOR
MA
PLC
AN
NU
AL R
EP
OR
T AN
D A
CC
OU
NT
S 20
20
16 4 165
FIN
AN
CIA
L S
TA
TE
ME
NT
S

N O T E S T O T H E C O N S O L I D A T E D F I N A N C I A L S T A T E M E N T S F O R T H E Y E A R E N D E D 3 1 D E C E M B E R 2 0 2 0 c o n t i n u e d
6. Business segments continuedSegment revenue and resultsThe Group’s primary internal Income Statement performance measures for business segments are revenue and adjusted operating profit. A reconciliation of adjusted operating profit to statutory operating profit and profit before tax is provided below:
Year ended 31 December 2020
Informa Markets
£m
Informa Connect
£m
Informa Tech
£m
Informa Intelligence
£m
Taylor & Francis
£mTotal
£m
Revenue 524.4 124.2 150.9 305.3 556.0 1,660.8Adjusted operating (loss)/profit before joint ventures and associates1 (26.1) (24.0) (1.9) 103.0 216.0 267.0Share of adjusted results of joint ventures and associates (Note 20) 0.4 0.4 – – – 0.8Adjusted operating (loss)/profit (25.7) (23.6) (1.9) 103.0 216.0 267.8Intangible asset amortisation (Note 17)2 (185.7) (16.8) (20.7) (16.6) (52.0) (291.8)Impairment – goodwill (Note 16) (231.1) (105.9) (255.9) – – (592.9)Impairment – acquisition-related intangibles (24.1) (4.5) (6.2) (2.7) (1.0) (38.5)Impairment – IFRS 16 right of use assets (15.0) (5.3) (2.5) (7.0) (6.3) (36.1)Impairment – property and equipment (4.2) (1.3) (0.8) (1.0) (1.5) (8.8)Impairment – external investments – (2.5) – (1.4) – (3.9)Acquisition and integration costs (Note 8) (24.9) (1.6) (17.3) (4.3) (1.0) (49.1)Restructuring and reorganisation costs (Note 8) (39.5) (11.7) (11.8) (6.5) (8.1) (77.6)Onerous contracts and one-off costs associated with COVID-19 (Note 8) (46.3) (3.3) (2.9) (0.1) – (52.6)Subsequent remeasurement of contingent consideration (Note 8) (0.9) 0.7 3.3 – – 3.1Operating (loss)/profit (597.4) (175.8) (316.7) 63.4 146.1 (880.4)Loss on disposal of businesses (Note 21) (8.4)Finance income (Note 11) 15.3Finance costs (Note 12) (266.2)Loss before tax (1,139.7)
1. Adjusted operating profit before joint ventures and associates included the following amounts for depreciation and other amortisation: £38.8m for Informa Markets, £8.2m for Informa Connect, £19.2m for Informa Intelligence, £3.7m for Informa Tech and £18.3m for Taylor & Francis
2. Excludes acquired intangible product development and software amortisation
Year ended 31 December 2019 (restated)3
Informa Markets
£m
Informa Connect
£m
Informa Tech
£m
Informa Intelligence
£m
Taylor & Francis
£mTotal
£m
Revenue 1,437.7 286.1 256.2 350.7 559.6 2,890.3
Adjusted operating profit before joint ventures and associates1 489.2 46.5 71.4 107.3 217.2 931.6
Share of adjusted results of joint ventures and associates (Note 20) 1.4 0.1 – – – 1.5
Adjusted operating profit 490.6 46.6 71.4 107.3 217.2 933.1
Intangible asset amortisation (Note 17)2 (197.6) (17.9) (21.7) (23.2) (52.0) (312.4)
Impairment – goodwill (0.9) – – – – (0.9)
Impairment – acquisition-related intangibles (3.8) – – – – (3.8)
Impairment – IFRS 16 right of use assets (1.4) – – (0.9) (2.3) (4.6)
Acquisition and integration costs (Note 8) (39.3) (4.6) (12.2) (3.3) (0.3) (59.7)
Restructuring and reorganisation costs (Note 8) (3.0) (0.2) (0.6) (4.8) – (8.6)
Subsequent remeasurement of contingent consideration (Note 8) 1.6 (1.7) – (3.1) – (3.2)
VAT charges (Note 8) (1.8) – – – – (1.8)
Operating profit 244.4 22.2 36.9 72.0 162.6 538.1
Loss on disposal of businesses (Note 21) (95.4)
Finance income (Note 11) 10.1
Finance costs (Note 12) (134.1)
Profit before tax 318.7
1. Adjusted operating profit before joint ventures and associates included the following amounts for depreciation and other amortisation: £37.0m for Informa Markets, £9.2m for Informa Connect, £23.1m for Informa Intelligence, £3.7m for Informa Tech and £19.2m for Taylor & Francis
2. Excludes acquired intangible product development and software amortisation
3. Restated for restructure of operating segments (see Note 4)
The accounting policies of the reportable segments are the same as the Group’s accounting policies described in Note 2. Adjusted operating results by operating segment is the measure reported to the Directors for the purpose of resource allocation and assessment of segment performance. Finance costs and finance income are not allocated to segments, as this type of activity is driven by the central Treasury function, which manages the cash positions of the Group.
Segment assets
31 December2020
£m
31December20191
£m
Informa Markets 6,155.1 6,737.6
Informa Connect 487.1 684.5
Informa Tech 770.1 1,089.3
Informa Intelligence 992.7 980.9
Taylor & Francis 967.0 1,007.3
Total segment assets 9,372.0 10,499.6
Unallocated assets 360.2 223.7
Total assets 9,732.2 10,723.3
1. Restated for updates to provisional acquisition accounting (see Note 4)
For the purpose of monitoring segment performance and allocating resources between segments, the Group monitors the non-current tangible, intangible and financial assets attributable to each segment. All assets are allocated to reportable segments except for certain centrally held balances, including cash, some intangible software assets relating to Group infrastructure, balances receivable from businesses sold and taxation (current and deferred). Assets used jointly by reportable segments are allocated on the basis of the revenues earned by individual reportable segments.
Geographic informationThe Group’s revenue by location of customer and information about its segment assets by geographic location are detailed below:
Revenue Segment non-current assets1
2020£m
2019£m
2020£m
20192
£m
UK 138.9 203.2 2,278.3 2,493.8
Continental Europe 174.3 338.7 1,019.2 1,042.1
North America 846.3 1,357.8 3,766.8 4,392.3
China 213.6 405.4 1,740.7 1,862.4
Rest of world 287.7 585.2 179.0 195.3
1,660.8 2,890.3 8,984.0 9,985.9
1. Non-current amounts exclude financial instruments, deferred tax assets and retirement benefit surplus
2. Restated for updates to provisional acquisition accounting (see Note 4)
No individual customer contributed more than 10% of the Group’s revenue in either 2020 or 2019.
INFO
RM
A P
LC A
NN
UA
L R
EP
OR
T A
ND
AC
CO
UN
TS
20
20 IN
FOR
MA
PLC
AN
NU
AL R
EP
OR
T AN
D A
CC
OU
NT
S 20
20
166 167
FIN
AN
CIA
L S
TA
TE
ME
NT
S

N O T E S T O T H E C O N S O L I D A T E D F I N A N C I A L S T A T E M E N T S F O R T H E Y E A R E N D E D 3 1 D E C E M B E R 2 0 2 0 c o n t i n u e d
7. Operating profitOperating profit has been arrived at after charging/(crediting):
Notes
Adjusted results
2020£m
Adjusting items 2020
£m
Statutory results
2020£m
Adjusted results
2019£m
Adjusting items 2019
£m
Statutory results
2019£m
Cost of sales 527.3 – 527.3 981.3 – 981.3
Staff costs (excluding adjusting items) 9 634.8 – 634.8 692.8 – 692.8
Amortisation of other intangible assets 17 41.1 291.8 332.9 41.9 312.4 354.3
Impairment – goodwill 8 – 592.9 592.9 – 0.9 0.9
Impairment – acquisition-related intangibles 8 – 38.5 38.5 – 3.8 3.8
Impairment – IFRS 16 right of use assets 8 – 36.1 36.1 – 4.6 4.6
Impairment – property and equipment 19 – 8.8 8.8 – – –
Impairment – investments 8 – 3.9 3.9 – – –
Depreciation – property and equipment 19 16.8 – 16.8 17.2 – 17.2
Depreciation – IFRS 16 right of use assets 38 30.3 – 30.3 33.1 – 33.1
Acquisition-related costs 8 – 2.8 2.8 – 3.3 3.3
Integration-related costs 8 – 46.3 46.3 – 56.4 56.4
Restructuring and reorganisation costs 8 – 77.6 77.6 – 8.6 8.6
Onerous contracts and one-off costs associated with COVID-19 8 – 52.6 52.6 – – –
Subsequent remeasurement of contingent consideration 8 – (3.1) (3.1) – 3.2 3.2
VAT charges 8 – – – – 1.8 1.8
Net foreign exchange gain (3.1) – (3.1) (9.3) – (9.3)
Auditor’s remuneration for audit services 3.2 – 3.2 3.4 – 3.4
Other operating expenses 143.4 – 143.4 198.3 – 198.3
Total net operating expenses before share of joint ventures and associates 1,393.8 1,148.2 2,542.0 1,958.7 395.0 2,353.7
Amounts payable to the auditor, Deloitte LLP, and its associates by the Company and its subsidiary undertakings are provided below:
2020£m
2019£m
Fees payable to the Company’s auditor for the audit of the Company’s annual financial statements 2.3 2.5
Fees payable to the Company’s auditor and its associates for other services to the Group:
Audit of the Company’s subsidiaries 0.9 0.9
Total audit fees 3.2 3.4
Fees payable to the Company’s auditor for non-audit services comprises:
Half-year review 0.3 0.2
Other services 0.2 0.1
Total non-audit fees 0.5 0.3
Fees payable to Deloitte LLP and its associates for non-audit services to the Company are included in the consolidated disclosures above.
The Audit Committee approves all non-audit services within the Company’s policy. The Committee considers that certain non-audit services should be provided by the external auditor, because its existing knowledge of the business makes this the most efficient and effective way for those non-audit services to be carried out, and does not consider the provision of such services to impact the independence of the external auditor. In 2020 the non-audit fees paid to Deloitte totalled £0.5m (2019: £0.3m), which represented 16% (2019: 9%) of the 2020 audit fee, with £0.3m relating to the half-year review.
A description of the work of the Audit Committee is set out in the Corporate Governance Statement on pages 110 to 115 and includes an explanation of how auditor objectivity and independence is safeguarded when non-audit services are provided by the auditor. No services were provided under contingent fee arrangements.
8. Adjusting itemsThe Board considers certain items should be recognised as adjusting items (see glossary on page 228) since, due to their nature or infrequency, such presentation is relevant to an understanding of the Group’s performance. These items do not relate to the Group’s underlying trading and are adjusted from the Group’s adjusted operating profit measure. The following charges/(credits) are presented as adjusting items:
Notes2020
£m2019
£m
Intangible amortisation and impairment
Intangible asset amortisation 17 291.8 312.4
Impairment – goodwill 16 592.9 0.9
Impairment – acquisition-related intangible assets 17 38.5 3.8
Impairment – IFRS 16 right of use assets 38 36.1 4.6
Impairment – property and equipment 8.8 –
Impairment – investments 3.9 –
Acquisition costs 2.8 3.3
Integration costs 46.3 56.4
Restructuring and reorganisation costs
Redundancy and reorganisation costs 47.6 6.4
Vacant property and finance lease modification costs 30.0 2.2
Onerous contracts associated with COVID-19 47.3 –
Other one-off costs associated with COVID-19 5.3 –
Subsequent remeasurement of contingent consideration (3.1) 3.2
VAT charges – 1.8
Adjusting items in operating loss/profit 1,148.2 395.0
Loss on disposal of subsidiaries and operations 21 8.4 95.4
Finance income 11 (8.3) (1.2)
Finance costs 12 161.8 13.5
Adjusting items in loss/profit before tax 1,310.1 502.7
Tax related to adjusting items 13 (127.7) (83.5)
Adjusting items in loss/profit for the year 1,182.4 419.2
The principal adjusting items are in respect of the following:
• Intangible asset amortisation – the amortisation charges in respect of intangible assets acquired through business combinations or the acquisition of trade and assets
• Impairment – the Group tests for impairment on an annual basis or more frequently when an indicator exists. Impairment charges are separately disclosed and are excluded from adjusted results. Note 16 provides details of the impairment of goodwill
• Impairment of right of use assets relate to the permanent closure of a number of office properties in 2020• Acquisition costs are the costs and fees incurred by the Group in acquiring businesses • Integration costs are the costs incurred by the Group in integrating share and asset acquisitions and included £27.5m relating
to the integration of UBM• Restructuring and reorganisation costs are incurred by the Group in business restructuring and operating model changes
and in 2020 this included voluntary and targeted redundancy programmes• Vacant property and finance lease modification costs arose from the permanent closure of office properties in 2020• Onerous contracts associated with COVID-19 relate to onerous contract costs for events which have been cancelled
or postponed and the costs cannot be recovered. The costs largely relate to venue, marketing and event set-up costs• Other one-off costs associated with COVID-19 are the one-off indirect cost incurred as a result of COVID-19, largely relating
to a contractual commitment to the owner of an event that was cancelled• Subsequent remeasurement of contingent consideration is recognised in the year as a charge or credit to the Consolidated
Income Statement unless qualifying as a measurement period adjustment arising within one year from the acquisition date• VAT charges related to an increase of the existing provisions for VAT penalties relating to the UAE which the Group is disputing • Loss on disposal of subsidiaries and operations – the loss on disposal primarily relates to the impairment of loan
note receivables• Finance income reflects the fair value movement on an acquisition put option• Finance costs relate to the one-off costs in relation to the issue of EMTNs and repayment of the Group’s US private placements
in 2020• The tax items relate to the tax effect on the items above and adjusting tax items which are analysed in Note 13
INFO
RM
A P
LC A
NN
UA
L R
EP
OR
T A
ND
AC
CO
UN
TS
20
20 IN
FOR
MA
PLC
AN
NU
AL R
EP
OR
T AN
D A
CC
OU
NT
S 20
20
168 169
FIN
AN
CIA
L S
TA
TE
ME
NT
S

N O T E S T O T H E C O N S O L I D A T E D F I N A N C I A L S T A T E M E N T S F O R T H E Y E A R E N D E D 3 1 D E C E M B E R 2 0 2 0 c o n t i n u e d
9. Staff numbers and costsThe monthly average number of persons employed by the Group (including Directors) during the year, analysed by segment, was as follows:
Average Number of employees
2020 2019
Informa Markets 4,730 5,042
Informa Connect 1,189 1,200
Informa Tech 1,129 921
Informa Intelligence 1,579 1,841
Taylor & Francis 2,318 2,170
Total 10,945 11,174
Their aggregate remuneration comprised:
2020£m
2019£m
Wages and salaries 553.8 605.6
Social security costs 47.6 54.6
Pension costs associated with staff charged to operating profit (Note 34) 21.6 21.8
Share-based payments (Note 10) 11.8 10.8
Staff costs (excluding adjusting items) 634.8 692.8
Redundancy costs 45.7 5.7
680.5 698.5
The remuneration of the Directors, who are the key management personnel of the Group, is set out below in aggregate for each of the categories specified in IAS 24 Related Party Disclosures (Note 39). Further information about the remuneration of individual Directors is provided in the audited part of the Remuneration Report on pages 120 to 128.
2020£m
2019£m
Short-term employee benefits 2.1 3.9
Post-employment benefits 0.3 0.3
Share-based payments 1.7 2.0
4.1 6.2
10. Share-based paymentsThe Group recognised total expenses of £11.8m (2019: £10.8m) relating to share-based payment costs in the year ended 31 December 2020 with £10.1m (2019: £9.4m) relating to equity-settled LTIPs, £1.1m (2019: £1.0m) relating to equity-settled ShareMatch and £0.6m (2019: £0.4m) relating to Employee Share Purchase Plan (ESPP) awards.
Long-Term Incentive PlanThe Group’s Long-Term Incentive Plan (LTIP) awards have a grant price used in the valuation of the awards equal to the closing share price from the day prior to the grant date. LTIP awards in 2020 were conditional share awards with specific performance conditions and a performance period of three years. To the extent that they are met or satisfied then awards will be exercisable following the end of the relevant performance period. The TSR award components of the LTIPs are valued using a Monte Carlo simulation model. LTIP allocations are equity-settled and will lapse if the colleague leaves the Group before an LTIP grant is exercisable, unless the employee meets certain eligibility criteria.
In 2020 the Remuneration Committee modified the performance achievement level for EPS CAGR for LTIP awards granted to Gareth Wright and Stephen A. Carter on 22 March 2018 and 21 March 2019. The performance condition for EPS compound annual growth rate (CAGR) were previously measured over the three years to 31 December 2020 and three years to 31 December 2021 and in light of the impact of the COVID-19 pandemic the performance criteria were adjusted to reflect the EPS CAGR over the first two years of the performance period (2018 and 2019) and for 2020 year and 2021 year these were switched to be on cash measures; see Remuneration Report on pages 118 and 119 for further details. The Income Statement impact of this modification is total increase in the estimated share-based payment Income Statement charge of £1.1m, with £0.5m impacting the year ended 31 December 2020 and £0.6m impacting the year ending 31 December 2021. The increase reflects the fair value based on the number of shares expected to vest and the share price at the date of modification.
The movement in number of options during the year is as follows:
2020 Number
of options
2019Number
of options
Outstanding at 1 January 5,500,523 5,072,890
LTIPs granted in the year 3,291,347 2,042,374
LTIPs exercised in the year (272,026) (1,370,098)
LTIPs lapsed and modification adjustment in the year (858,313) (244,643)
Outstanding at 31 December 7,661,531 5,500,523
Exercisable awards included in outstanding number of options at 31 December 1,442,713 914,402
In order to satisfy outstanding share awards granted under the LTIP, the share capital would need to be increased at 31 December 2020 by 6,963,887 shares (2019: 4,541,535 shares) taking account of the 697,644 (2019: 958,988) shares held in the Employee Share Trust (Note 36). The Company will satisfy the awards either through the issue of additional share capital or the purchase of shares as needed on the open market. The average exercise price for LTIP exercised during the year was £4.49 (2019: £8.03). The exercise price for the majority of LTIP awards is 0.1p per share award and the average period to exercise was 5.3 years (2019: 5.7 years) for awards exercisable at 31 December 2020.
Expected volatility was determined by calculating the historical volatility of the Group’s share price over one, two and three years back from the date of grant. The expected life used in the model has been adjusted, based on the Group’s best estimate, for the effects of non-transferability, exercise restrictions and behavioural considerations.
ShareMatch (Share Incentive Plan)In June 2014, the Company launched ShareMatch, a global Share Incentive Plan (tax qualifying in the UK), under which eligible colleagues can invest up to the limit of £1,800 per annum in the Company’s shares. The scheme includes a matching element, whereby for every one share purchased by the colleague, the Company will award the participant one matching share. Matching shares are subject to forfeiture if the purchased shares are withdrawn from the scheme within three years of purchase or if the colleague leaves the Group, unless the reason for leaving is due to restructuring or retirement. In addition, both the purchased and matching shares are eligible to receive any dividends payable by the Company, which are reinvested in more shares. Employee subscriptions can be made on a monthly or one-off lump sum basis and matching shares are purchased on a monthly basis, through a UK Trust. Further details are set out in the remuneration section of the financial statements.
2020 ShareMatch
Number ofshare awards
2019ShareMatch
Number ofshare awards
Outstanding at 1 January 474,878 411,812
Purchased in the year 299,466 88,933
Transferred to participants in the year (63,647) (25,867)
Outstanding at 31 December 710,697 474,878
INFO
RM
A P
LC A
NN
UA
L R
EP
OR
T A
ND
AC
CO
UN
TS
20
20 IN
FOR
MA
PLC
AN
NU
AL R
EP
OR
T AN
D A
CC
OU
NT
S 20
20
170 171
FIN
AN
CIA
L S
TA
TE
ME
NT
S

N O T E S T O T H E C O N S O L I D A T E D F I N A N C I A L S T A T E M E N T S F O R T H E Y E A R E N D E D 3 1 D E C E M B E R 2 0 2 0 c o n t i n u e d
11. Finance income
2020 £m
2019£m
Interest income on bank deposits 5.5 4.7
Interest income finance lessor leases 0.1 0.8
Fair value gain on financial instruments through the Income Statement 1.4 3.4
Finance income before adjusting items 7.0 8.9
Adjusting item: finance income associated with debt issuance and fair value gain on acquisition put options 8.3 1.2
Total finance income 15.3 10.1
12. Finance costs
Notes2020
£m2019
£m
Interest expense on borrowings and loans1 92.3 105.5
Interest on IFRS 16 leases 38 12.2 14.3
Interest cost on pension scheme net liabilities 34 0.7 1.4
Total interest expense 105.2 121.2
Fair value loss on financial instruments through the Income Statement (0.8) (0.6)
Financing costs before adjusting items 104.4 120.6
Adjusting item: financing expense associated with early repayment of debt and associated termination of put options2 161.8 13.5
Total finance costs 266.2 134.1
1. Included in interest expense above is the amortisation of debt issue costs of £12.4m (2019: £5.1m)
2. The adjusting item for finance costs in 2020 and 2019 primarily relates to the finance fees associated with early repayment of debt
13. TaxationThe tax (credit)/charge comprises:
2020£m
2019£m
Current tax:
UK (1.1) 21.6
Continental Europe (1.1) 23.2
US 4.2 12.0
China 11.8 29.6
Rest of world 11.6 22.6
Total current tax 25.4 109.0
Deferred tax:
Current year (132.7) (19.5)
Credit arising from tax rate changes 5.2 (16.9)
Total deferred tax (127.5) (36.4)
Total tax (credit)/charge on (loss)/profit on ordinary activities (102.1) 72.6
The tax on adjusting items within the Consolidated Income Statement relates to the following:
Notes
Gross 2020
£m
Tax 2020
£m
Gross 2019
£m
Tax 2019
£m
Intangible assets amortisation 8 (291.8) 57.2 (312.4) 92.1
Benefit of goodwill amortisation for tax purposes only – (22.6) – (23.0)
Deferred tax recognised on fair value adjustments – – – 16.5
Impairment of intangibles and goodwill 8 (631.4) 16.5 (4.7) 1.0
Impairment of IFRS 16 right of use assets 8 (36.1) 8.0 (4.6) 0.9
Impairment of property and equipment 8 (8.8) 2.1 – –
Impairment of investments 8 (3.9) – – –
Acquisition and integration-related costs 8 (49.1) 8.2 (59.7) 11.4
Restructuring and reorganisation costs 8 (77.6) 17.4 (8.6) 1.8
Onerous contracts and other items associated with COVID-19 8 (52.6) 10.9 – –
Subsequent remeasurement of contingent consideration 8 3.1 (0.1) (3.2) 0.7
VAT charges 8 – – (1.8) –
Loss on disposal of subsidiaries and operations 21 (8.4) 2.2 (95.4) (20.4)
Finance income 8 8.3 (1.6) 1.2 –
Finance costs 8 (161.8) 29.5 (13.5) 2.5
Total tax on adjusting items (1,310.1) 127.7 (502.7) 83.5
The current and deferred tax are calculated on the estimated assessable profit for the year. Taxation is calculated in each jurisdiction based on the prevailing rates of that jurisdiction. On 3 March 2021 the UK Government announced its intention to increase the UK Corporation Tax rate from 19% to 25% from 1 April 2023. If this change had been enacted by 31 December 2020, it would not have had a material impact on the amount of deferred tax recognised. A reconciliation of the actual tax expense to the expected tax expense at the applicable statutory rate is shown below:
2020 2019
£m % £m %
(Loss)/profit before tax (1,139.7) 318.7
Tax (credit)/charge at effective UK statutory rate of 19.0% (2019: 19.0%) (216.5) 19.0 60.6 19.0
Different tax rates on overseas profits (27.3) 2.4 22.8 7.1
Disposal-related items (0.1) – 36.9 11.6
Non-deductible expenditure 121.9 (10.7) 10.9 3.4
Non-taxable income (2.1) 0.2 (6.2) (1.9)
Benefits from financing structures (5.5) 0.5 (6.1) (1.9)
Tax incentives (1.7) 0.1 (1.9) (0.6)
Adjustments for prior years 6.6 (0.6) (6.9) (2.2)
Net movement in provisions for uncertain tax positions 1.1 (0.1) (4.3) (1.3)
Impact of changes in tax rates 5.2 (0.4) (16.9) (5.3)
Deferred tax recognised on fair value adjustments – – (16.5) (5.2)
Movements in deferred tax not recognised 16.3 (1.4) 0.2 0.1
Tax (credit)/charge and effective rate for the year (102.1) 9.0 72.6 22.8
In addition to the income tax charge to the Consolidated Income Statement, a tax credit of £20.2m (2019: credit of £0.7m) has been recognised directly in the Consolidated Statement of Comprehensive Income during the year.
Current tax liabilities include £54.2m (2019: £53.1m) in respect of provisions for uncertain tax positions. In 2017, the European Commission announced that it would be opening a State Aid investigation into the UK’s Controlled Foreign Company regime and in particular the exemption for group finance companies. Like many UK- based multinational companies, the Group has made claims in relation to this exemption. On 3 March 2021, a charging notice was issued by HMRC to Informa in relation to certain Group companies and periods and on 1 April 2021, Informa paid an amount of £5.5m to HMRC. The Group is awaiting confirmation from HMRC as to the position for other Group companies and periods where the exemption was claimed and we believe that the maximum amount that could become payable in addition to the £5.5m already paid is £19.1m including interest.
As part of the acquisition accounting relating to contingent liabilities, an amount of £8m has been provided in relation to UBM companies. We do not currently believe it is probable that we will ultimately have a liability in relation to this matter and therefore have not provided for any additional amounts.
INFO
RM
A P
LC A
NN
UA
L R
EP
OR
T A
ND
AC
CO
UN
TS
20
20 IN
FOR
MA
PLC
AN
NU
AL R
EP
OR
T AN
D A
CC
OU
NT
S 20
20
172 173
FIN
AN
CIA
L S
TA
TE
ME
NT
S

N O T E S T O T H E C O N S O L I D A T E D F I N A N C I A L S T A T E M E N T S F O R T H E Y E A R E N D E D 3 1 D E C E M B E R 2 0 2 0 c o n t i n u e d
14. Dividends
2020Pence per
share£m
2020£m
20191
Pence per share
£m2019
£m
Amounts recognised as distributions to equity holders in the year:
Final dividend for the year ended 31 December 2019 – – – –
Interim dividend for the year ended 31 December 2020 – – – –
Final dividend for the year ended 31 December 2018 – – 14.75p 185.8
Interim dividend for the year ended 31 December 2019 – – 7.50p 94.5
– – 22.25p 280.3
Proposed final dividend for the year ended 31 December 2020 and the year ended 31 December 2019 – – – –
1. Restated for share placement (see Note 4)
In April 2020 the Group announced the temporary suspension of dividend payments, including the withdrawal of the proposed 2019 final dividend. There was no interim dividend for the six months ended 30 June 2020 or proposed final dividend for the year ended 2020. As at 31 December 2020 £0.2m (2019: £0.4m) of dividends were still to be paid, and total dividend payments in the year were £0.2m (2019: £280.0m).
In the year ended 31 December 2020 there were dividend payments of £13.6m (2019: £17.5m) to non-controlling interests.
15. Earnings per shareBasicThe basic earnings per share calculation is based on the loss attributable to equity Shareholders of the parent of £1,038.0m (2019: profit £225.5m). This loss on ordinary activities after taxation is divided by the weighted average number of shares in issue (less those shares held by the Employee Share Trust and ShareMatch), which is 1,419,707,507 (2019: 1,259,117,620).
DilutedThe diluted earnings per share calculation is based on the basic EPS calculation above except that the weighted average number of shares includes all potentially dilutive options granted by the reporting date as if those options had been exercised on the first day of the accounting period or the date of the grant, if later, giving a weighted average of 1,419,707,507 (2019: 1,264,230,940). In 2020 there were 6,813,614 potential ordinary shares which are anti-dilutive and are therefore excluded from the weighted average number of ordinary shares for the purpose of calculating diluted earnings per share.
The table below sets out the adjustment in respect of dilutive potential ordinary shares for use in the calculation of diluted EPS:
2020 20191
Weighted average number of shares used in basic earnings per share 1,419,707,507 1,259,117,620
Effect of dilutive potential ordinary shares – 5,113,320
Weighted average number of shares used in diluted earnings per share 1,419,707,507 1,264,230,940
1. Restated for share placement (see Note 4)
The table below sets out the adjustment in respect of dilutive potential ordinary shares for use in the calculation of diluted adjusted EPS:
2020 20191
Weighted average number of shares used in basic earnings per share 1,419,707,507 1,259,117,620
Effect of dilutive potentially ordinary shares 6,813,614 5,113,320
Weighted average number of shares used in diluted adjusted earnings per share 1,426,521,121 1,264,230,940
1. Restated for share placement (see Note 4)
Earnings per shareIn addition to basic EPS, adjusted diluted EPS has been calculated to provide useful additional information on underlying earnings performance. Adjusted diluted EPS is based on profit attributable to equity Shareholders which has been adjusted to exclude items that, in the opinion of the Directors, would distort underlying results with the items detailed in Note 8.
Earnings per share
Earnings2020
£m
Per share amount
2020Pence
Earnings2019
£m
Per share amount
20191
Pence
(Loss)/profit for the year (1,037.6) 246.1
Non–controlling interests (3.9) (20.6)
Earnings for the purpose of statutory basic EPS/statutory basic EPS (p) (1,041.5) (73.4) 225.5 17.9
Effect of dilutive potential ordinary shares – – – (0.1)
Earnings for the purpose of statutory diluted EPS/statutory diluted EPS (p) (1,041.5) (73.4) 225.5 17.8
1. Restated for share placement (see Note 4)
Adjusted earnings per share
Earnings2020
£m
Per share amount
2020Pence
Earnings2019
£m
Per share amount
20191
Pence
Earnings for the purpose of statutory basic EPS/statutory basic EPS (p) (1,041.5) (73.4) 225.5 17.9
Adjusting items (Note 8):
Intangible asset amortisation 291.8 20.5 312.4 24.8
Impairment – goodwill 592.9 41.8 0.9 0.1
Impairment – acquisition-related intangible assets 38.5 2.7 3.8 0.3
Impairment – IFRS 16 right of use assets 36.1 2.5 4.6 0.4
Impairment – property and equipment 8.8 0.6 – –
Impairment – investments 3.9 0.3 – –
Acquisition and integration costs 49.1 3.5 59.7 4.7
Restructuring and reorganisation costs 77.6 5.5 8.6 0.7
Onerous contracts associated with COVID-19 47.3 3.3 – –
Other items associated with COVID-19 5.3 0.4 – –
Subsequent remeasurement of contingent consideration (3.1) (0.2) 3.2 0.2
VAT charges – – 1.8 0.1
Loss on disposal of subsidiaries and operations 8.4 0.6 95.4 7.6
Finance income (8.3) (0.6) (1.2) (0.1)
Finance costs 161.8 11.4 13.5 1.1
Tax related to adjusting items (127.7) (9.0) (83.5) (6.6)
Earnings for the purpose of adjusted basic EPS/adjusted basic EPS (p) 140.9 9.9 644.7 51.2
Effect of dilutive potential ordinary shares (p) – – – (0.2)
Earnings for the purpose of adjusted diluted EPS/adjusted diluted EPS (p) 140.9 9.9 644.7 51.0
1. Restated for share placement (see Note 4)
INFO
RM
A P
LC A
NN
UA
L R
EP
OR
T A
ND
AC
CO
UN
TS
20
20 IN
FOR
MA
PLC
AN
NU
AL R
EP
OR
T AN
D A
CC
OU
NT
S 20
20
174 175
FIN
AN
CIA
L S
TA
TE
ME
NT
S

N O T E S T O T H E C O N S O L I D A T E D F I N A N C I A L S T A T E M E N T S F O R T H E Y E A R E N D E D 3 1 D E C E M B E R 2 0 2 0 c o n t i n u e d
16. Goodwill
£m
Cost
At 1 January 2019 6,464.9
Additions in the year1 128.3
Disposals (149.7)
Exchange differences (182.4)
At 1 January 20201 6,261.1Additions in the year (Note 18) 57.5Disposals (0.8)Exchange differences (79.9)At 31 December 2020 6,237.9Accumulated impairment losses
At 1 January 2019 (121.0)
Disposals 1.1
Impairment loss for the year (0.9)
Exchange differences 4.1
At 1 January 2020 (116.7)Disposals 0.8Impairment loss for the year (592.9)Exchange differences 47.5At 31 December 2020 (661.3)Carrying amount
At 31 December 2020 5,576.6At 31 December 20191 6,144.4
1. 2019 restated for updates to provisional acquisition accounting (see Note 4)
The Group tests for impairment of goodwill at the business segment level (see Note 6 for business segments) representing an aggregation of CGUs reflecting the level at which goodwill is monitored. Intangible assets are tested for impairment at the individual CGU level. The impairment testing of goodwill involved testing for impairment at a segment level by aggregating the carrying value of assets across CGUs in each Division and comparing this to value in use calculations derived from the latest Group cash flow projections.
There were five groups of CGUs for goodwill impairment testing in 2020 and these were identical to the business segment reporting detailed in Note 6 (2019: five CGU groups).
CGU groups
Carrying Amount
31 December2020
£m
Carrying Amount
31 December2019
£m
Number ofCGUs2020
Number ofCGUs2019
Informa Markets 3,598.8 3,848.3 6 8
Informa Connect 328.3 436.7 3 5
Informa Tech 433.3 678.0 1 1
Informa Intelligence 678.6 648.0 4 4
Taylor & Francis 537.6 533.4 1 1
5,576.6 6,144.4 15 19
Impairment reviewAs goodwill is not amortised, it is tested for impairment at least annually, or more frequently if there are indicators of impairment. During the year, an impairment indicator was identified in three of our groups of CGUs, namely the business segments which derive the majority of their revenue from operating physical events: Informa Markets, Informa Connect and Informa Tech. This was as a result of the containment measures to prevent the spread of COVID-19 and the resulting reduction in forecast events revenues.
The outbreak of COVID-19 has led to the cancellation or postponement of the majority of physical events since March 2020, and therefore a reduction in the revenue generated by these businesses. The short-term and potential longer-term impact were considered as an indicator of impairment. Because of this, an impairment analysis was carried out at 30 June 2020 and an impairment of £592.9m was recognised. Due to the ongoing restrictions, and in line with our accounting policy, an annual impairment review was performed on 31 December 2020. The testing involved comparing the carrying value of assets in each CGU with value in use calculations or assessments of fair value less costs to sell, derived from the latest Group cash flow projections.
At 30 June, long-term growth rates were 2.3% for Informa Markets, 1.7% for Informa Connect and 1.9% for Informa Tech. The pre-tax discount rates were 10.1% for Informa Markets, 10.7% for Informa Connect and 11.8% for Informa Tech.
The goodwill impairment test at 30 June 2020 resulted in an impairment to the following CGU groups:
Impairment of goodwill
Year ended31 December
2020£m
Year ended31 December
2019£m
Informa Markets 231.1 –
Informa Connect 105.9 –
Informa Tech 255.9 –
Total 592.9 –
Management has used the following assumptions in its impairment analysis as at 31 December 2020:
Key assumption How we have defined this
Projected cash flows For 2021, management has used the budget to provide the forecast for the year. For the periods 2022-2025, management has made a judgement as to the likely shape and length of recovery in the sectors they operate. Management’s short- to medium-term forecasts from 2022 to 2025 reflect a deeper economic impact and slower recovery on the events industry when compared with GDP forecasts for the same period in the relevant geographies. This is based on management expecting large-scale physical events to be one of the last parts of the economy to return to normal trading levels.
Considering these inputs to the financial forecasts, this results in a recovery to 2019 cash flow levels for the events revenues for these CGUs over the course of the period from 2021 to 2025. These projections represent the Directors’ best estimate of the future performance of these businesses. For non-events revenues, there is a stable growth trajectory over the medium to longer term.
Across each of these time horizons, management has considered external metrics, market data and publicly available economic outlooks, taking these into account when determining the estimate.
Long-term growth rate For the Group’s value in use calculation, a perpetual growth rate has been applied to the 2025 operating cash flow. Long-term growth rates are based on external reports on long-term GDP growth rates for the main geographic markets in which each CGU and Division operates and therefore are not considered to exceed the long-term average growth prospects for the individual markets. Long-term growth rates have not been risk adjusted to reflect any of the uncertainties noted above, as these uncertainties are reflected in the forecasts.
Discount rate applied We have calculated the WACC for each CGU and CGU group. For the cost of debt, we have considered market rates, based on entities with a comparable credit rating. The cost of equity is calculated using the Capital Asset Pricing Model (CAPM). Discount rates have not been risk adjusted to reflect any of the uncertainties noted above, as these uncertainties are reflected in the forecasts.
INFO
RM
A P
LC A
NN
UA
L R
EP
OR
T A
ND
AC
CO
UN
TS
20
20 IN
FOR
MA
PLC
AN
NU
AL R
EP
OR
T AN
D A
CC
OU
NT
S 20
20
176 177
FIN
AN
CIA
L S
TA
TE
ME
NT
S

N O T E S T O T H E C O N S O L I D A T E D F I N A N C I A L S T A T E M E N T S F O R T H E Y E A R E N D E D 3 1 D E C E M B E R 2 0 2 0 c o n t i n u e d
16. Goodwill continuedManagement has concluded that there was no impairment indicated in the impairment test conducted as at 31 December 2020, noting headroom as follows:
Headroom on CGU groups
Long-term market growth rates Pre-tax discount rates
Key assumptions and headroom2020
£m 2020 2019 2020 2019
Informa Markets 170.4 2.5% 2.2% 11.1% 9.3%
Informa Connect 64.7 1.8% 1.7% 11.7% 9.6%
Informa Tech 44.1 2.0% 1.9% 11.3% 10.9%
Informa Intelligence 894.7 1.9% 1.7% 10.4% 10.2%
Taylor & Francis 2,337.3 1.7% 1.6% 8.8% 8.9%
The headroom shown above represents the excess of the recoverable amount over the carrying value.
Sensitivity analysisThe sensitivities provided represent areas assessed by management to be a key source of estimation uncertainty, as described in Note 3.
Key uncertainties relate to the depth of the economic impact from COVID-19 containment measures, the speed of recovery, and the variability in impact across the geographies in which the group operates, which may impact our future cash flows, discount rates and LTGR.
Our cash flow sensitivity analysis scenario considers a potentially extended and severe restriction on our ability to run events into the future. The sensitivity specifically considers the impact on cash flows if COVID-19 restricted our ability to run events outside of Mainland China in 2021, as well as the impact that would have on our business in the medium to longer term. When taken together these would be equivalent to a further 11.9% reduction in cash flow from 2021 to 2025.
Sensitivity analysis scenarios also considered changes to the key assumptions including the rate of WACC and LTGR. We based this sensitivity analysis on reasonably possible changes to the cost of capital and LTGR in the markets in which we operate. These sensitivities show the impact of WACC rates increasing by 1.0% and LTGR reducing by 1.0%.
The results from the sensitivity analysis would indicate the following impairments to CGU groups, in addition to the £592.9m impairment that has been recorded in the results for the year:
Cash flow reduction
£m
WACC rates increasing
by 1.0%£m
LTGRreduction
by 1.0%£m
Informa Markets (603.8) (393.5) (256.1)Informa Connect (30.5) – –Informa Tech (16.7) (39.1) (22.0)Informa Intelligence – – –Taylor & Francis – – –Total (651.0) (432.6) (278.1)
The above sensitivities indicate management’s assessment of reasonably plausible, material changes which could lead to a further impairment.
17. Other intangible assets
Publishing book lists and
journal titles£m
Database and intellectual
property, brand and customer
relationships£m
Exhibitions and
conferences, brand and customer
relationships £m
Sub-total2
£m
Intangible software
assets£m
Productdevelopment1
£mTotal2
£m
Cost
At 1 January 2019 896.7 657.9 3,652.6 5,207.2 252.5 71.2 5,530.9
Arising on acquisition of subsidiaries and operations – 40.3 4.8 45.1 – – 45.1
Additions3 0.4 – 62.0 62.4 25.3 7.0 94.7
Disposals – (116.8) (20.1) (136.9) (16.8) (11.3) (165.0)
Exchange differences (16.4) (35.7) (93.5) (145.6) (3.0) (1.3) (149.9)
At 1 January 2020 880.7 545.7 3,605.8 5,032.2 258.0 65.6 5,355.8Reclassification1 – 98.6 (96.3) 2.3 – – 2.3Arising on acquisition of subsidiaries and operations 3.9 19.1 0.4 23.4 1.3 1.0 25.7Additions3 1.5 – – 1.5 21.2 13.9 36.6Disposals – (27.0) (22.4) (49.4) (12.9) (5.0) (67.3)Exchange differences (16.9) (34.9) (25.7) (77.5) (2.7) (1.6) (81.8)At 31 December 2020 869.2 601.5 3,461.8 4,932.5 264.9 73.9 5,271.3Amortisation
At 1 January 2019 (494.4) (524.2) (506.6) (1,525.2) (109.5) (41.8) (1,676.5)
Charge for the year (51.8) (61.1) (199.5) (312.4) (30.6) (11.3) (354.3)
Impairment losses – – (3.8) (3.8) – – (3.8)
Disposals – 33.7 14.8 48.5 5.1 10.8 64.4
Exchange differences 10.0 15.2 18.7 43.9 6.7 1.2 51.8
At 1 January 2020 (536.2) (536.4) (676.4) (1,749.0) (128.3) (41.1) (1,918.4)Reclassification1 – 58.7 (58.7) – – – –Charge for the year (51.9) (17.5) (222.4) (291.8) (31.0) (10.1) (332.9)Impairment losses2 (0.1) (5.2) (33.2) (38.5) (5.0) – (43.5)Disposals – 26.3 22.4 48.7 11.9 3.9 64.5Exchange differences 12.2 18.1 20.0 50.3 2.2 1.0 53.5At 31 December 2020 (576.0) (456.0) (948.3) (1,980.3) (150.2) (46.3) (2,176.8)Carrying amount
At 31 December 2020 293.2 145.5 2,513.5 2,952.2 114.7 27.6 3,094.5At 31 December 2019 344.5 9.3 2,929.4 3,283.2 129.7 24.5 3,437.4
1. Update to the categorisation of intangible assets from the acquisition of Penton
2. £5.0m impairment of intangible software assets is included within integration costs in adjusting items (see Note 8)
3. Additions includes business asset additions and product development. Of the £36.6m (2019: £94.7m) total additions, the Consolidated Cash Flow Statement shows £45.0m (2019: £91.7m) for these items with £23.8m (2019: £25.3m) for intangible software assets, £13.9m (2019: £7.0m) of product development and £7.3m (2019: £59.4m) for titles, brands and customer relationships
Intangible software assets include a gross carrying amount of £226.0m (2019: £223.0m) and accumulated amortisation of £128.8m (2019: £114.0m) which relates to software that has been internally generated. The Group does not have any of its intangible assets pledged as security over bank loans.
In addition to the impairment review of goodwill a review of intangible assets identified an impairment of £38.5m relating to brands and customer relationships where the recoverable amount did not support the carrying amount, and included selected individual events which have been discontinued.
INFO
RM
A P
LC A
NN
UA
L R
EP
OR
T A
ND
AC
CO
UN
TS
20
20 IN
FOR
MA
PLC
AN
NU
AL R
EP
OR
T AN
D A
CC
OU
NT
S 20
20
178 179
FIN
AN
CIA
L S
TA
TE
ME
NT
S

N O T E S T O T H E C O N S O L I D A T E D F I N A N C I A L S T A T E M E N T S F O R T H E Y E A R E N D E D 3 1 D E C E M B E R 2 0 2 0 c o n t i n u e d
18. Business combinations
Cash paid on acquisitions net of cash acquired2020
£m2019
£m
Current year acquisitions
TrialScope 54.1 –
F1000 Research Limited 14.9 –
Prior year acquisitions including deferred and contingent payments
IHS Markit Database and Research portfolio (1.8) 123.3
Other 10.1 44.4
Total cash paid in year net of cash acquired 77.3 167.7
AcquisitionsTo determine the value of separately identifiable intangible assets on a business combination, and deferred tax on these intangibles, the Group is required to make estimates when utilising valuation methodologies. These methodologies include the use of discounted cash flows, revenue forecasts and the estimates for the useful economic lives of intangible assets.
There are estimates involved in assessing what amounts are recognised as the estimated fair value of assets and liabilities acquired through business combinations, particularly the amounts attributed to separate intangible assets such as titles, brands, acquired customer lists and associated customer relationships. These estimates impact the amount of goodwill recognised on acquisitions. Any provisional amounts are subsequently finalised within the 12-month measurement period, as permitted by IFRS 3. The Group has built considerable knowledge of these valuation techniques, and for major acquisitions, defined as when consideration is £75m or above, the Group also considers the advice of third party independent valuers to identify and support the valuation of intangible assets arising on acquisition.
The provisional amounts recognised in respect of the estimated fair value of identifiable assets and liabilities for 2020, and acquisitions and payments made in 2020 relating to prior year acquisitions were:
TrialScope£m
Other acquisitions
including deferred
consideration£m
Deferred consideration
and finalisation of working
capital£m
Total£m
Acquisition-related intangibles 19.1 3.9 – 23.0Other intangibles 2.5 – – 2.5Trade and other receivables 1.7 0.2 – 1.9Cash and cash equivalents 3.4 – – 3.4Trade and other payables (1.8) (0.1) – (1.9)Deferred income (5.2) (0.1) – (5.3)Deferred tax liabilities (4.9) (0.7) – (5.6)Identifiable net assets acquired 14.8 3.2 – 18.0Goodwill 44.8 12.7 – 57.5Total consideration 59.6 15.9 – 75.5Satisfied by:
Cash consideration 57.5 15.9 – 73.4Deferred and contingent cash consideration 1.2 – 8.3 9.5Non-cash consideration 0.9 – – 0.9Total 59.6 15.9 8.3 83.8
Net cash outflow arising on acquisitions:
Initial cash consideration 57.5 15.9 – 73.4Deferred and contingent consideration paid – – 8.3 8.3Less: cash settlement in 2019 – (1.0) – (1.0)Less: cash acquired (3.4) – – (3.4)Net cash outflow arising on acquisitions 54.1 14.9 8.3 77.3
TrialScope acquisitionOn 2 October 2020 the Group acquired the business and assets of TrialScope Inc. TrialScope is a pharmaceutical subscription software business and forms part of the Informa Intelligence Division. Cash consideration, including estimated working capital, was £57.5m ($73.9m), deferred consideration was £1.2m ($1.5m) and non-cash consideration was £0.9m ($1.1m).
Final consideration is subject to the finalisation of working capital amounts.
The provisional fair value of the identifiable assets acquired and liabilities assumed at the acquisition date are shown in the table below.
Book value£m
Provisional fair value
adjustments£m
Provisional fair value
£m
Acquisition-related intangibles – 19.1 19.1Other intangibles 2.5 – 2.5Trade and other receivables 2.0 (0.3) 1.7Cash and cash equivalents 3.4 – 3.4Trade and other payables (1.4) (0.4) (1.8)Deferred income (4.9) (0.3) (5.2)Deferred tax liabilities – (4.9) (4.9)Identifiable net assets acquired 1.6 13.2 14.8Goodwill 44.8Total consideration 59.6Satisfied by:
Cash consideration 57.5Deferred consideration 1.2Non-cash consideration 0.9Total consideration 59.6
Provisional goodwill of £44.8m arising on the acquisition has initially been identified as relating to the following factors:
• Enhancing the Group’s capabilities in clinical trial-related workflow solutions, particularly in the disclosure space • Providing additional strength to the Group in key areas of the pharma market, including increasing the Group’s presence in the
growing regulatory and patient recruitment space• Synergy opportunities from incremental revenue opportunities• Adding to the Group a skilled and experienced team
Acquisition costs charged to operating profit amounted to £0.9m.
The business generated an adjusted and statutory operating profit of £0.4m, profit after tax of £0.3m and £3.3m of revenue for the period from the date of acquisition to 31 December 2020. If the acquisition had completed on the first day of the financial year, it would have generated £0.4m of profit after tax and £11.1m of revenue for the year ended 31 December 2020.
Other business combinations made in 2020There was one other acquisition completed in the year ended 31 December 2020 which related to the acquisition of F1000 Research Limited (F1000) on 9 January 2020 for cash consideration of £14.9m. F1000 is an open access publishing platform for a range of research, article and data outputs and forms part of Taylor & Francis.
Deferred and contingent consideration paid in 2020 relating to business combinations completed in prior yearsIn the year ended 31 December 2020 there were contingent and deferred net cash payments of £8.3m relating to acquisitions completed in prior years which include a receipt of £1.8m for the finalisation of working capital amounts.
INFO
RM
A P
LC A
NN
UA
L R
EP
OR
T A
ND
AC
CO
UN
TS
20
20 IN
FOR
MA
PLC
AN
NU
AL R
EP
OR
T AN
D A
CC
OU
NT
S 20
20
180 181
FIN
AN
CIA
L S
TA
TE
ME
NT
S

N O T E S T O T H E C O N S O L I D A T E D F I N A N C I A L S T A T E M E N T S F O R T H E Y E A R E N D E D 3 1 D E C E M B E R 2 0 2 0 c o n t i n u e d
18. Business combinations continuedFinalisation of valuation of 1 August 2019 IHS Markit Database and Research portfolio (TMT) 2019 acquisitionOne year on from the acquisition of the IHS Markit portfolio, as is required, we have completed the finalisation of the valuation of identifiable assets acquired and liabilities assumed at the acquisition date, resulting in the following true-ups and minor adjustments, with the finalisation of the valuation resulting in a fair value of acquired intangible assets of £29.6m and goodwill of £111.3m.
Book value£m
Provisional fair value
adjustments recognised
in 2019£m
Final fair value
adjustments recognised
in 2020£m
Final fair value
recognised in 2020
£m
Intangible assets – 29.6 – 29.6IFRS 16 right of use assets – 1.2 – 1.2Property and equipment 0.1 (0.1) – –Trade and other receivables 10.5 (0.5) (0.3) 9.7Trade and other payables (2.6) (2.3) – (4.9)Deferred income (17.7) – – (17.7)Finance lease liabilities – (1.2) – (1.2)Current tax liability – (0.1) – (0.1)Provisions – (1.2) – (1.2)Deferred tax liability – (2.0) – (2.0)Identifiable net (liabilities)/assets acquired (9.7) 23.4 (0.3) 13.4Goodwill 111.3Total 124.7
Equity transactionsWhen there is a change in ownership of a subsidiary without a change in control, the difference between the consideration paid/received and the relevant share of the carrying amount of net assets acquired/disposed of the subsidiary is recorded in equity. The carrying amounts of the controlling and non-controlling interests are adjusted to reflect the changes in their relative interests in the subsidiary. Any difference between the amount by which the non-controlling interests are adjusted and the fair value of the consideration paid is recognised directly in equity
2020£m
2019£m
Cash paid (44.9) –
Disposal of non–controlling interests – (0.5)
Recognised in equity – (0.5)
The cash payment of £44.9m relating to the settlement of put option liabilities relates to a £28.1m cash settlement in January 2020 on the exercise of an option relating to minority interests in certain Fashion shows in the US and a £16.8m payment in August 2020 for the settlement of options held by a 4.1% minority holder of parts of the ASEAN businesses, bringing ownership to 100% for these businesses.
19. Property and equipment
Freehold land and buildings
£m
Leasehold land and buildings
£m
Equipment, fixtures and
fittings£m
Total property and
equipment£m
Cost
At 1 January 2019 3.1 64.6 57.8 125.5
Additions1 – 8.9 9.3 18.2
Acquisitions – 1.4 0.2 1.6
Disposals – (2.9) (14.6) (17.5)
Exchange differences – (2.1) (1.4) (3.5)
At 1 January 2020 3.1 69.9 51.3 124.3Additions1 – 5.4 5.3 10.7Disposals – (6.6) (7.7) (14.3)Exchange differences – (1.7) (1.7) (3.4)At 31 December 2020 3.1 67.0 47.2 117.3Depreciation
At 1 January 2019 (0.6) (15.1) (40.1) (55.8)
Charge for the year (0.1) (7.4) (9.7) (17.2)
Disposals – 2.1 12.9 15.0
Exchange differences – 1.4 1.3 2.7
At 1 January 2020 (0.7) (19.0) (35.6) (55.3)Charge for the year – (7.4) (9.4) (16.8)Disposals – 4.6 5.6 10.2Impairment – (7.8) (1.0) (8.8)Exchange differences – 0.9 1.6 2.5At 31 December 2020 (0.7) (28.7) (38.8) (68.2)Carrying amount
At 31 December 2020 2.4 38.3 8.4 49.1At 31 December 20192 2.4 50.9 15.7 69.0
1. Cash paid in relation to additions was £10.7m (2019: 17.5m)
2. 2019 restated for updates to provisional acquisition accounting (see Note 4)
The Group does not have any of its property and equipment pledged as security over bank loans.
20. Other investments and investments in joint ventures and associatesInvestments in joint ventures and associatesThe carrying value of investments in joint ventures and associates are set out below:
2020£m
2019£m
At 1 January 19.8 19.1
Arising on disposal of subsidiaries and operations (0.7) (0.7)
Share of results of joint ventures and associates 0.8 1.5
Foreign exchange 0.1 (0.1)
At 31 December 20.0 19.8
INFO
RM
A P
LC A
NN
UA
L R
EP
OR
T A
ND
AC
CO
UN
TS
20
20 IN
FOR
MA
PLC
AN
NU
AL R
EP
OR
T AN
D A
CC
OU
NT
S 20
20
182 183
FIN
AN
CIA
L S
TA
TE
ME
NT
S

N O T E S T O T H E C O N S O L I D A T E D F I N A N C I A L S T A T E M E N T S F O R T H E Y E A R E N D E D 3 1 D E C E M B E R 2 0 2 0 c o n t i n u e d
20. Other investments and investments in joint ventures and associates continuedThe following represents the aggregate amount of the Group’s share of assets, liabilities, income and expenses of the Group’s joint ventures:
100% of results
2020£m
Group share 2020
£m
100% of results
2019£m
Group share 2019
£m
Non-current assets 78.3 14.4 98.6 18.2
Current assets 84.7 15.7 100.7 18.2
163.0 30.1 199.3 36.4
Non-current liabilities (121.2) (24.2) (102.3) (20.4)
Current liabilities (68.1) (12.9) (50.3) (9.5)
Net (liabilities)/assets (26.3) (7.0) 46.7 6.5
Operating profit 9.0 1.2 10.7 2.5
Profit before tax 8.6 1.2 5.7 1.6
Profit after tax 6.8 0.8 4.7 1.5
The Group’s investments in joint ventures at 31 December 2020 were as follows:
Company Divisions
Country of incorporation and operation
Class of shares
held
Shareholding or share of operation
Accounting year end
Independent Materials Handling Exhibitions Limited Informa Markets UK Ordinary 50% 31 December
Guzhen Lighting Expo Co. Ltd Informa Markets China Ordinary 35.7% 31 December
GML Exhibition (Thailand) Co. Ltd Informa Markets China Ordinary 49% 31 December
Guangdong International Exhibitions Ltd Informa Markets China Ordinary 27.5% 31 December
Lloyd’s Maritime Information Services Ltd Informa Intelligence UK Ordinary 50% 31 December
The Group’s investments in associates at 31 December 2020 were as follows:
Company Divisions
Country of incorporation and operation
Class of shares
held
Shareholding or share of operation
Accounting year end
Independent Television News Limited Informa Markets UK Ordinary 20% 31 December
PA Media Group Ltd Informa Markets UK Ordinary 17% 31 December
Other investmentsThe Group’s other investments at 31 December 2020 are as follows:
2020£m
2019£m
At 1 January 10.1 5.1
Additions in year 0.9 5.0
Impairment (see Note 8) (3.9) –
Foreign exchange 0.2 –
At 31 December 7.3 10.1
Other investments include investments in unlisted equity securities and convertible loan notes which are redeemable through the issue of equity. Investments are held at fair value through profit or loss under IFRS 9.
21. Disposal of subsidiaries and operationsDuring the year, the Group generated the following profit/(loss) on disposal of subsidiaries and operations:
2020£m
2019£m
Life Sciences media brands portfolio (1.1) 10.8
Agribusiness Intelligence portfolio (2.6) 35.6
Media assets portfolio (5.0) (120.6)
Lifestyle events – (13.3)
Other operations profit/(loss) on disposal 0.3 (7.9)
Loss for the year from disposal of subsidiaries and operations (8.4) (95.4)
22. Deferred tax
Consolidated Balance Sheet at 31 December
Consolidated Income Statement year ended
31 December
Net deferred tax liabilities2020
£m2019
£m2020
£m2019
£m
Accelerated capital allowances – (1.2) 0.1 1.7
Intangibles 623.4 660.3 (36.6) (75.2)
Pensions (14.6) (7.4) 0.9 0.8
Losses (174.5) (82.9) (88.7) 33.7
Other (36.3) (35.1) (3.2) 2.6
398.0 533.7 (127.5) (36.4)
The movement in deferred tax balance during the year is:
2020£m
2019£m
Net deferred tax liability at 1 January 533.7 595.5
Credit to other comprehensive income for the year (16.2) (0.7)
Effect of initial application of IFRS 16 – 1.0
Acquisitions and additions 5.6 7.9
Disposal (0.4) (16.1)
Credit to profit or loss for the year (127.5) (36.4)
Foreign exchange movements 2.8 (17.5)
Net deferred tax liability at 31 December 398.0 533.7
Certain deferred tax assets and liabilities have been offset. The following is the analysis of deferred tax balances for the Consolidated Balance Sheet.
2020£m
2019£m
Deferred tax liability 406.4 540.4
Deferred tax asset (8.4) (6.7)
398.0 533.7
Deferred tax assets have been recognised because, based on the Group’s current forecasts, it is expected that there will be taxable profits against which these assets can be utilised.
INFO
RM
A P
LC A
NN
UA
L R
EP
OR
T A
ND
AC
CO
UN
TS
20
20 IN
FOR
MA
PLC
AN
NU
AL R
EP
OR
T AN
D A
CC
OU
NT
S 20
20
18 4 185
FIN
AN
CIA
L S
TA
TE
ME
NT
S

N O T E S T O T H E C O N S O L I D A T E D F I N A N C I A L S T A T E M E N T S F O R T H E Y E A R E N D E D 3 1 D E C E M B E R 2 0 2 0 c o n t i n u e d
22. Deferred tax continuedThe Group has the following unused tax losses in respect of which no deferred tax assets have been recognised:
• £279.5m (2019: £295.6m) of UK tax losses• £103.6m (2019: £106.3m) of US Federal tax losses which expire between 2024 and 2037. In addition, there are unrecognised
deferred tax assets in respect of US State tax losses of £6.4m (2019: £5.0m)• £251.6m (2019: £251.6m) of UK capital losses which are only available for offset against future capital gains• £5.5bn (2019: £7.2bn) of Luxembourg tax losses• £29.1m (2019: £36.0m) of Brazilian tax losses• £64.5m (2019: £22.3m) of tax losses in other countries
No deferred tax has been recognised in respect of these tax losses as it is not considered probable that these losses will be utilised.
In addition, the Group has unrecognised deferred tax assets in relation to other deductible temporary differences of £4.3m (2019: £0.3m). No deferred tax assets have been recognised in respect of these amounts as it is not considered probable that they will be utilised.
The aggregate amount of withholding tax on post-acquisition undistributed earnings for which deferred tax liabilities have not been recognised was £3.7m (2019: £2.0m). No liability has been recognised because the Group, being in a position to control the timing of the distribution of intra-Group dividends, has no intention to distribute intra-Group dividends in the foreseeable future that would trigger withholding tax.
23. Trade and other receivables
2020£m
20191
£m
Current
Trade receivables 264.2 287.0
Less: provision (47.7) (34.7)
Trade receivables net 216.5 252.3
Other receivables 39.7 51.4
Accrued income 26.3 50.3
Prepayments 75.6 122.1
Total current 358.1 476.1
Non-current
Other receivables 27.0 31.2
Less: provision (6.8) (3.4)
Other receivables net 20.2 27.8
378.3 503.9
1. 2019 restated for updates to provisional acquisition accounting (see Note 4)
The average credit period taken on sales of goods is 60 days (2019: 49 days). Under the normal course of business, the Group does not charge interest on its overdue receivables.
The Group’s exposures to credit risk and impairment losses related to trade and other receivables are disclosed in Note 32. The Directors consider that the carrying amount of trade and other receivables approximates to their fair value.
24. Derivative financial instruments
2020£m
2019£m
Financial assets – non-current
Interest rate swaps – hedged – 1.4
Cross currency swaps – hedged 44.6 2.5
44.6 3.9
Financial assets – current
Call options – 1.0
– 1.0
Financial liabilities – current
Currency forwards – not hedged 0.2 –
Put options over non-controlling interests – 36.4
0.2 36.4
Financial liabilities – non-current
Cross currency swaps – hedged 7.5 22.4
7.5 22.4
Cross currency swaps that are associated with debt instruments are included within net debt (see Note 27). £44.6m (2019: £2.5m) derivative financial assets and £7.5m (2019: £22.4m) derivative financial liabilities relate to loan notes swapped to USD using cross currency swaps. £nil (2019: £1.4m) interest rate swaps relates to USD borrowings that were repaid in 2020.
In 2020 the Group issued new loan notes (see Note 29) and we swapped to USD using cross currency swaps with the following terms:
• A fixed rate of interest on £150.0m of EMTN borrowings with a five-year maturity and pays a fixed rate of interest for $195.2m• A fixed rate of interest on €700.0m of EMTN borrowings with a five-year maturity and pays a fixed rate of interest for $821.6m
Put options over non-controlling interests relate to options over previous acquisitions and minority interests in certain Fashion shows in the US that were settled in 2020.
25. Inventory
2020£m
2019£m
Work in progress 7.9 6.2
Finished goods and goods for resale 23.4 32.3
31.3 38.5
The write-down of inventory during the year amounted to £2.3m (2019: £2.9m).
The cost of inventories recognised as an expense during the year was £32.0m (2019: £40.5m).
26. Reconciliation of movement in net debt for the year ended 31 December 2020
2020£m
2019£m
Increase in cash and cash equivalents in the year (including cash acquired) 103.2 77.1
Cash flows from net drawdown of borrowings and derivatives associated with debt 535.6 199.8
Change in net debt resulting from cash flows 638.8 276.9
Non-cash movements including foreign exchange 1.3 93.1
Movement in net debt in the period (before opening IFRS 16 debt) 640.1 370.0
Net debt at beginning of the year (2,657.6) (2,681.9)
IFRS 16 lease liabilities at 1 January 2019 – (343.6)
IFRS 16 finance lease receivables at 1 January 2019 – 14.4
Net finance lease additions in year (12.1) (16.5)
Net debt at end of the year (2,029.6) (2,657.6)
INFO
RM
A P
LC A
NN
UA
L R
EP
OR
T A
ND
AC
CO
UN
TS
20
20 IN
FOR
MA
PLC
AN
NU
AL R
EP
OR
T AN
D A
CC
OU
NT
S 20
20
186 187
FIN
AN
CIA
L S
TA
TE
ME
NT
S

N O T E S T O T H E C O N S O L I D A T E D F I N A N C I A L S T A T E M E N T S F O R T H E Y E A R E N D E D 3 1 D E C E M B E R 2 0 2 0 c o n t i n u e d
27. Movements in net debtNet debt consists of cash and cash equivalents and includes bank overdrafts, borrowings, derivatives associated with debt instruments, finance leases and other loan note receivables where these are interest bearing and do not relate to deferred contingent arrangements.
At 1 January2020
£m
Non-cashMovements
£mCash flow
£m
Exchange movements
£m
At 31 December
2020£m
Cash at bank and on hand 195.1 – 103.2 1.1 299.4Overdrafts – – – –Cash and cash equivalents 195.1 – 103.2 1.1 299.4
Bank loans due in less than one year – – – – –Bank loans due in more than one year (56.9) – 61.3 (4.4) –Bank loan fees due in more than one year 2.2 0.4 – – 2.6Private placement loan notes due in less than one year (152.2) – 153.0 (0.8) –Private placement loan notes due in more than one year (1,060.6) 3.7 1,074.8 (17.9) –Private placement loan note fees 2.7 (2.7) – – –Bond borrowings due in more than one year (1,279.1) – (788.3) (43.7) (2,111.1)Bond borrowing fees 11.0 4.3 – – 15.3Derivative assets associated with borrowings 3.9 40.7 – – 44.6Derivative liabilities associated with borrowings (22.4) 14.9 – – (7.5)Lease liabilities (316.6) (6.8) 37.1 5.5 (280.8)Finance lease receivables 15.3 (5.4) (2.3) 0.3 7.9Net debt (2,657.6) 49.1 638.8 (59.9) (2,029.6)
Included within the net cash inflow of £638.8m (2019: inflow of £276.9m) is £61.3m (2019: £499.7m) of loan repayments, £nil (2019: £41.2m) of facility loan drawdowns, £788.3m (2019: £433.7m) of proceeds from EMTN bond issuances and £1,227.8m (2019: £143.4m) of private placement repayments.
28. Cash and cash equivalents
2020£m
2019£m
Cash at bank and on hand 299.4 195.1
Cash and cash equivalents in the Consolidated Cash Flow Statement 299.4 195.1
The cash at bank and on hand is presented net of the Group’s legal right to offset overdrafts, if applicable. The Group’s exposure to interest rate risks and a sensitivity analysis for financial assets and liabilities is disclosed in Note 32.
29. BorrowingsTotal borrowings, excluding derivative assets and liabilities associated with borrowings, are as follows:
Notes2020
£m2019
£m
Current
Bank borrowings ($200.0m) – repaid March 2019 – –
Private placement loan note ($200.5m) – repaid February 2020 – 152.2
Total current borrowings 27 – 152.2
Non-current
Bank borrowings – revolving credit facility1 – 56.9
Bank debt issue costs (2.6) (2.2)
Bank borrowings – non-current 27 (2.6) 54.7
Private placement loan note ($385.5m) – repaid November 2020 – –
Private placement loan note ($45.0m) – repaid November 2020 – 35.0
Private placement loan note ($120.0m) – repaid November 2020 – 91.1
Private placement loan note ($55.0m) – repaid November 2020 – 41.7
Private placement loan note ($76.1m) – repaid November 2020 – 61.8
Private placement loan note ($80.0m) – repaid November 2020 – 60.7
Private placement loan note ($200.0m) – repaid November 2020 – 151.8
Private placement loan note ($130.0m) – repaid November 2020 – 98.7
Private placement loan note ($365.0m) – repaid November 2020 – 277.1
Private placement loan note ($116.0m) – repaid November 2020 – 90.9
Private placement loan note ($200.0m) – repaid November 2020 – 151.8
Private debt issue costs – (2.7)
Private placement – non-current 27 – 1,057.9
Bond borrowings ($350.0m) – repaid November 2019 –
Euro Medium Term Note (€650.0m) – due July 2023 583.6 553.4
Euro Medium Term Note (€700m) – due October 2025 628.5 –
Euro Medium Term Note (£450.0m) – due July 20262 450.0 300.0
Euro Medium Term Note (€500.0m) – due April 2028 449.0 425.7
Bond and EMTN borrowings issue costs (15.3) (11.0)
Bond and EMTN borrowings – non-current 27 2,095.8 1,268.1
Total non-current borrowings 2,093.2 2,380.7
2,093.2 2,532.9
1. On 26 November 2020, the Group’s RCF was increased by £150m to £1,050m. On 14 December 2020 there were extensions to the RCF resulting in facilities of £30m (2019: £30m) maturing February 2023, £420m (2019: £270m) maturing February 2024, £60m (2019: £60m) maturing February 2025 and £540m (2019: £540m) maturing February 2026.
2. On 3 November 2020, the Group issued an additional £150m EMTN to increase the borrowings in this tranche to £450m (2019: £300m)
Following debt repayments in November 2020 there are no longer any debt covenants on any of the Group’s bank facilities. The Group does not have any of its property and equipment and other intangible assets pledged as security over loans.
At 31 December 2020, the Group had private placement loan notes amounting to $nil (2019: $1,587.6m). All US private placement loan notes were repaid on 6 November 2020, with any associated fees being recognised in the Income Statement. The decision to repay the US private placement loan notes was taken in 2020.
For the purpose of refinancing the borrowings the Group issued the following Euro Medium Term Notes (EMTNs), which are debt instruments traded outside of the US and Canada.
On 22 October 2019, EMTN fixed term loan notes were issued totalling €500.0m with a maturity of 22 April 2028.
INFO
RM
A P
LC A
NN
UA
L R
EP
OR
T A
ND
AC
CO
UN
TS
20
20 IN
FOR
MA
PLC
AN
NU
AL R
EP
OR
T AN
D A
CC
OU
NT
S 20
20
188 189
FIN
AN
CIA
L S
TA
TE
ME
NT
S

N O T E S T O T H E C O N S O L I D A T E D F I N A N C I A L S T A T E M E N T S F O R T H E Y E A R E N D E D 3 1 D E C E M B E R 2 0 2 0 c o n t i n u e d
29. Borrowings continuedIn addition, the Group issued the following EMTNs during 2020:
• €700.0m on 6 October 2020 with a maturity of 6 October 2025• £150.0m on 3 November 2020 with a maturity of 5 July 2026
The average debt maturity on our drawn borrowings is currently 4.8 years (2019: 5.5 years).
The Group maintains the following lines of credit:
• £1,050.0m (2019: £900.0m) revolving credit facility, of which £nil (2019: £56.9m) was drawn down at 31 December 2020. Interest is payable at the rate of LIBOR plus a margin
• £109.7m (2019: £152.9m) comprising a number of bilateral bank uncommitted facilities that can be drawn down to meet short-term financing needs, of which £nil (2019: £nil) was drawn at 31 December 2020. These facilities consist of £60.0m (2019: £70.0m), USD 22.3m (2019: USD 22.3m), €nil (2019: €40.0m), AUD 1.0m (2019: AUD 1.0m), CAD 2.0m (2019: CAD 2.0m), SGD 2.3m (2019: SGD 2.3m) and CNY nil (2019: CNY 50.0m). Interest is payable at the local base rate plus a margin
• Four bank guarantee facilities comprising in aggregate up to USD 10.0m (2019: USD 10.0m), €7.0m (2019: €7.0m), £16.0m (2019: £9.0m) and AUD 1.5m (2019: AUD 1.5m)
The effective interest rate for the year ended 31 December 2020 was 3.3% (2019: 3.9%).
The Group’s exposure to liquidity risk is disclosed in Note 32(g).
30. Provisions
Contingent consideration
£m
Acquisition & integration
£m
Property leases
£m
Restructuring provision
£m
Otherprovision1
£mTotal1
£m
At 1 January 2019 40.6 5.2 22.7 3.8 21.2 93.5
IFRS 16 adjustment on adoption at 1 January 2019 – – (10.5) – – (10.5)
Increase in year 3.4 6.9 1.0 9.1 16.5 36.9
Acquisition of subsidiaries1 8.6 – – 0.7 9.3
Currency translation (0.3) – – – – (0.3)
Utilisation (32.8) (10.0) (2.9) (6.2) (11.6) (63.5)
Release (0.8) (1.6) (3.7) (2.5) (2.7) (11.3)
At 1 January 20201 18.7 0.5 6.6 4.2 24.1 54.1Increase in year 1.9 21.2 35.4 47.6 56.9 163.0Utilisation (13.7) (20.8) (7.4) (29.8) (50.4) (122.1)Release (0.2) (0.1) (2.5) (1.0) (1.7) (5.5)At 31 December 2020 6.7 0.8 32.1 21.0 28.9 89.5
2020
Current liabilities 0.4 0.8 7.3 20.6 15.6 44.7Non-current liabilities 6.3 – 24.8 0.4 13.3 44.820191
Current liabilities 13.3 0.5 0.6 3.9 16.7 35.0
Non-current liabilities 5.4 – 6.0 0.3 7.4 19.1
1. 2019 restated for updates to provisional acquisition accounting (see Note 4)
Contingent consideration will be paid primarily in one to two years. The contingent consideration is based on future business valuations and profit multiples (both Level 3 fair value measurements) and has been estimated on an acquisition by acquisition basis using available profit forecasts (a significant unobservable input). The higher the profit forecast, the higher the fair value of any contingent consideration (subject to any maximum payout clauses), and if all future business valuations and profit multiples were achieved, the maximum undiscounted amounts payable for contingent consideration would be £8.9m (2019: £138.6m).
Acquisition & integration provisions relate to the costs and fees incurred in acquiring businesses and subsequently integrating these into the Group. Of the £21.2m increase in the year £2.6m relates to acquisitions and the remaining £18.6m is associated with the UBM and IHS Markit TMT Research and Intelligence portfolio integrations.
The £35.4m property lease increase in the year relates to provisions for the future costs of a number of office properties that have been permanently vacated. These provisions will be utilised over the course of the remaining lease. We expect the £24.8m non-current property lease provisions to be fully utilised by 31 December 2029.
Restructuring provisions occur as a result of business restructuring and operating model changes within the Group. The Group’s 2020 severance programme resulted in a £43.4m increase in year with £20.3m expected to be utilised in 2021.
Other provisions primarily consist of onerous contracts, legal and various other claims. Of the £56.9m increase in year £47.3m relates to onerous contracts provisions for events which have been cancelled or postponed as a result of COVID-19 and the costs cannot be recovered. £3.1m of this provision remains at 31 December 2020 and is expected to be utilised in 2021. Also included in the £28.9m provision at 31 December 2020 are £11.8m relating to multiple legal claims.
31. Trade and other payables and deferred incomeTrade and other payables
2020£m
20191
£m
Current
Deferred consideration 0.2 2.5
Trade payables2 62.7 99.8
Accruals 248.9 329.0
Other payables 31.9 51.5
Total current 343.7 482.8
Non-current
Other payables 16.2 17.4
Total non-current 16.2 17.4
359.9 500.2
1. 2019 restated for updates to provisional acquisition accounting (see Note 4)
2. Included within trade payables is a £7.9m (2019: £nil) refund provision relating to amounts which may need to be repaid for cancelled or postponed events
Trade payables and accruals principally comprise amounts outstanding for trade purchases and ongoing costs. The average credit period taken for trade purchases is 45 days (2019: 44 days). There are no suppliers who represent more than 10% of the total balance of trade payables in either 2020 or 2019. The Group has financial risk management policies in place to ensure that all payables are paid within the credit timeframe. Therefore, under the normal course of business, the Group is not charged interest on overdue payables. The Directors consider that the carrying amount of trade payables is approximate to their fair value.
Deferred income
2020£m
2019£m
Total current 700.6 746.5
Total non-current 2.7 3.3
Total 703.3 749.8
Deferred income relates to payments received or to be received in advance of the satisfaction of a performance obligation. Non-current amounts relate to payment in advance received or to be received for biennial and triennial events and exhibitions.
INFO
RM
A P
LC A
NN
UA
L R
EP
OR
T A
ND
AC
CO
UN
TS
20
20 IN
FOR
MA
PLC
AN
NU
AL R
EP
OR
T AN
D A
CC
OU
NT
S 20
20
190 191
FIN
AN
CIA
L S
TA
TE
ME
NT
S

N O T E S T O T H E C O N S O L I D A T E D F I N A N C I A L S T A T E M E N T S F O R T H E Y E A R E N D E D 3 1 D E C E M B E R 2 0 2 0 c o n t i n u e d
32. Financial instruments(a) Financial risk managementThe Group has exposure to the following risks from its use of financial instruments:
• Market risk• Credit risk• Liquidity risk
This note presents information about the Group’s exposure to each of the above risks, the Group’s management of capital, and the Group’s objectives, policies and procedures for measuring and managing risk.
The Board of Directors has overall responsibility for the establishment and oversight of the Group’s risk management framework. The Board has established a Treasury Committee which is responsible for developing and monitoring the Group’s financial risk management policies. The Treasury Committee meets regularly and reports to the Audit Committee on its activities.
The Group Treasury function provides services to the Group’s businesses, co-ordinates access to domestic and international financial markets, and monitors and manages the financial risks relating to the operations of the Group. These risks include market risk (including currency risk, interest risk and price risk), credit risk and liquidity risk.
The Treasury Committee has put in place policies to identify and analyse the financial risks faced by the Group and has set appropriate limits and controls. These policies provide written principles on funding investments, credit risk, foreign exchange risk and interest rate risk. Compliance with policies and exposure limits is reviewed by the Treasury Committee. This Committee is assisted in its oversight role by the Internal Audit function, which undertakes both regular and ad hoc reviews of risk management controls and procedures, the results of which are reported to the Audit Committee.
Capital risk managementThe Group manages its capital to ensure that the Group is able to continue as a going concern while maximising the return to stakeholders and supporting the future development of the business. In order to maintain or adjust the capital structure, the Group may suspend or adjust the amount of dividends paid to Shareholders, return capital to Shareholders, issue new shares or sell assets to reduce debt.
The capital structure of the Group consists of net debt, which includes borrowings (Note 29), and cash and cash equivalents (Note 28), and equity attributable to equity holders of the parent, comprising issued capital (Note 35), reserves and retained earnings.
Cost of capitalThe Group’s Treasury Committee reviews the Group’s capital structure on a regular basis and, as part of this review, the Committee considers the weighted average cost of capital and the risks associated with each class of capital.
Leverage ratioDebt covenants ceased to apply to all the Group’s borrowing facilities from November 2020 following the repayment of debt subject to debt covenants. The previous principal financial covenant ratios under the Group’s borrowing facilities were maximum net debt to covenant-adjusted EBITDA of 3.5 times and minimum EBITDA interest cover of 4.0 times.
Under these previous covenant ratios at 31 December 2020, the ratio of net debt (using average exchange rates) to EBITDA was 5.6 times (2019: 2.5 times). The ratio of EBITDA to net interest payable in the year ended 31 December 2020 was 3.6 times (2019: 9.4 times). See the glossary of terms on page 228 for the definition of these previous leverage and interest cover ratios.
(b) Categories of financial instrumentsDetails of the significant accounting policies and methods adopted, including the criteria for recognition, the basis of measurement and the basis on which income and expenses are recognised in respect of each class of financial asset, financial liability and equity instrument, are disclosed in Note 2.
Notes2020
£m20191
£m
Financial assets
Trade receivables 23 216.5 252.3
Other receivables 23 59.9 79.2
Finance lease receivables 38 7.9 15.3
Cash at bank and on hand 28 299.4 195.1
Derivative assets associated with borrowings 27 44.6 3.9
Investments in unquoted companies 20 7.3 10.1
Total financial assets 635.6 555.9
Financial liabilities
Bank borrowings 29 (2.6) 54.7
Private placement loan notes 29 – 1,210.1
Bond borrowings 29 2,095.8 1,268.1
Lease liabilities 38 280.8 316.6
Derivative liabilities associated with borrowings 27 7.5 22.4
Derivative liabilities associated with put options over non-controlling interests 24 – 36.4
Trade payables 31 62.7 99.8
Accruals 31 248.9 329.0
Other payables 31 48.1 68.9
Deferred consideration 31 0.2 2.5
Contingent consideration 30 6.7 18.7
Total financial liabilities 2,748.1 3,427.2
1. 2019 restated for updates to provisional acquisition accounting (see Note 4)
(c) Market riskMarket risk is the risk that changes in market prices, such as foreign exchange and interest rates, will affect the Group’s income or the value of its holdings of financial instruments.
The Group manages these risks by maintaining a mix of fixed and floating rate debt and currency borrowings using derivatives where necessary. The Group does not use derivative contracts for speculative purposes.
The Group’s overall risk management programme focuses on the unpredictability of financial markets and seeks to minimise adverse effects on the Group’s financial performance. Risk management is carried out by a central Treasury function under policies approved by the Board of Directors. There has been no change to the Group’s exposure to market risks or the manner in which these risks are managed and measured.
INFO
RM
A P
LC A
NN
UA
L R
EP
OR
T A
ND
AC
CO
UN
TS
20
20 IN
FOR
MA
PLC
AN
NU
AL R
EP
OR
T AN
D A
CC
OU
NT
S 20
20
192 193
FIN
AN
CIA
L S
TA
TE
ME
NT
S

N O T E S T O T H E C O N S O L I D A T E D F I N A N C I A L S T A T E M E N T S F O R T H E Y E A R E N D E D 3 1 D E C E M B E R 2 0 2 0 c o n t i n u e d
32. Financial instruments continued(d) Interest rate riskThe Group has no significant interest-bearing assets at floating rates, except cash, but is exposed to interest rate risk as entities in the Group borrow funds at both fixed and floating interest rates. Borrowings issued at variable rates expose the Group to cash flow interest rate risk. Borrowings issued at or converted to fixed rates expose the Group to fair value interest rate risk.
The interest rate risk is managed by maintaining an appropriate mix of fixed and floating rate borrowings and by the use of interest rate swap contracts. The Group’s exposures to interest rates on financial assets and financial liabilities are detailed in the liquidity risk section of this note.
The following table details financial liabilities by interest category:
2020 20191
Fixed rate£m
Floating rate£m
Non-interest bearing
£mTotal
£mFixed rate
£mFloating rate
£m
Non-interest bearing
£mTotal
£m
Bank overdraft – – – – – – – –
Bank borrowings – (2.6) – (2.6) – 54.7 – 54.7
Private placement loan notes – – – – 1,175.3 34.8 – 1,210.1
Bond borrowings 2,095.8 – – 2,095.8 1,268.1 – – 1,268.1
Lease liabilities 280.8 – – 280.8 316.6 – – 316.6
Derivatives liabilities associated with borrowings 7.5 – – 7.5 22.4 – – 22.4
Derivative liabilities associated with put options over non-controlling interests – – – – – – 36.4 36.4
Trade payables – – 62.7 62.7 – – 99.8 99.8
Accruals – – 248.9 248.9 – – 329.0 329.0
Other payables – – 48.1 48.1 – – 68.9 68.9
Deferred consideration – – 0.2 0.2 – – 2.5 2.5
Contingent consideration – – 6.7 6.7 – – 18.7 18.7
2,384.1 (2.6) 366.6 2,748.1 2,782.4 89.5 555.3 3,427.2
1. 2019 restated for updates to provisional acquisition accounting (see Note 4)
Interest rate sensitivity analysis100% (2019: 97%) of borrowings are at fixed interest rates; hence the Group’s interest rate sensitivity would only be affected by the exposure to variable rate debt.
If interest rates had been 100 basis points higher or lower and all other variables were held constant, the Group’s profit for the year would have decreased or increased by £nil (2019: £0.9m).
Derivatives designated in hedge relationships2020
£m2019
£m
Interest rate swaps – derivative financial assets – 1.4
The interest rate swaps are used to increase the Group’s exposure to interest rates to maintain a balance of fixed and floating interest rate cost.
At 31 December 2019, the Group had an interest rate swaps in place for $76.1m matched against $76.1m of the US private placement loan notes due June 2024; this was recognised in a fair value through profit and loss relationship. This interest rate swap was closed when the US private placement notes were repaid in November 2020, with any amounts being recognised in the Income Statement.
(e) Foreign currency riskThe Group is a business with significant net USD transactions; hence exposures to exchange rate fluctuations arise.
Allied to the Group’s policy on the hedging of surplus foreign currency cash inflows, the Group will usually seek to finance its net investment in its principal overseas subsidiaries by borrowing in those subsidiaries’ functional currencies, primarily USD. This policy has the effect of partially protecting the Group’s Consolidated Balance Sheet from movements in those currencies to the extent that the associated net assets are hedged by the net foreign currency borrowings.
The carrying amounts of the Group’s foreign currency denominated monetary assets and liabilities at the reporting date are as follows:
Assets Liabilities
2020£m
2019£m
2020£m
2019£m
USD 606.9 336.7 (509.1) (1,936.8)
EUR 46.9 40.9 (1,071.4) (1,115.0)
Other 45.1 352.3 (1,086.0) (1,024.9)
698.9 729.9 (3,379.2) (4,076.7)
The foreign currency borrowings of £1,661.1m (2019: £2,248.8m) are used to hedge the Group’s net investments in foreign subsidiaries.
Average rate Closing rate
2020 2019 2020 2019
USD 1.29 1.28 1.37 1.32
Foreign currency sensitivity analysisIn 2020, the Group earned approximately 63% (2019: 59%) of its revenues and incurred approximately 48% (2019: 53%) of its costs in USD or currencies pegged to USD. The Group is therefore sensitive to movements in USD against GBP. In 2020, each $0.01 movement in the USD to GBP exchange rate has a circa £8m (2019: circa £13m) impact on revenue and a circa £3m (2019: circa £5m) impact on adjusted operating profit. Offsetting this are reductions to the value of USD borrowings, interest and tax liabilities. This analysis assumes all other variables, including interest rates, remain constant.
Derivatives designated in hedge relationships2020
£m2019
£m
Cross currency swaps – derivative financial assets 44.6 2.5
Cross currency swaps – derivative financial liabilities (7.5) (22.4)
There are cross currency swaps over the EMTN borrowings where the Company receives the following:
• A fixed rate of interest for £450.0m of EMTN borrowings with a maturity of July 2026 and pays a fixed rate of interest for $588.9m
• A fixed rate of interest on €150.0m of EMTN borrowings with a maturity of July 2023 and pays a fixed rate of interest for $174.1m
• A fixed rate of interest on €500m of EMTN borrowings with a maturity of April 2028 and pays a fixed rate of interest for $551.6m
• A fixed rate of interest on €700.0m of EMTN borrowings with a maturity of October 2025 and pays a fixed rate of interest for $821.6m
INFO
RM
A P
LC A
NN
UA
L R
EP
OR
T A
ND
AC
CO
UN
TS
20
20 IN
FOR
MA
PLC
AN
NU
AL R
EP
OR
T AN
D A
CC
OU
NT
S 20
20
194 195
FIN
AN
CIA
L S
TA
TE
ME
NT
S

N O T E S T O T H E C O N S O L I D A T E D F I N A N C I A L S T A T E M E N T S F O R T H E Y E A R E N D E D 3 1 D E C E M B E R 2 0 2 0 c o n t i n u e d
32. Financial instruments continuedAt 31 December 2020, the fair value of these swaps was a net financial asset of £37.1m (2019: £19.9m liability); of these amounts a £49.8m (2019: £1.5m) asset was designated in a net investment hedge relationship and a £12.7m (2019: £21.4m) liability was designated in a cash flow hedge relationship.
Of the amounts in hedging relationships, there was £98.2m (2019: £58.2m) loss within the net investment hedging reserve, £1.5m (2019: £2.6m) gain within the cash flow hedging reserve and £2.8m (2019: £1.5m) gain within the cost of hedging reserve. All amounts relate to continuing hedge relationships.
These hedges were assessed to be highly effective at 31 December 2020 with the small ineffective portions of the hedging contracts included in financing income.
(f) Credit riskThe Group’s principal financial assets are trade and other receivables (Note 23) and cash and cash equivalents (Note 28), which represent the Group’s maximum exposure to credit risk in relation to financial assets.
Credit risk refers to the risk that a counterparty will default on its contractual obligations resulting in financial loss to the Group. The Group has adopted a policy of assessing creditworthiness of counterparties as a means of mitigating the risk of financial loss from defaults.
The Group’s exposure and the creditworthiness of its counterparties are continuously monitored, and the aggregate value of transactions concluded is spread amongst approved financial institutions. Credit exposure is controlled by counterparty limits that are reviewed and approved as part of the Group’s treasury policies.
The carrying amount of financial assets recorded in the financial statements, which is net of impairment losses, represents the Group’s maximum exposure to credit risk.
Trade receivablesThe Group’s credit risk is primarily attributable to its trade receivables and the amounts presented in the Consolidated Balance Sheet are net of the expected credit loss (ECL). Trade receivables consist of a large number of customers, spread across diverse industries and geographic areas, and the Group’s exposure to credit risk is influenced mainly by the individual characteristics of each customer. The Group does not have significant credit risk exposure to any single counterparty or any group of counterparties having similar characteristics. The Group defines counterparties as having similar characteristics if they are related entities. Concentration of credit risk did not exceed 5% of gross trade receivables at any time during the year and we have not experienced a significant increase in concentration of credit risk as a result of the COVID-19 pandemic.
All customers have credit limits set by credit managers and are subject to the standard terms of payment of each Division. As Informa Markets, Informa Connect and the journals part of the Taylor & Francis Division operate predominantly on a prepaid basis, they are not subject to the same credit controls and they have a low bad debt history. The Group is exposed to normal credit risk and potential losses are mitigated as the Group does not have significant exposure to any single customer.
The Group recognises lifetime ECL for trade receivables using a provisioning matrix. The ECL is estimated based on the Group’s historical credit loss experience, adjusted for factors that are specific to the debtors, general economic conditions and an assessment of both the current as well as the forecast direction of conditions at the reporting date, including time value of money where appropriate. The carrying amount is reduced by the ECL through the use of a provision account. The Group writes off a trade receivable against the provision account when the receivable is considered uncollectible. This occurs when the debtor is in severe financial difficulty and there is no realistic prospect of recovery, e.g. when the debtor has been placed under liquidation or has entered into bankruptcy proceedings. None of the trade receivables that have been written off are subject to enforcement activities. Subsequent recoveries of amounts previously written off are credited against the provision account. Changes in the carrying amount of the provision are recognised in the Consolidated Income Statement.
We have assessed the impact of the COVID-19 pandemic on our ECL and concluded that there were no significant changes required in the estimation techniques or significant assumptions during the current reporting period.
The Directors consider that the carrying amount of trade and other receivables approximates their fair value.
Ageing of trade receivables:
Gross 2020
£m
Provision2020
£m
Gross2019
£m
Provision20191
£m
Not past due 123.6 – 126.0 –
Past due 0–30 days 54.8 – 73.2 –
Past due over 31 days 85.8 (32.5) 87.8 (19.2)
Books provision (see below) – (15.2) – (15.5)
264.2 (47.7) 287.0 (34.7)
1. 2019 restated for updates to provisional acquisition accounting (see Note 4)
Trade receivables that are less than three months past due for payment are generally not considered impaired. For trade receivables that are more than three months past due for payment, there are debtors with a carrying amount of £22.2m (2019: £25.8m) which the Group has not provided for, as there has not been a significant change in the credit quality and the amounts are considered recoverable. The Group does not hold any collateral over these balances.
A provision relating to returns on books which are yet to be paid for of £15.2m (2019: £15.5m) has been disclosed separately in the table above. This is based on the Group’s best estimate of returns for future periods, taking account of returns trends, and the amount is included as part of the overall provision balance of £47.7m (2019: £34.7m).
Movement in the provision:
2020£m
20191
£m
1 January 34.4 37.7
Arising on acquisition of subsidiaries and operations – –
Provision recognised 28.5 18.1
Receivables written off as uncollectible (5.1) (8.5)
Amounts recovered during the year (10.1) (12.6)
31 December 47.7 34.7
1. 2019 restated for updates to provisional acquisition accounting (see Note 4)
There are no customers who represent more than 5% of the total gross balance of trade receivables in either 2020 or 2019.
Non-current other receivablesNon-current other receivables mainly arise from disposals made in the current and prior years. The Audit Committee reviews these receivables and the credit quality of the counterparties on a regular basis. The movement in the provision representing the ECL on non-current other receivables is as follows:
2020£m
2019£m
1 January 3.4 –
Provision recognised 3.4 3.4
31 December 6.8 3.4
INFO
RM
A P
LC A
NN
UA
L R
EP
OR
T A
ND
AC
CO
UN
TS
20
20 IN
FOR
MA
PLC
AN
NU
AL R
EP
OR
T AN
D A
CC
OU
NT
S 20
20
196 197
FIN
AN
CIA
L S
TA
TE
ME
NT
S

N O T E S T O T H E C O N S O L I D A T E D F I N A N C I A L S T A T E M E N T S F O R T H E Y E A R E N D E D 3 1 D E C E M B E R 2 0 2 0 c o n t i n u e d
32. Financial instruments continued(g) Liquidity riskLiquidity risk is the risk that the Group will not be able to meet its financial obligations as they fall due. Ultimate responsibility for liquidity risk management rests with the Board of Directors, though operationally it is managed by Group Treasury with oversight by the Treasury Committee. Group Treasury has built an appropriate liquidity risk management framework for the management of the Group’s short-, medium- and long-term funding. The Group manages liquidity risk by maintaining adequate reserves and debt facilities, together with continuously monitoring forecast and actual cash flows and matching the maturity profiles of financial assets and liabilities. Included in Note 29 is a summary of additional undrawn facilities that the Group has at its disposal.
Historically and for the foreseeable future the Group has been, and is expected to continue to be, in a net borrowing position. The Group’s policy is to fulfil its borrowing requirements by borrowing in the currencies in which it operates, principally USD and EUR; thereby providing a natural hedge against projected future surplus USD cash inflows.
(h) Liquidity and interest risk tablesThe following tables detail the Group’s remaining contractual maturities for its financial assets and liabilities.
The table below presents the contractual maturities of the financial assets, including interest that will be earned on those assets except where the Group anticipates that the cash flow will occur in a different period.
Carrying amount
£m
Contractualcash flows1
£m
Less than1 year
£m1–2 years
£m2–5 years
£m
Greater than5 years
£m
31 December 2020
Non-derivative financial assets
Lease receivable 7.9 8.4 1.7 1.7 2.7 2.3Non-interest bearing 583.1 575.8 555.6 20.2 – –
591.0 584.2 557.3 21.9 2.7 2.3Derivative financial assets
Interest rate swaps – – – – – –Cross currency swaps 44.6 17.2 16.2 16.2 18.8 (34.0)
635.6 601.4 573.5 38.1 21.5 (31.7)31 December 2019
Non-derivative financial assets
Lease receivable 15.3 16.7 2.9 2.3 5.6 5.9
Non-interest bearing 536.7 526.6 498.8 27.8 – –
552.0 543.3 501.7 30.1 5.6 5.9
Derivative financial assets
Interest rate swaps 1.4 2.1 0.4 0.5 1.2 –
Cross currency interest rates swaps 2.5 (67.5) (9.0) (9.0) (27.0) (22.5)
555.9 477.9 493.1 21.6 (20.2) (16.6)
1. Under IFRS 7 contractual cash flows are undiscounted and therefore may not agree with the carrying amounts in the Consolidated Balance Sheet
The following tables present the earliest date on which the Group can settle its financial liabilities. The table includes both interest and principal cash flows.
Carrying amount
£m
Contractualcash flows1
£m
Less than1 year
£m1–2 years
£m2–5 years
£m
Greater than5 years
£m
31 December 2020
Non-derivative financial liabilities
Variable interest rate instruments (2.6) 7.0 1.7 1.7 3.5 0.1Fixed interest rate instruments 2,095.8 2,315.6 41.9 41.9 1,312.9 918.9Lease liabilities 280.8 419.0 44.3 37.0 82.2 255.5Trade and other payables 359.7 359.7 343.5 16.2 – –Deferred consideration 0.2 0.2 0.2 – – –Contingent consideration 6.7 6.7 0.4 6.3 – –
2,740.6 3,108.2 432.0 103.1 1,398.6 1,174.5Derivative financial liabilities
Cross currency interest rate swaps 7.5 13.8 8.1 8.1 7.5 (9.9)Put options over non-controlling interests – – – – – –
2,748.1 3,122.0 440.1 111.2 1,406.1 1,164.631 December 20192
Non-derivative financial liabilities
Variable interest rate instruments 89.5 100.2 4.1 4.0 92.1 –
Fixed interest rate instruments 2,443.4 2,836.1 222.3 63.3 909.8 1,640.7
Lease liabilities 316.6 466.0 47.5 41.1 95.6 281.8
Trade and other payables 497.7 497.7 480.3 17.4 – –
Deferred consideration 2.5 2.5 2.5 – –
Contingent consideration 18.7 18.7 7.2 11.5 – –
3,368.4 3,921.2 763.9 137.3 1,097.5 1,922.5
Derivative financial liabilities
Cross currency interest rate swaps 22.4 48.9 8.9 8.9 25.0 6.1
Put options over non-controlling interests 36.4 36.4 36.4 – – –
Total financial liabilities 3,427.2 4,006.5 809.2 146.2 1,122.5 1,928.6
1. Under IFRS 7 contractual cash flows are undiscounted and therefore may not agree with the carrying amounts in the Consolidated Balance Sheet
2. 2019 restated for updates to provisional acquisition accounting (see Note 4)
(i) Fair value of financial instrumentsFinancial assets and financial liabilities measured at fair value in the Consolidated Balance Sheet:
CarryingAmount
2020£m
Estimated fair value
2020£m
Carryingamount
2019£m
Estimated fair value
2019£m
Financial assets
Derivative financial instruments in designated hedge accounting relationships 44.6 44.6 3.9 3.9
Unhedged derivative financial instruments – – – –
Equity investments in unquoted companies 7.3 7.3 10.1 10.1
51.9 51.9 14.0 14.0
Financial liabilities
Derivative financial instruments in designated hedge accounting relationships 7.5 7.5 22.4 22.4
Derivative liabilities associated with put options over non-controlling interests – – 36.4 36.4
Contingent and deferred consideration on acquisitions 6.9 6.9 21.2 21.2
14.4 14.4 80.0 80.0
INFO
RM
A P
LC A
NN
UA
L R
EP
OR
T A
ND
AC
CO
UN
TS
20
20 IN
FOR
MA
PLC
AN
NU
AL R
EP
OR
T AN
D A
CC
OU
NT
S 20
20
198 199
FIN
AN
CIA
L S
TA
TE
ME
NT
S

N O T E S T O T H E C O N S O L I D A T E D F I N A N C I A L S T A T E M E N T S F O R T H E Y E A R E N D E D 3 1 D E C E M B E R 2 0 2 0 c o n t i n u e d
32. Financial instruments continued(j) Fair values and fair value hierarchyValuation techniques use observable market data where it is available and rely as little as possible on entity-specific estimates. The fair values of interest rate swaps and forward exchange contracts are measured using discounted cash flows. Future cash flows are based on forward interest/exchange rates (from observable yield curves/forward exchange rates at the end of the reporting period) and contract interest/forward rates, discounted at a rate that reflects the credit risk of the counterparties.
The fair values of put options over non-controlling interests (including exercise price) and contingent and deferred consideration on acquisitions are measured using discounted cash flow models with inputs derived from the projected financial performance in relation to the specific contingent consideration criteria for each acquisition, as no observable market data is available. The fair values are most sensitive to the projected financial performance of each acquisition; management makes a best estimate of these projections at each financial reporting date and regularly assesses a range of reasonably possible alternatives for those inputs and determines their impact on the total fair value. An increase of 20% to the projected financial performance used in the put option measurements would increase the aggregate liability by £nil. The fair value of the contingent and deferred consideration on acquisitions is not significantly sensitive to a reasonable change in the forecast performance. The potential undiscounted amount for all future payments that the Group could be required to make under the contingent consideration arrangements for all acquisitions is disclosed in Note 30.
Financial instruments that are measured subsequently to initial recognition at fair value are grouped into Levels 1 to 3, based on the degree to which the fair value is observable, as follows:
Level 1 fair value measurements are those derived from unadjusted quoted prices in active markets for identical assets or liabilities.
Level 2 fair value measurements are those derived from inputs, other than quoted prices included within Level 1, that are observable for the asset or liability, either directly (as prices) or indirectly (derived from prices).
Level 3 fair value measurements are those derived from valuation techniques that include inputs for the asset or liability that are not based on observable market data (unobservable inputs), such as internal models or other valuation methods. Level 3 balances include investments where, in the absence of market data, these are held at cost, and adjusted for impairments which are taken to approximate to fair value. Level 3 balances for contingent consideration use future cash flow forecasts to determine the fair value, with the fair value of deferred consideration balances taken as the receivable amount adjusted for an impairment assessment. The fair value of put options over non-controlling interest uses the present value of the latest cash flow forecast for each business.
Financial assets and liabilities measured at fair value in the Consolidated Balance Sheet and their categorisation in the fair value hierarchy 31 December 2020 and 31 December 2019:
Level 12020
£m
Level 22020
£m
Level 32020
£m
Total2020
£m
Financial assets
Derivative financial instruments in designated hedge accounting relationships1 – 44.6 – 44.6Equity investments in unquoted companies (Note 20) – – 7.3 7.3
– 44.6 7.3 51.9Financial liabilities at fair value through profit or loss
Derivative financial instruments in designated hedge accounting relationships1 – 7.5 – 7.5Unhedged derivative financial instruments – 0.2 – 0.2Deferred consideration on acquisitions2 – – 0.2 0.2Contingent consideration on acquisitions (Note 30) – – 6.7 6.7Put options over non-controlling interests3 – – – –
– 7.7 6.9 14.6
1. Amounts relates to interest rate swaps associated with Euro Medium Term Notes. Refer to Note 29
2. £2.3m reduction from the prior year reflects a £2.3m decrease from payments relating to prior year acquisitions
3. £36.4m reduction from the prior year reflects £43.3m cash paid offset by £8.5m fair value movement in put options and £0.5m from foreign exchange movements
Level 12019
£m
Level 22019
£m
Level 32019
£m
Total2019
£m
Financial assets
Derivative financial instruments in designated hedge accounting relationships – 3.9 – 3.9
Unhedged derivative financial instruments – – – –
Equity investments in unquoted companies (Note 20) – – 10.1 10.1
– 3.9 10.1 14.0
Financial liabilities at fair value through profit or loss
Private placement loan notes – 61.8 – 61.8
Derivative financial instruments in designated hedge accounting relationships1 – 22.4 – 22.4
Deferred consideration on acquisitions2 – – 2.5 2.5
Contingent consideration on acquisitions (Note 30) – – 18.7 18.7
Put options over non-controlling interests3 – – 36.4 36.4
– 84.2 57.6 141.8
1. £22.4m relates to interest rate swaps associated with Euro Medium Term Notes. Refer to Note 24
2. £0.9m reduction from the prior year reflects a £1.6m decrease from payments relating to prior year acquisitions and a £0.7m increase arising from current year acquisitions
3. £42.5m reduction from the prior year reflects £32.2m cash paid, £1.3m reduction from disposals, £7.5m reduction from transfers to other payables and £1.5m reduction from foreign exchange movements
Fair value of other financial instruments (unrecognised)The Group also has a number of financial instruments which are not measured at fair value in the balance sheet. For the majority of these instruments, the fair values are not materially different to their carrying amounts, since the interest receivable/payable is either close to current market rates or the instruments are short-term in nature. Significant differences were identified for the following instruments at 31 December 2020 and 31 December 2019:
Carrying amount 31 December
2020£m
Estimated fair value 31
December 2020
£m
Carrying amount 31 December
2019£m
Estimated fair value
2019£m
Financial liabilities
Private placement loan notes – – 1,148.3 1,226.4
Bond borrowings 2,095.8 2,186.7 1,268.1 1,309.0
Total 2,095.8 2,186.7 2,416.4 2,535.4
INFO
RM
A P
LC A
NN
UA
L R
EP
OR
T A
ND
AC
CO
UN
TS
20
20 IN
FOR
MA
PLC
AN
NU
AL R
EP
OR
T AN
D A
CC
OU
NT
S 20
20
20 0 201
FIN
AN
CIA
L S
TA
TE
ME
NT
S

N O T E S T O T H E C O N S O L I D A T E D F I N A N C I A L S T A T E M E N T S F O R T H E Y E A R E N D E D 3 1 D E C E M B E R 2 0 2 0 c o n t i n u e d
33. Notes to the Cash Flow Statement
Notes2020
£m2019
£m
(Loss)/profit before tax (1,139.7) 318.7
Adjustments for:
Depreciation of property and equipment 19 16.8 17.2
Depreciation of right of use asset 38 30.3 33.1
Amortisation of other intangible assets 17 332.9 354.3
Impairment – goodwill 8 592.9 0.9
Impairment – investments 3.9 –
Impairment – acquisition intangible assets 17 38.5 3.8
Impairment – property and equipment 8.8Impairment – IFRS 16 right of use assets 38 36.1 4.6
Share-based payments 10 11.2 10.4
Subsequent remeasurement of contingent consideration 8 (3.1) 3.2
Finance lease modifications (2.2) –
Loss on disposal of businesses 21 8.4 95.4
Loss on disposal of property and equipment and software 0.9 –
Finance income 11 (15.3) (10.1)
Finance costs 12 266.2 134.1
Share of adjusted results of joint ventures and associates 20 (0.8) (1.5)
Operating cash inflow before movements in working capital 185.8 964.1
Decrease in inventories 7.2 12.3
Decrease in receivables 114.8 20.6
Decrease in payables (148.5) (33.1)
Movements in working capital (26.5) (0.2)
Pension deficit recovery contributions 34 (6.2) (5.4)
Cash generated by operations 153.1 958.5
34. Retirement benefit schemes(a) Charge to operating profitThe charge to operating profit for the year in respect of pensions, including both defined benefit and defined contribution schemes, was £21.6m (2019: £21.8m).
(b) Defined benefit schemes – strategyThe Group operates four defined benefit pension schemes in the UK (the UK Schemes): the Informa Final Salary Scheme (FSS), the Taylor & Francis Group Pension and Life Assurance Scheme, the UBM Pension Scheme (UBMPS) and the United Newspapers Executive Pension Scheme (UNEPS). These are for qualifying UK colleagues and provide benefits based on final pensionable pay. The Group has two defined benefit schemes in the US, the Penton, Inc. Retirement Plan and the Penton Media, Inc. Supplemental Executive Retirement Plan (together, the US Schemes). All schemes (the Group Schemes) are closed to future accrual. Contributions to the UK Schemes are determined following triennial valuations undertaken by a qualified actuary using the Projected Unit Credit Method. Contributions to the US Schemes are assessed annually following valuations undertaken by a qualified actuary.
For the UK Schemes, the defined benefit schemes are administered by separate funds that are legally separated from the Company. The Trustees are responsible for running the UK Schemes in accordance with the Group Schemes’ Trust Deed and Rules, which sets out their powers. The Trustees of the UK Schemes are required to act in the best interests of the beneficiaries of the Group Schemes. There is a requirement that one third of the Trustees are nominated by the members of the UK Schemes. The Trustees of the pension funds are responsible for the investment policy with regard to the assets of the fund. None of the Schemes have any reimbursement rights.
The Group’s pension funding policy is to provide sufficient funding, as agreed with the Trustees, to ensure any pension deficit will be addressed to ensure pension payments made to current and future pensioners will be met.
For the Penton Schemes, the defined benefit scheme is administered by Informa Media, Inc. and is subject to the provisions of the Employee Retirement Income Security Act 1974 (ERISA). The Company is responsible for the investment policy with regard to the assets of the fund. The defined benefit scheme has no reimbursement rights.
The investment strategies adopted by the Trustees of the UK Schemes include some exposure to index-linked gilts and corporate bonds. The investment objectives of the US Schemes are to maximise plan assets within designated risk and return profiles. The current asset allocation of all schemes consists primarily of equities, bonds, property, diversified growth funds, credit funds, LIBOR funds, bespoke funds and annuity contracts. All assets are managed by a third party investment manager according to guidelines established by the Company.
(c) Defined benefit schemes – riskThrough the Group Schemes the Company is exposed to a number of potential risks as described below:
• Asset volatility: The Group Schemes’ defined benefit obligation is calculated using a discount rate set with reference to corporate bond yields; however, the Group Schemes invest significantly in equities. These assets are expected to outperform corporate bonds in the long term, but provide volatility and risk in the short term
• Changes in bond yields: A decrease in corporate bond yields would increase the Group Schemes’ defined benefit obligation; however, this would be partially offset by an increase in the value of the Schemes’ bond holdings
• Inflation risk: A significant proportion of the Group Schemes’ defined benefit obligation is linked to inflation; therefore higher inflation will result in a higher defined benefit obligation (subject to caps for the UK Schemes). The majority of the UK Schemes’ assets are either unaffected by inflation or only loosely correlated with inflation, therefore an increase in inflation would also increase the deficit
• Life expectancy: If the Group Schemes’ members live longer than expected, the Group Schemes’ benefits will need to be paid for longer, increasing the Group Schemes’ defined benefit obligations
The Trustees and the Company manage risks in the Group Schemes through the following strategies:
• Diversification: Investments are well diversified, such that the failure of any single investment would not have a material impact on the overall level of assets
• Investment strategy: The Trustees are required to review their investment strategy on a regular basis
There are three categories of pension scheme members:
• Employed deferred members: Currently employed by the Company• Deferred members: Former colleagues of the Company• Pensioner members: In receipt of pension
The defined benefit obligation is valued by projecting the best estimate of future benefit payments (allowing for future salary increases for UK employed deferred members, revaluation to retirement for deferred members and annual pension increases for UK members) and then discounting to the balance sheet date. UK members receive increases to their benefits linked to inflation (subject to caps for the UK Schemes). There are no caps on benefits in the US Schemes as benefits are not linked to inflation in these Schemes. The valuation method used for all Schemes is known as the Projected Unit Credit Method.
The approximate overall duration of the Group Schemes’ defined benefit obligation as at 31 December 2020 was as follows:
2020 2019
Informa FSS and T&F Scheme
UBMPS and UNEPS
SchemePenton
Schemes
Informa FSS and T&F Scheme
UBMPS and UNEPS
SchemePenton
Schemes
Overall duration (years) 20 14 15 18 14 14
INFO
RM
A P
LC A
NN
UA
L R
EP
OR
T A
ND
AC
CO
UN
TS
20
20 IN
FOR
MA
PLC
AN
NU
AL R
EP
OR
T AN
D A
CC
OU
NT
S 20
20
202 203
FIN
AN
CIA
L S
TA
TE
ME
NT
S

N O T E S T O T H E C O N S O L I D A T E D F I N A N C I A L S T A T E M E N T S F O R T H E Y E A R E N D E D 3 1 D E C E M B E R 2 0 2 0 c o n t i n u e d
34. Retirement benefit schemes continuedThe assumptions which have the most significant effect on the results of the IAS 19 valuation for the Schemes are those relating to the discount rate, the rates of increase in price inflation, salaries, and pensions and life expectancy. The main assumptions adopted are:
2020 2019
Informa FSS and T&F Scheme
UBMPS and UNEPS
SchemePenton
Schemes
Informa FSS and T&F Scheme
UBMPS and UNEPS
SchemePenton
Schemes
Discount rate 1.30% 1.30% 2.05% 2.10% 2.00% 2.95%
Rate of price inflation 2.10% (CPI) 2.90% (RPI)
2.10% (CPI) 2.90% (RPI) n/a
1.95% (CPI) 2.95% (RPI)
1.95% (CPI) 2.95% (RPI) n/a
Rate of increase for deferred pensions 2.10% 2.10% n/a 1.95% 1.95% n/a
Rate of increase for pensions in payment 1.90%–3.50% 1.90%–3.50% n/a 1.80%–2.85% 1.80%–3.55% n/a
Life expectancy:
For an individual aged 65 – male (years) 87 87 84 86 87 84
For an individual aged 65 – female (years) 89 89 86 88 89 87
For the UK Schemes, mortality assumptions used in the IAS 19 valuations are taken from tables published by Continuous Mortality Investigation (CMI). The UBMPS UK Scheme uses 105% of the ‘SAPS’ S2 tables based on the year of birth and the Informa FSS and T&F UK Schemes use ‘SAPS’ S3 tables with a scaling factor of 100% (2019: 102% for males and 110% for females). All UK Schemes use life expectancy improvements taken from CMI 2019 (2019: CMI 2018) with an initial addition parameter of 0.25% (2019: 0.5% for the UBM UK Schemes and 0% for the other UK schemes) and the long-term rate of improvement of 1.25% (2019: 1.25%). For the valuation of Penton Scheme liabilities, life expectancy has been taken from the PRI-2012 base mortality tables (amounts weighted) by the Society of Actuaries in 2020 (2019: PRI-2012 base mortality tables), with life expectancy improvements projected generationally using Scale MP-2020 (2019: Scale MP-2019).
(d) Defined benefit schemes – individual defined benefit scheme details
As at 31 December 2020Informa
FSS1T&FGPS2 UBMPS3 UNEPS4
Latest valuation date 31.2.2017 30.9.2017 31.3.2017 31.3.2017Funding (shortfall)/surplus at valuation date and agreed recovery plan amounts for UK Schemes
£(5.5)m£2.0m per year to 28 Feb 2021
£1.7m£nil
£(11.2)m£2.5m per year
to 1 March 2022
£4.7m£nil
1. Informa Final Salary Scheme (Informa FSS)
2. Taylor & Francis Group Pension and Life Assurance Scheme (T&F GPS)
3. UBM Pension Scheme (UBMPS)
4. United Newspapers Executive Pension Scheme (UNEPS)
The sensitivities regarding the principal assumptions used to measure the IAS 19 pension scheme liabilities are set out below:
Impact on scheme liabilities: Increase amounts
Sensitivity analysis at 31 December 2020
InformaFSS£m
T&FGPS£m
UBMPS£m
UNEPS£m
Penton£m
Discount rate – Decrease by 0.25% 6.6 1.7 20.8 0.2 1.1Rate of price inflation pre-retirement – Increase by 0.25% 5.8 1.4 10.6 0.3 n/aLife expectancy – Increase by 1 year 4.4 1.3 23.3 1.6 0.7
Sensitivities have been prepared using the same approach as 2019. The above sensitivity analyses are based on a change in an assumption while holding all other assumptions constant, although in practice this is unlikely to occur and changes in some assumptions may be correlated.
(e) Defined benefit schemes – individual defined benefit scheme detailsAmounts recognised in respect of these defined benefit schemes are as follows:
2020£m
2019£m
Recognised in profit before tax
Past service credit (0.7) –
Interest cost on net pension deficit (Note 12) 0.7 1.4
2020£m
2019£m
Recognised in the Consolidated Statement of Comprehensive Income
Actuarial gain on scheme assets 28.8 68.7
Experience gain/(loss) 0.1 (0.8)
Change in demographic actuarial assumptions 1.6 2.4
Change in financial actuarial assumptions (78.1) (71.9)
Actuarial loss (47.6) (1.6)
2020£m
2019£m
Movement in net deficit during the year
Net deficit in schemes at beginning of the year (before irrecoverable element of pension surplus) (27.7) (30.5)
Past service credit 0.7 –
Net finance cost (0.7) (1.4)
Actuarial loss (47.6) (1.6)
Cash payments from Scheme for Scheme costs (1.4) (0.7)
Contributions from the employer to fund Scheme costs 0.8 0.8
Deficit recovery contributions from the employer to the Schemes 5.4 5.4
Effect of movement in foreign currencies 0.7 0.3
Net deficit in Schemes at end of the year (before irrecoverable element of pension surplus) (69.8) (27.7)
Irrecoverable element of pension surplus (1.6) (2.4)
Net deficit in schemes at end of the year after irrecoverable element of pension surplus (71.4) (30.1)
The expected deficit recovery contributions from the employer to the Schemes for 2021 are expected to be £6m subject to any revision of agreed recovery payments following updates to funding valuations.
The amounts recognised in the Consolidated Balance Sheet in respect of the Group Schemes are as follows:
2020£m
2019£m
Present value of defined benefit obligations (786.8) (730.8)
Fair value of Scheme assets 717.0 703.1
Irrecoverable element of pension surplus (1.6) (2.4)
Net deficit (71.4) (30.1)
Reported as:
Retirement benefit surplus recognised in the Consolidated Balance Sheet – 4.9
Deficit in scheme and liability recognised in the Consolidated Balance Sheet (71.4) (35.0)
Net deficit (71.4) (30.1)
INFO
RM
A P
LC A
NN
UA
L R
EP
OR
T A
ND
AC
CO
UN
TS
20
20 IN
FOR
MA
PLC
AN
NU
AL R
EP
OR
T AN
D A
CC
OU
NT
S 20
20
20 4 205
FIN
AN
CIA
L S
TA
TE
ME
NT
S

N O T E S T O T H E C O N S O L I D A T E D F I N A N C I A L S T A T E M E N T S F O R T H E Y E A R E N D E D 3 1 D E C E M B E R 2 0 2 0 c o n t i n u e d
34. Retirement benefit schemes continuedChanges in the present value of defined benefit obligations are as follows:
2020£m
2019£m
Opening present value of defined benefit obligation at 1 January (730.8) (679.2)
Past service credit 0.7 –
Interest cost (14.9) (19.4)
Benefits paid 32.9 36.6
Actuarial loss (76.4) (70.3)
Effect of movement in foreign currencies 1.7 1.5
Closing present value of defined benefit obligation at 31 December (786.8) (730.8)
Changes in the fair value of Scheme assets are as follows:
2020£m
2019£m
Opening fair value of Scheme assets at 1 January 703.1 648.7
Return on Scheme assets 14.2 18.0
Actuarial gain 28.8 68.7
Benefits paid (32.9) (36.6)
Other payments from Schemes (1.4) (0.7)
Contributions from the employer to the Schemes 6.2 6.2
Effect of movement in foreign currencies (1.0) (1.2)
Closing fair value of Scheme assets at 31 December 717.0 703.1
The assets of the Informa Final Salary Scheme and Taylor & Francis Group Pension and Life Assurance Scheme include assets held in managed funds and cash funds operated by Legal & General Investment Management, Partners Group (UK) Limited and Zurich Assurance Limited.
The assets of the UBM Pension Scheme assets are held in equity funds, absolute return bonds and bespoke liability driven investment (LDI) funds with Legal & General, diversified growth funds with Schroders, real return funds with Newton, property funds with Aviva and M&G, an illiquid credit fund with M&G, annuities to cover a small number of pension members and cash.
The assets of the United Newspapers Executive Pension Scheme assets are held in an insurance buy-in policy with Aviva and a Sterling Liquidity Fund with Legal & General.
The assets of the Informa Media, Inc. Retirement Plan are primarily invested in private commingled group trust funds operated by Aon with various investment managers serving as sub-managers within each fund. The Penton Media, Inc. Supplemental Executive Retirement Plan is funded on a pay-as-you-go method (i.e. is unfunded).
The fair values of the assets held are as follows:
31 December 2020
InformaFSS£m
T&FGPS£m
UBMPS£m
UNEPS£m
Penton£m
Total£m
Equities 49.0 12.8 158.4 – 13.0 233.2Bonds and gilts – – – – 11.1 11.1Property 9.7 3.8 73.8 – 4.2 91.5Diversified growth fund 26.2 7.7 130.8 – – 164.7Illiquid credit funds 2.3 0.7 48.3 – – 51.3Absolute return bond fund – – 1.4 – – 1.4Bespoke funds (LDI and hedge funds) 11.5 3.9 114.5 – 2.0 131.9Annuity contracts – – 6.1 13.4 – 19.5Cash 6.5 1.3 2.6 1.6 0.4 12.4Total 105.2 30.2 535.9 15.0 30.7 717.0
31 December 2019
InformaFSS£m
T&FGPS£m
UBMPS£m
UNEPS£m
Penton£m
Total£m
Equities 46.0 12.0 161.9 – 13.7 233.6
Bonds and gilts 3.2 0.9 – 21.9 11.1 37.1
Property 9.5 3.8 74.3 – 4.5 92.1
Diversified growth fund 25.3 7.5 121.9 – – 154.7
Illiquid credit funds – – 51.4 – – 51.4
Absolute return bond fund – – 14.8 0.6 – 15.4
Bespoke funds (LDI and hedge funds) 8.0 2.7 88.7 – 2.2 101.6
Annuity contracts – – 6.3 – – 6.3
Cash 7.1 1.8 1.7 – 0.3 10.9
Total 99.1 28.7 521.0 22.5 31.8 703.1
All the assets listed above have a quoted market price in an active market, with the exception of annuities and cash. The Group Schemes’ assets do not include any of the Group’s own financial instruments, nor any property occupied by, or other assets used by, the Group.
INFO
RM
A P
LC A
NN
UA
L R
EP
OR
T A
ND
AC
CO
UN
TS
20
20 IN
FOR
MA
PLC
AN
NU
AL R
EP
OR
T AN
D A
CC
OU
NT
S 20
20
206 207
FIN
AN
CIA
L S
TA
TE
ME
NT
S

N O T E S T O T H E C O N S O L I D A T E D F I N A N C I A L S T A T E M E N T S F O R T H E Y E A R E N D E D 3 1 D E C E M B E R 2 0 2 0 c o n t i n u e d
Merger reserveIn 2004 the merger of Informa PLC and Taylor & Francis Group plc resulted in a merger reserve amount of £496.4m being recorded. On 2 November 2016, the Group acquired Penton Information Services and the £82.2m share premium on the shares issued to the vendors was recorded as an increase in the merger reserve in accordance with the merger relief rules of the Companies Act 2006. There were 427,536,794 shares issued on 18 June 2018 in connection with the acquisition of UBM plc, which at the acquisition-date closing share price of 829p resulted in an increase in the merger reserve of £3,544.6m. From 19 July 2018 to 13 December 2018 there were 256,689 shares issued in connection with the satisfaction of Save As You Earn (SAYE) awards in the UBM business which resulted in an increase in the merger reserve of £2.2m.
Other reserveThe other reserve includes the inversion accounting reserve of £2,189.9m which was created from an issue of shares under a Scheme of Arrangement in May 2014.
Employee Share Trust and ShareMatch sharesAs at 31 December 2020, the Informa Employee Share Trust (EST) held 697,644 (2019: 958,988) ordinary shares in the Company at a market value of £3.8m (2019: £8.2m). As at 31 December 2020, the ShareMatch scheme held 710,697 (2019: 474,878) matching ordinary shares in the Company at a market value of £3.9m (2019: £4.1m). At 31 December 2020, the Group held 0.1% (2019: 0.1%) of its own called up share capital.
37. Non-controlling interestsThe Group has subsidiary undertakings where there are non-controlling interests. At 31 December 2020, these non-controlling interests were composed entirely of equity interests and represented the following holding of minority shares by non-controlling interests:
35. Share capital and share premiumShare capitalShare capital as at 31 December 2020 amounted to £1.5m (2019: £1.3m). For details of options issued over the Company’s shares see Note 10.
2020£m
2019£m
Issued, authorised and fully paid1,502,137,804 (2019: 1,251,798,534) ordinary shares of 0.1p each 1.5 1.3
2020Number of
shares
2019Number of
shares
At 1 January 1,251,798,534 1,251,798,534
Issue of new shares in relation to share placements in 2020 250,318,000 –
Other issue of shares 21,270 –
At 31 December 1,502,137,804 1,251,798,534
On 15 April 2020 the Company announced a share placement of 250,318,000 new ordinary shares in the capital of the Company, representing approximately 19.99% of the Company’s existing issued share capital. 125,159,000 new ordinary shares were issued on 20 April 2020 and a further 125,159,000 on 5 May 2020. The shares were issued at 400p per share resulting in gross proceeds of £1,001.3m and net proceeds of £973.7m.
Share premium
Issued, authorised and fully paid2020
£m2019
£m
At 1 January and 31 December 1,878.8 905.3
36. Other reservesThis note provides further explanation for the ‘Other reserves’ listed in the Consolidated Statement of Changes in Equity.
Reserves for shares to be issued
£m
Merger reserve
£m
Other reserve
£m
EmployeeShare Trust
and ShareMatch
shares£m
Total£m
At 1 January 2019 14.0 4,125.4 (2,158.9) (6.0) 1,974.5Share award expense (equity–settled) 9.4 – – 1.0 10.4Own shares purchased – – – (15.9) (15.9)Transfer of vested LTIPs (5.7) – – – (5.7)Non–controlling interest adjustment arising from disposal – – 1.3 – 1.3At 1 January 2020 17.7 4,125.4 (2,157.6) (20.9) 1,964.6
Share award expense (equity–settled) 11.2 – – – 11.2Own shares purchased (1.3) – – – (1.3)Transfer of vested LTIPs (4.9) – – – (4.9)At 31 December 2020 22.7 4,125.4 (2,157.6) (20.9) 1,969.6
Reserve for shares to be issuedThis reserve relates to LTIPs granted to colleagues reduced by the transferred and vested awards. Further information is set out in Note 10.
• APLF Ltd (40%, 2019: 40%)• China International Exhibitions Company Limited
(30%, 2019: 30%)• Cosmoprof Asia Limited (50%, 2019: 50%)• Fort Lauderdale Convention Services, Inc. (10%, 2019: 10%)• Guangzhou Citiexpo Jianke Exhibition Co., Ltd
(40%, 2019: 40%)• Hong Kong Sinoexpo Informa Markets Limited
(30%, 2019: 30%)• Informa Marine Holdings, Inc. (10%, 2019: 10%)• Informa Markets Art, LLC (10%, 2019: 10%)• Informa Markets BN Co., Ltd (40%, 2019: 40%)• Informa Markets Trust Company Ltd (30%, 2019: 30%)• Informa Tech Founders Limited (45%, 2019: 45%)• Informa Tharawat Limited (51%, 2019: 51%)• Informa Tianyi Exhibitions (Chengdu) Co., Ltd
(40%, 2019: 40%)• Informa Wiener Exhibitions (Chengdu) Co., Ltd
(40%, 2019: 40%)• ITF2 Limited (45%, 2019: 45%)• Monaco Yacht Show S.A.M. (10%, 2019: 10%)• PT UBM Pameran Niaga Indonesia (33%, 2019: 33%)• Sea Asia Singapore Pte Limited (10%, 2019: 10%)
• Shanghai Baiwen Exhibitions Co., Ltd (15%, 2019: 15%)• Shanghai Meisheng Culture Broadcasting Co., Ltd
(15%, 2019: 15%)• Shanghai Sinoexpo Informa Markets International
Exhibitions Co., Ltd (30%, 2019: 30%)• Shanghai UBM Showstar Exhibitions Co., Ltd
(30%, 2019: 30%)• Shanghai Yingye Exhibitions Co., Ltd (40%, 2019: 40%)• Shenzhen UBM Creativity Exhibition Co., Ltd
(35%, 2019: 35%)• Shenzhen UBM Herong Exhibition Company Limited
(30%, 2019: 30%)• Sinoexpo Newco for Ecommerce Business Co., Limited
(30%, 2019: 0%)• Southern Convention Services, Inc. (10%, 2019: 10%)• UBM Asia (Thailand) Co., Ltd (51%, 2019: 51%)• UBM Mexico Exposiciones, S.A.P.I. (20%, 2019: 20%)• Yachting Promotions, Inc. (10%, 2019: 10%)
INFO
RM
A P
LC A
NN
UA
L R
EP
OR
T A
ND
AC
CO
UN
TS
20
20 IN
FOR
MA
PLC
AN
NU
AL R
EP
OR
T AN
D A
CC
OU
NT
S 20
20
208 209
FIN
AN
CIA
L S
TA
TE
ME
NT
S

N O T E S T O T H E C O N S O L I D A T E D F I N A N C I A L S T A T E M E N T S F O R T H E Y E A R E N D E D 3 1 D E C E M B E R 2 0 2 0 c o n t i n u e d
38. Leases and finance lease receivables(a) IFRS 16 leases at 31 December The Group’s right of use assets and lease liabilities at 31 December are as follows:
Right of use assetsProperty
leases£m
Otherleases1
£mTotal
£m
1 January 2019 184.8 110.5 295.3
Depreciation (29.6) (3.5) (33.1)
Additions 26.2 – 26.2
Impairment (4.6) – (4.6)
Disposals (7.3) – (7.3)
Foreign exchange movement (8.6) (3.5) (12.1)
1 January 2020 160.9 103.5 264.4Depreciation (26.8) (3.5) (30.3)Additions 18.5 22.5 41.0Impairment (note 8) (36.1) – (36.1)Disposals (27.0) – (27.0)Foreign exchange movement 1.9 (4.0) (2.1)At 31 December 2020 91.4 118.5 209.9
Lease liabilitiesProperty
leases£m
Otherleases1
£mTotal
£m
1 January 2019 (233.1) (110.5) (343.6)
Repayment of lease liabilities 44.0 4.8 48.8
Interest on lease liabilities (10.1) (4.2) (14.3)
Additions (29.1) – (29.1)
Disposals 9.4 – 9.4
Foreign exchange movement 8.7 3.5 12.2
At 1 January 2020 (210.2) (106.4) (316.6)Repayment of lease liabilities 42.1 7.2 49.3Interest on lease liabilities (8.0) (4.2) (12.2)Additions (13.9) (22.5) (36.4)Disposals 29.6 – 29.6Foreign exchange movement 0.8 4.7 5.5At 31 December 2020 (159.6) (121.2) (280.8)
2019
Current lease liabilities (33.4) (0.8) (34.2)
Non-current lease liabilities (176.8) (105.6) (282.4)
At 31 December 2019 (210.2) (106.4) (316.6)
2020
Current lease liabilities (33.0) (0.4) (33.4)Non-current lease liabilities (126.6) (120.8) (247.4)At 31 December 2020 (159.6) (121.2) (280.8)
1. Other leases relate to event venue-related leases
The Group’s average lease term under IFRS 16 is 4.5 years (2019: 3.5 years). The average incremental borrowing rate used for year ended 31 December 2020 to discount lease liabilities was 4.4% (2019: 4.7%).
(b) IFRS 16 finance lease receivable at 31 December The Group’s finance lease receivable at 31 December is as follows:
Finance lease receivableProperty
leases£m
Otherleases1
£mTotal
£m
1 January 2019 14.4 – 14.4
Rent receipt (2.9) – (2.9)
Interest Income 0.8 – 0.8
Additions 3.2 – 3.2
Foreign exchange movement (0.2) – (0.2)
At 1 January 2020 15.3 – 15.3Rent receipt (2.4) – (2.4)Interest Income 0.1 – 0.1Additions 0.4 – 0.4Disposals (5.8) – (5.8)Foreign exchange movement 0.3 – 0.3At 31 December 2020 7.9 – 7.9
2019
Current finance lease receivable 2.3 – 2.3
Non-current finance lease receivable 13.0 – 13.0
At 31 December 2019 15.3 – 15.3
2020
Current finance lease receivable 1.5 – 1.5Non-current finance lease receivable 6.4 – 6.4At 31 December 2020 7.9 – 7.9
The Group entered into finance leasing arrangements as a lessor for sub-leases on property leases. The average term of IFRS 16 finance sub-leases entered is 4.1 years (2019: 2.9 years).
(c) Low value and short-term lease income and expense for the year ended 31 December
Total£m
2019
Low value and short-term sublease rent income 0.8
Low value and short-term rent expense1 (159.8)
2020
Low value and short-term sublease rent income 2.5Low value and short-term rent expense1 (51.0)
1. Includes event venue-related leases
INFO
RM
A P
LC A
NN
UA
L R
EP
OR
T A
ND
AC
CO
UN
TS
20
20 IN
FOR
MA
PLC
AN
NU
AL R
EP
OR
T AN
D A
CC
OU
NT
S 20
20
210 211
FIN
AN
CIA
L S
TA
TE
ME
NT
S

N O T E S T O T H E C O N S O L I D A T E D F I N A N C I A L S T A T E M E N T S F O R T H E Y E A R E N D E D 3 1 D E C E M B E R 2 0 2 0 c o n t i n u e d
39. Related party transactionsTransactions between the Company and its subsidiaries, which are related parties, have been eliminated on consolidation and are not disclosed in this note. The transactions between the Group and its joint ventures and associates are disclosed below. The following transactions and arrangements are those which are considered to have had a material effect on the financial performance and position of the Group for the year.
Transactions with DirectorsThere were no material transactions with Directors of the Company during the year, except for those relating to remuneration and shareholdings. For the purposes of IAS 24 Related Party Disclosures, Executives below the level of the Company’s Board are not regarded as related parties.
Further information about the remuneration of individual Directors is provided in the audited part of the Remuneration Report on pages 116 to 131 and Note 9.
Other related party disclosuresAt 31 December 2020, Informa Group companies have guaranteed the UK pension scheme liabilities of the Taylor & Francis Group Pension and Life Assurance Scheme, the Informa Final Salary Scheme and the UBM Pension Scheme.
Transactions with related parties are made at arm’s length. Outstanding balances at year end are unsecured and settlement occurs in cash. There are no bad debt provisions for related party balances as at 31 December 2020, and no debts due from related parties have been written off during the year. During the period, Informa entered into related party transactions to the value of £0.5m (2019: £0.2m) with a balance of £0.2m (2019: £0.2m) outstanding at 31 December 2020.
40. SubsidiariesThe listing below shows the subsidiary undertakings as at 31 December 2020:
Company Name Country Ownership Registered
Office
Centre for Asia Pacific Aviation Pty Limited
Australia 100% AU1
Centre for Aviation Pty Limited
Australia 100% AU1
Datamonitor Pty Limited Australia 100% AU2
Informa Australia Pty Limited
Australia 100% AU2
Informa Holdings (Australia) Pty Limited
Australia 100% AU1
Ovum Pty Limited Australia 100% AU2
International Exhibition Holdings Limited (in liquidation)
Bahamas 100% BH1
Arabian Exhibition Management W.L.L.
Bahrain 100% BA1
Informa Middle East Limited
Bermuda 100% BM1
Informa Markets Ltda Brazil 100% BR1
iNet Interactive Canada Inc. Canada 100% CA1
Informa Canada Inc. Canada 100% CA2
Informa Tech Canada Inc. Canada 100% CA2
China International Exhibitions Company Limited
China 70% CH1
Guangzhou CitiExpo Jianke Exhibition Co., Ltd
China 60% CH2
Guangzhou Informa Yi Fan Exhibitions Co., Ltd
China 100% CH3
IBC Conferences and Event Management Services (Shanghai) Co., Ltd
China 100% CH4
Informa Data Service (Shanghai) Co., Ltd
China 100% CH5
Informa Enterprise Management (Shanghai) Co., Ltd
China 100% CH6
Informa Exhibitions (Beijing) Co., Ltd
China 100% CH7
Company Name Country Ownership Registered
Office
Informa Information Technology (Shanghai) Co., Ltd
China 100% CH8
Informa Markets China (Chengdu) Co., Ltd
China 100% CH9
Informa Markets China (Hangzhou) Co., Ltd
China 100% CH10
Informa Markets China (Shenzhen) Co., Ltd
China 100% CH11
Informa Markets Trust Company Ltd
China 70% CH12
Informa Tianyi Exhibitions (Chengdu) Co., Ltd
China 60% CH13
Informa Weiner Exhibitions (Chengdu) Co., Ltd
China 60% CH14
Shanghai Baiwen Exhibitions Co., Ltd
China 85% CH15
Shanghai Meisheng Culture Broadcasting Co., Ltd
China 85% CH16
Shanghai SinoExpo Informa Markets International Exhibitions Company Ltd
China 70% CH1
Shanghai UBM Showstar Exhibition Co., Limited
China 70% CH17
Shanghai Yingye Exhibitions Co., Ltd
China 60% CH18
Shenzhen UBM Creativity Exhibition Co., Ltd
China 65% CH19
Shenzhen UBM Herong Exhibition Company Limited
China 70% CH20
Sinoexpo Newco for Ecommerce Business Co., Limited
China 70% CH21
UBM China (Beijing) Exhibition Company Limited
China 100% CH22
UBM China (Guangzhou) Co., Ltd
China 100% CH23
Company Name Country Ownership Registered
Office
UBM China (Shanghai) Co., Limited
China 100% CH24
Stormcliff Limited Cyprus 100% CY1
Informa Egypt LLC Egypt 100% EG1
Euromedicom SAS France 100% FR1
Eurovir SAS France 100% FR1
New AG International Sarl France 100% FR1
CMP Media GmbH Germany 100% GE1
EBD Group GmbH Germany 100% GE2
Informa Holding Germany GmbH
Germany 100% GE2
Informa Tech Germany GmbH
Germany 100% GE2
UBM Canon Deutschland GmbH
Germany 100% GE3
APLF Limited Hong Kong 60% HK1
Cosmoprof Asia Limited Hong Kong 50% HK1
Datamonitor Publications (HK) Limited
Hong Kong 100% HK2
Great Tactic Limited Hong Kong 100% HK1
Hong Kong Sinoexpo Informa Markets Limited
Hong Kong 70% HK1
Informa Global Markets (Hong Kong) Limited
Hong Kong 100% HK1
Informa Limited Hong Kong 100% HK1
Informa Markets Asia Limited
Hong Kong 100% HK1
Informa Markets Asia Group Limited
Hong Kong 100% HK1
Informa Markets Asia Holdings (Hong Kong) Limited
Hong Kong 100% HK1
Informa Markets Asia Partnership
Hong Kong 100% HK1
Informa Markets South China Limited
Hong Kong 100% HK1
MAI Brokers (Asia & Pacific) Limited
Hong Kong 100% HK1
Mills & Allen Holdings (Far East) Limited
Hong Kong 100% HK1
Penton Media Asia Limited Hong Kong 100% HK3
Informa Markets India Private Limited
India 100% IN1
NND Biomedical Data Systems Private Limited (in liquidation)
India 100% IN2
Taylor & Francis Books India Private Limited
India 100% IN3
Taylor & Francis Technology Services LLP
India 100% IN4
UBM Exhibitions India LLP India 100% IN1
PT Pamerindo Indonesia Indonesia 100% ID1
PT UBM Pameran Niaga Indonesia
Indonesia 67% ID2
Chartbay Unlimited Ireland 100% IR1
Colwiz Limited Ireland 100% IR2
CX Properties Unlimited Ireland 100% IR1
Donytel Unlimited Ireland 100% IR1
F1000 Open Science Platforms Limited
Ireland 100% IR3
Garragie Investments Unlimited
Ireland 100% IR1
Hickdale Unlimited Ireland 100% IR1
Maypond Holdings Limited Ireland 100% IR1
Company Name Country Ownership Registered
Office
Maypond Limited Ireland 100% IR1
MFWWNet Unlimited Ireland 100% IR1
Tanahol Unlimited Ireland 100% IR1
UBM Financial Services Ireland
Ireland 100% IR1
UBM IP Ireland Unlimited Ireland 100% IR1
UBM Ireland No 1 Unlimited
Ireland 100% IR1
UBM Ireland No 2 Unlimited
Ireland 100% IR1
UBM Ireland No 3 Unlimited
Ireland 100% IR1
UBM Ireland No 4 Unlimited
Ireland 100% IR1
UBM Ireland No 5 Unlimited
Ireland 100% IR1
UBM Ireland No 6 Unlimited
Ireland 100% IR1
UBM Ireland No 8 Unlimited
Ireland 100% IR1
UBM Ireland No 9 Unlimited
Ireland 100% IR1
UNM Holdings Ireland Unlimited
Ireland 100% IR1
Wenport Unlimited Ireland 100% IR1
UNM International Holdings Limited
Isle of Man 100% IM1
UNM Overseas Holdings Limited
Isle of Man 100% IM1
Informa Global Markets (Japan) Limited
Japan 100% JP1
Informa Intelligence Godo Kaisha
Japan 100% JP2
Informa Markets Japan Co. Ltd
Japan 100% JP3
Taylor & Francis Japan G.K. Japan 100% JP4
Informa Switzerland Limited
Jersey 100% JE1
UBM (Jersey) Limited Jersey 100% JE2
UBM Limited3 Jersey 100% JE2
CMP Holdings S.à.r.l. Luxembourg 100% LX1
CMP Intermediate Holdings S.à.r.l.
Luxembourg 100% LX1
UBM Finance S.à.r.l. Luxembourg 100% LX1
UBM IP Luxembourg S.à.r.l. Luxembourg 100% LX1
United Brazil Holdings S.à.r.l.
Luxembourg 100% LX1
United Commonwealth Holdings S.à.r.l.
Luxembourg 100% LX1
United Consumer Media Holdings S.à.r.l.
Luxembourg 100% LX1
United CP Holdings S.à.r.l. Luxembourg 100% LX1
United News Distribution S.à.r.l.
Luxembourg 100% LX1
United Professional Media S.à.r.l.
Luxembourg 100% LX1
UNM Holdings S.à.r.l. Luxembourg 100% LX1
Vavasseur International Holdings S.à.r.l.
Luxembourg 100% LX1
Informa Markets Malaysia Sdn Bhd2
Malaysia 100% MA1
Malaysian Exhibition Services Sdn Bhd
Malaysia 100% MA1
UBM Tech Research Malaysia Sdn Bhd
Malaysia 100% MA1
INFO
RM
A P
LC A
NN
UA
L R
EP
OR
T A
ND
AC
CO
UN
TS
20
20 IN
FOR
MA
PLC
AN
NU
AL R
EP
OR
T AN
D A
CC
OU
NT
S 20
20
212 213
FIN
AN
CIA
L S
TA
TE
ME
NT
S

N O T E S T O T H E C O N S O L I D A T E D F I N A N C I A L S T A T E M E N T S F O R T H E Y E A R E N D E D 3 1 D E C E M B E R 2 0 2 0 c o n t i n u e d
Company Name Country Ownership Registered
Office
UBMMG Holdings Sdn Bhd Malaysia 100% MA1
UBM Mexico Exposiciones, S.A.P.I.
Mexico 80% ME1
Informa Monaco SAM Monaco 100% MC1
Monaco Yacht Show SAM Monaco 90% MC1
Myanmar Trade Fair Management Company Limited
Myanmar 100% MC1
IIR South Africa B.V. Netherlands 100% NE1
Informa Europe B.V. Netherlands 100% NE1
Informa Finance B.V. Netherlands 100% NE1
Informa Markets B.V. Netherlands 100% NE2
UBM Asia B.V. Netherlands 100% NE1
Dove Medical Press (NZ) Limited
New Zealand 100% NZ1
Informa Healthcare A.S. Norway 100% NO1
Colwiz Pakistan Private Limited
Pakistan 100% PK1
UBM Exhibitions Philippines Inc
Philippines 100% PH1
Informa Tharawat Limited Qatar 49% QA1
Informa Markets BN Co Ltd Republic of Korea
60% RK2
Informa Markets Korea Corporation
Republic of Korea
100% RK1
Informa Tech Korea Co., Ltd Republic of Korea
100% RK2
Informa Saudi Arabia Limited
Saudi Arabia 100% SU1
Informa Saudi Arabia LLC (in liquidation)
Saudi Arabia 100% SU2
IBC Asia (S) Pte Limited Singapore 100% SG1
Informa Exhibitions Pte Limited
Singapore 100% SG1
Informa Global Markets (Singapore) Pte Limited
Singapore 100% SG1
Sea Asia Singapore Pte Limited
Singapore 90% SG2
Singapore Exhibition Services (Pte) Limited
Singapore 100% SG3
Taylor & Franceis (S) Pte Limited
Singapore 100% SG4
Marketworks Datamonitor (Pty) LTD
South Africa 100% SA1
Institute for International Research Espana S.L.
Spain 100% SP1
Co-Action Publishing AB Sweden 100% SE1
Taylor & Francis AB Sweden 100% SE1
EBD GmbH Switzerland 100% SW1
Informa IP GmbH Switzerland 100% SW1
Informa Tech Taiwan Limited
Taiwan 100% TA1
Bangkok Exhibition Services Ltd
Thailand 100% TH1
UBM Asia (Thailand) Co. Ltd Thailand 49% TH2
UBM Istanbul Fuarcılık ve Gösteri Hizmetleri A.Ş.
Turkey 100% TU1
UBM Rotaforte Uluslararası Fuarcılık Anonim Şirketi
Turkey 100% TU2
Informa Middle East Media FZ LLC
United Arab Emirates
100% UAE1
Company Name Country Ownership Registered
Office
ABI Building Data Limited United Kingdom 100% UK1
Afterhurst Limited United Kingdom 100% UK1
AMA Research Limited United Kingdom 100% UK1
Blessmyth Limited United Kingdom 100% UK1
Canrak Books Limited United Kingdom 100% UK1
Cogent OA Limited United Kingdom 100% UK1
Colonygrove Limited United Kingdom 100% UK1
Colwiz UK Limited United Kingdom 100% UK1
Crosswall Nominees Limited
United Kingdom 100% UK1
Datamonitor Limited United Kingdom 100% UK1
Design Junction Limited United Kingdom 100% UK1
DIVX Express Limited United Kingdom 100% UK1
Dove Medical Press Limited United Kingdom 100% UK1
eBenchmarkers Limited United Kingdom 100% UK1
E-Health Media Limited United Kingdom 100% UK1
F1000 Research Limited United Kingdom 100% UK1
Futurum Media Limited United Kingdom 100% UK1
GNC Media Investments Limited
United Kingdom 100% UK1
Green Thinking (Services) Limited
United Kingdom 100% UK1
Hirecorp Limited United Kingdom 100% UK1
IBC (Ten) Limited United Kingdom 100% UK1
IBC (Twelve) Limited United Kingdom 100% UK1
IBC Fourteen Limited United Kingdom 100% UK1
IIR (U.K. Holdings) Limited United Kingdom 100% UK1
IIR Management Limited United Kingdom 100% UK1
Informa Connect Limited United Kingdom 100% UK1
Informa Cosec Limited United Kingdom 100% UK1
Informa Exhibitions Limited
United Kingdom 100% UK1
Informa Final Salary Pension Trustee Company Limited
United Kingdom 100% UK1
Informa Finance Australia Limited
United Kingdom 100% UK1
Informa Finance Brazil Limited
United Kingdom 100% UK1
Informa Finance Egypt Limited
United Kingdom 100% UK1
Informa Finance Mexico Limited
United Kingdom 100% UK1
Informa Finance UK Limited
United Kingdom 100% UK1
Informa Finance USA Limited
United Kingdom 100% UK1
Informa Global Markets (Europe) Limited
United Kingdom 100% UK1
Informa Group Holdings Limited
United Kingdom 100% UK1
Informa Group Limited United Kingdom 100% UK1
Informa Holdings Limited United Kingdom 100% UK1
Informa Investment Plan Trustees Limited
United Kingdom 100% UK1
Informa Manufacturing Europe Holdings Limited
United Kingdom 100% UK1
Informa Manufacturing Europe Limited
United Kingdom 100% UK1
40. Subsidiaries continuedCompany Name Country Ownership
Registered Office
Informa Manufacturing Holdings Limited
United Kingdom 100% UK1
Informa Manufacturing Limited
United Kingdom 100% UK1
Informa Markets (Europe) Limited
United Kingdom 100% UK1
Informa Markets (Maritime) Limited
United Kingdom 100% UK1
Informa Markets (UK) Limited
United Kingdom 100% UK1
Informa Markets Limited United Kingdom 100% UK1
Informa Overseas Investments Limited
United Kingdom 100% UK1
Informa Property (Colchester) Limited1
United Kingdom 100% UK1
Informa Six Limited United Kingdom 100% UK1
Informa Tech Founders Limited
United Kingdom 55% UK1
Informa Tech Research Limited
United Kingdom 100% UK1
Informa Telecoms & Media Limited
United Kingdom 100% UK1
Informa Three Limited United Kingdom 100% UK1
Informa UK Limited United Kingdom 100% UK1
Informa US Holdings Limited
United Kingdom 100% UK1
ITF2 Limited United Kingdom 55% UK1
James Dudley International Limited
United Kingdom 100% UK1
Light Reading UK Limited United Kingdom 100% UK1
London On-Water Ltd United Kingdom 100% UK1
MAI Luxembourg UK Societas
United Kingdom 100% UK1
Mapa International Limited United Kingdom 100% UK1
Maritime Insights and Intelligence Limited
United Kingdom 100% UK1
Miller Freeman Worldwide Limited
United Kingdom 100% UK1
MRO Exhibitions Limited United Kingdom 100% UK1
MRO Network Limited United Kingdom 100% UK1
MRO Publications Limited United Kingdom 100% UK1
Oes Exhibitions Limited United Kingdom 100% UK1
OTC Publications Limited United Kingdom 100% UK1
Penton Communications Europe Limited
United Kingdom 100% UK1
Psychology Press New Co. Limited
United Kingdom 100% UK1
Roamingtarget Limited United Kingdom 100% UK1
Routledge Books Limited United Kingdom 100% UK1
T & F Canrak Books Limited United Kingdom 100% UK1
Taylor & Francis Books Limited
United Kingdom 100% UK1
Taylor & Francis Group Limited
United Kingdom 100% UK1
Taylor & Francis Limited United Kingdom 100% UK1
Taylor & Francis Publishing Services Limited
United Kingdom 100% UK1
TU-Automotive Holdings Limited
United Kingdom 100% UK1
TU-Automotive Limited United Kingdom 100% UK1
Turtle Diary Limited United Kingdom 100% UK1
UBM Aviation Routes Limited
United Kingdom 100% UK1
Company Name Country Ownership Registered
Office
UBM Aviation Worldwide Limited
United Kingdom 100% UK1
UBM Holdings Limited United Kingdom 100% UK1
UBM International Holdings UK Societas
United Kingdom 100% UK1
UBM (GP) No1 Limited United Kingdom 100% UK1
UBM (GP) No3 Limited United Kingdom 100% UK1
UBM Property Limited United Kingdom 100% UK1
UBM Property Services Limited
United Kingdom 100% UK1
UBM Shared Services Limited
United Kingdom 100% UK1
UBM Trustees Limited United Kingdom 100% UK1
UBM Worldwide Group Limited
United Kingdom 100% UK1
UBMA Holdings Limited United Kingdom 100% UK1
UBMG Holdings United Kingdom 100% UK1
UBMG Limited United Kingdom 100% UK1
UBMG Services Limited United Kingdom 100% UK1
United Consumer Media UK Societas
United Kingdom 100% UK1
United Delaware Investments Limited
United Kingdom 100% UK1
United Executive Trustees Limited
United Kingdom 100% UK1
United Finance Limited United Kingdom 100% UK1
United Newspapers Publications Limited
United Kingdom 100% UK1
United Trustees Limited United Kingdom 100% UK1
UNM Investments Limited United Kingdom 100% UK1
Vavasseur Overseas Holdings Limited
United Kingdom 100% UK1
WCN 2 Limited United Kingdom 100% UK1
Workyard Limited United Kingdom 100% UK1
Advanstar Communications, Inc.
United States 100% US1
CMP Child Care Center, Inc. United States 100% US2
Duke Investments, Inc. United States 100% US3
Farm Progress Limited United States 100% US4
Fort Lauderdale Convention Services, Inc.
United States 90% US5
Informa Business Intelligence, Inc.
United States 100% US6
Informa Business Media Holdings, Inc.
United States 100% US4
Informa Business Media, Inc.
United States 100% US4
Informa Data Sources, Inc. United States 100% US4
Informa Exhibition, LLC United States 100% US4
Informa Exhibitions Holding Corp.
United States 100% US4
Informa Exhibitions U.S. Construction & Real Estate, Inc.
United States 100% US4
Informa Export, Inc. United States 100% US4
Informa Global Sales, Inc. United States 100% US4
Informa Life Sciences Exhibitions, Inc.
United States 100% US4
Informa Marine Holdings, Inc.
United States 90% US4
Informa Markets Art, LLC United States 90% US4
Informa Markets Fashion (East) LLC
United States 100% US4
INFO
RM
A P
LC A
NN
UA
L R
EP
OR
T A
ND
AC
CO
UN
TS
20
20 IN
FOR
MA
PLC
AN
NU
AL R
EP
OR
T AN
D A
CC
OU
NT
S 20
20
214 215
FIN
AN
CIA
L S
TA
TE
ME
NT
S

N O T E S T O T H E C O N S O L I D A T E D F I N A N C I A L S T A T E M E N T S F O R T H E Y E A R E N D E D 3 1 D E C E M B E R 2 0 2 0 c o n t i n u e d
Company Name Country Ownership Registered
Office
Informa Markets France, Inc.
United States 100% US4
Informa Markets Holdings, Inc.
United States 100% US4
Informa Markets Investments, Inc
United States 100% US4
Informa Markets Manufacturing LLC
United States 100% US4
Informa Markets Medica LLC
United States 100% US4
Informa Media, Inc. United States 100% US4
Informa Operating Holdings, Inc.
United States 100% US4
Informa Pop Culture Events, Inc.
United States 100% US4
Informa Princeton, LLC United States 100% US1
Informa Support Services, Inc.
United States 100% US4
Informa Tech Holdings LLC United States 100% US4
Informa Tech LLC United States 100% US4
Informa USA, Inc. United States 100% US6
Internet World Media, Inc. United States 100% US4
Knect365 US, Inc. United States 100% US1
Ludgate USA LLC United States 100% US4
Ovum, Inc. United States 100% US6
Roast LLC United States 100% US4
Rocket Holdings, Inc. United States 100% US4
Southern Convention Services, Inc.
United States 90% US5
Spectrum ABM Corp. United States 100% US4
Taylor & Francis Group, LLC United States 100% US4
UBM Community Connection Foundation
United States 100% US7
UBM Delaware LLC United States 100% US4
UBM Finance, Inc. United States 100% US4
UBM UK LLC United States 100% US4
Yachting Promotions, Inc. United States 90% US5
SES Vietnam Exhibition Services Company Limited
Vietnam 100% VI1
1. On 24 February 2021 LLP Limited changed its name to Informa Property (Colchester) Limited
2. On 4 March 2021 United Business Media (M) Sdn Bhd changed its name to Informa Markets Malaysia Sdn Bhd
3. On 31 March 2021 UBM PLC re-registered as a private limited company
The proportion of voting power held is the same as the proportion of ownership interest. The Consolidated Financial Statements incorporate the financial statements of all entities controlled by the Company as at 31 December each year. Refer to Note 2 for further description of the method used to account for investments in subsidiaries.
Company registered office addresses
UK
UK1 5 Howick Place, London SW1P 1WG, United Kingdom
The Americas
US1 c/o Corporation Service Company, 80 State Street, Albany, NY 12207-2543, USA
US2 1983 Marcus Avenue, Suite 250, Lake Success, NY 11042, USA
US3 c/o Corporation Service Company, 1900 W. Littleton Boulevard, Littleton, CO 80120, USA
US4 c/o Corporation Service Company, 251 Little Falls Drive, Wilmington, DE 19808, USA
US5 c/o Corporation Service Company, 1201 Hays Street, Tallahassee, FL 32301, USA
US6 c/o Corporation Service Company, 84 State Street, Boston, MA 02109, USA
US7 c/o The Prentice-Hall Corporation System Inc, 251 Little Falls Drive, Wilmington, DE 19808, USA
BH1 M B & H Corporate Services Limited, Mareva House, 4 George Street, Nassau, Bahamas
BM1 Victoria Place, 5th Floor, 31 Victoria Street, Hamilton, HM10, Bermuda
BR1 Avenida Doutora Ruth Cardoso, 7221 22 Andar Conjunto 2301 e 23 Andar Conjunto 2401, Edificio Birmann 21, São Paulo, SP, CEP 05425-902, Brazil
CA1 c/o McMillan LLP, 1500 Royal Centre, 1055 W. Georgia Street, Vancouver, BC V6E 4N7, Canada
CA2 12th Floor, 20 Eglinton Avenue West, Yonge Eglinton Centre, Toronto, ON M4R 1K8, Canada
ME1 Av. Benjamin Franklin 235-4, Mexico, DF06100, Mexico
China and Asia
CH1 Floor 7/8, Urban Development International Tower, No. 355 Hong Qiao Road, Xu Hui District, Shanghai, 200030, China
CH2 Room 902,No. 996 East Xingang Road, Haizhu District, Guangzhou, China
CH3 No. 1111, Building 11, 2433 Xingang East Road, Zuhai District, Guangzhou, China
CH4 Room 2072, 2nd Floor, 124 Building, No. 960 Zhong Xing Road, Jing’an District, Shanghai, China
CH5 Room 6396 No. 650 Dingxi Road, Changning District, Shanghai China
CH6 Room 2201 Hong Kong New Tower, No. 300 Huai Hai Middle Road, Huang Pu District, Shanghai, China
CH7 Unit 802 Comfort Plaza, No. 4 of Worker’s Stadium North Road, Chaoyang District, Beijing 100027, China
CH8 West-South Area Fl. 3, No. 2123 Pudong Avenue, Free Trade Zone, Shanghai, China
CH9 China (Sichuan) Pilot Free Trade Zone, East Section of Ningbo Road, Zhengxing Street, Tianfu New District, Chengdu, China
CH10 Room 123, Floor 1, Building 1, No.108 Kangqiao Road, Gongshu District, Hangzhou, China
CH11 V3 East, Level 17 Daqing Building, Tian’an Shatou Street, Futian District, Shenzhen, China
CH12 Room 1806-1807, 4 Huating Road, Tianhe District, Guangzhou, China
CH13 No 502, 5th Floor, Building 4, 99 Guangfu Road, Wuhou District, Chengdu, China
CH14 Room 1009, Western Tower, No. 19, Way 4 South People Road, Chengdu City, China
CH15 Room 1010, 10F, No. 993 West Nanjing Road, Jingan District, Shanghai, China
CH16 Room 101-75, No.15 Jia, No. 152 Alley, Yanchang Road, Jing’an District, Shanghai, China
40. Subsidiaries continued
CH17 9/F Ciro’s Plaza, 388 West Nanjing Road, Huangpu District, Shanghai, 200003, China
CH18 Room 234, 2nd Floor, M-Zone, 1st Building, No 3398 Hu Qing Ping Road, Zhao Xiang Town, Qing Pu District, Shanghai, China
CH19 Unit 201, Building A, No. 1 Qianwan Road One, Qianhai Shenzhen & Hong Kong Cooperation Zone, Shenzhen, China
CH20 Room 607, East Block, Coastal Building, Haide 3rd Road, Nanshan District, Shenzhen, Guangdong 518054, China
CH21 Room 45, 6/F, Building 1, No. 39 Jia Tai Road, Shanghai, China
CH22 Room 1557, Unit 01-06, 15th Floor, Block A, Building 9, Dongdagiao Road, Beijing, Chaoyang District, China
CH23 Room 1159-1164, China Hotel Office Tower, Liu Hua Road, Guangzhou, China
CH24 Room 207, No. 453 Fahuazhen Road, Shanghai, China
HK1 Room 812, Silvercord, Tower 1, 30 Canton Road, Tsimshatsui, Kowloon, Hong Kong
HK2 Suite 1106-8, 11/F, Tai Yau Building, 181 Johnston Road, Wanchai, Hong Kong
HK3 Level 5, 28 Hennessey Road, Admiralty, Hong Kong
IN1 Unit No. 1&2, B-Wing, Times Square, Andheri Kurla Road, Marol, Andheri East, Mumbai, 400 059, India
IN2 Flat No 104, Dhanunjaya Residency, Plot No 143, Kalyan Nagar III, Hyderabad, Andhra Pradesh, 500018, India
IN3 2nd & 3rd floor, The National Council of YMCAs of India, 1, Jai Singh Road, New Delhi, 110001, India
IN4 No. 143, 144 Hosur Main Road, Industrial Layout, Koramangala, Bangalore, Karnataka, 560095, India
ID1 Menara Utara Gedung Menara Jamsotek, Lt. 12 unit TA 12-04, Jl. Jend., Gabot Subroto No. 38, Jakarta, Indonesia
ID2 Jalan Sultan Iskandar Muda, No 7 Arteri Pondok Indah, Kebayoran Lama, Jakarta Selantan, 12240, Indonesia
JP1 4F, Shin-Kokusai Building, 3-4-1 Marunouchi, Chiyoda-Ku, Tokyo, 100-0005, Japan
JP2 Otemachi Financial City, North Tower 21F, 1-9-5 Otemachi, Chiyoda-ku, Tokyo, 100-0004, Japan
JP3 Kanda 91 Building, 1-8-3 Kajicho, Chiyoda-ku, Tokyo, 101-0044, Japan
JP4 1-54-4, Kanda, Jimbocho, Chiyoda-ku, Tokyo, Japan
MA1 Unit 30-01, Level 30, Tower A, Vertical Business Suite, Avenue 3, Bangsar South, No. 8, Jalan Kerinchi, 59200 Kuala Lumpur, Malaysia
MY1 No.42/A Pantra Street, Dagon Township, Yangon, Myanmar
PH1 Unit 1 Mezzanine Floor, Fly Ace Corporate Center, 13 Coral Way Barangay 76, Pasay City NCR, Fourth District Philippines, 1300, Philippines
PK1 6th Floor, Citi View, Block 3, Bahadur Yar Jung Cooperative Housing Society, Shaheed-e-Millat Road, Karachi Sindh, Pakistan
RK1 #801, 8/F Korea Design Center, 322 Yanghyeon-Ro, Bundang-Gu, Seongnam-si, Gyeonggi-do, 13496, Republic of Korea
RK2 8F, Woodo Building, 214 Mangu-ro, Jungnang-gu, Seoul, 02121, Republic of Korea
SG1 #04-01, Visioncrest Commercial, 103 Penang Road, 238467, Singapore
SG2 10 Kallang Avenue, #09-16 Aperia Tower 2, 339510, Singapore
SG3 80 Robinson Road, #02-00, 068898, Singapore
SG4 60 Macpherson Road, #06-09, The Siemens Centre, 348615 Singapore
TA1 Floor 10, No. 66, Second 1, Neihu Rd, Neiting District, Taipei, Taiwan
TH1 252 SPE Tower, 9th Floor, Phaholyothin Road, Samsennai, Phayathai, Bangkok, Thailand
TH2 428 Ari Hills Building, 18th Floor, Phahonyothin Road, Samsen Nai, Phaya Thai, Bankok 10400, Thailand
VI1 10th Floor., Ha Phan Building, 17-17A-19, Ton That Tung Street, District 1, HCMC, Vietnam
Australia & New Zealand
AU1 c/o LBW & Partners, Level 3, 845 Pacific Highway, Chatswood, NSW 2067, Australia
AU2 Level 4, 24 York Street, Sydney, NSW 2000, Australia
NZ1 HPCA Limited, 1 ihumata Road, Milford, Auckland, 0620, New Zealand
Middle East & Africa
BA1 Building 1, Road 22, Block 414, Al-Daih, PO Box 20200, Jidhafs, Bahrain
EG1 7H Building, Street 263, New Maadj, Cairo, Egypt
QA1 P.O. Box 545, Doha, Qatar
SU1 Office 109, 1st Floor, Aban Center, King Abdulaziz Road, AlGhadir District, Riyadh, 13311, Saudi Arabia
SU2 Marei bin Mahfouz Group Regional Office Building, Al Aziziya intersection of Tahlia & Siteen Str nearby Ikea, Po Box 4100, Jeddah 21491, Saudi Arabia
SA1 Broadacres Business Centre, Corner Cedar, 3rd Avenue Broadacres, Sandton Gauteng, Johannesburg, 2021, South Africa
UAE1 17th & 18th Floor, Creative Tower, P. O. Box 422, Fujairah, United Arab Emirates
Europe
CY1 2nd Floor, Sotiri Tofini 4, Agios Athanasios, Limassol 4102, Cyprus
FR1 37 avenue de Friedland, 75008, Paris, France
GE1 Prielmayer.3, c/o Ruter und Partner, Steurberatungsgeesellschaft, 80335 Munich, Germany
GE2 Westenriederstraße 19, 80331 Munich, Germany
GE3 Friedensplatz 13, 53721, Siegburg, Germany
IR1 68 Merrion Square, Dublin 2, D02 W983, Ireland
IR2 70 Sir John Rogerson’s Quay, Dublin 2, Ireland
IR3 Unit 3D North Point House, North Point Business Park, New Mallow Road, Cork, Ireland
IM1 First Names House, Victoria Road, Douglas, Isle of Man, IM2 4DF, Isle of Man
JE1 22 Grenville Street, St Helier JE4 8PX, Jersey
JE2 44 The Esplanade, St Helier JE4 9WG, Jersey
LX1 21–25 Allee Scheffer, L-2520, Luxembourg
MC1 Le Suffren, 7 rue Suffren-Reymond, Monaco, 98000, Monaco
NE1 Coengebouw, Suite 8.04, Kabelweg 37, 1014 BA, Amsterdam, Netherlands
NE2 de Entree 73, 1101 BH, Toren A, Amsterdam, Netherlands
NO1 c/o Advokat Merete Bardsen, Wahl-Larson Advokatfirma AS, Fridtjof Nansens plass 5, Oslo, 0160, Norway
SP1 Calle Azcona, 36, Bajo de Madrid, Madrid 28028, Spain
SE1 Box 3255, 103 65, Stockholm, Sweden
SW1 Suurstoffi 37, 6343 Rotkreuz, Switzerland
TU1 Rüzgarlıbaçe Mah. Kavak Sok, Smart Plaza B Blok, No: 31/1 Kat: 8, 34805 Kavacik-Beykoz, Istanbul, Turkey
TU2 Molla Fenari Mah, Bab-i Ali Cad, No:9 K:3-4, Fatih 34120, Istanbul, Turkey
China and Asia
INFO
RM
A P
LC A
NN
UA
L R
EP
OR
T A
ND
AC
CO
UN
TS
20
20 IN
FOR
MA
PLC
AN
NU
AL R
EP
OR
T AN
D A
CC
OU
NT
S 20
20
216 217
FIN
AN
CIA
L S
TA
TE
ME
NT
S

N O T E S T O T H E C O N S O L I D A T E D F I N A N C I A L S T A T E M E N T S F O R T H E Y E A R E N D E D 3 1 D E C E M B E R 2 0 2 0 c o n t i n u e d
41. Contingent liabilities and assets At 31 December 2020, the Group identified one contingent asset. This related to insurance claims of £12.1m, relating to losses incurred from events cancelled as a result of COVID-19, which were under negotiation as at year end and as such remained uncertain as to their outcome. In accordance with IAS 37, these amounts have not been recognised in the financial statements of the Group at 31 December 2020. Following the end of year, and before the approval of these financial statements, these amounts were agreed with insurance providers and cash was received, for the full amount of £12.1m.
There are no contingent liabilities.
42. Post balance sheet eventsThere have been no post balance sheet events.
P A R E N T C O M P A N Y B A L A N C E S H E E T A S A T 3 1 D E C E M B E R 2 0 2 0
Notes2020
£m2019
£m
Fixed assets
Investment in subsidiary undertakings 3 7,316.8 7,868.5
Other debtors: amounts falling due after one year 4 1,913.0 1,278.0
9,229.8 9,146.5
Current assets
Debtors due within one year 5 1,239.9 2,426.9
Cash at bank and on hand 0.2 0.4
1,240.1 2,427.3
Creditors: amounts falling due within one year 6 (34.6) (1,198.6)
Net current assets 1,205.5 1,228.7
Creditors: amounts falling due after more than one year 7 (2,967.8) (3,083.6)
Net assets 7,467.5 7,291.6
Capital and reserves
Share capital 8 1.5 1.3
Share premium account 9 1,878.8 905.3
Reserve for shares to be issued 20.1 15.0
Merger reserve 9 4,501.9 4,501.9
Capital redemption reserve (17.4) (17.4)
Profit and loss account 9 1,082.6 1,885.5
Equity Shareholders’ funds 7,467.5 7,291.6
Loss for the year ended 31 December (807.8) (16.6)
The financial statements of this Company, registration number 08860726, were approved by the Board of Directors and authorised for issue on 22 April 2021 and were signed on its behalf by
Stephen A. Carter Gareth Wright Group Chief Executive Group Finance Director
INFO
RM
A P
LC A
NN
UA
L RE
PO
RT A
ND
AC
CO
UN
TS 2
02
0
219
FIN
AN
CIA
L S
TA
TE
ME
NT
SIN
FOR
MA
PLC
AN
NU
AL
RE
PO
RT
AN
D A
CC
OU
NT
S 2
02
0
218

P A R E N T C O M P A N Y S T A T E M E N T O F C H A N G E S I N E Q U I T Y F O R T H E Y E A R E N D E D 3 1 D E C E M B E R 2 0 2 0
Share capital£m
Share premium
account£m
Reserve for shares to be
issued£m
Merger reserve
£m
Capital redemption
reserve£m
Profit and loss account
£mTotal
£m
At 1 January 2019 1.3 905.3 11.4 4,501.9 (2.3) 2,176.7 7,594.3
Purchase of own shares – – – – (15.1) – (15.1)
Share-based payment charge – – 9.3 – – – 9.3
Loss for the year – – – – – (16.6) (16.6)
Equity dividends – – – – – (280.3) (280.3)
Transfer of vested LTIPs – – (5.7) – – 5.7 –
At 1 January 2020 1.3 905.3 15.0 4,501.9 (17.4) 1,885.5 7,291.6Issue of share capital 0.2 973.5 – – – – 973.7Purchase of own shares – – – – – – –Share-based payment charge – – 10.0 – – – 10.0Loss for the year – – – – – (807.8) (807.8)Equity dividends – – – – – – –Transfer of vested LTIPs – – (4.9) – – 4.9 –At 31 December 2020 1.5 1,878.8 20.1 4,501.9 (17.4) 1,082.6 7,467.5
N O T E S T O T H E P A R E N T C O M P A N Y F I N A N C I A L S T A T E M E N T S F O R T H E Y E A R E N D E D 3 1 D E C E M B E R 2 0 2 0
1. Corporate informationInforma PLC (the Company) is a company incorporated in the United Kingdom under the Companies Act 2006 and is listed on the London Stock Exchange. The Company is a public company limited by shares and is registered in England and Wales with registration number 08860726. The address of the registered office is 5 Howick Place, London SW1P 1WG.
Principal activity and business reviewInforma PLC is the Parent Company of the Informa Group (the Group) and its principal activity is to act as the ultimate holding company of the Group.
2. Accounting policiesBasis of accountingThe Company meets the definition of a qualifying entity under Financial Reporting Standard 100 (FRS 100) issued by the Financial Reporting Council. The financial statements have therefore been prepared in accordance with FRS 102 The Financial Reporting Standard applicable in the UK and Republic of Ireland as issued by the Financial Reporting Council.
As permitted by FRS 102, the Company has taken advantage of the disclosure exemptions available under that standard in relation to share-based payments, financial instruments, presentation of a cash flow statement, standards not yet effective and related party transactions. The Directors’ Report, Corporate Governance Statement and Directors’ Remuneration Report disclosures are on pages 102 to 137 of this report. The financial statements have been prepared on the historical cost basis except for the remeasurement of the derivative financial instruments which are measured at fair value at the end of each reporting period. Having assessed the principal risks and the other matters discussed in connection with the Group viability statement, the Directors have considered it appropriate to adopt the going concern basis of accounting in preparing the financial statements.
The only critical accounting judgement that would have a significant effect on the amounts recognised in the Company financial statements or key sources of estimation uncertainty at the balance sheet date that would have a significant risk of causing a material adjustment to the carrying amounts of assets and liabilities within the next financial year was those associated with the impairment assessment. These are set out in Note 3 to the Consolidated Financial Statements. The principal accounting policies adopted are the same as those set out in Note 2 to the Consolidated Financial Statements, with the exception of the merger reserve accounting treatment arising from the Scheme of Arrangement in 2014. The Company’s financial statements are presented in pounds sterling, being the Company’s functional currency.
Profit and loss accountAs permitted by section 408 of the Companies Act 2006 the Company has elected not to present its own profit and loss account or Statement of Comprehensive Income for the year. The Company’s revenue for the year is £nil (2019: £nil), and loss after tax for the year is £807.8m (2019: £16.6m).
Share-based payment amounts that relate to employees of subsidiary Group companies are recorded as capital contributions to the relevant Group company.
Investments in subsidiaries and impairment reviewsInvestments held as fixed assets are stated at cost less any provision for impairment. Where the recoverable amount of the investment is less than the carrying amount, an impairment is recognised. Impairment reviews are undertaken at least annually, or more frequently where there is an indication of impairment.
INFO
RM
A P
LC A
NN
UA
L R
EP
OR
T A
ND
AC
CO
UN
TS
20
20 IN
FOR
MA
PLC
AN
NU
AL R
EP
OR
T AN
D A
CC
OU
NT
S 20
20
220 221
FIN
AN
CIA
L S
TA
TE
ME
NT
S

3. Investments in subsidiary undertakings
Cost2020
£m2019
£m
At 1 January 7,868.5 7,861.2
Additions – other1 8.4 7.3
Impairment (560.1) –
At 31 December 7,316.8 7,868.5
1. Additions – other includes £8.4m (2019: £7.3m) related to the fair value of share incentives issued to employees of subsidiary undertakings during the year
The outbreak of COVID-19 has led to the cancellation or postponement of the majority of physical events since March, and therefore a reduction in the revenue generated by these investments. The short-term and potential longer-term impact were considered as an indicator of impairment. Due to the ongoing restrictions, and in line with our accounting policy, an annual impairment review was performed on 31 December 2020. The testing involved comparing the carrying value of investments with value in use calculations or assessments of fair value less costs to sell, derived from the latest Group cash flow projections. This review resulted in an impairment of investments in subsidiary undertakings of £560.1m (2019: £nil).
The listing below shows the direct subsidiary and other subsidiary undertakings as at 31 December 2020 which affected the profit or net assets of the Company:
Company Country of registration and operation Principal activity Ordinary shares held
Informa Switzerland Limited England and Wales Holding company 100%
Informa Global Sales, Inc. US Domestic international sales corporation 100%
UBM plc UK Holding company 100%
Details of subsidiaries controlled by the Company are disclosed in the Consolidated Financial Statements (Note 40).
4. Debtors falling due after one year
2020£m
2019£m
Amounts due from Group undertakings 1,868.4 1,275.5
Derivative financial instruments 44.6 2.5
1,913.0 1,278.0
Amounts due from Group undertakings falling due after one year are unsecured, non-interest bearing and repayable on demand.
5. Debtors falling due within one year
2020£m
2019£m
Amounts owed from Group undertakings 1,239.9 2,426.9
Amounts owed from Group undertakings falling due within one year are unsecured, non-interest bearing and repayable on demand. The interest rate on amounts owed from Group undertakings is 0% (2019: 0% to 3.25%).
6. Creditors: Amounts falling due within one year
2020£m
2019£m
Amounts owed to Group undertakings – 1,172.8
Other creditors and accruals 34.6 23.6
Current tax liabilities – 2.2
34.6 1,198.6
Amounts owed to Group undertakings falling due within one year are unsecured, non-interest bearing and repayable on demand.
N O T E S T O T H E P A R E N T C O M P A N Y F I N A N C I A L S T A T E M E N T S F O R T H E Y E A R E N D E D 3 1 D E C E M B E R 2 0 2 0 c o n t i n u e d
7. Creditors: Amounts falling due after one year
2020£m
2019£m
Revolving credit facility (RCF)1 (2.6) 54.8
Private placement loan notes2 – 871.3
Euro Medium Term Notes3 2,095.8 1,268.1
Derivative financial instruments 7.5 22.4
Amounts owed to Group undertakings 867.1 867.0
Other payables – –
2,967.8 3,083.6
1. Stated net of arrangement fees of £2.6m (2019: £2.2m)
2. Stated net of arrangement fees of £nil (2019: £1.6m)
3. Stated net of arrangement fees of £15.3m (2019: £11.0m)
Amounts owed to Group undertakings falling due after one year are unsecured, non-interest bearing and repayable on demand.
On 15 February 2019, the RCF was replaced with a new facility with two tranches: £600m for a five-year term to February 2024 and £300m for a three-year term to February 2022. On 24 January 2020, both tranches of RCF were extended by one further year, to February 2025 and February 2023 respectively. Interest is payable at the rate of LIBOR plus a margin. The RCF was fully repaid at 31 December 2020 with a balance of £nil (2019: £56.9m) and is stated net of £2.5m (2019: £2.2m) of arrangement fees.
The private placement loan notes total £nil ($nil) (2019: £872.9m ($1,150.0m)) and are stated net of £nil (2019: £1.6m) of arrangement fees. These were repaid on 6 November 2020.
In 2020, the following bonds were issued by the Company under the EMTN programme:
• A 5.5-year fixed term note, until July 2026, of value £150m with a 3.125% coupon rate• A five-year fixed term note, until October 2025, of value €700m with a 2.125% coupon rate
On 22 October 2019, the following bonds were issued to the Company under the EMTN programme:
• 8.5-year fixed term notes, until April 2028, of value €500m, with a 1.25% coupon rate
There are cross currency swaps over the EMTN borrowings where the Company receives the following:
• A fixed rate of interest for £450.0m of EMTN borrowings with a maturity of July 2026 and pays a fixed rate of interest for $588.9m
• A fixed rate of interest on €150.0m of EMTN borrowings with a maturity of July 2023 and pays a fixed rate of interest for $174.1m
• A fixed rate of interest on €500m of EMTN borrowings with a maturity of April 2028 and pays a fixed rate of interest for $551.6m
• A fixed rate of interest on €700.0m of EMTN borrowings with a maturity of October 2025 and pays a fixed rate of interest for $821.6m
At 31 December 2020, the fair value of these swaps was a financial asset of £37.1m (2019: liability £19.9m).
On 26 November 2020, the Group’s RCF was increased by £150m to £1,050m. On 14 December 2020, there were extensions to the RCF resulting in facilities of £30m (2019: £30m) maturing February 2023, £420m (2019: £270m) maturing February 2024, £60m (2019: £60m) maturing February 2025 and £540m (2019: £540m) maturing February 2026.
INFO
RM
A P
LC A
NN
UA
L R
EP
OR
T A
ND
AC
CO
UN
TS
20
20 IN
FOR
MA
PLC
AN
NU
AL R
EP
OR
T AN
D A
CC
OU
NT
S 20
20
222 223
FIN
AN
CIA
L S
TA
TE
ME
NT
S

8. Share capital
2020£m
2019£m
Issued and fully paid
1,502,137,804 (2019: 1,251,798,534) ordinary shares of 0.1p each 1.5 1.3
2020Number of
shares
2019Number of
shares
At 1 January 1,251,798,534 1,251,798,534
Issue of shares in relation to share placements in 2020 250,318,000 –
Other issue of shares 21,270 –
31 December 1,502,137,804 1,251,798,534
9. Capital and reservesShare capitalOn 30 May 2014, under a Scheme of Arrangement, 603,941,249 ordinary shares of 435p each in the Company were allotted to Shareholders. On 4 June 2014, a capital reduction took place which resulted in a reduction in share capital of £2,626.5m and the establishment of a distributable reserve of the same amount. This involved the nominal value per share of the issued share capital of the Company of 603,941,249 shares being reduced from 435p per share to 0.1p per share. During 2014, the Company also issued 45,000,000 ordinary shares of 0.1p for consideration of £207.0m.
On 11 October 2016, the Company issued 162,234,656 ordinary shares of 0.1p each through a 1-for-4 rights issue to part-fund the Penton acquisition. The shares were issued at 441p each and raised gross proceeds before expenses of £715.5m. On 2 November 2016, the Company issued 12,829,146 ordinary shares to the sellers of the Penton business in part consideration for the sale (consideration shares). The Company issued 427,536,794 shares on 18 June 2018 in connection with the acquisition of UBM plc, which at the acquisition-date closing share price of 829p. The Company also issued 256,689 shares in 2018 to satisfy UBM SAYE scheme awards maturing in the post-acquisition period.
On 15 April 2020, the Company announced a share placement of 250,318,000 new ordinary shares of 0.1p. 125,159,000 new ordinary shares were issued on 20 April 2020 and a further 125,159,000 on 5 May 2020. The shares were issued at 400p per share resulting in gross proceeds of £1,001.3m and an increase in share capital of £0.2m. In 2020 the Company also issued 21,270 ordinary shares of 0.1p to Non-Executive Directors of the Company.
Share premiumIn 2014, the Company issued 45,000,000 ordinary shares of 0.1p with the share premium (net of transaction costs) being £204.0m. Share premium as at 31 December 2014 and 2015 amounted to £204.0m. On 11 October 2016, the Company issued 162,234,656 ordinary shares of 0.1p each through a 1-for-4 rights issue. The shares were issued at 441p each and resulted in share premium (net of transaction costs) of £701.3m. On 20 April 2020 and 5 May 2020, the Company issued 125,159,000 ordinary shares totalling 250,318,00 of 0.1p each. The shares were issued at 400p each and resulted in share premium (net of transaction costs) of £973.5m. Share premium relating to the 2020 issues of 21,270 shares to Non-Executive Directors of the Company was £0.1m.
Merger reserveOn 30 May 2014, under a Scheme of Arrangement, the Company subscribed to shares in Informa Switzerland Limited, formerly Old Informa, a subsidiary undertaking, which were valued at £3,500.0m. This resulted in new share capital of £2,627.1m from the issue of 603,941,249 shares at a nominal value of 435p and the creation of a merger reserve of £872.9m.
On 2 November 2016, the Company acquired Penton Information Services and the Group issued 12,829,146 ordinary shares to the vendors, with the £82.2m share premium on the shares issued recorded against the merger reserve in accordance with the merger relief rules of the Companies Act 2006.
The Company acquired UBM plc on 15 June 2018 and issued 427,536,794 shares resulting in an increase in the merger reserve of £3,544.6m. The Company also issued 256,689 shares in 2018 to satisfy UBM SAYE scheme awards maturing in the post-acquisition period and there was an increase in the merger reserve of £2.2m in relation to the issue of these shares.
N O T E S T O T H E P A R E N T C O M P A N Y F I N A N C I A L S T A T E M E N T S F O R T H E Y E A R E N D E D 3 1 D E C E M B E R 2 0 2 0 c o n t i n u e d
Profit and loss accountOn 4 June 2014, a capital reduction took place which resulted in a reduction in share capital of £2,626.5m and the establishment of a distributable reserve of the same amount. This involved the nominal value per share of the issued share capital of the Company of 603,941,249 shares being reduced from 435p per share to 0.1p per share.
The distributable reserves of the Company are not materially different to the profit and loss account balance, with distributable reserves of £1,064.3m at 31 December 2020 (31 December 2019: £1,872.5m).
As at 31 December 2020, the Informa Employee Share Trust (EST) held 697,644 (2019: 958,988) ordinary shares in the Company and the ShareMatch Scheme held 710,697 (2019: 474,878) matching ordinary shares in the Company. The average exercise price during the year was 449p (2019: 803p). The shares held by the EST relating to ShareMatch have not been allocated to individuals, whilst shares relating to the Deferred Share Bonus Plan have been allocated to individuals as set out in the Directors’ Remuneration Report on pages 116 to 131.
Details of the description of reserves are disclosed in the Consolidated Financial Statements (Note 36).
10. Share-based paymentsDetails of the share-based payments are disclosed in the Consolidated Financial Statements (Note 10).
11. DividendsDuring the year an interim dividend of £nil (2019: £94.5m) and a final dividend for the prior year of £nil (2019: £185.8m) were recognised as distributions by the Company. As at 31 December 2020, £0.2m (2019: £0.4m) of dividends were still to be paid relating to prior periods. Details of dividends are disclosed in the Consolidated Financial Statements (Note 14).
12. Related partiesThe Directors of Informa PLC had no material transactions with the Company or its subsidiaries during the year other than service contracts and Directors’ liability insurance. Details of Directors’ remuneration are disclosed in the Remuneration Report. The Company has taken advantage of the exemption that transactions with wholly owned subsidiaries do not need to be disclosed.
INFO
RM
A P
LC A
NN
UA
L R
EP
OR
T A
ND
AC
CO
UN
TS
20
20 IN
FOR
MA
PLC
AN
NU
AL R
EP
OR
T AN
D A
CC
OU
NT
S 20
20
224 225
FIN
AN
CIA
L S
TA
TE
ME
NT
S

The following UK subsidiaries will take advantage of the audit exemption set out within section 479A of the Companies Act 2006 for the year ended 31 December 2020:
A U D I T E X E M P T I O N
Audit exempt companyRegistration
number
ABI Building Data Limited 02385277
Afterhurst Limited 01609566
AMA Research Limited 04501364
Blessmyth Limited 03805559
Canrak Books Limited 03194381
Colonygrove Limited 04109768
Colwiz UK Limited 08164609
Datamonitor Limited 02306113
Design Junction Limited 07634779
DIVX Express Limited 03212879
Dove Medical Press Limited 04967656
Ebenchmarkers Limited 04159695
E-Health Media Limited 04214439
F1000 Research Limited 08322928
Futurum Media Limited 09813559
GNC Media Investments Limited 03085849
Green Thinking (Services) Limited 05803263
Hirecorp Limited 04790559
IBC (Ten) Limited 01844717
IBC (Twelve) Limited 03007085
IBC Fourteen Limited 03119071
IIR (U.K. Holdings) Limited 02748477
IIR Management Limited 02922734
Informa Connect Limited 01835199
Informa Exhibitions Limited 05202490
Informa Finance Australia Limited 12008055
Informa Finance Brazil Limited 12007958
Informa Finance Egypt Limited 12008044
Informa Finance Mexico Limited 12008165
Informa Finance UK Limited 08774672
Informa Finance USA Limited 08940353
Informa Global Markets (Europe) Limited 03094797
Informa Group Limited 03099067
Informa Holdings Limited 03849198
Informa Manufacturing Europe Limited 09893244
Informa Manufacturing Europe Holdings Limited 10025028
Informa Manufacturing Holdings Limited 10025020
Informa Markets Limited 02972059
Informa Markets (Europe) Limited 08851438
Informa Markets (Maritime) Limited 00495334
Informa Markets (UK) Limited 00370721
Informa Overseas Investments Limited 05845568
Informa Property (Colchester) Limited 03610056
Informa Six Limited 04606229
Informa Tech Founders Limited 12302369
Audit exempt companyRegistration
number
Informa Tech Research Limited 11971005
Informa Telecoms & Media Limited 00991704
Informa Three Limited 04595951
Informa UK Limited 01072954
Informa US Holdings Limited 09319013
ITF2 Limited 12294578
James Dudley International Limited 02394118
Light Reading UK Limited 08823359
London-on-Water Limited 10621549
MAI Luxembourg UK Societas SE000010
Mapa International Limited 04757016
Miller Freeman Worldwide Limited 01750865
MRO Exhibitions Limited 02737787
MRO Network Limited 09375001
MRO Publications Limited 02732007
OES Exhibitions Limited 09958003
OTC Publications Limited 02765878
Penton Communications Europe Limited 02805376
Roamingtarget Limited 05419444
Routledge Books Limited 03177762
Taylor & Francis Books Limited 03215483
Taylor & Francis Group Limited 02280993
Taylor & Francis Publishing Services Limited 03674840
TU-Automotive Holdings Limited 09823826
TU-Automotive Limited 09798474
UBM Aviation Worldwide Limited 04226716
UBM (GP) No 1 Limited 03259390
UBM International Holdings UK Societas SE000009
UBM Property Limited 08227422
UBM Property Services Limited 03212363
UBMG Holdings 00152298
UBMG Limited 01693134
UBMG Services Limited 03666160
UBM Holdings Limited 04790552
UBM Shared Services Limited 04957131
United Consumer Media UK Societas SE000008
United Delaware Investments Limited 03096874
United Finance Limited 00948730
United Newspapers Publications Limited 00235544
The Group provides adjusted results and underlying measures in addition to statutory measures, in order to provide additional useful information on business performance trends to Shareholders. The Board considers these non-GAAP measures as the most appropriate way to measure the Group’s performance because it aids comparability to the prior year and is also in line with the similarly adjusted measures used by peers and therefore facilitates comparison.
The terms ‘adjusted’ and ‘underlying’ are not defined terms under IFRS and may not therefore be comparable with similarly-titled measurements reported by other companies. These measures are not intended to be a substitute for, or superior to, IFRS measurements. The Financial Review provides reconciliations of alternative performance measures (APMs) to statutory measures and also provides the basis of calculation for certain APM metrics. These APMs are provided on a consistent basis with the prior year.
Adjusted results and adjusting itemsAdjusted results exclude items that are commonly excluded across the media sector: amortisation and impairment of goodwill and intangible assets relating to businesses acquired and other intangible asset purchases of book lists, journal titles, acquired databases and brands related to exhibitions and conferences, acquisition and integration costs, profit or loss on disposal of businesses, restructuring costs and other items that in the opinion of the Directors would impact the comparability of underlying results. Adjusting items are detailed in Note 8 to the Consolidated Financial Statements.
Adjusted results are prepared for the following measures which are provided in the Consolidated Income Statement on page 147: Adjusted operating profit, Adjusted net finance costs, Adjusted profit before tax (PBT), Adjusted tax charge, Adjusted profit after tax, Adjusted earnings, and Adjusted diluted earnings per share. Adjusted operating margin, Adjusted tax rate and Adjusted EBITDA are used in the Financial Review on pages 84, 87 and 90 respectively.
EBITDA• Adjusted EBITDA is earnings before interest, tax, depreciation, amortisation and other non-cash items such as share-based
payments and before adjusting items• Covenant-adjusted EBITDA for interest cover purposes under the Group’s previous debt covenants is earnings before interest,
tax, depreciation and amortisation and adjusting items. It is adjusted to be on a pre-IFRS 16 basis• Covenant-adjusted EBITDA for leverage purposes under the Group’s previous debt covenants is earnings before interest, tax,
depreciation and amortisation and adjusting items. It is adjusted to include a full year’s trading for acquisitions and remove trading results for disposals, and adjusted to be on a pre-IFRS 16 basis
Effective tax rateThe effective tax rate is shown as a percentage and is calculated by dividing the adjusted tax charge by the adjusted profit before tax. The Financial Review on page 87 provides the calculation of the effective tax rate.
Free cash flowFree cash flow is a key financial measure of cash generation and represents the cash flow generated by the business before cash flows relating to acquisitions and disposals and their related costs, dividends, and any new equity issuance or purchases and debt issues or repayments. Free cash flow is one of the Group’s key performance indicators, and is an indicator of operational efficiency and financial discipline, illustrating the capacity to reinvest, fund future dividends and repay down debt. The Financial Review on page 90 provides a reconciliation of free cash flow to statutory measures.
G L O S S A R Y O F T E R M S : A L T E R N A T I V E P E R F O R M A N C E M E A S U R E S
INFO
RM
A P
LC A
NN
UA
L R
EP
OR
T A
ND
AC
CO
UN
TS
20
20 IN
FOR
MA
PLC
AN
NU
AL R
EP
OR
T AN
D A
CC
OU
NT
S 20
20
226 227
FIN
AN
CIA
L S
TA
TE
ME
NT
S

Interest coverDebt covenants ceased to apply to all the Group’s borrowing facilities from November 2020 following the repayment of debt subject to debt covenants. Interest cover is calculated according to the Group’s previous debt covenants and is the ratio of covenant-adjusted EBITDA for interest cover purposes to adjusted net finance costs and excluding finance fair value items. It is provided to enable the assessment of our debt position together with our compliance with these previous specific debt covenants. The Financial Review on page 93 provides the basis of the calculation of interest cover.
Leverage ratioThe leverage ratio is calculated according to the Group’s previous debt covenants and is the ratio of net debt to covenant-adjusted EBITDA for leverage information purposes, and is provided to enable the assessment of our debt position together with compliance with these previous specific debt covenants. Covenant-adjusted net debt is translated using average exchange rates for the 12-month period and is adjusted to include deferred consideration payable, to exclude derivatives associated with borrowings and to be on a pre-IFRS 16 basis. The Financial Review on page 93 provides the basis of the calculation of the leverage ratio.
Operating cash flow and operating cash flow conversionOperating cash flow is a financial measure used to determine the efficiency of cash flow generation in the business and is measured by and represents free cash flow before interest, tax, restructuring and reorganisation costs. The Financial Review on page 90 reconciles operating cash flow to statutory measures.
Operating cash flow conversion is a measure of the strength of cash generation in the business and is measured as a percentage by dividing operating cash flow by adjusted operating profit in the reporting period. The Financial Review on page 90 provides the calculation of operating cash flow conversion.
Underlying measures of growthUnderlying measures of growth refer to revenue and adjusted operating profit results adjusted for acquisitions and disposals, the phasing of events, including biennials, the impact of changes from implementing new accounting standards and accounting policy changes and the effects of changes in foreign currency by adjusting the current year and prior year amounts to use consistent currency exchange rates. Phasing and biennial adjustments relate to the alignment of comparative period amounts to the timing of events in the current year. Where an event originally scheduled for 2020 was either cancelled or postponed there was an adverse impact on 2020 underlying growth as no adjustment was made for these in the calculation.
The results from acquisitions are included on a pro-forma basis from the first day of ownership in the comparative period. Disposals are similarly adjusted for on a pro-forma basis to exclude results in the comparative period from the date of disposal. Underlying measures are provided to aid comparability of revenue and adjusted operating profit results against the prior year. The Financial Review on page 85 provides the reconciliation of underlying measures of growth to reported measures of growth in percentage terms.
2020£m
2019£m
2018£m
2017£m
2016£m
Results from operations
Revenue 1,660.8 2,890.3 2.369.5 1,756.8 1,344.8
Adjusted operating profit 267.8 933.1 732.1 544.9 415.6
Statutory operating (loss)/profit (880.4) 538.1 363.2 344.7 198.6
Statutory (loss)/profit before tax (1,139.7) 318.7 282.1 268.2 178.1
(Loss)/profit attributable to equity holders of the parent (1,041.5) 225.5 207.9 310.8 171.5
Free cash flow (153.9) 722.1 503.2 400.9 305.7
Net assets
Non-current assets 9,037.0 10,001.4 10,328.7 4,356.6 4,542.3
Current assets 695.2 721.9 715.1 460.5 489.3
Current liabilities (1,200.6) (1,584.6) (1,530.8) (1,117.7) (1,048.8)
Non-current liabilities (2,889.6) (3,300.7) (3,441.4) (1,470.4) (1,795.0)
Net assets 5,642.0 5,838.0 6,071.6 2,229.0 2,187.8
Key statistics from continuing operations (pence)1
Earnings per share (73.4) 17.9 19.6 37.5 23.5
Diluted earnings per share (73.4) 17.8 19.5 37.4 23.4
Adjusted diluted earnings per share 9.9 51.0 48.8 45.7 41.8
Dividends per share – 7.5 21.8 20.3 19.2
1. 2016-2019 EPS and dividends per share restated for 2020 share placement
F I V E - Y E A R S U M M A R YG L O S S A R Y O F T E R M S : A L T E R N A T I V E P E R F O R M A N C E M E A S U R E S c o n t i n u e d
INFO
RM
A P
LC A
NN
UA
L R
EP
OR
T A
ND
AC
CO
UN
TS
20
20 IN
FOR
MA
PLC
AN
NU
AL R
EP
OR
T AN
D A
CC
OU
NT
S 20
20
228 229
FIN
AN
CIA
L S
TA
TE
ME
NT
S

Shareholder Information
S H A R E H O L D E R I N F O R M A T I O N
Annual General MeetingInforma’s 2021 AGM will be held on Thursday 3 June 2021 at 11.00am. Details of the resolutions being proposed at the AGM, together with details on how Shareholders can participate and vote online, are set out in the Notice of Meeting available on our website at www.informa.com.
RegistrarAll general enquiries about holdings of ordinary shares in Informa PLC should be addressed to our registrar, Computershare:
Computershare Investor Services PLC The Pavilions, Bridgwater Road Bristol BS99 6ZZ Helpline: +44 (0)370 707 1679 www.investorcentre.co.uk
The helpline is available Monday to Friday, 8.30am to 5.30pm.
To access shareholding details online, go to Computershare’s website at www.investorcentre.co.uk. To register to use the website, you will need your Shareholder reference number, shown on your share certificate or dividend voucher.
The website enables you to:
• View and manage all yourshareholdings
• Register for electronic communications
• Buy and sell shares online with thedealing service
• Deal with other matters such as achange of address, transferring shares or replacing a lost certificate
Electronic Shareholder communicationsAs part of Informa’s commitment to the sustainable use of natural resources and reducing our environmental impact, we offer all Shareholders the opportunity to elect to register for electronic communications. To do so, please visit www.investorcentre.co.uk/ecomms.
Dividend and dividend reinvestmentInforma typically pays dividends in June and September each year.
Shareholders can have their dividends paid directly into a bank or building society account. To do this, complete the dividend mandate instruction form available at www.investorcentre.co.uk or contact our registrar.
To receive dividends in a different currency, you will need to register for the global payments service provided by our registrar. Further information is available at www.investorcentre.co.uk.
Informa offers a Dividend Reinvestment Plan, or DRIP, where cash dividends can be automatically reinvested in further Informa shares. Further details and full terms and conditions, including eligibility for Shareholders based outside of the UK, are available at www.investorcentre.com.
Share dealingShareholders can buy or sell Informa PLC shares using a share dealing facility operated by our registrar. Dealing can be undertaken online or by telephone. Further information, including details of eligibility and costs, can be found at www.investorcentre.co.uk or by calling 44 (0)370 703 0084 between 8.00am and 4.30pm Monday to Friday. You should have your Shareholder reference number to hand when logging on or calling.
UK regulations require the registrar to check that you have read and accepted the terms and conditions before being able to trade, which could delay your first telephone trade. If you wish to trade quickly, please register online at www.computershare.trade before visiting www.investorcentre.co.uk.
Informa’s ordinary shares continue to trade on the Premium Main Market of the London Stock Exchange under the symbol INF, ISIN: GB00BMJ6DW54.
ADR programme for US investorsSince 2013 Informa has maintained a Level I American Depositary Receipt (ADR) programme with BNY Mellon. Each Informa ADR represents two ordinary shares and they trade on the over-the-counter market in the US under the symbol IFJPY, ISIN: US45672B2060.
Information on Informa’s ADRs can be found at www.adrbnymellon.com.
ShareGiftShareGift (registered charity no. 1052686) is an independent charity that takes holdings of shares that may be unwanted, aggregates those shares and sells them for the benefit of thousands of charities. If you have a small shareholding in Informa and would like to support this initiative, see the ShareGift website at www.ShareGift.org, email [email protected] or call +44 (0) 20 7930 3737.
Protecting your investment from share fraudThe world of investing and share dealing unfortunately attracts fraudsters.
Shareholders are strongly advised to be highly cautious about any unsolicited phone calls or correspondence about investment matters, whether they claim to be associated with Informa PLC, an Informa company, an Informa Director or any other company or scheme.
The UK’s Financial Conduct Authority (FCA) reports that even experienced investors can be deceived and lose large amounts of money through what are ever more sophisticated schemes.
From time to time, we receive reports from Shareholders that they have been contacted about investment matters that imply a connection with Informa or one of its subsidiaries.
Neither Informa PLC nor any Director of an Informa company will ever offer investment advice or make unsolicited calls or send unsolicited emails or letters about buying or selling shares.
Shareholder details Under UK law, companies have to make their shareholder registers publicly available. Shareholder registers include the names of shareholders, their address and the number of shares they hold.
These details can be obtained without the company’s knowledge or control and used, sometimes in combination with other sources, to obtain additional information such as phone numbers.
Common scams There are many known investment scams in the UK. Some of the most common are:
• A caller offers shares for sale, which often turn out to be worthless or relatedto high risk US or UK investments
• A caller says there is an imminentoffer from the company in which the shareholder has invested and offers to buy their shares at a pricesignificantly above the current marketrate. This may involve payment of an administration fee or transferring shares to the caller
• In January 2021, the FCA issued a warning over so-called ‘clone firminvestment scams’. Clone firms arefake firms set up by scammers usingsome of the details of real companiesthat are authorised by the FCA, suchas their name, address and firmreference number (or FRN).
Fraudsters can be very persistent and extremely persuasive, and often have websites that support their activities and claim to be related to the websites of genuine companies.
What to do Shareholders are advised to be very wary of any unsolicited investment advice, offers to buy or sell any shares or offers of free company reports. If it sounds too good to be true, it probably is.
If you receive any unsolicited phone calls or correspondence:
• Treat any call with extreme caution– if called, the safest thing to do ishang up
• Do not give out or confirm anypersonal information
• If you have a conversation with someone, make sure you record thename of the person and organisation who contacted you – name, telephonenumber and web address if possible
• Do not hand over any money withoutchecking that the organisation isauthorised by the FCA atwww.fca.org.uk/register/.Some scammers copy the registration details of a genuine regulated firm.The FCA keeps a warning list on its ScamSmart website atwww.fca.org.uk/scamsmart
Report the issue If you think you have been targeted, you should report the matter to the FCA as soon as possible via its online form at www.fca.org.uk/consumers/scams/report-scam or by calling its consumer helpline on 0800 111 6768 from the UK or +44 (0)20 7066 1000 from outside.
You can also report any suspicious contact received via the Action Fraud website (www.actionfraud.police.uk), or by calling 0300 123 2040.
If you receive telephone calls, emails or letters purporting to be from Informa, or companies endorsed by Informa, and you are unsure if they are legitimate, please contact our Shareholder helpline (+44 (0)370 707 1679) or email our Investor Relations team at [email protected].
Details of any share dealing facilities endorsed by Informa are listed in the Shareholder Information pages of the Annual Report and will be included in any relevant company mailing.
Tips on protecting your shareholding: • Ensure all your certificates are kept
in a safe place or hold your shareselectronically in CREST via a nominee
• Keep all documentation containing personal share information in a safeplace and shred any correspondenceyou do not wish to keep
• Know when the dividends are paid and consider having dividends paid directly into your bank
• If you change address or bankaccount, inform the registrarimmediately. If you receive a letterfrom the registrar regarding a changeof address or bank details that you did not instigate, contact themimmediately on +44 (0)370 707 1679
• If you are buying or selling shares,only deal with brokers registered in the UK or in your country of residence
INFO
RM
A P
LC A
NN
UA
L R
EP
OR
T A
ND
AC
CO
UN
TS
20
20 IN
FOR
MA
PLC
AN
NU
AL R
EP
OR
T AN
D A
CC
OU
NT
S 20
20
230 231
CO
MP
AN
Y IN
FO
RM
AT
ION

Advisers
A D V I S E R S
AuditorDeloitte LLP1 New Street SquareLondon EC4A 3HQUK
www.deloitte.com
Joint StockbrokerBAML2 King Edward StreetLondon EC1A 1HQUK
www.bofaml.com
Joint StockbrokerMorgan Stanley25 Cabot SquareLondon E14 5ABUK
www.morganstanley.com
Depository Bank BNY MellonDepositary Receipts 101 Barclay Street, 22nd FloorNew York NY 10286United States
www.adrbnymellon.com
Principal Solicitors Clifford Chance LLP10 Upper Bank Street London E14 5JJUK
www.cliffordchance.com
Strategic Financial AdviceRothschildNew CourtSt Swithin’s LaneLondon EC4N 8ALUK
www.rothschild.com
Communications Advisers Teneo6 More London PlaceLondon SE1 2DAUK
www.teneo.com
RegistrarComputershare Investor Services PLC The PavilionsBridgwater RoadBristol BS99 6ZZUK
www.computershare.com
Legal noticesNotice concerning forward-looking statementsThis Annual Report contains forward-looking statements. Although the Group believes that the expectations reflected in such forward-looking statements are reasonable, these statements are not guarantees of future performance and are subject to a number of risks and uncertainties and actual results and events could differ materially from those currently being anticipated as reflected in such forward-looking statements. The terms ‘expect’, ‘estimate’, ‘forecast’, ‘target’, “believe’, ‘should be’, ‘will be’ and similar expressions are intended to identify forward-looking statements. Factors which may cause future outcomes to differ from those foreseen in forward-looking statements include, but are not limited to, those identified under ‘Principal Risks and Uncertainties’ on pages 71 to 77 of this Annual Report. The forward-looking statements contained in this Annual Report speak only as of the date of publication of this Annual Report and the Group therefore cautions readers not to place undue reliance on any forward-looking statements.
Except as required by any applicable law or regulation, the Group expressly disclaims any obligation or undertaking to release publicly any updates or revisions to any forward-looking statements contained in this document to reflect any change in the Group’s expectations or any change in events, conditions or circumstances on which any such statement is based.
WebsiteInforma’s website www.informa.com gives additional information on the Group. Information made available on the website does not constitute part of this Annual Report.
The paper in this report is produced with FSC® mixed sources with pulp which is partially recyclable, biodegradable, pH neutral, heavy metal free and acid free. It is manufactured within a mill which complies with the international environmental ISO 14001 standard.
Informa is grateful to the following for their support and contribution to the production of this Annual Report:
Consultancy, design and production by Luminous www.luminous.co.uk
Cover and illustrations by Stephanie Wunderlich
Page 5 Magic pop-up Orlando photography by Hailley Howard
Page 59 photography by ThisisEngineering RA Eng/Unsplash
Page 63 photography by heylagostechie/Unsplash
Board of Directors photography by Simon Jarratt
All information in this report is © Informa PLC 2020 and may not be used in whole or part without prior permission.
We use biodegradable vegetable based inks. All waste paper, chemicals and other materials generated in the manufacturing process are recycled.
The printed version of this document is a certified CarbonNeutral® publication, meaning the emissions from production and shipping have been offset, reducing them to zero.IN
FOR
MA
PLC
AN
NU
AL
RE
PO
RT
AN
D A
CC
OU
NT
S 2
02
0
232

These are some of Informa’s office locations around the world:
EuropeLondon (Registered Office)5 Howick Place, SW1P 1WG+44 (0)20 7017 [email protected] Blackfriars240 Blackfriars, SE1 8BFLondon Blue Fin Building110 Southwark Street, SE1 0SUColchesterSheepen Place, Essex, CO3 3LPMilton Park 4 Park Square, Milton Park, OX14 4RNAmsterdamDe Entreé 73, 1101 B, AmsterdamMonaco7, rue Suffren-Reymond Le Suffren, MC 98000
AmericasNew York605 Third Avenue, New York, NY 10158Washington DC2121 K Street NW, Washington DC, DC 20037Philadelphia530 Walnut Street, Philadelphia, PA 19106Boca Raton6000 Broken Sound, Parkway NW, Boca Raton, FLKansas City22701 West 68th Terrace Shawnee, KS 66226Boulder5541 Central Avenue, Boulder, CO 80301Phoenix2020 North Central Avenue, Phoenix, AZ 85004Dallas222 West Las Colinas Boulevard, Irving, TX 75039San Francisco303 2nd Street, San Francisco, CA 94107Santa Monica28th St, Suite 100, Santa Monica, CA 90405Toronto20 Eglinton Avenue West, Toronto
Mexico CityLago Alberto 319, Colonia Granada, Delegacion Miguel Hidalgo, Mexico City 11520São PauloAvenida Dra Ruth Cardoso, 7221, Pinheiros, São Paulo
Middle East/AustralasiaIstanbulSmart Plaza B Blok, Rüzgarlıbahçe Mah. Kavak Sok, Kavacık Beykoz BahrainBuilding 1, Road 22, Block 414 Al-Diah, JidhafsCairo7H Building, Street 263 New Maadi, CairoDubaiLevel 20, World Trade Centre Tower, PO Box 9292, DubaiMumbaiTimes Square, Andheri-Kurla Road, Mumbai 400 059New Delhi1 Jai Singh Road, New Delhi 110001Hong Kong17/F China Resources Building, 26 Harbour Road, WanchaiShanghai9/F Ciros Plaza, No. 388 West Nanjing Road, Shanghai 200003SingaporeVisioncrest Building, 103 Penang, Singapore 238467Kuala LumpurSunway Visio Tower, Lingkaran SV, Sunway, Velocity 55100, Kuala LumpurTokyoKanda 91 Building, Chiyoda-ku, Tokyo 101-0044Sydney24 York Street, NSW 2000