derivation and validation of a prediction tool for venous thromboembolism (vte): a verity registry...
TRANSCRIPT

Derivation and Validation of a Prediction Tool for
Venous Thromboembolism (VTE):A VERITY Registry Study
Roopen Arya, Shankaranarayana Paneesha, Aidan McManus, Nick Parsons, Nicholas Scriven, Tim Farren, Tim Nokes,
Denise O'Shaughnessy & Peter Rosefor the VERITY Investigators

Disclosures for Dr. Roopen Arya
Presentation includes discussion of the following off-label use of a drug or medical device: N/A
Research Support/P.I. Sanofi-aventis
Employee No relevant conflicts of interest to declare
Consultant No relevant conflicts of interest to declare
Major Stockholder No relevant conflicts of interest to declare
Speakers Bureau No relevant conflicts of interest to declare
Honoraria Sanofi-aventis
Scientific Advisory Board Boehringer Ingelheim
In compliance with ACCME policy, ASH requires the following disclosures to the session audience:
49th A
SH A
nnua
l Mee
ting
♦ A
tlant
a, G
eorg
ia

VPrevention of VTE in hospitalised patients:
the UK experienceDocumented mandatory risk
Documented mandatory risk
assessment for all hospitalised
assessment for all hospitalised
patients
patients

Why the need for risk assessment for VTE?
Identifying at-risk patientIdentifying at-risk patient
Counselling at-risk patientCounselling at-risk patient
PrescribePrescribethromboprophylaxisthromboprophylaxis

Risk Assessment
• The highest ranking safety practice was the appropriate use of prophylaxis to prevent VTE in patients at risk.AHRQ “Making Health Safer: A Critical Analysis of Patient Safety Practices” 2001
• We recommend that every hospital develop a formal strategy that addresses the prevention of thromboembolic complications. This should generally be in the form of a written thromboprophylaxis policy especially for high risk groups.ACCP guidelines “ Prevention of VTE” 2004

Risk assessment models
• Group-specific (‘opt-out’)
• Individualized (‘opt-in’)
– Risk stratification
– Risk scores
• Linked to ACTION of thromboprophylaxis

Kucher, N. et al. N Engl J Med 2005;352:969-977
Clinical Feature Score
Active cancer (treatment ongoing or within 6 months or palliative) 3
Personal history of VTE 3
Thrombophilia 3
Recent major surgery 2
Advanced age (≥ 75 years) 1
Obesity (BMI >29) 1
Bed rest (medical inpatient/immobilized >3d in last 4 wks/paralysis) 1
Hormonal therapy (OCP/HRT) 1
Risk scoring for VTE: Kucher risk score

Primary end point: Freedom from VTE
Intervention
Control
Number at risk1255 977 900 853
1251 976 893 839
Intervention
Control
Time (days)0 30 60 90
Fre
edo
m f
rom
D
VT
or
PE
(%
)
90
92
94
96
98
100
P < 0.001
Kucher, N. et al. N Engl J Med 2005;352:969-977

Study objective
• to develop a multiple regression model for VTE risk, based on Kucher, and validate its performance
• to employ the extensive VTE risk factor data recorded in a UK VTE treatment registry (VERITY) – VERITY enrolls patients presenting to hospital with
suspected VTE

UK multi-centre observational VTE registry of
clinical management practices & patient outcomes

Features of VERITY
• National registry – outpatient VTE treatment
• Full spectrum of VTE – DVT and PE
• Records information on patients presenting with suspected and confirmed VTE
• Expanded data on demographics, presentation, management & outcomes
• Extensive risk factor data
Statistical plan – model development
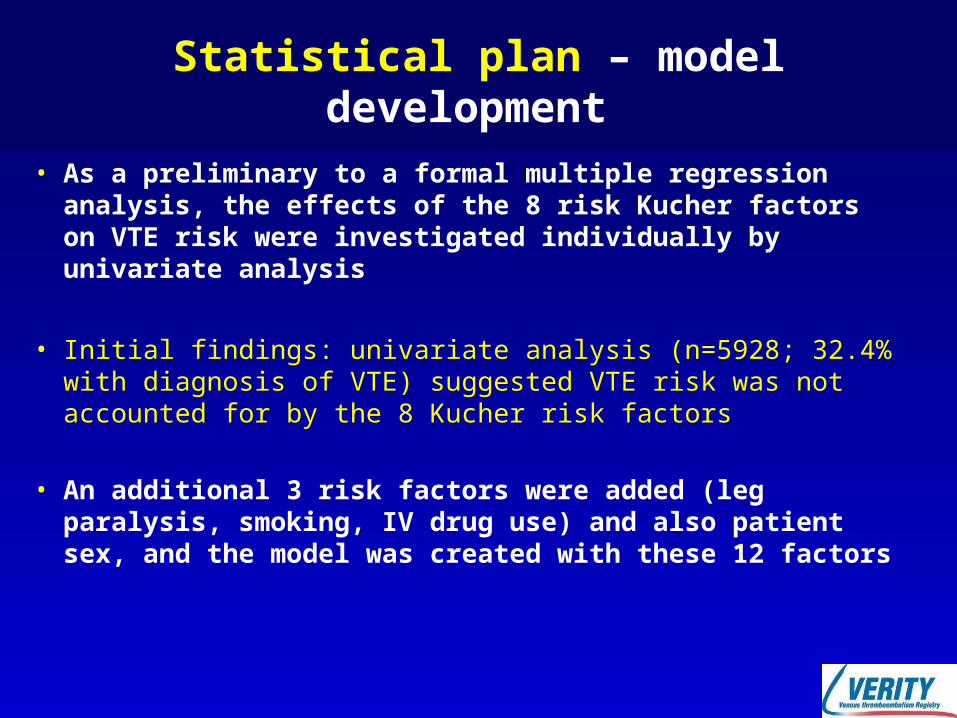
• As a preliminary to a formal multiple regression analysis, the effects of the 8 risk Kucher factors on VTE risk were investigated individually by univariate analysis
• Initial findings: univariate analysis (n=5928; 32.4% with diagnosis of VTE) suggested VTE risk was not accounted for by the 8 Kucher risk factors
• An additional 3 risk factors were added (leg paralysis, smoking, IV drug use) and also patient sex, and the model was created with these 12 factors

Statistical plan – model development
• The multiple logistic regression model was developed using backward stepwise regression
• The open source statistical package ‘R’ was employed to conduct the regression analysis
Statistical plan – model performance
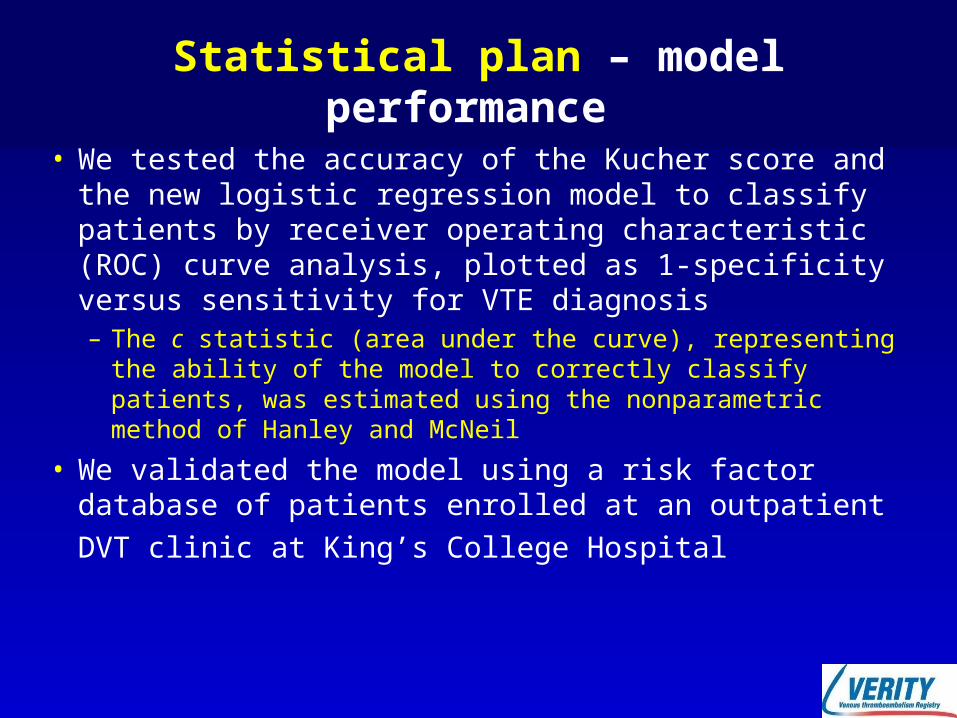
• We tested the accuracy of the Kucher score and the new logistic regression model to classify patients by receiver operating characteristic (ROC) curve analysis, plotted as 1-specificity versus sensitivity for VTE diagnosis– The c statistic (area under the curve), representing the ability
of the model to correctly classify patients, was estimated using the nonparametric method of Hanley and McNeil
• We validated the model using a risk factor database of patients enrolled at an outpatient
DVT clinic at King’s College Hospital

Statistical plan – model performance
• We interpreted the predicted probabilities from the logistic regression model as a risk score– each tenth of predicted risk was scored as 1
• i.e. lower tenth of risk = risk score of 1; upper tenth of risk = risk score of 10
• We assessed the degree of agreement between the observed rate and the predicted rate of VTE by plotting the risk score vs. observed VTE rate– Differences in the rates of VTE vs. increasing risk score
were assessed using the χ2 test for trend

Results - study populations
VERITYn=55996
Assessment cohort (n=5938)8 risk factors knownVTE status known
Development cohort (n=5241)12 risk factors known
VTE status known
Validation Cohort (n=915)12 risk factors known
VTE status known
DVT O/PKCL n=928
Univariate regressionanalysis
Multiple regressionanalysis
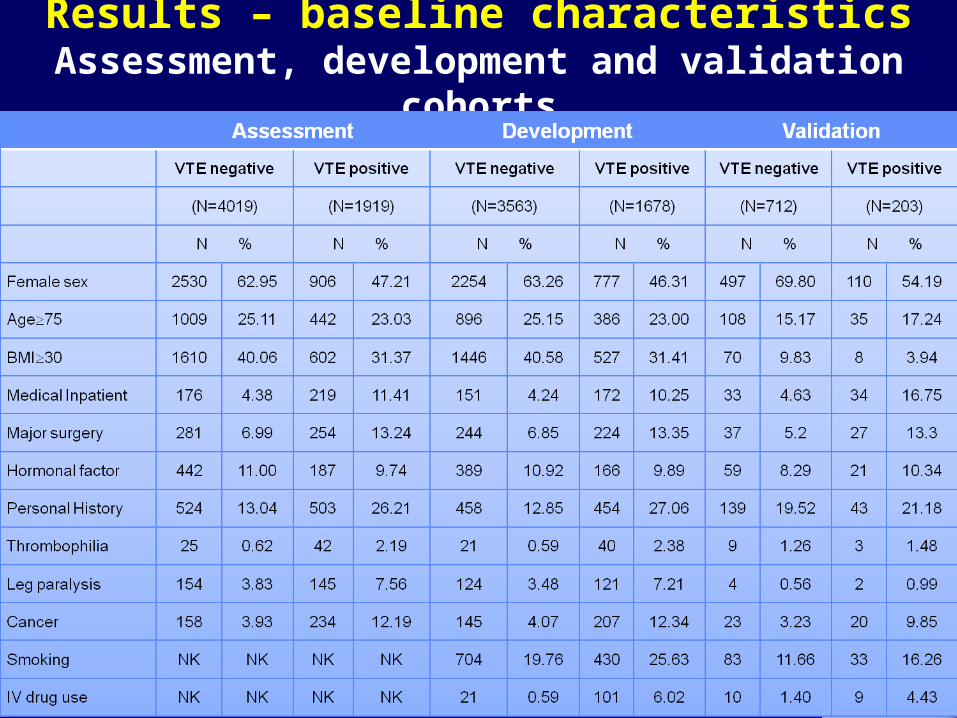
Results – baseline characteristicsAssessment, development and validation cohorts

Results – risk factor findings in multiple logistic regression model
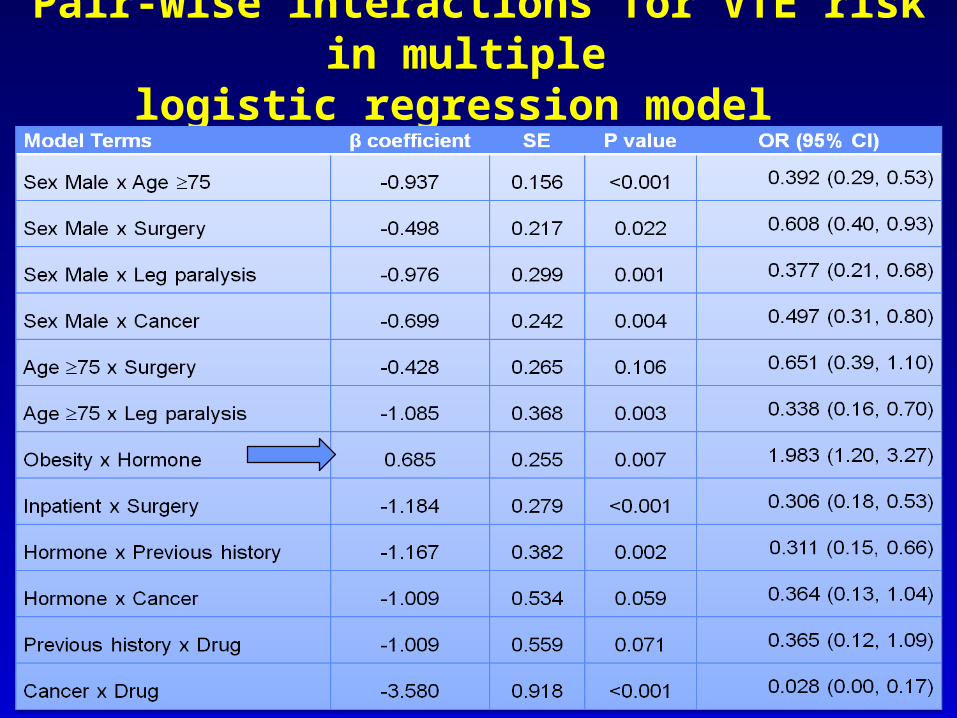
Pair-wise interactions for VTE risk in multiple logistic regression model
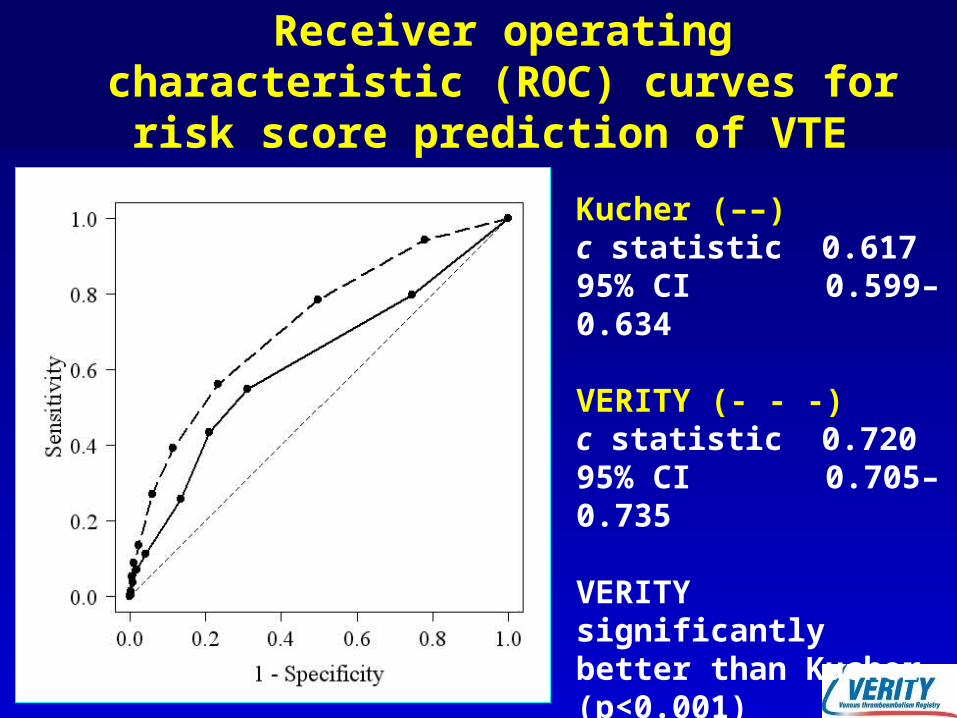
Receiver operating characteristic (ROC) curves for risk score prediction of VTE
Kucher (––)c statistic 0.61795% CI 0.599–0.634 VERITY (- - -)c statistic 0.720 95% CI 0.705–0.735
VERITY significantly better than Kucher (p<0.001)

Proportion of patients with VTE vs. risk score
VERITY risk score Kucher risk score
Strong positive correlation between an increasing risk score and the percentage of VTE-positive cases in the development cohort (P<0.001 by χ2 test for trend).

Validation cohort: ROC curves for risk score prediction of VTE
Kucher (––)c statistic 0.58795% CI 0.542–0.632 VERITY (- - -)c statistic 0.678 95% CI 0.635–0.721
VERITY c statistic no different from development cohort (p=NS)

Conclusions
• The c statistic for this VERITY risk model (0.72) indicates a good test for likelihood of VTE diagnosis
• This VERITY risk model was superior to Kucher for predicting the likelihood of a diagnosis of VTE in a cohort in whom the diagnosis was suspected
• This risk model was validated in an independent VTE database
• A prospective study is required to determine clinical value as a risk prediction tool for VTE at the time of hospital admission to assist in assessing prophylaxis needs