desap - united nations g0-leg... · it in together with the team responsible for the different...
TRANSCRIPT

EUROPEAN COMMISSION EUROSTAT
DESAP
The EuropeanSelf Assessment Checklist
for Survey Managers
Name of the survey: Name of the Survey Manager:
Date:


Self Assessment Checklist for Survey Managers 1
Guidelines for the Use of the Checklist
What is DESAP?
DESAP is the generic checklist for a systematic quality assessment of surveys in the European
Statistical System (ESS). It has been designed as a tool for survey managers and should support
them in assessing the quality of their statistics and considering improvement measures. During its
development, the checklist has been tested in a pilot study covering a large variety of survey areas. It
is fully compliant with the ESS quality criteria and comprises the main aspects relevant to the quality
of statistical data. The checklist is generic in the sense that it applies to all individual statistics
collecting micro data, irrespective of the subject matter area and the specific survey methodology.
Who should fill in the Checklist?
The checklist has been designed to be filled in by the survey manager, i. e. the person responsible for
the survey (or the main parts of it) without time consuming preparation. However, depending on the
specific organisation of a statistical agency, it might be useful to involve other experts in the
assessment process (e. g. the methodologist). Another option to carry out the self assessment is to fill
it in together with the team responsible for the different aspects of the survey.
The objectives of DESAP
The DESAP Checklist has been designed in order to fulfil a number of quite different functions. First
of all it is an assessment tool: It should be used to assess the overall quality of a survey and to
compile a quality profile covering the ESS quality components. But this is not all. The checklist also
provides guidance in the consideration of improvement measures and could facilitate a basic
appraisal of the risk of potential quality problems. Additionally it provides a means for simple
comparisons of the level of quality over time and across domains (given that data are stored centrally
in the statistical agency). It could also provide support for resource allocation within statistical offices
or be helpful for the training of new staff. Please consider all potential uses for your survey beforeyou start to complete the checklist.
The structure of DESAP
DESAP is structured in a process-oriented way which means that it goes along with you in thought
through the whole process of a survey from the very early stages until the final steps. In order to
provide a manageable structure, seven main survey processes and 24 elements were defined. These
processes and elements please are shown on page 4.

Self Assessment Checklist for Survey Managers 2
Processes and process elements of DESAP
II. Survey design
→→→→ Survey concepts 10→→→→ Sample design (for sample surveys only) 12→→→→ Development and testing of the measurement instruments 15
III. Data collection
→→→→ Reducing non–response 25
→→→→ Data sources 18→→→→ Interviewer deployment and training 23
→→→→ Fieldwork 27
IV. Data capture and data processing
→→→→ Data capture 30→→→→ Editing procedures 31→→→→ Imputation procedures 34
V. Data Analysis and output quality
VI. Documentation and Dissemination
→→→→ Coherence 44
→→→→ Relevance 38→→→→ Accuracy 39→→→→ Timelines and Punctuality 42
→→→→ Data analysis 44
→→→→ Comparability 43
→→→→ Disclosure control 45
→→→→ Dissemination strategies 50→→→→ Metadata documentation 47
→→→→ Data management 51
VII. Improvement cycle
→→→→ Adaptability / flexibility 52→→→→ Expertise in relevant areas 53→→→→ Quality management 53
I. Decision to undertake a survey
→→→→ Analysis of user needs 7→→→→ Survey objectives 9

Self Assessment Checklist for Survey Managers 3
How to use the checklist
Please start to complete the checklist at page 7 with the first section and go through the checklist stepby step. The survey manager can either answer the questions on his or her own or could gothrough the checklist with the team responsible for the respective survey. Alternatively he or shecould hand out copies of the checklist to the colleagues so that everyone completes it on his or herown before discussing the results in the team. Furthermore, depending on the organisational structureof your survey, you might want to contact experts from other departments of your organisations forparticular questions, e. g. a mathematical statistician concerning the questions about sampling designor the measures of accuracy.
The checklist aims to meet its objectives (mentioned before) by different types of questions. First of allthere are the assessment questions. You will recognise them by a deep blue background and adark blue bar at the side. They can be summarised to provide you with a graphical feedback bydrawing the diagram on page 5. Detailed instructions for drawing the diagram are on page 4.
If you want to complete the checklist periodically, e. g. to achieve comparisons of the quality level ofyour survey over time you might not always want to go through the whole list but concentrate only onthe assessment questions. In this case please note that the assessment questions are availableseparately in a condensed version. It is, however, recommended to go through the entire checklist,especially if you are carrying out the self assessment for the first time.
There are many other questions with numerous response categories (“improvementquestions”) which sum up to an inventory for (data) quality assurance measures in NSIs. Generallythe response categories should make the process of completing the checklist less time consuming foryou because you just can tick the item(s) that apply to your survey. However, regarding the differentalternatives might give you some ideas of possible improvements for the survey production process.
In order to get a suitable documentation of the assessment ideas collected, it is recommended towrite down all your ideas, possible methodological changes etc. already whilst you are going throughthe checklist. There is some space provided on page 6 where you can note down and thus gatheryour ideas. This page can be ripped out so that you can have it next to you while completing thechecklist.
Finally there are open questions. For some of them no response categories could be given.However some of them aim to confront you with pertaining questions which might be useful for thedevelopment of improvement ideas (e. g. “What are the key unmet user needs in priority order?”).
The glossary
While completing the checklist you might encounter some technical terms you are not familiar with. Insuch cases the glossary at the end of the checklist should provide you with explanations. Based onthe standard glossary of the Eurostat Working Group “Assessment of quality in statistics” {doc.Eurostat/ A4/ Quality/ 03/ General/ Glossary} it was adjusted to the DESAP checklist.

Self Assessment Checklist for Survey Managers 4
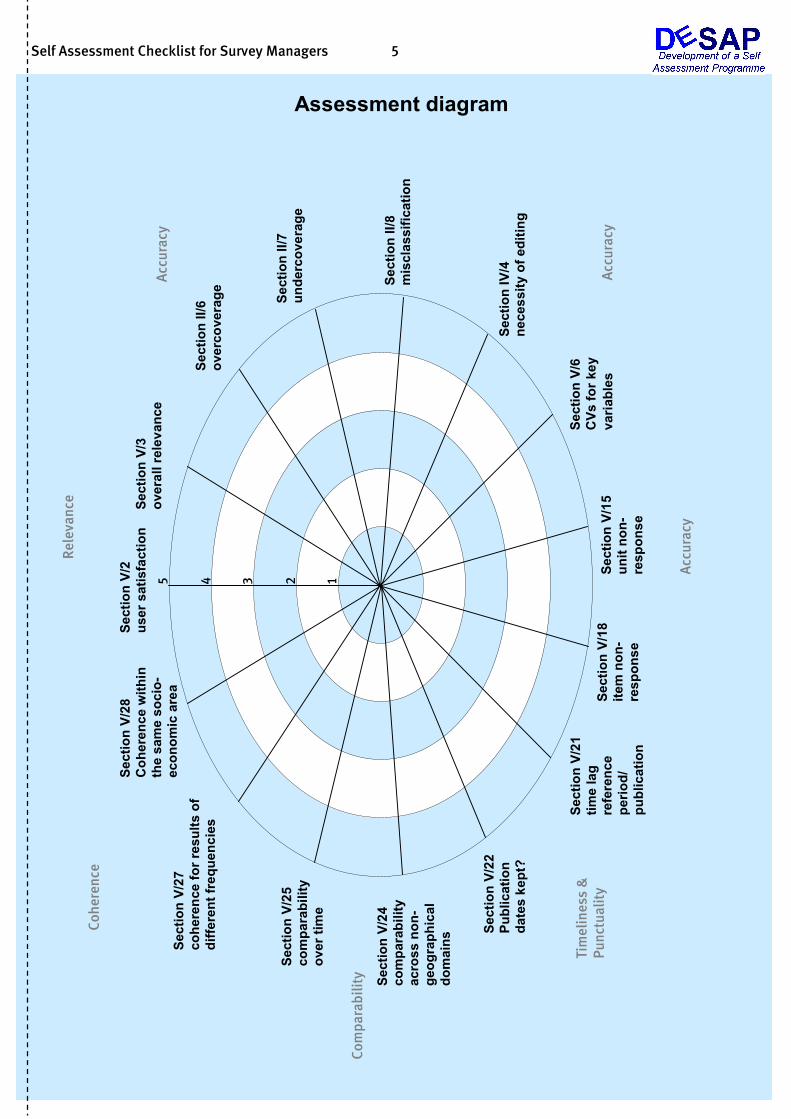
How to draw the assessment diagram (on page 5):
1. Rip out page 5 and put it next to you when answering the checklist.
2. When you come to an assessment question (they are marked by a deep blue background and adark blue bar at the side) copy your answer into the diagram.
3. The answers of the assessment questions are numbered and you find equivalent numbers in thediagram.
4. Make a cross in the diagram at the number according to your answer of the respective questions(see example below). If a question is not relevant for your survey, please just skip the respectiveitem in the diagram.
5. When you have completed all assessment questions combine your crosses in the diagram asdone in the example below.
6. The area which comes out by doing so reflects the quality profile of your statistic.
Have fun and many good ideas with the checklist!
Self Assessment Checklist for Survey Managers 5
Assessment diagram
Sect
ion
II/6
over
cove
rage Se
ctio
n II/
7un
derc
over
age
Sect
ion
II/8
mis
clas
sific
atio
n
Sect
ion
IV/4
nece
ssity
of e
ditin
g
Sect
ion
V/6
CVs
for k
eyva
riabl
es
A
ccur
acy
Sect
ion
V/15
unit
non-
resp
onse
Acc
urac
y
Sect
ion
V/21
time
lag
refe
renc
epe
riod/
publ
icat
ion
Sect
ion
V/25
com
para
bilit
yov
er ti
me
Sect
ion
V/18
item
non
-re
spon
se
Sect
ion
V/27
cohe
renc
e fo
r res
ults
of
diffe
rent
freq
uenc
ies
Sect
ion
V/24
com
para
bilit
yac
ross
non
-ge
ogra
phic
aldo
mai
ns
Sect
ion
V/28
Coh
eren
ce w
ithin
the
sam
e so
cio-
econ
omic
are
a
Sect
ion
V/2
user
sat
isfa
ctio
nSe
ctio
n V/
3ov
eral
l rel
evan
ce
Sect
ion
V/22
Publ
icat
ion
date
s ke
pt?
1234
Rel
evan
ce
Acc
urac
y
Com
para
bilit
y
Tim
elin
ess
&Pu
nctu
alit
y
Cohe
renc
e
5
Self Assessment Checklist for Survey Managers 6
Notes for improvement ideas:This space is thought to be used for noting down any improvement ideas for your statistic that you mighthave got while completing the checklist. If you have ripped the page out you can have it next to you whilecompleting the checklist and you are able to gather your ideas on this page instead of noting them downin the checklist. For instance, this might be helpful if you wish to go back and look at them again.
SectionI
SectionII
SectionIII
SectionIV
SectionV
SectionVI
SectionVII
Self Assessment Checklist for Survey Managers 7
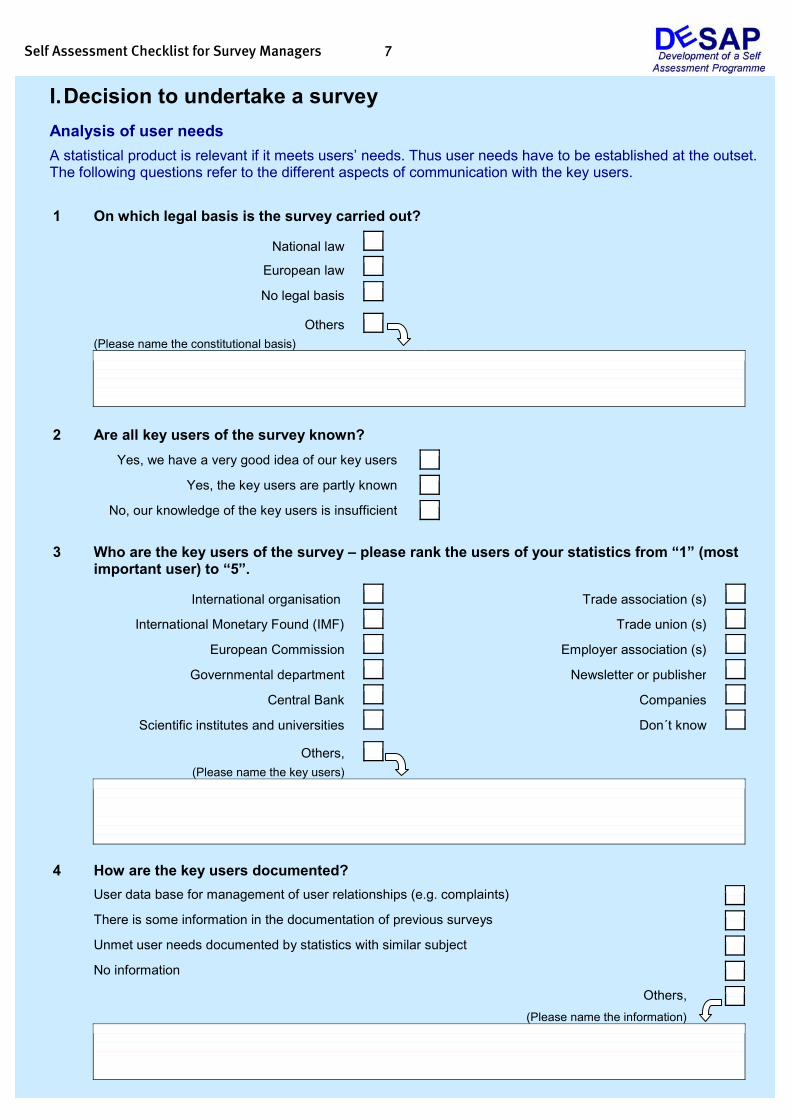
I.Decision to undertake a surveyAnalysis of user needsA statistical product is relevant if it meets users’ needs. Thus user needs have to be established at the outset.The following questions refer to the different aspects of communication with the key users.
1 On which legal basis is the survey carried out?
National law
European law
No legal basis
Others(Please name the constitutional basis)
2 Are all key users of the survey known?
Yes, we have a very good idea of our key users
Yes, the key users are partly known
No, our knowledge of the key users is insufficient
3 Who are the key users of the survey – please rank the users of your statistics from “1” (mostimportant user) to “5”.
International organisation Trade association (s)
International Monetary Found (IMF) Trade union (s)
European Commission Employer association (s)
Governmental department Newsletter or publisher
Central Bank Companies
Scientific institutes and universities Don´t know
Others,(Please name the key users)
4 How are the key users documented? User data base for management of user relationships (e.g. complaints)
There is some information in the documentation of previous surveys
Unmet user needs documented by statistics with similar subject
No information
Others,(Please name the information)

Self Assessment Checklist for Survey Managers 8
5 Which of the following procedures are in place for user consultation?
Relevant governmental departments are involved in the planning process
Producer-user groups (e.g. sub-committees of statistical councils), discussing subject specific questions
Scientific board/ council
Customer survey exploring the needs of a larger group of users
Formalised agreements (e.g. service level agreements) with priority key user(s)
Available marketing concepts which mention the use of statistical information
Co-operation with partners in social- and economic sciences as well as market research
Informal contacts with relevant users
Others,(Please name the procedures)
6 Which of the following measures are undertaken in order to anticipate future user needs? Programme planning in a statistical council or a subcommittee of a statistical council
Bilateral committees with government departments
Access to the policy agenda of the government or to cabinet documents
Bilateral committees with states/ regional governments in case of federal countries
Attendance of agency staff at conferences of user organisations
Bilateral meetings or workshops with other user groups
User enquiries that could not be satisfied yet
Publication review
No measures in place
Don´t know
Others,(Please name the measures)

Self Assessment Checklist for Survey Managers 9
7 What are the known key unmet user needs in priority order?Don´t know
8 Which plans are in place to react to the key unmet user needs?
Survey objectives
Before the actual planning phase, it is vital to constitute a basis for specifying the contents, the characteristics,the fundamental definitions and classifications of the survey. In creating this basis it is highly important toclearly formulate the objectives of the survey in question.
9 Are the survey objectives set out in a written form?
Yes
No
Place for comments concerning the questions of process I “Decision to undertake a survey”

Self Assessment Checklist for Survey Managers 10
II.Survey design -Basis of quality assurance for all stages of collection and processing
Survey conceptsA careful selection and design of the survey concepts is particularly important to assure conceptualcomparability, coherence and timeliness. The following questions reflect the main aspects to be clarified at thebeginning of the planning phase.
1 Are there any official or non-official surveys to which your survey can be compared to?
Yes
No Then go to question 3
2 Are there any official or non-official surveys from which quality improving measures could beadopted?
No
Yes(Please name the surveys)
3 Which standard frameworks, concepts, definitions and classifications are used?International standards
National standards
Survey specific concepts
4 Are there any standard classifications the survey is not compliant with?
No
Yes(Please state)
5 Is the frame a common sampling frame employed in comparable surveys?Yes
No
A common frame does exist but is not used

Self Assessment Checklist for Survey Managers 11
6 How do you appraise the problem of overcoverage?
1 - Major overcoverage: An unacceptably high number of units not belonging to the target populationwere included in the frame; or the overcoverage rate not known
2 - Considerable overcoverage: Many units not belonging to the target population were included in theframe
3 - Some overcoverage: Some units not belonging to the target population were included in the frame
4 - Slight overcoverage: Few units not belonging to the target population were included in the frame5 - Nearly no overcoverage: There is only a very small difference between the frame and the target
population
7 How do you appraise the problem of undercoverage?
1 - Major undercoverage: An unacceptably high number of units belonging to the target populationwere not included in the frame; or the undercoverage rate not known
2 - Considerable undercoverage: Many units belonging to the target population were not included inthe frame
3 - Some undercoverage: Some units belonging to the target population were not included in the frame
4 - Slight undercoverage: Few units belonging to the target population were not included in the frame5 - Nearly no undercoverage: There is only a very small difference between the frame and the target
population
8 Are there any problems with misclassification of statistical units?
1 - There are is a large number of misclassifications
2 - There is a considerable number of misclassification
3 - There are some misclassifications
4 - There is a slight problem with the number of misclassifications
5 - There are nearly no misclassifications
9 How long is the time gap between the reference period to the last update of the samplingframe?
3 months or less
6 months or less
9 months or less
12 months or less
More than a year and less than three years
More than three years

Self Assessment Checklist for Survey Managers 12
10 Would the problems of under- or overcoverage be less if the time gap between the referenceperiod to the last update of the frame was shorter?
Yes
No
11 Did you make sure that the frame is as close to the target population as possible byassessing the coverage via...?Matching the frame with comparable alternative sources for the target population
Analysing survey returns for duplicates, deaths, out-of-scope units and changes in characteristics
Using specific questions on the questionnaire to aid in monitoring coverage
Verifying with local authorities (e.g. regional offices, field survey staff, the survey units themselves)
Verifying the frame of subsets of it in the field (which could include verification of out-of-scope units)
Comparing the frame with sample units from a corresponding area frame
Updating the frame to determine the changes which occur during a certain time period
Checking the consistency of counts with other sources or with data from specially designed replicates
Using evaluative information obtained from other surveys with the same frame
Contact with the people in charge of the administrative data when coverage changes are outside yourcontrolMap checks for area frames to ensure clear and non-overlapping delineation of the geographic areasused in the sampling design
No monitoring
Others,(Please name the method(s))
Please answer the following part “ Sample design ” only if your survey is a sample survey. Otherwiseplease go to the end of page 14.
Sample design (for sample surveys only)
The maximal or required level of accuracy depends to a great extent on the sample design and therefore thesample design should be considered very carefully.
12 For your survey, is a common technique of the National Statistical Institute (NSI) chosen forsampling?
Yes
No
13 Is the sample size optimised with regard to accuracy and cost?
Yes
No
Self Assessment Checklist for Survey Managers 13
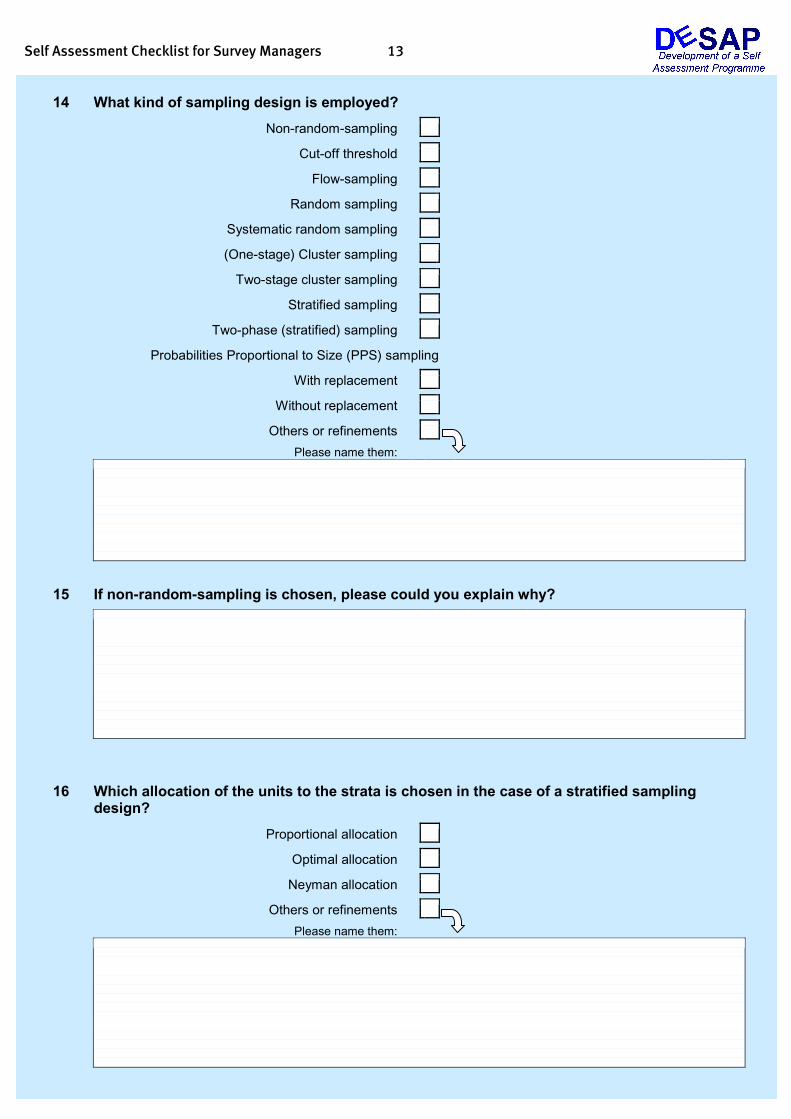
14 What kind of sampling design is employed?Non-random-sampling
Cut-off threshold
Flow-sampling
Random sampling
Systematic random sampling
(One-stage) Cluster sampling
Two-stage cluster sampling
Stratified sampling
Two-phase (stratified) sampling
Probabilities Proportional to Size (PPS) sampling
With replacement
Without replacement
Others or refinementsPlease name them:
15 If non-random-sampling is chosen, please could you explain why?
16 Which allocation of the units to the strata is chosen in the case of a stratified samplingdesign?
Proportional allocation
Optimal allocation
Neyman allocation
Others or refinementsPlease name them:

Self Assessment Checklist for Survey Managers 14
17 Do you use a rotation scheme to minimise the response burden?
Yes
No
18 What kind of software is used for sampling/ determining the sample size?
A Tailor-made system
A generalised sample selection software or sampling procedure, please state the software:
19 Are there any differences between the target and achieved sample size?No, there are no differences
Yes, the achieved sample size is bigger than the target size
Yes, the achieved sample is ≤ 5% smaller than the target size
Yes, the achieved sample is > 5% smaller than the target size
20 Is substitution allowed in the case of missing units?
Yes
Yes, however only in defined limits
No
21 Considering all topics so far, how do you appraise the efficiency of the survey designfor this survey?Efficient
Very satisfactory for the budget (and time) given, only minor improvements could be made
Satisfactory for the budget (and time) given, but improvements should be made
Inadequate
Highly deficient
22 From a purely methodological point of view, would you recommend changesin the survey design?Yes, it should urgently be considered
It might be appropriate but should be subject to further testing
No
Please answer the following part “Development and testing of the measurement instruments” only ifyour survey is questionnaire based. Otherwise go to section III.

Self Assessment Checklist for Survey Managers 15
Development and testing of the measurement instruments
Well developed measurement instruments minimise measurement errors and optimise the relation to therespondents. The following questions focus on the main aspects concerning the quality of thequestionnaire or interview.
23 Which of the following measures are in place for the questionnaire design?Questions or question batteries that have been used before but have not been previously tested
Harmonised questions or question batteries that have been previously tested
Standardised drafts for the layout
Standard software for programming an electronic questionnaire for computer assisted interviews
An internal specialised questionnaire appointee of the institute who gives advice and checks the questionnaire
A questionnaire expert external to the NSI who gives advice and checks the questionnaire
The questionnaire is provided by Eurostat
24 How do you appraise the response burden considering the length for responding orcompletion?It is easily done within 20 Minutes
It can be done within 45 Minutes
It takes longer than 45 Minutes
Longitudinal or panel surveys:Introduction interview:
It is easily done within 20 Minutes
It can be done within 45 Minutes
It takes longer than 45 Minutes
Following interviews / completions of questionnaires or diaries:
Easily done within 20 Minutes
Can be done within 45 Minutes
Take longer than 45 Minutes
25 How do you appraise the response burden of the questionnaire or interview concerning thecompilation of information needed?Low response burden, the information can be provided easily
Moderate response burden, some information needs to be retrieved
Demanding response burden, the information required needs complicated retrieval
26 How do you appraise the response burden of the questionnaire or interview consideringsensitive questions?Low response burden, all questions can be answered easily
Moderate response burden, there are some sensitive questions
Demanding response burden, there are many or very sensitive questions

Self Assessment Checklist for Survey Managers 16
27 Items determining the quality of the questionnaire design include the ones listed below.Please tick the ones that apply to your surveyAttractive design appearing professional and businesslike
In the introduction, the title or subject of the survey, the identification of the sponsor, the explanation of the purpose of the survey, the request of the respondent’s co-operation, information about the conduct-
cing authority and confidentiality protection are provided
There are titles or headings for the separate sections
Graphic additives like colour use, shading, illustrations, symbols or bold writing are employed in an optimal way to indicate where the respondents should answer or to direct their attention
The opening questions are applicable to all respondents and/ or easy to answer
Words and concepts are always consistently used
Each question is adequately justifiable
Questions follow the respondents’ logic
The order of the questions does warrant an optimal direction through the filters
Time reference periods and units of response are always clear
On the last page there is space for additional comments by respondents
On the last page there is an expression of appreciation to the respondent
Instructions and additional guidance
A free phone number for contact in the case of questions
28 Given these requirements, how would you assess the quality of the questionnaire used forthe survey in question?The questionnaire meets all of these requirements and no improvements are necessary
The questionnaire meets most of these items and can be considered sufficient although some itemscould be improved
A view items of the questionnaire should be improved
The questionnaire needs to be improved urgently because most of these items are failed
29 Who has tested the questionnaire?Testing was undertaken internally
Testing was undertaken by the responsible committee of the NSI
The internal survey laboratory
An external survey laboratory has been consulted for the pretest
The questionnaire was tested by external experts

Self Assessment Checklist for Survey Managers 17
30 Which methods for questionnaire testing have been used to assess the questionnaires’response burden in terms of length, requirements and its (graphic) design?Pretesting of the questionnaire with a small sample
Debriefing sessions with interviewers following a pretest
Qualitative testing of respondent behaviour/ understanding of the questions
Focus groups interviews
In-depth interviews
Think-aloud interviews
Paraphrasing
Behaviour coding
Split sample testing
Others,(Please name the method(s))
Place for comments concerning the questions of process II “Survey design”

Self Assessment Checklist for Survey Managers 18
III. Data collection
Data sourcesDifferent ways of obtaining data should be considered in order to get the most accurate data available. Surveymanagers should chose a data collection method which reduces measurement errors and response burdenand which helps to minimise the expenses.
1 On which basis did you decide on the data collection technique used in your survey?Testing
Literature review
Legal requirements
Available capacity
Consistency with former surveys
Others(Please name the basis of your decision)
2 Which kind of data collection technique is used in your survey?Interviewer–administrated survey
Face-to-face: Electronic questionnaire (CAPI)
Paper questionnaire (PAPI) Please go to question 28
Telephone: Electronic questionnaire (CATI) Please go to question 24
Self-administrated surveyWeb questionnaire
Electronic questionnaire (CASI) Please go to question 17
Paper questionnaire or diary
Administrative data or registers Please go to question 4
Mixed mode (in this case please tick as many items from above as necessary, goto the respective questions and answer question 3)
Others(Please name the technique(s))

Self Assessment Checklist for Survey Managers 19
Mixed mode surveys3 Did you assess the measurement effects due to different data collection modes?
Yes, they are fully assessed
Yes, they are sufficiently assessed
They are assessed, however it could be improved
No they are not assessed at all
Administrative data or registers
4 Where are the data you use maintained?In your unit
In an other unit in your organisation
In an other unit outside your organisation
5 Are you able to assess the quality of the data yourself?
Yes please go to question 8
No
6 Do you have external quality assessment available?
Yes
Partly
No(Please specify which information would be needed)
7 Do you have sufficient information on the quality of the data?
Yes
No
8 Do you need to link the data with other data?
Yes
No please go to question 12

Self Assessment Checklist for Survey Managers 20
9 Which kind of record linking methods are used?Direct matching (Deterministic or Probabilistic)
Statistical matching
Others, please state:
10 Do you evaluate the success rate of the linkage?
Yes
No please go to question 12
11 How do you assess the success rate of the linkage?Nearly error free
Satisfactory
Acceptable but to be improved
Not acceptable
12 If you use different data sources, are there problems with....?coverage
classifications
definitions
Updates and timeliness
Units which are duplicates or multiple units
13 How do you assess the security aspects during the data collection/ exchange?Satisfactory
Acceptable but to be improved
Not acceptable
14 Are you able to identify units which are duplicates or multiple units?
Yes
No please go to question 16

Self Assessment Checklist for Survey Managers 21
15 If you are able to identify units which are duplicates or multiple units, do you take care ofthem before sampling?
Yes
No
16 Are you able to ensure efficient use of registers and administrative data in your survey?
No
Yes(Please specify how)
please go to question 50 (unless mixed mode survey)
Self administrated surveys
17 How do you appraise the instructions or guidance of the questionnaire?Excellent
Good
Sufficient
Needs some improvements
Inadequate
18 Do you provide a free phone number for contact in the case that the respondents havequestions?
Yes
No
19 Do you have an organised contact team to deal with incoming questions?
Yes
No
20 Is your survey computer assisted?
Yes
No please go to question 45 (unless mixed mode survey)

Self Assessment Checklist for Survey Managers 22
21 Have you implemented any consistency check in the questionnaire?
Yes
No
22 Are there any modules implemented to prevent item non-response?
Yes
No
23 Do you use computer assisted coding?
Yes
No
please go to question 45 (unless mixed mode survey)
Computer Assisted Telephone Interviews (CATI)
24 Where is the telephone field work accomplished? (multiple choice possible)Inhouse
In a call centre
Out-sourced
Interviewers are allowed to work from home
25 Is there any call schedule programme implemented for the field work?
Yes
No
26 Do you conduct any statistics on the contacts?
Yes
No
27 Which method is used for the selection of the phone numbers?Selection directly from the frame
From previous data collection
Random digit dialling
Other source(Please name the selection method)

Self Assessment Checklist for Survey Managers 23
Interviewer deployment and trainingThe way an interview is conducted influences the relation to the respondent(s) to a large extent. To optimisethis relation and to minimise the measurement error, care should be taken how to deploy and train theinterviewers.
28 Is there a special recruiting procedure for interviewers?Yes, the interviewers are specially selected for CAPI, PAPI or CATI
Yes, there is a list of personal requirements the interviewer should have
Yes, there is a list of minimum qualifications the interviewer should have
No, there are no binding minimum qualifications
29 How are the interviewers prepared?They get an intensive training which consists of different training phases, at minimum a preparatorytraining (for example communication), a special course of instruction and they are provided with a wellorganised interviewer manual
They are adequately trained within one session and they are provided with some interviewer material
The interviewers get a special training in refusal conversion techniques and how to motivate people toparticipate in surveys
They do get some training and/ or a interviewer manual, but they are not really sufficiently prepared
Others(Please state)
30 Do the interviewers get a bonus for each successfully accomplished interview?
Yes
No
31 How is the interviewer deployment organised?Central
Not central
32 Is there any support for interviewers?
Yes, every group of interviewers has a specially trained support and contact person
Yes, there are regular meetings
Yes, support is provided on demand of the interviewer
No, there is no support for the interviewers
Self Assessment Checklist for Survey Managers 24
33 Is there any means of control for the interviewers?
Yes, the interviewers get special feed–back periodically
Yes, the newly recruited interviewers are generally checked during their first couple of missions
Yes, there are special controls in case of suspicious factsYes, there are accomplishment controls concerning the failures, the compliance of the deadlines and theexhaustion
Yes, there are routine accomplishment controls of % of the interviews
Yes, there are basic controls of the compliance of the sample instructions, the sample persons and/ orthe prescribed way of completing the questionnaire
No, there are no means of control for the interviewers
Others(Please state which other control is used)
34 Is the interview announced to the household in advance via mail, e–mail or telephone?
Yes
No
35 How many interviews are conducted by one interviewer on average?
36 What is the maximum number of interviews conducted by one interviewer?
37 Do you have any demographic information about the interviewers?
Yes
No
38 Are there any analyses about the possible influence of the interviewers’ demographicattributes and the response pattern of the target groups?Yes, the interviewers’ demographic attributes do have a significant influence on the participationbehaviour
Yes, the interviewers’ demographic attributes do have a slight influence on the participation behaviour
Yes, the interviewers’ demographic attributes have no influence on the participation behaviour
No, there is no such information

Self Assessment Checklist for Survey Managers 25
39 Is there any information about the timing of the interviews?
Yes
No
40 What kind of time information do you have?
The month
The week–day
The calendar day
The rough time, like forenoon, afternoon, evening
The exact time
Others(Please name the kind of information)
41 Is your survey computer assisted?
Yes
No please go to question 45
42 Have you any consistency check implemented in the questionnaire?
Yes
No
43 Are there any modules implemented to prevent item non-response?
Yes
No
44 Do you use computer assisted coding?
Yes
No

Self Assessment Checklist for Survey Managers 26
Reducing non–responseThe reduction of non–response is crucial to avoid the reduction of sample size and to minimise the bias.
45 Which procedures are taken in order to prevent non–response, i.e. to encourage response?
There is one follow–up cycle after days
There are two or more follow–up cycles after days
The follow–up activities are prioritised in a way that large influential units are preferentially treated in thecase of business studies or similar surveys
The follow–up activities are prioritised in a way that units in domains with high potential for non–response bias are preferentially treated
A standard procedure and infrastructure for the resolution of the respondents’ queries is established
The response process is designed according to monitoring results of a previous survey
Others
(Please state)
46 Are any pre–programmed plausibility checking systems integrated for computer assistedinterviews (CAPI, CATI or CASI)?
Yes
Partly
No
47 If the respondents or data suppliers have the option to chose between a computer assistedand an other (conventional) method, how many percent chose the computer assistedmethod?
Not known
48 If computer assisted methods with integrated pre–programmed plausibility checking systemsare employed, is there any additional checking in the office necessary?
No, no additional checking is necessary because the data are (nearly) error free
Although there are some errors, additional checking is not necessary
Additional checking is needed to correct a couple of errors
Additional checking is indispensable to correct the data
and

Self Assessment Checklist for Survey Managers 27
49 Are the respondents re–contacted (e.g. via telephone) in the case that an answer is notplausible?
Yes
No
FieldworkPlanning the fieldwork is important in order to realise the data collection at minimal expenses and to choose the optimal time period.
50 If you use survey data, did you check if you could use already available data sets likeadministrative records in the future?
Yes
No
51 To what extent do legal aspects restrict the use of administrative data or registers?
Not at all
Somehow, but they can still be used
Very much
Completely prohibited in the survey area
52 Is the complete reference period covered by the fieldwork period?
Yes
No
53 How long does the period of fieldwork take?
54 Does the collection period cover any holidays or unpredictable events (e.g. a strike) whichmight influence the survey results?No, there was no such influence
Yes, there are weeks of holidays during the collection period
Yes, there was a during the collection period
55 What is the ratio of people in supervisory positions to the people accomplishing thefieldwork?

Self Assessment Checklist for Survey Managers 28
56 What kind of arrangements do you have organised for potential problems that might ariseduring the progress of the survey?
There are supervisors that can be contacted immediately
Continuous monitoring by the supervisors
There are feedback reports containing information about frequencies and causes of errors for
managers
subject matter specialists
methodologists
The participants opinion is taken
There are sample control procedures for all data collection operations which track the status of sampledunits from the beginning through the completion of data collection
Others(Please state)
57 In case of establishment surveys: Did you make sure that
the appropriate person within the organisation is contacted
at the appropriate time for the information to be easily available
the respondents are allowed to provide the data using a method and format that is convenient for them?
58 How do you assess the process of handling incoming data?
Best practice
Satisfactory
Acceptable but to be improved
Not acceptable
59 How do you ensure data protection of incoming and outgoing microdata?Encryption of electronic files
Exclusion of identification information on incoming paper questionnaires
Others(Please state)

Self Assessment Checklist for Survey Managers 29
Place for comments concerning the questions of process III “Data collection”

Self Assessment Checklist for Survey Managers 30
IV. Data capture and data processing
Data captureConverting the original data into a computer-readable format and coding them are processes susceptible toerrors. Therefore different methods need to be regarded to minimise them.
1 How are the data captured?
Manually
ElectronicallyMark character recognition (MCR)
Intelligent character recognition (ICR)
Optical character recognition (OCR)
Voice recognition entry (VRE)
Electronic data interchange (EDI)
During their collection (Computer Assisted Interviewing)
Others(Please state)
2 How are the data coded?Manually
Automatically by specially designed software
Others(Please state)
3 If the data are manually coded, are there any means of control or consistency checks of thecodes?No
YesDependent verification
Independent verification

Self Assessment Checklist for Survey Managers 31
Editing proceduresEditing procedures should be employed to identify missing, invalid, inconsistent entries and to indicatepotentially erroneous data. Here editing simply means the identification of the potentially erroneous data.
4 How do you appraise the necessity of editing the raw data?1 - A lot of errors were discovered in the original data material and checking is indispensable
2 - Few errors were discovered in the original data material which need to be corrected
3 - Few errors were discovered in the original data material; however they need not be corrected4 - The raw data have already been sufficiently checked during the collection process by integrated pre–programmed plausibility checking systems
5 - As far as possible the raw data material is error free and no data editing is necessaryPlease go to question 20
5 Is the chosen editing methodautomated or
manual or
a combination of both?
6 Does the chosen editing method rely
solely on data available for the non–respondent and/ or other auxiliary data
solely on the observed data of other responding units for the given survey
on a mixture of data available for the non–respondent, other auxiliary data and observed data of otherresponding units for the given survey
Others,(Please state)
7 Do you pretest your editing procedures?
Yes
No

Self Assessment Checklist for Survey Managers 32
8 Which of the following editing procedures are applied to the raw data? (Please tick as manyitems as necessary)A value range check for every variable
Logical editing (based on logical relationships)
Statistical tests of procedures, e.g. outlier analysis techniques
Combination of logical and statistical editing
Comparisons with data from previous collections of the same statistics or from other sources
Empirical procedures
Others(Please state)
9 Are the persons in charge of manual editing provided with written, clear and detailedinstructions?
Yes, they have accurate and up-to date instructions
Yes, however the instructions are only partly concise
No
10 Is there a distinction between the concepts of missing values, zero values and impossibleinformation?
Yes
No
11 Did you organise your editing procedures by priority?No
Yes, severe errors are generally edited manually and more effort is spent on these while less attention ispaid to the minor errors that are mostly edited automatically
Yes, priority is given to the correction of variables used as identifiers (if the survey data are to bemerged with auxiliary data for weight constructions and/ or estimation purposes)
Yes, others(Please state)

Self Assessment Checklist for Survey Managers 33
12 Are there any measures taken in order to avoid over–editing and introduction of new errorsinto the data?
Yes, there is an error recognising mechanism assessing the influence of the corrections on the finalresult thus allowing to determine an “optimum of editing”
Yes, edits were reapplied to units to which corrections were made
No measures were taken in order to avoid over–editing
Yes, others(Please state)
13 Could the editing procedures be conducted continuously, for example getting started when apart of the data are available?
Yes
No
14 Are there any error statistics available from previous surveys that you can built upon toimprove your editing procedures?
Yes
No
15 Do you calculate any error statistics as a quality measure of the survey in question and tosuggest improvements for future surveys?
Yes
No
16 How do you appraise the flexibility of your data editing system?Very flexible – a new or modified procedure can be incorporated easily
Sufficient flexible – a new or modified procedure can be incorporated without major problems
Not flexible – incorporating a new or modified procedure is time consuming and expensive
Others(Please state)

Self Assessment Checklist for Survey Managers 34
17 Do you have any information about the source(s) of error?
No, the sources of error are not knownYes, the sources of error are partly known, they are
Measurement errors
Coding errors
Others(Please state)
Yes, the sources of error are known, they are
Measurement errors
Coding errors
Others(Please state)
Imputation proceduresImputation procedures should be used to correct erroneous and replace missing data while preserving thecourse of the underlying distributions
18 How do you correct the errors detected by the editing procedure? If you employ severalmethods please indicate how many errors (in percent) are corrected how.Interviewers or respondents are re-contacted %The erroneous variable is suppressed %The erroneous or missing variable is replaced with a more suitable value %The erroneous or missing variable is replaced with a imputed value %Don't know %
Others %(Please state)
19 Do you impute any values for your statistic
Yes
No please go to section V.

Self Assessment Checklist for Survey Managers 35
20 Is the chosen imputation methodautomated or
manual or
a combination of both?
21 Does the chosen imputation method relysolely on data available for the non–respondent and/ or other auxiliary data (logical and historical)?
on a mixture of data available for the non–respondent, other auxiliary data and observed data of otherresponding units for the given survey?
solely on the observed data of other responding units for the given survey?
Others(Please state)
22 Is the chosen imputation method anautogenerative (e.g. calculating the mean) or
a predictive (e.g. calculating a regression) one?
23 Which of the following imputation methods are chosen for the survey?
A deterministic one:
Logical imputation
Historical imputation
Mean imputation
Ratio and regression imputation
Nearest–neighbour imputation
A stochastic one:
Hot deck method
Regression with random residuals
Methods of artificial intelligence, e.g. neural networks
Any other deterministic method with random residuals added
24 Do you use asingle (the missing value is replaced with one imputed value) or
a multiple (several values are used) imputation method?

Self Assessment Checklist for Survey Managers 36
25 Do you employ a generalised system to implement the algorithms?
Yes, the is employed for all imputations
Yes, the is employed for most imputations
Yes, the is employed for some imputations
No generalised system is employed
26 If several methods and/ or donors could have been applied, have they (their results) beenevaluated against each other to assess the best method?
Yes
Partly
No
27 Is the imputation internally consistent and plausible in the sense that the relationshipsbetween the variables and the underlying distributions are preserved?
Yes
No
Don't know
28 Are the imputed values flagged?
Yes
No
29 Are the original values retained?
Yes
No
30 Which percentage of the records from the raw material has been imputed?
% of the records have been imputed
31 Has it actually been assessed if the imputation process does limit the bias caused by nothaving observed all the desired values?
Yes
No

Self Assessment Checklist for Survey Managers 37
32 Have you made efforts to measure the variance introduced by imputation?Yes, the variance introduced byimputation has the following value
as analysed by the following technique:
Yes, several techniques are tested but it is not possible to measure the variance introduced by imputationbecause:
No efforts are made to measure the variance introduced by imputation because:
33 Are the available software packages or procedures flexible enough allowing to easily makeadjustments during the imputation process?
Yes
Partly
No
Place for comments concerning the questions of process IV “Data capture and data processing”

Self Assessment Checklist for Survey Managers 38
V. Data Analysis and output quality –Data quality assessment
Each statistical agency needs to evaluate data quality. Although the basic conditions and targets for thequality dimensions were set already during the design phase (compare to II) the data need to be treated andassessed with respect to the ESS quality dimensions relevance, accuracy, timeliness, accessibility and clarity,comparability and coherence and after their collection and processing. This section contains the main part ofthe questions aiming at an assessment of data quality as well as a number of questions relating to furtheraspects of data analysis.
RelevanceRelevance is the degree to which statistics meet current and potential users’ needs. It refers to whether allstatistics that are needed are produced and the extent to which concepts used (definitions, classifications etc.)reflects user needs.
1 Do you use one of the following means to measure user satisfaction for your survey?Regular specific user satisfaction survey
Systematic assessment of user feedback
Feedback in the context of regular user consultation
Calculation of a user satisfaction index
No measures
Others(Please describe)
2 How do you appraise the information available on user satisfaction of (key) users?
1 – Little information on key users and on other users available
2 – Some information on key users and little information on other users available
3 – Some information on key users and some on other users available
4 – A lot of information on key users and some on other users available
5 – Complete information on key users and other users available
3 How do you appraise the overall relevance of your survey?
1 – The survey is of little relevance
2 – Key areas are relevant to some extent, other areas covered are of little relevance
3 – Key areas and other areas covered are relevant to some extent
4 – Key areas are highly relevant, other areas covered are relevant to some extent
5 – Key areas and other areas covered are both highly relevant
Self Assessment Checklist for Survey Managers 39
AccuracyAccuracy in the general statistical sense denotes the closeness of computations or estimates to the(unknown) exact or true values. Achieving and assessing accuracy is basically done via assessing thesampling and the non–sampling errors which result from coverage errors, measurement errors, processingerrors, model assumption errors and bias due to non–response.
4 Are the following measures of the estimates’ precision provided?Mean Square Error (MSE)
Coefficient of variation or relative standard error
Confidence intervals
Qualitative accuracy statement only
No precision measure is provided
5 If the mean square error is calculated, does it meet the user needs?
No
Yes
6 How do you appraise the coefficients of variation (CVs) for key variables?
1 - CVs are very high for the entire statistics
2 - CVs are high for a lot of items and items and/or in a large part of the subdivisions
3 - CVs are medium both for relevant items and some important subdivisions
4 - CVs are small for most of the relevant items and important classification levels
5 - CVs are small for all key items and all important classification levels
7 Is the level of the CVs acceptable for the purpose of the survey?
Yes
No
Party(Please explain)
8 Is the Horvitz–Thompson estimator (= sample weighting with a weight variable which is equalto the inverse of the inclusion probability of a selected element) constructed for the data setto be analysed?
Yes(Pl
No
9 Was the planned sample size sufficiently large to finally obtain the desired precision?
Yes
No
Self Assessment Checklist for Survey Managers 40
10 Which of the following sources of bias are adjusted for by using auxiliary information in theestimation process (calibration or re–weighting)?Non–response bias
Errors in the sampling frame
Measurement errors
No re–weighting procedure is employed please go to question 12
Other types of errors(Please state)
11 If re–weighting is undertaken, what kind of calibration procedures are used?
Post-Stratification
Regression estimation
Ratio estimation
Others(Please specify)
12 If model-assisted estimation is employed, how did you assure that your auxiliary orbenchmark variables correlate with the variable that is estimated?
13 Do you use a generalised estimation software?
No, tailor-made system
Yes(Please specify)

Self Assessment Checklist for Survey Managers 41
14 Is the correctness of weights established via calculating the sum of the weight variable overthe sample data set?
Yes
No
15 How do you appraise the extent of unit non-response in your survey?
N. B.: Due to the fundamentally different pre–conditions of different survey types, unit non–responseassessment criteria for mandatory surveys, short voluntary surveys and demanding voluntary surveys have tobe distinguished. Please use the following categories of unit non–response for your assessment:
mandatory survey short voluntary survey demanding voluntary survey
< 5 % < 20 % < 40 %low non-response rate
5 % up to 15 % 20 % up to 40 % 40 % up to 60 %medium non-response rate
high non-response rate > 15 % > 40 % 60 %
1 – The rate of unit non–response is not known or unacceptably high
2 – High unit non-response rate
3 – Medium unit non-response rate
4 – Low unit non response-rate
5 – There is nearly no unit non-response
16 Is there – in the process of evaluating the non–response – any breakdown of the non–responsesinto sub–categories (like refusals, not contacted, not at home, not found, incapacity, lostschedule)?
Yes
Partly
No
17 Are there any means to estimate the bias due to unit non–response?
Yes, via linkage with external data sources (e.g. administrative data files)
Yes, through an ad hoc control survey (sub-sample of non-respondents)
Yes, by the help of background information about the non–respondents to be used for comparisons
No, there are no means to determine the bias due to non–response
Other means than listed(Please specify)

Self Assessment Checklist for Survey Managers 42
18 How do you appraise the extent of item non-response in your survey (for key variables)?
1 – The rate of item non–response is not known or unacceptably high (>50%)
2 – There is a lot of item non-response (15% to under 50%)
3 – There is some item non-response (5% to under 15%)
4 – There is little item non-response (<5%)
5 – There is nearly no item non-response
Timeliness and PunctualityFor any statistic it is vital to produce timely results and to keep the time schedule. It is perhaps one of themost important user needs, maybe because it is so obviously linked to an efficient use of the results.Timeliness of information reflects the length of time between its availability and the event or phenomenon itdescribes. Punctuality refers to the time lag between the release date of data and the target date (e. g. datesannounced in an official release calendar, laid down by Regulations or previously agreed among partners).
19 Please indicate the time lag between the end of the reference period and the publication ofthe results in days or months.
20 Please indicate the time lag between the planned publication date and the actual publicationdate in days or months.
21 How do you appraise the time lag between the reference period and the first publication ofthe preliminary or final results?
1 – There is a substantial time lag
2 – There is a larger time lag
3 – There is a certain time lag (within the agreed time schedule)
4 – There is a small time lag
5 – There is a very small time lag
22 Are the planned publication dates for the main publication (e. g. comprehensive tables withresults including web publications) usually kept?
1 – There is frequently a large delay
2 – They are frequently not met with a certain delay
3 – They are mostly kept (> 50% of the publications)
4 – They are usually kept (> 80% of the publications)
5 – They are (nearly) always kept

Self Assessment Checklist for Survey Managers 43
23 Which kind of changes would be necessary to substantially improve timeliness?
Minor internal changes
Major internal changes
Changes involving external partners
Others(Please specify)
ComparabilityComparability aims at measuring the impact of differences in applied statistical concepts and measurementtools/procedures when statistics are compared between geographical areas, non-geographical domains, orover time. We can say it is the extent to which differences between statistics are attributed to differencesbetween the true values of the statistical characteristic.
24 How do you appraise the comparability of your statistical product across non-geographicaldomains (relating to concepts and survey design of important other statistics)?
1 – There are serious differences to other important related statistics
2 – There are larger differences to other important related statistics
3 – There are some differences to other important related statistics
4 – There are slight differences to other important related statistics
5 – There are no major differences to other important related statistics
25 How do you appraise the comparability of your statistical product over time (relating topreceding reference periods of your survey)?Comparability over time can be restricted due to changes in concepts and/or survey design.
1 – The survey is not comparable over time due to fundamental changes or problems
2 – Comparability over time is seriously restricted
3 – Comparability over time is restricted to some extent
4 – Comparability over time is slightly restricted
5 – There are no restrictions concerning comparability over time
Self Assessment Checklist for Survey Managers 44
CoherenceCoherence of statistics is their adequacy to be reliably combined in different ways and for various uses.When originating from a single source, statistics are normally coherent in the sense that elementary resultsderived from the concerned survey can be reliably combined in numerous ways to produce more complexresults.When originating from different sources, and in particular from statistical surveys of different nature and/orfrequencies, statistics may not be completely coherent in the sense that they may be based on differentapproaches, classifications and methodological standards. Conveying neighbouring results, they may alsoconvey not completely coherent messages, the possible effects of which, users should be clearly informed of.
26 Is the survey carried out with different frequencies at the same time (e. g. on a monthly and ayearly basis)?
Yes
No please go to question 29
27 Concerning the results for different frequencies, how do you appraise the coherence of yourstatistics – in other words can the results of different frequencies for the same referenceperiod be reliably combined?
1 – There are substantial problems
2 – There are a lot of contradictions
3 – There are some contradictions
4 – There are few contradictions
5 – There are no major contradictions
28 How do you appraise the coherence of your statistic within the same socio–economic area?Can results be reliably combined with statistics originating from other sources (alsoincluding important non-official statistics)?
1 – There are substantial differences
2 – There are a lot of differences
3 – There are some differences
4 – There are few differences
5 – There are no major differences
Data analysisData analysis aims to explore key findings of the data and prepare data for dissemination in a way suitable forthe target group.
29 How do you appraise your ability to react quickly and flexibly to user demands for tailormade analysis?There is great potential to react quickly and flexibly to user demands for tailor made analysis becausethe capacity and expertise for nearly all analysis concerning the statistic in question is available
In most cases user demands for tailor made analysis can be satisfied because the capacity andexpertise for most analysis concerning the statistic in question is available for nearly all analysisconcerning the statistic in question is available
Unfortunately most user demands for tailor made analyses can not be satisfied because of a lack ofcapacity or expertise
It is not our duty to satisfy user demands concerning the analysis of the data

Self Assessment Checklist for Survey Managers 45
30 Which of following approaches of follow–up analysis do you employ?Modelling
Spatial Analysis
Index calculation
Seasonal or trend analysis and extrapolation
Others(Please specify)
31 Did you introduce new and innovative methods or extensions of existing methods for yourdata analysis in the last year?
Yes
No
Disclosure controlThe confidentiality of the respondents’ information needs to be protected preserving the usefulness of the dataoutputs to the greatest extent possible.
32 Which types of data do you have for publication or (semi)public access?
Frequency tables
Tables of magnitude
Microdata – Scientific Use File
Microdata – Public Use File
33 Which criteria do you agree to define a cell sensitive to delete it from a table (cellsuppression)?The minimum number of respondents in a cell must exceedsome minimum value, the minimum value is:
Measures of concentration of predominance for the distribution of the respondents’ values within thecell:
The C–times rule, ensuring that the second–ranking respondent cannot obtain a goodestimate of the largest unit
Linear combinations of the order statistics, e.g. the (n, k) rule: a cell is sensitive if thelargest n respondent account for at least k% of the total cell value
Zero frequencies which must not reveal information about respondents above or belowcertain threshold levels, e.g. profits that never exceed a certain value for a certain classof business

Self Assessment Checklist for Survey Managers 46
34 Did you need to suppress complementary cells in order to protect the sensitive cell?
Yes
No
35 Did you use existing software to accomplish cell suppression?
Yes
No
Place for comments concerning the questions of process V “Data Analysis and outputquality”

Self Assessment Checklist for Survey Managers 47
VI. Documentation and Dissemination
Metadata documentationA complete and unambiguous description of the production process including data sources, concepts,definitions and methods used needs to be achieved. This is crucial for the NSIs internal use to ensure andimprove quality and to take over other people’s processes as well as for the users to better understand anduse the data.
1 Is there a proper documentation concerning the administrative registers in case of the use ofadministrative data?
Yes
No
2 If you document the production process please state which of the following items areincluded:Assessment of needs
A copy of the questionnaire
The variables including
Variable name
Origin of the variable, specifying
If the variable is obtained by coding an answer to a question in a statisticalquestionnaire or in an administrative document
If the variable is obtained from a calculation based on other variables (derived variable)
If the variable comes from an external source
The statistical nature of the variable (i.e. whether it is categorical, ordinal, metric)
The length of the corresponding record
The level of detail of the observed variable
The unit of measure (when it has a meaning)
The list of values taken (codes and headings) when a not standard classification is used
The description of the external source (when a variable comes from it)
The description of the calculations made in the case of a derived variable
Classifications describing
The references to the classifications, when standard or general classifications are used
The texts of the classifications when a specifc classification has been adopted
Information explaining particular points in the processing of some items of the referencedclassifications
Definitions of concepts (e.g. unemployment) and of the statistical units (e.g. enterprise or local unit) including
The title of the defined concepts
The text of the definition
The links between these definitions and the variables to measure the concepts
Question continues on the next page
Self Assessment Checklist for Survey Managers 48
Survey methodologies and techniques used during the production process
Any changes of survey design during process of survey
Results including all files produced starting from the files of raw data up to the files for datadissemination, whereby the required documentation is:
The name of the file
The storage format
The dissemination status
A description of the file (design, number of records)
Quality report
3 How do you disseminate metadata and quality indicators?
Metadata in paper publications
Metadata on the internet
Quality indicators in paper publications
Quality indicators on the internet
4 Do you have a documentation of the quality assurance measures (e.g. follow–up proceduresof non–response or cite of training manuals for interviewers)?
No, there is no documentation of the qualitative assurance measures
Yes, there is a documentation of all relevant quality assurance measures
Yes there is a documentation of the following quality assurance measures:
....however the documentation is inadequate due to:
5 Is there any systematic documentation of the administrative processes and the proceduresthat should be followed supporting the statistical production process, such as getting thefunds and spending them for a given survey including the economic follow–up, printing thequestionnaires, recruiting staff, contacting local authorities, contacting media...?
Yes
No

Self Assessment Checklist for Survey Managers 49
6 Below you find a list of theEurostat quality criteria. Please indicate for which of the followingcriteria you document the quality indicators?
Relevance:
User Satisfaction Index
Number of publications disseminated and/or accesses to databases
Accuracy:
Coefficient of variations (CVs)
Unit response rates
Item response rates
Editing rates and ratios
Imputation rates and ratios
Over-coverage and misclassification error rates
Average size of revisions
Timeliness and Punctuality:
Punctuality of time schedule of effective publication
Average time between the end of reference period and the date of the first results
Average time between the end of reference period and the date of the final results
Accessibility and Clarity:
Number and types of means used for disseminating statistics
Comparability:
Number and proportion of differences in concepts or/and measurement from theEuropean norms
Number and length of comparable time series
Asymmetries for statistics mirror flowsCoherence:
Number and proportion of products that satisfies the requirements for the mainsecondary use
7 Do you have a systematic documentation about the probable limitations in the use of thedata, e.g. any break in the time series?
Yes
No
8 Do you have information about the degree of satisfaction of the external users with thedocumentation?
Yes
No

Self Assessment Checklist for Survey Managers 50
9 Do you have reliable information about the degree of satisfaction of the internal staff?
Yes
No
10 Which of the following items of the production process would you wish to have a betterdocumentation on?None
Data collection
Data processing operations
Methodology
Quality control
Staff deployment
Software used
Others(Please state)
Dissemination strategiesResults are of high value when they are easily accessible and available in forms suitable to the users. Thedata provider should also assist the users in interpreting the results.
11 Are there user friendly corporate “catalogue” systems and information services available tosearch for information concerning recently produced and archived data?
Yes
No
12 Are there corporate “delivery” systems in your office providing access to data in formats,that suit users?
Yes
No
13 Are there any presentation standards used for tables and graphs?
Yes
No

Self Assessment Checklist for Survey Managers 51
14 Are preliminary or early estimates as well as revisions clearly marked and explained and isthere any information provided on limitations or the expected level of revisions forpreliminary data?
Yes
No
Data managementMany data need to be archived, e.g., for future reuse or time series analysis and this data archive should bemanaged in a systematic and elaborated way.
15 Do you have a systematic approach for managing and archiving the data?
Yes
No
16 Is there any means of data protection in the archive against unusual conditions?
Yes
No
Place for comments concerning the questions of process VI “Documentation andDissemination”

Self Assessment Checklist for Survey Managers 52
VII. Improvement cycle
Quality management needs to be incorporated into the management process of the statistical agencybecause the agency is responsible to balance the trade–offs between user data quality, user needs,budget restrictions and response burden for all statistical programmes. The effort to evaluate andimprove the operational procedures continuously influences the quality of the statistics producedwhich is called the improvement cycle. The following items are particularly prone for the improvementcycle with respect to the quality of individual surveys.
Adaptability / flexibilityKeeping the survey up–to–date means to maintain and improve the capability of collecting information andreacting flexible to new demands.
1 How do you appraise the adaptability of your statistical software packages and procedures tocollect different information and the time it takes for these systems to respond to newdemands or information needs?
Satisfactory, if necessary, nearly all improvements can be made
Satisfactory, but there is some space for improvements,concerning the following statistical processes:
Not satisfactory, the adaptability of the data input systems needs to be improved
2 Do you have a data collection infrastructure for the flexible implementation of ad hoc surveys(e. g. an Access Panel, a permanent sample of voluntary respondents)?
Yes
No
3 How do you appraise the burden and costs for quick response to changing demands?
Acceptable, nearly no reductions are possible
Acceptable, but the costs for quick response could still be reduced
Too high
Othersplease state:

Self Assessment Checklist for Survey Managers 53
Expertise in relevant areasThe NSIs should aim to maintain and improve the available capacity to produce good quality statisticalinformation
4 Does the staff in charge of the survey have good knowledge and understanding of thesubject field, the source data, concepts and classifications, current and emerging issues andthe necessary operations which are relevant for the survey in question?Yes, the staff has a profound expertise for all subject matters relevant for the survey in question
Yes, the staff has a sufficient knowledge for most subject matters relevant for the survey in question
No, there is no sufficient expertise for all requirements in our office but the missing expertise can becontracted in
No, there is no sufficient expertise
5 How do you appraise the training of your staff?There is excellent training for the staff available
The training of staff is sufficient but could be improved
The situation of the staffs training should urgently be improved
6 Can the expertise in charge of the survey be maintained without being vulnerable to key staffchanges?Yes, the expertise in our statistical office can be maintained without being vulnerable to staff changes
The expertise in our statistical office can generally be maintained although there might be shortcomingsdue to key staff changes
No, there are shortages due to key staff changes
7 How do you appraise your contacts to other agencies or professional associations?Very good, there are a lot of contacts to various national and international agencies and associations
Satisfactory, although the contacts could be intensified, we have enough contacts to be up to date withthe latest developments
Not satisfactory, our contacts to other agencies or professional associations need to be improved
Quality managementThe overall aim of the quality management should be to achieve cost–effective outputs satisfying reasonabledemands.
8 Does a regular monitoring of your survey takes place concerning the efficiency of allproduction processes in the sense that the quality and expenses for the input vs. the qualityof the output are evaluated?No monitoring takes places
Yes, all production processes are reviewedQuestion continues on the next page
Self Assessment Checklist for Survey Managers 54
Yes, the following processes are reviewed
Please state the processes:
9 Is the latest IT technology available and used to achieve efficiency, timeliness or quality?
No, there should be a changeover of the IT technology for most processes
Yes, the latest IT technology is used for nearly all processes
Yes, generally the latest IT technology is employed but improvements could be made using the followingtechnique for the following processing:
10 Is it possible for you to achieve an extensive overview of all existing resources which couldpotentially improve the efficiency of your survey, e.g. financial resources, human resources,existing data that could be used?
Yes
No
11 Is the efficiency of the statistical production process reviewed by any independent experts?
Yes, it is reviewed by Eurostat
Yes, it is reviewed by independent experts outside Eurostat
No
12 If you would have 20% more or 20% less of your budget, what would you do?
Space continues on the next page

Self Assessment Checklist for Survey Managers 55
Place for comments concerning the questions of process VII “Improvement cycle”

Self Assessment Checklist for Survey Manager 56
DESAP Glossary of technical terms
Accessibility Accessibility refers to the physical conditions in which users can obtaindata: where to go, how to order, delivery time, clear pricing policy,convenient marketing conditions (copyright, etc.), availability of micro ormacro data, various formats (paper, files, CD-ROM, Internet…), etc.
Accuracy Accuracy in the general statistical sense denotes the closeness ofcomputations or estimates to the exact or true values.
Administrative record Refers to any data collected primarily for some other purpose than officialstatistics production. They contain information used in making decisions ordeterminations or for taking actions affecting individual subjects of therecords. Compare to → “Register”
Behaviour coding Frequency of certain types of behaviours that interviewers and/orrespondents exhibit during an interview are systematically recorded viacodes.
Bias Generally, an effect which deprives a statistical result ofrepresentativeness by systematically distorting it, as distinct from a randomerror which may distort on any one occasion but balances out on theaverage.
Clarity Clarity refers to the data’s information environment whether data areaccompanied with appropriate metadata, illustrations such as graphs andmaps, whether information on their quality also available (includinglimitation in use…) and the extend to which additional assistance isprovided by the NSI.
Cluster sampling (One–stage) The frame is divided into groups (clusters) which are usually naturallyoccurring divisions of the population. All elements from each selectedcluster are included in the sample.
Cluster sampling (Two–stage) A sub–selection from within the selected clusters is included in the sample.
Coding Coding is a technical procedure for converting verbal information intonumbers or other symbols, which can be more easily counted andtabulated.
Coding error The attribution of an incorrect code to a survey response.
Coefficient of variation A measure of spread for a set of data defined as the ratio of the standarddeviation to the mean.
Coherence Coherence of statistics is their adequacy to be reliably combined indifferent ways and for various uses. It is, however, generally easier to showcases of incoherence than to prove coherence. When originating from asingle source, statistics are normally coherent in the sense that elementaryresults derived from the concerned survey can be reliably combined innumerous ways to produce more complex results. When originating fromdifferent sources, and in particular from statistical surveys of differentnature and/or frequencies, statistics may not be completely coherent in thesense that they may be based on different approaches, classifications andmethodological standards. Conveying neighbouring results, they may alsoconvey not completely coherent messages, the possible effects of which,users should be clearly informed of.
Comparability Comparability is the extent to which differences between statistics fromdifferent geographical areas, non-geographical domains, or over time, canbe attributed to differences between the true values of the statistics.

Self Assessment Checklist for Survey Manager 57
Completeness Completeness is the extend to which all statistics that are needed areavailable. It is usually described as a measure of the amount of availabledata from a statistical system compared to the amount that was expectedto be obtained.
Confidence Interval A a% confidence interval for an unknown population parameter •, is aninterval, calculated from sample values by a procedure such that if a largenumber of independent samples is taken, a% of the intervals obtained willcontain •.
Consistent estimator An estimator which converges in probability, as the sample size increases,to the parameter of which it is an estimator.
Coverage error Coverage error is the error associated with the failure to include some unitsof the target population in the frame used for sample selection(undercoverage) and the error associated with the failure to identify unitsrepresented in the frame more than once (overcoverage).The source ofcoverage error is the sampling frame itself.
Cut-off threshold A cut-off threshold is used, mainly for cost or burden reasons, to excludeunits from the target population (hence from the frame) contributing verylittle to the requested statistics, small businesses for instance. Thecontribution from the population below the threshold can either be deemednegligible or be estimated by using a model.
Editing, Edits Data editing is the application of checks that identify missing, invalid orinconsistent entries or that point to data records that are potentially inerror.
Electronic Data interchange(EDI)Electronic document interchange
Electronic Data Interchange (EDI) is the computer-to-computer exchangeof data in a publicly published and globally standardised format.
Error In general, a mistake or error in the colloquial sense. There may, forexample, be a gross error or avoidable mistake; an error of reference,when data concerning one phenomenon are attributed to another; copyingerrors; an error of interpretation. In a more limited sense the word error isused in statistics to denote the difference between an occurring value andits true or expected value. There is here no imputation of mistakes on thepart of a human agent; the deviation is a chance effect. In this sense wehave, for example, errors of observations, errors in equations, errors of thefirst and second kinds in the testing hypothesis, and the error bandsurrounding an estimate; and also the Normal curve of errors itself.
Estimate In the strict sense an estimate is the particular value yielded by anestimator in a given set of circumstances.
Estimator An estimator is a rule or method of estimating a constant of a population. Itis usually expressed as a function of sample values and hence is avariable whose distribution is of great importance in assessing thereliability of the estimate to which it leads.
Expected Value(expectation value,expectation)
The hypothetical averages from the conceived replicates of the survey allconducted under the same essential conditions.
Flow-sampling Selecting a sample unit per time unit, e.g. questioning somebody every 15Minutes from a stream of people passing a border.
Focus groups interviews Interviewers meet in a group which is moderated to identify any problemsor successes of the survey and to suggest how potential problems couldbe solved.

Self Assessment Checklist for Survey Manager 58
Frame The frame consists of previously available descriptions of the objects ormaterial related to the physical field in the form of maps, lists, directories,etc., from which sampling units may be constructed and a set of samplingunits selected; and also information on communications, transport, etc.,which may be of value in improving the design for the choice of samplingunits, and in the formation of strata, etc. However a frame is needed forcensuses, too. In this case the frame is ideally congruent with the targetpopulation.
Imputation Imputation is the process used to resolve problems of missing, invalid orinconsistent responses identified during editing. This is done by changingsome of the responses or missing values on the record being edited toensure that a plausible, internally coherent record is created.
In–depth interviews A conversation conducted by trained staff that usually collects specificinformation when not much is known about a population to get preliminaryideas from the participants.
Inlier An inlier is a data value that lies in the interior of a statistical distributionand is in error. Because inliers are difficult to distinguish from good datavalues they are sometimes difficult to find and correct. A simple example ofan inlier might be a value in a record reported in the wrong units, saydegrees Fahrenheit instead of degrees Celsius.
Interviewer error Interviewer errors are associated with effects on respondents' answersstemming from the different ways that interviewers administer the samesurvey. Examples of these errors include the failure to read the questioncorrectly (leading to response errors by the respondent), delivery of thequestion with an intonation that influences the respondent's choice ofanswer, and failure to record the respondent's answer correctly.
Item non-response Item non-response occurs when a respondent provides some, but not all,of the requested information, or if the reported information is not usable.
Item response rate The item response rate is the ratio of the number of eligible unitsresponding to an item to the number of responding units eligible to haveresponded to the item.
Macro-editing A macro-edit detects individual errors by checks on aggregated data, orchecks applied to the whole body of records. The checks are typicallybased on the models, either graphical or numerical formula based, thatdetermine the impact of specific fields in individual records on theaggregate estimates.
Mean square error The total Mean square error (MSE) for an estimate is equal to the biassquared plus the variance. There are several sources of error contributingboth to the bias and to the variance components of the total MSE. Theseare the specification error, frame error, nonresponse error, measurementerror, data processin error and the sampling error.
Measurement error Measurement error refers to errors in survey responses arising from themethod of data collection, the respondent, or the questionnaire (or otherinstruments). It includes the error in a survey response as a result ofrespondent confusion, ignorance, carelessness, or dishonesty; the errorattributable to the interviewer, perhaps as a consequence of poor orinadequate training, prior expectations regarding respondents' responses,or deliberate errors; and error attributable to the wording of the questionsin the questionnaire, the order or context in which the questions arepresented, and the method used to obtain the responses.
Micro editing Finding errors by inspection of individual observations. Editing done at therecord, or questionnaire level.

Self Assessment Checklist for Survey Manager 59
Misclassification Misclassification refers to allocating statistical units in a wrong class, inrelation to a given classification. For instance, a business is classified intrade instead of industry.
Model assumption error Model assumption are errors that occur due the use of methods, such ascalibration, generalised regression estimator, calculation based on fullscope or constant scope, benchmarking, seasonal adjustment and othermodels not included in the preceding accuracy components, in order tocalculate statistics or indexes.
Non probability sample A non-probability Sample is a sample in which the selection of units isbased on factors other than random chance, e.g. convenience, priorexperience or the judgement of the researcher. Examples of non-probability.
Non response Non response is a form of nonobservation present in most surveys.Nonresponse means failure to obtain a measurement on one or morestudy variables for one or more elements k selected for the survey. Theterm encompasses a wide variety of reasons for nonobservation:"impossible to contact", "not at home", "unable to answer", "incapacity","hard core refusal", "inaccessible", "unreturned questionnaire", and others.In the first two cases contact with the selected element is neverestablished.
Non response bias see non response error
Non response error Nonresponse errors, which occur when the survey fails to get a responseto one, or possibly all, of the questions. Nonresponse causes both anincrease in variance, due to the decrease in the effective sample sizeand/or due to the use of imputation, and may cause a bias if the non-respondents and respondents differ with respect to the characteristic ofinterest.
Non sampling error An error in sample estimates which cannot be attributed to samplingfluctuations. Such errors may arise from many different sources such asdefects in the frame, faulty demarcation of sample units, defects in theselection of sample units, mistakes in the collection of data due to personalvariations or misunderstandings or bias or negligence or dishonesty on thepart of the investigator or of the interviewee, mistakes at the stage of theprocessing of the data, etc.
Out of scope units Units that should not be included in the sampling frame because they donot belong to the target population in the reference period. If enumerated,they cause over-coverage.
Outlier In a sample of n observations it is possible for a limited number to be so farseparated in value from the remainder that they give rise to the questionwhether they are not from a different population, or that the samplingtechnique is a fault. Such values are called outliers.
Overcoverage Overcoverage arises from the presence of units in the frame not belongingto the target population or appearing in the frame more than once.
Over–editing Extensive editing that does not achieve noticeable quality improvements.
Paraphrasing Let the respondent repeat the question in his or her own words.

Self Assessment Checklist for Survey Manager 60
Population Population is the total membership or population or “universe” of a definedclass of people, objects or events. There are two types of population, viz.,target population and survey population. A target population is thepopulation outlined in the survey objects about which information is to besought and a survey population is the population from which informationcan be obtained in the survey. The target population is also known as thescope of the survey and the survey population is also known as thecoverage of the survey. For administrative records the correspondingpopulations are: the “target” population as defined by the relevantlegislation and regulations, and the actual “client population”.
Probability sample Probability sampling is an approach to sample selection that satisfiescertain conditions, which, for the case of selecting elements directly fromthe population, are described as follows: 1) we can define the set ofsample, {S1, S2, …,Sm}, that are possible to obtain with the samplingprocedure. 2) a known probability of selection p(s) is associated with eachpossible sample s. 3) the procedure gives every element in the populationa nonzero probability of selection. 4) we select one sample by a randommechanism under which each possible s receives exactly the probabilityp(s). A sample realised under these four requirements is called probabilitysample.
Probabilities Proportional to Size(PPS) sampling
Attaching an inclusion probability to each element that is related to theelement size.
Processing error Once data have been collected, they pass through a range of processesbefore the final estimates are produced: coding, keying, editing, weighting,tabulating, etc. Errors introduced at these stages are called processingerrors.
Punctuality Punctuality refers to the time lag existing between the actual delivery dateof data and the target date when it should have been delivered, forinstance, with reference to dates announced in some official releasecalendar, laid down by regulations or previously agreed among partners.
Quality control survey A replicated survey carried out on a small scale by very experienced staffin order to obtain some “zero-default” results with which the actual resultsof the survey can be compared.
Quality index A one-dimension synthetic information on quality, possibly calculated as aweighted mean of all available quality indicators.
Random sampling All elements in a population have a given probability of being included inthe sample.
Record linkage Record linkage is the bringing together for statistical and researchpurposes of information about individual respondents or units ofobservation such as persons, households or businesses from two or moredifferent sources in order to form combined individual micro records.Record linkage is a potentially important source of valuable statisticalinformation, for example, to shed light on the effectiveness of certaincancer screening methods or the long-term effects of heart surgery.
Reference period(reference time)
The period of time for which data are collected.
Refusal rate In the sampling of human populations, the proportion of individuals who,through successfully contacted, refuse to give the information sought. Theproportion is usually and preferably calculated by dividing the number ofrefusals by the total number of the sample which it was originally desired toachieve.

Self Assessment Checklist for Survey Manager 61
Register (Administrative) Registers are a sub-group of → administrative records. Ifan administrative record consists of unit-level data, it can be called aregister. Administrative registers come from administrative sources andbecome statistical registers after passing through statistical processing inorder to make it fit for statistical purposes (production of register basedstatistics, frame creation, etc.)
Relative standard error The relative standard error (RSE) is a measure of an estimate’s reliability.The RSE of an estimate is obtained by dividing the standard error of theestimate (SE(r)) by the estimate itself (r). This quantity is expressed as apercent of the estimate and is calculated as follows: RSE=100 x (SE(r)/r).
Relevance Relevance is the degree to which statistics meet current and potentialusers’ needs. It refers to whether all statistics that are needed areproduced and the extent to which concepts used (definitions,classifications etc.) reflect user needs.
Reweighting Reweighting consists of raising the original weights for the respondentvalues when estimates are computed. Reweighting concerns mainly unitnon-response. It may also be used to increase precision through the use ofauxiliary information. Standard methods include post-stratification,calibration and response propensity modelling.
Sampling error The part of the difference between a population value and an estimatethereof, derived from a random sample, which is due to the fact that only asample of values is observed; as distinct from errors due to imperfectselection, bias in response or estimation, errors of observation andrecording, etc.
Standard error The positive square root of the variance of the sampling distribution of astatistic.
Statistical characteristics A numerical value (like turnover, average income) defined by a statisticalmeasure that is used to summarise the values for a specific quantitativevariable (like turnover, disposable income) for all statistical units in aspecific group.
Statistical measure A summary of the individual quantitative variable values for the statisticalunits in a specific group (study domains).
Statistical unit An object of a statistical survey and the bearer of statistical characteristics.The statistical unit is the basic unit of statistical observation within astatistical survey.
Stratified sampling The population is first divided into mutually exclusive homogenous sub–populations (strata) and from each stratum a probability sample is drawnwith the aim to reduce the total variance.
Study domains Statistics are presented for different sub-groups of the population, socalled study domains. These study domains are usually defined accordingto some classification (e.g. territorial units, economic activity etc.)
Success rate of the record linkage When records are linked the success rate expresses in percent how manyrecords could be matched. See also → “record linkage”

Self Assessment Checklist for Survey Manager 62
Survey design(Sampling planSample design)
Survey design defines the fixed properties of the data collection over allpossible implementations within a fixed measurement environment. Theusage is not uniform as regards the precise meaning of this and similarterms like "sample plan," "survey design," or "sampling design".These cover one or more parts constituting the entire planning ofa (sample) survey inclusive of processing, etc. The term "sampling plan"may be restricted to mean all steps taken in selecting the sample; the term"sample design" may cover in addition the method of estimation; and"survey design" may cover also other aspects of the survey, e.g. choiceand training of interviewers, tabulation plans, etc. "Sample design" issometimes used in a clearly defined sense, with reference to a givenframe, as the set of rules or specifications for the drawing of a sample in anunequivocal manner.
Systematic random sampling Every element is selected over the whole sampling frame on the basis of aselection interval (r, r+k, r+2k,...).
Target population The target population is the population we wish to study, that is, the set ofelements about which estimates are required.
Think–aloud interviews Respondents think out loud how they interpret a question, retrieveinformation, formulate a response and select a response alternative.
Timeliness Timeliness of information reflects the length of time between its availabilityand the event or phenomenon it describes.
True value The actual population value that would be obtained with perfect measuringinstruments and without committing any error of any type, both in collectingthe primary data and in carrying out mathematical operations.
Two–phase (stratified) sampling If stratification information is not available from the frame, a first largesample is selected to get it.
Undercoverage Undercoverage results from the omission of units from the frame belongingto the target population.
Unit non response Unit non response is a complete failure to obtain data from a sample unit.
Unit response rate The ratio, expressed in percentage of the number of interviews to thenumber of eligible units in the sample. The weighted response ratecalculates the ratio using the inverse probability of inclusion in the sampleas a weight for each unit. In some occasions a value that reflects theimportance of the unit is also used as a weighting factor (like size ofworkforce for establishments).
User Satisfaction survey A statistical survey aiming to assess the satisfaction of users of statistics.
Variance Variance estimation provides a measure of the quality of estimates, is usedin the computation of confidence intervals and helps draw accurateconclusions. The sampling variance is one of the key indicators of thequality in sample surveys and estimation. Sampling variance helps theuser to draw better conclusions about the statistics produced, and it is alsoimportant information for the design and estimation phases of surveys.