deschutes basin hcp - u.s. fish and wildlife service basin habitat conservation plan study report...
TRANSCRIPT
Deschutes Basin HABITAT CONSERVATION PLAN
STUDY REPORT
Study 15: Assessment of Total Dissolved Gas at Dams Covered by the
DBHCP
Prepared for:
Deschutes Basin Board of Control, and
City of Prineville, Oregon
Prepared by:
R2 Resource Consultant, Inc. and Biota Pacific Environmental Sciences, Inc.
March 2013
DESCHUTES BASIN HABITAT CONSERVATION PLAN STUDY REPORT
Study 15: Assessment of Total Dissolved Gas at Dams Covered by the DBHCP
Prepared for:
Deschutes Basin Board of Control P. O. Box 919 Madras, Oregon 97741
City of Prineville 387 NE Third Street Prineville, Oregon 97754
Prepared by:
Biota Pacific Environmental Sciences, Inc. P. O. Box 158 Bothell, Washington 98041 R2 Resource Consultants, Inc. P. O. Box 203 Redmond, Washington 98073
March 2013

Study_15_Report_March_2013 Page i
TABLE OF CONTENTS
1.0 Introduction ................................................................................................................................ 1
1.1. Background .................................................................................................................................. 1
1.2. Purpose, Scope and Methods ...................................................................................................... 1 1.2.1. Purpose ............................................................................................................................... 1 1.2.2. Statement of the Issue ........................................................................................................ 1 1.2.3. Scope ................................................................................................................................... 5 1.2.4. Methods .............................................................................................................................. 5
2.0 Results ......................................................................................................................................... 6
2.1. Bowman Dam .............................................................................................................................. 6 2.1.1. Physical Structure and Operation ....................................................................................... 6 2.1.2. Evaluation of TDG ............................................................................................................... 7 2.1.3. Evaluation of TDG Abatement .......................................................................................... 11
2.2. Ochoco Dam .............................................................................................................................. 12 2.2.1. Physical Structure and Operation ..................................................................................... 12 2.2.2. Evaluation of TDG ............................................................................................................. 15
3.0 Conclusions and Recommendations ......................................................................................... 15
4.0 References ................................................................................................................................ 16
LIST OF TABLES
Table 2-1. Predicted river flows where certain TDG levels are exceeded at the Bowman Dam tailrace based on various linear regression models. ........................................................... 9
Table 2-2. Crooked River depths available at 500 cfs in the Upper Canyon. ...................................... 11
Table 2-3. Predicted TDG levels at 500 cfs increments of river flow at the Bowman Dam tailrace based on various linear regression models. .......................................................... 11
LIST OF FIGURES
Figure 1-1. Exopthalmia, gas bubbles, and hemorrhaging around the eye of a juvenile Chinook salmon with severe signs of GBD. ........................................................................................ 3
Figure 1-2. Relationship between measured and actual TDG saturation levels experienced by fish at various water depths. ................................................................................................ 4
Figure 2-1. Linear regression of TDG levels and river discharge in the Bowman Dam tailrace. ........... 8

Study_15_Report_March_2013 Page ii
LIST OF PHOTOS
Photo 2-1. Prineville Reservoir, Bowman Dam, Spillway, and Stilling Basin. ........................................ 6
Photo 2-2. Arthur R. Bowman spillway and stilling basin showing location of splitter walls. ............. 7
Photo 2-3. Ochoco Dam and Spillway. ................................................................................................... 13
Photo 2-4. Ochoco Dam Spillway at an average grade of 9.6 percent. ................................................ 13
Photo 2-5. Ochoco Main Canal Spill to Ochoco Creek at RM (11.0). ..................................................... 15

Study_15_Report_March_2013 Page 1
1.0 Introduction
1.1. Background
Seven central Oregon irrigation districts (Arnold, Central Oregon, North Unit, Ochoco, Swalley, Three Sisters, and Tumalo) and the City of Prineville, Oregon (City) are seeking Federal Endangered Species Act (ESA) incidental take permits for the Middle Columbia River steelhead (Oncorhynchus mykiss), bull trout (Salvelinus confluentus), and up to 12 other listed and unlisted species inhabiting the Deschutes River basin. As required by Section 10 of the ESA, the City and the irrigation districts (collectively the Applicants) are preparing the Deschutes Basin Multi-species Habitat Conservation Plan (DBHCP) to minimize and mitigate the effects of the proposed incidental take on the covered species. The DBHCP is being prepared in cooperation with a multi-stakeholder Working Group representing the U.S. Fish and Wildlife Service (USFWS), National Marine Fisheries Service (NMFS), U.S. Bureau of Reclamation (Reclamation), U.S. Bureau of Land Management (BLM), Oregon Department of Fish and Wildlife (ODFW), Oregon Department of Environmental Quality (ODEQ), Oregon Water Resources Department (OWRD), the Confederated Tribes of the Warm Springs, Crook County, and several non-governmental entities.
This study has been completed to support development of the DBHCP. The scope of work for the study was reviewed and approved by the Working Group prior to initiation. Drafts of this report are being provided to the Working Group for review and comment, and the final report will reflect their input. This report does not necessarily represent the consensus view of the Working Group. Rather, it is intended to serve as a reference document for the members of the group as they collaboratively develop plans for additional studies and conduct analyses of the effects of the covered activities and the benefits of various minimization and mitigation options.
1.2. Purpose, Scope and Methods
1.2.1. Purpose
The purpose of this study is to provide an initial evaluation of the potential for dams covered by the DBHCP to alter concentrations of total dissolved gas (TDG) in waters occupied by covered fish species. The release of water from high-head storage reservoirs has the potential to increase downstream concentrations of TDG, which can be harmful to fish as described below.
1.2.2. Statement of the Issue
Water releases can introduce air into the waterbody and may result in total dissolved gas saturation. The effects of dam operation on TDG have been well-documented (May 1973; Ebel et al. 1975; Weitkamp 1976; Dawley et al. 1976; Weitkamp and Katz 1980; Colt et al. 1986; Marking 1987; Shrank et al. 1997; Ryan et al. 2000; Weitkamp et al. 2003b; Beeman et al. 2003). Gas supersaturation below dams occurs when air becomes entrained in the water column and is forced into solution. The extent of the saturation is exacerbated when the water plunges below the surface, thereby increasing hydrostatic pressure to further force the air into solution. TDG is the measure of the sum total of all gas partial pressures in water relative to atmospheric pressure. Dissolved gas supersaturation in the region occurs typically during the spring freshet when water is voluntarily or involuntarily spilled over dams.
Study_15_Report_March_2013 Page 2
1.2.2.1. Physical Conditions
The gases of concern comprise the atmospheric gases of nitrogen (80%), oxygen (20%), and a few trace gases. The presence of dissolved gases is measured by the pressure exerted compared to atmospheric pressures. If more gas is entrained in water than normal atmospheric pressure at the surface of the water it is referred to as a supersaturated condition.
Several environmental factors affect the solubility of gases in air and water. Changes in these factors alter the pressure exerted by the gases, and can affect the degree of saturation. Increasing water temperature, falling barometric pressure, and biological activity (community respiration) can generate an increase in the partial pressure of dissolved gases (Weitkamp and Katz 1980; Colt 1984). Conversely, decreasing water temperature, photosynthesis, and a rising barometer have the opposite effect. Although it does not affect gas physics, wind can decrease the amount of gasses in river water by stripping gas at the surface. All of these factors should be considered when evaluating gas levels due to water releases and spills.
1.2.2.2. Biological Effects
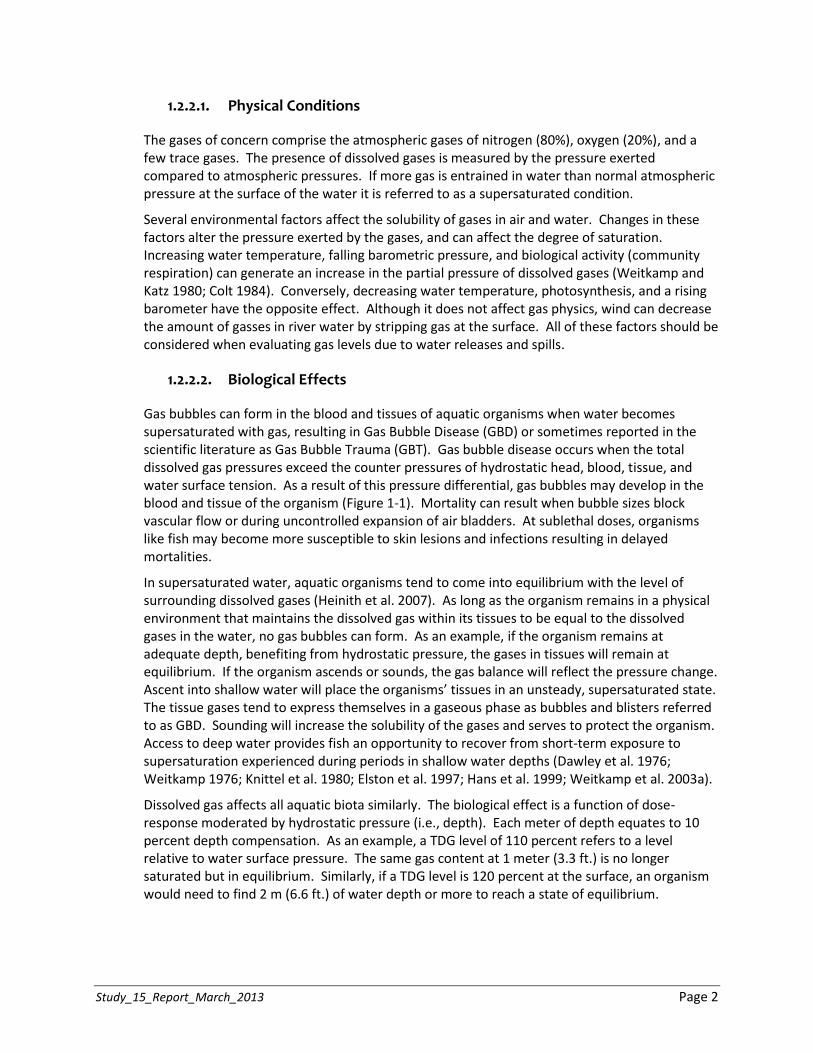
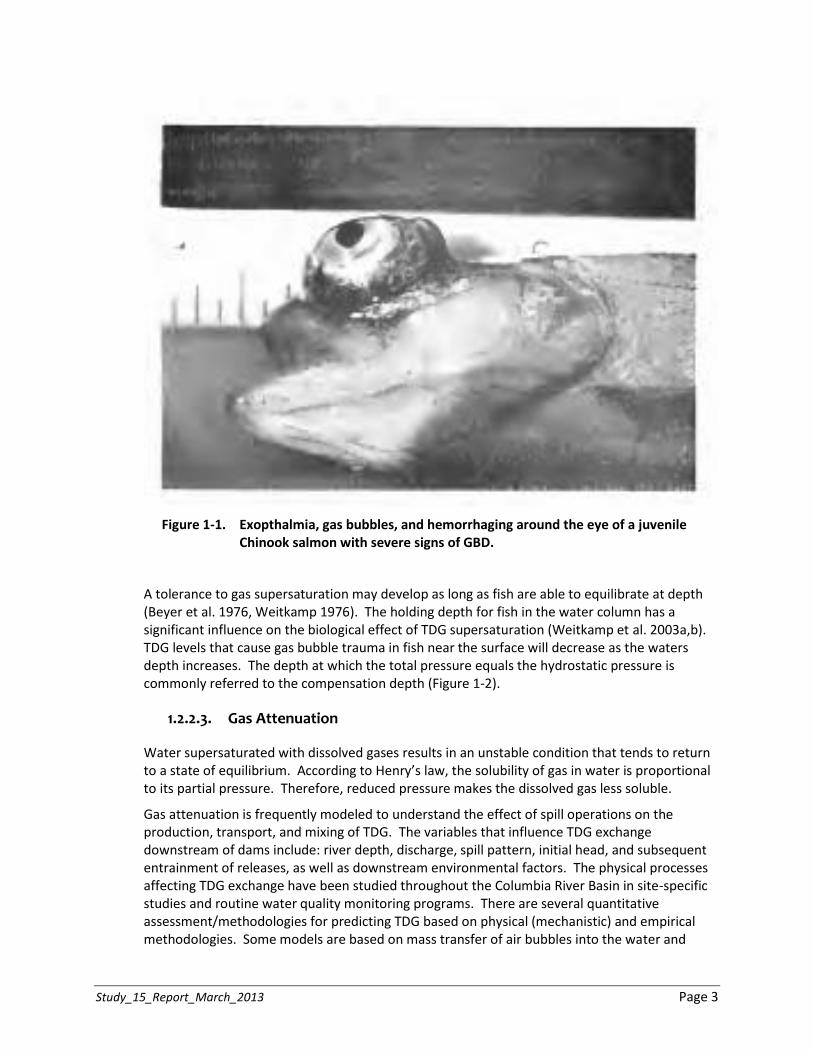
Gas bubbles can form in the blood and tissues of aquatic organisms when water becomes supersaturated with gas, resulting in Gas Bubble Disease (GBD) or sometimes reported in the scientific literature as Gas Bubble Trauma (GBT). Gas bubble disease occurs when the total dissolved gas pressures exceed the counter pressures of hydrostatic head, blood, tissue, and water surface tension. As a result of this pressure differential, gas bubbles may develop in the blood and tissue of the organism (Figure 1-1). Mortality can result when bubble sizes block vascular flow or during uncontrolled expansion of air bladders. At sublethal doses, organisms like fish may become more susceptible to skin lesions and infections resulting in delayed mortalities.
In supersaturated water, aquatic organisms tend to come into equilibrium with the level of surrounding dissolved gases (Heinith et al. 2007). As long as the organism remains in a physical environment that maintains the dissolved gas within its tissues to be equal to the dissolved gases in the water, no gas bubbles can form. As an example, if the organism remains at adequate depth, benefiting from hydrostatic pressure, the gases in tissues will remain at equilibrium. If the organism ascends or sounds, the gas balance will reflect the pressure change. Ascent into shallow water will place the organisms’ tissues in an unsteady, supersaturated state. The tissue gases tend to express themselves in a gaseous phase as bubbles and blisters referred to as GBD. Sounding will increase the solubility of the gases and serves to protect the organism. Access to deep water provides fish an opportunity to recover from short-term exposure to supersaturation experienced during periods in shallow water depths (Dawley et al. 1976; Weitkamp 1976; Knittel et al. 1980; Elston et al. 1997; Hans et al. 1999; Weitkamp et al. 2003a).
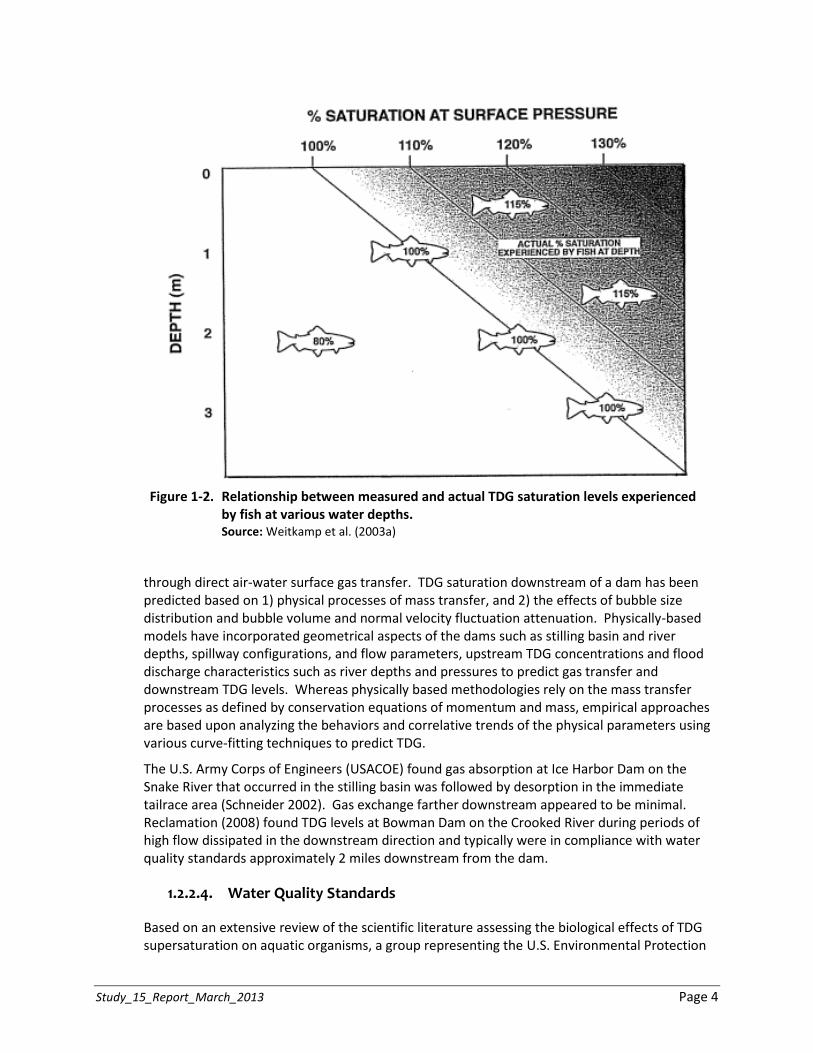
Dissolved gas affects all aquatic biota similarly. The biological effect is a function of dose- response moderated by hydrostatic pressure (i.e., depth). Each meter of depth equates to 10 percent depth compensation. As an example, a TDG level of 110 percent refers to a level relative to water surface pressure. The same gas content at 1 meter (3.3 ft.) is no longer saturated but in equilibrium. Similarly, if a TDG level is 120 percent at the surface, an organism would need to find 2 m (6.6 ft.) of water depth or more to reach a state of equilibrium.
Study_15_Report_March_2013 Page 3
Figure 1-1. Exopthalmia, gas bubbles, and hemorrhaging around the eye of a juvenile Chinook salmon with severe signs of GBD.
A tolerance to gas supersaturation may develop as long as fish are able to equilibrate at depth (Beyer et al. 1976, Weitkamp 1976). The holding depth for fish in the water column has a significant influence on the biological effect of TDG supersaturation (Weitkamp et al. 2003a,b). TDG levels that cause gas bubble trauma in fish near the surface will decrease as the waters depth increases. The depth at which the total pressure equals the hydrostatic pressure is commonly referred to the compensation depth (Figure 1-2).
1.2.2.3. Gas Attenuation
Water supersaturated with dissolved gases results in an unstable condition that tends to return to a state of equilibrium. According to Henry’s law, the solubility of gas in water is proportional to its partial pressure. Therefore, reduced pressure makes the dissolved gas less soluble.
Gas attenuation is frequently modeled to understand the effect of spill operations on the production, transport, and mixing of TDG. The variables that influence TDG exchange downstream of dams include: river depth, discharge, spill pattern, initial head, and subsequent entrainment of releases, as well as downstream environmental factors. The physical processes affecting TDG exchange have been studied throughout the Columbia River Basin in site-specific studies and routine water quality monitoring programs. There are several quantitative assessment/methodologies for predicting TDG based on physical (mechanistic) and empirical methodologies. Some models are based on mass transfer of air bubbles into the water and
Study_15_Report_March_2013 Page 4
Figure 1-2. Relationship between measured and actual TDG saturation levels experienced by fish at various water depths. Source: Weitkamp et al. (2003a)
through direct air-water surface gas transfer. TDG saturation downstream of a dam has been predicted based on 1) physical processes of mass transfer, and 2) the effects of bubble size distribution and bubble volume and normal velocity fluctuation attenuation. Physically-based models have incorporated geometrical aspects of the dams such as stilling basin and river depths, spillway configurations, and flow parameters, upstream TDG concentrations and flood discharge characteristics such as river depths and pressures to predict gas transfer and downstream TDG levels. Whereas physically based methodologies rely on the mass transfer processes as defined by conservation equations of momentum and mass, empirical approaches are based upon analyzing the behaviors and correlative trends of the physical parameters using various curve-fitting techniques to predict TDG.
The U.S. Army Corps of Engineers (USACOE) found gas absorption at Ice Harbor Dam on the Snake River that occurred in the stilling basin was followed by desorption in the immediate tailrace area (Schneider 2002). Gas exchange farther downstream appeared to be minimal. Reclamation (2008) found TDG levels at Bowman Dam on the Crooked River during periods of high flow dissipated in the downstream direction and typically were in compliance with water quality standards approximately 2 miles downstream from the dam.
1.2.2.4. Water Quality Standards
Based on an extensive review of the scientific literature assessing the biological effects of TDG supersaturation on aquatic organisms, a group representing the U.S. Environmental Protection
Study_15_Report_March_2013 Page 5
Agency (USEPA) and state regulatory agencies of Washington, Oregon, and Idaho in the late 1970s concluded a level of 115 percent saturation could be tolerated by juvenile salmonid fishes, considering the compensatory effects of hydrostatic pressure (Rulifson and Pine 1976). When compensating water depths are available, TDG levels up to 120 percent for short-term periods do not produce significant adverse effects on juvenile and adults salmonid fishes (Johnson et al. 2005). The general consensus at the time was a TDG level of 115 percent could serve as a criterion for the protection of juvenile salmonid fishes from direct lethal effects. However, the group recommended a lower level of 110 percent be adopted as the water quality standard for the protection of shallow-water macroinvertebrate species, which are important food chain organisms (Rulifson and Pine 1976). As a result, the 110 percent value was established by the USEPA as a biological criterion and adopted by ODEQ as a water quality standard. The standard continues to exist today.
In 1994, ODEQ and the Washington Department of Ecology (Ecology) granted variances from the 110 percent TDG standard in relation to the fish enhancement measures of using spill along the lower Columbia River Hydroelectric Projects to speed the downstream migration of juvenile salmonid outmigrants. The waiver allowed TDG to reach 120 percent, defined as the 12 highest hourly readings measured about a mile downstream of the dams, with a maximum instantaneous allowable TDG of 125 percent (Heinith et al. 2007). These conditions were adopted as a waiver by NOAA in their biological opinion for the Columbia River Hydroelectric Projects (NMFS 2008).
1.2.3. Scope
The DBHCP covers nine storage reservoirs and associated dams; Crescent Lake, Crane Prairie, Wickiup, Upper Tumalo, Haystack, Watson, McKenzie Canyon, Prineville (Bowman Dam) and Ochoco. Four of these dams (Upper Tumalo, Haystack, Watson, and McKenzie Canyon) release water only into irrigation conduits and not into natural water bodies where they could affect fish. Another three dams (Crescent Lake, Crane Prairie, and Wickiup) are 95 miles or more upstream of waters occupied by covered fish species and thus are not of concern with respect to TDG, which typically returns to background levels within a few miles downstream of the point where it is elevated (Reclamation 2008). Similarly, there are no irrigation return spills with sufficient plunging depths to entrain atmospheric gases. As a result, the remaining two dams (Bowman and Ochoco), are the subjects of this study.
1.2.4. Methods
Study 15 evaluates the potential for deleterious levels of TDG based on previous studies, the physical characteristics of the dams, and the operational regimes. The approach for this phase of the TDG assessment includes providing a detailed description of the dam structures and seasonal releases that could influence TDG levels.
Given the compensation depths that could provide refugia or ameliorate the influence of supersaturated waters, river cross -sections available in the river segments downstream of supersaturated waters were also reviewed. Hardin (1993, 2001) assessed 25 transects in the upper canyon reach of the Crooked River between Bowman Dam and the Crooked River Diversion. These transects were reviewed to evaluate the availability of deep water at river flow levels consistent with high levels of TDG generation.
Study_15_Report_March_2013 Page 6
An initial list of potential gas abatement measures Reclamation considered at Bowman Dam are discussed in Section 2.1.3 below. The conclusions in Section 3.0 include recommendations on additional data collection to occur in subsequent phases of this study.
2.0 Results
2.1. Bowman Dam
2.1.1. Physical Structure and Operation
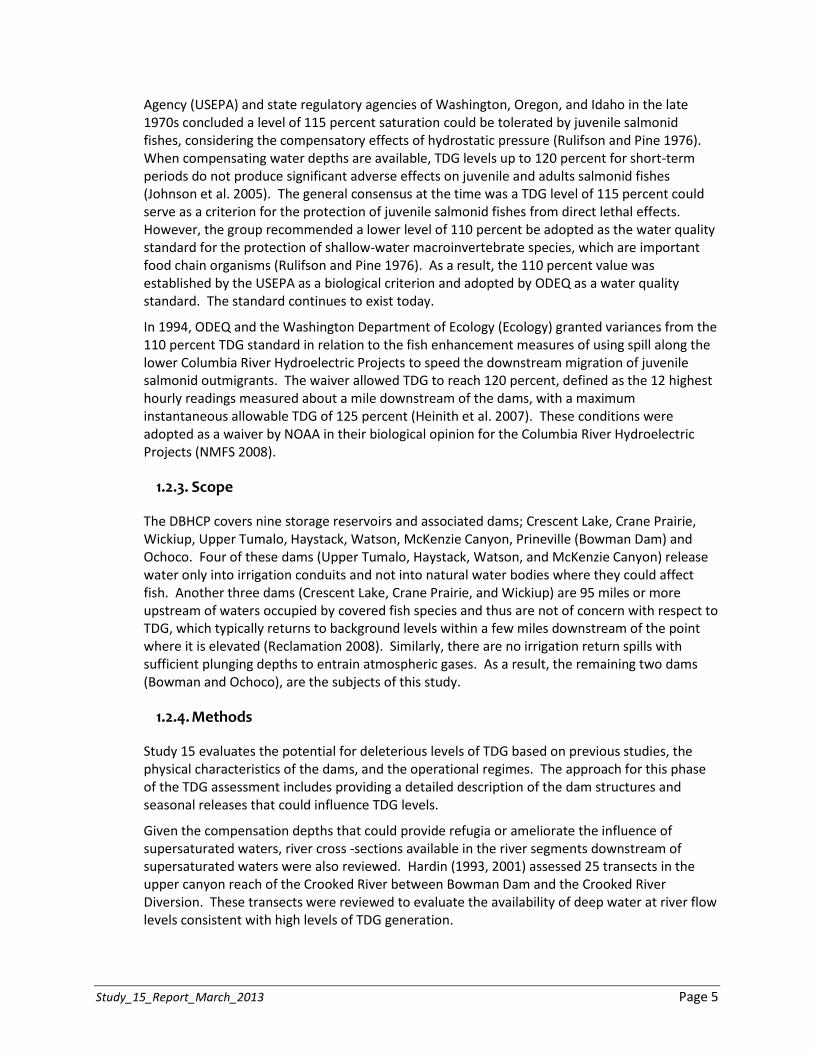
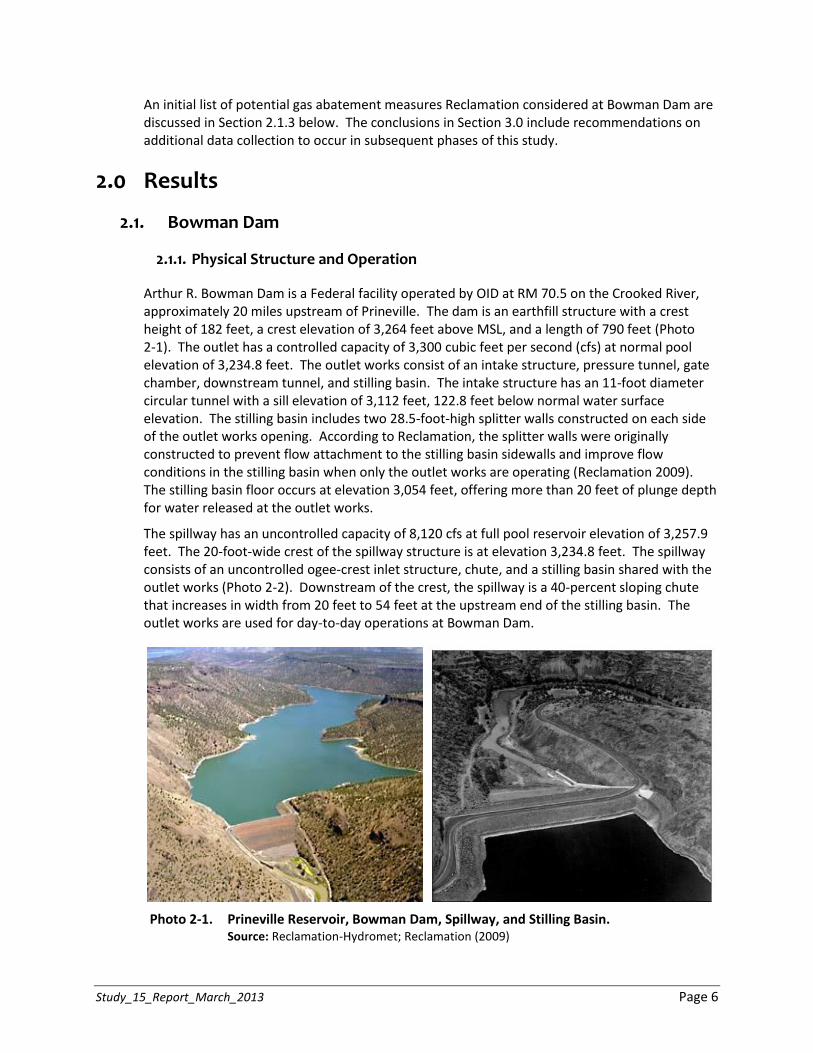
Arthur R. Bowman Dam is a Federal facility operated by OID at RM 70.5 on the Crooked River, approximately 20 miles upstream of Prineville. The dam is an earthfill structure with a crest height of 182 feet, a crest elevation of 3,264 feet above MSL, and a length of 790 feet (Photo 2-1). The outlet has a controlled capacity of 3,300 cubic feet per second (cfs) at normal pool elevation of 3,234.8 feet. The outlet works consist of an intake structure, pressure tunnel, gate chamber, downstream tunnel, and stilling basin. The intake structure has an 11-foot diameter circular tunnel with a sill elevation of 3,112 feet, 122.8 feet below normal water surface elevation. The stilling basin includes two 28.5-foot-high splitter walls constructed on each side of the outlet works opening. According to Reclamation, the splitter walls were originally constructed to prevent flow attachment to the stilling basin sidewalls and improve flow conditions in the stilling basin when only the outlet works are operating (Reclamation 2009). The stilling basin floor occurs at elevation 3,054 feet, offering more than 20 feet of plunge depth for water released at the outlet works.
The spillway has an uncontrolled capacity of 8,120 cfs at full pool reservoir elevation of 3,257.9 feet. The 20-foot-wide crest of the spillway structure is at elevation 3,234.8 feet. The spillway consists of an uncontrolled ogee-crest inlet structure, chute, and a stilling basin shared with the outlet works (Photo 2-2). Downstream of the crest, the spillway is a 40-percent sloping chute that increases in width from 20 feet to 54 feet at the upstream end of the stilling basin. The outlet works are used for day-to-day operations at Bowman Dam.
Photo 2-1. Prineville Reservoir, Bowman Dam, Spillway, and Stilling Basin. Source: Reclamation-Hydromet; Reclamation (2009)
Study_15_Report_March_2013 Page 7
Photo 2-2. Arthur R. Bowman spillway and stilling basin showing location of splitter walls.
Source: Reclamation (2009)
Prineville Reservoir has a total volume of 150,216 acre-feet and a current storage capacity of 148,633 acre-feet as determined by a sedimentation study completed in 1998. Surface area at full pool is 3,028 acres. Maximum fill capacity is reached in an average of 8 out of 10 years. A maximum of 250 cfs of water is released from Prineville Reservoir into the Crooked River at Bowman Dam for downstream diversion by OID and its patrons. Any additional releases occur for reservoir management and flood control as directed by USACOE.
The spillway is used for flood control purposes during spring runoff at a frequency of 3 out of every 4 years since 1992. Spill management from Prineville Reservoir runs approximately 1 month during the spring runoff period to reduce the potential of flood flow releases. These occurrences equate to a daily spill frequency rate of 9 percent per annum. All of the flow releases over the spillway are for flood control operations. The management goal is to slowly release the water for spillway maintenance purposes. The management approach is to keep flows in the spillway to less than 1 foot deep, or less than 75 cfs. In practice, these spills range between 10 and 20 cfs (Rhoden, pers. comm. 2012). Nevertheless, there are times during storm events when the spillway has more than 1 foot of water depth.
2.1.2. Evaluation of TDG
In April 1989, signs of gas bubble disease were observed in over 80 percent of the redband trout captured during electrofishing surveys conducted by ODFW in the Crooked River below Bowman Dam (Reclamation 2008). In April of 2006, ODFW similarly observed signs of gas bubble disease in fish in the lower Crooked River (Reclamation 2008, Nesbit 2010).
When water is released through the outlet works or over the spillway, air is entrained in the plunging flows in the stilling basin, increasing the level of TDG in the water (Reclamation 2008,

Study_15_Report_March_2013 Page 8
2009). Flow through the stilling basin can produce TDG levels that exceed Oregon State and Federal water quality standards of 110 percent. Supersaturation levels of 115 -120 percent can injure or kill adult trout if deep water or other refugia are unavailable (Weitkamp 1976; Weitkamp and Katz 1980; Knittel et al. 1980; Stevens et al. 1980; Lund and Heggberget 1985; Mesa and Warren 1997; Johnson et al. 2005).
Three independent studies have measured TDG levels in the Crooked River downstream of Bowman Dam. Reclamation (2008) performed a TDG study at six stations in the lower Crooked River, up to 12 miles downstream from Bowman Dam, throughout 2006 and 2007. They measured TDG levels during dam releases between 229 and 2,900 cfs. At no time during the 2006 – 2007 survey was the spillway in use. Typical flow releases from the outlet works of less than 500 cfs did not generate excessive supersaturation. Field measurements collected by Reclamation indicated a TDG level in the upstream reservoir of 104 percent, while TDG levels just downstream of the stilling basin ranged between 106.4 percent during a 288-cfs release and a peak TDG level of 122.5 percent during a 2,600-cfs release. Reclamation generated a TDG saturation curve for the stilling basin based on linear regression for their 2006 – 2007 measurements, as shown in Figure 2-1 and described in the following equation:
Eqn. 1 Y = 0.0056X + 106.16 R2 = 0.9589 Where: X = River Flow (cfs) Y = TDG (%) R2 = the proportion of TDG (%) variance explained by river flow
Figure 2-1. Linear regression of TDG levels and river discharge in the Bowman Dam tailrace. Source: Reclamation (2008), Nesbit (2010), Sharp (2012)
Study_15_Report_March_2013 Page 9
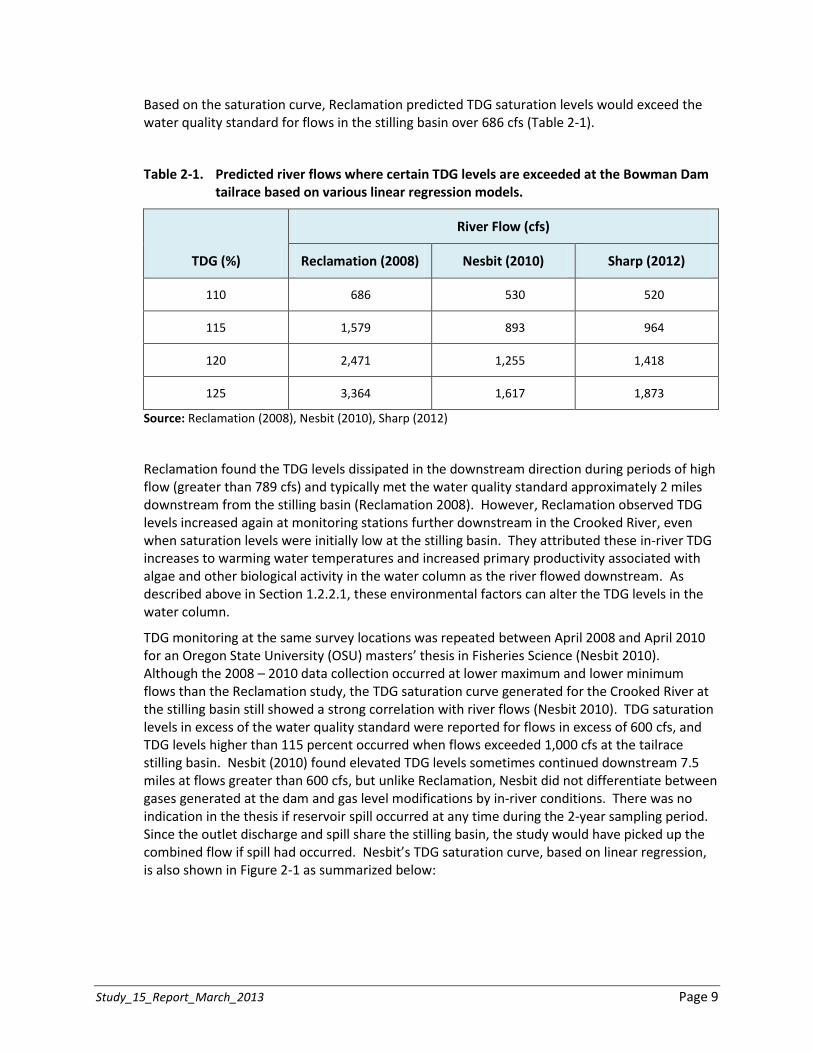
Based on the saturation curve, Reclamation predicted TDG saturation levels would exceed the water quality standard for flows in the stilling basin over 686 cfs (Table 2-1).
Table 2-1. Predicted river flows where certain TDG levels are exceeded at the Bowman Dam tailrace based on various linear regression models.
TDG (%)
River Flow (cfs)
Reclamation (2008) Nesbit (2010) Sharp (2012)
110 686 530 520
115 1,579 893 964
120 2,471 1,255 1,418
125 3,364 1,617 1,873
Source: Reclamation (2008), Nesbit (2010), Sharp (2012)
Reclamation found the TDG levels dissipated in the downstream direction during periods of high flow (greater than 789 cfs) and typically met the water quality standard approximately 2 miles downstream from the stilling basin (Reclamation 2008). However, Reclamation observed TDG levels increased again at monitoring stations further downstream in the Crooked River, even when saturation levels were initially low at the stilling basin. They attributed these in-river TDG increases to warming water temperatures and increased primary productivity associated with algae and other biological activity in the water column as the river flowed downstream. As described above in Section 1.2.2.1, these environmental factors can alter the TDG levels in the water column.
TDG monitoring at the same survey locations was repeated between April 2008 and April 2010 for an Oregon State University (OSU) masters’ thesis in Fisheries Science (Nesbit 2010). Although the 2008 – 2010 data collection occurred at lower maximum and lower minimum flows than the Reclamation study, the TDG saturation curve generated for the Crooked River at the stilling basin still showed a strong correlation with river flows (Nesbit 2010). TDG saturation levels in excess of the water quality standard were reported for flows in excess of 600 cfs, and TDG levels higher than 115 percent occurred when flows exceeded 1,000 cfs at the tailrace stilling basin. Nesbit (2010) found elevated TDG levels sometimes continued downstream 7.5 miles at flows greater than 600 cfs, but unlike Reclamation, Nesbit did not differentiate between gases generated at the dam and gas level modifications by in-river conditions. There was no indication in the thesis if reservoir spill occurred at any time during the 2-year sampling period. Since the outlet discharge and spill share the stilling basin, the study would have picked up the combined flow if spill had occurred. Nesbit’s TDG saturation curve, based on linear regression, is also shown in Figure 2-1 as summarized below:

Study_15_Report_March_2013 Page 10
Eqn. 2 Y = 0.0138X + 102.68 R2 = 0.9635 Where: X = River Flow (cfs) Y = TDG (%) R2 = the proportion of TDG (%) variance explained by river flow
The trend lines through the Nesbit (2010) and Reclamation (2008) data points are somewhat consistent in the low range of river releases from Bowman Dam, but they deviate markedly above 1,000 cfs (Figure 2-1). The slope of Reclamation’s regression line is less steep than Nesbit’s.
Recently, Normandeau Associates, Inc. collected TDG data in the Crooked River near Bowman Dam during October 2011 and in April and May 2012 (Sharp 2012). As summarized in Table 2-1 and shown in Figure 2-1, the monitoring results and TDG saturation curves are similar to data reported by Nesbit (2010), even though Normandeau’s tailrace sampling location was 200 feet downstream of the previous studies. Similar to the other surveys, the recent data showed a strong linear relationship between TDG and stream discharge. The lowest TDG level of 106.1 percent was measured on May 10, 2012 at a release of 261 cfs, while the highest TDG value (122.7% saturation) was recorded during high flows of 1,677 cfs on April 23, 2012 (Sharp 2012). Normandeau’s TDG saturation curve, based on linear regression, is summarized below in Equation 3:
Eqn. 3 Y = 0.011X + 104.4 R2 = 0.9427 Where: X = River Flow (cfs) Y = TDG (%)
R2 = the proportion of TDG (%) variance explained by river flow.
Water depths available for refugia from high TDG levels in this segment of the Crooked River increase with river flow. Water depths were evaluated based on river cross sections in the Upper Canyon. Twenty-five cross sections were collected during instream flow studies (Hardin 1993, 2001). Range and mean maximum depths for pool, glide, and riffle habitat types at 500 cfs are shown in Table 2-2. As expected, mean water depths increase sequentially from riffle to pool habitat features. The mean of the maximum transect depths, weighted by habitat frequencies in the Upper Canyon reach, is approximately 4.9 feet (1.5m) representing the potential for a 15 percent reduction in TDG levels based on increased hydrostatic pressure as shown in Figure 1-2. The original cross sections were not measured with high flows in mind, so the maximum amount of water that can be measured within the elevations of the cross-sections is approximately 500 cfs. The three model-predicted TDG levels at 500 cfs are 109, 110, and 110 percent saturation, at the surface of the river (Table 2-3). These levels are not necessarily a concern for covered fish species. The predicted TDG levels at 1,000 cfs of 112, 116, and 115 percent saturation, are in the neighborhood of reported gas pressures with a potential of adverse influences to fish (Table 2-3). However, available compensation depths in the river at 1,000 cfs may reduce the potential influence to covered fish species. The information suggests somewhere between 2,000 and 2,500 cfs river flow, the TDG generation reported at the water surface likely would exceed the refuge offered to fish by sounding to maximum depths.

Study_15_Report_March_2013 Page 11
Table 2-2. Crooked River depths available at 500 cfs in the Upper Canyon.
Habitat Type
Transects Habitat
Frequency Mean Maximum Depth Depth Range
(#) (%) (feet) (meters) (feet) (meters)
Riffle 12 48% 4.1 1.2 2.7 – 6.1 0.8 – 1.9
Glide 9 48% 5.7 1.7 3.4 – 8.4 1.0 – 2.6
Pool 4 4% 7.9 2.4 5.7 – 12.0 1.7 – 3.7
Source: Hardin (1993, 2001)
Table 2-3. Predicted TDG levels at 500 cfs increments of river flow at the Bowman Dam tailrace based on various linear regression models.
Flow (cfs) TDG Prediction (%)
Reclamation (2008) Nesbit (2010) Sharp (2012)
500 109 110 110
1,000 112 116 115
1,500 115 123 121
2,000 117 130 126
2,500 120 137 132
3,000 123 144 137
Source: Reclamation (2008), Nesbit (2010), Sharp (2012)
2.1.3. Evaluation of TDG Abatement
Reclamation considered several gas abatement alternatives in a 1992 physical model study of Bowman Dam at Reclamation’s Hydraulic Investigations and Laboratory Services facility (Johnson 1992). Design of a shallow, heavily-baffled stilling basin was considered, but this design would not significantly reduce supersaturation and could cause cavitation damage. Installation of a downstream check structure across the entire channel, such as a weir with a roughened downstream ramp, was also considered. The weir would have to create a whitewater riffle to strip entrained air from the water. Due to the flat river gradient, Reclamation concluded this alternative would likely only be effective at stripping gas during low flows when saturation levels do not exceed water quality standards.
Study_15_Report_March_2013 Page 12
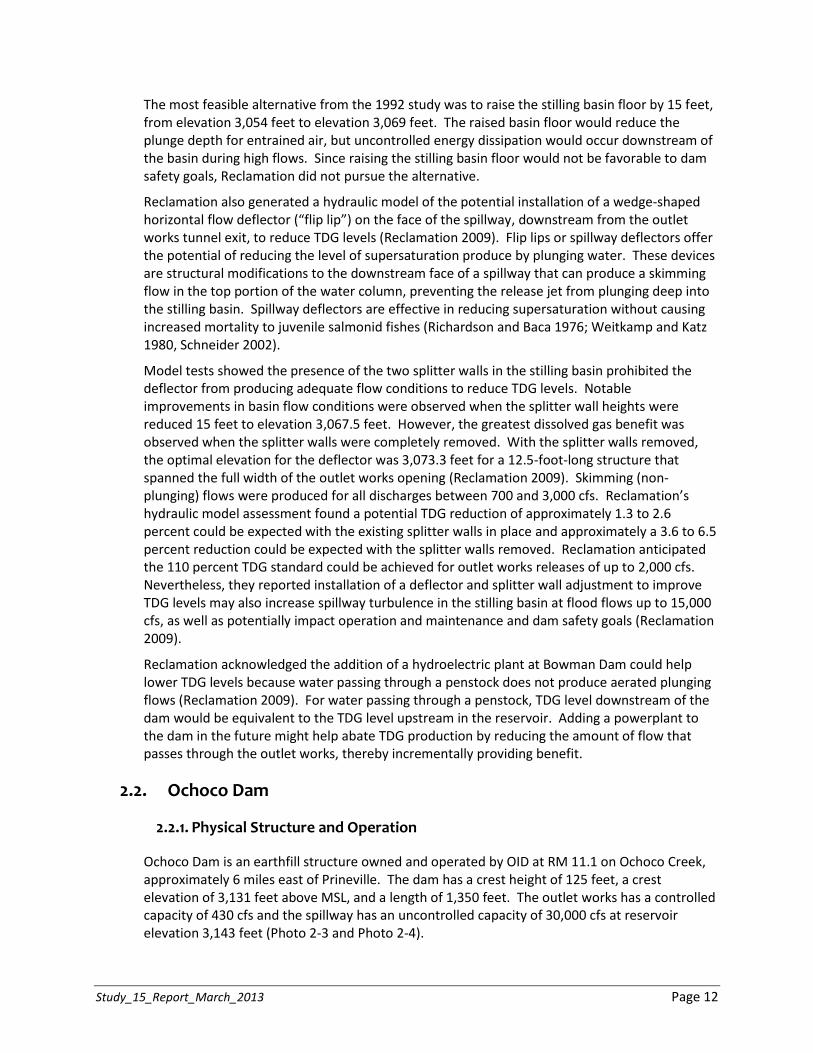
The most feasible alternative from the 1992 study was to raise the stilling basin floor by 15 feet, from elevation 3,054 feet to elevation 3,069 feet. The raised basin floor would reduce the plunge depth for entrained air, but uncontrolled energy dissipation would occur downstream of the basin during high flows. Since raising the stilling basin floor would not be favorable to dam safety goals, Reclamation did not pursue the alternative.
Reclamation also generated a hydraulic model of the potential installation of a wedge-shaped horizontal flow deflector (“flip lip”) on the face of the spillway, downstream from the outlet works tunnel exit, to reduce TDG levels (Reclamation 2009). Flip lips or spillway deflectors offer the potential of reducing the level of supersaturation produce by plunging water. These devices are structural modifications to the downstream face of a spillway that can produce a skimming flow in the top portion of the water column, preventing the release jet from plunging deep into the stilling basin. Spillway deflectors are effective in reducing supersaturation without causing increased mortality to juvenile salmonid fishes (Richardson and Baca 1976; Weitkamp and Katz 1980, Schneider 2002).
Model tests showed the presence of the two splitter walls in the stilling basin prohibited the deflector from producing adequate flow conditions to reduce TDG levels. Notable improvements in basin flow conditions were observed when the splitter wall heights were reduced 15 feet to elevation 3,067.5 feet. However, the greatest dissolved gas benefit was observed when the splitter walls were completely removed. With the splitter walls removed, the optimal elevation for the deflector was 3,073.3 feet for a 12.5-foot-long structure that spanned the full width of the outlet works opening (Reclamation 2009). Skimming (non-plunging) flows were produced for all discharges between 700 and 3,000 cfs. Reclamation’s hydraulic model assessment found a potential TDG reduction of approximately 1.3 to 2.6 percent could be expected with the existing splitter walls in place and approximately a 3.6 to 6.5 percent reduction could be expected with the splitter walls removed. Reclamation anticipated the 110 percent TDG standard could be achieved for outlet works releases of up to 2,000 cfs. Nevertheless, they reported installation of a deflector and splitter wall adjustment to improve TDG levels may also increase spillway turbulence in the stilling basin at flood flows up to 15,000 cfs, as well as potentially impact operation and maintenance and dam safety goals (Reclamation 2009).
Reclamation acknowledged the addition of a hydroelectric plant at Bowman Dam could help lower TDG levels because water passing through a penstock does not produce aerated plunging flows (Reclamation 2009). For water passing through a penstock, TDG level downstream of the dam would be equivalent to the TDG level upstream in the reservoir. Adding a powerplant to the dam in the future might help abate TDG production by reducing the amount of flow that passes through the outlet works, thereby incrementally providing benefit.
2.2. Ochoco Dam
2.2.1. Physical Structure and Operation
Ochoco Dam is an earthfill structure owned and operated by OID at RM 11.1 on Ochoco Creek, approximately 6 miles east of Prineville. The dam has a crest height of 125 feet, a crest elevation of 3,131 feet above MSL, and a length of 1,350 feet. The outlet works has a controlled capacity of 430 cfs and the spillway has an uncontrolled capacity of 30,000 cfs at reservoir elevation 3,143 feet (Photo 2-3 and Photo 2-4).

Study_15_Report_March_2013 Page 13
Photo 2-3. Ochoco Dam and Spillway. Source: Reclamation, Hydromet
Photo 2-4. Ochoco Dam Spillway at an average grade of 9.6 percent.

Study_15_Report_March_2013 Page 14
Ochoco Reservoir has a total volume of 44,330 acre-feet and an active storage capacity of 43,520 acre-feet, but 5,266 acre-feet of the active storage are only accessible by pumping. At full pool (elevation 3,130.7 ft.), the reservoir has a surface area of approximately 1,060 acres. On average, full pool is reached in only about 4 years out of 10 because Ochoco Creek flow consists almost entirely of snow melt and surface runoff that are quite variable from year to year.
Controlled release from the dam occurs through an outlet works located in the reservoir. A 60-inch I.D. horizontal intake steel pipe with a trash rack and an inlet transition at elevation of 3,074.94 feet leads to a control tower. The tower is a vertical 8.0-foot I.D. concrete cylinder, founded on the base of the reservoir. Water enters the intake pipe, flows down through the vertical shaft of the tower, and exits through the outlet pipe.
The controlled outlet at Ochoco Dam is located 56 feet below the normal pool elevation. Water released from the reservoir flows directly through the dam into the Ochoco Main Canal by dropping less than 32 feet. The outlet pipe is a 44-inch I.D. circular steel pipe approximately 459 feet long. The upstream end of the pipe is grouted into the original horseshoe-shaped tunnel to create a water tight seal. The outlet pipe terminates at a 3-foot by 3-inch square hydraulically operated high pressure regulating slide gate, located in the control house at the downstream side of the dam. This gate regulates flow through the conveyance pipe. The regulating gate cannot be operated at less than a 2-inch opening.
A 14-inch bypass pipe, controlled by two 14-inch high-pressure butterfly valves, provides a bypass around the regulating gate. This system is typically used for flows less than 20 cfs during the non-irrigation season, and it provides a fire protection tap and irrigation water for the dam- tender’s residence.
Flows passing through the regulating gate and/or the bypass pipe enter a stilling basin at the upstream end of the Ochoco Main Canal. The Ochoco Main Canal leads from the stilling basin to the OID Canal System to convey irrigation releases. A portion of the released water is spilled from the canal about 230 feet downstream from the control house into Ochoco Creek (Photo 2-5). This facility is combined with a check structure in the canal, and consists of a reinforced concrete weir, chute, and flip bucket. Flashboards at the top of the weir provide control of releases to the Ochoco Creek. The drop from the canal to the creek is approximately 20 feet in an angled concrete spillway to an apron that serves as a ‘flip lip’-style flow deflector. The spill continues to drop an additional 5 feet to boulder-sized rip-rap that serve as further energy dissipaters. There is no deep plunge pool to assist in the entrainment of gases.
A concrete spillway is located along the left bank of the dam crest, consisting of a three-level uncontrolled overflow crest. The overall width of the spillway is 275 feet. The three crest sections, from left to right (looking downstream) are: 1) 54 feet long at elevation 3,131.8 feet; 2) 71 feet long at elevation 3,131.3 feet; and 3) 150 feet long at elevation 3,130.7 feet. Water flows over the crest into a 3-stage stilling basin that leads back to Ochoco Creek. The spillway has only been used twice in the past 20 years. These occurrences equate to a 0.05 percent daily spill frequency. The spillway has not been used to convey stormwater flows since a 3-day storm during the month of May 1998 (Rhoden, pers. comm. 2012).
Study_15_Report_March_2013 Page 15
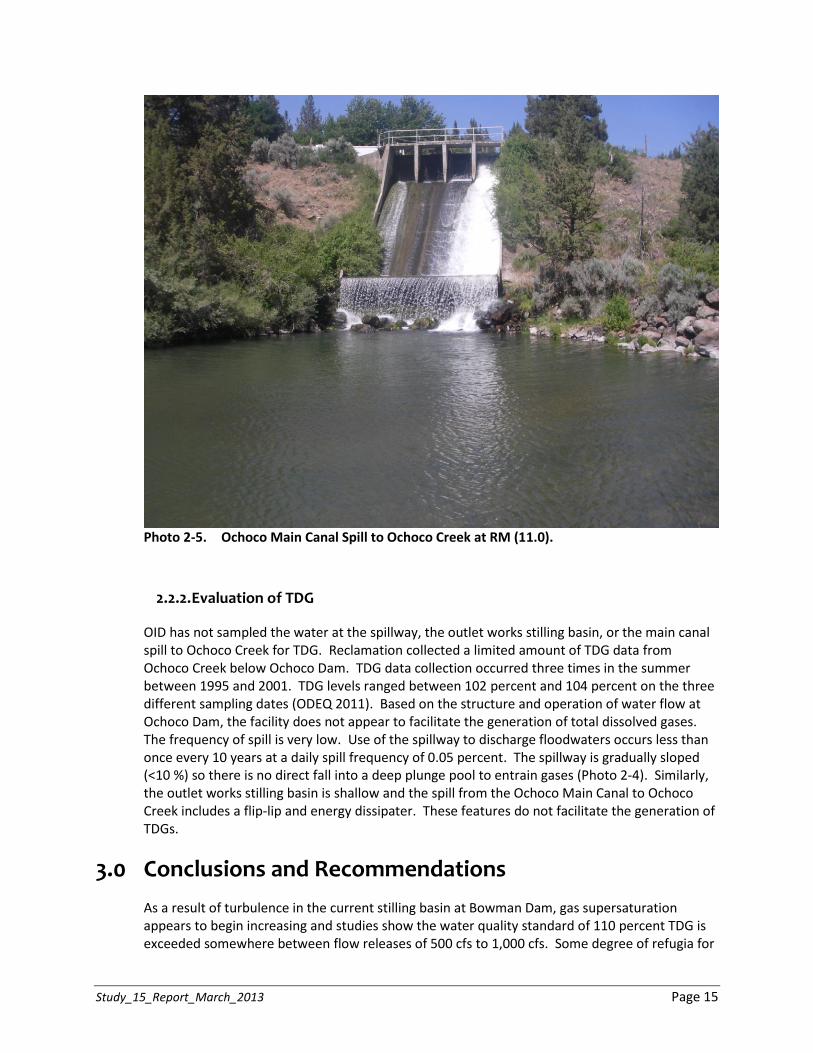
Photo 2-5. Ochoco Main Canal Spill to Ochoco Creek at RM (11.0).
2.2.2. Evaluation of TDG
OID has not sampled the water at the spillway, the outlet works stilling basin, or the main canal spill to Ochoco Creek for TDG. Reclamation collected a limited amount of TDG data from Ochoco Creek below Ochoco Dam. TDG data collection occurred three times in the summer between 1995 and 2001. TDG levels ranged between 102 percent and 104 percent on the three different sampling dates (ODEQ 2011). Based on the structure and operation of water flow at Ochoco Dam, the facility does not appear to facilitate the generation of total dissolved gases. The frequency of spill is very low. Use of the spillway to discharge floodwaters occurs less than once every 10 years at a daily spill frequency of 0.05 percent. The spillway is gradually sloped (<10 %) so there is no direct fall into a deep plunge pool to entrain gases (Photo 2-4). Similarly, the outlet works stilling basin is shallow and the spill from the Ochoco Main Canal to Ochoco Creek includes a flip-lip and energy dissipater. These features do not facilitate the generation of TDGs.
3.0 Conclusions and Recommendations
As a result of turbulence in the current stilling basin at Bowman Dam, gas supersaturation appears to begin increasing and studies show the water quality standard of 110 percent TDG is exceeded somewhere between flow releases of 500 cfs to 1,000 cfs. Some degree of refugia for
Study_15_Report_March_2013 Page 16
covered fish species is available in the river, based on compensation depths, upward to approximately 2,000 cfs of river discharge. ODFW and others have noted signs of GBD in resident redband trout and whitefish downstream of Bowman Dam some years during high flow releases. This study review suggests TDG generation is apparently a concern for covered fish species at Bowman Dam via gas entrainment from turbulence in the stilling basin whenever the combination of reservoir outflow or spill initially exceeds 500 cfs, and certainly when the outflow exceeds 2,000 cfs. Flow releases at the dam only exceed 250 cfs during periods of reservoir and flood control management. At present, flood control operations are not a DBHCP covered activity. Therefore, there are no DBHCP recommendations with respect to potential TDG conservation measures at Bowman Dam.
Based on project configurations, spill frequency, and physical conditions in the receiving water near Ochoco Dam, it is unlikely substantial increases in TDG levels in Ochoco Creek are generated. Limited measurements performed by Reclamation confirm this assessment. Given the limited nature of existing data collection, additional TDG measurements at the outlet works stilling basin in the main canal prior to the release to Ochoco Creek and at the water quality station immediately downstream of the spill entrance to Ochoco Creek are recommended during a period of maximum releases at the outlet works.
4.0 References
Beeman, J.W., D.A. Venditti, R.G. Morris, D.M. Gadmoski, B.J. Adams, S.P. VanderKooi, T.C. Robinson, and A.G. Maule. 2003. Gas bubble disease in resident fish below Grand Coulee Dam; Final Report of Research. Western Fisheries Research Center. Columbia River Research Laboratory, Cook, WA.
Beyer, D., B. D’Aoust, and L. Smith. 1976. Responses of coho salmon (Oncorhynchus kisutch) to supersaturation at one atmosphere, p. 47 - 50 In D.H. Fickeisen and M.J. Schneider (editors), Gas bubble disease. CONF-741033. Technical Information Center, Energy Research and Development Administration, Oak Ridge, TN.
Colt, J. 1984. Computation of dissolved gas concentrations in water as a function of temperature, salinity and pressure. American Fisheries Society, Bethesda, Md. Special Publication. 14: 154pp.
Colt, J. 1986. Gas supersaturation-impact on the design and operation of aquatic systems. Aquaculture Engineering (5): 49-85.
Colt, J., G. Bouck, and L. Fidler. 1986. Review of current literature and research on gas supersaturation and gas bubble trauma. American Fisheries Society, Bioengineering Section, Special Publication Number 1.
Dawley, E.M., M. Schiewe, and B. Monk. 1976. In D.H. Fickeisen and M.J. Schneider (editors), Gas bubble disease, p. 1-11. CONF-741033. Technical Information Center, Energy Research and Development Administration, Oak Ridge, TN.
Ebel, W.J., H.L. Raymond, G.E. Monan, W.E. Farr, and G.K. Tanonaka. 1975. Effects of atmospheric gas supersaturation caused by dams on salmon and steelhead trout of the Snake and Columbia Rivers. National Marine Fisheries Service, Northwest Fisheries Center, Seattle, WA.

Study_15_Report_March_2013 Page 17
Elston, R., J. Colt, S. Abernethy, and W. Maslen. 1997. Gas bubble reabsorption in Chinook salmon: pressurization effects. Journal of Aquatic Animal Health 9(4) 371-321.
Hans, K., M. Mesa, and A. Maule. 1999. Rate of disappearance of gas bubble trauma signs in juvenile salmonids. Journal of Aquatic Animal Health 11:383-390.
Hardin, T. 1993. Crooked River Instream Flow Study. Prepared for ODFW, BLM, and BOR. ODFW, Bend Office by Hardin-Davis, Inc. Albany, OR. 18p. +app. June.
Hardin, T. 2001. Physical Habitat for anadromous species in the Crooked River below Bowman Dam. Report prepared for BOR, Boise, ID by Hardin-Davis, Inc. Corvallis, OR, 4p. + tables, figures and app.
Heinith, B., R. Kiefer, R. Boyce, C. LeFleur, and D. Willis. 2007. Technical comments on the U.S. Army Corps of Engineer’s application for a waiver to Oregon’s total dissolved gas standard. State, Federal, and Tribal Fishery Agencies Joint Technical Staff Memorandum. January 31, 2007.
Johnson, P.L. 1992. Modification of the stilling basin at A.R. Bowman Dam, Oregon to Reduce dissolved gas supersaturation. United States Department of the Interior, Bureau of Reclamation. Hydraulic Laboratory Report No. PAP-749.
Johnson, E.L., T.S. Clabough, D.H. Bennett, T.C. Bjorn, C.A. Peery, C.C. Caudill, and L.C. Stuehrenberg. 2005. Migration depths of adult spring and summer Chinook salmon in the lower Columbia and Snake rivers in relation to dissolved gas supersaturation. Transactions of the American Fisheries Society, 134:1213-1227.
Knittel, M.D., G.A. Chapman, and R.R. Garton. 1980. Effects of hydrostatic pressure on steelhead survival in air-supersaturated water. Transactions of the American Fisheries Society. 109:755-759.
Lund, M., and T.G. Heggberget. 1985. Avoidance response of two-year-old rainbow trout to air-supersaturated water: hydrostatic compensation. Journal of Fish Biology 26 (2), 1993-2000.
Marking, L.L. 1987. Gas supersaturation in fisheries: causes, concerns and cures. National Fisheries Research Center, U.S. Fish and Wildlife Service, La Cross, Wisconsin.
May, B. 1973. Evaluation on the effects of gas bubble disease on fish populations in the Kootenia River below Libby Dam. Proceedings of the 53rd Annual Conference Western Association of State Fish and Game Commissioners: 525-540.
Mesa, M.G., and J.J Warren. 1997. Predator avoidance ability of juvenile Chinook salmon subjected to sublethal exposures of gas-supersaturated water. Canadian Journal of Fisheries and Aquatic Sciences. 54: 757-764.
National Marine Fisheries Service (NMFS). 2008. Endangered Species Act Section 7(a)(2) Consultation. Biological Opinion and Magnusson Stevens Fisheries Conservation and Management Act Essential Fish Habitat Consultation. Consultation on remand for the operation of the Federal Columbia River Power System, 11 Bureau of Reclamation Projects in the Columbia Basin, and ESA Section 10(a)(2)(A) Permit for the Juvenile Fish Transportation Program. (Revised and reissued pursuant to court order, NWF v. NMFS, Civ No. CV01-640-RE (D. Oregon)). US Army Corps of Engineers,
Study_15_Report_March_2013 Page 18
Bonneville Power Authority, US Bureau of Reclamation, and National Marine Fisheries Service. F/NWR/2005/05883. Issued May 5, 2008.
Nesbit, S. 2010. Population characteristics and movement patterns of redband trout and mountain whitefish in the Crooked River, Oregon. Oregon State University. Master Thesis. June 2010.
Oregon Department of Environmental Quality (ODEQ). 2011. Water quality status and action plan: Deschutes Basin in: The Health of Oregon Waters. 12-WQ-008 September 2011. 121p. + app.
Richardson, G. and R. Baca. 1976. Physics of dissolved gases and engineering solutions, p. 118-11. In D.H. Fickeisen and M.J. Schneider (editors), Gas bubble disease, p. 24-36. CONF-741033. Technical Information Center, Energy Research and Development Administration, Oak Ridge, TN.
Rulifson, R.L., and R. Pine. 1976. Water Quality Standards. In D.H. Fickeisen and M.J. Schneider (editors), Gas bubble disease, p. 120. CONF-741033. Technical Information Center, Energy Research and Development Administration, Oak Ridge, TN.
Ryan, B.A., E.M. Dawley, and R.A. Nelson. 2000. Modeling the effects of supersaturated dissolved gas on resident aquatic biota in the main-stem Snake and Columbia rivers. North American Journal of Fisheries Management 20: 182-192.
Schneider, M. 2002. Total dissolved gas exchange at Ice Harbor Dam: A historical perspective. Paper presented at: Research & Extension Regional Water Quality Conference 2002 U.S. Army Corps of Engineers Waterway Experiment Station, Dallesport, WA.
Sharp, M. 2012. Draft water quality report, Arthur R. Bowman Dam, Crooked River, Oregon. Normandeau Associates, Inc. Stevenson, Washington. Prepared for Ochoco Irrigation District, Prineville, Oregon. August 2012. 48p.
Shrank, B.P, E.M. Dawley, and B.R. Ryan. 1997. Evaluation of the effects of dissolved gas supersaturation on fish and invertebrates in Priest Rapids Reservoir, and downstream from Bonneville and Ice Harbor Dams, 1995. Northwest Fisheries Science Center, 2725 Montlake Boulevard East, Seattle, Washington 98112.
Stevens, D.G., A.V. Nebeker, and R.J. Baker. 1980. Avoidance responses of salmon and trout to air-supersaturated water. Transactions of the American Fisheries Society 109:751-754.
U.S. Bureau of Reclamation (Reclamation). 2008. Total dissolved gas monitoring - Summary Report, Crooked River, Oregon, 2006 and 2007. Reclamation, Managing Water in the West. Pacific Northwest Region. Boise, Oregon. November, 2009.
U.S. Bureau of Reclamation (Reclamation). 2009. Hydraulic model study of Arthur R. Bowman Dam Total Dissolved Gas Deflector. Reclamation, Managing Water in the West. Hydraulic investigations and Laboratory Services. Denver, Colorado. May, 2009.
Weitkamp, D.E. 1976. Dissolved gas supersaturation: live cage bioassays at Rock Island Dam, WA. In D.H. Fickeisen and M.J. Schneider (editors), Gas bubble disease, p. 24-36. CONF-741033. Technical Information Center, Energy Research and Development Administration, Oak Ridge, TN.

Study_15_Report_March_2013 Page 19
Weitkamp, D.E., and M. Katz. 1980. A review of dissolved gas supersaturation literature. Transactions of the American Fisheries Society 109: 659-702.
Weitkamp, D.E., R.D. Sullivan, T. Swant, and J. DosSantos. 2003a. Behavior of resident fish relative to total dissolved gas supersaturation in the lower Clark Fork River. Transactions of the American Fisheries Society 132: 856-864.
Weitkamp, D.E., R.D. Sullivan, T. Swant, and J. DosSantos. 2003b. Gas bubble disease in resident fish of the lower Clark Fork River. Transactions of the American Fisheries Society 132: 865-876.
Additional Literature Ebel, W.J., and R. McConnell. 1976. Biological studies: field orientations. p. 114-115 In D.H. Fickeisen
and M.J. Schneider (editors), Gas bubble disease. CONF-741033. Technical Information Center, Energy Research and Development Administration, Oak Ridge, TN.
Meekin, T.K., and B.K. Turner. 1974. Tolerance of salmonid eggs, juveniles and squawfish to supersaturated nitrogen. Washington Department of Fisheries Technical Report 12: 78-126.
Mesa, M.G., L.K. Weiland, and A.G. Maule. 2000. Progression and severity of gas bubble disease in juvenile salmonids. Transactions of the American Fisheries Society. 129: 174-185.
Rucker, R.P., and P.M. Kangas. 1974. Effects of nitrogen supersaturated water on coho and Chinook salmon. The Progressive Fish-Culturist 36: 152-156.
Schneider, M., J. Carroll, C. Schneider, and K. Barko. 2003. Total dissolved gas exchange at Bonneville Dam, 2002 spill season. CEERDC-CHL Memorandum for Record. U.S. Army Engineer Waterways Experiment Station, Vicksburg, MS:
Stuart, A. M., D. Grover, T.K. Nelson, and S.L. Theisfeld. 2007. Redband trout investigations in the Crooked River Basin. Pages 76-91 in R.K Schroeder and J.D. Hall (editors). Redband trout: Resilience and challenge in a changing landscape. Oregon Chapter, American Fisheries Society, Corvallis.
Symbiotics, 2004. Arthur R. Bowman, FERC No. 11925, Final License Application Stage 3 Consultation Document. Prepared by Ecosystems Research Institute and NW Power Services, Inc. Logan Utah and Rigby, Idaho.
Weber, D.D., and M.H. Schiewe. 1976. Morphology and function of the lateral in line of juvenile steelhead trout in relation to gas-bubble disease. J. Fish Biology.Vol. 9, 213-233.