description & learning objectives ceteris... · decision-making setting to achieve the...
TRANSCRIPT

P a g e | 1
© LearnBiz Simulations LLP
DESCRIPTION & LEARNING OBJECTIVES
You are about to embark on an exciting journey in the world of experiential learning. ‘Ceteris
Paribus’ is an interactive on-line simulation game that will help you learn economics and develop
management skills. The game requires you to apply economic concepts and business models in a
decision-making setting to achieve the objectives of the firm. As a top-level management executive
you would have to take up to 8 critical decisions – Price, Production, Plant Capacity, Training Budget,
Maintenance Budget, Marketing Budget, R&D Budget and Alternate Channel Development Budget.
The learning objectives of the simulation experience are to-
1. Apply management decisions in a simulated marketplace and economy
2. Understand the “macro picture” of managing a firm and importance of cohesion of all the
functional areas for deliverance of outstanding business results
3. Experience the difficulty of making short & long run decisions in face of uncertainty and
learn the importance of prudent risk taking
4. Effective introspection of financial statements to make key capital and revenue decisions
5. Practice the strategic management process and enhance critical thinking
6. Have fun competing against your peers
The mechanics of playing the game are very simple. At the start of the game, you compete against
firms - all of which are equal in all respects, i.e. all have same price, demand and supply. The other
firms are managed by other players. The general process is to enter your firm's operating decisions
for a given period. Then, in the tournament game, you will advance to the next time period in
accordance to the specified schedule that will be given to you. You must make sure your decisions
are submitted before the specified times otherwise your previous round decisions would get
repeated. (Note: in other games, you will be competing against computer managed firms and will be
able to advance the game by yourself). After end of each period, your decisions are evaluated
relative to the competition and a set of reports are generated for your introspection. Please note,
the firms remain a going concern even at the end of game, so continuous investment is required in
inputs such as R&D, Training etc.
P a g e | 2
© LearnBiz Simulations LLP
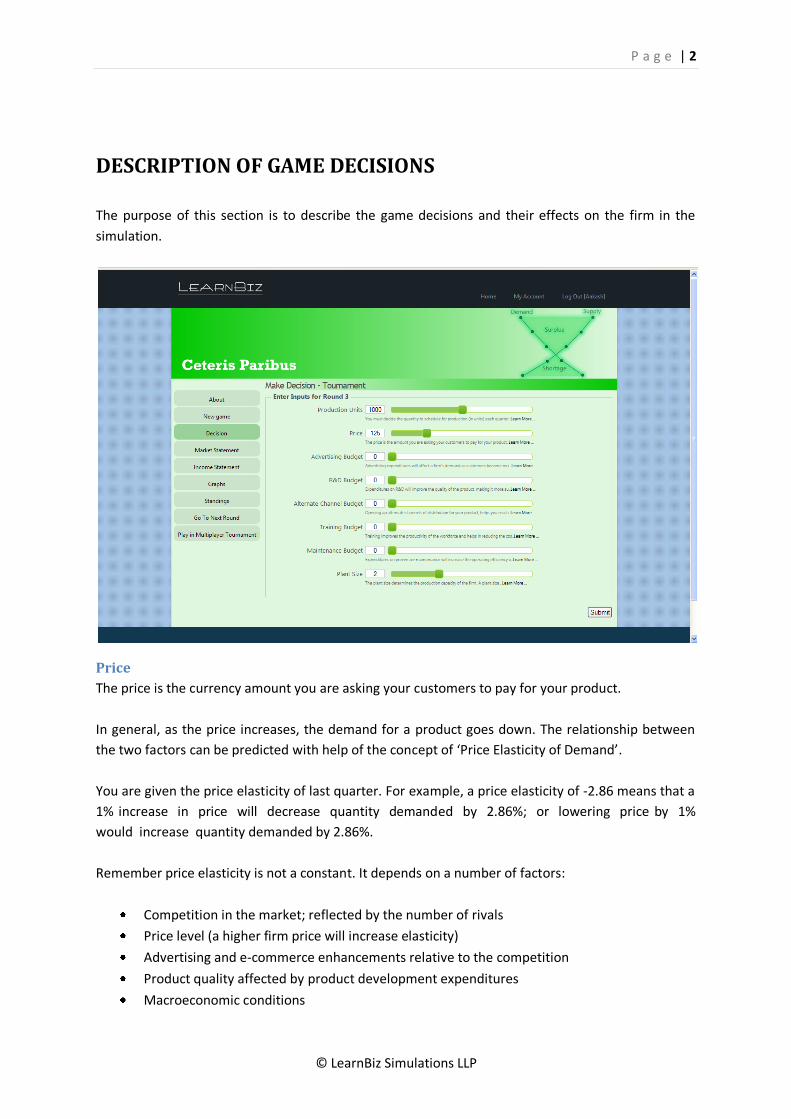
DESCRIPTION OF GAME DECISIONS
The purpose of this section is to describe the game decisions and their effects on the firm in the
simulation.
Price
The price is the currency amount you are asking your customers to pay for your product.
In general, as the price increases, the demand for a product goes down. The relationship between
the two factors can be predicted with help of the concept of ‘Price Elasticity of Demand’.
You are given the price elasticity of last quarter. For example, a price elasticity of -2.86 means that a
1% increase in price will decrease quantity demanded by 2.86%; or lowering price by 1%
would increase quantity demanded by 2.86%.
Remember price elasticity is not a constant. It depends on a number of factors:
Competition in the market; reflected by the number of rivals
Price level (a higher firm price will increase elasticity)
Advertising and e-commerce enhancements relative to the competition
Product quality affected by product development expenditures
Macroeconomic conditions

P a g e | 3
© LearnBiz Simulations LLP
Other factors such as changing consumer preference, demographics, etc.
Studying the market research reports in the game will help in assessment of these factors.
Advertising
Advertising expenditures will affect a firm's demand as customers become more aware of the
product and its advantages. Please note that advertising does not affect sales in the perfect
competition market structure.
The marginal impact of advertising on demand means a hundred currency amount increase in
expenses would be expected to increase demand by the marginal impact. Please note that
advertising is subject to the laws of diminishing returns.
The degree to which advertising activities will increase demand depends on:
Level of advertising
Nature of the market
The amount your rivals spend on advertising
General macroeconomic conditions
Studying the market research report in the game will help you assess these conditions. The
general rule is to increase Marketing expenditures if the estimated marginal revenues exceed the
marginal costs in the long run.
Research & Development (R&D)
Expenditures on R&D will improve the quality of the product, making it more suited to the needs
and wants of the customers. Demand for your product will increase as resources are allocated to
development. Please note that R&D expenditure does not affect sales in the perfect competition
market structure.
The marginal impact of R&D expenditures on demand means a hundred currency amount increase in
expenses would be expected to increase demand by the marginal impact. Please note that R&D
expenditures is subject to the laws of diminishing returns.
The degree to which R&D activities will increase demand depends on-
Level of R&D expenditures
Nature of the market
The amount your rivals spend on R&D expenditures
General macroeconomic conditions

P a g e | 4
© LearnBiz Simulations LLP
Studying the market research report in the game will help you assess these conditions. The
general rule is to increase R&D expenditures if the estimated marginal revenues exceed the marginal
costs in the long run.
Alternate Channel Development
Opening up alternate channels of distribution for your product, helps you reach out better to the
target customer segment. This also leads to an increase in demand. Please note that alternate
channel development expenditure does not affect sales in the perfect competition market structure.
The marginal impact of alternate channel development expenditure on demand means a hundred
currency amount increase in expenses would be expected to increase demand by the marginal
impact. Please note that alternate channel development expenditure is subject to the laws of
diminishing returns.
The degree to which Alternate Channel Development activities will increase demand depends on-
Level of alternate channel development expenditure
Nature of the market
The amount your rivals spend on alternate channel development expenditure
General macroeconomic conditions
Studying the market research report in the game will help you assess these conditions. The
general rule is to increase alternate channel development expenditures if the estimated marginal
revenues exceed the marginal costs in the long run.
Production
You must decide the quantity to schedule for production (in units) each quarter. This decision is
critical if you produce more than is demanded, the excess supply will be carried forward and might
be sold at lower price at a time when production cost could be lower because of learning curve or
economies of scale. If you do not produce enough goods to meet demand you will disappoint your
customers. There is an opportunity cost of lost sales equal to the profits that could have been
earned if you were able to meet demand or if you were able to hike your price in anticipation of
stock-shortfall!!!
The maximum production depends on the firm's plant size. But production efficiency changes with
the level of production. A list of the designed production levels for each plant size will be given.
The general rule in economics is to change production as long as the marginal revenues (MR) exceed
the marginal costs (MC).

P a g e | 5
© LearnBiz Simulations LLP
Preventive Maintenance
Expenditures on preventive maintenance will increase the operating efficiency of both capital and
labor.
It is recommended to increase expenditures as long as the incremental (marginal) savings
exceed the incremental (marginal) costs. Please note that there are diminishing returns to these
expenditures.
Plant Size
The plant size determines the production capacity of the firm. A plant size of 1 means a production
capacity of 1000 units. The starting plant size is 2. You may increase or decrease the plant size by up
to 2 times per period. This change in plant size does not occur immediately, it takes one period to
increase or reduce the plant size. This means that in the short-run you are constrained to operate
with a given plant size.
Plant Size
AVC at 50%
Utilization
MC at 50%
Utilization
AVC at 100%
Utilization
MC at 100%
Utilization
1 31.20 29.46 29.58 26.48
2 30.98 29.97 30.02 28.14
3 30.68 30.36 30.37 29.74
4 30.30 30.61 30.61 31.23
5 29.84 30.72 30.73 32.58
6 29.56 31.24 31.31 35.04
7 29.40 32.08 32.28 38.66
8 29.30 33.14 33.59 43.47
9 29.20 34.30 35.16 49.50
10 29.35 35.89 37.39 57.59
11 29.45 37.48 39.85 67.22
12 29.82 39.59 43.16 79.90
13 30.12 41.65 46.75 94.69
14 30.31 43.57 50.52 111.42
15 30.36 45.23 54.32 129.69
*The table is indicative. The numbers change depending upon Inflation Rate and Training
Expenditures.
Each plant has been designed to produce efficiently at around 50% of the maximum. Thus, the
average and marginal costs rise significantly as production is increased from the maximum efficiency
level to the maximum production level. Be careful while deciding on the production level!
In selecting the best plant size, a rule of thumb is to increase plant size based on the expected
demand of the firm. If demand is expected to be around 6000 units, it would be much more efficient
to increase plant size to 12.

P a g e | 6
© LearnBiz Simulations LLP
The cost incurred in setting up Plant of Size 1 is $1500. Increasing plant size increases fixed costs.
These costs will increase with inflation. The onus is on the player to track costs as plant size is
increased, to assess economies of scale. Production efficiency will increase with plant size up to a
point (economies) and then decrease (diseconomies).
Training
Training improves the productivity of the workforce and helps in reducing the cost of production.
If the average productivity of labor is X, it means that 1 hour of labor is required to produce X units.
Given a wage rate of Y per hour, the labor costs per unit produced may be calculated as follows:
Labor costs per unit = wage rate / productivity = Y / X
The starting values of Y and X in the game are $7.5 per hour and 0.5 unit per hour respectively.
Please note that Y gets adjusted by Wage Index rate.
It is worthwhile to increase training expenditures as long as the reduction in labor costs exceeds the
training expenditures. Please not that there are diminishing returns to labor productivity as training
increases.
The savings in these costs should also be considered in a more comprehensive analysis and may be
tracked by reviewing the Profit & Loss Statement of your firm.

P a g e | 7
© LearnBiz Simulations LLP
DESCRIPTION OF REPORTS
You are provided with a set of reports at beginning of each period. These reports will help you
understand your performance and ways to improve the same. It is critical to clearly understand the
reports before you make any decision.
Profit & Loss Statement Net Profit of the firm is the criteria which is used to rank your performance in the game; thereby
making the Profit & Loss Statement the most critical one for your ongoing tracking.
Revenues
Total revenues are the currency amount received from selling the products of the firm. Revenues are
equal to the current selling price multiplied by the units sold.
Costs
This is the sum of Fixed, Variable and the General Overhead expenses.
Taxes
Corporate Income Tax in the game is 30% of Profit before Tax.

P a g e | 8
© LearnBiz Simulations LLP
It is interesting to note that if the Profit before Tax is negative, then the Corporate Income Tax will be
negative. What this means is that the firm will receive a tax rebate.
Net Profit
This is Profit before Tax minus Corporate Income Tax.
Fixed Cost
The Fixed cost changes with change in inflation or the plant size. It is independent of the level of
production.
Utility Cost
This is the cost which varies with the level of production and reflects the usage of materials and
electricity in production of goods. This would increase exponentially depending on capacity
utilization.
Inventory Holding Cost
It is the cost incurred in carrying forward the quantity of goods which remained unsold at the end of
last period.
Labour Cost
This is the cost which varies with the level of production and reflects the usage of labour in
production of goods. A suitable training budget should help in improving the labour productivity.
Advertising
This is equal to advertising budget set by you in the last period.
R & D
This is equal to R & D budget set by you in the last period.
Alternate Channel
This is equal to alternate channel budget set by you in the last period.
Training
This is equal to training budget set by you in the last period.
Maintenance
This is equal to maintenance budget set by you in the last period.

P a g e | 9
© LearnBiz Simulations LLP
Savings
This is equal to savings which resulted because of preventive maintenance expenditure incurred by
you in the last period.
Cumulative Profit
This is the sum of all net profits earned in each period.
Inventory
It is the quantity of goods which remained unsold at the end of last period.
Plant Size
This is the current size of your production plant.
Price
This is the price set by you for your products in the last period.
Demand
The quantity which your customers are willing to buy at your specified price is referred to as
demand.
Units demanded depend on numerous factors relating to the economy, the market structure,
customer and the competition.
Your own decisions regarding price, advertising, random economic events may affect your demand
(such as the change in the price of a substitute good)
Supply
This represents the quantity of units supplied by you in the last period. The maximum possible
supply for a period would be the sum of your inventory and the new production in the period.
Plant Utilization
This represents the quantity of units produced by you with respect to the plant capacity in the last
period. Generally, the plant is most efficient when operated at 50% capacity.
Elasticity
This represents the price elasticity of your goods.

P a g e | 10
© LearnBiz Simulations LLP
Labour Productivity
This represents the number of items which were produced per hour of manual labour.
Marginal Revenue
The impact of price on revenues is measured by marginal revenues. It means that one unit
increase in quantity demanded will increase revenues by the marginal revenue. The marginal
revenue depends on the price elasticity of demand. As the price elasticity increases (becomes more
elastic) the marginal revenue increases and becomes closer to the firm’s price.
A general formula for Marginal Revenue can be-
Marginal Revenue = ((New Price * New Demand) – (Old Price * Old Demand)) / (New Demand – Old
Demand)
Marginal Cost
Costs are also an important factor in setting price. If the price you set does not cover the costs of
production, it is not possible to make a profit. Marginal cost is the total cost incurred on production
of one more unit. Please note that it is different from average cost per unit.
The general rule in economics is to change price as long as the marginal revenues (MR) exceed the
marginal costs (MC)
Marginal Sales – Advertisement
This represents the number of items by which your demand will increase if you spend $1000 more
into advertising than your current budget.
Marginal Sales – R & D
This represents the number of items by which your demand will increase if you spend $1000 more
into R & D than your current budget.
Marginal Sales – Alternate Channel
This represents the number of items by which your demand will increase if you spend $1000 more
into alternate channel than your current budget.
Marginal Savings – Maintenance
This represents the further savings which you can expect to generate if you spend $1000 more into
preventive maintenance than your current budget.

P a g e | 11
© LearnBiz Simulations LLP
Market Statement Market Statement is important to understand the overall market and the likely macroeconomic
changes. Your decisions concerning price, production, plant size, and others, should be modified
based on your assessment of the market conditions. The Market Research Report includes a
Demand and Supply Report for the market and other relevant Economic News.
Market Information
Number of firms in the market is equal to the total number of players in the game
The Market price is the average of price set by all firms in the market
Market Demand is the sum total of demand faced by all firms in the market
Market Supply is the sum of all inventory and new production by all the firms combined
Average Expenses
Advertisement is equal to the average of advertising expenditures of all firms in the game
R & D is equal to the average of R & D expenditures of all firms in the game
Alternate Channel is equal to the average of alternate channel expenditures of all firms in the
game
Training is equal to the average of training expenditures of all firms in the game
Maintenance is equal to the average of maintenance expenditures of all firms in the game

P a g e | 12
© LearnBiz Simulations LLP
Key Macroeconomic factors
The GDP INDEX measures the level of the Gross Domestic Product compared to the base period.
GDP is a measure of total production of goods and services in the economy. If GDP increases from
100 to 104, then the economy would have has grown by 4%. This should increase consumer demand
for goods and services. The GDP FORECAST is an estimate of GDP for next period. The estimate is not
necessarily a correct prediction of the future.
The CONSUMER PRICE INDEX (CPI) measures the average price of consumer goods and services
compared to the base period. If the CPI increases from 100 to 102, then prices in the economy
would have increased by 2%, which is a measure of inflation. An increase in inflation will cause a
higher resource price thereby increasing the cost of doing business. Purchasing power of consumers
will also be reduced with inflation. The CPI FORECAST is an estimate of the CPI for next quarter. The
estimate is not necessarily a correct prediction of the future.
The WAGE INDEX (WI) measures the average wages compared to the base period. If the WI
increases from 100 to 103, then wages in the economy have increased by 3%, which is a measure of
labor costs. This increase the costs of doing business as wage rates rise. On the flip side, purchasing
power of consumers will be increased. The WI FORECAST is an estimate of the WI for next quarter.
The estimate is not necessarily correct prediction of the future.
As an executive, it is up to you to decide how to respond to the information and forecasts.
Just as in the real world, judgment and prudent risk taking must be used.

P a g e | 13
© LearnBiz Simulations LLP
Graphs The Competitive Analysis Report Graphs are available for you to check the performance drivers of
each firm in the game.

P a g e | 14
© LearnBiz Simulations LLP
Standings The Standings lists the profit performance of each firm in the game. The firms are ranked by
cumulative profits.