description of obesity in the mouse - journal of lipid ... · description of obesity in the pbb/ld...
TRANSCRIPT

Description of obesity in the PBB/Ld mouse
S. U. Walkley, C. E. Hunt, R. S. Clements, and J. R. Lindsey Departments of Comparative Medicine and Medicine, University of Alabama in Birmingham, Birmingham, AL 35294
Abstract A new strain of obese mouse, the PBB/Ld, has been studied in terms of fat pad cellularity, serum insulin and blood glucose levels, and response to gold thioglucose injections. Age-matched C57B l/6J mice were used as controls. Adipocyte size and number in the major fat depots were determined at various ages from weanling to maturity in the PBB/Ld and C57B1/6J strains. Results indicated that obesity in the PBB/Ld was due to hyper- trophy of adipocytes in retroperitoneal and subcutaneous fat depots and to hypertrophy and hyperplasia in the epididymal fat pad. PBB/Ld mice also developed hyper- insulinemia and hyperglycemia and these findings have been discussed in terms of the developmental changes in fat pad cellularity. The injection of gold thioglucose led to increased food intake in both PBB/Ld and C57B1/ 6J mice. Hyperphagia was also present in the PBBlLD con- trol group, but increased efficiency of converting calories to body weight was not observed in this group when compared to control C57B l/6J mice. The characteristics of obesity seen in the PBB/Ld mouse are discussed and comparisons are made to similar studies in other rodent models of obesity.
Supplementary key words adipocyte number . adipocyte size plasma insulin hypothalamic obesity
A current approach to the study of obesity is based on the determination of the relative number and size of adipocytes in the major fat depots. By using this technique it has been shown that adipocyte number in the normal adult is fixed in certain laboratory animals (1) and in man (2). Increases in body weight following increased food intake in man (2) or VMN lesioning in rats (1) and mice (3) have been found to result in increased fat cell size without effect on cell number. Weight loss following food restriction in man (4) and laboratory animals (1) has been shown to result in reduction of fat cell size without an accompanying change in cell number. In contrast fat pads from certain rodent models of obesity such as the obese- hyperglycemic mouse (obob) , the New Zealand obese mouse (NZO), and the Zucker rat have been found to contain an increased number of cells whose size is also ab- normally increased (3, 5). Similarly, marked fat cell hyperplasia has been found to contribute to the in-
creased adiposity of early onset obesity in humans (2). These findings have led to obese states being de- scribed as either hypertrophic (increased adipocyte size) or hypertrophic- hyperplastic (increased adipo- cyte size and number) (3).
Earlier studies on the nature of obesity often emphasized the role of food intake regulation. The discovery that the injection of gold thioglucose (GTG) caused hyperphagia and accompanying obesity in a number of different animal species encouraged this approach. The subsequent finding that GTG caused destruction of neurons in the ventromedial nucleus (VMN) of the hypothalamus led to the glucostatic theory of food intake regulation and suggested that a possible malfunction of this regulatory center might be involved in some natural states of obesity (6-8).
The PBB/Ld is a newly discovered rodent model of obesity (9, 10). These mice were derived from ani- mals purchased at a pet store and subsequently studied for inheritance of coat color. A black line of obese mice emerged during inbreeding (Fig. 1). The PBB/Ld now has been brother-sister mated for over 21 generations and limited genetic studies indicate that the obesity is polygenic.
This report examines the cellularity of fat depots in the development of obesity in the PBB/Ld strain, with a concomitant evaluation of serum insulin and blood glucose. The response of the PBB/Ld mice to GTG, in terms of alterations in food intake and weight gain, also is evaluated. These findings are briefiy discussed in terms of similar studies of other rodent models of obesity and the unique characteris- tics of the PBB/Ld strain are illustrated.
METHODS
Fat pad cellularity study Male PBB/Ld mice (from a colony maintained by
the Department of Comparative Medicine) and male
Abbreviations: GTG, gold thioglucose; VMN, ventromedial nucleus; NZO, New Zealand obese; obob, obese-hyperglycemic.
Journal of Lipid Research Volume 19, 1978 335
by guest, on Novem
ber 2, 2018w
ww
.jlr.orgD
ownloaded from
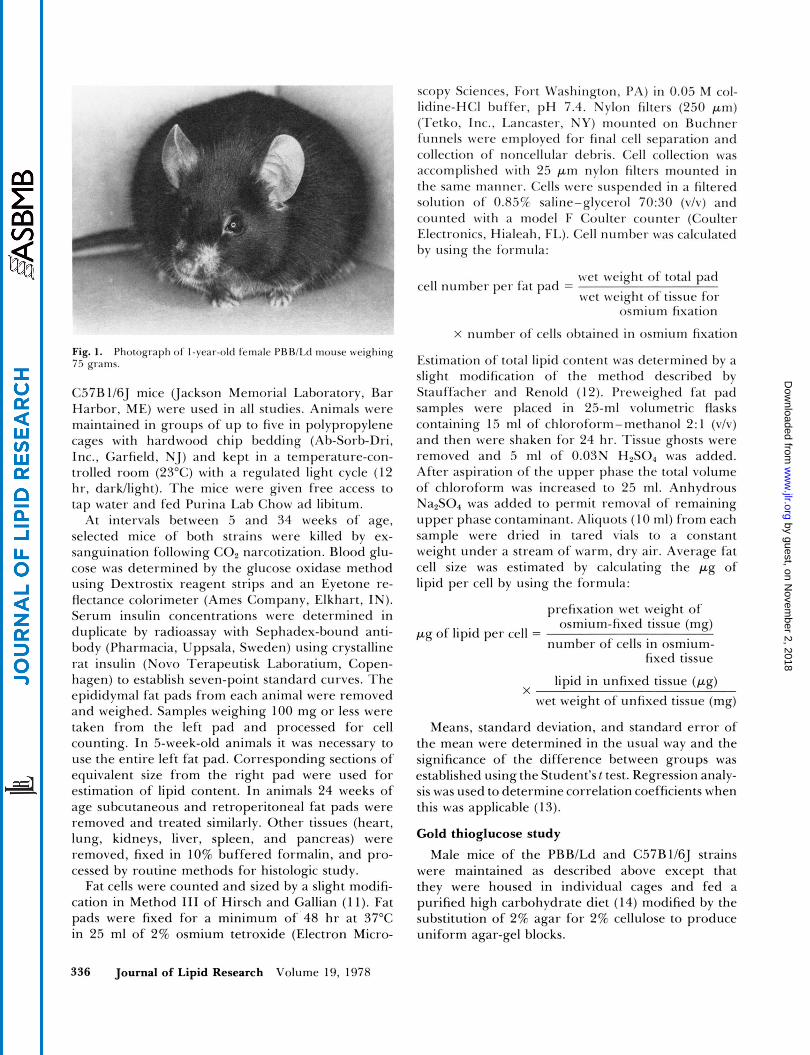
Fig. 1. Photograph of 1-year-old female PRRlLd mouse weighing /:> grams. "
C57B1/6J mice (Jackson Memorial Laboratory, Bar Harbor, ME) were used in all studies. Animals were maintained in groups of up to five in polypropylene cages with hardwood chip bedding (Ab-Sorb-Dri, lnc., Garfield, NJ) and kept in a temperature-con- trolled room (23°C) with a regulated light cycle (12 hr, darkhght). The mice were given free access to tap water and fed Purina Lab Chow ad libitum.
At intervals between 5 and 34 weeks of age, selected mice of both strains were killed by ex- sanguination following C 0 2 narcotization. Blood glu- cose was determined by the glucose oxidase method using Dextrostix reagent strips and an Eyetone re- flectance colorimeter (Ames Company, Elkhart, IN). Serum insulin concentrations were determined in duplicate by radioassay with Sephadex-bound anti- body (Pharmacia, Uppsala, Sweden) using crystalline rat insulin (Novo Terapeutisk Laboratium, Copen- hagen) to establish seven-point standard curves. The epididymal fat pads from each animal were removed and weighed. Samples weighing 100 mg or less were taken from the left pad and processed for cell counting. In 5-week-old animals it was necessary to use the entire left fat pad. Corresponding sections of equivalent size from the right pad were used for estimation of lipid content. In animals 24 weeks of age subcutaneous and retroperitoneal fat pads were removed and treated similarly. Other tissues (heart, lung, kidneys, liver, spleen, and pancreas) were removed, fixed in 10% buffered formalin, and pro- cessed by routine methods for histologic study.
Fat cells were counted and sized by a slight modifi- cation in Method I11 of Hirsch and Gallian (1 1). Fat pads were fixed for a minimum of 48 hr at 37°C in 25 ml of 2% osmium tetroxide (Electron Micro-
scopy Sciences, Fort Washington, PA) in 0.05 M col- lidine-HCI buffer, pH 7.4. Nylon filters (250 p m ) (Tetko, Inc., Lancaster, NY) mounted on Buchner funnels were employed for final cell separation and collection of noncellular debris. Cell collection was accomplished with 25 pm nylon filters mounted in the same manner. Cells were suspended in a filtered solution of 0.85% saline-glycerol 7030 (v/v) and counted with a model F Coulter counter (Coulter Electronics, Hialeah, FL). Cell number was calculated by using the formula:
wet weight of total pad wet weight of tissue for
osmium fixation
cell number per fat pad =
X number of cells obtained in osmium fixation
Estimation of total lipid content was determined by a slight modification of the method described by Stauffacher and Renold (12). Preweighed fat pad samples were placed in 25-ml volumetric flasks containing 15 ml of chloroform-methanol 2:l (v/v) and then were shaken for 24 hr. Tissue ghosts were removed and 5 ml of 0.03N H2S04 was added. After aspiration of the upper phase the total volume of chloroform was increased to 25 ml. Anhydrous Na,SO, was added to permit removal of remaining upper phase contaminant. Aliquots (10 ml) from each sample were dried in tared vials to a constant weight under a stream of warm, dry air. Average fat cell size was estimated by calculating the p g of lipid per cell by using the formula:
prefixation wet weight of osmium-fixed tissue (mg)
number of cells in osmium- fixed tissue
lipid in unfixed tissue (pg) wet weight of unfixed tissue (mg)
Means, standard deviation, and standard error of the mean were determined in the usual way and the significance of the difference between groups was established using the Student'st test. Regression analy- sis was used to determine correlation coefficients when this was applicable (13).
Gold thioglucose study
p g of lipid per cell =
X
Male mice of the PBB/Ld and C57B1/6J strains were maintained as described above except that they were housed in individual cages and fed a purified high carbohydrate diet (14) modified by the substitution of 2% agar for 2% cellulose to produce uniform agar-gel blocks.
336 Journal of Lipid Research Volume 19, 1978
by guest, on Novem
ber 2, 2018w
ww
.jlr.orgD
ownloaded from

At 3 months of age mice of each strain were randomly divided into two groups and fasted for 24 hr. Approximately half of each group was injected intraperitoneally with 0.8 g/kg of a 100 mg/ml solu- tion of gold thioglucose (Sigma Chemical Company, St. Louis, MO) in 0.85% saline. During the next 3 months food intake, weight gain, and blood glucose were monitored at regular intervals. Two months after the injections, glucose tolerance tests were per- formed on animals in each of the four groups. Mice were fasted for 24 hr and blood was col- lected from the tail in order to establish base line blood glucose values. Each animal then received 2 g/kg of a 20% glucose solution in 0.85% saline by intraperitoneal injection; blood was collected 30, 60, 120, and 180 min post-injection. Blood glucose was determined by the glucose oxidase method (Worthington Biochemical Corporation, Freehold, NJ). At 6 months of age the animals were killed by the method previously mentioned and tissues, including brain, were removed and treated by routine histologic methods. Serum insulin concentrations were determined as previously described.
Twenty-four-hour food intake was measured 13 times between days 22 and 60 of the 3-month study. The food remaining after each 24-hr period was dried to a constant weight in a drying oven (1 10°C) and this weight was subtracted from the calculated dry weight of the initial sample to deter- mine the dry weight of food consumed. These weights
were averaged to provide an estimate of the mean daily food intake of each mouse. Daily weight gain was calculated on the basis of difference in the weight of each animal at the beginning and end of the same 38-day period. Food efficiency was deter- mined for each mouse by dividing average daily weight gain by average daily food intake.
RESULTS
Fat pad cellularity study Significant increases in body weight in the C57B 1/
6J mice occurred only until 24 weeks of age, whereas increases in body weight in the PBB/Ld mice oc- curred throughout the 34-week study. The rate of increase in both strains slowed after 11 weeks, with this tendency being greater in the C57B 1/6J mice (Table 1).
Left epididymal fat pad weight in the C57B1/6J mice also increased up to 24 weeks of age but the rate of increase slowed after the first 11 weeks. The epididymal fat pads of PBB/Ld mice increased in weight dramatically until 34 weeks of age with only a slight slowing of the rate of increase at 11 weeks (Table 1). The increases in left epididymal fat pad weight in the C57B1/6J mice appeared to result primarily from hypertrophy of adipocytes, with cell number remaining essentially unchanged after 1 1
TABLE 1. Developmental studies relating cellularity, blood glucose, and insulin in C57BV6J and PBB/Ld mice
No. Left Epididymal Left Epididymal Left Epididymal Animals Age Body Wt. Blood Glucose Insulin Fat Pad Weight Fat Pad Cell Size Fat Pad Cell No.
C57BMJ PBB/Ld
C57BMJ PBB/Ld
C57B116J PBB/Ld
C57B1/6J PPB/Ld
C 5 7B l/6 J PBB/Ld
C57B1/6J PBB/Ld
W h
3 5 5 5
6 8
3 11 5 1 1
3 16 5 16
3 24 5 24
4 34 3 34
g
15.0 t 1.0 18.5 t 0.7b
29.2 2 0.7
24.8 t 0.4 38.6 t 0.6"
26.1 c 1.2 39.8 t 1.2
30.6 ? 0.3 44.3 t 1.7
28.0 c 0.2 50.3 c 1.8
N.D.'
mg/dl
110.0 t 10.0 123 .0 t 3.0d
N.D. 180.0 ? 10.0
121.7 t 4.4 158.0 t 8.7
131.7 c 9.3 167.0 ? 8.6"
135.0 ? 7.6 166.0 t 4.0
157.5 c 2.5 198.3 t 33.4d
pUlml
54.8' 41.8 t 4.1
55.9 t 16.0
39.8 t 7.3 50.7 t 5.0d
38.2' 77.4 t 8.5
41.8 9.3 111.6 t 9.1
N.D.
N.D. N.D.
mg
35.5 t 8.3 30.2 t 3.gd
N.D. 132 .9 t 8.1
141.5 t 22.8 288.1 ? 21.7
138.8 t 4.8 435.2 33.3
234.2 2 37.0 590.7 2 56.7
242.3 t 10.4 801.7 t 90.5
p g lcpldlcell
0.012 c 0.003 0.013 t 0.003d
N.D. 0.073 ? 0.010
0.101' 0.101 t 0.018
0.074 t 0.004 0.143 t 0.01 1
0.132 ? 0.013 0.246 0.024
0.105 t 0.000 0.188 c 0.019
X I 0 6
1.40 c 0.16 1.02 t 0.04'
N.D. 1.62 2 0.25
1.53 0.22 2.76 t 0.31
1.60 c 0.12
1.60 t 0.26 2.14 c 0.18d
2.13 t 0.06 3.97 ? 0.66c
2.88 ? 0.41
All values are significantly different from C57B1/6J mice of the same age at P < 0.01 except as indicated otherwise. Values
P < 0.025. P < 0.050. Not significant.
e Two animals only. ' Not determined.
represent group means t SEM (second value in each pair of numbers).
Walkley et al. Obesity in the PBBlM mouse 337
by guest, on Novem
ber 2, 2018w
ww
.jlr.orgD
ownloaded from

TABLE 2. Cellularity and cell size in three fat depots in adult (24 wk.) C57B1/6J and PBB/Ld mice
Body Wt
Epididymal Fat Pad
Wet Wt Cell Size Cell No.
C57B1/6J no. 25 no. 28 no. 30
mean of group
PBB/Ld no. 23 no. 24 no. 27 no. 29 no. 31
mean of group
30.5 31.2 30.0 30.6
? 0.3
50.8 43.8 42.3 43.7 41.1 44.3"
? 1.7
171.1 299.2 232.4 234.2
? 37.0
690.0 634.6 644.7 614.9 369.2 590.7
? 56.7
clg lzpdIcrl1
0.137 0.152 0.106 0.132 t ,013
0.260 0.320 0.263 0.205 0.180 0.246 t ,024
Xl0'
1.07 1.80 1.95 1.60
& 0.26
2.34 1.74 2.19 2.74 1.85 2.14d
? 0.18
Subcutaneous Fat Pad Retroperitoneal Fat Pad
Wet Wt Cell Size Cell No.
XlOO mg '"g Izpzdlcrll
161.1 0.050 2.52 257.8 0.054 3.85 203.7 0.058 2.53 207.5 0.054 2.97
t- 28.0 ? ,000 ? 0.44
355.5 0.158 1.71 375.4 0.217 1.49 563.9 0.107 4.59 499.5 0.129 3.02 135.7 0.059 1.64 386.0" 0.134' 2.49"
t- 73.6 ,026 t 0.59
Wet Wt Cell Size
mg PLg lipidlcell
94.7 0.038 109.4 0.149 112.3 0.038 105.5 0.075 f. 5.4 t ,037
394.6 0.216 283.5 0.277 335.5 0.301 315.3 0.150 193.9 0.112 304.6 0.211'
5 33.1 ? ,036
Cell No.
x 10'
2.07 0.62 2.53 1.74
2 0.57
1.48 0.88 0.96 1.84 1.46 1.32
t 0.18 ~~ -
" All values are significantly different from C57B1/6J at P < 0.01 except as indicated otherwise. Values represent group means * SEM
* P < 0.025. r P < 0.050.
(second value in each pair of numbers).
Not significant.
weeks of age. Increased weight of this fat pad in the PBB/Ld mice could be accounted for by increases in both adipocyte number and size (Table 1).
Retroperitoneal and subcutaneous fat pad weights of 24week-old PBB/Ld mice generally exceeded those of C57B1/6J mice of the same age. Cell size was found to be markedly larger in these fat depots in the PBB/Ld mice but fat cell number was generally less than that of the C57B1/6J mice (Table 2).
lncreases in the mean blood glucose concentration were observed in both strains as age increased, with the levels generally being greater in the adult PBB/Ld mice (Table 1). Whereas the insulin con- centration was not observed to increase with age in the C57B1/6J strain, a progressive increase was ob- served in the PBB/Ld mice (Table 1). Regression analysis indicates that fat cell size and insulin concentration correlate significantly in the PBB/Ld mouse (Table 3).
Gold thioglucose study Hypothalami from the GTG-injected mice con-
tained lesions of variable extent consisting of col- lapse, pigment (lipofuscin?) accumulation, and glial scarring in the area of the ventromedial nuclei. Although disruption of the nucleus occurred both unilaterally and bilaterally, complete bilateral VMN destruction was not seen. The ventral portions of the VMN were more commonly affected with the lesion often extending to the area of the infundibulum. There were no discernable light microscopic dif- ferences in the lesions of GTG-injected PBB/Ld and C57B1/6J mice, or between the hypothalami of the untreated PBB/Ld and C57B l/6J controls. Vary- ing degrees of fatty change and glycogen accumula- tion were observed in the livers of GTG-treated and untreated PBB/Ld mice. Similar but less extensive changes were seen in GTG-treated C57B 1/6J animals whereas the livers of C57B 1/6J control animals
TABLE 3. Relationship between fat cell size and number and plasma insulin and glucose concentration
Correlation Significance of Strain Regression Equation Coefficient Correlation
Fat cell size PBB y = 272.9~ + 36.5 0.7 P < 0.01 vs. plasma insulin C57BL y = -78 .4~ + 48.9 0.3 N.S."
Fat cell number PBB y = 57.2s + 5.2 0.1 N.S. vs. plasma insulin C57BL y = 3 4 . 5 ~ + 5.5 0.1 N.S.
Blood glucose PBB y = 144.6~ + 0.2 0.3 N.S. vs. plasma insulin C57BL y = 1 2 7 . 7 ~ + 0.1 0.1 N.S.
a Not significant.
338 Journal of Lipid Research Volume 19, 1978
by guest, on Novem
ber 2, 2018w
ww
.jlr.orgD
ownloaded from

TABLE 4. Comparative biochemical and dietary data on the GTG-injected and control C57B1/6J AND PBB/Ld mice
No. Average Food Food Animals Blood glucose Insulin Intake Efficiency
300
200
- E 100
I. C57BV6J (saline injected)
11. C57BV6J (GTG injected)
111. PBB/Ld (saline injected)
IV. PBB/Ld (GTG injected)
(vs. I)
(vs. I)
(vs. I) (vs. 111)
-
-
b-4 PEE- mtrol7animdr av. ut. = 499m -
mgldl
8 174.6 t 4.6"
10 205.7 2 3.1 (P < 0.001)
10 203.1 t 7.8 (P < 0.010)
10 227.9 2 10.6 (P < 0.001)
(N.S.)
\
plJlml ddoy 120.7 f 25.15~ 2.26 t 0.07
N.D. 2.72 2 0.04 (P < 0.001)
3.53 t 0.10 (N.S.)e (P < 0.001)
N.D. 3.98 t 0.16 (P < 0.001) (P < 0.050)
182.1 f 27.7'
I I 1 1 I
x lo-=
2.96 ? 0.22
6.46 2 0.59
3.73 t 0.68 (N.S.)
4.34 2 0.58 (P < 0.025)
(N.S.)
(P < 0.001)
All values represent group means t SEM. Only seven animals represented Only eight animals represented. Not determined.
e Not significant.
appeared to be normal. Sections of heart, lung, pancreas, spleen, and kidneys from the four groups appeared normal.
PBB/Ld mice consumed significantly more food than control C57B l/6J mice, but the efficiency of converting calories to body weight was not sig- nificantly different in the two groups. Average daily food intake and food efficiency of C57B1/6J mice injected with GTG were significantly greater than those of control mice. While the GTG-treated PBB/Ld mice consumed more food than any of the other groups, their food efficiency did not differ significantly from that of control PBB/Ld mice (Table 4). Average weight gain for the GTG-injected animals of both strains was about twice that of the control animals, and a few of the GTG-injected C57B l/6J mice achieved body weights exceeding those of PBB/Ld controls.
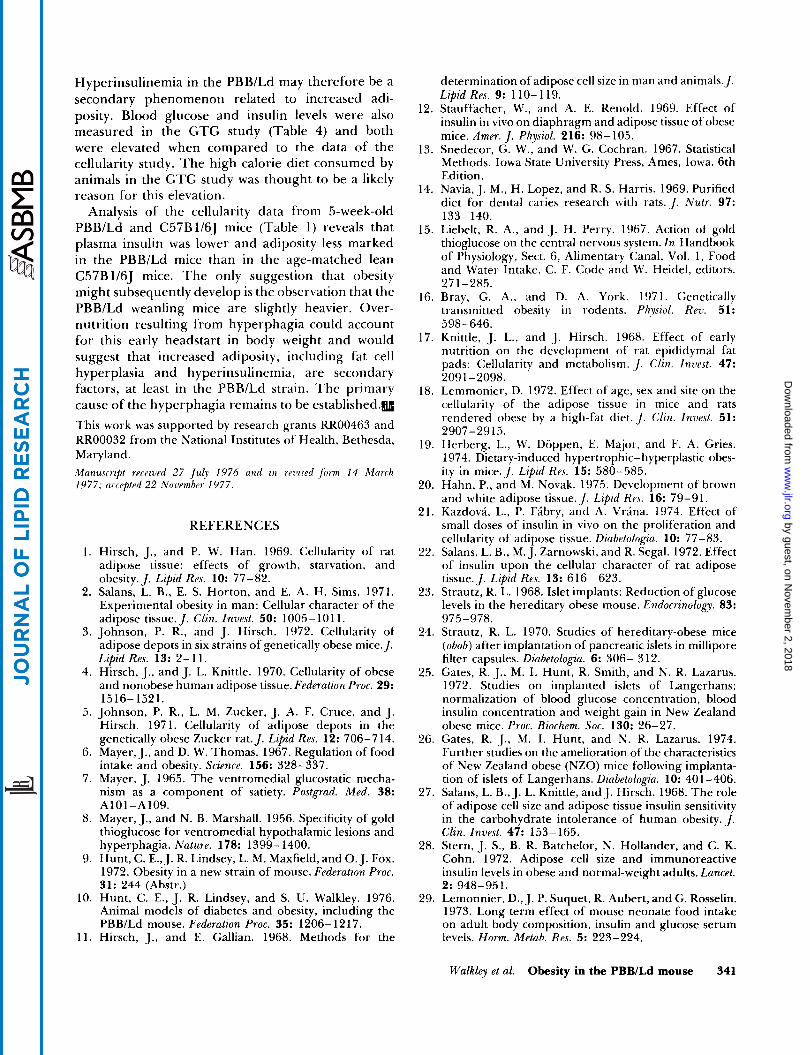
The mean blood glucose concentration was signifi- cantly higher in PBB/Ld mice when compared with C57B 1/6J controls, but did not differ from that of the C57B 1/6J GTG-injected group (Table 4). Glucose tolerance tests at 5 months of age were abnormal in both GTG-treated and untreated PBB/Ld mice as well as in the C57B1/6J GTG-injected group when compared with the C57B l/6J controls (Fig. 2). Serum insulin concentrations were slightly higher in the untreated PBB/Ld mice when compared with the C57B l/6J controls, but this difference was not statisti- cally significant (Table 4).
DISCUSSION
The results presented here indicate that obesity in the PBB/Ld mouse is due primarily to hypertrophy of adipocytes in the epididymal, subcutaneous, and
retroperitoneal fat pads. Additionally, fat cell hyper- plasia appears to occur in the epididymal pad. Obesity resulting from hypertrophy of adipocytes in epididy- mal, subcutaneous and retroperitoneal fat pads has also been described in the yellow (dy), intermediate
400 1
O I Q
0 3
200
IO0
I 2 3 Time in hours
0 0.5
Fig. 2. Glucose tolerance curves for 5-month-old GTG-lesioned and control groups of C57B116J and PBB/Ld mice. Data points are 2SEM.
Walkley et al. Obesity in the PBBlLd mouse 339
by guest, on Novem
ber 2, 2018w
ww
.jlr.orgD
ownloaded from

(diu), viable yellow ( U A ~ ’ ~ ) , and diabetic (dbdb) mutant mouse. Obesity involving hypertrophy and hyper- plasia of adipocytes has been reported in the obese- hyperglycemic mouse (obob) and the obese Zucker rat (3, 5). Obesity in these strains is thought to be the result of single gene mutations (3). Obesity in the New Zealand obese (NZO) mouse, which, like the PBB/Ld, is generally considered to be the result of a polygenic inheritance, is associated with both hyper- trophy and hyperplasia of fat cells (3). A detailed comparison of the obesity in the PBB/Ld and other rodent models of obesity has recently been pub- lished (10).
Comparison of data from individual adult animals in the cellularity study is useful in an attempt to determine the contributions of adipcoyte hypertrophy and hyperplasia to the PBBiLd obesity. Table 2 shows fat cell number and size data from individual PBB/Ld and C57B1/6J mice at 24 weeks of age and indicates the degree of variation that can occur in the fat pads of PBB/Ld mice. For example, two animals (nos. 24 and 31) illustrate that PBB/Ld obesity need not involve significant hyperplasia as obesity in these mice was due only to hypertrophy of fat cells. Similarly, even though hyperplasia was most conspicuous in the epididymal pads of the PBB/Ld, increased cellularity could occur elsewhere, as evi- denced by the subcutaneous fat pad of one mouse (no. 27).
When comparing the epididymal fat pads of the two groups of 24-week-old mice, hyperplasia of adipo- cytes in the PBB/Ld strain was not significantly different than that of the C57B1/6J mice (Table 2). However, at 5, 11, 16, and 34 weeks of age, the PBB/Ld mice did show adipocyte hyperplasia in the epididymal pad when compared to the C57B 1/6J strain. Hypertrophy showed less variation and fat cells of the PBB/Ld mice were significantly larger than those of the C57B1/6J mice at 16 weeks of age and this difference continued to the end of the study, at 34 weeks of age.
Adult PBB/Ld mice proved susceptible to the ef- fects of GTG and their response was similar to that reported for other mouse strains. Hypothalamic lesions appeared identical to those of the earlier studies (e.g., see 15) and also were similar to those of the C57B1/6J mice injected in the present study. Food intake studies on both control and GTG- injected PBB/Ld and C57B 1/6J mice demonstrated that control PBB/Ld mice were hyperphagic but not more efficient in converting food to body weight compared to lean C57B 1/6J mice. Increased food ef- ficiency was found to occur, however, in C57B 1/6J mice made obese by GTG (Table 4). PBBlLd mice injected with GTG also were more efficient than 340 Journal of Lipid Research Volume 19, 1978
control (saline-injected) C57B 1/6J mice but not more efficient than control PBB/Ld mice. The explanation for this difference is unclear. Increased food efficiency has also been reported in rats made obese by GTG, as well as in some rodent models of inherited obesity (16).
Early nutritional status is now thought to influence adipose tissue cellularity in an irreversible fashion (1, 17). Fat cell hyperplasia has been induced in young mice that were allowed to suckle mothers being maintained on a high fat diet (18). Similarly, high fat diets fed to Naval Medical Research Institute (NMRI) mice for 11 weeks have been found to result in hyperplasia of fat cells in the epididymal and subcutaneous depots (19). As Hahn and Novak point out in a recent review (20), the development of hyperplasia or hypertrophy may well be decided by the age at which the animal initially is exposed to overnutrition. Early postnatal overnutrition may initi- ate hyperplasia whereas overnutrition later in life may produce only hypertrophy of fat cells.
Elevated serum insulin at an early age also has been thought to play a role in the development of adipocyte hyperplasia (2 l) , although there is not general agreement on this possibility (22). Recent work with transplantation of islets of Langerhans from normal mouse pancreas into the obob and N Z O strains with subsequent normalization of blood glu- cose and insulin levels has led to the conclusion that a primary abnormality responsible for the de- velopment of obesity in both these strains lies within the islets (23, 24, 25). The finding that islets from normal animals treated with streptozoto- cin are equally effective in producing this normaliza- tion suggest that the beta cell may not be involved directly in this process (26). It has been proposed that a yet unidentified factor may be involved in the normal regulation of insulin release, and that resultant hypersecretion of insulin may be the abnormality responsible for the development of obesity in the obob and NZO strains (26).
Blood glucose and insulin levels were measured in PBB/Ld and C57B1/6J mice concurrently with the study of cell size and number in an attempt to determine whether a relationship could be found. Summary data in Table 1 show that insulin increased slowly with age in the PBB/Ld, while levels in the C57B 1/6J were relatively constant. It should be noted, however, that insulin concentrations in PBB/Ld mice were not elevated when compared to C57Bl/6J mice until after conspicuous hyperplasia had already oc- curred in the epididymal fat pad. Insulin levels in the PBB/Ld also can be shown to correlate best with fat cell size rather than with cell number or blood glucose (Table 3) and this correlation has also been reported to occur in other obese states (27, 28, 29).
by guest, on Novem
ber 2, 2018w
ww
.jlr.orgD
ownloaded from
Hyperinsulinemia in the PBB/Ld may therefore be a secondary phenomenon related to increased adi- posity. Blood glucose and insulin levels were also measured in the GTG study (Table 4) a n d both were elevated when compared to the data of t he cellularity study. The high calorie diet consumed by animals in the GTG study was thought t o be a likely reason fo r this elevation.
Analysis of t he cellularity data f rom 5-week-old PBB/Ld and C57B1/6J mice (Table 1) reveals that plasma insulin was lower and adiposity less marked in the PBB/Ld mice than in the age-matched lean C57B l/6J mice. T h e only suggestion that obesity might subsequently develop is the observation that the PBB/Ld weanling mice are slightly heavier. Over- nutrition resulting f rom hyperphagia could account fo r this early headstart in body weight and would suggest that increased adiposity, including fat cell hyperplasia a n d hyperinsulinemia, are secondary factors, a t least in the PBB/Ld strain. T h e primary cause o f t h e hyperphagia remains to be estab1ished.m
This work was supported by research grants RR00463 and RR00032 from the National Institutes of Health, Bethesda, Maryland. Manutcrzpt iucuzved 27 July 1976 and in rt?uwd form 14 Marth 1977. ncrpbtvd 22 1Yo71umb~r 1977.
1.
2.
3.
4.
5.
6.
7.
8.
9.
10.
11.
REFERENCES
Hirsch, J., and P. W. Han. 1969. Cellularity of rat adipose tissue: effects of growth, starvation, and obesity. J . Lipid RQS. 10: 77-82. Salans, L. B., E. S. Horton, and E. A. H. Sims. 1971. Experimental obesity in man: Cellular character of the adipose tissue. J . Clin. Invest. 50: 1005- 10 1 I . Johnson, P. R., and J. Hirsch. 1972. Cellularity of adipose depots in six strains of genetically obese mice.J. Lipid Res. 13: 2- 11. Hirsch, J., and J. L. Knittle. 1970. Cellularity of obese and nonobese human adipose tissue. Federation Proc. 29: 1516-1521.
Johnson, P. R., L. M. Zucker, J. A. F. Cruce, and J. Hirsch. 1971. Cellularity of adipose depots in the genetically obese Zucker rat. J . Lipid Res. 12: 706-714. Mayer, J., and D. W. Thomas. 1967. Regulation of food intake and obesity. Science. 156: 328-337. Mayer, J. 1965. The ventromedial glucostatic mecha- nism as a component of satiety. Postgrud. Med. 38:
Mayer, J., and N. B. Marshall. 1956. Specificity of gold thioglucose for ventromedial hypothalamic lesions and hyperphagia. Nature. 178: 1399- 1400. Hunt, C. E., J. R. Lindsey, L. M. Maxfield, and 0. J. Fox. 1972. Obesity in a new strain of mouse. Federation Proc. 31: 244 (Abstr.) Hunt, C. E., J. R. Lindsey, and S. U. Walkley. 1976. Animal models of diabetes and obesity, including the PBBILd mouse. Federation Proc. 35: 1206- 1217. Hirsch, J., and E. Gallian. 1968. Methods for the
A10 1 -A 109.
determination of adipose cell size in man and animals. J . Lipid Res. 9: 110-1 19.
12. Stauffacher, W., and A. E. Renold. 1969. Effect of insulin in vivo on diaphragm and adipose tissue of obese mice. Amer. J . Physiol. 216: 98-105.
13. Snedecor, G. W., and W. G. Cochran. 1967. Statistical Methods. Iowa State University Press, Ames, Iowa. 6th Edition.
14. Navia, J. M., H. Lopez, and R. S. Harris. 1969. Purified diet for dental caries research with rats. J . Nutr. 97: 133- 140.
15. Liebelt, R. A., and J. H. Perry. 1967. Action of gold thioglucose on the central nervous system. In Handbook of Physiology, Sect. 6, Alimentary Canal, Vol. 1, Food and Water Intake. C. F. Code and W. Heidel, editors. 271-285.
16. Bray, G. A., and D. A. York. 1971. Genetically transmitted obesity in rodents. Physiol. RPU. 51:
17. Knittle, J. L., and J. Hirsch. 1968. Effect of early nutrition on the development of rat epididymal fat pads: Cellularity and metabolism. J . Clzn. Inzlest. 47:
18. Lemmonier, D. 1972. Effect of age, sex and site on the cellularity of the adipose tissue in mice and rats rendered obese by a high-fat diet. J . Clzn. Invest. 51:
19. Herberg, L., W. Doppen, E. Major, and F. A. Gries. 1974. Dietary-induced hypertrophic-hyperplastic obes- ity in mice. J . Lipid Rrs. 15: 580-585.
20. Hahn. P.. and M. Novak. 1975. Develoament of brown
598-646.
209 1-2098.
2907-29 15.
-~
21.
22.
23.
24.
25.
26.
27.
28.
29.
and white adipose tissue. J . Lipid Rrs. i6: 79-91. Kazdova, L., P. Fibry, and A. Vrana. 1974. Effect of small doses of insulin in vivo on the proliferation and cellularity of adipose tissue. Diubetologza. 10: 77-83. Salans, L. B., M. J. Zarnowski, and R. Segal. 1972. Effect of insulin upon the cellular character of rat adipose tissue. J . Lipid Res. 13: 616- 623. Strautz, R. L. 1968. Islet implants: Reduction of glucose levels in the hereditary obese mouse. Endocrinology. 83: 975-978. Strautz, R. L. 1970. Studies of hereditary-obese mice (obob) after implantation of pancreatic islets in millipore filter capsules. Diabetologia. 6: 306- 3 12. Gates, R. J., M. I . Hunt, R. Smith, and N. R. Lazarus. 1972. Studies on implanted islets of Langerhans: normalization of blood glucose concentration, blood insulin concentration and weight gain in New Zealand obese mice. Proc. Biochem. Soc. 130: 26-27. Gates, R. J., M. I . Hunt, and N. R. Lazarus. 1974. Further studies on the amelioration of the characteristics of New Zealand obese (NZO) mice following implanta- tion of islets of Langerhans. Diubetologza. 10: 401-406. Salans, L. B., J. L. Knittle, and J. Hirsch. 1968. The role of adipose cell size and adipose tissue insulin sensitivity in the carbohydrate intolerance of human obesity. J . Clin. Invest. 47: 153-165. Stern, J. S., B. R. Batchelor, N. Hollander, and C. K. Cohn. 1972. Adipose cell size and immunoreactive insulin levels in obese and normal-weight adults. Lancet.
Lemonnier, D., J. P. Suquet, R. Aubert, and G. Rosselin. 1973. Long term effect of mouse neonate food intake on adult body composition, insulin and glucose serum levels. Horm. Metub. Res. 5: 223-224.
2: 948-951.
Walkley et al. Obesity in the PBBILd mouse 341
by guest, on Novem
ber 2, 2018w
ww
.jlr.orgD
ownloaded from