descriptive statistics - wordpress for wwu€¦ · descriptive statistics report 2015-04 john krieg...
TRANSCRIPT
WESTERN EDUCATIONAL LONGITUDINAL STUDY (WELS) SPRING 2015 FOLLOW-UP SURVEY OF FRESHMEN
WHO ENTERED WESTERN IN FALL OF 2013
Descriptive Statistics
Report 2015-04
John Krieg Beth Hartsoch
Chris Stark
Sept, 2015
OFFICE OF SURVEY RESEARCH WESTERN
WASHINGTON UNIVERSITY
Page
2
5
6
11
17
20
23
24
26
28
28
30
Western Libraries and Learning Commons 31
Online Courses 33
Office of Sustainable Transportation 35
Technology 40
University Residences
Western Reads Program
I. Items Requested by Departments, Offices, and Programs
Table of Contents
H. Employment and Educational Expenses
D. Course Scheduling
E. Academic Major
F. Major Advising
G. Academic Engagement and Rigor
Executive Summary
A. Comparison of All Second-Year Students and Respondents
B. Attending Western
C. General Education
Western Educational Longitudinal Study (WELS) Spring 2015 Follow-up Survey of Freshmen Who Entered Western in the Fall of 2013
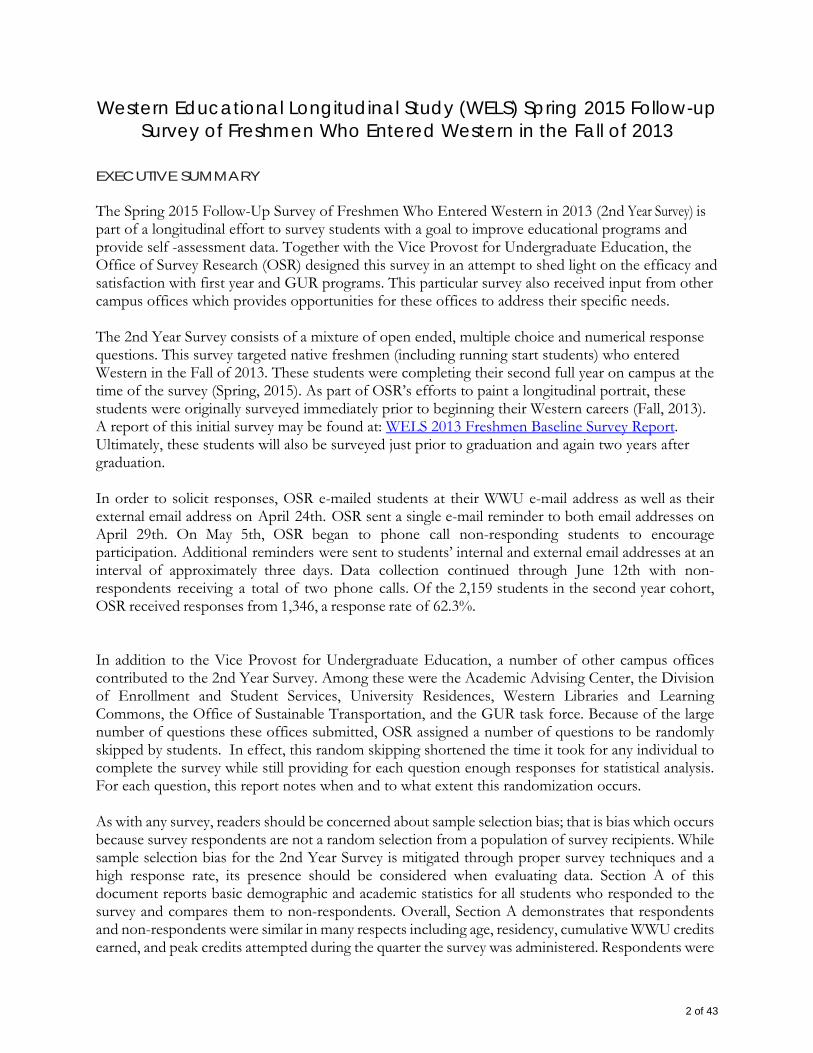
EXECUTIVE SUMMARY
The Spring 2015 Follow-Up Survey of Freshmen Who Entered Western in 2013 (2nd Year Survey) is part of a longitudinal effort to survey students with a goal to improve educational programs and provide self -assessment data. Together with the Vice Provost for Undergraduate Education, the Office of Survey Research (OSR) designed this survey in an attempt to shed light on the efficacy and satisfaction with first year and GUR programs. This particular survey also received input from other campus offices which provides opportunities for these offices to address their specific needs.
The 2nd Year Survey consists of a mixture of open ended, multiple choice and numerical response questions. This survey targeted native freshmen (including running start students) who entered Western in the Fall of 2013. These students were completing their second full year on campus at the time of the survey (Spring, 2015). As part of OSR’s efforts to paint a longitudinal portrait, these students were originally surveyed immediately prior to beginning their Western careers (Fall, 2013). A report of this initial survey may be found at: WELS 2013 Freshmen Baseline Survey Report. Ultimately, these students will also be surveyed just prior to graduation and again two years after graduation.
In order to solicit responses, OSR e-mailed students at their WWU e-mail address as well as their external email address on April 24th. OSR sent a single e-mail reminder to both email addresses on April 29th. On May 5th, OSR began to phone call non-responding students to encourage participation. Additional reminders were sent to students’ internal and external email addresses at an interval of approximately three days. Data collection continued through June 12th with non-respondents receiving a total of two phone calls. Of the 2,159 students in the second year cohort, OSR received responses from 1,346, a response rate of 62.3%.
In addition to the Vice Provost for Undergraduate Education, a number of other campus offices contributed to the 2nd Year Survey. Among these were the Academic Advising Center, the Division of Enrollment and Student Services, University Residences, Western Libraries and Learning Commons, the Office of Sustainable Transportation, and the GUR task force. Because of the large number of questions these offices submitted, OSR assigned a number of questions to be randomly skipped by students. In effect, this random skipping shortened the time it took for any individual to complete the survey while still providing for each question enough responses for statistical analysis. For each question, this report notes when and to what extent this randomization occurs.
As with any survey, readers should be concerned about sample selection bias; that is bias which occurs because survey respondents are not a random selection from a population of survey recipients. While sample selection bias for the 2nd Year Survey is mitigated through proper survey techniques and a high response rate, its presence should be considered when evaluating data. Section A of this document reports basic demographic and academic statistics for all students who responded to the survey and compares them to non-respondents. Overall, Section A demonstrates that respondents and non-respondents were similar in many respects including age, residency, cumulative WWU credits earned, and peak credits attempted during the quarter the survey was administered. Respondents were
2 of 43

more likely to be women (63.7% of respondents were women versus 50.4% of non-respondents), averaged higher admissions indices (56.7 v. 53.2), earned better WWU cumulative GPAs (3.0 v. 2.9), and were more likely to live in campus housing when the survey was administered (29.0% v. 21.8%).
In addition to Section A, this report contains eight sections each focusing on an aspect of student life at Western. While we leave it to the reader to decide what is informative or striking in this report, here we undertake to highlight findings which the wider campus may find interesting. Eighty-four percent of students claimed to be “satisfied” or “very satisfied” with their Western experience, a number similar to prior years. Sixty-four percent of students claimed that they were “very unlikely” to leave Western prior to graduation, whereas only 5% of respondents indicated a positive likelihood that they would leave Western before graduation.
When asked about General Education courses (Section C), one-half of students replied that GURs were about as difficult as expected with nearly equal numbers of students claiming they were easier or harder than expected. Sadly, only 9% of students strongly agreed that “taking GUR courses gives me useful skills” and 17% strongly agreed that “completing courses in a broad range of disciplines is something I would choose to do myself even if it were not required.” Just less than one-half of respondents demonstrated a positive level of satisfaction with the size and structure of GUR courses and 69% of students were positively satisfied with the quality of instruction in their GUR courses.
In order to gauge the difficulty of registering for courses, students were asked how many classes which they wanted to take in the spring quarter were full. Forty-six percent of respondents were unable to take at least one class because it was full, a decrease of eleven percentage points over the prior year and eighteen percentage points lower than two years ago. Of students who had yet to declare a major, 59% were certain of what their major would be and a further 30% had “some idea” of what they would study. When asked what delayed their major declaration, students most frequently responded that they needed more courses in order to declare or they were not sure about which major to declare. Very few students cited inadequate academic advising as causing their delay. The most frequently listed intended majors of those who have yet to declare are Biology, Psychology, Computer Science, and Management.
Of all respondents, 60% worked for pay during the quarter; the average hours worked per week of all students was 9.4 hours, about half-an-hour higher than last year and up from 6.9 hours four years ago. Forty-eight percent of respondents claimed that they or someone else on their behalf has borrowed money to fund their education, a decrease of nine percentage points relative to last year. Of those who have borrowed, the average education debt to date was $16,695, a slight decrease from the prior year. Of this amount, respondents averaged $707 in education-related credit card debt and about $9,300 in loans in other people’s names. About one-half of students expect to borrow more to complete their Western education.
This year’s 2nd Year Survey contains a section asking students about their perceptions and experiences with online courses (part of Section I of this report). Consistently, students describe the benefits of online courses as providing them with a flexible schedule. About one-in-five students had previously completed an online course prior to coming to Western and a similar percentage expect to enroll in an online class while at Western. When asked to compare traditional formats with online formats, the dominant perception is that traditional courses generate more learning, have hire quality and quantity of interaction with faculty and their peers. Online courses are thought to be better for
3 of 43
earning higher grades and, as previously mentioned, for setting a flexible schedule. Nine percent of students strongly agreed that Western should offer more online courses. Three features of the 2nd Year Survey are worth mentioning. First, this is part of a longitudinal cohort which began with an OSR baseline survey prior to the beginning of the freshmen year. OSR is happy to package this data and share it with interested researchers. Secondly, each respondent in the 2nd Year Survey is tracked with a unique tracking number which OSR can match with university records. This ability profoundly opens the door for research in issues which impact students and the university. OSR will happily provide such data to researchers, departments, and offices upon request. Finally, as previously mentioned, 2nd Year Surveys were also given in 2010, 2011, 2012, 2013 and 2014 which provides the opportunity to track responses over time. Information from the prior surveys may be found on OSR’s website.
4 of 43
Clarifying Notes 1. Unless otherwise noted, percentages given are of the number responding to a question divided
by the number asked that question. This denominator may contain fewer students than the total number responding to the survey due to question branching, random selection of respondents for certain questions, and survey attrition.
2. In many cases percentages do not sum to one hundred because of rounding.
3. A blank space indicates no respondent chose that response option. A report of 0% indicates that the percent of responses rounded down to, but is not equal with, zero.
4. This report presents responses from all students completing any question regardless of whether the respondent completed the survey or not.
The Office of Survey Research The Office of Survey Research provides high quality survey research and other applied social science research that supports the mission of Western Washington University. In particular, OSR surveys students, alumni, graduates, employers, and the campus community to provide valuable assessment data and analysis of reports which can be used for improvement of programs, instruction, faculty scholarship, and information services. OSR is responsible for developing and administering the Western Educational Longitudinal Study (WELS), Western’s Alumni Surveys, and Western’s exit surveys of graduating students.
5 of 43
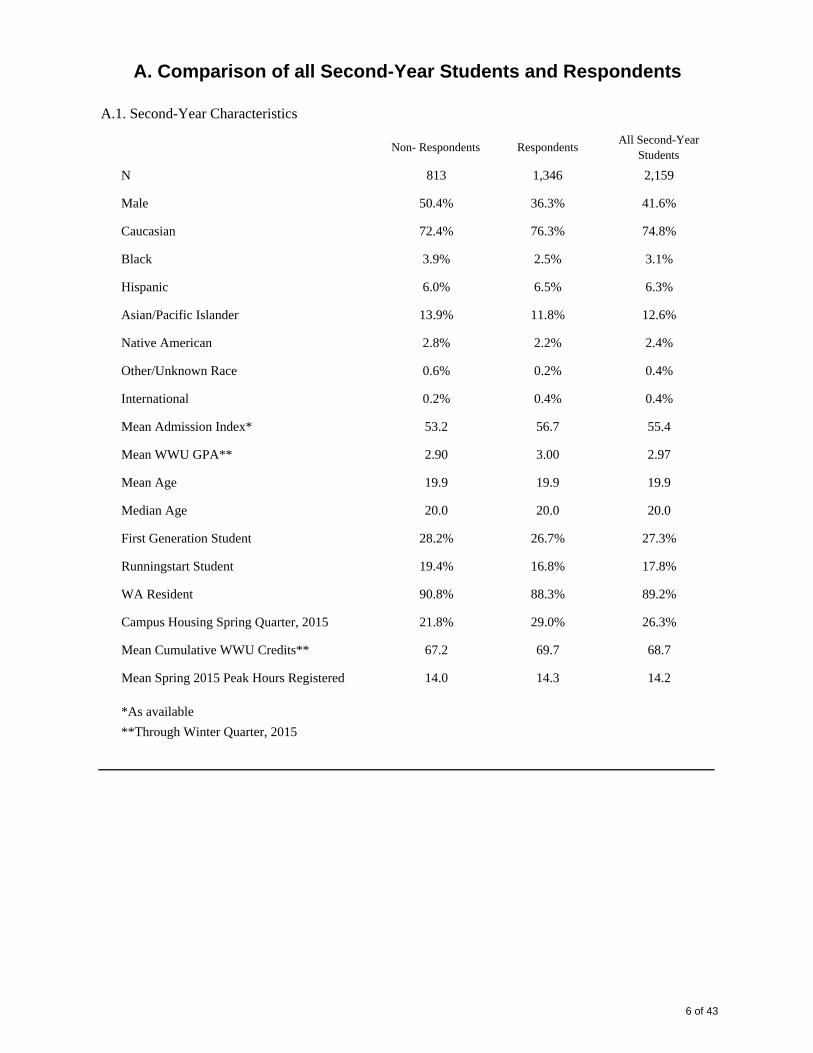
Non- Respondents RespondentsAll Second-Year
Students
N 813 1,346 2,159
Male 50.4% 36.3% 41.6%
Caucasian 72.4% 76.3% 74.8%
Black 3.9% 2.5% 3.1%
Hispanic 6.0% 6.5% 6.3%
Asian/Pacific Islander 13.9% 11.8% 12.6%
Native American 2.8% 2.2% 2.4%
Other/Unknown Race 0.6% 0.2% 0.4%
International 0.2% 0.4% 0.4%
Mean Admission Index* 53.2 56.7 55.4
Mean WWU GPA** 2.90 3.00 2.97
Mean Age 19.9 19.9 19.9
Median Age 20.0 20.0 20.0
First Generation Student 28.2% 26.7% 27.3%
Runningstart Student 19.4% 16.8% 17.8%
WA Resident 90.8% 88.3% 89.2%
Campus Housing Spring Quarter, 2015 21.8% 29.0% 26.3%
Mean Cumulative WWU Credits** 67.2 69.7 68.7
Mean Spring 2015 Peak Hours Registered 14.0 14.3 14.2
*As available
**Through Winter Quarter, 2015
A.1. Second-Year Characteristics
A. Comparison of all Second-Year Students and Respondents
6 of 43

N 1338
Attend Western 82%
Attend a different university 17%
Not pursue a bachelor's degree at any school 1%
N 224
I could graduate more quickly from a different school 18%
I don't like Western's campus 8%
I don't like Western's students 21%
I don't like Western's quarter system 5%
I don't like Western's faculty members 6%
I became interested in a major that Western doesn't offer 22%
Another school has a better program in my field 37%
A degree from another school is more valuable 24%
Western's degree or major requirements were not what I expected or was led to believe 15%
Another school would have challenged me more at Western 10%
I feel like I settled for a second-rate experience when I should have tried harder to get into a better school
34%
Western is too big 3%
Western is too small 11%
Western is too far from home 11%
Western is too close to home 8%
Other 19%
B. Attending Western
B.1.a. Why would you choose to attend a different university? (Asked of respondents who answered "Attend a different university" in B.1.)
B.1. If you could start your higher education experience over, would you choose to:
7 of 43
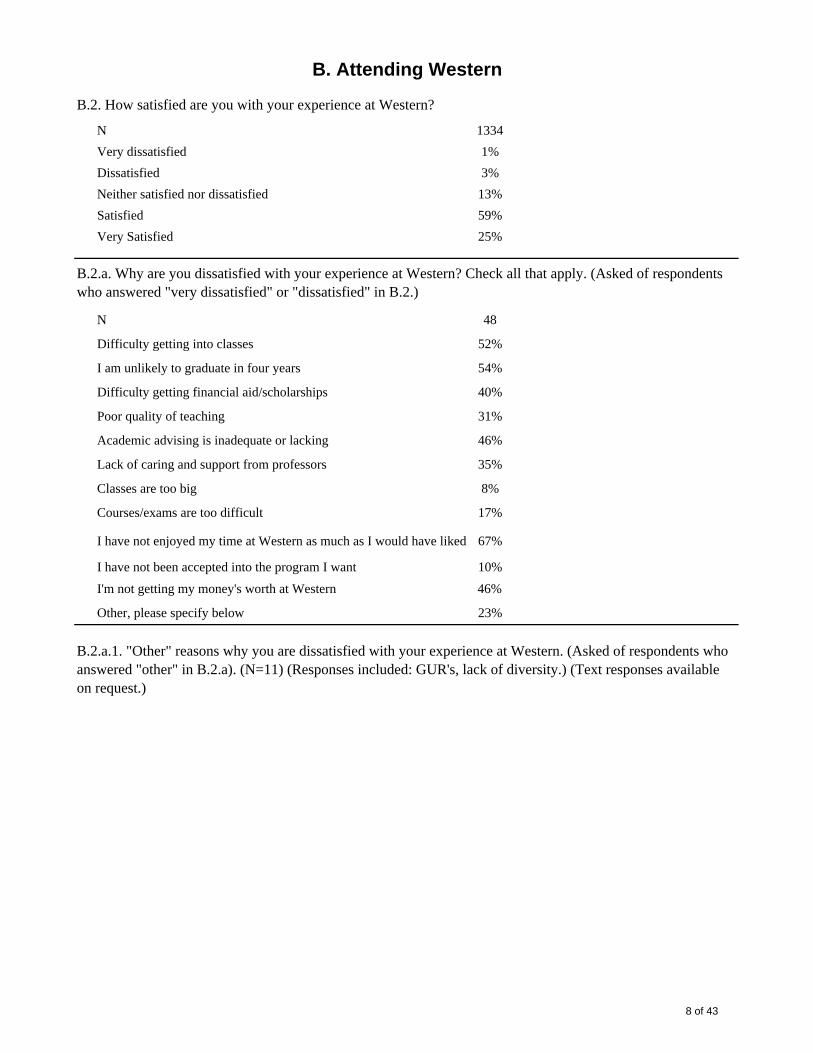
N 1334
Very dissatisfied 1%
Dissatisfied 3%
Neither satisfied nor dissatisfied 13%
Satisfied 59%
Very Satisfied 25%
N 48
Difficulty getting into classes 52%
I am unlikely to graduate in four years 54%
Difficulty getting financial aid/scholarships 40%
Poor quality of teaching 31%
Academic advising is inadequate or lacking 46%
Lack of caring and support from professors 35%
Classes are too big 8%
Courses/exams are too difficult 17%
I have not enjoyed my time at Western as much as I would have liked 67%
I have not been accepted into the program I want 10%
I'm not getting my money's worth at Western 46%
Other, please specify below 23%
B. Attending Western
B.2. How satisfied are you with your experience at Western?
B.2.a. Why are you dissatisfied with your experience at Western? Check all that apply. (Asked of respondents who answered "very dissatisfied" or "dissatisfied" in B.2.)
B.2.a.1. "Other" reasons why you are dissatisfied with your experience at Western. (Asked of respondents who answered "other" in B.2.a). (N=11) (Responses included: GUR's, lack of diversity.) (Text responses available on request.)
8 of 43

N 1330
Very unlikely 64%
Somewhat unlikely 22%
Uncertain 9%
Somewhat likely 3%
Very likely 2%
N 63
Transfer 84%
Not attend 16%
N 10
Finances 40%
Academic performance 30%
Unsure of my direction 80%
Employment opportunity 0%
A college education isn't important to me 30%
Not accepted in my major of choice 30%
Lack of diversity at Western 30%
Personal health 30%
I'm not getting my money's worth at Western 20%
Other 10%
Attending Western (cont.)
B.3.a.1. Why are you likely to leave Western before you graduate? Check all that apply. (Asked of respondents who answered "not attend" in B.3.a.)
B.3.a.1.a. Please list the "other" reasons why you are likely to leave Western. (Asked of respondents who answered "other" in B.3.a.1). (N= 0)
B.3.a. If you leave Western, will you transfer to another institution or not attend school anywhere? (Asked of respondents who answered "somewhat likely" or "very likely" in B.3.)
B.3. How likely is it that you will leave Western before you graduate?
9 of 43

N 52
Western doesn't offer the major that interests me 42%
Another school has a better program in my field 52%
Another school would have challenged me more than Western
13%
Western is too big or too small 13%
It is too hard to get the classes I need 15%
I was not accepted to my major of choice 8%
I dislike the weather, recreation opportunities, or location in general 19%
Problems with academic performance at Western 13%
Finances 15%
Personal health 13%
To do something or go somewhere new and different 33%
To be closer to home 15%
To be further from home 10%
To be with friends or a significant other 6%
I don't fit in at Western 27%
Lack of diversity at Western 15%
I'm not getting my money's worth at Western 19%
Other 6%
Attending Western (cont.)
B.3.a.2. Why are you likely to transfer from Western? Check all that apply. (Asked of respondents who answered "transfer" in B.3.a.)
B.3.a.2.a.. Please list "other" reasons why you are likely to transfer. (Asked of respondents who answered "other" in B.3.a.2.) (N=3) (Responses included: GUR's, lack of diversity, harassment by university. ) (Text responses available on request.)
10 of 43

N 51
University of Washington - Seattle 33%
Whatcom Community College 8%
Eastern Washington University 6%
Washington State University 4%
The University of Montana 4%
Central Washington University 2%
Seattle University 2%
Bellingham Technical College 2%
Bellevue College
The Evergreen State College
Skagit Valley College
Everett Community College
Seattle Pacific University
Olympic College
Other 39%
N 1,323
Winter 2016 or earlier 4%
Spring 2016 through winter 2017 12%
Spring 2017 51%
Summer 2017 through winter 2018 27%
Spring 2018 or later 6%
B.3.a.4. When do you expect to graduate from Western with your bachelor's degree? (Asked of respondents who indicated they were "very unlikely", "somewhat unlikely" or "uncertain" about leaving Western before graduating in B.3.) (OSR asked a second version of this question if respondents said in B.3. that they are "somewhat likely" or "very likely" to leave Western. We asked "If you do stay at Western, when do you expect to graduate with your bachelor's degree?") (Results from the two versions are combined below.)
Attending Western (cont.)
B.3.a.3. To which school are you likely to transfer? (Asked of respondents who indicated in B.3.a. that if they left Western before graduating they would transfer to another institution.)
B.3.a.3.a.. To which school are you likely to transfer? (Asked of respondents who answered "other" in B.3.a.3.) (N=16) (Responses included: Oklahoma State University, University of Hawaii) (Text responses available on request.)
B.3.a.4.b.. Why do you expect to take more than four years to earn your bachelor's degree at Western? (Asked of respondents who answered "Summer 2017 through winter 2018 or Spring 2018 or later" in B.3.a.4.) (N=384) (Responses included: Double Major, Failed classes, changed my major) (Text responses available on request.)
11 of 43

NNot at all prepared
A little prepared
Somewhat prepared
Well preparedVery well prepared
Math 694 8% 19% 26% 29% 19%
Writing 694 4% 10% 22% 40% 24%
Research 693 9% 18% 32% 30% 11%
Reading 695 4% 9% 23% 37% 28%
Time-management 695 12% 20% 27% 25% 15%
NNot at all prepared
A little prepared
Somewhat prepared
Well preparedVery well prepared
Math 210 19% 12% 22% 29% 16%
Writing 211 4% 6% 19% 39% 31%
Research 212 9% 9% 28% 33% 21%
Reading 211 4% 5% 22% 39% 29%
Time-management 211 4% 11% 20% 39% 26%
N 614
Much less difficult than expected 7%
Somewhat less difficult than expected 22%
As difficult as expected 46%
Somewhat more difficult than expected 22%
Much more difficult than expected 3%
C.1. How well did your high school experience prepare you to succeed at Western in each of the following areas? (Asked of 50% of respondents at random.)
C. General Education
C.3. How has the level of difficulty in your GUR courses compared with your expectations? Most were: (Asked of 50% of respondents who are required to complete GURs at WWU; excludes Fairhaven and Runningstart students.)
C.2. How well did your Running Start experience prepare you to succeed at Western in each of the following areas? (Asked of respondents whol participated in Running Start.)
12 of 43
NStrongly disagree
Somewhat disagree
Neither agree nor disagree
Somewhat agree
Strongly agree
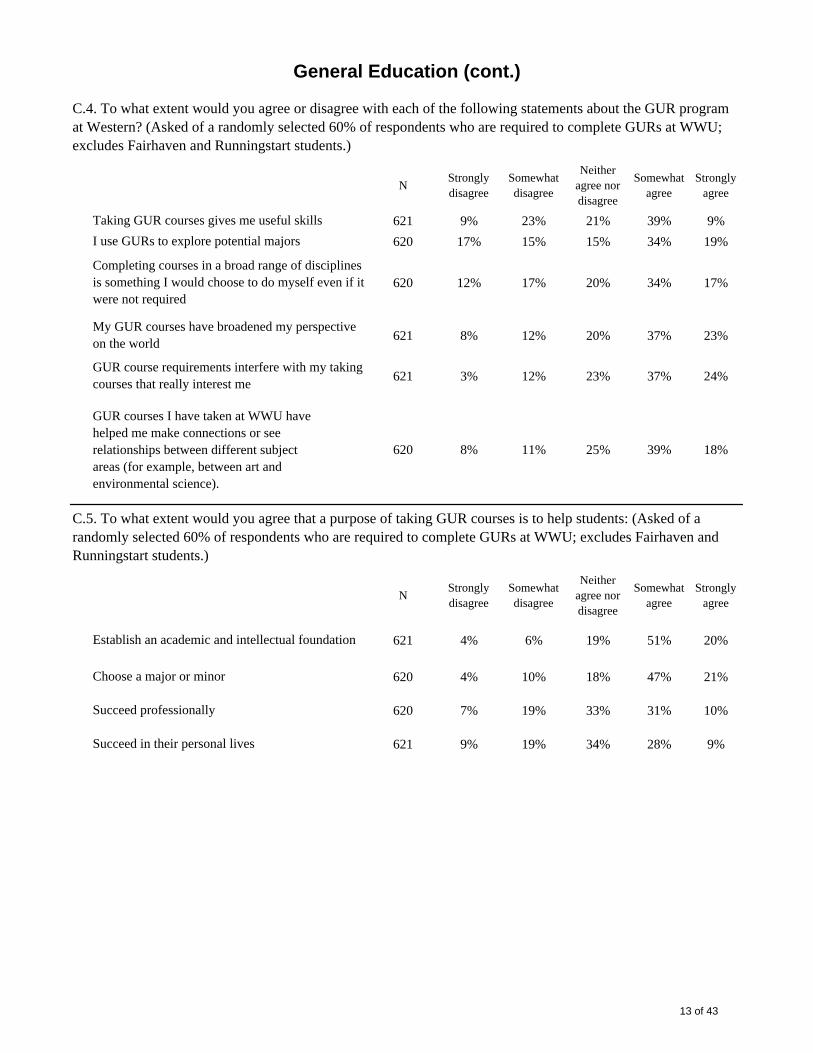
621 9% 23% 21% 39% 9%
620 17% 15% 15% 34% 19%
620 12% 17% 20% 34% 17%
621 8% 12% 20% 37% 23%
621 3% 12% 23% 37% 24%
GUR courses I have taken at WWU have helped me make connections or see relationships between different subject areas (for example, between art and environmental science).
620 8% 11% 25% 39% 18%
NStrongly disagree
Somewhat disagree
Neither agree nor disagree
Somewhat agree
Strongly agree
621 4% 6% 19% 51% 20%
620 4% 10% 18% 47% 21%
620 7% 19% 33% 31% 10%
621 9% 19% 34% 28% 9%
Choose a major or minor
Succeed professionally
Succeed in their personal lives
C.4. To what extent would you agree or disagree with each of the following statements about the GUR program at Western? (Asked of a randomly selected 60% of respondents who are required to complete GURs at WWU; excludes Fairhaven and Runningstart students.)
General Education (cont.)
Taking GUR courses gives me useful skills
I use GURs to explore potential majors
Completing courses in a broad range of disciplines is something I would choose to do myself even if it were not required
My GUR courses have broadened my perspective on the world
GUR course requirements interfere with my taking courses that really interest me
C.5. To what extent would you agree that a purpose of taking GUR courses is to help students: (Asked of a randomly selected 60% of respondents who are required to complete GURs at WWU; excludes Fairhaven and Runningstart students.)
Establish an academic and intellectual foundation
13 of 43
NVery
dissatisfiedSomewhat dissatisfied
Neither satisfied nor dissatisfied
Somewhat satisfied
Very satisfied
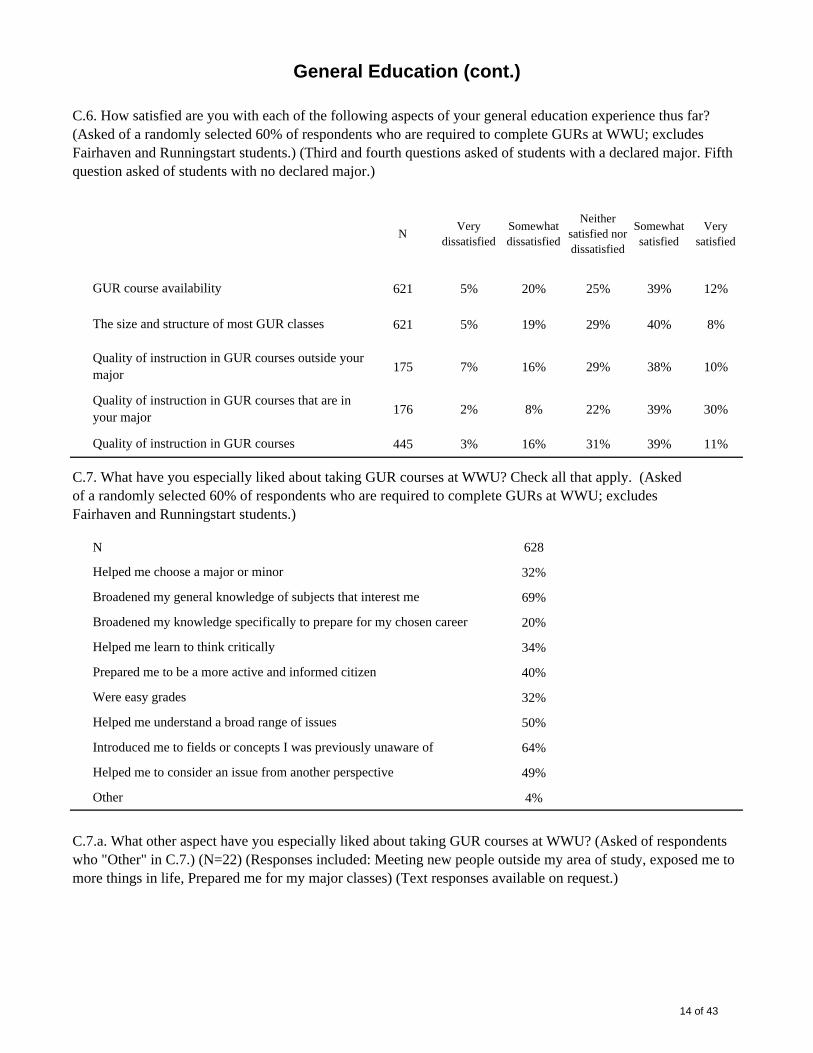
621 5% 20% 25% 39% 12%
621 5% 19% 29% 40% 8%
175 7% 16% 29% 38% 10%
176 2% 8% 22% 39% 30%
445 3% 16% 31% 39% 11%
N 628
32%
69%
20%
34%
40%
32%
50%
64%
49%
4%
Helped me choose a major or minor
Broadened my general knowledge of subjects that interest me
Broadened my knowledge specifically to prepare for my chosen career
Introduced me to fields or concepts I was previously unaware of
C.7.a. What other aspect have you especially liked about taking GUR courses at WWU? (Asked of respondents who "Other" in C.7.) (N=22) (Responses included: Meeting new people outside my area of study, exposed me to more things in life, Prepared me for my major classes) (Text responses available on request.)
Helped me learn to think critically
Prepared me to be a more active and informed citizen
Were easy grades
Helped me understand a broad range of issues
Helped me to consider an issue from another perspective
Other
Quality of instruction in GUR courses
C.7. What have you especially liked about taking GUR courses at WWU? Check all that apply. (Asked of a randomly selected 60% of respondents who are required to complete GURs at WWU; excludes Fairhaven and Runningstart students.)
General Education (cont.)
C.6. How satisfied are you with each of the following aspects of your general education experience thus far? (Asked of a randomly selected 60% of respondents who are required to complete GURs at WWU; excludes Fairhaven and Runningstart students.) (Third and fourth questions asked of students with a declared major. Fifth question asked of students with no declared major.)
GUR course availability
The size and structure of most GUR classes
Quality of instruction in GUR courses outside your major
Quality of instruction in GUR courses that are in your major
14 of 43
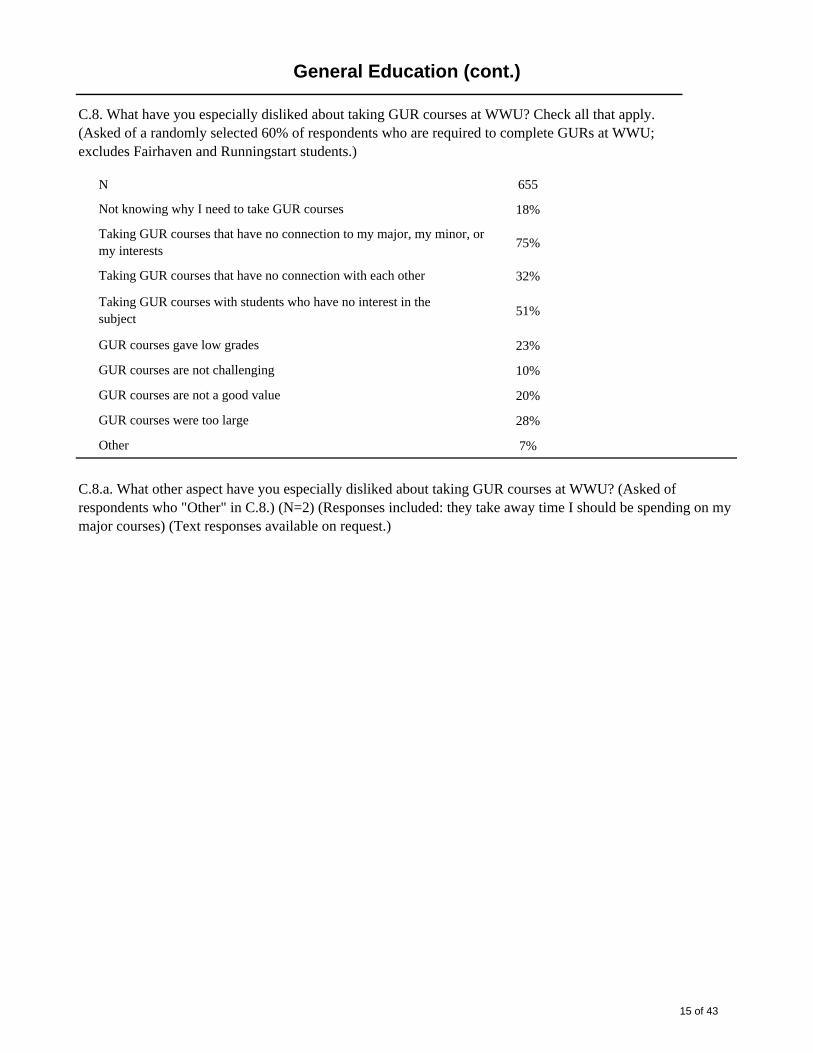
N 655
18%
75%
32%
51%
23%
10%
20%
28%
7%
Taking GUR courses with students who have no interest in the subject
C.8.a. What other aspect have you especially disliked about taking GUR courses at WWU? (Asked of respondents who "Other" in C.8.) (N=2) (Responses included: they take away time I should be spending on my major courses) (Text responses available on request.)
GUR courses gave low grades
GUR courses are not challenging
GUR courses are not a good value
GUR courses were too large
Other
General Education (cont.)
C.8. What have you especially disliked about taking GUR courses at WWU? Check all that apply. (Asked of a randomly selected 60% of respondents who are required to complete GURs at WWU; excludes Fairhaven and Runningstart students.)
Not knowing why I need to take GUR courses
Taking GUR courses that have no connection to my major, my minor, or my interests
Taking GUR courses that have no connection with each other
15 of 43
N 448
61%
56%
51%
34%
46%
55%
55%
51%
48%
50%
42%
5%
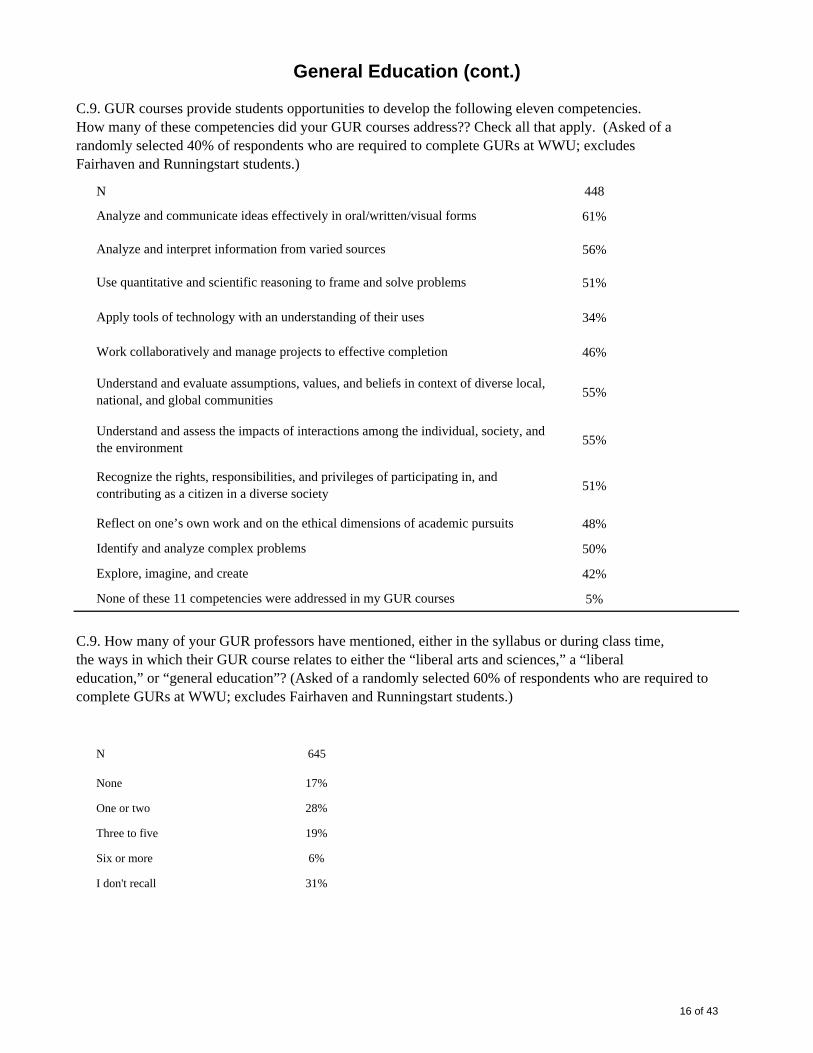
N 645
None 17%
One or two 28%
Three to five 19%
Six or more 6%
I don't recall 31%
C.9. How many of your GUR professors have mentioned, either in the syllabus or during class time,the ways in which their GUR course relates to either the “liberal arts and sciences,” a “liberaleducation,” or “general education”? (Asked of a randomly selected 60% of respondents who are required to complete GURs at WWU; excludes Fairhaven and Runningstart students.)
Work collaboratively and manage projects to effective completion
General Education (cont.)
C.9. GUR courses provide students opportunities to develop the following eleven competencies.How many of these competencies did your GUR courses address?? Check all that apply. (Asked of a randomly selected 40% of respondents who are required to complete GURs at WWU; excludes Fairhaven and Runningstart students.)
Analyze and communicate ideas effectively in oral/written/visual forms
Analyze and interpret information from varied sources
Use quantitative and scientific reasoning to frame and solve problems
Apply tools of technology with an understanding of their uses
None of these 11 competencies were addressed in my GUR courses
Understand and evaluate assumptions, values, and beliefs in context of diverse local, national, and global communities
Understand and assess the impacts of interactions among the individual, society, and the environment
Recognize the rights, responsibilities, and privileges of participating in, and contributing as a citizen in a diverse society
Reflect on one’s own work and on the ethical dimensions of academic pursuits
Identify and analyze complex problems
Explore, imagine, and create
16 of 43
N 568
20%
36%
17%
29%
19%
11%
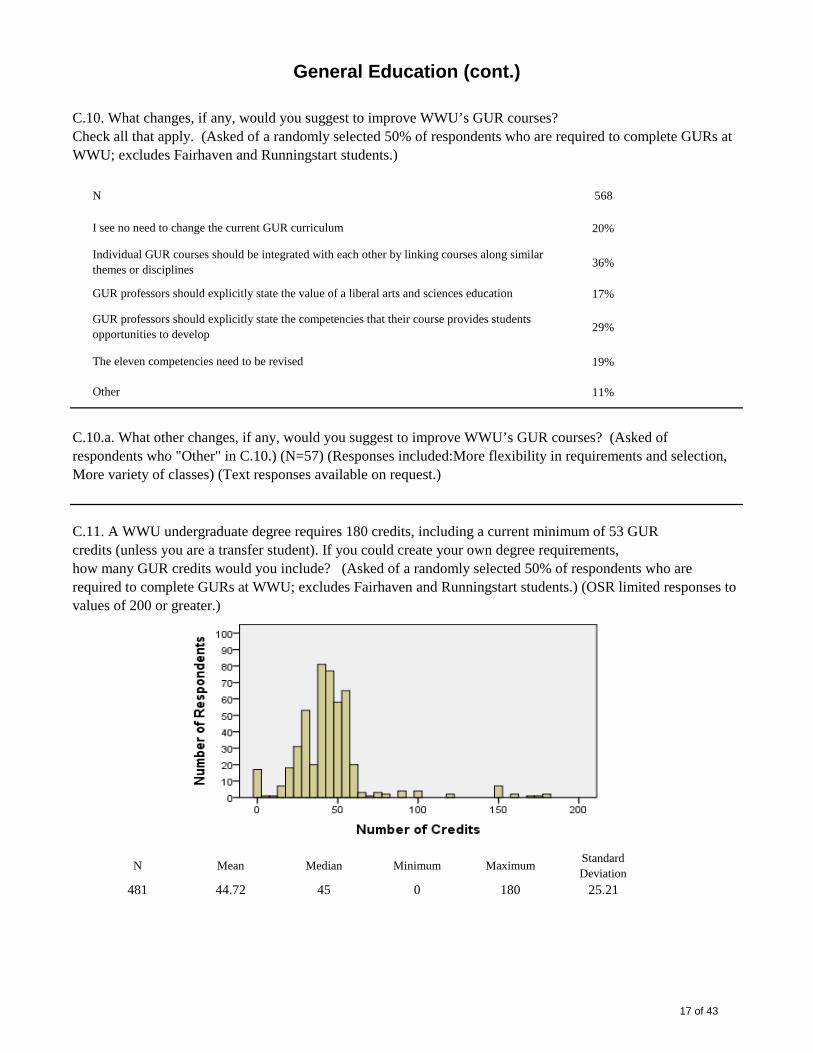
N Mean Median Minimum MaximumStandard Deviation
481 44.72 45 0 180 25.21
C.10. What changes, if any, would you suggest to improve WWU’s GUR courses?Check all that apply. (Asked of a randomly selected 50% of respondents who are required to complete GURs at WWU; excludes Fairhaven and Runningstart students.)
C.10.a. What other changes, if any, would you suggest to improve WWU’s GUR courses? (Asked of respondents who "Other" in C.10.) (N=57) (Responses included:More flexibility in requirements and selection, More variety of classes) (Text responses available on request.)
General Education (cont.)
C.11. A WWU undergraduate degree requires 180 credits, including a current minimum of 53 GURcredits (unless you are a transfer student). If you could create your own degree requirements,how many GUR credits would you include? (Asked of a randomly selected 50% of respondents who are required to complete GURs at WWU; excludes Fairhaven and Runningstart students.) (OSR limited responses to values of 200 or greater.)
I see no need to change the current GUR curriculum
Individual GUR courses should be integrated with each other by linking courses along similar themes or disciplines
The eleven competencies need to be revised
Other
GUR professors should explicitly state the value of a liberal arts and sciences education
GUR professors should explicitly state the competencies that their course provides students opportunities to develop
17 of 43
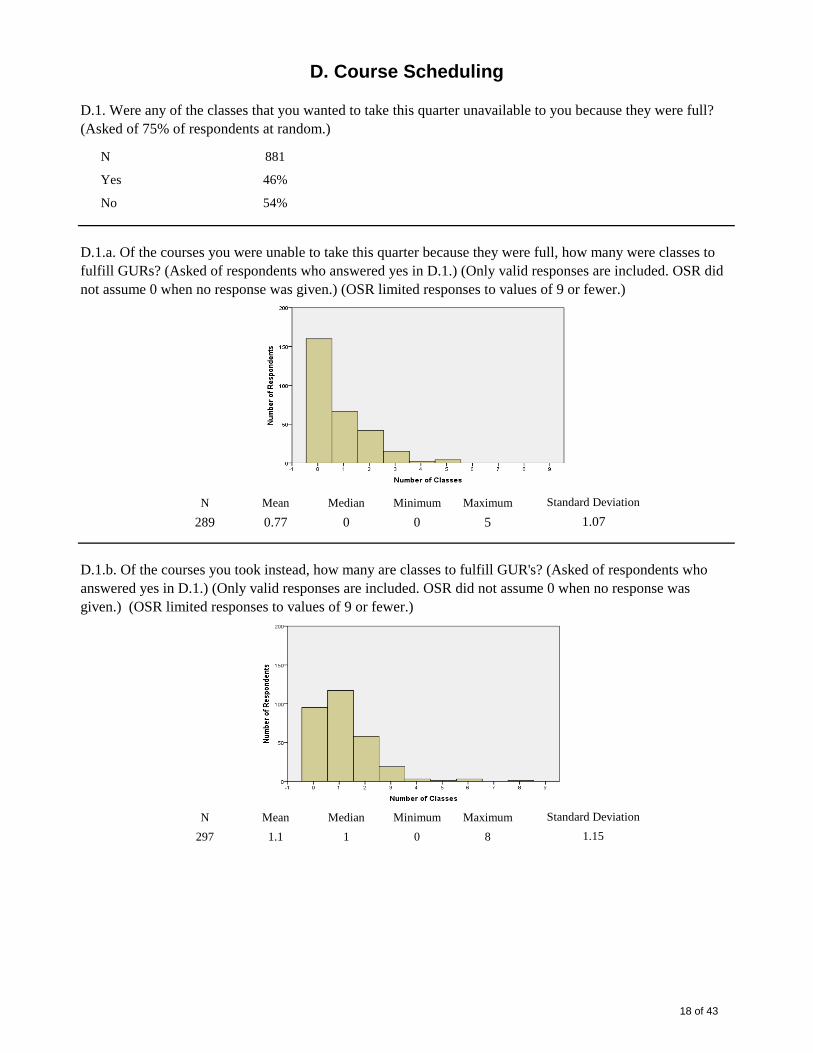
N 881
Yes 46%
No 54%
N Mean Median Minimum Maximum
289 0.77 0 0 5
N Mean Median Minimum Maximum
297 1.1 1 0 8 1.15
D. Course Scheduling
D.1.a. Of the courses you were unable to take this quarter because they were full, how many were classes to fulfill GURs? (Asked of respondents who answered yes in D.1.) (Only valid responses are included. OSR did not assume 0 when no response was given.) (OSR limited responses to values of 9 or fewer.)
Standard Deviation
1.07
D.1. Were any of the classes that you wanted to take this quarter unavailable to you because they were full? (Asked of 75% of respondents at random.)
Standard Deviation
D.1.b. Of the courses you took instead, how many are classes to fulfill GUR's? (Asked of respondents who answered yes in D.1.) (Only valid responses are included. OSR did not assume 0 when no response was given.) (OSR limited responses to values of 9 or fewer.)
18 of 43

N Mean Median Minimum Maximum
372 1.7 1 0 7
N Mean Median Minimum Maximum
322 1.4 1 0 5
Standard Deviation
1.03
Course Scheduling (cont.)
D.1.c. Of the courses you were unable to take this quarter because they were full, how many were classes for your major or pre-major which did not fulfill a GUR? (Asked of respondents who answered yes in D.1.) (Only valid responses are included. OSR did not assume 0 when no response was given.) (OSR limited responses to values of 9 or fewer.)
D.1.d. Of the courses you took instead, how many are classes for your major or pre-major which did not fulfill a GUR? (Asked of respondents who answered yes in D.1.) (Only valid responses are included. OSR did not assume 0 when no response was given.) (OSR limited responses to values of 9 or fewer.)
Standard Deviation
1.12
19 of 43

N Mean Median Minimum Maximum
253 0.5 0 0 5
N Mean Median Minimum Maximum
277 0.8 1 0 4 0.87
Standard Deviation
0.93
Course Scheduling (cont.)
D.1.f. Of the courses you took instead, how many are non-GUR courses outside your major or pre-major? (Asked of respondents who answered yes in D.1.) (Only valid responses are included. OSR did not assume 0 when no response was given.) (OSR limited responses to values of 9 or fewer.)
D.1.e. Of the courses you were unable to take this quarter because they were full, how many were non-GUR courses outside your major or pre-major? (Asked of respondents who answered yes in D.1.) (Only valid responses are included. OSR did not assume 0 when no response was given.) (OSR limited responses to values of 9 or fewer.)
Standard Deviation
20 of 43
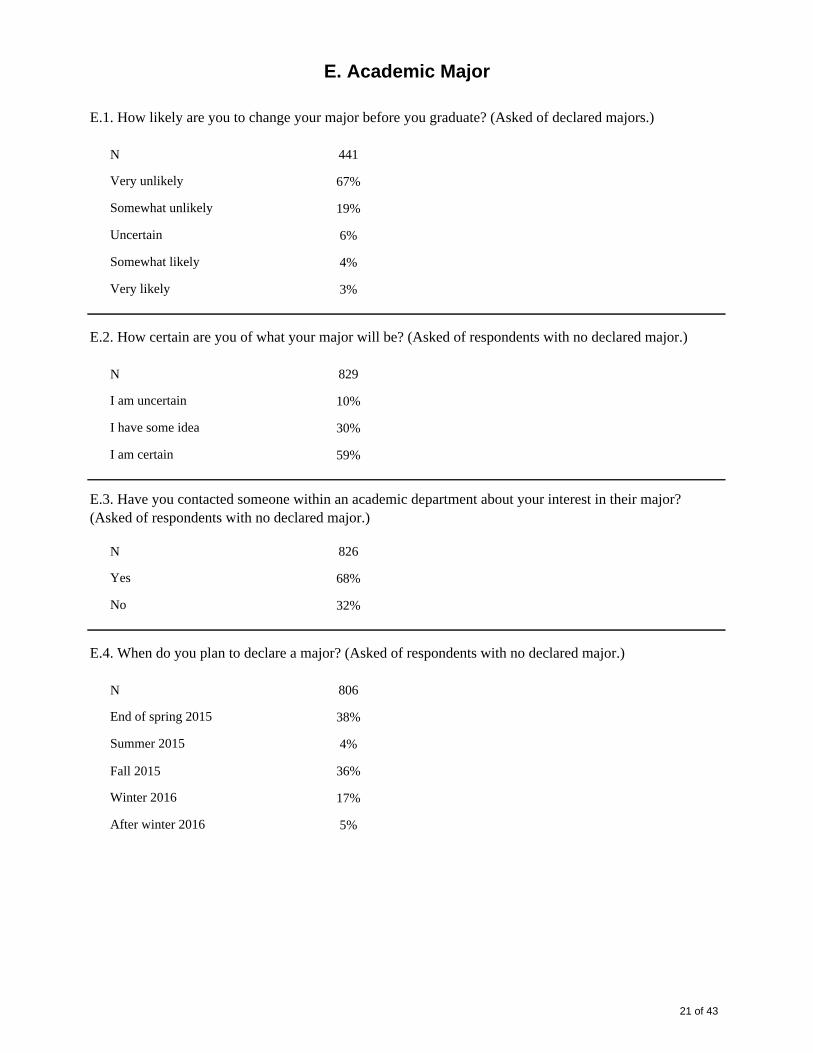
N 441
67%
19%
6%
4%
3%
N 829
10%
30%
59%
N 826
68%
32%
N 806
38%
4%
Fall 2015 36%
17%
5%
Summer 2015
Winter 2016
After winter 2016
E.3. Have you contacted someone within an academic department about your interest in their major? (Asked of respondents with no declared major.)
Yes
No
E.4. When do you plan to declare a major? (Asked of respondents with no declared major.)
I have some idea
Somewhat likely
Very likely
I am certain
End of spring 2015
E. Academic Major
E.1. How likely are you to change your major before you graduate? (Asked of declared majors.)
E.2. How certain are you of what your major will be? (Asked of respondents with no declared major.)
I am uncertain
Very unlikely
Somewhat unlikely
Uncertain
21 of 43

N 710
Accounting 2%
American Cultural Studies 0%
Anthropology 3%
Art 2%
Biology 9%
Chemistry 3%
Communication 3%
Communication Sciences & Disorders 2%
Computer Science 8%
Decision Sciences 2%
Economics 3%
Elementary Education 4%
Engineering and Design 4%
English 1%
Environmental Sciences 6%
Environmental Studies 5%
Fairhaven College 2%
Finance & Marketing 4%
Finance, Marketing & Decision Sciences 0%
General Studies 0%
Geography 0%
Geology 1%
History 1%
Human Services and Rehabilitation 4%
Interdisciplinary Arts 0%
International Studies 0%
Journalism 3%
Liberal Studies 0%
Linguistics 1%
Management 6%
Mathematics 2%
Modern and Classical Languages 1%
Music 0%
Philosophy 0%
Physical Education, Health & Recreation 2%
Physics and Astronomy 1%
Political Science 1%
Psychology 9%
Science Education 0%
Secondary Education 0%
Sociology 3%
Special Education 1%
Theatre Arts and Dance 0%
Academic Major (cont.)
E.5. Which department houses the major you plan to declare? (Asked of respondents with no declared major who "have some idea" or are "certain" of which major they plan to declare.)
22 of 43

N Not at all Minor reason Major reason
Didn't know how to officially declare 482 56% 33% 11%
Not sure about what major to declare 482 48% 27% 26%
Recently decided on a major but haven't had time to officially declare it
482 52% 30% 17%
Needed to take more courses to qualify 483 28% 26% 47%
Difficulty meeting grade requirements for admission to the major
477 63% 21% 16%
Too hard to get into courses needed to qualify 481 52% 24% 24%
Department advising was inadequate or lacking
478 75% 18% 7%
Missed deadline for declaring my major this year
477 80% 14% 6%
E.6. To what extent is each of the following a reason for not having officially declared a major prior to this time? (Asked respondents with no declared major who "have some idea" or are "certain" of which major they plan to declare.)
Academic Major (cont.)
23 of 43

N 439
Yes 73%
No 27%
NVery
dissatisfiedDissatisfied Neutral Satisfied
Very satisfied
318 1% 3% 12% 40% 44%
317 3% 5% 19% 32% 41%
315 5% 14% 45% 19% 16%
317 4% 9% 40% 28% 19%
N 319
Very dissatisfied 1%
Dissatisfied 6%
Neutral 19%
Satisfied 46%
Very satisfied 28%
Understanding career opportunities
F.1.b. Overall, how satisfied are you with the advising services in the {Major} department? (Asked of respondents who answered "yes" in F.1.)
F.1.a. For each of the following, please rate how helpful your {Major} advisor has been. (Asked of respondents who answered "yes" in F.1.)
F. Major Advising
F.1. Have you sought advising from your major department? (Asked of declared majors.)
Understanding the requirements of your major
Selecting courses to take
Understanding internship opportunities
24 of 43
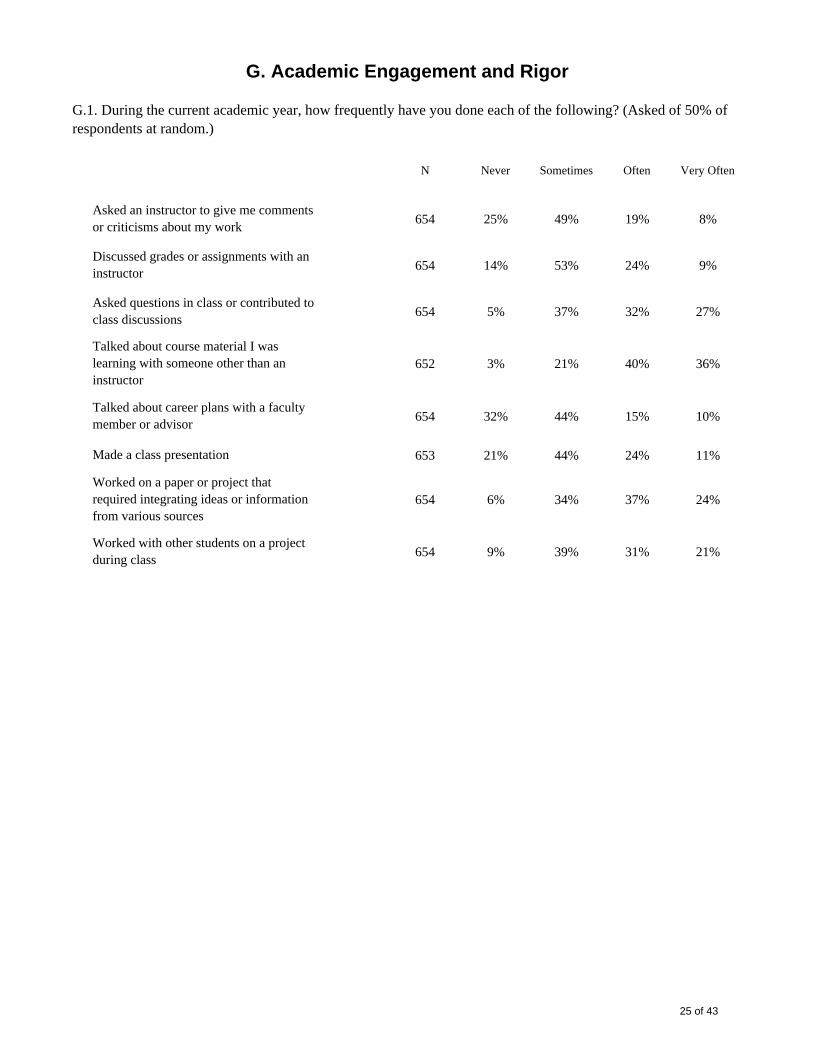
N Never Sometimes Often Very Often
654 25% 49% 19% 8%
654 14% 53% 24% 9%
654 5% 37% 32% 27%
652 3% 21% 40% 36%
654 32% 44% 15% 10%
653 21% 44% 24% 11%
654 6% 34% 37% 24%
654 9% 39% 31% 21%
G. Academic Engagement and Rigor
Talked about course material I was learning with someone other than an instructor
Talked about career plans with a faculty member or advisor
Made a class presentation
Worked with other students on a project during class
Worked on a paper or project that required integrating ideas or information from various sources
Asked an instructor to give me comments or criticisms about my work
G.1. During the current academic year, how frequently have you done each of the following? (Asked of 50% of respondents at random.)
Discussed grades or assignments with an instructor
Asked questions in class or contributed to class discussions
25 of 43
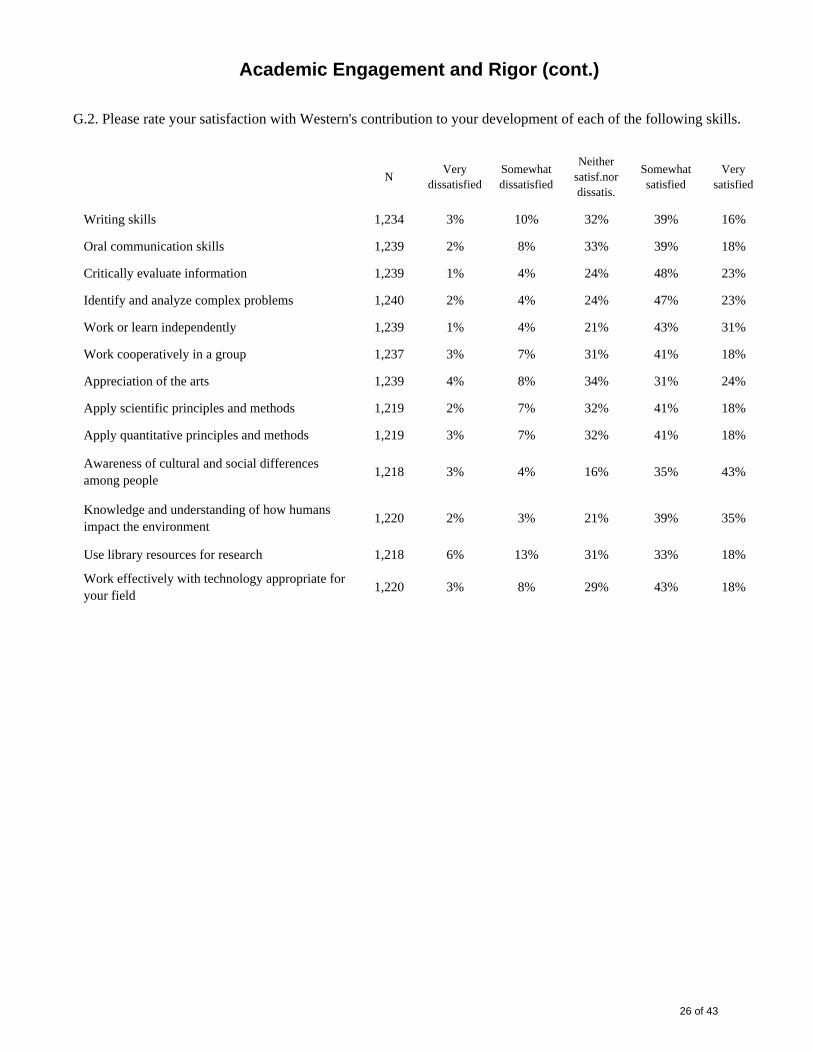
NVery
dissatisfiedSomewhat dissatisfied
Neither satisf.nor dissatis.
Somewhat satisfied
Very satisfied
Writing skills 1,234 3% 10% 32% 39% 16%
Oral communication skills 1,239 2% 8% 33% 39% 18%
Critically evaluate information 1,239 1% 4% 24% 48% 23%
Identify and analyze complex problems 1,240 2% 4% 24% 47% 23%
Work or learn independently 1,239 1% 4% 21% 43% 31%
Work cooperatively in a group 1,237 3% 7% 31% 41% 18%
Appreciation of the arts 1,239 4% 8% 34% 31% 24%
Apply scientific principles and methods 1,219 2% 7% 32% 41% 18%
Apply quantitative principles and methods 1,219 3% 7% 32% 41% 18%
Awareness of cultural and social differences among people
1,218 3% 4% 16% 35% 43%
Knowledge and understanding of how humans impact the environment
1,220 2% 3% 21% 39% 35%
Use library resources for research 1,218 6% 13% 31% 33% 18%
Work effectively with technology appropriate for your field
1,220 3% 8% 29% 43% 18%
G.2. Please rate your satisfaction with Western's contribution to your development of each of the following skills.
Academic Engagement and Rigor (cont.)
26 of 43
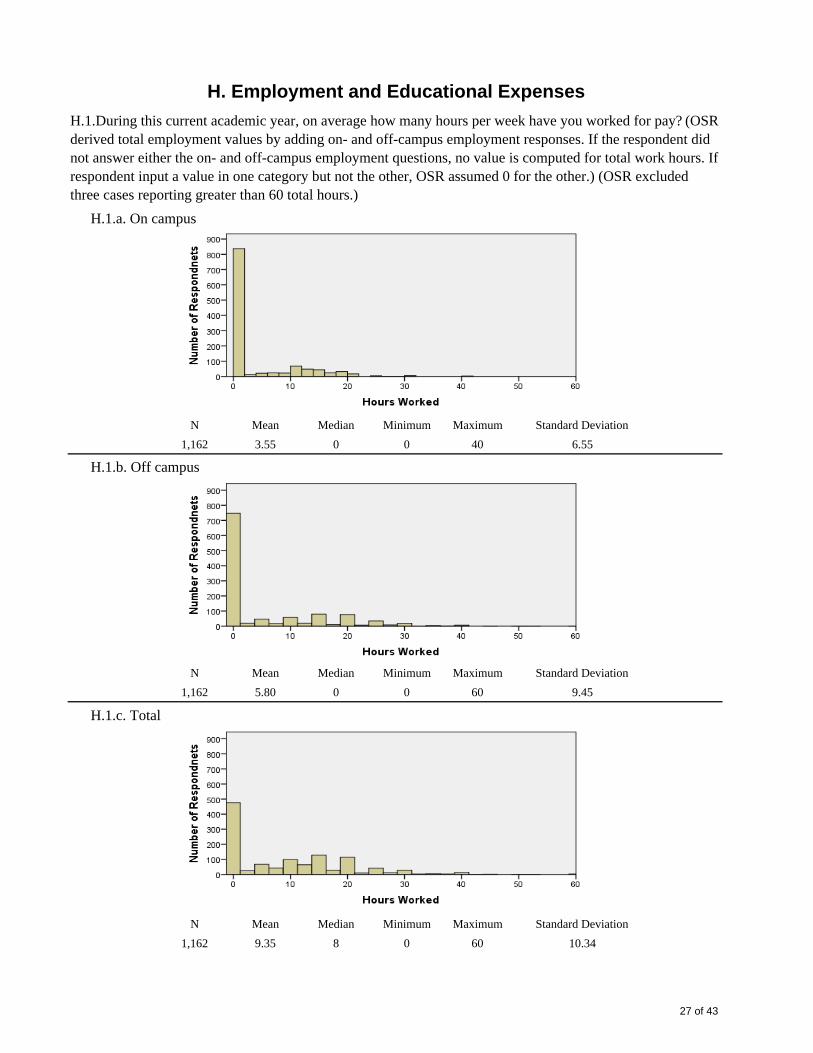
N Mean Median Minimum Maximum Standard Deviation
1,162 3.55 0 0 40 6.55
N Mean Median Minimum Maximum Standard Deviation
1,162 5.80 0 0 60 9.45
N Mean Median Minimum Maximum Standard Deviation
1,162 9.35 8 0 60 10.34
H.1.During this current academic year, on average how many hours per week have you worked for pay? (OSR derived total employment values by adding on- and off-campus employment responses. If the respondent did not answer either the on- and off-campus employment questions, no value is computed for total work hours. If respondent input a value in one category but not the other, OSR assumed 0 for the other.) (OSR excluded three cases reporting greater than 60 total hours.)
H. Employment and Educational Expenses
H.1.a. On campus
H.1.b. Off campus
H.1.c. Total
27 of 43

N 1,228
Yes 48%
No 52%
N 1,215
Yes 52%
No 48%
N Mean Median Minimum MaximumStandard Deviation
438 $11,395 $10,000 $0 $60,000 $9,759
273 $9,299 $3,000 $0 $55,000 $12,498
173 $707 $0 $0 $20,000 $3,004
Other 142 $2,077 $0 $0 $69,500 $7,495
Total 476 $16,695 $11,000 $8 $75,000 $14,460
N Mean Median Minimum Maximum St. Dev.
503 $33,042 $24,000 $0 $150,000 $27,679
Employment and Educational Expenses (cont.)
H.2. Have you, or someone else on your behalf, borrowed money to fund your education?
H.2.a. Will additional funds be borrowed to complete your education at Western? (Or if respondent indicated in H.2. that no funds have been borrowed yet, 'Will any money be borrowed to complete your education at Western'?)
H.2.c. When you graduate, approximately how much will be owed for your education? (Asked of respondents who indicated in H.2.a. that additional funds will be borrowed to complete their education at Western.) (OSR excluded three cases reporting greater than $150,000.)
H.2.b. As of now, approximately how much have you (or someone on your behalf) borrowed in each of the following categories to fund your education? (Asked of respondents who indicated "yes" in H.2., that they or someone else have borrowed money to fund their education.) (OSR assumed 0 for categories with no response if the respondent gave a valid amount for at least one category.) (OSR limited values to a maximum total of $75,000.)
Loans in your name
Loans in someone else's name
Credit cards
28 of 43
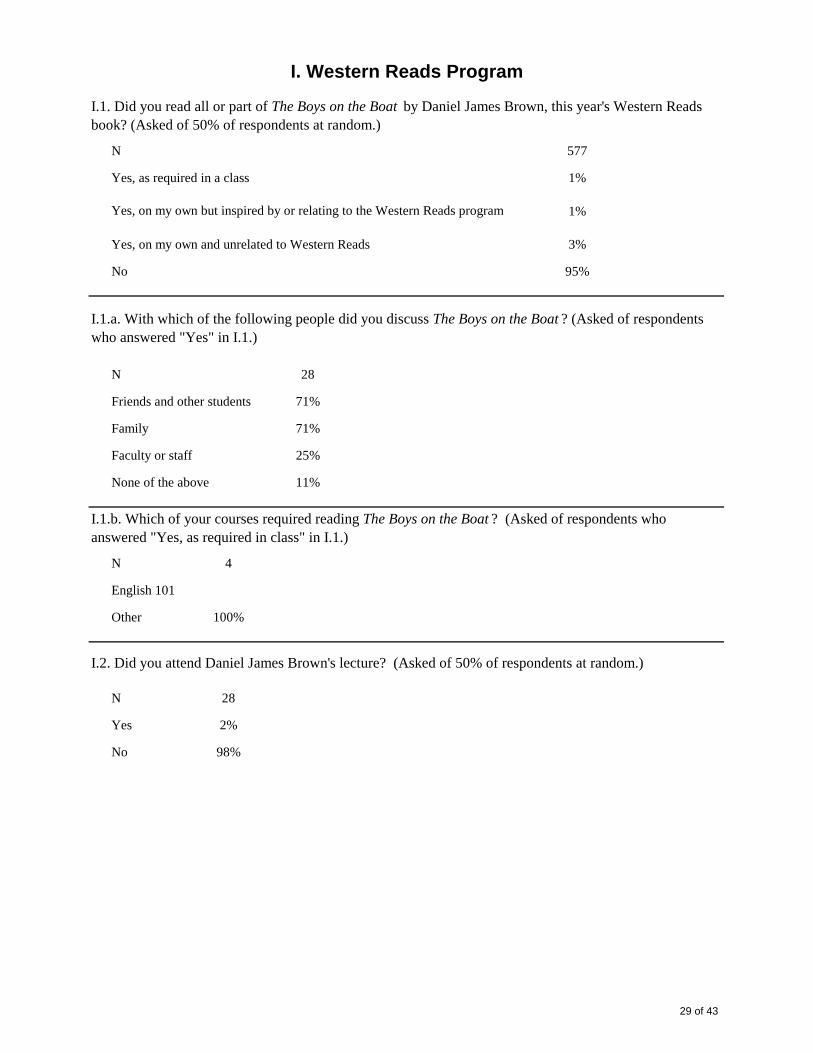
N 577
Yes, as required in a class 1%
1%
Yes, on my own and unrelated to Western Reads 3%
No 95%
N 28
Friends and other students 71%
Family 71%
Faculty or staff 25%
None of the above 11%
N 4
English 101
Other 100%
N 28
Yes 2%
No 98%
I.2. Did you attend Daniel James Brown's lecture? (Asked of 50% of respondents at random.)
I. Western Reads Program
I.1. Did you read all or part of The Boys on the Boat by Daniel James Brown, this year's Western Reads book? (Asked of 50% of respondents at random.)
Yes, on my own but inspired by or relating to the Western Reads program
I.1.a. With which of the following people did you discuss The Boys on the Boat ? (Asked of respondents who answered "Yes" in I.1.)
I.1.b. Which of your courses required reading The Boys on the Boat ? (Asked of respondents who answered "Yes, as required in class" in I.1.)
29 of 43
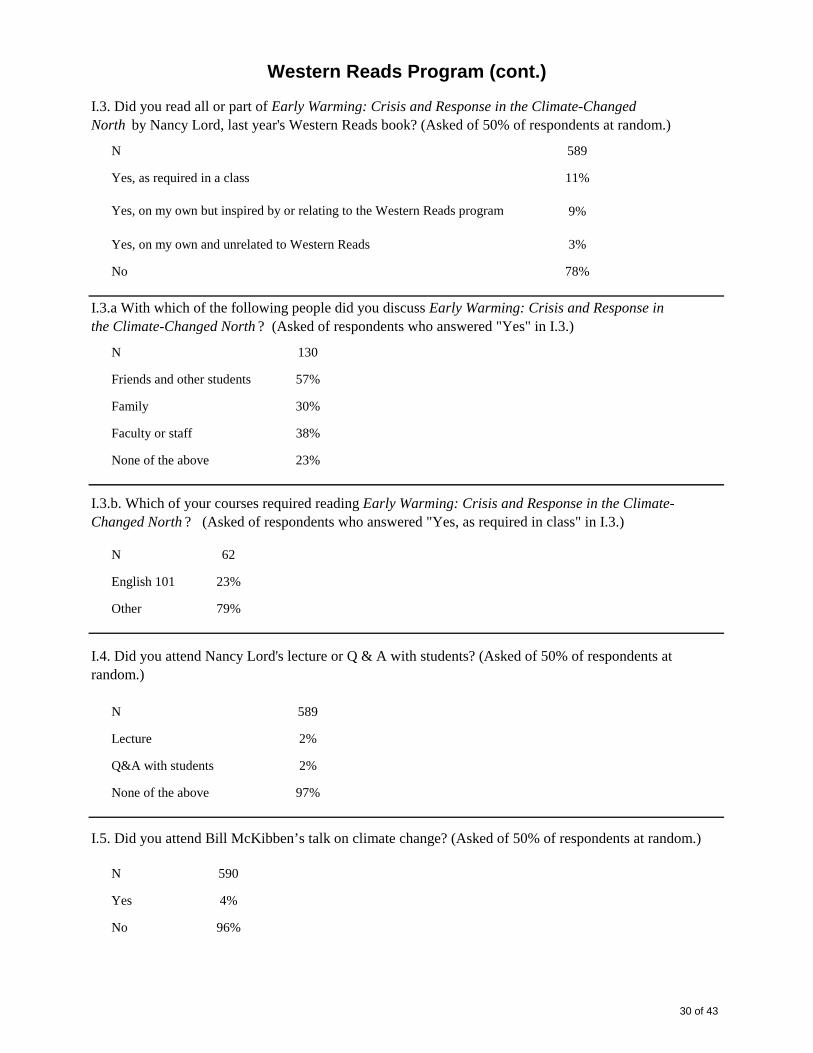
N 589
Yes, as required in a class 11%
9%
Yes, on my own and unrelated to Western Reads 3%
No 78%
N 130
Friends and other students 57%
Family 30%
Faculty or staff 38%
None of the above 23%
N 62
English 101 23%
Other 79%
N 589
Lecture 2%
Q&A with students 2%
None of the above 97%
N 590
Yes 4%
No 96%
I.5. Did you attend Bill McKibben’s talk on climate change? (Asked of 50% of respondents at random.)
Western Reads Program (cont.)
I.3. Did you read all or part of Early Warming: Crisis and Response in the Climate-ChangedNorth by Nancy Lord, last year's Western Reads book? (Asked of 50% of respondents at random.)
Yes, on my own but inspired by or relating to the Western Reads program
I.3.a With which of the following people did you discuss Early Warming: Crisis and Response inthe Climate-Changed North ? (Asked of respondents who answered "Yes" in I.3.)
I.3.b. Which of your courses required reading Early Warming: Crisis and Response in the Climate-Changed North ? (Asked of respondents who answered "Yes, as required in class" in I.3.)
I.4. Did you attend Nancy Lord's lecture or Q & A with students? (Asked of 50% of respondents at random.)
30 of 43

N 1,161
Very dissatisfied 7%
Dissatisfied 16%
Neither satisfied nor dissatisfied 22%
Satisfied 44%
Very satisfied 12%
University Residences
I.6. How satisfied are you with your experience living in campus housing? (Asked of respondents who lived in campus housing for one or more quarters.)
31 of 43
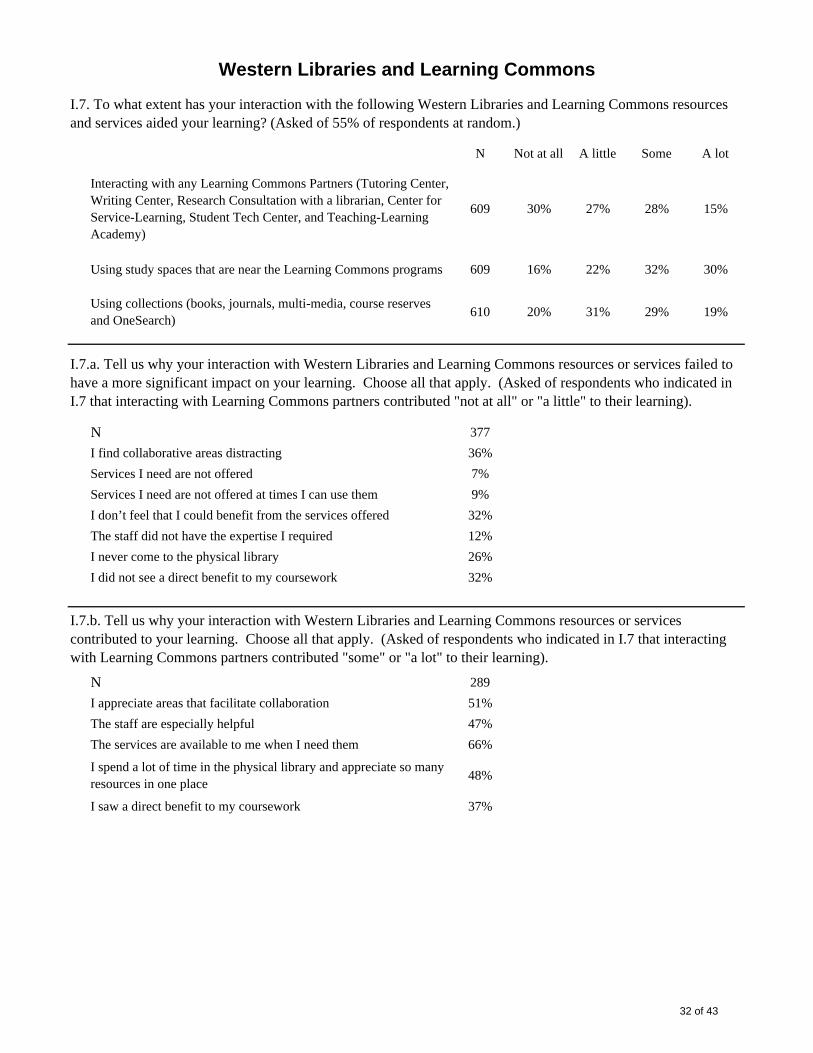
N Not at all A little Some A lot
Interacting with any Learning Commons Partners (Tutoring Center, Writing Center, Research Consultation with a librarian, Center for Service-Learning, Student Tech Center, and Teaching-Learning Academy)
609 30% 27% 28% 15%
Using study spaces that are near the Learning Commons programs 609 16% 22% 32% 30%
Using collections (books, journals, multi-media, course reserves and OneSearch)
610 20% 31% 29% 19%
N 377
I find collaborative areas distracting 36%
Services I need are not offered 7%
Services I need are not offered at times I can use them 9%
I don’t feel that I could benefit from the services offered 32%
The staff did not have the expertise I required 12%
I never come to the physical library 26%
I did not see a direct benefit to my coursework 32%
N 289
I appreciate areas that facilitate collaboration 51%
The staff are especially helpful 47%
The services are available to me when I need them 66%
I spend a lot of time in the physical library and appreciate so many resources in one place
48%
I saw a direct benefit to my coursework 37%
I.7.b. Tell us why your interaction with Western Libraries and Learning Commons resources or services contributed to your learning. Choose all that apply. (Asked of respondents who indicated in I.7 that interacting with Learning Commons partners contributed "some" or "a lot" to their learning).
Western Libraries and Learning Commons
I.7. To what extent has your interaction with the following Western Libraries and Learning Commons resources and services aided your learning? (Asked of 55% of respondents at random.)
I.7.a. Tell us why your interaction with Western Libraries and Learning Commons resources or services failed to have a more significant impact on your learning. Choose all that apply. (Asked of respondents who indicated in I.7 that interacting with Learning Commons partners contributed "not at all" or "a little" to their learning).
32 of 43
N 256
I don’t have a need for these services or resources 29%
I rarely study in the Learning Commons spaces 48%
I prefer to study in the quiet areas of the library 34%
I prefer to study elsewhere on campus 36%
I don’t study on campus 32%
N 409
I appreciate having support services and resources close at hand when I study 62%
I appreciate having food services close at hand when I study 63%
I like the comfortable and inviting furniture 58%
I want to be able to interact with others when I study 34%
I don’t have any other places where I can study 16%
N 245
It's difficult to identify the materials I need 27%
I find the layout of the building too confusing when looking for items 20%
I can't find books or other items the library owns using OneSearch 9%
I find it difficult to use the various to use the databases effectively 18%
The course reserves items I needed were not available 12%
N 337
The staff have helped me understand how to identify and find the materials I need 23%
I have become familiar with the layout of the building so know where to look for items 40%
I have learned how to use OneSearch 42%
I have learned how to use the databases effectively 33%
The course reserve items for my classes were available when I needed 32%
I.8. Is there anything else you would like to tell us about your experience with Western Librariesand Learning Commons? (Asked of 40% of respondents at random.) (N=82) (Text responses available on request.)
I.7.e. Tell us why Western Libraries and Learning Commons collections failed to have a more significant impact on your learning. Choose all that apply. (Asked of respondents who indicated in I.7 that Western Libraries and Learning Commons collections contributed "not at all" or "a little" to their learning.
I.7.f. Tell us why Western Libraries and Learning Commons collections contributed to your learning. Choose all that apply. (Asked of respondents who indicated in I.7 that Western Libraries and Learning Commons collections contributed "some" or "a lot" to their learning.
Western Libraries and Learning Commons (cont.)
I.7.c. Tell us why Western Libraries and Learning Commons spaces failed to have a more significant impact on your learning. Choose all that apply. (Asked of respondents who indicated in I.7 that Western Libraries and Learning Commons spaces contributed "not at all" or "a little" to their learning.
I.7.d. Tell us why Western Libraries and Learning Commons spaces contributed to your learning. Choose all that apply. (Asked of respondents who indicated in I.7 that Western Libraries and Learning Commons spaces contributed "some" or "a lot" to their learning.
33 of 43

N 187
The quality of the course was better in the online format 9%
Schedule flexibility 67%
To make progress toward my degree 43%
The traditional format course sections were full 11%
The course was not offered that quarter in a traditional format
19%
The traditional format course had major restrictions that I did not meet
1%
To repeat a class already taken in a traditional format
1%
To gain admission or re-admission to western 1%
Other 5%
No 653Yes 21%
No 79%
N None OneTwo or more
High school 119 37% 42% 21%
Two-year college 116 42% 24% 34%
Four-year college (excluding Western) 96 92% 5% 3%
Other 96 94% 2% 4%
No 656Yes 19%
No 44%
I don't know 37%
I.11. Do you expect to take an online course at Western between now and graduation?
I.10.a. How many online courses have you completed through each of the following? (Asked of respondents who indicated in 1.9 that they had taken an online course at another institution.)
I.9. Why did you choose to take a course (or courses) online through Western? Check all that apply. (Asked of respondents who have taken an online course through Western.)
Online Courses
For the following questions, "online" refers to a course format where required interaction is exclusively online. "Traditional' refers to courses that are primarily face-to-face interaction, whether or not they have an online component.
I.10. Have you ever taken an online course at another institution or high school? (Asked of 55% of respondents at random.)
34 of 43

NOnline is a lot
better
Online is somewhat
better
Online and traditional are
equal
Traditional is somewhat
better
Traditional is a lot better
Learning more 578 0% 3% 22% 33% 42%
Getting good grades 578 9% 17% 37% 17% 20%
Making progress toward my degree 577 1% 5% 40% 21% 33%
Quality of interaction with faculty 581 0% 2% 9% 23% 66%
Quantity of interaction with faculty 581 1% 3% 11% 21% 64%
Class discussions 580 2% 4% 11% 24% 59%
Scheduling around other courses 576 41% 30% 15% 6% 8%
Scheduling around a job 579 47% 28% 15% 5% 6%
Sscheduling around family or other respnsibilities
578 39% 29% 20% 5% 7%
Confidence in my ability to succeed 579 3% 6% 37% 25% 30%
N No preference
GURs 583 38%
Major or minor requirements 584 17%
Courses outside my major/minor 582 46%
NStrongly disagree
DisagreeNeither agreenor disagree
AgreeStrongly
agree
In general, I like taking online courses 201 17% 26% 29% 20% 7%
In an ideal world, I would enroll in a mix of traditional on-campus classes and online classes while I am a Western student
267 18% 29% 27% 17% 9%
I wish Western offered more online courses 267 9% 27% 42% 13% 9%
Western should retain its identity as an on-campus university and resist the move toward online education
266 4% 14% 36% 24% 23%
I.14. To what extent do you agree with the following? (Asked of 50% of respondents at random). (Only respondents who had previously taken an online course were asked the first item below).
Online Courses (cont.)
I.12. Do you think online or traditional courses are better for the following purposes? (Asked of 50% of respondents at random).
I.13. Do you prefer an online or traditional format for the following types of classes? (Asked of 50% of respondents who had previously taken an online course).
Prefer online Prefer traditional
19%
1%
7%
43%
82%
47%
35 of 43
N Mean Median Maximum
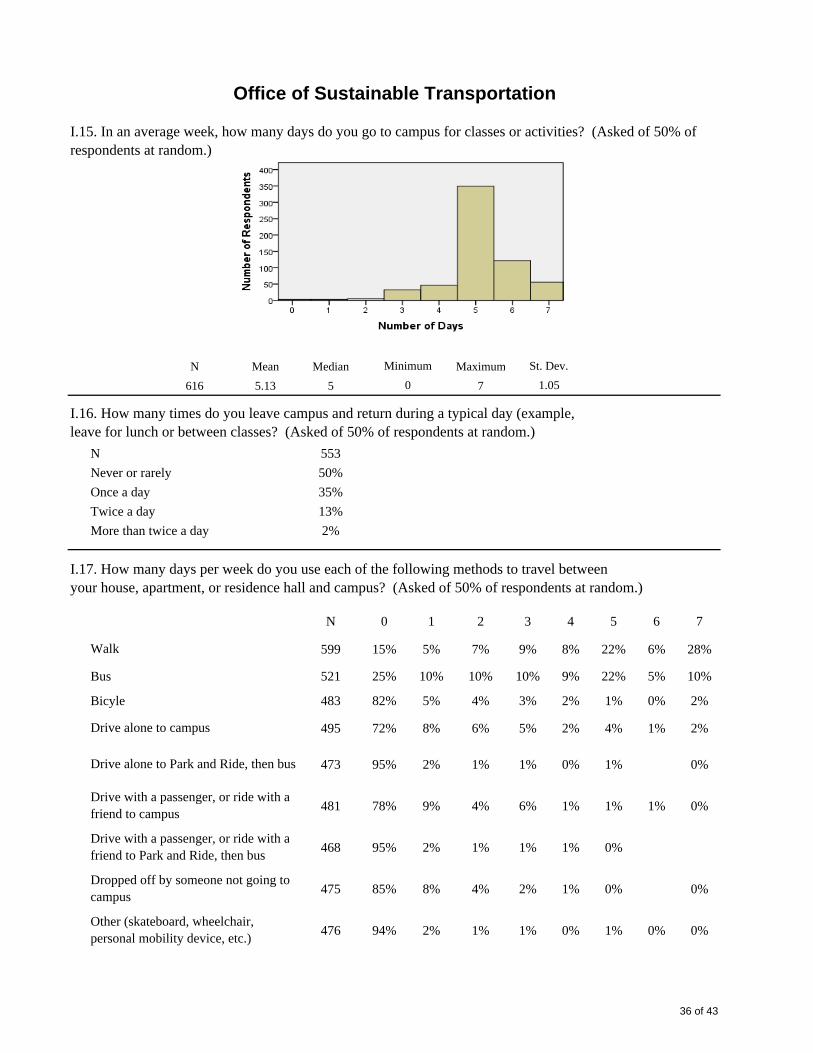
616 5.13 5 7
N 553
Never or rarely 50%
Once a day 35%
Twice a day 13%
More than twice a day 2%
N 0 1 2 3 4 5 6 7
599 15% 5% 7% 9% 8% 22% 6% 28%
Bus 521 25% 10% 10% 10% 9% 22% 5% 10%
Bicyle 483 82% 5% 4% 3% 2% 1% 0% 2%
495 72% 8% 6% 5% 2% 4% 1% 2%
473 95% 2% 1% 1% 0% 1% 0%
481 78% 9% 4% 6% 1% 1% 1% 0%
468 95% 2% 1% 1% 1% 0%
475 85% 8% 4% 2% 1% 0% 0%
476 94% 2% 1% 1% 0% 1% 0% 0%
Drive with a passenger, or ride with a friend to campus
Drive with a passenger, or ride with a friend to Park and Ride, then bus
Dropped off by someone not going to campus
Other (skateboard, wheelchair, personal mobility device, etc.)
Office of Sustainable Transportation
I.15. In an average week, how many days do you go to campus for classes or activities? (Asked of 50% of respondents at random.)
I.16. How many times do you leave campus and return during a typical day (example,leave for lunch or between classes? (Asked of 50% of respondents at random.)
I.17. How many days per week do you use each of the following methods to travel betweenyour house, apartment, or residence hall and campus? (Asked of 50% of respondents at random.)
Walk
Drive alone to campus
Drive alone to Park and Ride, then bus
Minimum St. Dev.
0 1.05
36 of 43
N 622
Yes 96%
No 4%
Map Code Percent Map Code Percent
1 10% 11 0%
2 51% 12 1%
3 24% 13 0%
4 5% 14
5 0% 16
6 5% 20
7 1% 22
8 3% 23
9 1% 26
10 0%
N 25
Skagit County 12%
Snohomish County 12%
Lynden, Laurel, Merdian north of Horton 12%
Everson, Nooksack, Sumas 8%
unincorporated Whatcom County 4%
King County 4%
Blaine, Birch Bay, Custer, Semiahmoo 4%
Marine Drive west of Airport Drive, Marietta 4%
Gooseberry Point, Lummi Island 4%
Other 36%
Office of Sustainable Transportation (cont)
I.18.When attending Western, do you live within the area encompassed by the map below (see next page.) (Asked of 50% of respondents at random.)
I.18.a. Please select the number corresponding to the area in which you live while attending Western. (Asked of respondents who answered "yes" in I.18.) (N = 593) (Map is on the next page.)
I.18.b. Where do you live while attending Western? (Asked of respondents who answered "no" in I.18.)
37 of 43

38 of 43
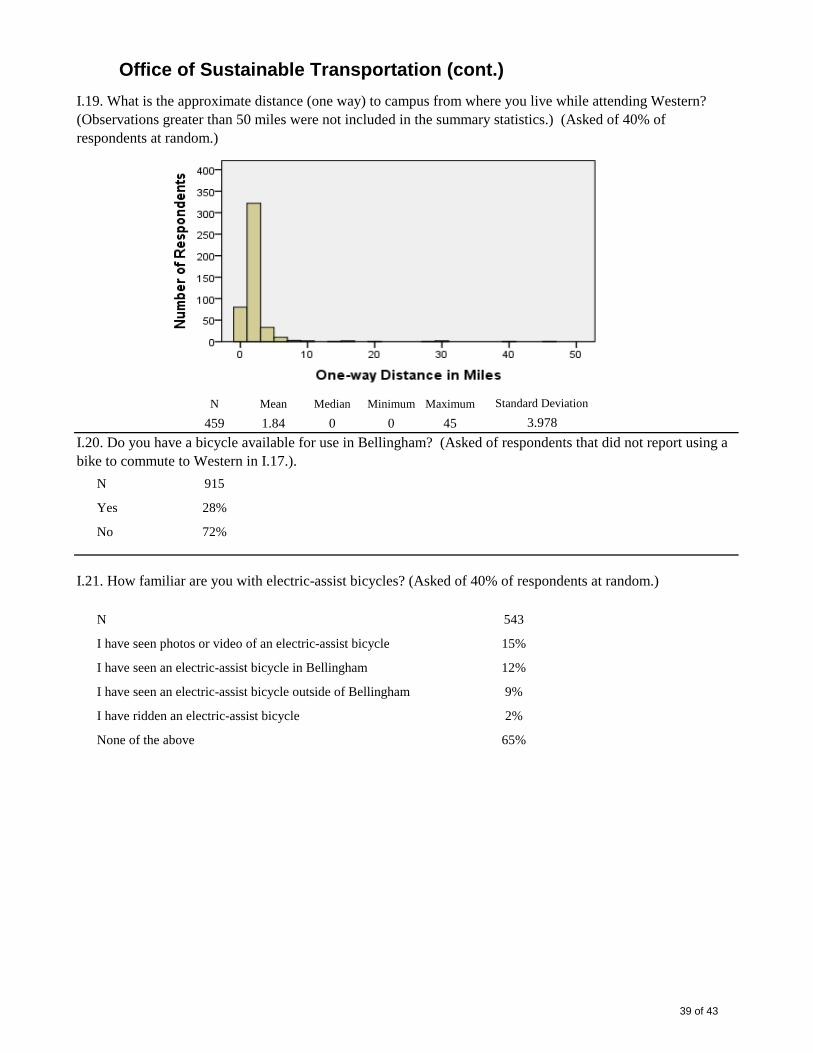
N Mean Median Minimum Maximum
459 1.84 0 0 45
N 915
Yes 28%
No 72%
N 543
I have seen photos or video of an electric-assist bicycle 15%
I have seen an electric-assist bicycle in Bellingham 12%
I have seen an electric-assist bicycle outside of Bellingham 9%
I have ridden an electric-assist bicycle 2%
None of the above 65%
I.21. How familiar are you with electric-assist bicycles? (Asked of 40% of respondents at random.)
I.20. Do you have a bicycle available for use in Bellingham? (Asked of respondents that did not report using a bike to commute to Western in I.17.).
Office of Sustainable Transportation (cont.)
I.19. What is the approximate distance (one way) to campus from where you live while attending Western? (Observations greater than 50 miles were not included in the summary statistics.) (Asked of 40% of respondents at random.)
Standard Deviation
3.978
39 of 43
N 303
Yes 75%
No 25%
N 227
Never 11%
Rarely 28%
Several times a month 9%
Several times a week 27%
Nearly every day 25%
N Never RarelySeveral times a month
Several times a week
Nearly every day
Use a campus parking permit (C or G lot permit) 191 54% 9% 6% 8% 22%
Park in C lots 194 17% 20% 24% 22% 18%
Use bus pass in G lots 181 89% 3% 3% 2% 2%
Pay at meters or pay boxes 183 67% 22% 8% 3%
482 33% 43% 21% 3%
Office of Sustainable Transportation (cont.)
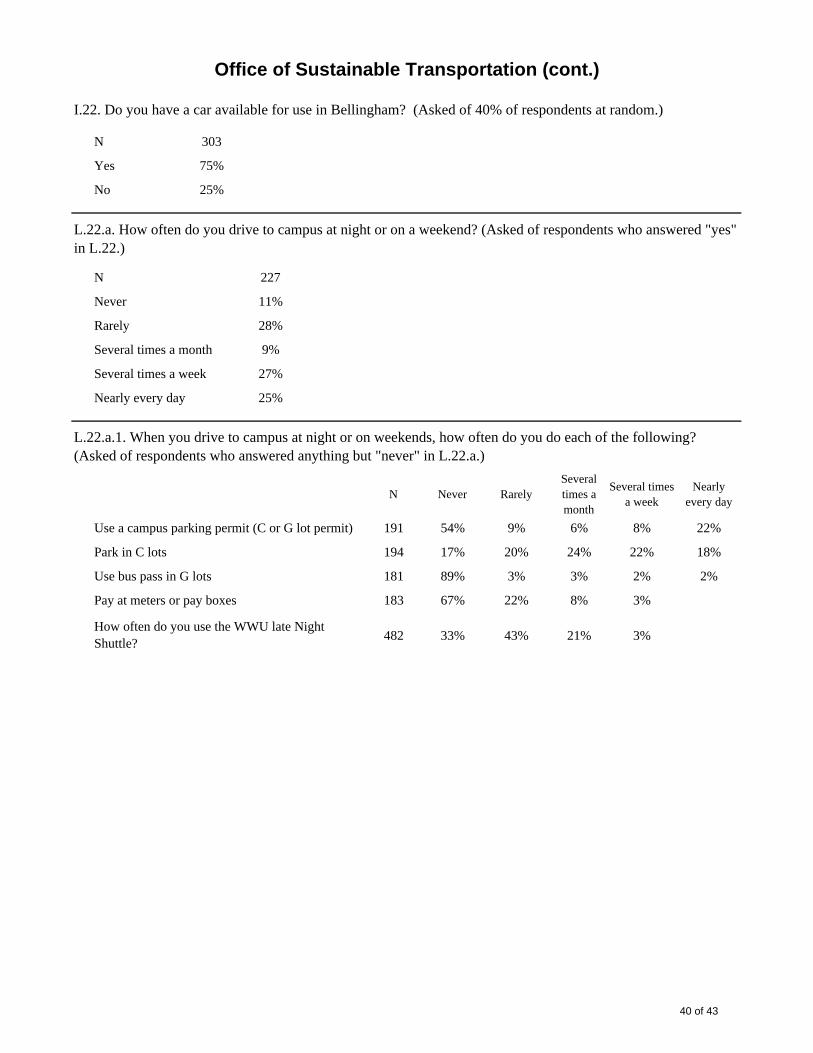
L.22.a. How often do you drive to campus at night or on a weekend? (Asked of respondents who answered "yes" in L.22.)
L.22.a.1. When you drive to campus at night or on weekends, how often do you do each of the following? (Asked of respondents who answered anything but "never" in L.22.a.)
How often do you use the WWU late Night Shuttle?
I.22. Do you have a car available for use in Bellingham? (Asked of 40% of respondents at random.)
40 of 43

N 552
Laptop computer 95%
Desktop computer 9%
Tablet computer 22%
Cell phone 98%
E-book reader 14%
Other wi-fi enabled device 15%
None of the above 0%
N 552
Laptop computer 35%
Tablet computer 11%
Cell phone 94%
E-book reader 2%
Other wi-fi enabled device 4%
None of the above
Technology
I.23. Which of the following devices do you have with you at Western this quarter? Check all that apply. (Asked of 50% of respondents at random.)
I.23.a. Which of the following devices do you typically bring to class? Check all that apply. (Asked of respondents indicating in I.23 that they had one or more of the following devices with them at Western this quarter. Respondents saw only the devices they checked in I.23.)
B.18.a.1. What other Wi-Fi enabled device do you have with you this quarter? (Open-ended question asked of respondents who answered "other wi-fi enabled device" in I.23 and I.23.a.) (N=17) (Responses included: iPod, i-touch.) (Text responses available on request.)
41 of 43

N 524
Windows 54%
OS X 40%
Linux 1%
Other 3%
I don't know 3%
N 47
Windows 83%
OS X 6%
Linux 6%
Other 2%
I don't know 2%
N 121
iOS 61%
Android 17%
Windows 14%
Blackberry 1%
I don't know 3%
Other 4%
Technology
I.23.b What type of operating system is your laptop computer running? (Asked of respondents indicating in I.23 that they brought a laptop computer to Western this quarter.)
I.23.c What type of operating system is your desktop computer running? (Asked of respondents indicating in I.23 that they brought a desktop computer to Western this quarter.)
I.23.d What type of operating system is your tablet running? (Asked of respondents indicating in I.18 that they brought a tablet to Western this quarter.)
42 of 43

N 539
Smartphone 93%
Texting (with texting plan) 61%
None of the above 1%
N NeverLess than weekly
Weekly Daily Hourly
Facebook 543 5% 5% 19% 56% 15%
Twitter 542 61% 11% 7% 15% 6%
Email 545 1% 1% 10% 65% 23%
YouTube 545 3% 17% 34% 41% 5%
Instant Messenger 538 65% 8% 10% 11% 6%
SMS/text messaging 543 3% 1% 4% 41% 52%
Google+ 541 71% 11% 7% 9% 2%
QR (Quick Response) Codes 540 96% 3% 1% 0% 0%
Reddit 542 74% 8% 6% 8% 4%
Foursquare 539 98% 1% 0% 1% 0%
LinkedIn 541 83% 10% 4% 2% 0%
Groupon or other "daily deal" service 540 86% 11% 2% 1% 0%
Instagram 542 34% 8% 7% 39% 11%
Snapchat 542 18% 10% 13% 39% 20%
Kik 541 96% 2% 1% 1% 0%
Tinder 540 82% 9% 4% 4% 1%
Skype 540 53% 34% 10% 3% 1%
Yik-Yak 541 67% 14% 7% 10% 2%
Vine 542 80% 13% 4% 4% 1%
Pinterest 543 57% 16% 15% 10% 2%
Technology
I.23.e Which of the following capabilities does your cell phone or cell plan have? (Asked of respondents indicating in I.23 that they brought a cellphone to Western this quarter.)
I.24. During this quarter, how frequently have you used the following? (Asked of 50% of respondents at random.)
43 of 43