deselection: a novel approach to the peering process … · n-co co 01%. w. deselection: a novel...
TRANSCRIPT

N-COCO01%
wDESELECTION: A NOVEL APPROACH
TO THE PEERING PROCESS
Paul B. Duby
OFFICE OF INSTITUTIONAL RESEARCHNorthern Michigan University
Marquette, Michigan
BEST COPY AVAILABLE
Paper presented at the 28th Annual Forum of the Associationfor Institutional Research
'phoenix, Arizona'PERMISSION TO REPRODUCE THIS May, 1988 U.S. DEPARTMENT OF EDUCATION
OtOce of Educational Research and improvement
EDUCATIONAL RESOURCES INFORMATIONCENTER (ERIC)
24.1his document has been reproduced asreceived from the pillson or organizatiOnoriginating
0 Minor changes have been made to improvereproduction quality
MATERIAL HAS BEEN GRANTED BY
AIR
TO THE EDUCATIONAL RESOURCESINFORMATION CENTER (ERIC)." 2
Points of viewor opnionsstaledinthisdocument do not necessarily represent officialOERI position or policy

DESELECTION: A NOVEL APPROACHTO THE PEERING PROCESS
Paul B. Duby
OFFICE OF INSTITUTIONAL RESEARCHNorthern Michigan University
Marquette, Michigan
BEST COPY AVAILABLE
Paper presented at the 28th Annual Forum of the Associationfor Institutional Research
''hoenix, Arizona"PERMISSION TO REPRODUCE THIS May, 1988 U.S. OEPAFTTAIENT OF EDUCATION
Office of Edu Carona' Research and ImptovemenlMATERIAL HAS BEEN GRANTED BY
TO THE EDUCATIONAL RESOURCESINFORMATION CENTER (ERIC)." 2
EDUCATIONAL RESOURCES INFORMATIONCENTER (ERIC)
Finis document has been reproduced asreceived from the person or organizationoriginating IL
0 Minor changes have been made to Improvereproduction quality
Points of view°, opinions stated in this decryment do not necessarily represent officialOERI posMon or policy,

ARfor Management Research, Polky Analysis, and Planning
This paper was presented at the Twenty-EighthAnnual Forum of the Association for InstitutionalResearch held at the Hyatt Regency Phoenix Hotel,Phoenix, Arizona, May 15-18, 1988. This paperwas reviewed by the AIR Forum PublicationsCommittee and was judged to be of high quality andof interest to others concerned with the research
of higher education. It has therefore beenselected to be included in the ERIC Collection of
Forum Papers.
Teresa KarolewskiChair and EditorForum Publications EditorialAdvisory Committee
DESELECTION: A NOVEL APPROACHTO THE PEER SELECTION PROCESS
Abstract
The purpose of this project was to devise a peeringprocedure which would be technically defensible, yet simple andequitable enough to allow agreement by both faculty andadministration of not only the peering process but also theproducts of the ensuing salary study. A national IIA data basewas built in LOTUS 1-2-3 format of secondary enrollment, revenue,and institutional data. A joint faculty-administrative advisorycommittee eventually negotiated the selection of five key dataelements.. Institutions not possessing these' characteristics were"deselected." The remaining forty-four schools became the agreedupon base for the national faculty salary survey.
Background and Problem
In 1984 the Office of Institutional Research at Northern Michigan
University conducted a salary study as the primary means for
determining how a small pool of salary equity funds would be
distributed among the faculty. The comparative salary
information was derived from a midwestern data base. Beginning
with a population of forty-two public IIA institutions in the
states of Illinois, Indiana, Michigan, Minnesota, Ohio and
Wisconsin, twenty-three schools were chosen by the four members
of an administrative advisory group. Surveys were sent out and
data from the respondents became the source for the salary equity
study. The results were presented to the faculty representative
of the collective bargaining unit. While there was some
questioning of motives and the peer selection strategy,
eventually the equity funds were distributed without a great deal
of rancor. For this researcher, two clear messages emerged from
this effort. First, a more effective and more defensible peering
4

Deselection: A Novel ApproachPage 2
mechanism would have to be developed. Second, in order for the
process to be a credible one, faculty as well as administrative
representatives needed to be actively involved at each and every
stage of the peering and salary survey process.
Problem
With the faculty contract expiring in 1987, the President of the
University indicated that a salary study would be conducted and
also that this study would employ a national peer group. The
problem, simply stated, was how to produce this national peer
group and the resulting salary data base in such a fashion that
it would be accepted and utilized by both faculty and
administrative representatives who were involved in the
collective bargaining process.
Relevant literature
In the 1960's and early 1970's, the process of peering had
largely been a judgmental exercise, in which the investigators
selected institutions which were similar to their own, With the
aggressive intrusion of state legislatures, Boards of Higher
Education and Trustees, the methodology has changed. The State
of Kansas has been particularly involved in this process. The
methodologies employed in this state (see e.g., Cleaver, 1981;
5

A
Deselection: A Novel ApproachPage 3
Rawson, Hoyt & Teeter, 1983; Teeter and Christal, 1984) are
basically representative of current approaches where HEGIS-like
data are employed to select institutions and then sophisticated
weighing formulae are utilized to adjust for the inevitable
interinstitutional differences.
In one sense, the peering process is akin to pairing in
experimental research in that when you pair on one variable you
tend to "unpair" on ten others. The pressing methodological
problem is the critical need to determine which are the essential
elements or factors which need to be paired. Once this is
decided, the next step is a simple one. Those institutions which
do not match these key criteria are eliminated or "deselected."
The choosing of the essential criteria must be negotiated by the
participants, if it is to tie them into the process and to
inspire confidence that the process has been an open and
equitable one.
Methodology
A. Data Base Development
The March/April 1986 Issue of Academe- "The annual report
on the Economic Status of the Profession 1985-1986" was
utilized as the source document for the population of
institutions. Northern Michigan University is a IIA
institution which signifies that it is a "comprehensive
institution with diverse post-baccalaureate programs, but

Deselection: A Novel ApproachPage 4
without significant doctoral-level education. (Academe, p.
18)." All 344 IIA institutions in the continental United
States were identified and became the population for the
study. A search was then made of easily attainable data
elements for these 344 IIA institutions. In all, a total of
fifty-two enrollment, revenue and institutional descriptions
were collected for each institution. Five major types of
data elements were collected and the major source documents
are listed below.
1. Student Related Data-
Annual Survey of Colleges - Fall Enrollment 1985(The College Board).
2. faculty Related Data-(but not salaries)
"The Annual Report on the Economic Status of theProfession 1985-86", Academe, March/April, 1986.
3. Institutional Descriptors-
1986 Higher Education Directory.
4. State Appropriations-
"State Appropriations for Higher Education (TheHines Report), The Chronicle of Higher Education.
5. Revenue Ratios-
Chronical of Higher Education Management Ratios 2,Ed. by John Mater, National Data Service.
Each of these data elements was taken from these secondary
sources and was incorporated into an extremely large (360K) but
very flexible data base. The data base was build in LOTUS 1-2-3
format and was eventually transferred onto floppy diskettes.
7

Deselection: A Novel ApproachPage 5
The construction of the data base was a labor intensive effort
and required considerable concentration and a lengthy
verification process to insure accuracy. Nonetheless, it was a
clerical process and could be handled by support staff. The
development and editing of the data base was completed in the
period from October through the first week in December of 1986.
B. Advisory Committee Process
As the development of the data base proceeded, a joint
faculty-administrative advisory group was convened. Two
faculty members participated in the process, including one
hired by the faculty union for his expertise in computer
methodology. The director of Human Resources (the chief
negotiator for the administration) and the Comptroller were
appointed as the administrative representatives. The group
met for the first time in November and met on a bi-weekly
and then a weekly basis through the end of January of 1987.
C. Project Implementation
As discussed previously, there were two equally important
goals for this phase of the salary study project. First, it
was critical to develop an effective mechanism for
identifying institutions comparable to N.M.U. across a
number of key dimensions. Second, it was essential to
create a climate which would enhance a bonding to the
process and a sense of responsibility for the outcome
(5

Deselection: A Novel ApproachPage 6
for all the participants. To this end, meticulous attention
was given to the explanation of each variable, its source,
its weaknesses, or if any coding schema or special
interpretation was necessary for an understanding of that
particular variable. Original source materials and detailed
documentation were offered for each of the fifty-two
variables. As the data base was being build, each member of
the advisory group was provided with working copies of the
current form of the data file. Finally, each participant
was encouraged to probe the data base in order to identify
additional variables. For example, the data base contained
a variable containing state appropriations and another
element had to do with enrollment. One inquiry involved a
calculation of State appropriation,: per headcount. Each of
these inquiries was handled by the next meeting of the
advisory group.
A more subtle objective of the whole salary study process
was to maintain the hard-won perception of neutrality (or
something approaching neutrality) for the Office of
Institutional Research. It is true that it was not possible
to achieve a complete climate of "trust" among all the
participants. However, it was both satisfying and somewhat
amusing that both the faculty and administrative
representatives expressed on several occasions, a sense of
9

Deselection: A Novel ApproachPage 7
4
uneasiness because of their lack of control over the outcome
of either the peer selection procedure or the salary data
which eventually would be collected.
Results
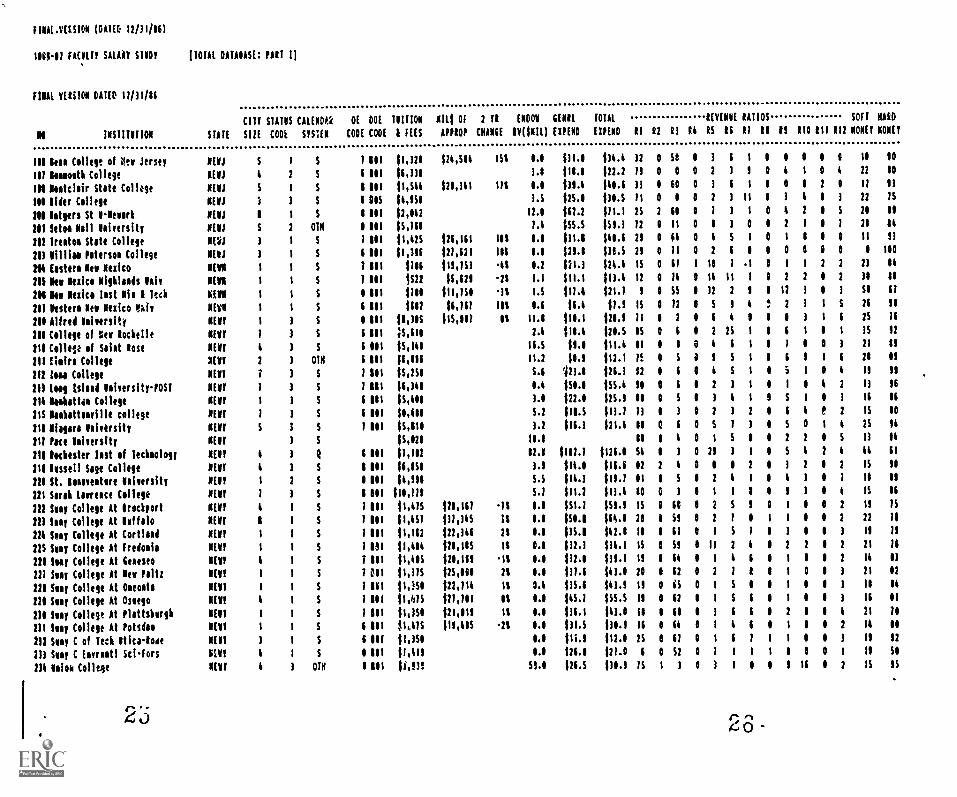
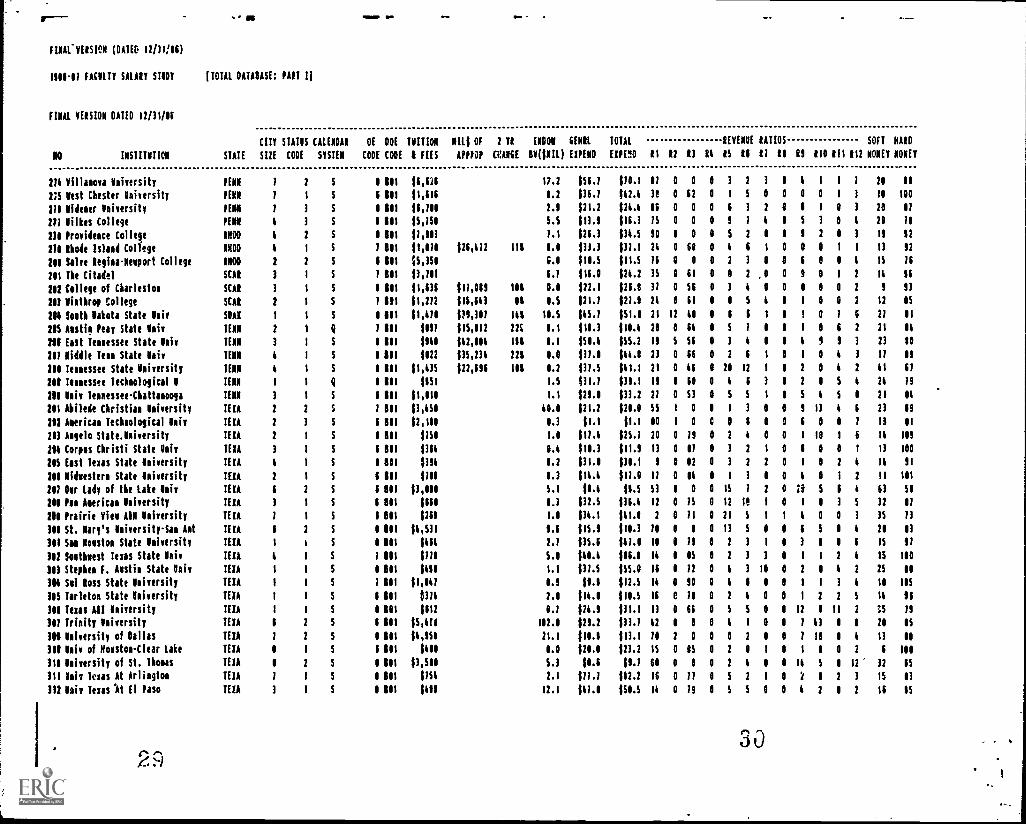
The data base of fifty-two variables for each of the 344 IIA
institutions was completely developed by the beginning of
December and was distributed to the advisory group (a copy
of the data base is included as Appendix A). By the second
week in December, the advisory body had as a first step
tentatively identified six criteria that seemed essential.
These involved:
1. the mission of the institution (e.g., comprehensiveinstitutions but without a major Medical or EngineeringEmphasis);
2. the level of offerings (i.e., significant master'sofferings or master's + offerings, but no doctoralprograms);
3 the type of locale (i.e., an attempt to get at theremoteness/centrality of an institution to ametropolitan region);
4. the number of faculty members;
5. the undergraduate enrollment;
6. the full-time undergraduate enrollment (i.e., anattempt to get at the commuter, part-time/full-time mixof undergraduates.
Using these tentative criteria a total of 297 institutions were
10
Deselection: A Novel ApproachPage 8
deselected. The schools and the criteria were examined very
closely. Over the next six weeks numerous iterations of these
original criteria were discussed, and modeled and rediscussed.
Modifications included tightening and broadening enrollment and
faculty ranges and adjusting the ratios of full-time versus part-
time students. The most attention, however, focused on the city
size/remoteness issue. A wide variety of arguments ranging from
recruitment costs/opportunities to opportunities for consulting
for faculty were raised and challenged. By the end of January
with impending deadlines rapidly approaching, the administrative
members of the advisory group decided to drop their support for
the inclusion of a city size variable. The final negotiated
criteria (see Appendix B) paralleled very closely the original
list of variables. Using those criteria, 299 schools were
deselected and a total of forty-four institutions were deemed to
be peers of Northern Michigan University as far as the five key
negotiated criteria were concerned. (See Appendix C)
One final step remained. A survey instrument was prepared and
distributed to the advisory group. After a few suggestions the
modified instrument was mailed on February 4, 1987.
Conclusions
From the population of forty-four possible peer
institutions, twenty-four schools (besides N.M.U.) chose to
participate in the study. Faculty salary data was collected from
over 7,000 faculty members from the participating institutions.
(See Appendix D).

4
Deselection: A Novel ApproachPage 9
The computer generated reports from the participating
institutions contained information on salary, years in rank,
years at the institution and other related data. This
information was then painstakingly transferred to a LOTUS 1-2-3
data base. On April 1, 1987, the administrative and faculty
representatives met in order to discuss the contract and the
salary study. In addition to several summary tables of
comparative salary data, both the administrative and faculty
representatives were handed one copy eadt, of the diskette with
the data from the national faculty salary survey. In addition,
the original salary reports were offered to each of the parties
to once again provide confidence in the accuracy of the salary
data base.
Given the lack of dissent and acrimony about the peering
process, the peer group itself, or the accuracy of the salary
survey. the project has generally been considered to be a
complete success. The most critical factor contributing to this
success was clearly the effort to actively tnvolve all of the
participants at each stage of the process. This involvement plus
the simplicity of the logic and the techniques. involved in the
denlJection process helped to convince participants that the peer
:electica process had been an open and equitable one.

4
Deselection: A Novel ApproachPage .10
Implications
The construction of the data bases in this project were a time
consuming and labor intensive process. However, the source
documents are easily attainable and generally can be obtained at
a limited cost. The development of this type of data base can be
handled by support staff and once it is in place, it is an easy
to use and very flexible tool for the academic administrator.
The data base at Northern Michigan University has been used in
the faculty salary study, and has also been utilized by the
Graduate school to identify peer institutions for a Graduate
school survey which it ha@ now completed, The personnel office
is in the process of conducting an administrative staffing survey
and will utilize the data base and the participants in the salary
survey to select peers. Finally, it is being recommended that
some departments, such as nursing, use the data base to identify
peer programs in order to provide comparable cost, staffing and
productivity figures.
Virtually any institution, at any level or of any size, can build
a data base similar to Northern Michigan's for its referent
institutional pool. Once it is in place, it will allow a school
to respond in a timely fashion to requests for peer group
information as well as to effectively, evaluate the
appropriateness of any specific institutions which are advanced

Deselection: A Novel ApproachPage 11
as peers by some external agency. If updated on an annual basis,
it can continue to serve the institution as a useful management
tool.
References
Cleaver, G. S. "Analysis to Determine A Ranking in Similarityfor Institutions in Higher Education," Paper presented atthe Society for College and University Planning Conference,Omaha, 1981.
Rawson, T.M., Hoyt, D.P., & Teeter, D.J. "Identifying"Comparable" Institutions," Research in Higher Education,1983, 18, 3, 299-310.
Teeter, D.J., & Christal, M.E. "A Coriarison of Procedures forEstablishing Peer Groups," Paper presented at the AnnualMeeting of the Southern Association for InstitutionalResearch, Little Rock, Arkansas, 1984.

1116-01 FACILI! SUM ST111
FINAL VEISION 11111 12/11/16
( Appendix A-part 1 pages 1-8
CITI SIMS CALENDAR "OE ME 1111101 5111 Of 2 it 11101 UM TOTAL SIVEHE IATIOS 5011 NAID
NO INSTITUTION STATE mu con 51511$ con COIF I FEES 1PPIOP CNAN6E 11(1111) MEM IIPENO RI 12 13 :i 25 ei RI IS to tte III 112 NONE! NOIEV
I Alakom A I N Isieersity ALAI 3 I S I 511 Hee 15,111 lei 5.1 las./ 121.1 111411111111115 IS so
2 Alaimo State Isiversity ALAI 3 1 Q I 111 1116 114,151 3.3 1.1 111.2 121.6 23111111 11111114 II 13
1 Wore Isivetsity-Neatiaotry ALAS 3 1 Q I III 1155 1114,111 111 1.1 115.4 111.6 261511165112 44 25 14
4 JaCiSOCilit State Isiversity ALAS 2 I S I III fin 1ts,e1e 121 ce 122.1 125.4 iieieesrleeetl IS 11
ilrey State leiversitillais Atal I 1 5 1 III 11,311 1.3 $35.5 123.1 161451411111111 31 12
6 Trey St I Iotkaft locket ALAI 1 1 Q I III 1145 1.1 13.3 $3.5 II I 35113114 III 13 15
I Tray State I Matteotti ALAI I 1 5 1 all $1,111 5.5 12.3 12.5 62124116111013 1e ii
s mho/ lamelif ALAS 1 3 S C 112 13,111 25.1 131.1 139.4 31 I S I It 3 I I 16 i 2 I 13 IS
I hi, AWNS to Nsetsville ALAS 3 1 Q I III 11,122 1.1 121.1 131.1 25055111 2113111 1 ee
11 laiversity of hatovalle ALAI 1 I S I III 11,142 11,152 III 1.1 $12.1 115.1 22152111111115 21 II
II Vole of Meta Alibis. MAI 2 1 S I III 1141 112,111 121 1.1 115.1 111.1 22161 123011116 II. 111
12 lair of Seek Alaimo ALAS 3 I Q 1 112 11,115 116,1ee III 4.1 156.4 1115.4 23111 4 2 3111115 21 ee
it lair Alaska Wheelie ALAS 2 I I 1 III 1641 1.6 121.1 131.2 1111)121211115 12 II
14 lair Alaska fairkasks
IS MOW N Aritosa laiversity AILIAISI
1
1
I
I
5 e 5e1
S I III
1141
1115 152,145 261
2.2
1.1
1113.1
151.1
1111.611631211114111111.1
11
0
II
I
II ArkiIIII State lair Nail AIM 1 1 S I MI 1111 126,112 III 2.6 121.4 131.5 21 I 12 I 13 II 2 I 0 I 2 I 21 11
11 Otackita lotist Isiyersity AREA 1 2 S 6 5e1 13,I5e 1.e $3.5 11.1 $2 8111111126415 II 51
II his khans At Little lock AMA 3 1 S 6 III 1111 1.1 $33.1 116.2 26 I 56 1 II 3 2 I 3 I 2 2 23 12
II hie of Ceatral Arkaosas
ACIAIL:
I I S I III 1111 111,112 61 1.1 121.4 125.5 21116 1 12121112 2 11 II
21 Anna Pacific Isiversity 1 3 5 6 111 $5,111 5.1 111.1 112.1 it o] 4111015 II If
21 lista
22 Ca
Misers/1y
iforaia Laker. Collett
CALI
CALI
1
I
2
2
S e let$ 6 III
$5,111
16,131
1.2
1.1
111.1
111.1
$11.1
111.2
1211111111111115111131112112
21
22
11
11
21 Ca State 11laiersfiel1 CALI 3 1 Q 6 III 1154 121,152 III 1.1 122.1 123.1 1111613 2 213 115 IS 12
24 Ca State I-Saa leraardise CALI S 1 Q ; 111 1115 121,111 221 I.) 121.1 121.2 tee1ses) 211041 11 11
2$ Ca MI St 1-51 Loll 16 CALI 1 I Q 1 III 1111 111,19 121 3.) fit.s 1115.4 1111112 leeleel 11 es
21 Ca State 1Chico CALI 2 1 S 6 111 1122 116,115 III 1.1 112.1 111.2 2116114 3511111 IS 11
21 Ca State 11elisivez NIs CALI 1 1 Q 6 111 $132 121,212 21 1.1 131.1 $31.1 2311213 3 211112 11 IS
21 Ca State I-freseo CALI 1 1 S 6 III 1111 111,235 11% 2.1 118.1 111.1 21166111 211111 II II
21 Ca
31 Ca
State 1follertos
State 111alvard
CALI
CAL!
S 1
I 1
S 1 III
Q 6 III
1611
1621
111,121
151,165
II
it
1.2
1.1
111.1
151.1
111.1
156.1
2111112 21131112111112 2 211111
II
I
12
IS
31 Ca State 1.11141111 CALI 1 1 Q I 112 $113 $11,115 3S 1.2 145.4 151.2 151/1143411114 Is 15
32 Co Stale 1Losg hick CALI 1 I S 1 III 1311 111,156 It 1.1 $111.1 1130.1 21161113 212091 It 15
13 Ca
24 Ca
State 1Los Asgelos
State 1.Northridie
CAL!
CALI
1
I
1
I
Q I Al2
S 6 iot
1612
$115
114,111
116,111
St
111
I.)
5.1
111.1
116.1
1111.6
$332.1
24111153 1 1001221161111202011
13
11
II
IS
35 Ca State Poly 1-hoosa CALI 1 3 Q 6 111 1115 111,111 111 1.1 112.2 111.4 2111513 3101012 I 15
36 Ca State 1-Sacra seato CALI 6 I S 6 III 1151 111,611 111 1.3 $16.1 114.4 22111 I 31115012 If II
11 to State 1-Sal Diego CALI 6 3 S I III 1111 1112,111 III 5.3 1111.1 1116.1 23151111 2 05111 21 12
II Ca State 11-Sas frimcisco CALI 1 I 5 t III $115 111,121 111 1.4 111.1 1116.6 26161114 4111112 25 11
it (11 roil. Mann In.. CHI 6 1 S 8 ill Me 111,111 It 1.1 1111.1 $113.1 25114111121115 II II
15

FINAL VERSION MATED 11/31/16)
1116.11 FAULTY SALARY STUDY (TOTAL DATAIASE: FAIT
FINAL VERSION DATED 12/31/11
CITt STATUS CALENDAR Of ODE TUITION AILS Of 2 YR ENDOW 6ENIL TOTAL 19ENVE RATIOS SOFT MAID
11 INSTITUTION STATE SIZE CODE SYSTEM CODE COE I FEES APPROP UAW IV(1111% EXPEND EXPEND II 12 13 11 15 16 11 II IS III III 112 NONE! MONEY
11 CO State 1-Soaosa CALI 3 I S 6 ill 1313 $21,511 51 1.2 $32.1 $35.1 11111153 301113 IS II
41 Cal State I-Stinislars CALI 3 I S 6 III $611 $21,111 51 1.2 $21.1 $23.0 1101102 3 011112 sloe
41 Chapala College CALI 5 3 5 1 ill lodoo 5.6 123.1 $25.6 11 0 0 012 211213 15 10
41 College Of Notre Dale CALI A 2 S 8 111 $5,111 2.1 $5.2 We 11801121111 205 11 el
44 lay Naves College CALI 1 2 S 6 III $6,161 2.2 $1.3 $5.1 61000121122 2 13 3 II 63
45 Jobs F Remedy laiversity CALI 1 3 Q 1 III $3,321 1.1 $1.3 11.3 121011111113 2 11 12
Si twirl Arland laiversity CALI I 2 5 I ill $5,131 11.1 $35.5 $39.1 1511113111216 20 11
41 Rills College CALI 1 3 S I ill 11,411 11.1 $11.2 111.1 69 0001111 11 1111 JO il
41 leaterey last. lateral Stad CALI 3 3 5 1 III Dam 1.1 $2.1 $3.1 is 01011.1116113 21 IS
41 Pepperliae laiversity CALI 1 I T e ill $1,411 53.1 $51.6 155.2 1111051111115 21 11
511 Saist Nary's toll. of Calif CALI I 2 S I III 16,311 1.1 $13.1 $11.1 16161121011 211 13 st
SI lair of La Verse CALI 1 I 5 I III $6,121 2.1 $11.1 $21.1 121112 35112112 25 13
51 Iliv of The Pacific CALI 3 I S I 112 1115 12.1 156.1 $61.1 111112111216 1 II 11
SI his of Redlands CALI 5 3 5 6 III $1,111 11.1 111.3 $21.1 11118121011112 16 11
54 lair of Sao liege CALI 6 2 5 o iel $5,11e 1.1 131.1 116.1 98 00152111011 11 SO
-51 Ial, of Saa Francisco CALI I 2 S I III $6,151 11.5 $31.2 $15.1 1181111115212 12 11
SI Salta Clara laiversity CALI 5 2 1 I 16;111 35.5 113.1 151.2 121012 25111 ill 2: 11
$1 Mintier College CALI 1 I S 1 III 11,212 13.1 113.1 115.4 1110I3 2S1IS 1 82 21 11
SI Adam State College COLO I I S 6 III $1,111 1.1 $1.1 $11.5 23 I 66 I 1 II I 1 2 I 1 2 21 11
SI lair of Colorado Cold Sprgs COLO 3 I 6 III 1.3 $13.1 115.3 35016111512011 21 11
11 lair of Colorado at haver COLO 6 1 S I I01 $112 1.3 $31.1 $32.1 3111113 2116111 13 15
11 Inters State Coll of Colo COLO I I S 6 III 11,111 1.1 111.2 $11.1 31 511125111111 13 12
11 Ceatral Coaaeticit St his CONN 2 I S 1 III 11,111 $25,163 111 1.1 $31.1 116.1 3116312 3111111 5 MI
II Coaleticat College COIN 2 3 5 1 CII 111,311 11.S $11.2 123.3 11111311111 61122 15
14 Fairfield laireristy CONN 3 2 5 1 191 $1,111 1.1 $23.1 $31.$ 1110131215215 11 11
IS Saint Joseph College COON 1 2 $ 1 III $6,111 1.1 16.1 $1.3 510202 2 611111 1 32 65
II Souther. Coos State lair COIN 3 I S 1 III $1,661 $21,111 111 1.1 $21.5 111.4 31466131211101 II 11
11 Wait, College CONE 4 3 S I ill imie 51.2 121.2 126.5 13 Ieoiilt 11 III6 22 11
10 laiversity of iridgeport C1110 3 3 S I III $1,115 1.1 $31.1 $13.3 111112 21112 11 13 el
11 Iiiversit of Mulford COIN 1 3 5 I RII $1,115 12.1 $13.1 $11.1 1112 6 314112 2 5 16 11
II laiversity of Ner Naves COON 3 3 5 I Ill $1,111 1.1 $11.3 $21.1 11100 013 1 01101 1 111
21 Vesleyas laiversity CONN 1 3 S I III $11,513 112.1 $11.1 11,1.1 12 0 0 I II I 0 e II 21 I 2 25 13
12 Sisters Conn St College COIN 2 I S 1 III $1,116 $11,112 22% 1.1 113.5 $15.1 36 8 11113111011 5 13
11 iallardet College 1151 I 3 S I III $2,551 2.1 $31.1 113.1113 0011112115 12 Ill
14 lair District of Coluabfa IIST I 1 S 6 III $116 1.5 $11.1 Ile.eloololloTeloi It os
11 lorry lairersity FLOR 6 2 S 6 III 15,411 1.1 $13.1 $11.5 111001 21111110 21 16
11 Florida Atlaatic Div FLOR I 1 S 1 151 $1,111 1.1 $12.1 $15.2 1111212 2115111 13 os
11 Florida laterait'l his FLOR I I S e ell flu 156,313 211 1.1 $51.5 159.5 il 8 11 0 1 2 2 0 2 0 2 I 13 ii
I: Stets°. university FLOR 3 2 5 1 III $5,611 11.1 $15.6 110.5 11 0 1 0 3 3 I I IS 5 1 1 21 13
17

FINALVERSION RAID 12/31/10
1111.11 FAcILTY SALARY STUDY (TOTAL DATA1ASE: PART II
FINAL VERSION DATED 12/31/16
CITY STAINS MINOAN OE DOE TUITION
NO INSTITUTION STA1E SIZE CODE SYSTEM CODE CODE 1 FEES
11 hie Of Central Florida FLOR i I S I III $oli
11 leiversity of Vest Florida FLOI 3 I S 6 III 1111
It Arestroag State College 6E05 2 I Q g ill 1161
1/ Asgesta College 6E01 3 I if 1 111 $1,11$
II Coluens College 6EOR 2 I Q 1 III 11,111
114 hues College 6E01 I I Q 1 ill 11,121
IS Georgia Southern College 6EOR I I I 1 III SIMI
II Georgia Southwestern Coll 6E011 I I Q 1 ill IOUIT heti Georgia College 6E01 I I Q s ill Sosi
11 lest Ienrgia College 6E011 I I Q / 111 11,211
11 him State University IIAN 2 1 S 6 III 11,151
II Idaho State laiversity HAN I I S I III 1111
11 Iredlly Iniversit ILLI 3 3 S 1 III 11,311
12 Chicago State University ILLI I I S o ill 11,211
13 Benet laiversity ILLI 1 2 11 I III 15,121
14 Easter' Illinois University ILL! I I S 1 III 11,414
IS Invernors State University ILLI 1 T I ill $1,111
II Levis Iliversity ILLI 1 3 S I III 15,314
11 National College of Edna ILLI 1 3 il / 011 0,915
11 Northeasters Illinois hie ILLI I I 1 6 III 11,111
11 lossevelt University ILLI I 3 0TH I 111 0,135
III losary College ILLI 1 2 S 6 III 11,111
III Saagason State laiversity ILLI 2 I S I III 11,114
112 Souther' Ill laividvardsvle ILLI 1 I Q s 112 Pm,111 lister' Illinois Iniversity ILLI I I S 1 III 11,631
114 Melon College ILLI 1 3 S 6 III 15,111
III Ilvtlir Iaiversity 1101 I 3 S 1 111 11,311
IN Mau Central University IIII I 3 0TH 6 III 15,411
111 Mama State hie -Terre Nte INC I S 111 11,512
Ill INI-Pardue I Fort Wayne INII 3 I S o III 11,631
III Mau Imiv-ImilImpolis 1111 I I S 1 112 11,213
III lndiaaa Inia-Northvest INDI i I S I 111 11,551
III Milos ley At Small lead INDI I I S 1 III $1,214
112 Peale IlaiversityCalneet IIIII i I S 1 III $1,131
111 Ilaiversity of Evansville 1101 3 3 S i III 11,111
114 Valparaiso him-sill ROI 4 3 S 6 III 15,112
116 Drake University IOWA 3 3 S 1 III 11,131
116 Ilaiv of Northern lova IOWA 2 I S 1 111 11,212
II/ (Norio State Iniversity VANS I I S 1 III $1,113
1 T I ill $1,111
II Levis Iliversity ILLI 1 3 S I III 15,314
11 National College of Edna ILLI 1 3 il / 011 0,915
11 Northeasters Illinois hie ILLI I I 1 6 III 11,111
11 lossevelt University ILLI I 3 0TH I 111 0,135
III losary College ILLI 1 2 S 6 III 11,111
III Saagason State laiversity ILLI 2 I S I III 11,114
112 Souther' Ill laividvardsvle ILLI 1 I Q s 112 Pm,111 lister' Illinois Iniversity ILLI I I S 1 III 11,631
114 Melon College ILLI 1 3 S 6 III 15,111
III Ilvtlir Iaiversity 1101 I 3 S 1 111 11,311
IN Mau Central University IIII I 3 0TH 6 III 15,411
111 Mama State hie -Terre Nte INC I S 111 11,512
Ill INI-Pardue I Fort Wayne INII 3 I S o III 11,631
III Mau Imiv-ImilImpolis 1111 I I S 1 112 11,213
III lndiaaa Inia-Northvest INDI i I S I 111 11,551
III Milos ley At Small lead INDI I I S 1 III $1,214
112 Peale IlaiversityCalneet IIIII i I S 1 III $1,131
111 Ilaiversity of Evansville 1101 3 3 S i III 11,111
114 Valparaiso him-sill ROI 4 3 S 6 III 15,112
116 Drake University IOWA 3 3 S 1 III 11,131
116 Ilaiv of Northern lova IOWA 2 I S 1 111 11,212
II/ (Norio State Iniversity VANS I I S 1 III $1,113
19
NW OF 2 11 ENDOW GENII TOTAL REVERIE RATIOS SOFT MAD
APPROP CHANGE MINH) EXPEND EXPEND II 12 R3 RI 15 16 RI 11 RI 111 Ott 112 MONEY MONEY
152,411 21% 1.1 Ow$26,151 22% 2.1 131.5
11,031 14 1.1 11.1
$1,141 III 1.1 111.1
112,111 I% 1.5 115.5
1.1 111.3
121,393 12% 1.1 125.1
11,113 II% 1.5 11.3
11,351 126 Lo 11.6
116,335 111 1.1 111.1
125,151 I% 1.0 132.1
121,161 IIS 1.1 132.1
13.1 132.1
lit IA 121.5
11.3 $61.5
131,163 les 1.3 143.1
01,111 los 1.0 111.8
It 111.3
1.3 111.6
121,221 30% 0.0 $32.5
1.1 121.1
1.1 16.1
115,113 136 1.1 111.1
1.3 151.1
$11,315 16% 1.0 155.1
MI 122.2
ILI 111.1
12.1 11.2
IN 122.3
4.1 1155.1
0.0 113.1
I.O $12.1
1.1 111.2
1.1 121.1
11.1 121.1
14.1 133.1
111,111 IS 0.2 $10.1
111,101 -I% 1.1 110.1
20

FINAL .VERSION (DATED 12/31/861
1106.01 FACULTY SALARY STUDY (TOTAL DATABASE: PART li
FINAL VERSION DATED 12/31/16
CITY STATUS CALENDAR OE DOE TUITION NIL$ OF 2 YR ENDOV GENRL TOTAL REVENUE RATIOS SOFT HARD
NO INSTITUTION STATE SIZE CODE SYSTEM CODE CODE 1 FEES APPROP CHANGE BV(1111L) EXPEND EXPEND RI 12 13 Rt RS 16 RI RI RI RIO RII 112 NONE? NONE!
III Fort Nays State University KANS I I S 1 111 $1,15S $15,131 i% 1.0 01.1 $22.1 23 0 10 0' 4 6 0 1 0 0 3 2 IS 01
III Pittsburg State University KANS I I S 1 111 $151 $16,301 3% 2.1 $11.1 $21.S 21 0 13 11 2 6 2 0 I 0 2 0 13 14
174 Voshlorn University RAMS 2 I S 0 COI $1,611 $1,116 1% 1.S 121.S $22.6 39 0 19 16 2 S I 10 1 3 2 4 20 II
III Vichita State University RAMS 3 I S 0 111 $1,216 $31,525 It S.I $S1.3 $63.1 21 0 56 3 1 4 0 0 S 0 1 4 21 16
10 Eastern Kentucky University KENT I I S I 111 $111 $31,115 IR 1.0 06.3 $61.1 22 0 66 0 4 1 2 I I 0 3 2 20 11
113 Norehead State University KENT I I S 1 111 $111 123,516 II% 1.1 $12.1 131.1 21 0 0 0 1 1 0 0 0 0 I 2 11 10
124 Murray State University KENT I ! S 1 80 $111 08,891 10S 0.0 $10.0 $16.5 21 0 66 0 5 5 I 0 0 014 16 01
10 Union College KENT I 2 S I DIO $3,951 2.1 13.6 0.2 0 0
121 Niters Kentucky University KENT I I S 1 111 051 $31,211 121 0.1 $52.5 $61.1 20 0 61 0 1 S *I 1 I 0 1 4 19 16-
111 irobliog State University LOU! I I S 6 COI $1,311 $16,112 III 1.1 $22.6 $21.2 11159 0 II 10 613111 14 11
III Louisiana Tech University LOU! I I 1 1 111 $111 10,562 -I% I I $31.1 $SI.S 21 0 66 I S 6 2 0 2 0 I 3 11 11
III 4yola Univ In New Orleans LOU! 6 2 S 6 111 $1,121 41.5 $31.1 $33.0 SI 1 3 0 2 3 0 0 3 31 0 4 12 II
III McNees. State University LOU 2 I S I 111 $511 $11,152 -I% 1.1 $22.1 $21.6 toolsolisetoot II OS
131 Nicholls State University LOS! I I S 1 III $1,311 06,011 -11 1.2 $21.1 $2S.0 11 0 10831101121 14 96
131 Northeast Louisiana Univ LOS! 2 I S 1 111 $111 $21,621 -3% Id $31.1 11S.1 22161111012121 II 01
131 Northwestern State Univ 1081 I I S 1 111 $1,11S $16,211 -11 1.0 $21.1 $25.1 11 0 16 011211111 14 13
131 Southeastern Louisiana Univ LOU! 1 I S I 811 $136 $11,110 2% 1.1 126.1 $32.1 22 0 1115 $111112 II 0131 Southern Unit/ AIN C -Main LOH 3 i S 1 111 $01 1.1 $43.3 $S1.1 16 4 42 1 II 11 2 1 I 0 0 2 30 12
131 University of New Orleans LOU! 6 I S 1 111 01224 1.3 $51.1 $S1.6 3315113 6113111 11 11
131 Univ Southwestern Louisiana LOUT 2 1 S 1 811 $121 $31,124 -41 2.3 $46.1 01.1 22 0 69 05610 312 2 19 92
131 Univ Maine At Orono MAIN I I S 1 111 $1,545 6.1 $11.1 $111.1 23 S 30 0 13 1 2 0 S I S 3 32 SO
131 University of Southern Maine NA1N 2 I S 6 111 $1,511 S.3 $32.1 $31.1 21 0 51 0 13 1 2 0 2 0 3 6 33 0141 Frostburg State College NARY 2 1 S 6 111 $1,316 $11,311 131 1.0 $11.2 $22.3 22 0 10 0 11110 0 3 0 II 12
141 Noel College NARY 1 3 S 6 101 $6,161 13.1 $1.1 $11.6 61 0 6 0 2 2 0 0 1 1 1 0 IS 11
142 toyola College NARY 1 2 S / 811 $1,121 11.3 $22.1 $25.1 10 0 10 0 2 2 303113 14 19
143 Norm State University NARY 1 I S 1 811 $1,111 $21,361 221 1.1 $25.1 $21.3 23 0 62 0 11 9 2 0 I 0 0 0 22 IS
144 Salisbury State Colleg NARY I I S 6 111 $1,651 $12,021 141 1.1 116.0 $20.4 10161 011111111 6 11
a: TOM* State University NARY 1 1 S / 111 $1,311 $33,115 131 1.3 $1S.6 01.1 3S 1 61 011111111 6 16
141 University of laltinore NARY 1 I S 6 111 $1,211 $11,10 III 1.1 $15.1 $16.1 36162 0 2 2112111 I 91
141 Univ Maryland-Salto County NARY I I S 1 111 $1,511 1.1 $31.5 $12.1 26 0 64 0 1 4 211101 IS 11
141 Vestal Maryland College NAIV 1 3 0TH 1 ill $1,215 LI $10.5 $13.1 11 010 2 2 216S11 16 0141 Iridgewater State College MASS 2 I S I 111 $1,19S $11,513 1St 0.1 10.1 $22.0 34 0 81 0 3 1110000 12 ITS
111 Clad University NASS 3 3 S 1 A11 11,331 11.2 10.1 $21.3 II 0 0 0 IS 2114 311 26 11
111 Emerson College MASS 1 3 S 6 111 11,111 1.1 $12.S $15.1 11 0 0 0 41111101 11 11
112 Simmons College NASS 1 3 S 1 III $12,524 3S.S $21.5 $25.1 IS 0 0 0 1 2 I 1 6 IS 0 3 11 111
113 Smith College MASS 1 3 0TH 1 111 $1,113 111.1 $12.S 01.1 SI 0 0 0 2 I 1 0 26 23 3 2 31 II
111 Southeastern Mass Univ MASS 2 I S 6 811 $1,211 $32,11S 211 0.1 $26.4 $32.1 23111 0 1S311111 11 111
III Suffolk University NASS 0 3 S S ell fsmo 9.4 $24.1 $24.1 94 0 0 0 6100 3 302 IS 11
111 University of Lowell MASS 2 I S 1 801 11,130 $54,111 31% 0.8 $31.2 $34.2 2809609S106000 21 122
21
22

FINALVEISION (DATED 12/31'16)
1111.11 FACULTY SALARY STUDY [TOTAL DATABASE: FAIT II
FINAL VERSION DATED 11/11/06
NI INSTITUTION
CITY STATUS CALENDAR OE DOE TUITION MILS OF 2 II ENDOW MILSTATE SIZE CODE SYSTEM CODE CODE i FEES APPIOP CHANGE 11(0110 EXPEND
TOTAL REVENUE 12,TIOS SOFT HARD
EXPEND RI I2 13 114 0 16 C/ II II 110 111 112 MONEY NONE/
23 24
ir Nossachusetts-lostoo NASS I I S 6 CII 11,536 0.1 155.3 151.2 33 0 51 01 1111011 18 00
III Vest:1m New England College MASS 4 3 S 6 111 15,561 2.4 $11.1 $21.6 102 0 0 0 4 3 I 0 0 I 0 3 II 103
Ill Ceatral Nichigaa University MICH I I S I III $1,51? 145,115 21% 1.1 00.1 014 IS 0 16 0 3 6 0 0 2 0 3 2 16 II
III foster. Michigan Vairersity NICK 3 I S / III 11,454 152,301 219 2.1 I13.3 111.1 32 0 53 01 5112 0 21 II 15
III Bread Valley State College RICH 4 I S 6 III 11,512 121,341 219 3.1 121.2 132.5 21 I SI I I 6 0 I 6 0 3 3 21 II
112 lorygrore College- NICK I 2 6 1111 14,211 1.2 16.1 $6.1 13 0 I 0 II IS 1 I I 3 I 2 13 //
III Nichigoo Technological Voir MICH 1 1 Q I 014 11,02 133,124 21% 1.6 $56.2 111.2 21 0 46 0 I 3 3 I I 1 2 3 21 71
111 Norther. Nichigan Voir NICK I I S / III 11,412 $32,121 II% 1.3 131.5 111.2 21 0 60 0 3 / 2 0 3 0 4 3 22 47
10 Oaklomi University NICK / I S I III 11,114 121,111 21% 2.1 $15.2 10.1 31 0 11 0 I 3 .1 0 4 I 3 2 21 12
111 1ogimow Valley State College MICH 2 I 1 1 III 11,621 112,242 409 Ni 113.1 116.7 36151141 11513 0 11 14
1111 lair Nickigom-Dearborm RICH / 1 T 1 III $1,111 1.1 111.1 122.1 41 152114 111141 II II
III Bemidji State Voiversity MINN I I Q 1 III 11,213 1.1 111.1 123.1 21 0 St 1011111112 21 13
111 College of Saint Thomas MINN / 2 Q / III 15,111 31.3 135.5 $41.1 56 I 0 0 2 2 1 1 6 I 21 5 41 64
111 Moorhead State University MINN 2 I Q 6 III 11,516 0.1 $23.1 $21.1 29 0 1514 11101101 16 14
111 St. Clovd State University KINN 2 I Q / III 11,115 1.1 111.1 145.0 31 0 6313 911110 2 23 IS
1!2 hint Nary's College MINN I 2 S 1111 15,111 2.1 $1.4 $11.0 1411111 3111104 31 14
Ill lair Nimeesoto-luluth MINN 3 .1 Q / III $2,131 1.6 136.3 115.5 21 0 51111214153 21 14
114 Jackson State University 1115f 3 I S 1 III $1,112 114,765 -119 1.1 $31.1 136.7 21 I SI 0 21 16 I I I 0 4 0 13 11
115 Mississippi Voir For Voice MISP 1 1 S / 111 11,015 0,111 -II% 0.3 $11.5 113.4 1/1/I 2 35213121 16 II
I/1 Ceatral Missouri State lair MISO I 1 S / 111 1112 $21,162 23% 2.1 $30.1 $11.0 21 0 10 0 31 1110 3 3 II II
111 Micah Voirirsi11 NISO I I S 6 III 1111 $1,331 IS% 1.0 113,2 114.7 II 21 SI I 12 6 2 0 0 0 1 3 21 II
17I Liadeowood College NISO / 3 S 6 III $4,601 2.3 16.2 11.4 110112 400152 3 11 15
III Northeast Missouri St Voir NISO I I S 1 III 1711 121,626 311 5.6 122.5 121.4 21 0 62531110 213 16 13
111 Northwest Missouri St Voir MISO I I S i III 1111 114,134 214 1.3 $10.1 $21.1 21 0 64 0 2100 012 4 16 II
III Southeast Missouri St lair MISO I I S / HI PM 2.2 VIA 131.1 210630111113114 26 IS
112 Southwest Missouri St lair MISO 2 I S / III 11,114 126,112 23% 0.2 $11.3 141.4 21 0 61121001116 11 I/
Ill lair Missouri-St. Louis MISO 1 I S I III $1,111 I./ 131.4 $13.5 35 2 51 14 3 013114 IS 14
114 Webster laiversity NISO I 3 S / III 14,11) 2.1 111.1 111.1 121111210 4 III 13 12
INS ham State Imiversity MONT I I Q I III 11,112 141,511 -4% 1.4 $51.1 $61.1 II I 65 0 II 6 2 0 4 I I I 23 13
III Creighton University NESS 4 2 S I 112 15,234 25.5 111.1 $IS.S 411116121/3 361 56 41
III homy State College NE11 I I S 1 III 11,114 111,595 6% 1.1 116.1 $21.1 3416113 12 211111 04 15
111 lair Nebraska At Omaha NE11 1 I S / 111 $1,333 1.6 137.1 142.5 33051 0 4 611313 2 11 'I
111 Wayne State College NE11 1 I S / III 11,111 $6,165 It 1.1 $1.1 $11.3 26111 0 4 II 211111 11 14
INN Voir of Nevada -Las Vegas NEVA 3 I S I III 11,111 1.1 143.5 $15.1 2115101 3113 1112 3S 11
III Shier College NEVI 2 2 S I III 11,511 3.1 $4.1 14.7 1131113 4115111 11 103
111 Farlgh Ocksn Florham-MAD NEVJ 5 3 S I III 0,111 2.2 111.1 111.1 II 0 312 211311S 13 92
11) Farlgh DCW I lutherfd NEVJ / 3 S 1 III 11,111 2.1 III./ 111.6 t 0
114 Farlgh Dcksm Teaneck Cam NEVJ / 3 S I 112 14,10 kJ 142.1 $15.3 10 0 2 0 4 2 12 1 4 I 3 3 21 13
10 Jersey CityState College NEVJ 4 I S S 111 11,122 121,131 14% 1.1 121.1 121.6 26062 0 414 0 3101 21 II
23 24
FINAI.VEISION DATED 12/31/161
110.11 FAULTY SAL S11DY
FINAL VERSION DATED 12/11/11
110111 0011ASE: PART lj
C111 SIAM CALENDA1 OE DOE 11111011 011l OF 2 II ENDOW GENII TOTAL MENNE RATIOS SOFT HARD
NO 1051111110N STATE SIZE CODE SYSTEN CODE CODE 1 FEES APPIOP CHANGE IV(INIL) MEND UPEND RI 22 RI RI RS 16 RI II RI 110 III 112 NOM MONEY
III Eta' Witte of Her Jersey NUJ 5 I S 1 III $1,111 $24,514 151 1.0 $31.1 $36.1 32 0 SI 0 3 1111011 11 10
111 loalootk College NEVJ 4 2 S I III $6,331 1.1 $11.1 $22.2 II 0 0 0 2 3 I 0 I I 0 i 22 10
IN loatclair State College NEVJ S I S 1 101 0,514 01,111 111 1.1 $11.1 110.6 I) 0 60 0 3 611012 0 12 I)
111 liter College NEVJ 3 3 S I 115 0,01 1.S $25.1 $31.5 11 0 0 0 2 1 II 0 3 I 0 1 22 IS
III Iltgers St 1Nevort N(N) I 1 S I III $2,142 12.1 $11.2 I11.1 2S 2 6001310 4 20521 01
111 Seto Nall Vaiversity NEVI S 2 0TH 0 101 $5,111 1.1 $55.5 $51.3 12 0 II 013 012111 21 14
112 hello State College NEVJ 3 I S 1 101 $1,125 $21,111 Ill 1.1 $11.1 00.6 21 0 61 015101110 II 0
213 Lillian Paterson College NEW) 1 I S 6 III $1,311 $21,121 III 1.1 $21.1 $30.5 21 0 11 0 2 6000 6 60 1 100
III Entire Net Ivaco VENN 1 1 S 7 III $111 Mau -41 1.2 121.1 04.4 IS 0 5) I 10 1 .1 0 I I 2 2 23 14
20 Nev Mice NIgklaads Vale 1E01 I I S 1 101 1522 $6,121 -21 1.1 $11.1 $11.1 12 0 11 4 II II 1 0 2 2 0 2 )1 II
214 Nov Mexico last Nisi Tech NEVI I I S I 101 $111 $11,151 -II I.S $11.4 $21.1 1 0 55 0 32 2 1 0 12 1 0 1 SI 11
201 Nesters Net Nexico Oh NEVI I I S 1 111 1112 $1,111 111 1.6 16.1 $1.1 1S0121511! 2 3 I S 21 10
ill Alfred flimsily NEVY 1 1 S 1 111 $1,105 IBM/ It 11.1 $11.1 $21.1 11111140113 16 2S 16
211 College of Iry toclelle NEVI 1 3 S 6 101 0,611 2.1 $11.4 $21.5 IS 0 612 25116111 IS 12
111 Wiese of Salat lose NEVI 4 3 S 6 III 0,111 11.5 $1.1 111.1 111101111110) 21 11
111 flair. College NEVY 2 1 0TH 1 111 $1,111 11.2 11.1 $12.1 1505115116 116 21 II
21! Lou College NEVI i 3 S 1 101 $5,251 1.6 121.1 $26.1 1206145111114 11 II
211 bog lslaad ItiversIty1051 NEVI 1 3 5 1 III $1,111 1.1 $51.1 $55.4 110612 311114 2 13 96
214 loohattea College NEVI I 3 5 6 III 0,111 3.1 $22.1 125.9 10 050) 419$113 16 II
215 laalattaavIlle college NEVI 1 1 5 1 111 $1,011 S.2 $11.S $13.1 1) 1 3 0 2 3 216102 IS 10
III Niagara lairIrsity NEVI S 1 S 1 101 $5,111 1.2 $11.1 $21.4 1106051105014 25 14
111 Pace IalversIty NEVI 1 S $5,121 10.1 1111015112 2 1 S 13 II
211 Rochester last of Technology NEVI 4 1 Q 1 111 $1,112 12.1 $112.1 $126.1 5413 0 21 3115111 II 61
211 lessen Sage College NEVI I 3 S I 101 0,61 3.1 $10.1 $11.1 12 2 4011213 212 IS 10
221 St. loareatere Valversity NEVI 1 2 S 0 101 $4,111 S.S $14.1 III./ 11 1 S 1 2 4104111 11 11
221 WA !Amore College NEVI 1 1 S 1 Ill $11,111 S.1 $11.2 113.1 10 0 3 1111 0 1 301 IS 16
111 Soap College At Irottport NEVI 4 I S 1 III $1,115 111,111 -1% 1.1 $51.1 ISM IS0601151 01102 II IS
111 Stay College At 'offal° NEVI I I S 1 111 $1,151 01,115 11 1.1 $51.1 160.1 2015902 1 111112 22 11
214 Stay College At Cortland NEVI I I S 1 III $1,112 $22,141 1% 1.1 05.1 $12.1 1116111SII1111 11 11
215 Soap College At Fredonia NEVI I I S 1 III $1,111 111,115 IS 0.1 $32.1 $34.1 IS 0 S9 0 II 2 4 0 2 2 1 2 21 11
211 Stay College At Goose° NEVI 4 I S / 101 $1,11S $21,111 -11 0.0 $32.1 131.1 016111111111 2 II 1)
221 Soy College At Nev ?alit NEVI 1 I S 7 001 $1,315 125,111 21 1.1 01.6 $13.1 20 0 12 0 2 111101) 21 12
211 Seal College At Oneonta NEVI I I S 1 161 0,151 $22,114 11 0.6 $15.6 OM 0005 01S111013 II II
211 hay College At Oswego NEVI I I S 1 III 0,615 111,101 0% 1.1 05.1 $55.5 II 0 6211S101113 II II
211 hay College At flattsbergli NEVI I I S 1 111 11,1SO $21,111 It 0.1 06.1 14).0 II I 611) I 612114 21 11
111 hay College At Potsdaa NEVI I I S 6 101 116115 $11,415 -21 1.1 $11.5 WA 16 0 61011111112 II 01
212 hay C of Tech ItIcaRove NEVI 3 I S 6 111 0,39 0.1 $11.1 $12.1 2S 0 61 01111110) II 12
11) Seal C Wrest! Sci-Fors VIVI 4 I S 1 101 $1,011 1.1 126.1 121.0 6 0 52 0 111110 01 II SI
111 IWO College NEVI 4 1 0TH 1 III $1,030 51.0 $21.5 $11.1 /SI) 0 311111612 IS IS

FINAL115101 (DATED 12/31/86)
1111-1/ FACULTY SALARY STUDY (TOTAL DATABASE: PART
FINAL VERSION DATED 12/31/16
N INSTITUTION STATE
CITY STATUS CALENDAR OE DOE
SIZE CODE SYSTEM CODE CODE
TUITION
1 FEES
NIL$ OF
APPROP
2 111
CHANGE
EMOON MIL1V(INiL) MEND
TOTAL REVENUE RATIOS SOFT HARD
EIPEN RI R2 RI Ri 15 R6 RI RI 11 RIO III 112 MONEY MONEY
2)5 Appalachian State War NORC I 1 S / Ill 1111 111,611 26% 6.1 143.6 151.6 16 0 69 0 3 410111 2 II 11
231 East Carolina University NORC 1 I S 1 802 1164 112,606 21% 8.4 116.1 $110.0 13 0 65 0 3 2 3 I 1 0 1 15 21 11
2)1 North Carolina (Waal Univ NORC 1 I 5 6 III I151 I./ 124.) $21.6 15 0 13 0 1 12 1 0 I 0 2 0 25 11
2)1 Ilniv of M C Charlotte NORC 4 1 S / Ill $661 $31,562 31% 1.1 1)1.6 154.5 22 8 69 0 ) 4113001 I) 11
211 Wake Forest University NORC 6 2 S 1 112 01,111 122.2 $111.5 $126.2 26 0 2 0 I) 0 4 8 IS 8 I 36 61 36
1111 Western Carolina Ink NOIC I I 5 1 811 I111 $21,331 3)% 0.5 $21.5 131.9 11 0 66 0 1 5 3 0 1 I 6 I 25 12
111 North Dakota State Univ NDAt 2 I Q o est $1,115 111,112 12% 1.6 IBM I11.0 II / 520542041102) 11
212 Antioch University OHIO 6 1 0TH 1 III 11,111 5.1 122.1 $21.1 13 0 0 0 I) 3 0 0 9 2 2 I 28 15
213 Ashland College OHIO I 2 5 1 III 11,541 4,0 113.3 111.1 1400006001 2 2 4 II II
266 Cleveland State University OHIO 6 1 Q 1 111 11,713 146,412 21% O.) $61.5 111.1 3105404411)01) II 11
215 Jahn Carroll University OHIO 1 2 S 1 III $5,366 11.) 116.1 $21.6 /1000»11111584 21 13
210 Diversity of Dayton OHIO 6 2 0TH 8 Ill $5,261 15,6 $66.1 111.1 51 I 0 0 )2 2 0 0 12 I o s 51 51
241 Wright state Vniv-Niim OHIO 4 I Q S 102 11,141 I./ 015.e $12.1 34053 01)104021 26 el
260 levier University OHIO 6 2 5 6 ist Itoss 1.3 $25.1 130,0 160002 3 2011 3 2 2 21 19
260 Youngstown State University OHIO 6 1 Q 6 ost 11,315 $31,031 20% 4.1 141.5 $53.6 44059011104101 11 104
251 Central State University OKLA 4 I S 6 III 15)5 $21,115 1% 1.1 121.4 112.4 23 0 51 0 1101010 01 21 II
251 Phillips University OKLA 2 2 5 1 011 11,141 11.1 11.1 11.1 il 0 0 0 0 2 1 0 22 II 0 6 )0 51
212 Iniversity of /visa OKLA 4 2 5 I III $6,110 21.6 131.1 145,1 520002 20015 25 64 29 11
111 Levis and Clark College DREG 6 2 Q I Ill 11,121 13.5 122.1 126.2 1101041015604 14 85
251 Southern Oregon State Coll 01E6 2 I Q 6 ist 11,613 111,125 24% 0.0 MA 0214 33 0 51 0 1 II 4 0 2 0 1 1 21 91
255 University or Portland 011E8 1 2 5 1 III 11,018 4.1 Ill.) 116.5 1)00034)01 210 II 15
260 Blomberg University PENN I I S 6 811 11,711 121,215 11% 1.1 121.4 113.5 1) 0 61 0 i 1 0 0 0 0 0 2 12 li
251 Michell University PENN 1 3 5 1 811 11,115 41.5 132.1 131.6 vl 1 0 0 2 I I 1 8 II I 4 11 92
261 California University PENN / 1 5 1 III 11,111 117,153 I% 0.1 $21.1 126,1 21 0 6) 0 2 1 10 01)1 li 11
251 Cheyney lisiv of Penn PENA 1 I S 1 811 11,715 112,162 It 0.11 115.4 111.1 22 0 69 0 5 II I 0 1 0 0 3 20 11
211 Onion hie of Penn Main PEON I I 5 6 111 11,164 111,216 II% 0.0 $25.3 110.6 )1 0 61 0 2 6 2 0 0 0 0 2 12 92
211 Irene) University PEN1 1 3 Q 8 ill 15,121 31.6 166.1 I14.6 1406013115313 20 13
212 Duquesne University PENN 1 2 5 1 tot Isms hi 132.1 141.4 1100014)19101 25 11
211 East Stroudsburg Univ Peon PENN i I S 1 III 11,115 115,821 II% 1.1 12).1 125.5 21 0 56 0 2 5 1 0 I 0 2 2 12 15
211 Edinboro University of Penn PENN 3 1 5 / 811 11,111 120,611 169 1.0 125.1 121.1 )5065011 001801 8111211 64110011 University PENN 3 2 0TH 1 All 14,410 5.2 $11.5 111.9 /I 0 0 041 411211 )1 II
211 Indiana University of Penn PENN I I S 1 ost 0,112 139,153 130 Le 151.5 114.6 )2 0 54 0 ) 1 188112 li 11
211 totztova University PENN 3 1 S 6 est 01,101 Mitts 12% LI 121.2 121.6 34056014101002 1 II
211 Mansfield University PENN I I S 1 811 11,116 112,012 III 1.0 116.2 111.1 21064811 410114 II 12
211 Narywood College PENN 6 2 5 1 III 11,211 1.1 111.1 111.1 /5 0 0 0 3 6 4 I IS 1 I 3 32 83
211 Millersville Univ of Penn PENN 3 I S / III 11,711 121,111 12% 0.0 1)2.1 134.1 72 0 54 0 2 511110 5 13 16
211 Shippensburg University PENN 3 1 S / ill 11,112 111,121 II% 1.1 Ms 112.2 210550441;0011 13 li
212 Slippery loci University PENN 1 1 S 1 001 01,111 020,115 13% 0.0 121.7 112.1 )2 0 55 0 2 6101113 12 11
211 University of Scranton PENN 4 2 S 6 III 14,311 6.1 121.5 125.3 II 0 0 0 2 5 10 0 S 1 I 2 26 14
FINAL'VEISION (DATED 12/11116)
SS
1116-11 FACILTY SALARY STIOY (TOTAL DATABASE: PART I)
FINAL VERSION DATED 12/11/16
NO INSTITUTION
211 Villasova Vaiversitv
2;S Vest Chester iniversity
216 Videser Iniversity
211 Vines College
211 Provideace College
211 Rhode Island College
211 Salve leginaNevport College
211 The Citadel
212 College of Charleston
211 Vinthrop College
214 loath Idea State hit
211 Avstiv Pm State flax
201 East Tennessee State lair
211 Eddie TeaB State lair
211 Tennessee State University
211 Tennessee Technological 1
211 lair Tennessee - Chattanooga
211 Wide Christian University
212 Americas Technological lair
213 Angelo State.lsiversity
214 Corpus Christi State Voir
215 East Texas State University
216 Nidvestern State University
212 Or Lady of the Lake Vaiv
211 'IA American University
211 Prairie Vile AIN University
311 St. Nary's University-San Ant
311 Sam Noestos State University
312 Southwest Texas State VAiV
311 Stephen F. Austin State Voir
311 Sol loss State University
115 Web's State University
311 Texas Ail University
311 Trinity University
30$ University of Dallas
311 VIOV of Houston-Clear Lake
311 University of St. Thous
III lair Texas At Arlington
111 lair Texas At El Paso
2 9
CITY STATUS CALENDAR OE DOE TUITION NIL$ OF 2 EMI 6Elill TOTAL
STATE SIZE CODE SISTER CODE CODE 1 FEES APPFDP cum 81(11110 EXPEND EXPEND
PENN 1 2 5 I III 16,621 12.2 156.1 110.1
PENN 1 I S 6 111 11,616 1.2 136.1 $12.1
PENN 1 3 5 I III 16,111 2.1 121.2 $21.1
PENN 1 3 5 6 III 15,151 5.5 113.1 116.3
1000 1 2 5 I III 11,113 1.1 126.3 134.5
IMOD 1 I S 1 III 11,111 126,112 III 1.1 131.3 131.1
11100 2 2 5 1 III 15,351 6.0 111.5 111.5
SCAR 3 I S 1 811 13,111 6.1 116.0 121.2
SCAR 3 I S 6 III 11,636 111,019 111 0.1 122.1 126.1
SCAR 2 I S 1 111 11,212 111,613 II 1.5 $21.1 $21.1
SOAK I I S I ill 11,111 111,311 Id 11.5 115.1 151.1
TENN 2 1 Q 1 III 1111 115,112 22i It 116.3 111.1
TENN 3 I S I III 1111 112,611 111 It 151.1 155.2
TENN 1 I S I 811 1122 135,231 221 1.0 131.1 111.0
TENN I I S 1 111 11,135 122,116 111 1.2 131.5 111.1
TENN 1 1 Q 1 111 1151 1.S 131.1 $31.1
TENN 3 I S s en poll 1.1 121.1 133.2
TEXA 2 2 5 1 811 13,151 10.1 121.2 121.1
TEXA 2 3 5 6 811 12,111 1.3 11.1 11.1
TEXA 2 I S 6 811 1151 1.1 111.1 125.1
TEXA 3 I S 6 811 1361 0.1 111.3 111.1
TEXA I 1 S I 801 1391 1.2 131.1 131.1
TEXA 2 I S 6 III 1111 1.3 111.1 111.0
TEXA 6 2 5 6 III 13,111 5.1 WA 11.5
TEXA 1 I S 1 III 1661 1.3 132.5 136.1
TEXA 1 I S 6 III 1261 1.1 131.1 111.1
TEIA 6 2 5 6 111 11,531 9.1 115.1 111.3
TEIA 1 S I III 1161 2.1 135.6 111.1
TEXA 1 1 5 1 III 1111 5.1 141.1 166.1
TEIA I 1 S 1 811 1111 1.1 131.5 155.0
TEXA I I S 1 III 11,111 IA 11.1 $12.5
TEXA 1 I S s en 0311 2.1 111.1 111.5
TEXA I I S I III 1612 0.1 121.1 131.1
TEXA 6 2 S 6 111 ISMS 112.1 129.2 133.1
TEIA 1 2 S I III 11,151 21.1 111.1 113.1
TEXA I I S 6 III 1111 1.0 121.1 123.2
TEIA I 2 5 1 III 13,511 S.3 11.6 11.1
TEXA 1 I S 1 811 1151 2.1 111.1 112.2
TEXA 3 I S I III 1111 12.1 111.1 151.5
REVENUE RATIOS SOFT HARD
II R2 13 RI 15 16 11 II RN 110 III 112 NONE! NOSEY
II 0 003 2 311111 21 II
IN 0 62 0 I 5 0 0 0 0 I 3 II 100
16 0 0 0 I 3 2 0 6 I 0 3 20 11
15 0 061 1115 3 01 29 11
101085 2111 213 II 12
24 0 69 01610 0011 13 92
16 0 0 0 2 3 0 0 6 0 I 1 15 16
35 0 61 0 0 2 0 0 9 0 I 2 14 16
31 0 56 0 3 4 0 0 I 0 0 2 1 93
210611151110 0 2 12 15
21 12 11 I 6 6 1 I 1 0 1 6 21 11
210611511110 6 2 21 11
11 5 568311111 1 3 23 10
23 0 66 0 2 6181013 11 II
21 0 16 1 21 12 1 I 2 0 1 2 11 61
11168 016 312151 21 19
21 0 53655115151 21 11
5510113111 1316 23 69
101000610 6 011 13 II
20 0 19 0 2 1 0 0 I 10 I 6 11 111
13 0 II 8 3 2 I 0 I 0 0 I 13 100
9012 0 3 2 2 01121 II NI
11 0 11113101012 II III
53 1 0 0 15 1 2 0 23 S 6 1 63 51
12 0 15 0 12 11 1 0 I I 3 5 32 II
2 0 11 0 21 5 I I 1 0 0 3 35 13
11010 13 5 106511 21 13
1111902 3 113116 15 11
1111582 3 3 11121 15 110
16 1 12 0 1 3 10 0 2 I 4 2 25 II
II 0 10016161131 II 165
16 0 II 0 2 1 0 0 I 2 2 5 11 16
13 0 66 0 5 5 0 I 12 1 It 2 35 IN
12100110111311 21 15
10 2 0 0 0 2 I 0 1 16 I 1 13 II
15 0 15 0 2010110 2 6 III
61 000 2111115112 32 65
16 0 11 05210 212 3 15 13
11 0 19 0 5 5 0 0 4 2 1 2 16 15
301

FINAL VE11104 (FATED 12/31/16)
1111.17 FUMY SALAIT STUD? 11014 0A1A1A5E: PAI1 II
FINAL VERSION DATED 11/31/16
CITT STATIS CALENDAR OE DOE TVITION NIL$ OF 2 TR ENDOW GENRL TOTAL REVENUE 1ATIOS SOFT HAD
NO INSTITUTION STATE SIZE COOS SISTEN COOL COOS 1 FEES APPROP CHANGE 1V($NIL) EXPEND EXPEND 11 R1 13 R4 RS 116 It/ RI If RIO III 111 NOM MONET
113 Voir Texas Of Persian Iasi TEA 2 I 5 6 III 1311 2.1 11.1 11.910 91 011113112 5 100
111 lair Texas At San Moak' TEIA 6 I 6 111 I151 1.1 134.3 131.1 II 0 19 014002 0 3 2 II 11
31S Voir Texas At Tyler TEIA 2 I 5 1 III 1361 II.1 111.4 111.3 lw 0 14 0 21114121 1 12
III Vest Texas State goirersity TEIA 2 I 5 7 III 1442 3.3 116.1 $33.6 IS 0 11044104113 22 11
311 Suit Michael's College VERN 2 2 5 1 III "MI SA 112.1 116.1 16 21112010116 1 0311 Uorge Nasot Voirersity VIII 7 I 5 I 111 $1,311 141,111 111 0.1 I41.1 $53.6 43 0 62 0 3 1111011 10 115
311 Jim Nadisoo Voirersit V1R6 I I 5 7 101 $2,111 126,01 311 1.2 $31.1 152.1 31161 013110 0 01 i 17
121 trockburg College V1R6 2 2 5 7 111 $5,151 11.1 111.7 114.0 13 0 0 1 1 2 0 0 1 1 0 S 23 11
321 Norfolk State Voirersity V116 i I 5 1 111 $1,211 122,01 251 0.1 $21.3 02.6 21 0 63 1 7 IS 3 0 I 0 1 2 21 14
322 III llooloioo Voirersit 016 4 I S I 111 11,514 01,06 III 4.1 $52.1 10.2 3100 050112 0 0 3 II 11
323 Radford leiversity VIRG I I 5 7 111 11,113 111,19 344 1.1 111.1 131.1 3106113 5 111111 1 11
124 Voirersity of Rich000d V116 4 2 5 6 III $1,155 125.1 114.1 $33.0 16110111111301 II 116
32S Virginia State Voirersity 016 2 I 5 1 111 $1,111 $13,511 21 1.1 124.1 121.4 26 0 56121 11100111 31 12
126 Ceotral Vashitgtoo Voir WASH I I Q 6 III 11,20 10,215 61 1.1 $31.1 02.3 25 0 10 0 3 5 2 0 I 1 2 2 IS IS
121 fistful Vadiogtoo lair WASH 3 I Q / 111 $1,211 121,06 11 1.1 $31.1 01.6 23166 0 55301 013 it 11
321 Onaga Diversity WASH 3 2 S I 111 16,161 13.1 $21.7 124.3 12 0 0 0 1 3 0 1 1, 2 I 3 20 li
111 Pacific Unarm, Voirersity VA5N 3 2 5 1 111 11,05 1.1 I13.1 Ia./ 1111051111111 11 II
111 Seattle Vaiversity WASH I 2 Q I III 15,60 15.4 121.6 $25.3 1110111 3115414 26 11
111 Diversity of Paget 5ovad VA5N 3 2 S 6 111 16,01 22.6 $31.3 136.1 121114 2113106 IS 11
112 Nesters Vashiagtoo Voir WASH 2 1 Q / 111 11,111 131,661 gt 1.1 01.7 151.3 16161 045 311012 16 14
01 Marshall Voiversity VVIR 3 1 5 5 112 1161 $31,313 121 1.1 131.1 146.1 16 I 64 0 6 6 2 1 5 0 0 2 21 10
111 lay Viseoosin-Eau Claire VISC 2 I 5 7 111 $1,251 $25,133 41 1.1 141.3 153.6 30163 0 61010101 14 93
11g lair Viscoosiireeo lay 1115C 2 I 5 1 111 $1,113 02,412 71 1.1 $21.1 03.1 21161 0 7510 2121 II 11
111 Voir Viscoasiola Crosse 015C 2 I 5 1 III $1,311 111,10 SS 1.1 134.7 02.5 30 0 62 OS/ 00112 2 11 12
111 01, ViscoosioOskkoli 1115C 3 I 5 1 811 0,261 01,172 SS It $31.1 $51.3 21 0 61 0 6 1 0 0 0 1 1 32 45 13
111 Voir ViscoasinParkside 1115C 2 I 5 6 CII 0,144 04,10 141 0.1 $20.1 122.1 21 0 13 0540 01001 II 14
111 hi, ViscoosioPlatterille 015C I 1 5 6 111 11,116 114,19 61 0.1 $23.3 OM 2110 041100131 IS 0341 Isiv ViscoosiRirer Falls 015C I I Q 6 811 ;1,113 04,116 61 1.0 111.1 131.1 35051 04611113 2 15 13
141 Voir ViscoNsio-Sttreos Foist VISC I I 5 1 111 $1,231 $21,311 31 1.1 $35.1 07.1 2716211111113 2 21 11
10 lair Viscoosia-Stoat 015C I I 5 7 811 $1,111 111,111 IS 1.1 $31.5 147.1 3210 0 11 6 001131 21 17
111 lair Viscoosio-hperfor 015C 3 I Q 7 811 $1,214 0,114 III 1.3 $13.3 05.1 23 0 61 0 12 6111011 20 17
30 Voir ViscossioVhiterater 015C I I 5 6 111 0,01 01,01 71 0.1 134.1 10.1 31 0 63 0450 0 0 1 21 12 fl
1114111011 VALUES NA NI WA NA NA WO $1 -31.11 $1.0 $1.1 $1.1 200011011011 elMINIM VALVES NA NA NA NA NA 111,514 $113,111 41.11 $111.1 110.1 $311.3 104 0 0 71 44 25 12 16 21 43 31 34 13 121
AVERAGE VALVE NA NA NA NA NA 11,131 111,44 11.11 11.1 $31.S 131.1 41 I 41 0 5 5 2 I 4 2 I 3 21 16
511 DEVIATION NA NA NA NA NA 11,611 111,111 11.54 $11.1 111.3 I11.I 21 1 31453 21553 3 II 14
COINT (NONBLANIS) 311 311 311 311 312 313 163 161 313 311 311 310 310 310 310 310 310 310 310 310 310 311 311 311 311

Appendix A-Part 2 pages 9 -17
FINAL
NO
I Alabama
2 Alabama
3 Auburn
4 Jacksonville
S Troy
1 Troy
1 Troy
1 Isslegee
i WVII University
II lain
12 WV11 hit
lk hit
IS Northers
II Arkansas
I/ Ouachita
11 Univ
11 Univ
21 Azusa
21 lid;
22 Ca
23 Ca
24 Ca
25 Ca
26 Ca
21 Ca
21 Ca
21 Ca
11 Ca
31 Ca
12 Ca
11 Ca
lk Ca
35 Ca
16 Ca
11 Ca
11 Ca
11 Ca
el Ca
kl Ca
62 Chaplin
VE1510N DATED 12/11/16
INSTITUTION
A I N University
State University
Isiversity-Nontgovery
State University
State University -Hain
St V Dotkn-Ft fucker
State I Nontgomery
University
Alabama laHuntsville
of Nontevallo
of North Alablai
of South Alabama
Alaska Anchorage
Alaska Fairbanks
Arizona University
State Univ Main
Baptist University
Arkansas At Little lock
of Central Arkansas
Pacific University
University
iforuia takers College
State 1111atersfield
State I-Sas Bernardino
Poly St V-SN Luis 01
State II-Chico
State 0-Dominguez His
State I-Fresno
State I-Fullerton
State I-Hayward
State 1-11114boldt
State 1-Long leach
State I-Los Angelos
State 1-Northridge
State Poly V-Pomona
State II-Sacramento
State 11-San Diego
State I-Sas Francisco
State I-San Jose
State 11-Sonoma
State UStauislaus
College
STATE
ALAI
ALAI
ALAI
ALAI
ALAI
ALAI
ALAI
ALAI
ALAI
ALAI
ALAI
ALAI
ALAS
ALAS
A112
AQUA
AURA
ANNA
ARIA
CALI
CALI
CALI
CALI
CALI
CALI
CALI
CALI
CALI
CALI
CALI
CALI
CALI
CALI
CALI
CALI
CALI
CALI
CALI
CALI
CALI
CALI
CALI
Fl
lk
II
23
16
28
3
3
kl
kl
31
52
11
21
51
Ilk
16
11
11
63
23
33
23
15
16
ilk
311
121
ill
331
266
III
111
121
112
151
511
511
121
ill
141
115
12
AO
51
33
kl
25
21
k
6
At
53
31
31
16
46
SS
113
11
11
10
15
25
UI
11
24
31
116
15
31
16
RI
11
61
11S
Ilk
IS
III
III
221
Ilk
151
31
21
24
NEN
AI
SU
31
II
21
31
IS
II
kl
16
15
kl
51
31
16
11
lk
11
68
55
11
21
1
23
60
52
kl
II
kl
51
21
23
11
52
11
US
21
15
SU
51
II
lk
24
MIER OF FULL-TINE FACULTY
BONEN TOTAL
IN PI AO AI IN PI AO AI
16 II 26 32 11 kl 11 16
25 k 12 35 25 21 US 65
11 3 12 22 It 26 II 62
kl 23 2 21 31 III 21 53
11 3 lk 31 21 31 42 18
3 I I II I k 5 26
3 I 1 3 3 k 6 13
23 6 II 21 21 53 55 11
1 k IS 22 IS kl 61 II
2 1 11 21 3 31 kl 35
k 6 12 21 11 51 42 11
24 lk 21 26 lk 112 16 15
k 3 11 13 5 31 61 kk
1 1 1 21 5 51 lk 11
II 5 16 kl 1 III III 131
it k 16 32 42 11 16 16
1 2 k 6 2 21 22 16
11 II 31 k2 11 11 121 112
22 3 21 21 21 66 65 li
5 2 11 1 k 25 35 21
3 3 13 12 6 16 61 33
6 3 1 3 S 26 26 11
lk 1 20 5 11 33 41
3 lk 21 21 2 11 51 11
2 31 39 21 I 521 215 13
5 15 6 31 2 %IS 11 ti
I 45 II 21 0 112 51 31
1 13 kl ki 21 512 121 11
1 16 31 31 2 425 III 16
2 SS 31 32 9 321 III 56
0 2S 26 16 0 216 lk 39
1 II II 62 I 516 216 111
I 112 SU 21 I III 161 II
1 111 SI 51 I 511 116 131
0 41 31 21 3 klii -151 ti
k 115 51 31 3 611 151 11
1 12 101 61 21 661 116 IUU
11 111 11 US 13 521 115 11
$ 11 13 66 6 511 211 125
I 3S 21 5 1 111 51 16
k 16 II lk k 121 32 21
1 6 13 1 1 II 31 32
IN
lk
51
31
II
31
k
6
kk
23
5
lk
51
1
13
25
12
1
21
il
1
1
11
5
5
3
1
I
21
2
II
1
0
2
15
3
1
21
31
12
1
1
0
TOTAL
FACULTY
AS111
Ill
261
III
31
21
221
226
121
Ilk
351
Ikl
222
ill
Ikk
61
Ikl
264
11
131
13
110
211
112
611
254
151
112
115
HI121
611
III
611
115
1167
126
161
246
119
11
PERCENTAGE OF
TENURED FACULTY
Pt AO AI IN
16 16 51
11 61 SU 2
11 10 35
11 SI k0 8
11 11 35
0 23
0 50 23
lk 55 kl 9
II 11 13 1
11 92 31
13 16 II 1
16 93 20 3%
11 46 1
61 31 2
19 16 21
93 11 16 11
16 15 38 II
11 61 11 5
II 11 30 k
16 23
19 61 15
16 13 31
13 11 2
lk 16 1
lk 51 II
12 11 5
12 61 10
16 Il
91 51 5
16 SU 5
II lk 10
16 51 6
II 61 16
11 11 II
11 k1 1
II SI 1
15 66 21
15 56 1
11 53 5
11 14 25
13 61 k
100 61
BENEFITS
AS % OF
SALARY
19
it
22
21
20
21
21
11
II
19
20
20
23
23
11
21
22
23
21
26
11
21
22
22
22
21
22
21
22
22
22
21
21
21
22
21
22
21
21
21
22
18
TOTAL
1 UG
1211
1216
MO6211
1216
1105
1425
3111
1111
2210
1621
1061
1101
012
1111
I156
MO1118
5615
1113
2021
1511
2111
4616
15151
11000
5552
14111
11611
1211
5115
26616
15221
21506
ISM11111
21151
18151
21013
4014
3015
1511
TOTAL
1 6
Ilk
321
151
111
313
531
ill
113
151
230
541
151
462
553
2121
110
110
1151
III
110
152
1023
1315
1121
113
1661
2011
2101
3113
2113
1015
5111
6210
5216
1561
4512
6155
6115
1106
1416
111$
365
I PART
UG
1.2%
1.6%
1.0%
22.11
11.5%
62.4%
10.1%
2.0%
16.14
11.5%
18.1%
25.1%
51.2%
15.6%
15.5%
11.1%
0.11
46.11
10.2t
11.3%
8.1%
ISM38.1%
51.1%
12.1%
12.3%
3S.3%
11.10
35 -%%
30.11
11.1%
32.1%
31.2%
11.6%
25.0%
24.4%
21.1%
32.5%
31.2%
11.51
21.9%
12.5%
NUMBER OF STUDENTS
% FULL NO OF TOTAL I
UG III STUDENTS
11.11 820 4221
10.1% 122 3113
1.1% 1310 1158
11.1% Ilki 1028
11.5% 151 1519
11.6% III 1636
19.1% 1116
11.011 611 3311
53.2% 555 5131
10.5% 510 2410
10.61 125 5111
11.1% 1011 1131
kill Ill kIll
61.1% 512 4155
11.5% 1163 12615
16.2% 3111 I446
11.1% 349 1630
51.1% 1113 10141
11.1% 1115 6152
11.1% 313 201
11.2% 401 2916
11.1% 301 2533
61.1% 124 3152
61.21 kik 6513
11.1% 1105 16110
81.11 1316 4161
61.1% 415 1651
82.01 2121 16111
64.1% 1611 21112
61.11 611 12113
12.1% 511 6221
61.1% 2115 12511
62.11 1392 21510
11.k% Ski° 21112
15.01 1115 11217
15.21 1511 23313
12.0% 6615 IkIlk
61.5% 1151 25113
61.1% 1151 25111
61.5% 311 5511
10.1% 231 4255
11.5% Ill Ilk)
TOTAL
IFLIG
2111
2111
1115
1115
4l6
211
1151
2855
1111
3125
SOU
1101
2115
1152
5111
1410
1111
5111
113$
1116
1211
1501
1001
13115
11311
1561
11561
12613
6150
1252
11113
1561
16611
11131
14141
21116
12111
14513
2113
2155
1)11
TOTAL
IPT,VG
300
315
1116
111
611
Ilkk
63
2332
432
III
2131
2112
1411
1535
1116
10
klkl
511
31%
111
240
921
2111
1162
1611
1111
2513
6156
2110
133
1511
5660
All
1111
4611
1121
6154
6511
1211
120
III
. 33 34

FINAL VERSION (DATED 12/31/16)
1116-11 FACULTY SALARY STUDY (TOTAL DATABASE: PART I)
4-
FINAL VERSION DATED 12/31/16 NUNIIER OF FULL-TINE FACULTYNUMBER OF STUDENTS
PEICENTHE OF BENEFITS
NEN WOKEN TOTAL TOTAL TENURED FACULTY AS S OF TOTAL TOTAL S PART i FULL NO 0' TOTAL I TOTAL TOTAL
10 INSTITUTION STATE PI AO AI IN PI AO Al IN PI AO AI IN FACULTY PI AO AI IN SALARY I UG 16 116 116 frf STUDENTS !Fiji 111,16
43 College Of Notre Dan! CALI 114 3 151 0 16 II 13 3 13 11 21 IS 653 161 31.21 62.1% 101 1113 ill 213
41 Moly Names College CALI 2 3 613 11151131 31 kk 1 IS 405 III 11.11 55.31 15 512 221 III
IS John F leaned! Vniversity CALI 1111111110 2 0 2 306 1305 15.61 14.1% 1611 11 262
41 Loyola Norwood University CALI 11 51 51 3 11 22 21 I III II II 4 266 15 61 II 10 22 1020 1321 11.51 11.51 112 5311 3551 162
11 Mills College CALI IS I II 1 1 I 13 6 22 lk 23 6 65 11 16 20 161 216 1.21 15.11 160 113 135 32
41 Monterey last. loternl Stud CALI 55121512 6 II 12 4 32 SI 21 106 361 11.31 II.11 112 Ik 12
11 Pepperdine University CALI 13 11 21 2 6 II 5 2 11 16 25 1 211 II II 16 21 3210 3111 31.1% 11.11 511 1151 2215 165
SI Saint Nary's Coll. of Calif CALI 21 24 I/ I I 11 IS I 22 35 21 0 IS 12 11 li 22 2211 601 11.11 15.01 113 2111 2111 1114
SI Univ of La Verne CALI 25 21 12 1 1 II I I 33 31 21 1 IS 16 26 20 2152 1614 52.61 11.1% 221 1316 1301 1111
52 Univ of The Pacific CALI 161 65 53 2 16 11 21 S Ill 12 13 1 311 11 SI S 23 3611 262 6.1% 11.1% 111 3111 3311 211
51 Univ of ledlands CALI 51 21 1 I 12 1 II 2 61 31 11 3 III IT II 21 II 1116 15 2.3% 11.11 215 1111 1111 21
11 Univ of Sam Diego CALI 61 16 25 0 13 26 II 2 II 12 11 2 III 15 63 5 21 3352 1113 6.1% 13.11 161 5265 1121 232
SS Univ of San Francisco CALI II 16 35 1 1 33 I/ 3 II 11 52 1 226 II 65 56 21 11 3131 1111 13.2% 16.1% S11 MI 2111 153
56 Santa Clara VoivtriitY CALI 51 11 56 1 1 12 21 II II 11 I 211 II II I 24 1611 4Q15 2.5$ 91.5$ 110 1614 3511 II
SI Whittier College CALI 16 21 II 3 2 1 IS i II 31 26 1 12 III 11 35 21 1156 515 2.1% 11.It 212 1651 1131 22
SI Adams State College COLO 21 1111211121 II 11 S 61 11 11 31 23 1651 331 1.1$ 11.11 101 1113 1511 113
SI Univ of Colorado Cold Sprgs COLO 14 21 33 3 3 1 IS 4 31 12 41 1 124 95 II I 14 3111 1612 11.11 SOS 216 5511 2121 1111
II Voiv. of Colorado at Denver COLO 12 15 61 II II 22 II 6 12 11 16 21 211 II 66 3 IS 1252 2531 56.11 13.11 255 10111 3551 1613
61 Western State Coll of Colo COLO 12 22 16 1 1 2 1 I IS 24 21 5 11 III 16 IS 21 2123 ilk 6.21 13.1$ SS1 2531 1111 132
12 Central Comieticilt St Div CONN III 11 13 S II 31 31 6 121 133 III II HI II 13 SS 21 23 10160 2511 31.2% 60.11 1151 13361 1613 1251
63 CoometiclitIollege CONN 21 25 24 2 II II 13 6 16 36 31 I 121 11 11 5 22 IIIS 11 2.0% 91.01 151 1132 1651 31
11 Fairfield Voiveristy CONN II 51 il 3 1 12 23 3 41 62 II 6 III III 15 66 23 4051 1111 21.65 11.1% 116 SIll 2111 1151
IS Saint Joseph College COON i 1 10 2 3 II II 5 / 11 21 1 SI III 12 25 16 113 102 21.2% 12.It 121 13t5 511 202
11 Southern Conn State Univ CONN III 13 12 1 36 51 11 5 155 121 III 12 113 II 11 11 SI 23 IllS 3111 25.3% 14.1% 1325 10162 5111 1161
11 Trinity College C.AN 53 26 21 I 2 11 II 2 55 31 31 3 126 II 15 24 1111 115 1.1$ 12.11 161 2111 1163 151
II University of Iridgeport CONN 12 11 23 I 12 23 22 I 14 101 15 16 255 11 11 16 6 23 3151 2013 25.11 11.11 ISO 5111 2152 III
CO University of Nartford CONN 13 13 11 I I 10 15 3 Ik 113 106 II 211 II IS II 26 5511 2112 30.2% 61.I1 1111 1101 3113 1616
11 University of Men Naves CONN 13 11 26 1 2 5 1 1 IS 53 32 I 131 13 61 13 22 1314 2614 51.1% 11.21 III 1111 1115 2521
II Wesleyan University COON III 11 34 3 13 IS 21 121 SI SI 3 213 12 92 29 2611 161 0.1% 100.01 121 3111 2110
12 Western Como St College COON 53 36 21 1 I/ 11 22 3 11 52 SI 6 Ill 11 11 16 22 5021 1121 31.1% 60.11 623 6151 3111 2111
13 ialleadet College GIST 31 12 21 II 13 21 33 21 II 63 51 45 211 111 11 46 i II 1213 310 1.0% 0.11 16S 1153
11 Univ District of Columbia DIST 133 III II IS 11 11 11 11 111 113 111 31 511 21 12010 115 12.11 31.11 3351 12615 1111 1113
IS lorry University FLOI II II 11 I 12 22 25 1 22 II 12 I 112 II 1161 1153 12.11 11.11 116 1222 1151 1112
11 Florida Atlantic Univ FLOI 131 12 4$ 13 1 21 12 2 131 111 11 IS 331 13 II 13 22 1513 2112 53.11 16.11 251 11255 3163 1151
11 Florida lnternat'l Illiv FLOI IS 111 11 21 II 11 51 11 16 III 151 /I 511 II 11 6 22 12525 2125 10.11 MIS 511 15151 5115 1511
/I Stetson University FLOI SI 21 21 1 1 II II 1 12 11 11 II I45 II II 14 IS 2151 III 1.3% 11.1% 542 2111 2131 21
11 Univ Of Central Florida FLEA 123 121 III 22 I 22 11 23 131 151 154 IS ill 15 13 30 21 12111 1612 31.1% 12.11 1111 IMO 1111 1115
eo University of West Florida FLOI 62 11 21 II 1 IS 23 1 11 111 11 21 211 11 I/ 30 21 1031 1101 31.2% 60.I1 235 5116 2156 1513
II ArostrongState College 6101 44 14 30 5 3 S 31 11 41 II II II ISO 11 II 39 24 2100 100 0.0% 0.11 520 2111

FINAL VERSION (DATED 12/31/061
1116.11 FACULTY SALARY STUDY (TOTAL DATABASE: PANT I)
FINAL VERSION DATED 12/31/16
NO INSTITUTION
12 Augusta College
I) Nooks College
14 Georgia College
IS Georgia Smaller,' College
11 ieorgia Sovtkvestern Coll
11 North Georgia College
11 Nest Georgia College
II Noise State litiversity
11 Idaho State University
II Bradley Ilkiversity
12 Chicago State Voiversity
13 IOW University
14 'uteri 'Wools Vaiversity
15 Governors State Ilitiversity
16 Levis VolversitY
11 National College of (du
11 Northeasters iiiihiS hi,
11 Roosevelt Vkirersity
111 Rosary College
III Siefle0 State Vaiversity
112 SootkerA III INirEdvardsvle
113 Western Illioeis University
114 Wheaton College
115 Butler Volversity
II6 Iodine Central University
II/ Indiana State VAIr-Terre Ile
111 1111:rdve 1 Fort Mae
111 Wino Vairladiaaapolis
III Wilke Wale - Northwest
III Iodine Voir At South lead
112 Perdue Vuiversity-Calueet
113 Vaiversity of Crossville
114 Valparaiso lkiversitY
115 Drake Vaiversity
116 Sale of Nortlera 'ova
III Emporia State University
III Fort Nays State Vaiversity
Ill Pittsburg State University
121 Washburn University
37
NEN
MEI OF FULL-TINE FACULTY
VOW TOTAL TOTAL
PERCENTAGE OF
TCNIRED FACULTY
STATE PR AO Al IN PI AO Al IN PR AO Al IN FAULTY PR AO Al IN
iCON 31 21 25 1 1 11 22 1 31 41 41 16 141 IS 11 43
GEOR 51 41 11 5 13 21 II 1 63 69 36 13 III 11 11 25
UDR 36 21 25 4 1 22 26 6 45 51 SI 10 156 12 11 22
GEOR 11 11 12 13 5 11 11 31 15 11 131 44 346 11 13 42
LEON 26 21 25 1 5 II 16 31 31 il 1 110 11 11 39
6E01 21 II 16 3 6 1 II 2 35 21 35 5 16 11 III 29
GEOR 61 SI 45 16 II 16 II 12 12 14 14 21 231 10 II 21
LOAN III 13 42 2 12 21 26 5 121 III 61 1 316 14 61 21 14
INN 11 Si 61 13 5 26 32 21 IF 16 13 100 345 16 16 li SI
ILLI 13 1$ SI 1 S II 21 II /I 15 11 II 211 16 II 33 11
ILLI 12 42 21 5 21 31 31 II 11 13 SI 24 254 16 II 11
ILLI 11 III 41 16 14 31 36 11 III 151 13 33 314 11 12 23 3
ILLI 114 Ili 62 41 11 32 52 31 ti: 131 114 11 515 11 13 35
ILLI
ILLI 24 11 IS 6 1 1 1 6 31 24 24 12 II 14 SI 4
ILLI
ILLI 126 41 43 I 44 32 42 5 111 11 15 1 341 11 11 46
ILLI SI 31 25 1 II 1 13 4 62 41 31 4 151 11 62 24
ILLI 2 II 11 I I 13 1 I 3 24 II I 46 03 61
ILLI 21 61 11 I 3 11 12 I 31 11 30 0 139 11 14 II
ILLI 113 116 54 14 23 31 26 21 216 131 II 42 415 11 16 45 24
ILLI Ill 131 13 31 21 31 31 21 224 III 131 51 511 111 II 33
ILLI 53 31 23 3 I II 13 1 62 41 36 3 151 14 53
1111 41 31 25 4 1 / 22 S 54 45 41 1 155 10 11 41 II
INDI 12 11 16 2 3 12 24 4 IS 29 40 6 II 110 SS 1
INN 241 112 111 14 41 36 13 31 216 131 III 45 641 11 15 41 4
INII 41 12 13 S 6 24 45 1 46 116 III 14 211 16 11 26
INII III 141 114 I II 66 15 4 151 215 III 5 511 15 14 22
!III 21 36 23 2 2 II I/ I 23 46 41 3 112 16 13 3
INII 31 56 1515112 16 64 23 2 125 111 II 22
INDI 31 61 41 1 i 23 36 1 31 12 11 11 223 111 11 25
INDI 41 41 24 I 1 13 31 2 51 62 61 3 113 11 11 S4
INDI 61 12 26 1 3 12 31 1 64 14 Si 16 221 11 16 25 6
IOWA 15$ 41 25 6 4 16 23 1 III 65 41 13 235 11 IS IS
IOWA 122 121 133 35 13 31 14 41 135 111 III 15 561 11 14 SI I
BANS 61 62 31 1 12 IS 13 2 II 11 43 2 213 III 12 II
SANS 56 SI 11 IS II 13 11 II 61 63 SS 25 211 11 14 33
SANS 12 11 33 16 12 22 1 2 14 12 42 11 226 111 II 21
CANS 61 32 35 1 1 12 36 IS 61 44 11 24 211 11 11 21 4
BENEFITS
AS I OF
SALARY
TOTAL
1 VG
TOTAL
16
U PART
OG
NUMBER OF STUDENTS
t FULL NO OF TOTAL i
116 FTF STUDENTS
TOTAL TOTAL
IFT,IG IPT,IG
24 3311 515 41.11 51.11 514 3116 1141 1362
24 3316 459 36.11 63.11 525 3145 2135 1251
26 3226 114 26.6% 13.61 621 3140 2314 152
26 6161 134 1.31 11.11 1562 6135 5511 SIt
25 1113 364 15.11 14.11 341 2231 1511 211
21 1195 221 1.I1 12.11 313 2123 1653 142
23 4100 1110 21.I1 12.11 1311 5111 3411 1312
22 9313 1116 43.2% 51.11 1164 11211 5211 4123
21 MI 1525 31.11 61.11 ISIS 6134 3220 1311
11 4411 531 14.31 15.11 111 4151 3111 611
11 5141 1511 31.11 12.11 521 1421 3641 2211
25 1114 5122 31.11 61.11 116 12136 6115 2131
12 1451 121 3.11 16.21 1100 11211 1111 311
II 2213 3133 12.51 21.51 5326 631 1662
II 2421 655 35.21 61.11 411 3016 1561 152
11 1311 1315 1.11 1.01 215 2102
II 1131 2143 45.61 54.41 165 11111 4213 3525
21 4321 2111 61.31 31.11 161 6341 1611 2652
21 145 661 21.61 10.41 142 1616 665 211
II 1161 1416 60.91 31.11 3236 619 1111
II 1114 1152 21.11 12.0% 1121 11136 5113 2211
12 1611 2166 12.51 11.51 1111 11145 1412 1211
21 2211 311 OM 11.11 561 2511 2161 21
20 2415 1336 11.41 11.11 521 3141 1162 643
24 2561 434 54.51 45.56 331 2115 1165 1316
26 9111 1125 1.11 11.11 2119 11411 1154 12
21 1233 1111 51.51 41.51 1321 11334 3142 5411
21 15113 1365 55.41 44.61 2511 21431 6121 1344
21 3511 516 50.11 51.111 111 4114 1161 1151
21 4324 1255 65.11 34.11 1321 5511 1511 2114
24 6461 III 51.11 42.11 111 1331 2111 3610
21 3525 511 32.61 61.41 133 4133 2311 1141
II 3135 461 3.21 16.11 111 3114 3134 III
II 3111 1111 23.11 16.11 616 5512 2121 112
22 11431 1113 16.11 13.21 I11S 11514 1611 1151
11 3112 1562 13.61 16.41 1211 $344 3214 511
11 3154 1103 11.51 10.51 154 5151 3111 113
11 3131 1251 11.41 12.61 526 SIII 3111 661
11 4112 1211 42.61 51.41 922 6111 2141 2035
38

FINAL VERSION (DATED 12131/16)
1116-11 FACILT? SALARY STUDY
FINAL VERSION DATED 12/11/16
(TOTAL DATABASE: FAIT 1)
14111E1 OF FULL -TINE FAULTY NUMIEI OF STUDENTS
PERCENTAGE OF BENEFITS
NEN MORN TOTAL TOTAL 1ENVIED FACULTY AS 1 OF TOTAL TOTAL A FAIT S FULL NO OF TOTAL I TOTAL TOTAL
10 INSTITUTION SUM PI AO Al IN tl AO AI IN PI AO AI IN FACULTY PI AO Al IN SALARY 1 VG 1 G UG U6 fir STUDENTS IFT,VG Iti,VG
121 %Wilts State VaiversitY SANS II III 121 11 1 21 12 31 III 111 212 S2 IIS 11 II 31 II 13502 3111 50.1% 50.1% 1311 16112 1111 I155
122 Entire Ilatectypiversity SENT Ill 112 12 II 13 31 III 31 221 111 III 11 SI1 11 11 11 21 12122 1211 11.1% 11.2% 2616 13111 10161 1461
123 Morehead State University SENT IS SI SI II 6 11 41 11 Ill 61 11 21 211 13 IS 11 11 21 6333 1311 10.1% 13.1% 111 Sill 3116 131
121 Norm State laiversity LENT II IS 11 13 6 11 31 I I/ III 117 22 332 II II A 25 6065 1132 13.1% ILI% 1261 1111 S211 III
121 laioa College SENT 1 1 II 3 2111111 111 11 11 61 12 21 666 210 21.1% 13.1% 210 Ili III III
121 Mestere leatecky laiversity SENT 201 IP. 11 II 22 14 )1 22 231 111 113 33 521 II III 11 3 22 DS) 1111 11.6% 12.12 1111 11251 1111 1111
12/ irooklial State laiversity 10111 )1 )1 Si IS 11 II SI IS SI II 112 31 232 111 11 3S II 13 4161 2S3 1.6% IS.l% 111 1122 1266 21S
121 Lollislaaa Tech laiversity LOH 131 III II II I 11 II 11 111 13S III 21 III 91 12 IS IS 1116 1111 ISA% 11.0% 2113 10111 1111 1412
121 Loyola lair to Nee Ortega, 1011 41 11 )1 I I I/ 21 1 11 IS 62 II 211 li 11 II 22 )311 1211 11.6% 11.1% ill 16S1 21S3 631
131 McNees! State laiversity Loll SS 11 IS 23 I 11 21 23 II 11 12 II 211 12 IS 31 2 16 6S11 IISS 16.1% 13.1% ISIS 1153 SIII 1111
1)1 Nicholls State laiversity 1011 )1 11 )2 22 I 24 )4 II 41 11 66 41 21S III 11 12 11 6615 III 11.1% 11.1% 13S) 1S21 S3S3 1262
112 Northeast lollislaaa lair 1011 62 II II I) 1 11 11 SI II II 121 11 311 11 II )1 12 1111 IISS 11.6% 13.1% 2211 11161 1261 1613
II) Nortietstero State Vole 10111 61 31 IS 11 11 11 SI 31 I) SI IS 11 213 IS 11 21 I II MI 1221 36.1% 13.1% 1111 Sil/ 2121 1621
III Southeaster' lovisigla lair 1011 SI 61 12 12 I 11 SI 21 11 11 16 11 211 II 12 11 II 1111 11)1 ISM 11.5% IIIS 1101 1651 1721
135 Soethera laiv AiN Claim LOU1 III 11 11 II 31 11 121 31 1)1 12S 221 SS 511 II 12 SI 22 13 1St) 1121 13.1% ILI% 1711 I562 1112 1111
III laiversity of Nee Orleans 10111 121 III 11 11 2) 21 31 SI Ill 111 III III 111 14 11 I 11 3211 II 1.1% 1.1% III 3211
111 laiv Soetheestern Loathe' LOH III 13S 11 41 II 33 61 11 131 161 ISI III $61 I) II )2 S 13 111)1 1114 11.1% 11.2% 2112 16211 111)1 2111
131 lair. %aloe At Droao MAIN 111 11$ II II 1 )1 53 IS 111 11S 1)2 21 111 III 12 S 1 22 1151 1111 11.4% 11.1% 2162 11121 1126 1)2
III laiversity of Soother' Noise NAIN SI 11 31 3 S 31 31 II SI 121 61 21 2S1 II 11 II 22 1651 1112 II.S% 11.1% 1111 1131 )111 3111
Ill froth'', St0te College NAIY S2 12 31 I S 1 IS 11 SI 11 SI 22 III I) I) 11 I 30 )223 112 1).2% 11.1% III 311S 2111 126
111 Mood College NARY 12 1 II 3 I 21 IS 1 21 21 25 II 12 111 SI I 21 1111 611 26.S% 13.5% 111 1111 111 211
112 Loyola College NARY 21 SI I) 3 1 1 II I )1 13 Al 1 ISO 11 12 21 II 3136 2121 11.1% 11.3% III SRI 2111 326
11) Norgall State laiversity NARY 41 41 11 13 II II 1) II 61 61 11 32 2)1 IS II 11 )1 30 1111 511 11.1% 13.1% III 4510 3111 161
114 Salisbury State Colleg NARY )1 II 31 II 1 11 21 12 31 SI SI 22 III 12 II 31 SI 21 4111 121 22.1% 11.0% 111 011 3111 III
III hem State laiversity NAt1 IS 16 II) IS 21 )1 II 26 IIS 12) 212 11 111 III IS SI II 21 1)121 1111 32.6% $1.6% 1563 11111 1)11 1513
111 Diversity of Ioltiooro NARY 21 21 11 1 1 6 I/ 21 21 SI 1 III II 13 12 2) 2111 255I 62.11 21.01 525I 1111 1111
111 lair Narylasdalto Coed! NAII 61 II S2 21 3 21 3) 21 11 111 IS 12 101 16 II 11 25 1511 131 21.1% 13.1% 1)91 1111 SIll 2:33
141 Went Narylaad College say 21 22 II 1 2 1 1 1 21 21 11 1 IS III II II 21 1112 114 6.1% 11.1% 211 1611 1112 11
111 Ividgevater State College NASS 11 31 13 2 2) II )1 6 II) SI 11 I 2S2 III 13 13 13 II S362 1111 S.61 WI% 126) 1111 SIll 312
ISO Oak Diversity NASS 13 IS 21 1 II 1 II I S3 S2 IS 1 IS1 III 12 21 22S3 SIl 2.1% 11.1% Ill 2111 2211 li
ISI Eversoa College NASS 11 13 23 I S I II 2 22 22 33 2 11 II SS 6 2S 2011 213 16.1% 13.1% 112 2)62 11)6 353
112 Simms College NASS )2 II 13 3 21 )3 12 1 Si SI SS II 112 IS 11 21 1111 1161 11.1% 12.1% III 3111 1112 331
IS) kith College NASS 13 11 1, 4 21 21 IS S 112 li IS I 212 II II II 23 2611 12S 2.11 11.1% ill 211$ 2111 61
III Solltheastera Ness lair NASS 112 12 21 1 22 21 21 I III II SI 1 111 II 11 21 23 SIll 11$ 1.1% 11.1% III) 1111 SIII S6S
1SS Suffolk laiversity NASS 12 11 32 S 11 I 2S 6 12 Si Si II 211 11 21 21 3111 2121 )1.1% 11.1% S13 6132 2311 1151
1St laiversity of Lovell NASS 111 111 12 II 11 I) IS II III 111 III 21 411 II II 31 1 21 12111 211) 35.1% 11.1% 3111 15212 1231 1111
111 laly Massachesettslostom NASS I)) 13) SS 2 21 13 II 3 161 111 IIS S 111 II 11 21 II 11626 121 11.1% 11.1% 112 12S11 191 SSII
111 Mestere Nee Wald College NASS )1 31 )1 1511) 11 IS )1 II 131 III 61 16 II )116 11)1 33.1% 61.1% 111 SIll 2111 1021
ISI Cadre! Njchigaa Diversity NICK 111 122 123 )2 21 )1 53 31 215 1S2 111 61 511 II II 11 S 21 146)1 21)2 1.1% 12.3% 3011 11111 11511 1124

FINAL VERSION (DATED 12/31/10
1116.11 FACULTY SALARY STUDY (TOTAL DATABASE: PART 11
FINAL VERSION DATED 12/31/11
NO INSTITUTION
111 Easters Nichigas Diversity
111 Grand Valley State College
112 Narygrove College
113 Nichigas Techological Div
114 Northers Nichigas lniv115 Oaklaud Diversity
III Saginaw Valley State College
Ill Isiv Nichigas-Dearbors
111 1esidji State Diversity
III College of hist Thous
III hulled State Isiversity
I11 St. Cloud State Diversity
112 Saist Nary's College
I/I Isiv Nisuesota- Duluth
114 Jackson State Diversity
111 Mississippi Div For Vous
III Central Missouri State Univ
I11 Lincoln Diversity
11111slesvood College
Ill Northeast Missouri St Uuiv
Ill Northwest Missouri St Div
111 Southeast Missouri St Iuiv
112 Solthvest Missouri St Maio
111 Div Missouri -St. Louis
111 Webster Isiversity
111 Nuts.' State Diversity
Ill Creighton University
Ill Kearny State College
III Isis Nebraska At miskil
toi Wyse State College
III luiv of Nevada-Las Vegas
III Rioter College
112 FarIgh Ocksu Florhau -NAD
113 FarIgh Ocksu C Istierfd
111 FarIgh Ocksu Teaneck Cu
111 Jersey City State College
111 Bus College of New Jersey
111 Nosuouth College
III NostclairState College
41
NUMB OF FULL-TINE FACULTY NUMBER OF STUDENTS
PERCENTAGE OF BENEFITS
NEN WOMEN TOTAL TOTAL TENURED FACULTY AS S OF TOTAL TOTAL % PART % FULL NO OF TOTAL I TOTAL TOTAL
STATE IR AO AI IN PR AO AI IN PR AO AI IN FACULTY 111 AO AI IN SALARY I UG 1 6 16 06 FTF STUDENTS IFT,16 1/2,16
NICK 231 114 11 I 53 41 11 14 214 144 116 23 91 11 11 il 13 26 15211 1153 30.11 66.21 2521 11123 11512 4611
NICK 61 11 13 I 3 31 II 3 II III 21 4 212 93 10 21 24 1661 1421 40.1% Mil 2225 1111 4556 3111
NICK 2 5 5 2 4 11 5 1 6 22 10 11 il 13 15 30 14 1011 212 30.4% 61.61 146 1231 121 314
NICK II 15 III II 3 12 13 II 11 101 121 21 331 95 12 23 24 6113 314 6.8% 13.21 1161 1531 5155 ill
NICK 126 $ 21 13 12 26 31 21 131 16 51 34 311 11 15 25 26 6111 110 21.2% 18.11 1411 1411 5216 1123
MICH 13 III 41 1 1 21 35 II 112 133 14 24 143 110 11 5 32 1111 2211 33.9% 11.11 1311 11111 6412 3211
NICK 41 2S II 4 1 12 12 3 55 31 31 / 121 96 13 20 29 21 4140 530 48.11 51.3% 126 4111 2211 2163
NICK 52 41 21 1 1 13 1 1 51 54 21 1 141 III 93 4 25 5114 613 45.11 51.35 611 6511 3252 2132
NINN 11 42 31 II 1 1 24 I 13 41 61 20 212 II 61 35 24 3133 133 10.4% MIS 612 3166 3343
MINN 22 41 12 28 3 $ 32 II 25 51 14 31 216 81 11 21 11 4321 2446 15.2$ 14.1% III 6115 3113 651
MINN II SI SI 1 13 2: 33 1 13 12 II II 213 11 16 46 22 1234 112 11.65 12.4% 1211 1111 5151 1215
MINI 114 11 11 22 22 11 41 22 III 14 143 44 411 11 II 56 24 11116 512 1.3% 11.1$ 2441 11311 f116 1011
NINK II 21 11 2 2 5 S I 11 26 24 3 12 15 11 13 II 1114 341 2.2% 11.1% 311 1543 1111 26
NINN 11 II 51 25 2 24 36 IS 11 III 13 ill 323 181 II 31 21 1492 313 13.15 16.4% 2121 1105 6411 1121
NISI 45 54 63 21 20 32 42 25 15 16 115 45 311 94 II 31 21 5215 1150 1.3$ 11.11 1015 6425 4136 411
NISI 21 3 6 2 13 I) 21 II 3) II 34 13 11 11 15 41 20 1111 II 35.1% 64.0% 415 2061 1214 115
NISD 124 92 12 21 14 21 21 24 131 113 III 45 ill 11 14 SI II II 1610 125 1.4% 11.6% 1101 1613 1141 642
NISO II 11 31 15 4 4 II II 23 21 41 31 121 III 12 11 11 3025 211 35.1% 61.1% 511 3321 1141 1115
NISO 6 I II 1 1 5 13 I 1 14 24 1 41 101 51 11 20 1414 516 51.45 41.1% 154 1150 101 113
NISO 16 51 51 21 5 li 41 26 51 61 Ill 41 215 II 14 44 20 II 6116 121 16.61 13.4% 1401 1613 5123 1143
NISO 54 45 81 13 6 3 31 12 11 41 11 25 231 15 56 31 II 4211 611 1.1$ 12.21 1011 4911 3131 332
NISO 111 61 11 33 II II 41 il III 11 132 14 311 11 14 42 1 20 1342 116 10.81 11.2% 1114 1051 1439 913
NISO 161 114 14 45 16 32 32 41 112 136 III 11 511 11 11 43 23 16 14251 1255 26.2% 13.11 2110 15511 10511 3141
NISO 11 16 13 5 1 23 22 1 16 III 15 6 216 11 11 II II 20 1515 1119 41.11 51.21 1053 11214 4111 4611
NISO 1 11 12 1 12 13 II 1 21 31 21 I II 52 31 20 1151 1010 12.1% 51.1% 113 5461 143 614
NONT 111 131 113 II 1 21 13 11 116 151 116 21 532 II 14 II 5 II 1113 1041 1.1% 12.3% 1163 10110 1922 141
HEIR 61 14 II II 3 11 41 13 63 III 110 24 211 11 11 29 4 13 1015 1152 11.0$ 12.1% III 5121 3340 135
NE11 12 11 12 11 S 1 25 26 II 54 11 45 213 110 11 il 21 II 6311 2181 11.15 82.1% 1215 8125 5215 1101
NE11 124 13 51 11 1 21 31 II 133 122 11 3S 311 11 00 21 19 14013 2141 1.1$ 1.1$ 1531 11112
NEU II 11 *II II I 1 1 1 21 21 25 11 11 181 15 44 6 II 2221 511 12.1% 11.1% 123 2181 1131 211
NEVA 11 III 11 1 12 24 25 1 11 141 11 14 )21 96 II 21 15 1612 731 36.1% 13.11 2392 1412 5531 3111
NEVN 2 !I 5 1 2 1 11 3 4 11 IS 4 42 31 16 602 114 21.1% 11.1$ 214 1411 415 121
NEVJ 43 21 11 1 5 S 4 3 41 11 14 3 11 110 16 21 24 2351 1421 44.4% 55.6% 261 3114 1310 1011
NEW 1 11121131111 9 2 31 II 10 23 1511 1111 36.1% 13.1% 233 2141 1111 516
NEVJ 121 51 21 1 21 21 14 4 111 II 31 5 211 01 13 38 23 3111 2111 41.5% 51.5% 213 5111 2111 1411
NEVJ 11 51 44 2 23 31 41 2 II 11 65 4 264 Ill 11 14 II 5641 III 44.1% 15.1% 111 1118 3151 2111
NEVJ 11 II 15 6 21 31 43 5 111 III 111 II 341 11 15 V 21 24 10110 1631 11.65 51.11 !212 12613 5142 5331
KEW 31 51 21 I 3 :2 8 4 41 63 21 5 131 15 /2 II 21 325D IRO 31.3% 11.11 114 4311 2001 1211
NEVJ 11 II II 6 31 51 51 1 131 151 III 14 453 11 13 53 51 23 11165 2151 34.1% 65.6% 1318 13116 1320 3145
42

FINAL YERSIOM (DATED 12/31/16)
1111-1/ FACIE'? SALARY STUD! [TOTAL DATA1AS1: POI I)
FINAL VERSIDA DAM 121306 1111101 OF FILL-TIME FACULTY NUMBER OF STUDENTS
PERCENTAGE OF BENEFITS
NEN WOKEN TOTAL TOTAL TENURED FACULTY AS % OF TOTAL TOTAL % PART % FILL NO OF TOTAL 1 TOTAL TOTAL
KO INSTITUTION STATE PR AO AI IN 31 AO AI IN PI AO AI IN FACVM PR AO AI IN SALARY I UG 1 6 VG le FTF STUDENTS 1FT,VG 1PT,IG
111 Sider Collegs NEVJ 31 15 31 2 6 11 II 1 45 96 55 3 191 11 93 13 21 3931 161 26.6% 13.6% 656 6110 2000 1031
11-Y211 lotgers St V-Newark
211 Seto Mall folwersity
1 01
NEWLIT
il
11 St
I/ IS
5
3
11
II
66
2$
it
ii
6
10
12;
30
145
11$
tel
111
II
13
311
315
11
101
05
12
1
36 8
20
20
3613
5096
0
1116
13.5%
11.1%
16.5%
11.2%
631
151
3613
1110
3111
6616
615
612
112 Treatos State College NEVI 12 /1 13 I 22 21 11 6 ft 112 136 5 365 11 11 St 22 1261 1611 20.1% 10.3% 132 1652 5111 2156
ill 011ie Paterson College 1013 14 $1 52 3 21 65 65 4 112 III 91 7 331 11 11 62 14 26 1113 1661 32.1% 61.1% 1361 1360 5351 2535
214 fasters New Newly° NEVI 21 31 36 16 S t 22 II 25 il SI 2? 161 16 61 32 20 3063 611 12.1% 11.1% 613 3132 2613 311
21$ NH Nelico Nigklaads WV NEVI 31 21 21 4 0 6 II 3 46 35 32 1 III 05 II 19 11 1656 ill 16.6% 15.6% 311 2011 1613 261
211 Mtv Wino last Ito $ icei NEVI 31 29 13 2 I i 2 1 31 33 IS 2 11 11 16 21 1046 236 25.6% 16.6% 151 1210 110 2:5
211 Nester: New Oeoico law OEM IS 21 1 3 3 2 1 I IS 23 14 i 59 III 16 1 II 1506 1/9 30.1% 61.1% 266 1615 1053 653
111 Alfred Vviyersity NEVI 55 11 25 3 I 5 21 5 Si 63 46 1 153 10 $3 II 21 2356 320 11.6% 11.6% 623 2611 2106 251
ii
College of New Modelle
310 College of Wet RosNETTUS
211 Elmira College
NE
11111
0E:3
t
1
IS
13 1
15 li
13 11
3
i
1
I
5
3
11
16
:
24
9
12
II
i
5
12
13
II
31
31
2$
33
23
23
14 II
$ 15
3 91
III
65
III
II
li
IS
21
22
22
26
20
25
121
2032
1616
Ili
156
362
1.2%
31.3%
66.1%
12.1%
11.1%
53.1%
161
232
331
1116
2116
2016
11$
1236
913
61
III
III
212 loot College NEVI 33 63 il 5 4 1 11 i 33 SI 10 1 151 111 16 21 21 6161 1301 25.3%. 16.1% 151 6051 3561 1212
.213 Loag Island laiversjty-1051 MEVI 220 121 II 15 31 51 55 II 25? 114 136 33 ill 14 52 1 23 6111 3651 22.1% 11.2% 1111 1610 6631 1313
116 Namlattaa College/ NEVI 33 66 $1 1 I 1 II 2 36 12 31 II 115 li 11 21 24 3133 601 12.1% 11.2% III 6533 3631 512
11215 401Altaawille,iollege NEVI it 12 1 I II i 12 2 21 IS 21 3 11 III 9$ II 22 1111 216 16.5% 15.5% 331 1605 1St III
211 Niagara falyislty NEV/ 21 39 21 2 11 21 1? i 19 61 11 6 131 111 12 26 20 201$ 511 11.3% 11.1% lii 3266 2312 313
201 Pace 2siya3sity NETT 154 16 ?; 1 31 43 59 21 112 121 131 21 116 16 52 Si i 20 6112 3045 31.6% 61.5$ 9361 3166 2651
212 'oats:1r last of Technology NEIL 110 115 166 25 II 32 51 li 121 III 115 31 562 13 11 25 5 22 12313 1551 33.2% 66.1% 1506 13126 1251 6116
211 1mill Sage College NEVI 11 21 13 3 14 2; 31 1 21 50 63 10 130 16 11 26 26 1316 1113 6.1% 13.3% 256 2311 1211 II
Mil: losaweatere Voiwersity NEWr 35 51 3: 12 0 5 II 3 35 Si 61 15 153 101 16 31 1 23 2393 361 2.1% 11.2% 631 2156 2325 61
22tlarai lavreace College MEP 23 152 Ili 10.1% 11.1% 230 1066 151 16
/121 Sway College At Brockport NEVI 11 111 il 2 10 22 36 12 SI 122 11 26 321 16 94 St 1 21 5111 1612 20.2% ILI% 115 1622 6631 1112
/i?3 Svoy College At loffilo NEST 153 131 60 1 22 43 62 1 115 Ili 113 11 ill 1: li 21 21 10056 1661 Mit 10.6% 1615 11521 1101 1953
221 Sway Collega At Cortland NEVI 11 19 35 4 II 26 II 9 $1 16 52 13 250 100 II 21 21 5552 131 5.9% 16.1% 1623 6611 5225 321
12S Sway College At Fredooia NEVI 02 61 36 5 2 II 13 5 IS II 41 18 222 11 11 6 21 6611 361 10.3% 11.1% 903 6131 1030 661
221 Soly College At ieaeseo 0.131 51 66 55 2 1 S 21 5 ft 51 14 7 226 110 96 li IS 21 6165 652 6.2% 15.1% 1251 5211 ISIS 211
221 Softy College At New taltz NEVI li 12 63 I 1 24 21 I 103 106 71 2 212 11 11 21 21 6035 1315 25.6% 16.6% 1165 1351 6511 1535
li211 Stay Co le At Oaeolta
221 hay C ge At Oswego
:111
NEVI
12
III
11 31
III 31
1
1
II
12
If
34
2S
2:
1
3
103
120
IT
161
61
61
I
10
212
332
11
li
12
11
36
35
21
21
5391
1021
361
III
5.6%
12.1%
Wit11.1%
1111
1450
5151
1111
5116
6111
311
152
231 Sway College At Plattsburg4 NEVI 13 11 53 2 1 28 2: 6 11 II II 1 256 11 92 33 21 5612 533 10.1% 11.1% 165 6225 5111 515
111 Sway College At Fotsclso NEVI 11 63 43 5 1 21 22 i It 13 65 O 235 11 10 31 22 21 3166 601 1.3% 12.1% 131 6245 3565 211
232 Sus? C of Ted Utica-Use NEVI i 21 II 3 1 5 13 1 4 36 32 3 13 16 1 2$ 2331 12 61.1% 52.1% 2601 1231 1101
211 SIM C ;Ansel] Scl-Fors NEU 61 23 II I 1 C 2 1 62 23 II I 105 101 II II 26 10$ 131 1.1% 111.1% 1231 III
234 Woo College NEVI SI SI 216118 6111 10 351 163 11 51 26 2116 161 16.3% 15.1% 511 3213 2111 344
21S Anoslachlas state Lair NORC 196 11 5/ 5 36 31 22 1 232 121 II 2S 651 11 li 20 II 9011 1S2 1.1% 11.1% 2116 1161 1112 Ili
216 last Corollas Vaistrsity NOR 111 121 ft S 33 Si li 1 218 112 161 12 511 11 li il 19 11133 2116 9.6% 10.6% 2611 13161 10111 1133
j 231 Nora Corollas Central Unit 1102C 31 5? 55 5 II 21 43 1 it 11 11 12 231 16 51 36 50 II 6050 1655 11.1% 11.9% 131 5505 3103 650
44

FINAL VERSION (DATED 12111/16)
1111-1/ FACULTY SALARY STUDY
FINAL VERSION DATED I2/11/16
[TOTAL DATABASE: PART 1]
NUMBER OF FULL-TINE FACULTY NUMBER OF STUDENTS
PERCENTAGE OF BENEFITS
MEN MEN TOTAL TOTAL TENURED FACULTY AS % OF TOTAL TOTAL % PART % FULL NO OF TOTAL 1 TOTAL TOTAL
NO INSTITUTION STATE PI AO AI IN PI AO Al IN PR AO AI IN FACULTY PI AO Al IN SALARf 1 UG 1 6 VG UG FIE STUDENTS IFT,VG IPT,UG
231 Univ of N C Charlotte MOH 12 133 16 )1 I/1 126 0 312 11 11 1355 1411 24.15 /5.11 litl 1110 1101 2254
231 Vake Forest University MOIC 6S 21 1 S I/ 116 12 )1 22 241 S 20 3330 ISIS 3.6% 16.41 III MI 3211 111
241 Vestern Carolina Univ NOIC 12 S 22 31 6/ /I 21 211 14 1/ 42 19 IIIS 1120 9.2% 11.1$ 100 SUS 402 40211 North Dakota State Unit MOAK 111 Ili 11/ I/ S 11 2S IS liS 114 142 )1 152 16 11 II 10 22 1521 Iik 11.0$ 89.0% 1111 1465 1513 111
212 Antioch University ONIO 33 IS S 0 IS 1 1 /1 53 I) 21 ill 0 1.1% 95.11 11 111 466 23
211 Ashland College ONIO 31 21 21 I) 3 33 31 42 22 121 111 // II 21 2115 1241 32.3% 61.1% 415 101 1411 115
20 Cleveland State University 04410 121 115 61 IS 31 11 II 131 231 32 411 12 2 22 12123 4611 31.1% 61.91 16/1 1/542 1002 02120 John Carroll University ONO 59 11 21 1 3 11 21 21 121 91 IS 41 11 26 2102 551 14.01 16.0% /55 3460 2111 ill
241 University of Dayton OHO 112 121 IS 6 II 21 101 lik 111 IS 311 II 30 20 /la 3164 II.S% 11.5$ 1102 10211 6311 111
211 Vright State Way-Maio 0010 111 131 II 12 31 13 21 121 10 123 32 4)6 31 20 23 12111 340 22.61 61.11 2111 16111 1516 1111
211 levier University ONTO SI 33 1 11 12 SI 52 13 Ili IS 21 3111 2111 25.11 11.11 111 61!: 2511 1111
211 Youngstown State University 0010 151 IS 12 21 23 21 31 10 123 lig 14 SI 21 13111 1131 31.3$ 11.11 2211 15121 1535 09251 Central State University OKLA 12 12 32 23 31 31 2S LOS 13 SI 145 110 SI SO II 1151 3551 31.11 11.36 1310 13211 5125 1111
251 Phillips University OKLA 21 II 10 1 2 21 21 11 2 61 IS 6/ IS III 20 12.11 11.11 112 1061 553 2I5
252 University of Tulsa OKLA /4 SI 22 13 I/ 11 13 26/ 12 1 22 160 115 21.1% '1.2$ SI) 1551 210 10251 Lewis and Clark College OIEG SI 15 0 S IS 11 1 56 SI 21 1 135 11 20 1121 1351 2.61 .1.11 122 2111 1513 41
29 Southern Oregon State Coll OIEG I/ 21 2 14 11 10 /I 12 31 12 113 16 61 S 26 014 III 22.1$ 71.11 6/1 4210 2155 131
255 University of Portland ORR IS 31 3S 2 12 15 11 SI 1 115 12 11 23 2211 511 15.1% 11.11 III 2161 1111 331
251 Bloomsburg Diversity PENN 11 1/ 12 12 11 12 20 110 11k 32 331 91 52 2S 5112 53/ 13.0$ 11.11 1113 4431 5133 161
251 Iircinell University PENN 11 12 SI 1 1 lk 22 12 56 13 211 IS 11 26 3215 151 1.3$ 11.11 111 34111 013 42
251 California Diversity PENN Ili 13 35 II IS 12 112 II 213 16 12 5/ 23 4111 506 15.2$ 11.11 1311 011 1110 III
251 Chewy Univ of Penn PENN 11 6 IS 2S 11 3 Si 61 11 111 IS IS 11 23 1511 II 1.01 1.0$ 560 1511
211 Clarion Univ of Penn Main PENN 13 12 11 12 33 II 13 IS 12 23 212 12 22 26 6111 611 1.11 11.6$ 1110 1601 5115 513
211 hese) University PENN 112 Ik 11 13 1 11 31 111 112 III 21 )62 II 16 20 24 1616 2113 21.11 15.61 1112 12211 1212 230
212 Ilimesse University PENN /I 61 31 21 16 12 10 SS IS 231 /1 1 23 061 ISIS 1.1% 11.1$ III 51I2 3141 04213 East Stroudsburg Univ Penn PENN 12 53 2S 15 21 21 2 II 13 15 S 221 11 SI 24 3111 311 12.1$ 11.21 121 4331 1151 511
211 Edinboro University of Penn PENN 121 /6 SI 12 21 2 133 IS IS 2 301 101 IS 2S S312 S)/ 13.1$ 16.21 1161 SRI 4511 133
215 Gagnon University PENN 2S 32 31 6 2 S 1 21 16 III Ii 16 31 21 36/2 411 21.1% 11.1$ 111 00 2131 111
211 Indiana University of Penn PENN 211 133 II 2/ 11 IS 2S 231 161 155 116 SI 1 21 11111 1121 1.1$ 11.1$ 1513 12211 11111 1112
211 Katztovn University PENN IS 31 1 II 21 4 111 112 11 215 SI S6 36 23 5124 521 12.1$ 0.21 ISIS 0252 1111 131
211 Mansfield University PENN 46 21 1 11 3 SO SS 1 151 110 13 It IS 24 2615 210 14.111 16.1$ 113 2115 2311 315
211 Marmot; College PENN 14 2S 21 1 11 31 21 kl SI 11 131 /1 21 11 2061 151 26.5t 11.11 311 3125 1521 SkI
211 Millersville Univ of Penn PENN 11 1G SI 1 21 33 13 15 11/ I/ 301 111 12 Si 29 24 6151 01 21.St 11.5t 1105 1121 1121 1126
211 Shippeasburg University PENN IBS 1$ 11 2 S 12 21 S 121 11 SI 2/4 11 10 2S 510 1011 1.21 12.11 1251 6225 100 311
212 Slippery Rock University PENN 115 Ik 53 IS II II 11 132 13 11 21 33, 101 11 SI 11 24 5131 IIS 11.11 11.11 1333 3116 5232 511
211 University of Scranton PENN SI 61 S 1 11 SI IS SI IS III 11 /1 24 33 21 411S 10 ISM Wit III 1611 All 611
214 Villanova University PENN III 11/ 10 21 SI li 116 141 202 32 01 IS 12 ki 23 1250 2330 22.5t MIS 1111 11511 1411 1151
215 Vest Chester University PENN 111 11 1 23 31 SI 10 III IS kkk 11 91 61 23 8611 1335 20.11 11.2t 1511 1153 1125 1/11
216 Videner University PENN 21 S2 31 S 11 11 62 II 111 61 21 2141 1222 1.11 12.1t 02 3563 2114 161
46)

FINAL VERSiON DATED 12/31/16)
11/.11/ FACULTY SALARY STUDY (TOTAL DATABASE: PART I)
FINAL VERSION DATED 12/31/16
NO INSTITUTION
211 Wilkes College
211 Providence College
219 Rhode Island College
210 Salve Regina-Nerport College
711 The Citadel
212 College of Charleston
213 Winthrop College
211 South Dakota State Voir
215 Austin hay State Univ
211 East Tennessee State Univ
211 Middle Tenn State Unit
2CO Tennessee State University
211 Tennessee Technological V
210 Iniv Tennessee-Chattanooga
211 Abilene Christian University
212 Anoka Technological Div
213 Angelo State University
214 Corpus Christi State Univ
215 East Texas State University
III Nidaestern State Diversity
211 Our Lady of the Lake Div
211 Pan Aserican University
211 Prairie Vice AIN Diversity
ill 5t. Nary's Iliversitylan Ant
III Sae Houston State University
112 Soetbeest Texas State Univ
303 Stephen F. Austin State Only
114 Sul Ross State University
315 Tarleton State University
III Texas All University
311 Trinity Diversity
311 University of Dallas
311 Univ of Houston-Clear Lake
311 University of St. Thous
311 Div Texas At Arlington
312 Pay Texas At El Paso
113 Univ Texas Of Persian Basin
311 Univ Texas At San Antonio
315 Div Texas At Tyler
47
NUOIER ar 'ILL-TINE FACULTY NUMBER OF STUDENTS
PERCENTAGE OF CENEFIIS
NEN WOMEN TOTAL TOTAL TENURED FACULTY AS % OF TOTAL TOTAL % PART % FULL
STATE PR AO Al IN PR AO Al IN PR AO Al IN FACULTY PR AO Al IN SALARY I UG 16 UG VG
PENN 32 33 11 2 3 3 32 2 35 3% 66 1 111 101 II 21 11 2138 553 21.0% 11.2%
INN 21 11 31 II 3 II II 1 II 59 SI II ISO 101 12 51 53 14 5022 511 26.1% 13.2%
SHOD II 11 51 5 26 11 11 16 115 96 II 21 131 100 IS 30 25 5111 1391 26.9% 13.1%
RHO IS 1 11 5 I 11 22 I 23 20 II 11 13 II 4S 19 16 1152 392 16.2% 13.1%
SCAR 11 51 31 3111 111 Si III lel 32 le 11 11 2215 101 12.5% I/.5%
SCAR II /I 44 2 5 12 11 3 31 II II S 21! IS II 19 It MU 109 25.2! 1:.::
SCAR 11 31 11 12 12 16 21 25 el Si 61 31 221 13 11 31 18 4015 169 10.1% ILI%
SOAR III Si Si 21 II 23 IS 11 122 11 99 31 332 95 61 Il 3 IS 6165 651 1.3% 10.1%
TENN 65 31 35 1 I II 21 10 13 14 63 11 111 16 11 II 29 5012 311 15.1I 61.2%
TENN II III 56 31 11 II 52 11 113 111 101 II 123 12 12 12 21 21 1211 1311 10.3% 11.11
TENN 151 II 11 21 IS II SI 31 16S II 121 15 131 16 II 3S 6 30 9I10 1250 IS.I% 11.1%
TENN 11 12 II II IS 31 56 21 II II 16 IS 301 $11 12 SI 22 32 6011 121 33.1% 1/.1%
TENN 111 11 63 IS 1 II 21 21 120 II II 3S 331 II 16 11 I 29 0135 IkS 11.1% 11.3%
TENN 62 61 11 S S II 36 6 I/ 12 13 II 241 11 II 16 2S 6172 1311 23.3% 16.1%
TEIA 69 31 21 I 6 S 12 11 15 31 10 22 116 II 11 10 5 19 3156 519 11.2% 11.1%
TEIA 11111101511 II 23 256 213 61.1% 32.0%
TEXA 11 33 16 II I S 11 2S Si II 33 11 III III 14 21 22 Silt 311 25.6% /1.4%
TEXA 32 31 S I 1 12 II I 36 12 15 I 112 92 II 21 22 1132 1113 61.1% 31.15
TEXA 181 S3 11 12 13 21 II 1$ 122 /I SI 21 213 11 11 12 11 21 1052 2115 23.1% /6.1%
TEIA 3S 31 21 6 I 1 16 13 36 45 11 II 111 I/ II II 21 1112 611 MI% 11.0%
TEIA I I 11 2 1 II I II 11 II 23 13 61 11 42 11 15 1111 SIR WS% SS.S%
TEXA SI II 51 23 0 I 41 11 66 II 91 31 212 II 18 S2 Si 22 1126 1131 0.0% 0.1%
TEIA 26 41 S3 21 2 II 22 It 21 61 15 11 211 II SS 21 21 1116 160 6.0% 11.0%
TEIA 16 31 21 1 1 3 /5 2 12 12 36 I 126 16 21 14 2011 1111 10.1% IS.1%
TEIA III 11 11 1 II 22 16 1 121 112 12 I 311 11 95 4S 2S 21 1619 1661 HA 13.1%
TEIA 112 15 43 31 16 32 11 21 111 121 130 SI 133 101 II 13 1 23 11261 1112 21.1% 11.9%
TEIA 113 11 61 21 10 II 22 26 113 li 31 16 112 II 10 Si II 22 11001 1520 1.1% 10.1%
TEXA 22 21 21 5 I 3 1 4 23 21 21 I II 13 SI 25 1 2S ISII 311 11.2% 11.0%
TEXA 23 24 12 lb 3 5 12 II 21 21 51 21 131 113 03 il 1 23 1116 110 II.5% 11.51
TEIA 10 ii 22 1 i II 13 1 12 61 35 15 192 13 II 16 II 23 3121 1111 11.1% 12.1%
TEXA II SI 31 3 I 12 20 S 06 IS Si I 216 11 91 II 2S 22 2136 425 5.1% WI%TEXA II 31 22 i I 6 2 2 II 11 21 6 11 101 11 II 11 1011 IkIS 12.1% ILI%
TEXA 12 62 3S 1 1 21 II I 11 II 53 IS 205 16 IS i 21 3064 3391 62.0% 31.0%
TEXA 22 21 I I IS I 12 I 32 31 21 2 10 118 61 11 IS ISIO SkO 31.1% 61.2%
TEIA ISI 212 III 0 I 31 31 3 161 211 111 3 SSI III IS 21 21 11111 3313 31.2% 60.1%
TEIA II 113 III 0 1 II 58 I IS 121 IRS 0 III 11 13 33 22 IIISO 2160 33.5% 66.S%
TEXA 22 22 S 1 3 3 3 1 2S 2S I S 63 11 II II 22 1126 161 52.2% ILI%
iflA SI 61 II I I II 20 I Si /I 101 I 231 110 II 23 11090 1011 21.1% 12.1%
TEIA 20 30 12 6 1 S 16 IS 21 3S 21 21 III 16 II 1 22 2111 1212 11.6% SI.1%
. * #
NO Of TOTAL I TOTAL TOTAL
FIT STUDENTS IFT,I6 IPT,VG
65S 2111 1131 101
1033 SS33 36/4 1141
1061 6$15 3161 1316
161 1114 1211 235
656 2911 2000 21S
iii 5303 3131 1251
109 1131 1629 416
1251 6116 5512 513
311 5313 3211 I/9S
1114 9511 6/22 ISII
2110 11020 1221 1551
131 /116 10/4 2113
2161 /610 613/ 711
1009 /553 I/31 liel
1001 ISOS 3SSk 102
ill 12 I/1
1263 SIll 4110 1401
3/IS 111 1162
1110 616/ 3111 161
1051 1612 2111 1511
116 1615 653 S21
1310 10056
13/1 1626 3611 232
404 1210 I/S1 301
leS1 1130 6342 2311
2111 21110 1521/ 1161
21/S 12520 10000 1010
213 1112 1221 211
111 4626 3116 ISI
611 5114 3223 Ilk
S12 2111 2201 132
261 2553 111 131
6451 1165 1111
113 2151 1130 ill
2011 23111 12111 IISS
1621 11110 /911 1111
IIIS S31 511
1212 12131 1015 3005
316S 1116 10S/
43

EMI VERSION (DATED 12/31/86)
1111-11 FACULTY SALARY STUDY ITOTAL DATABASE: PART II
FINAL VERSION OATH 12/11/16
NO INSTITUTION
111 Vest Texas State University
III Saint Michael's College
111 George Mason University
111 Janes Madison University
321 Lyacbberg College
321 Norfolk State University
322 Old Dosision University
321 Radford University
326 University of Richeond
326 Virginia State Iniversity
,326 Central Washington Usiv
121 Eastern Washington Unit
)21 Gonraga University
121 Pacific tellers. University
:11 Seattle University
III University of Paget Sound
312 Western Washington Voir
31) Marshall Isixersity
3)6 lair Wisconsin-Eas Claire
115 Voir Wisconsin -Green lay
331 Vol, Wisconsin-La Crosse
3)1 hit Visconsin-Oshkosh
31$ Isiv Visconsin-Parkside
3)1 lair Wisconsin-Platteville
141 Isiv Viscossis-liver falls
141 lair Wisconsin Stevens Point
342 Only Wisconsin-Stout
163 Ilsiy Wisconsin-Superior
146 1siv Visconsinghitevater
NI1111111 VALUES
NAIINUN VALVES
AVERAGE VALUE
STO DEVIATION
COUNT (NON-BLANKS)
43
MEN
11111110 OF FULL-TINE FACULTY
WOMEN TOTAL
PERCENTAGE Of
TOTAL TENURED FACULTY
BENEFITS
AS 1 Of TOTAL TOTAL 1 PART
NUMBER OF STUDENTS
1 FULL MO OF TOTAL f TOTAL TOTAL
STATE PR AO AI IN PI AO AI IN PR AG AI IN FACULTY PR AO AI IN SALARY 1 16 1 i 06 UG FIE STUDENTS PTA IPT,IG
TEIA 51 41 )1 IS 1 5 25 21 60 66 62 44 212 12 II SS 9 22 4166 12)0 0.0% 0.0% 1St 61$5
VEIN 21 21 2) I 3 1 12 1 )1 )5 )5 I !SI III 101 )1 21 11)5 )1$ 6.1% 15.11 665 2051 1150 IS
VI16 16 1)2 Si 1 li St 11 4 111 111 114 12 616 1$ 12 S 23 11316 4210 )2.1% 11.11 2271 15606 1111 3111
VI16 114 121 1) 11 2S )2 )1 21 121 152 II) 45 6)9 11 $5 )1 25 1416 101 1.66 16.66 1161 1111 120) 21)
VI16 )1 1) 16 1 4 IS 11 1 16 it 21 6 115 14 11 2) 19 165$ 516 16.65 15.6% 401 2114 1421 21$
1116 1) 61 41 It IS 23 5) 21 11 tS 11 45 )22 $5 SS 1) 2 26 6662 52) 16.4% 15.6% 1)21 1105 5103 151
VIII 131 III II 25 II 46 41 )1 141 211 1)2 6I 561 91 $1 1 2) 11611 )610 MI% 16,1% 1121 15140 1100 2100
VI16 16 $1 61 II 22 )2 )4 IS 16 1) IS 26 )10 9) 11 )2 4 25 602) $10 4.1% :S.1% 1611 690) 5161 256
VIII 61 it )1 2 1 $ 24 S 15 Si 11 1 III 10$ It 11 14 22 1111 111 26.0% 16.2% 101 4101 2162 936
VI16 6) 1) SI IS IS 11 41 II SI 6) 11 21 21$ 1) 41 21 25 16$1 S21 12.3% 11.1$ 161 4100 3140 440
WASH 122 26 )1 1 I) 12 11 1 115 II Si 6 215 11 $6 1) 22 6211 614 12.1% 11.1% $15 619) 5516 11)
WASH 112 1) )5 6 II li 11 I 111 11 SI 1 325 It 11 IS 24 6S$$ 1251 4.1% ILI% 111 1031 1212 )26
WASH )6 6) 22 I 1 1 11 1 )1 S2 41 I 1)0 $1 it IS 25 2221 S16 $.21 11.1% 411 2142 2166 102
WASH 5) S) 21 2 S 20 )1 3 St $1 61 S 21) 11 16 22 25 )012 309 OM 10.1% 115 )411 2116 )16
WASH )2 52 2? 1 12 21 2) 2 44 1) 51 9 116 II 11 12 19 2616 1141 11.3% $2.1% )13 )141 222$ 466
WASH SI 32 21 1 1 11 12 II 11. it 41 21 115 11 11 21 2125 Ill 12.2% 11.1% Ill 1912 2461 )66
WASH 1)5 165 )4 9 14 21 11 1 161 III 5) 1 )1) 1$ IS 11 24 1115 $21 5.2% 1641 2)10 1116 1161 4)5WVIR 11 11 SI 12 16 11 41 11 11$ 111 115 )1 )11 11 1! )1 6 11 111$ 1148 11.1% 61.1% 2660 11161 1)61 2052
WISC 121 102 65 9 i 2) 41 S 1)6 125 106 14 111 11 12 SO 14 21 1060$ 514 19.2% 01.11 2)91 101)2 1144 1164
WISC )1 66 IS I 6 1 11 2 )1 IS 25 1 140 103 100 $ 21 MO 5)2 11.11 61.0% ill 5012 )129 1404
WISC 19 $6 6) 1 It 1 IS 16 III 95 It 24 )14 91 14 44 61 26 8169 541 LA 10.11 11)1 1)11 195) Ill
WISC 121 1$ 12 11 1$ 26 12 I) 141 114 114 2) )11 11 $1 Si 1! ti ID) 1656 21.1% 19.11 110 11511 1119 2116
WISC )6 11 22 0 I I) I) 1 )1 14 3$ 0 146 15 16 26 6044 )1) 41.3% 61.1% 011 5151 2111 2021
WISC 11 5) Si 0 4 1 14 I II Si 11 I 21$ 11 11 SI 21 5636 231 1.01 100.0$ 1111 ::!) $C16
VISC $5 46 Si 6 II 12 14 2 11 St 61 1 221 II 11 21 21 5111 Si: 1.6% 12.3% 1001 5101 4112 ill
WISC 121 116 41 II 11 IS 16 1 1)1 1)1 62 It 16$ 91 0, )1 1) 21 1151 141 12,0% 01.1% 101 9611 1102 1154
VISC 16 SS 46 It 11 IS 20 1 112 10 61 25 26) 101 1) 61 68 11 1205 S2S 6.1% 13.1% 1416 MO 6150 *SSVISC 11 22 li ) 6 $ 1 1 66 2$ 21 4 Si 111 $1 20 25 1146 413 15.1% 14.11 312 2119 1422 214
WISC 1)1 SS 11 I) 21 14 26 S 101 61 94 It )44 19 11 41 22 31 910$ 1)11 1.6% 16.51 2253 11021 111) 226
111161111121 212110 II 1$6 I 1% II 0 412 44 10
611 221 144 21 115 Ill 121 11 610 331 22$ III 1111 111 111 14 10 )4 21151 ;166 $11 100% 1615 )4014 2013$ 1171ti 62 44 1 I) 11 21 II 6/ 12 11 11 261 94 11 21 16 22 5144 ;2$S 21% lit 161) 6111 ;142 1441$1 41 2$ 11 II 14 11 II It SI 41 21 I15 II It 11 11 A 6661 IU.t. 11% 21% 116 5262 1412 1161
)41 )61 )61 1t9 )61 111 341 )11 )41 )41 )41 )41 )61 114 315 HS 122 16) 344 )44 )66 )44 )12 )44 315 )12
50
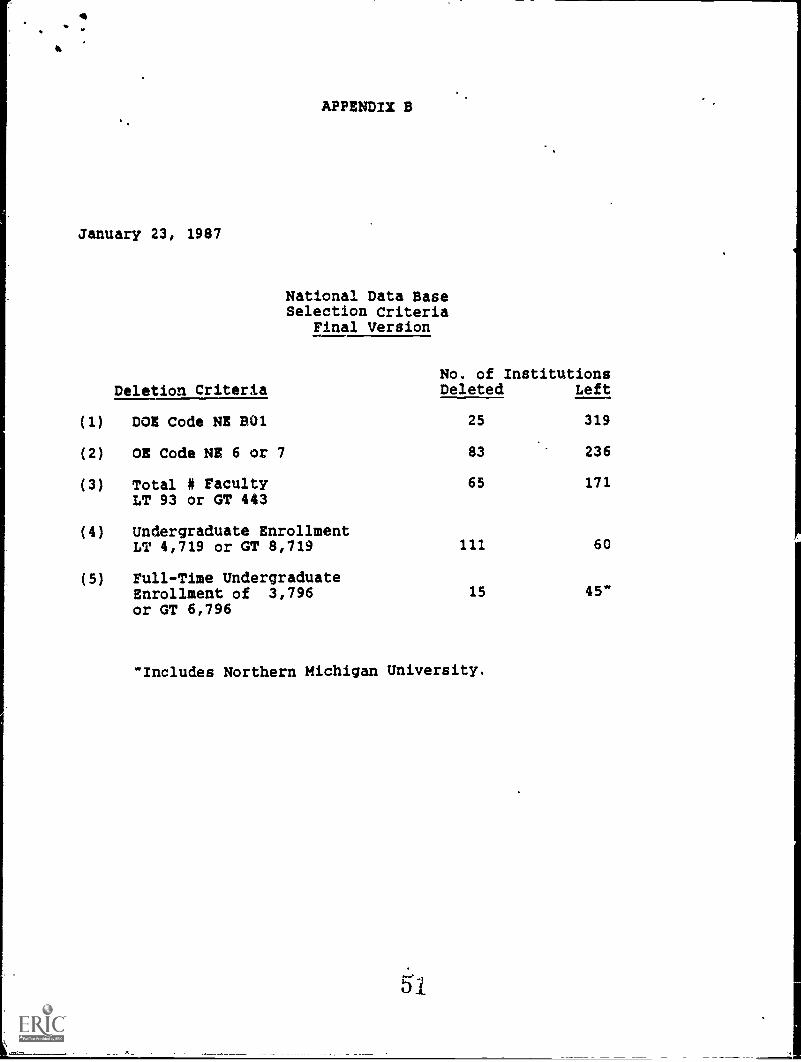
January 23, 1987
APPENDIX B
National Data BaseSelection Criteria
Final Version
No. of InstitutionsDeletion Criteria Deleted Left
(1) DOE Code NE 801 25 319
(2) OE Code NE 6 or 7 83 236
(3) Total # Faculty 65 171LT 93 or GT 443
(4) Undergraduate EnrollmentLT 4,719 or GT 8,719 111 60
(5) Full-Time UndergraduateEnrollment of 3,796or GT 6,796
15 45-
-Includes Northern Michigan University.

APPENDIX C1986 NORTHERN MICHIGAN UNIVERSITY
FACULTY SALARY STUDYSURVEY POPULATION
INSTITUTION STATE ENROLLMENT INSTITUTION STATE ENROLLMENT
Jackson State .University ALAB 7,020 University of Central Arkansas ARKA 6,452
Georgia Southern College GEOR 6,935 Arkansas State University Main ARKA 8,446
Murray State University KENT 7,197 Southern Conn State University .CONN 10,962
Nicholls State University LOUI 7,524 Northeastern Illinois Univ ILLI 10,081
University of Southern Maine MAIN 8,839 Mc Neese State University LOU I 7,753
Southeastern Mass Univ MASS 5,816 Southeastern Louisiana Univ LOUI 9,000
Grand Valley State College MICH 9,087 Bridgewater State College MASS 6,841
Univ Minnesota-Duluth MINN 7,805 Northern Michigan University MICH 7,489
Kearney State College NEBR 8,725 Moorhead State University MINN 8,016
Willian Paterson College NEWJ 9,360 Northeast Missouri St. Univ MISO 7,693
Suny College At Cortland NEWY 6,491 Trenton State College NEWJ 8,652
Suny College At New Peitz NEWY 7,350 Suny College At Brockport NEWY 7,422
Suny College At Oswego NEWY 7,810 Suny College At Goneseo NEWY 5,217
Suny College At Plattsburgh NEWY 6,225 Suny College At Oneonta NEWY 5,751
Bloomsburg University PENN 6,439 Western Carolina University NORC 5,935
Kutztown University PENN 6,252 Clarion Univ. of Penn-Main PENN 6,608
Shippensburg University PENN 6,225 Edinboro University PENN 5,849
Univ Tennessee-Chattanooga TENN 7,553 Millersville Univ of Penn PENN 6,628
Norfolk State University VIRG 7,185 Slippery Rock University PENN 6,496
Central Washington Univ WASH 6,993 Angelo State University TEXA 5,881
Eastern Washington Univ WASH 7,838 Radford University VIRG 6,903
Univ. Wisconsin-River Falls WISC 5,703 Univ Wisconsin-Platteville WISC 5,873Univ Wisconsin-Stout WISC 7,730
52 53
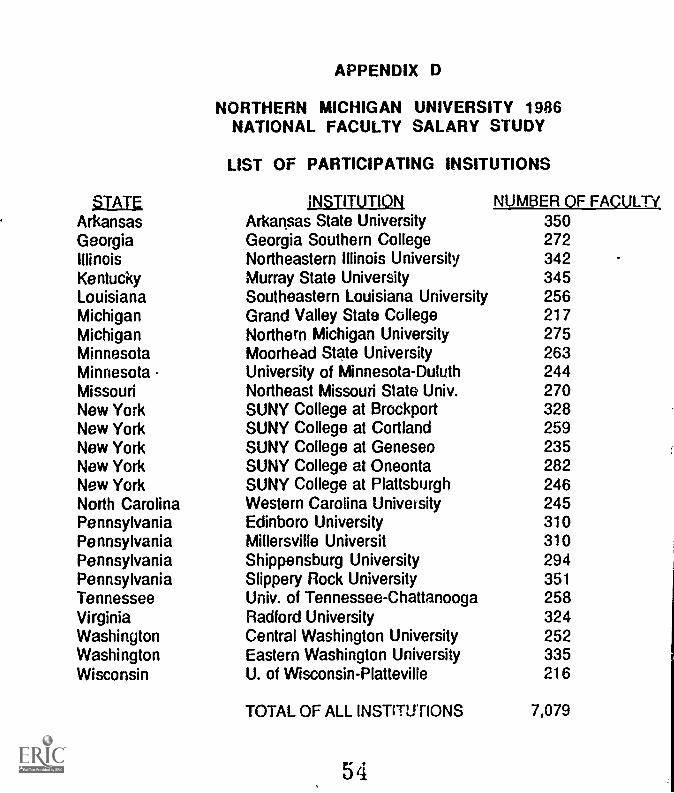
APPENDIX D
NORTHERN MICHIGAN UNIVERSITY 1986NATIONAL FACULTY SALARY STUDY
LIST OF PARTICIPATING INSITUTIONS
STATE INSTITUTION NUMBER OF FACULTYArkansas Arkansas State University 350Georgia Georgia Southern College 272Illinois Northeastern Illinois University 342Kentucky Murray State University 345Louisiana Southeastern Louisiana University 256Michigan Grand Valley State College 217Michigan Northern Michigan University 275Minnesota Moorhead State University 263Minnesota University of Minnesota-Duluth 244Missouri Northeast Missouri State Univ. 270New York SUNY College at Brockport 328New York SUNY College at Cortland 259New York SUNY College at Geneseo 235New York SUNY College at Oneonta 282New York SUNY College at Plattsburgh 246North Carolina Western Carolina University 245Pennsylvania Edinboro University 310Pennsylvania Millersville Universit 310Pennsylvania Shippensburg University 294Pennsylvania Slippery Rock University 351Tennessee Univ. of Tennessee-Chattanooga 258Virginia Radford University 324Washington Central Washington University 252Washington Eastern Washington University 335Wisconsin U. of Wisconsin-Platteville 216
TOTAL OF ALL INSTITUTIONS 7,079
54