desert biome final published nigam thomas 16october2019
TRANSCRIPT

The Sahara Desert Hydroclimate and Expanse: Natural Variability and ClimateChangeSumant Nigam and Natalie P Thomas, Department of Atmospheric and Oceanic Science, University of Maryland, College Park, MD,United States
© 2019 Elsevier Inc. All rights reserved.
Introduction 1Datasets and Analysis Method 2Observational Datasets 2Desert Expansion 2Statistical Significance 3Seasonal Climatology 3Centennial Trends in Surface Air Temperature and Precipitation 3Change in Sahara Desert Expanse Over 20th Century 5Sahara’s Advance 7Sahara’s Expanse 9Sahara’s Expanse: Variation and Potential Mechanisms 9Concluding Remarks 10References 12
Encyclop
Abstract
The Sahara Desert is the largest warm desert on the planet, with an area comparable to that of contiguous United States. It is akey element of the African climate system. 20th-Century trends in seasonal temperature and precipitation over the Africancontinent are analyzed from observational data to characterize the seasonal footprints of hydroclimate change. Given theprominence of agricultural economies on the continent, a seasonal perspective was considered more pertinent than theannual-average typically used in desert characterization as the latter can mask off-setting but agriculturally-sensitive seasonalhydroclimate trends. Seasonal surface air temperature (SAT) trends show that heat stress has increased in several regions,including Sudan and Northern Africa where largest SAT trends occur in the warm season—in stark contrast with the seasonalstructure of climate change over northern continents where the warming is most pronounced in winter. Precipitation trendsare varied but notable declining trends are found in the countries along the Gulf of Guinea, especially in the source region ofNiger river in West Africa, and in the Congo river basin. Rainfall over the African Great Lakes—one of the largest freshwaterrepositories—has, however, increased. The Sahara Desert is shown to have expanded over the 20th century, notablysouthward in summer, reflecting the retreat of the northern edge of the Sahel rainfall belt. Specific mechanisms for desertexpansion are investigated.
Introduction
Climate change has footprints across the planet; however, certain regions are disproportionately affected. Africa is less responsiblefor the occurrence than any other continent (Fields, 2005) but more vulnerable to the effects of climate change due to its highpopulation, low adaptive capacity, and multiple converging stressors (Fields, 2005 Busby et al., 2014 Niang et al., 2014). Africa isfurthermore an interesting case study for climate change due to its unique climatological features. It is the only continent that hasalmost equal parts in the Southern and Northern Hemispheres and thus home to a wide variety of climate zones. It consists of theSahara Desert and Sahel in northern Africa, the Namib/Kalahari Desert in southern Africa, tropical rainforest in Equatorial Africa,and grasslands and savanna in-between. The Sahara Desert is the largest warm desert on the planet, with an area comparable to thatof contiguous United States. It is bounded to the south by the Sahel—the semiarid transition zone between approximately10� and20�N that receives most of its rainfall in summer. Not surprisingly, the Sahara Desert appears more expansive in winter thansummer in satellite imagery. The prevalence of land-surface effects, internal climate variability, and hydroclimate sensitivity toglobal sea surface temperatures make the continent climatically complex (Hulme et al., 2001).
Global climate change often leads to the wet regions getting wetter and the dry ones drier (Chou et al., 2013), suggesting adverseimpacts on deserts. The impact on the Sahara Desert is of great importance for the proximal countries in Northern Africa as well asfor remote regions through the influence of Saharan dust on sea surface temperatures (SSTs) and Atlantic hurricane activity (Evanet al., 2016). Precipitation trends have been well-studied over the Sahel region which bounds the Sahara to the south. The dryingtrends over Sahel have been attributed to land-surface processes, including amplification of meteorological drought from biophys-ical (Charney, 1975) and surface hydrologic feedbacks (Nicholson, 2000), and to the increasing concentration of greenhouse gasesand aerosol loading (e.g., Held et al., 2006). Regional and global patterns of SST anomalies have also been implicated (Follandet al., 1986 Giannini et al., 2003) as have sulfate aerosols in the Northern Hemisphere through their effect on Atlantic SSTs (Biasutti
edia of the World's Biomes https://doi.org/10.1016/B978-0-12-409548-9.12034-2 1

2 The Sahara Desert Hydroclimate and Expanse: Natural Variability and Climate Change
and Giannini, 2006). The 1980s Sahel drought—the most intense episode of the 20th century—has been attributed to thecirculation-change associated with Indian Ocean warming (Hagos and Cook, 2008), and the drought recovery linked to higherlevels of greenhouse gases in the atmosphere (Dong and Sutton, 2015). Sahel rainfall has also been linked to variability in SSTs inthe North Atlantic, the Atlantic Multidecadal Oscillation (AMO) (Mohino et al., 2011 Knight et al., 2006). This oscillation has aperiod of 50–80 years, with the cold AMO phase coincident with extended droughts over Sahel (Kavvada et al., 2013). Causes ofsurface temperature variability in this region are less well-established (Collins, 2011), although an amplified warming signal hasbeen detected over the Sahara Desert in recent decades (Cook and Vizy, 2015 Vizy and Cook, 2017). The importance of agriculturein the African economies warrants a seasonally resolved analysis of hydroclimate variability and change over the continent. Thisarticle updates the findings of Thomas and Nigam (2018) from analysis of more extended observational records, especiallyprecipitation’s. It documents the regional structure of the century-long seasonal temperature and precipitation trends over theAfrican continent, focusing on how these trends affect the Sahara Desert boundary and expanse. The data sets and analysis methodsare described in “Datasets and Analysis Method” section. The seasonal climatology of near-surface air temperature (SAT) andprecipitation over the African continent are outlined in “Seasonal Climatology” section to provide context for characterization of thecentury-long seasonal hydroclimate trends in “Centennial Trends in Surface Air Temperature and Precipitation” section. Expansionof the Sahara Desert over the 20th century is discussed in “Change in Sahara Desert Expanse over 20th Century” section, and thesummer expansion mechanisms investigated in “Sahara’s Expanse: Variation and Potential Mechanisms” section. Concludingremarks, including sensitivity of the desert expansion rate to the analysis period follow in “Concluding Remarks” section.
Datasets and Analysis Method
The study focuses on centennial trends rather than multidecadal variability (a more common analysis focus) of African hydro-climate. The analysis period begins in 1920, in order to focus on the relatively stable rain gauge network period (Nicholson, 2018,personal communication). Linear trends in temperature and precipitation are computed from least-squares fitting using seasonally-averaged data. To avoid confusion given Africa’s expansive footprints in both hemispheres, seasons are referred using their borealdefinition: Winter is the average of December, January and February (DJF), and so on.
Observational Datasets
Three independent analyses of the observed SAT are used in this study: The CRU-TS4.02 monthly analysis from the ClimateResearch Unit of the University of East Anglia (Harris et al., 2014) is available on a 0.5� continental grid for the January 1901—December 2017 period, from http://www.crudata.uea.ac.uk/cru/data/hrg/cru_ts_4.02/. Berkeley Earth’s monthly analysis of surfacetemperature anomalies relative to the 1951–80 climatology (Rohde et al., 2013) is available on a 1.0� grid for the period January1850—December 2015; it is downloadable from http://berkeleyearth.org/data/. Finally, the NASA Goddard Institute for SpaceStudies (GISS) analysis of SAT anomalies relative to the 1951–80 baseline (Hansen et al., 2010) is available on a 2.0� land-oceangrid for the January 1880—September 2015 period from http://www.esrl.noaa.gov/psd/data/gridded/data.gistemp.html. The datasets are converted to a common 0.5� resolution using bilinear spatial interpolation.
The Global Precipitation Climatology Centre (GPCC; Becker et al., 2013) provides a monthly analysis of precipitation fromquality-controlled rain gauge data; GPCC’s Full Data Reanalysis Version 8 data is available on a 0.5� continental grid from January1901—December 2016, from http://www.esrl.noaa.gov/psd/data/gridded/data.gpcc.html#detail. Sahel rainfall is defined as thearea-averaged rainfall within 20�W-40�E and 10�N-20�N, following Held et al. (2006).
Several climate indices are used in the study: The Atlantic Multidecadal Oscillation (AMO; Enfield et al., 2001 Kavvada et al.,2013) index was computed as the linearly detrended seasonal SST anomaly over the North Atlantic (75�W-5�W, EQ-60�N),following Enfield et al. (2001); SST from the HadISSTv1.1 analysis (Rayner et al., 2003) was used. An additional marker of AMOvariability was the principal component extracted from an extended empirical orthogonal function analysis of HadISSTv1.1 SSTdata (Guan and Nigam, 2009). The Pacific Decadal Oscillation (PDO) index was obtained from http://jisao.washington.edu/data/pdo/ where it is defined as the leading principal component of monthly SST anomalies in the North Pacific basin (poleward of20�N; Zhang et al., 1997).
Desert Expansion
Two methods are used to quantify desert expansion during the 1920–2016 period. In both methods, a precipitation threshold ischosen to define the desert boundary; two threshold values—100 mm/year (or 0.274 mm/day) and 150 mm/year (or 0.411 mm/day)—based on previous definitions of the annual-mean Sahara boundary (e.g., Tucker and Nicholson, 1999 Breman and Dewit,1983) are used. Two thresholds were considered so that sensitivity of the desert-area trend to the desert definition can be assessed.Desert area is computed by taking an area sum after weighting each latitude-longitude grid-cell area by the cosine of its latitude;GrADS function “asum” was used. In the first method, referred to as the area-trend method, the desert area is computed each year ineach of the four seasons and annually, with average rainfall less than 0.274 mm/day (0.411 mm/day) defining deserts. The1920–2016 linear trend in the computed area characterizes desert expansion/contraction over the 20th century.

The Sahara Desert Hydroclimate and Expanse: Natural Variability and Climate Change 3
In the second method, referred to as the endpoint method, the precipitation climatology (Pclim) and the linear trend inprecipitation (Ptrend) over the 97-year record are first computed at each grid point, seasonally and annually. These are used tocreate two maps: Precipitation at the end (from the plus sign in the following expression) and at the beginning (from the minussign) of the record,
P ¼ Pc lim � Ptrendð Þ∗47 years:
The desert extent is then mapped in these synthetic 1920 and 2016 precipitation distributions at the endpoints of the record basedon the chosen threshold, with the difference yielding desert expansion over the time period.
In both methods, the desert area computation is restricted to North Africa (northward of 5�N) to preclude inclusion of theNamib/Kalahari Desert, and to the west of 43�E to avoid inclusion of the Horn of Africa.
Each method has its advantages: The area-trend method is conceptually simple but it does not reveal the desert advance/retreatregions. The endpoint method is slightly more complex but it easily outlines the desert advance/retreat regions. Both methodsshould yield similar results except, perhaps, when the analysis period is comparable to the embedded variability timescales—acondition met with AMO, especially when it is influential on regional hydroclimate. The aliasing of multidecadal variability intolinear trends would be inevitable in this case but with the twomethods having different exposure to aliasing from the inverted orderof the area-computation and linear-trend operations.
To remove the influence of multidecadal variability in the precipitation record, seasonally stratified precipitation fields areregressed onto the seasonal AMO and Pacific Decadal Variability—North Pacific (PDV-NP) SST principal components (PCs, whichare orthonormal) over the full period (1920–2016). The influence of these multidecadal variability modes is computed bymultiplying their time-independent regression coefficients by their time-varying PC, seasonally. The influence is then subtractedfrom the precipitation record, and the desert expanse recomputed, as above.
Statistical Significance
Statistical significance of individual linear trends at the 95% confidence level was assessed using the “AdjSE+AdjDF” approach ofSanter et al. (2000). This method employs an effective sample size based on the lag-1 autocorrelation coefficient of the regressionresiduals.
Seasonal Climatology
The seasonal cycle of rainfall over the African continent is shown in Fig. 1. Rainfall is larger, not surprisingly, in the summerhemisphere: Over tropical West Africa, Sahel, and Ethiopia in boreal summer (JJA), and over the Congo and Zambezi basins inaustral summer (DJF). The similarity of the March–May and September–November rainfall distributions—with equatorial Africa,especially Congo basin being the rainfall focus—reflects the similar insolation distribution over the continent at these times—fromthe Sun being overhead twice at the equator each year, during the vernal (late March) and autumnal (late September) equinox. TheSahara Desert is, however, drier in spring than it is in fall, and the Namib/Kalahari Desert likewise in its spring than fall. The stronglatitudinal gradient in precipitation at the southern boundary of the Sahara is a notable feature in all seasons, with the movement ofthis gradient over time having implications for regional agricultural productivity.
The desert boundary, based on the seasonally averaged rainfall threshold of 0.274 mm/day (or 25 mm/season), is shown inthick black contours in Fig. 1. The Sahara expanse is largest in boreal winter and smallest in boreal fall (see Table 1); the largerthreshold (0.411 mm/day or 37.5 mm/season) yields the smallest expanse in summer; both analysis methods return the sameseasons for maximum andminimum expanse (cf. Table 1). In winter, the dry region extends from�10�N to�30�N but in summer,the Sahel rainfall pushes Sahara’s southern edge closer to 20�N. Likewise, the Namib/Kalahari Desert in Southern Hemisphere Africais most expansive in austral winter, consistent with the notion of the desert location under the descending branch of themeridionally overturning Hadley Circulation; the Hadley descent is most intense in each hemisphere’s winter (e.g., Nigam andChan, 2009).
The seasonal distribution of climatological SAT is also shown in Fig. 1, using red contours. The warmest temperatures are foundin boreal summer when SAT exceeds 33 �C over western Saharan Africa. The coldest temperatures occur northward of the AtlasMountains in Algeria and Morocco in boreal winter. A local minimum in SAT exists over Ethiopia in all four seasons due to the highelevation of the Ethiopian Highlands. The spring and fall distributions exhibit less similarity in SAT than in rainfall, especially overSub-Saharan Africa where SAT is notably higher in boreal spring; likely, because of the preceding dry season (winter) and depletedsoil moisture stores which would preclude latent disposition of increased spring insolation.
Centennial Trends in Surface Air Temperature and Precipitation
The 1920–2014 period linear trend, obtained by averaging the linear trend in three independent analyses of SAT observations, isshown in Fig. 2. Notable features include:

Fig. 1 Seasonally averaged precipitation (brown-green shading; mm/day) and surface air temperature (SAT; red contours; �C) for the period 1920–2016.Precipitation is from GPCC and SAT from the CRU-TS4.02 dataset. The non-uniform shading interval for precipitation is indicated through the color bar. Contourinterval for SAT is 3.0 �C. Fields are shown after 9 applications of the 9-point smoother (smth9) in GrADS. Thick red contours indicate the 30 �C isotherm, while thickblack ones mark the 0.274 mm/day precipitation isoline. Note, 0.274 mm/day is equivalent to 100 mm/year, a precipitation-based definition of the annual-meanSahara Desert boundary (Tucker and Nicholson, 1999). Major rivers are shown in thin blue lines and labeled in the top-left panel.
4 The Sahara Desert Hydroclimate and Expanse: Natural Variability and Climate Change
• Larger trends over Northern Hemisphere Africa, in all seasons.
• A regional maximum over Sudan, particularly, in spring when SAT trends are larger than 1.5 �C/century; interestingly, this is theNile River basin.
• A pronounced seasonality in trends over North Africa, near Algeria and Tunisia. Trends here range from �0.8 �C/century inwinter to as much as 2.0 �C/century in summer.
• A comparatively muted seasonality in trends over Southern Hemisphere Africa except for Angola, Namibia, and Botswana whereaustral winter (JJA) warming is stronger than in other seasons.
• The similarity in boreal winter and fall SAT trends over much of the continent.
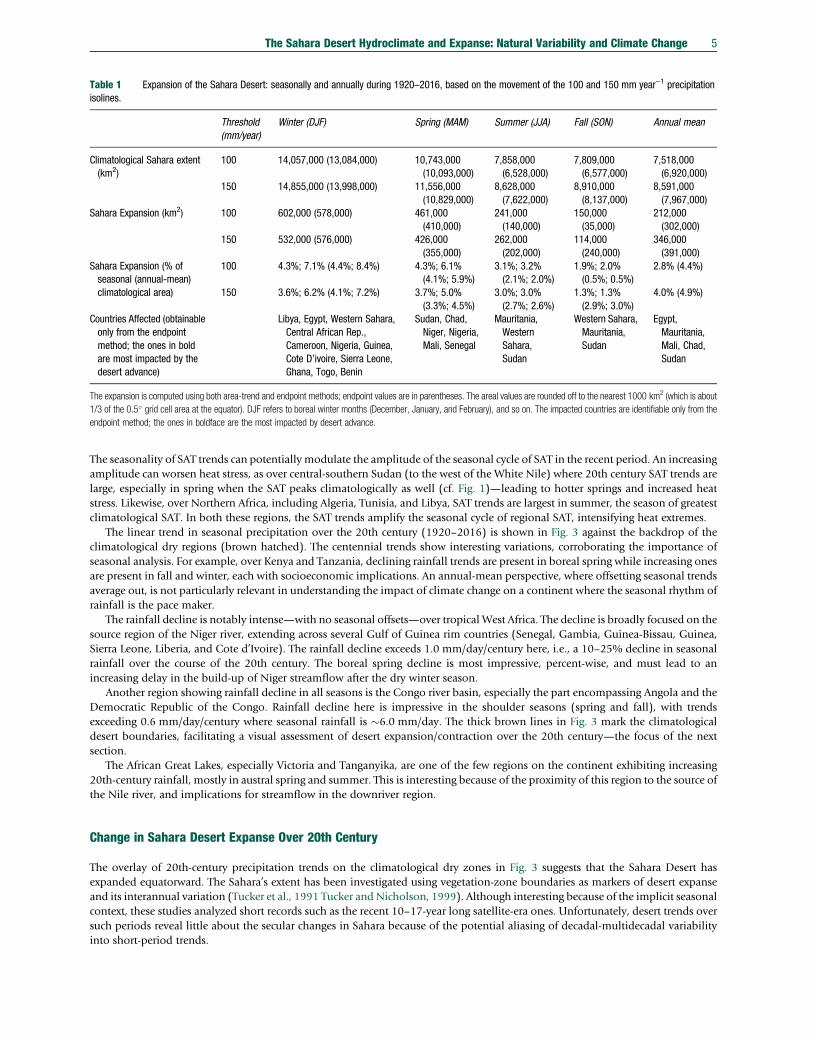
Table 1 Expansion of the Sahara Desert: seasonally and annually during 1920–2016, based on the movement of the 100 and 150 mm year−1 precipitationisolines.
Threshold(mm/year)
Winter (DJF) Spring (MAM) Summer (JJA) Fall (SON) Annual mean
Climatological Sahara extent(km2)
100 14,057,000 (13,084,000) 10,743,000(10,093,000)
7,858,000(6,528,000)
7,809,000(6,577,000)
7,518,000(6,920,000)
150 14,855,000 (13,998,000) 11,556,000(10,829,000)
8,628,000(7,622,000)
8,910,000(8,137,000)
8,591,000(7,967,000)
Sahara Expansion (km2) 100 602,000 (578,000) 461,000(410,000)
241,000(140,000)
150,000(35,000)
212,000(302,000)
150 532,000 (576,000) 426,000(355,000)
262,000(202,000)
114,000(240,000)
346,000(391,000)
Sahara Expansion (% ofseasonal (annual-mean)climatological area)
100 4.3%; 7.1% (4.4%; 8.4%) 4.3%; 6.1%(4.1%; 5.9%)
3.1%; 3.2%(2.1%; 2.0%)
1.9%; 2.0%(0.5%; 0.5%)
2.8% (4.4%)
150 3.6%; 6.2% (4.1%; 7.2%) 3.7%; 5.0%(3.3%; 4.5%)
3.0%; 3.0%(2.7%; 2.6%)
1.3%; 1.3%(2.9%; 3.0%)
4.0% (4.9%)
Countries Affected (obtainableonly from the endpointmethod; the ones in boldare most impacted by thedesert advance)
Libya, Egypt, Western Sahara,Central African Rep.,Cameroon, Nigeria, Guinea,Cote D’ivoire, Sierra Leone,Ghana, Togo, Benin
Sudan, Chad,Niger, Nigeria,Mali, Senegal
Mauritania,WesternSahara,Sudan
Western Sahara,Mauritania,Sudan
Egypt,Mauritania,Mali, Chad,Sudan
The expansion is computed using both area-trend and endpoint methods; endpoint values are in parentheses. The areal values are rounded off to the nearest 1000 km2 (which is about1/3 of the 0.5� grid cell area at the equator). DJF refers to boreal winter months (December, January, and February), and so on. The impacted countries are identifiable only from theendpoint method; the ones in boldface are the most impacted by desert advance.
The Sahara Desert Hydroclimate and Expanse: Natural Variability and Climate Change 5
The seasonality of SAT trends can potentially modulate the amplitude of the seasonal cycle of SAT in the recent period. An increasingamplitude can worsen heat stress, as over central-southern Sudan (to the west of the White Nile) where 20th century SAT trends arelarge, especially in spring when the SAT peaks climatologically as well (cf. Fig. 1)—leading to hotter springs and increased heatstress. Likewise, over Northern Africa, including Algeria, Tunisia, and Libya, SAT trends are largest in summer, the season of greatestclimatological SAT. In both these regions, the SAT trends amplify the seasonal cycle of regional SAT, intensifying heat extremes.
The linear trend in seasonal precipitation over the 20th century (1920–2016) is shown in Fig. 3 against the backdrop of theclimatological dry regions (brown hatched). The centennial trends show interesting variations, corroborating the importance ofseasonal analysis. For example, over Kenya and Tanzania, declining rainfall trends are present in boreal spring while increasing onesare present in fall and winter, each with socioeconomic implications. An annual-mean perspective, where offsetting seasonal trendsaverage out, is not particularly relevant in understanding the impact of climate change on a continent where the seasonal rhythm ofrainfall is the pace maker.
The rainfall decline is notably intense—with no seasonal offsets—over tropical West Africa. The decline is broadly focused on thesource region of the Niger river, extending across several Gulf of Guinea rim countries (Senegal, Gambia, Guinea-Bissau, Guinea,Sierra Leone, Liberia, and Cote d’Ivoire). The rainfall decline exceeds 1.0 mm/day/century here, i.e., a 10–25% decline in seasonalrainfall over the course of the 20th century. The boreal spring decline is most impressive, percent-wise, and must lead to anincreasing delay in the build-up of Niger streamflow after the dry winter season.
Another region showing rainfall decline in all seasons is the Congo river basin, especially the part encompassing Angola and theDemocratic Republic of the Congo. Rainfall decline here is impressive in the shoulder seasons (spring and fall), with trendsexceeding 0.6 mm/day/century where seasonal rainfall is �6.0 mm/day. The thick brown lines in Fig. 3 mark the climatologicaldesert boundaries, facilitating a visual assessment of desert expansion/contraction over the 20th century—the focus of the nextsection.
The African Great Lakes, especially Victoria and Tanganyika, are one of the few regions on the continent exhibiting increasing20th-century rainfall, mostly in austral spring and summer. This is interesting because of the proximity of this region to the source ofthe Nile river, and implications for streamflow in the downriver region.
Change in Sahara Desert Expanse Over 20th Century
The overlay of 20th-century precipitation trends on the climatological dry zones in Fig. 3 suggests that the Sahara Desert hasexpanded equatorward. The Sahara’s extent has been investigated using vegetation-zone boundaries as markers of desert expanseand its interannual variation (Tucker et al., 1991 Tucker and Nicholson, 1999). Although interesting because of the implicit seasonalcontext, these studies analyzed short records such as the recent 10–17-year long satellite-era ones. Unfortunately, desert trends oversuch periods reveal little about the secular changes in Sahara because of the potential aliasing of decadal-multidecadal variabilityinto short-period trends.

Fig. 2 Linear trends in near-surface air temperature (SAT) over the African continent during 1920–2014. Average of the trends in three independent SATanalyses—CRU TS4.02, Berkeley Earth, and NASA-GISS—is shown after each was interpolated to 0.5� resolution. Contour and shading are at 0.4 �C/centuryinterval. Fields are shown after 9 applications of the 9-point smoother (smth9) in GrADS. Country boundaries are shown in thin gray and major rivers in thin bluelines.
6 The Sahara Desert Hydroclimate and Expanse: Natural Variability and Climate Change
Here, we use the precipitation rate to demarcate the desert region. The use of precipitation rather than vegetation allows analysisof a longer record notwithstanding the spatiotemporal sparseness of the precipitation record in the early 20th century. A directrelationship between precipitation and the vegetation index found in previous studies (Tucker and Nicholson, 1999 Tucker et al.,1991) supports such a strategy. In Fig. 3, a 100 mm/year (or 0.274 mm/day; one of the two thresholds discussed in “DesertExpansion” section) precipitation isoline demarcates the deserts, seasonally. A light brown hatching of the regions where climato-logical precipitation is less than this value marks the desert expanse which is monitored using the two methods discussed in“Datasets and Analysis Method” section.

Fig. 3 Linear trends in seasonal precipitation over the African continent during 1920–2016, from the 0.5� resolution GPCC dataset v8, in units of mm/day/century.The non-uniform contouring and shading interval is indicated via the color bar. Thick solid brown contours mark the 0.274 mm/day climatological precipitationisoline, and brown hatching indicates regions where climatological precipitation is below 0.274 mm/day (or 100 mm/year)—a precipitation threshold used fordefining the Sahara Desert. Fields are shown after 9 applications of the 9-point smoother (smth9) in GrADS. Trends significant at the 95% confidence level aredenoted with black dots. Major rivers are shown in thin blue lines and country boundaries in thin gray lines.
The Sahara Desert Hydroclimate and Expanse: Natural Variability and Climate Change 7
Sahara’s Advance
The 20th century change in Sahara Desert’s seasonal (annual) extent is displayed in Fig. 4B; the change is estimated using theendpoint method. Brown shading, which represents the desert’s advance over the century, shows modest northward creep in borealwinter albeit not uniformly across longitudes; northward expansion is seen in Egypt and Libya, while modest desert retreat is seen inAlgeria. The desert has encroached equatorward as well in winter, with notable intrusions in Nigeria, Cameroon, and the CentralAfrican Republic.

(A)
(B)
Fig. 4 (A) Advance/retreat of the Sahara Desert over the 1920–2016 period, seasonally. The dashed (solid) brown lines denote the 0.274 mm/day precipitationisolines in the synthetic 1920 (2016) precipitation map obtained from the endpoint analysis (cf. Section “Datasets and Analysis Method”). The brown (green) shadedareas denote desert advance (retreat). [Note, the observed precipitation distribution at the period endpoints cannot be directly used as it includes both interannualand decadal-multidecadal variability components and the sought-after linear trend.]. (B) Advance/retreat of the Sahara Desert over the 1920–2016 period, annually.Desert identification here is fully consistent with the canonical desert definition based on annual rainfall; a 100 mm/year threshold is used. Rest as in (A).
8 The Sahara Desert Hydroclimate and Expanse: Natural Variability and Climate Change
The centennial change in Sahara’s summer extent is primarily through the equatorward advance of its southern boundary (Fig. 4)which is climatologically located at �20�N because of robust summer rainfall in the northern Tropics including the Sahel (EQ-20�N; cf. Fig. 1). Much as with the winter desert advance at the northern boundary, the southern advance is sectorally focused, withintrusions in Mauritania to the west and Sudan in the western sector, and desert retreat again seen in Algeria. The countries mostimpacted by the Sahara Desert’s seasonal and annual-mean advance are listed in Table 1.

The Sahara Desert Hydroclimate and Expanse: Natural Variability and Climate Change 9
The annual-mean desert advance (using the 100 mm/year threshold), displayed in Fig. 4B, provides context for the seasonalanalysis and comports with canonical definitions of the desert based on annual-mean rainfall threshold (e.g., Tucker andNicholson, 1999). The annual-mean advance shows primarily southward creep relative to the annual-mean desert boundaries.
Sahara’s Expanse
A quantitative analysis of the centennial change in Sahara Desert’s seasonal and annual-mean expanse is reported in Table 1. Theprimary analysis is based on the area-trend method but the endpoint method which generated Fig. 4 is also used with both desertdefinitions to assess the sensitivity of the desert expansion to analysis methods. The expansion has been largest (area-wise) in borealwinter (602,000 km2, a 4.3% increase) and smallest in fall (150,000 km2, a 1.9% increase) using the area-trend method with a100 mm/year threshold. Estimates of desert expansion from the endpoint method (noted in parentheses in Table 1), with the samethreshold, also yield maximum desert expansion in winter (578,000 km2, a 4.4% increase) and a minimum in fall (35,000 km2, a0.5% increase).
The sensitivity of the desert expansion rate to the desert-defining precipitation-threshold is also reported in Table 1. A lessstringent definition, based on a 150 mm/year threshold, leads to more expansive deserts—not surprisingly—but also smallercentennial expansions, indicating a tightening of the meridional precipitation gradient over the century. Percentages drop on bothcounts but Sahara’s expansion remains robust with the largest expansion, as before, in boreal winter (532,000 km2, a 3.6%increase). The weakest expansion again is in fall (114,000 km2, a 1.3% increase). Results from the endpoint method using thelarger threshold are qualitatively similar to those obtained with the lower one.
The sensitivity analysis indicates that while desert expansion and related area-percentage vary somewhat with the desertdefinition and analysis method, one can reasonably conclude that the Sahara Desert has grown larger, area-wise, more in winterthan summer and fall. The countries bearing the brunt of the Sahara’s southward advance in winter are the Gulf of Guinea rimcountries, including Nigeria, Cameroon, and Central African Republic, and Mauritania and Sudan in summer (cf. Fig. 4B). Notableagainst these areas of desert advance (brown shading) over the northern continent are areas of green over Algeria in winter andsummer, reflecting Sahara’s retreat.
The expansion of the Sahara Desert is also analyzed using the conventional annual-rainfall based desert definition. Table 1 (lastcolumn) notes the findings from the area-trend and endpoint methods for both the 100 and 150 mm/year annual-rainfallthresholds. During 1920–2013, the Sahara expanded by over 212,000 km2 (or �2200 km2/year) based on the 100 mm/yeardefinition, indicating a �3% expansion over its climatological area (7,518,000 km2). The desert’s southward creep is the majorcontributor to the expansion.
Sahara’s Expanse: Variation and Potential Mechanisms
The Sahara Desert’s expanse during the 1920–2016 period, and not just at its endpoints, is the focus of this section. The desertexpanse in summer is plotted in Fig. 5, along with select indices of circulation and SST variability that can provide insights on causalmechanisms. The focus is on the summer season, when variations in the Sahara Desert’s expanse arise mainly from the north-southmovements of its southern boundary which borders the Sahel.
The summer expanse (solid black line) exhibits both an upward trend, highlighted by the linear fit (thin black straight line), aswell as notable decadal-multidecadal variations. As areal changes result from the equatorward advance or poleward retreat of thedesert’s southern edge, Sahara’s summer expanse should be inversely linked to Sahel rainfall (defined in “Observational Datasets”section) which is plotted with a dashed black line. The inverse relationship can be visually discerned: for example, the drying of theSahel—a multidecadal decline in Sahel rainfall from the mid-1950s to the mid-1980s—is coincident with Sahara’s expansion; thefull-period correlation (r ¼ −0.78) points to a strong inverse relationship. The anti-correlation allows tapping into extensiveanalyses of Sahel rainfall variability in the attribution of the summer waxing and waning of the Sahara Desert.
The Sahel rainfall has been linked to AMO variability among other processes, as noted in the introduction. To assess linksbetween AMO and the Sahara’s extent, two markers of AMO variability are plotted in Fig. 5 along with their correlations to Sahara’sexpanse and Sahel rainfall. The AMO SST principal component (dashed red line), obtained from an evolution-centric spatiotem-poral analysis of seasonal SST anomalies in the 20th century (Guan and Nigam, 2009), shows higher correlations with both Sahara’sexpanse (r ¼ −0.49) and Sahel rainfall (r ¼ 0.55) in boreal summer.
Decadal SST variability in the Pacific basin, as typified by Pacific Decadal Oscillation (PDO; Mantua et al., 1997), is also linkedwith Sahel rainfall (Villamayor and Mohino, 2015 Nigam and Ruiz-Barradas, 2016) albeit not as strongly as the AMO. The PDOindex, shown in Fig. 5 (solid blue line), is correlated with Sahel rainfall and Sahara’s expanse at −0.34 and 0.27, respectively.A contemporaneous statistical link between the PDO and Sahel rainfall seems more intriguing than the rainfall’s link with the AMObecause the AMO SST anomalies are proximal, with their tropical footprints offering potential mechanisms for their influence.In contrast, the PDO SST anomalies are distant and focused in the midlatitudes, disadvantaging them from the influence potentialperspective, especially as only the tropical SST anomalies are generally viewed as influential on faraway regions. Interestingly, thesedisadvantages disappear once one recognizes that PDO is not without tropical links: Guan and Nigam (2008) showed the PDOcounterpart in their spatiotemporal analysis (called Pacific Decadal Variability–North Pacific, or PDV-NP) to be linked with the

1920 1930 1940 1950 1960 1970 1980 1990 2000 2010
-2
-1.5
-1
-0.5
0
0.5
1
1.5
2
2.5
3N
orm
aliz
ed V
aria
tions
SUMMER
Sahara Expanse - 100mm/year ; linear fit: 2490 sq km/yearAverage Sahel Rainfall; r = -0.78AMO Index; r1 = -0.55; r2 = 0.52AMO SST PC; r1 = -0.49; r2 = 0.55PDO Index; r1 = 0.27; r2 = -0.34
Fig. 5 Sahara Desert’s expanse during 1920–2016. The boreal summer expanse is shown in the top using the thick solid black line. The thin black straight line isthe linear fit to the desert expanse over the entire period—it is the basis of the area-trend analysis reported in Table 1. Indices of sea surface temperature (SST) andrainfall variability with potential links to Sahara Desert’s summer expanse are shown in the bottom panel, along with their correlation coefficients. For each index, r1(r2) is the correlation between the index and Sahara expanse (Sahel rainfall). The Atlantic Multidecadal Oscillation (AMO) and Pacific Decadal Oscillation (PDO) aredisplayed using their common SST indices; an SST principal component (PC) based AMO index is also shown. The rainfall over Sahel is plotted as well. All time-series depict normalized anomalies after 10% Loess smoothing; the time-series for the latitude of the Northern Hemisphere (NH) subtropical jet was smoothed with a20% Loess function. All time-series are normalized by their standard deviations; these are 703,903 km2, 0.458 mm/day, 0.245, 1.005, and 0.977 for Sahara’ssummer expanse, Sahel’s summer rainfall, AMO index, AMO PC, PDO index, respectively.
10 The Sahara Desert Hydroclimate and Expanse: Natural Variability and Climate Change
tropical Indian and Pacific basin SSTs. The PDO’s modest influence on Sahel rainfall, if realized through its tropical Indian Oceanfootprints, would be consistent with the findings of Hagos and Cook (2008).
Secular change is often characterized using the century-long linear trends in observational records, as for Sahara’s expanse inFig. 5. The linear trend is however susceptible to the aliasing of multidecadal variability should the latter be prominently manifest inthe record—the case in summer (cf. Fig. 5). The origin of the 95-year linear trend (referred as secular trend) in Sahara’s summerexpanse remains to be elucidated; the elucidation is challenging, especially, for an observational analysis. Trends on centennial andlonger timescales can potentially result from the interaction of multidecadal variabilities (e.g., PDO and AMO) and, of course, fromthe increasing concentration of greenhouse gases and aerosol loading (e.g., Held et al., 2006) and the related secular change in SSTdistribution (Nigam and Ruiz-Barradas, 2016; see their Fig. 23.6).
Concluding Remarks
The footprints of climate change over the African Continent are widely noted (e.g., Niang et al., 2014) but even region-specificdescriptions seldom stray from the annual-mean displays of hydroclimate trends—and this over the African continent, where theseasonal waxing and waning of the Sahara Desert and the complementary expansion and retraction of Sahel rainfall rule thenorthern continent. Southern Hemisphere Africa is also no stranger to the munificence of the seasonal cycle which brings rainfalland life to vast stretches of the Namib/Kalahari Desert in austral summer. The utility of the seasonal perspective in climatechange, i.e., seasonally-stratified centennial trends in precipitation and near-surface air temperature, for long-term water resourcemanagement cannot, of course, be overstated.
The centennial SAT trends are larger over the northern continent, especially in the northwestern sector and North Africa (Algeriaand Libya) where they are often greater than 1.6 �C/century. The trends are furthermore pronounced in boreal summer, amplifyingthe regional seasonal cycle, i.e., making hot summers even hotter and exacerbating heat-related distress. Another focal point of largeSAT trends over north Africa is the region to the west of the White Nile (central-southern Sudan). For context, these SAT trends are
The Sahara Desert Hydroclimate and Expanse: Natural Variability and Climate Change 11
not much smaller than the largest SAT trends over North America (e.g., Nigam et al., 2017, Fig. 1), that are manifest over western-central Canada in winter.
Centennial precipitation trends, especially the drying ones are notable over the tropical continent, i.e., in the region between theSahara and the Namib/Kalahari deserts. River-basin wise, impressive drying trends are found in the source region of the Niger Riverfrom spring to fall, i.e., in the local rainy seasons; the decline is impressive because it represents a 10–25% decline in seasonalrainfall over the course of the 20th century. Another focal point of declining rainfall is the Congo River basin, and the Blue Nilesource region around Lake Tana in Ethiopia; the latter in boreal summer—the peak rainfall season.
When viewed together, the key features of the centennial drying trends can be interpreted as the southward expansion of theSahara Desert during boreal spring-to-fall, or alternatively, as the equatorward retreat of the northern edge of the Sahel rainfall belt.We show that the Sahara Desert has expanded over 1920–2016—by 2–4% depending on the season—using conservative estimatesfrom the area-trend method. The southward expansion in summer is linked to the SST variability in the Atlantic and Pacific basinson multidecadal timescales, through Atlantic Multidecadal Oscillation (AMO) and Pacific Decadal Oscillation’s (PDO) impact onSahel rainfall. On centennial timescales, the summer expansion is related to aliased multidecadal variabilities and the increasingconcentration of greenhouse gases and aerosol loading (e.g., Held et al., 2006).
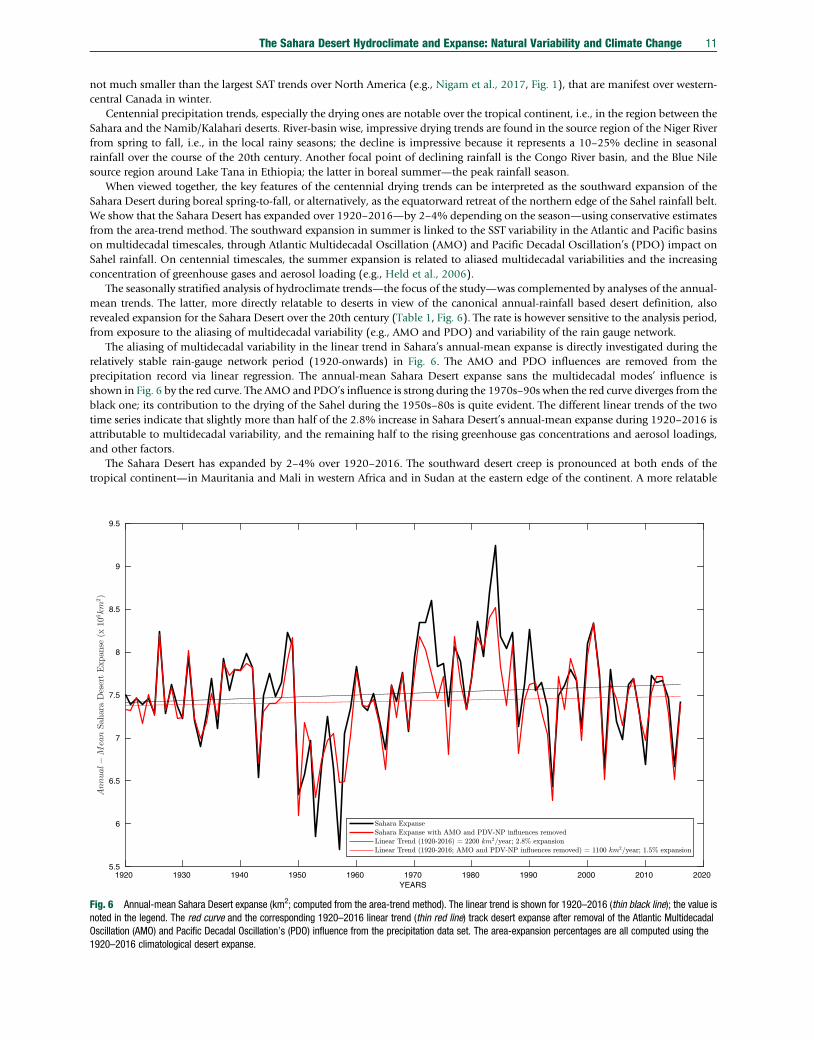
The seasonally stratified analysis of hydroclimate trends—the focus of the study—was complemented by analyses of the annual-mean trends. The latter, more directly relatable to deserts in view of the canonical annual-rainfall based desert definition, alsorevealed expansion for the Sahara Desert over the 20th century (Table 1, Fig. 6). The rate is however sensitive to the analysis period,from exposure to the aliasing of multidecadal variability (e.g., AMO and PDO) and variability of the rain gauge network.
The aliasing of multidecadal variability in the linear trend in Sahara’s annual-mean expanse is directly investigated during therelatively stable rain-gauge network period (1920-onwards) in Fig. 6. The AMO and PDO influences are removed from theprecipitation record via linear regression. The annual-mean Sahara Desert expanse sans the multidecadal modes’ influence isshown in Fig. 6 by the red curve. The AMO and PDO’s influence is strong during the 1970s–90s when the red curve diverges from theblack one; its contribution to the drying of the Sahel during the 1950s–80s is quite evident. The different linear trends of the twotime series indicate that slightly more than half of the 2.8% increase in Sahara Desert’s annual-mean expanse during 1920–2016 isattributable to multidecadal variability, and the remaining half to the rising greenhouse gas concentrations and aerosol loadings,and other factors.
The Sahara Desert has expanded by 2–4% over 1920–2016. The southward desert creep is pronounced at both ends of thetropical continent—in Mauritania and Mali in western Africa and in Sudan at the eastern edge of the continent. A more relatable
1920 1930 1940 1950 1960 1970YEARS
1980 1990 2000 2010 20205.5
6
6.5
7
7.5
8
8.5
9
9.5
Fig. 6 Annual-mean Sahara Desert expanse (km2; computed from the area-trend method). The linear trend is shown for 1920–2016 (thin black line); the value isnoted in the legend. The red curve and the corresponding 1920–2016 linear trend (thin red line) track desert expanse after removal of the Atlantic MultidecadalOscillation (AMO) and Pacific Decadal Oscillation’s (PDO) influence from the precipitation data set. The area-expansion percentages are all computed using the1920–2016 climatological desert expanse.

12 The Sahara Desert Hydroclimate and Expanse: Natural Variability and Climate Change
measure of the land-area lost to desert encroachment each year is, perhaps, obtained by distributing the annual lost area uniformlyacross longitudes, which leads to a southward desert creep of about 2/3 Km each year along the entire �5000 Km width of theSahara. Future desertification will depend upon the phases of related sea surface temperature variability as well as anthropogeniceffects. Continued expansion of the Sahara Desert will likely have significant implications for agriculture, water resources, and foodsecurity in the proximal countries.
References
Becker A, Finger P, Meyer-Christoffer A, Rudolf B, Schamm K, Schneider U, and Ziese M (2013) A description of the global land-surface precipitation data products of the GlobalPrecipitation Climatology Centre with sample applications including centennial (trend) analysis from 1901-present. Earth System Science Data 5: 71–99.
Biasutti M and Giannini A (2006) Robust Sahel drying in response to late 20th century forcings. Geophysical Research Letters 33: 4.Breman H and Dewit CT (1983) Rangeland productivity and exploitation in the Sahel. Science 221: 1341–1347.Busby JW, Cook KH, Vizy EK, Smith TG, and Bekalo M (2014) Identifying hot spots of security vulnerability associated with climate change in Africa. Climatic Change 124: 717–731.Charney J (1975) Dynamics of deserts and drought in the Sahel. Quarterly Journal of the Royal Meteorological Society 101: 193–202.Chou C, Chiang JCH, Lan CW, Chung CH, Liao YC, and Lee CJ (2013) Increase in the range between wet and dry season precipitation. Nature Geoscience 6: 263–267.Collins JM (2011) Temperature variability over Africa. Journal of Climate 24: 3649–3666.Cook KH and Vizy EK (2015) Detection and analysis of an amplified warming of the Sahara Desert. Journal of Climate 28: 6560–6580.Dong BW and Sutton R (2015) Dominant role of greenhouse-gas forcing in the recovery of Sahel rainfall. Nature Climate Change 5: 757–U173.Enfield DB, Mestas-Nunez AM, and Trimble PJ (2001) The Atlantic multidecadal oscillation and its relation to rainfall and river flows in the continental US. Geophysical Research Letters
28: 2077–2080.Evan AT, Flamant C, Gaetani M, and Guichard F (2016) The past, present and future of African dust. Nature 531: 493–495.Fields S (2005) Spheres of influence—Continental divide—Why Africa’s climate change burden is greater. Environmental Health Perspectives 113: A534–A537.Folland CK, Palmer TN, and Parker DE (1986) Sahel rainfall and worldwide sea temperatures, 1901-85. Nature 320: 602–607.Giannini A, Saravanan R, and Chang P (2003) Oceanic forcing of Sahel rainfall on interannual to interdecadal time scales. Science 302: 1027–1030.Guan B and Nigam S (2008) Pacific Sea surface temperatures in the twentieth century: An evolution-centric analysis of variability and trend. Journal of Climate 21: 2790–2809.Guan B and Nigam S (2009) Analysis of Atlantic SST variability factoring interbasin links and the secular trend: Clarified structure of the Atlantic multidecadal oscillation. Journal of
Climate 22: 4228–4240.Hagos SM and Cook KH (2008) Ocean warming and late-twentieth-century Sahel drought and recovery. Journal of Climate 21: 3797–3814.Hansen J, Ruedy R, Sato M, and Lo K (2010) Global surface temperature change. Reviews of Geophysics 48: 29.Harris I, Jones PD, Osborn TJ, and Lister DH (2014) Updated high-resolution grids of monthly climatic observations—The CRU TS3.10 dataset. International Journal of Climatology
34: 623–642.Held IM, Delworth TL, Lu J, Findell KL, and Knutson TR (2006) Simulation of Sahel drought in the 20th and 21st centuries (vol. 102, pg 17891, 2006). Proceedings of the National
Academy of Sciences of the United States of America 103: 1152–1153.Hulme M, Doherty R, Ngara T, New M, and Lister D (2001) African climate change: 1900-2100. Climate Research 17: 145–168.Kavvada A, Ruiz-Barradas A, and Nigam S (2013) AMO’s structure and climate footprint in observations and IPCC AR5 climate simulations. Climate Dynamics 41: 1345–1364.Knight JR, Folland CK, and Scaife AA (2006) Climate impacts of the Atlantic multidecadal oscillation. Geophysical Research Letters 33: 4.Mantua NJ, Hare SR, Zhang Y, Wallace JM, and Francis RC (1997) A Pacific interdecadal climate oscillation with impacts on salmon production. Bulletin of the American Meteorological
Society 78: 1069–1079.Mohino E, Janicot S, and Bader J (2011) Sahel rainfall and decadal to multi-decadal sea surface temperature variability. Climate Dynamics 37: 419–440.Niang I, Ruppel OC, Abdrabo MA, Essel A, Lennard C, Padgham J, Urquhart P, Adelekan I, Archibald S, Balinga M, Barkhordarian A, Battersby J, Bilir E, Burke M, Chahed M,
Chatterjee M, Chidiezie CT, Descheemaeker K, Djoudi H, Ebi KL, Fall PD, Fuentes R, Garland R, Gaye F, Hilmi K, Gbobaniyi E, Gonzalez P, Harvey B, Hayden M, Hemp A, Jobbins G,Johnson J, Lobell D, Locatelli B, Ludi E, Naess LO, Ndebele-Murisa MR, Ndiaye A, Newsham A, Njai S, Nkem J, Olwoch JM, Pauw P, Pramova E, Rakotondrafara ML, Raleigh C,Roberts D, Roncoli C, Sarr AT, Schleyer MH, Schulte-Uebbing L, Schulze R, Seid H, Shackleton S, Shongwe M, Stone D, Thomas D, Ugochukwu O, Victor D, Vincent K, Warner K,and Yaffa S (2014) Africa. In: Barros VR, Field CB, Dokken DJ, Mastrandrea MD, Mach KJ, Bilir TB, Chatterjee M, Ebi KL, Estrada YO, Genova RC, Girma B, Kissel ES, Levy AN,Maccracken S, Mastrandrea PR, and White LL (eds.) Climate change 2014: Impacts, adaptation, and vulnerability, Pt B: Regional aspects: Working Group ii Contribution to the FifthAssessment Report of the Intergovernmental Panel on Climate Change. Cambridge: Cambridge University Press.
Nicholson S (2000) Land surface processes and Sahel climate. Reviews of Geophysics 38: 117–139.Nigam S and Chan SC (2009) On the summertime strengthening of the northern hemisphere Pacific Sea level pressure anticyclone. Journal of Climate 22: 1174–1192.Nigam S and Ruiz-Barradas A (2016) Key role of the Atlantic multidecadal oscillation in twentieth century drought and wet periods over the US Great Plains and the Sahel. In: Li J,
Swinbank R, Volkert H, and Grotjahn R (eds.) Dynamics and predictability of large-scale, high-impact weather and climate events. Cambridge University Press.Nigam S, Thomas NP, Ruiz-Barradas A, and Weaver SJ (2017) Striking seasonality in the secular warming of the northern continents: Structure and mechanisms. Journal of Climate
30: 6521–6541.Rayner NA, Parker DE, Horton EB, Folland CK, Alexander LV, Rowell DP, Kent EC, and Kaplan A (2003) Global analyses of sea surface temperature, sea ice, and night marine air
temperature since the late nineteenth century. Journal of Geophysical Research-Atmospheres 108: 37.Rohde R, Muller RA, Jacobsen R, Muller E, Perlmutter S, Rosenfeld A, Wurtele J, Groom D, and Wickham C (2013) A New estimate of the average earth surface land temperature
spanning 1753 to 2011. Geoinformatics & Geostatistics: An Overview 1: 1–7.Santer BD, Wigley TML, Boyle JS, Gaffen DJ, Hnilo JJ, Nychka D, Parker DE, and Taylor KE (2000) Statistical significance of trends and trend differences in layer-average atmospheric
temperature time series. Journal of Geophysical Research-Atmospheres 105: 7337–7356.Thomas N and Nigam S (2018) Twentieth-century climate change over Africa: Seasonal Hydroclimate trends and Sahara Desert expansion. Journal of Climate 31: 3349–3370.Tucker CJ and Nicholson SE (1999) Variations in the size of the Sahara Desert from 1980 to 1997. Ambio 28: 587–591.Tucker CJ, Dregne HE, and Newcomb WW (1991) Expansion and contraction of the Sahara desert from 1980 to 1990. Science 253: 299–301.Villamayor J and Mohino E (2015) Robust Sahel drought due to the Interdecadal Pacific oscillation in CMIP5 simulations. Geophysical Research Letters 42: 1214–1222.Vizy EK and Cook KH (2017) Seasonality of the observed amplified Sahara warming trend and implications for Sahel rainfall. Journal of Climate 30: 3073–3094.Zhang Y, Wallace JM, and Battisti DS (1997) ENSO-like interdecadal variability: 1900-93. Journal of Climate 10: 1004–1020.