desi-ms in food contaminants control
TRANSCRIPT

DESI-MS in food contaminants control
Michel Nielen, Hans Mol

Outline
Introduction
Principle
Experimental parameters
Instrumentation
Food contaminant applications
Summary/outlook
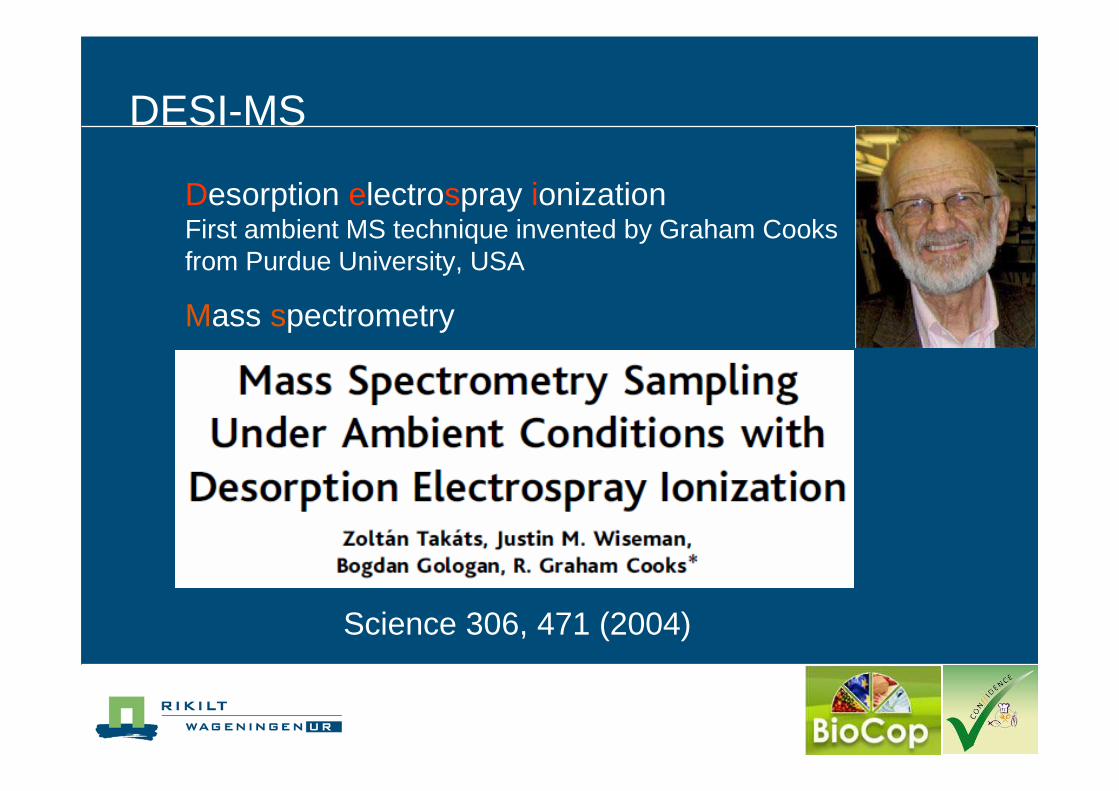
DESI-MS
Science 306, 471 (2004)
Desorption electrospray ionizationFirst ambient MS technique invented by Graham Cooks from Purdue University, USA
Mass spectrometry

Ambient MS techniques
Venter, Nefliu, Cooks, Trends in Anal. Chem. 27 (2008) 284-290

Ambient MSWeston, Analyst, 2010, 135, 661Weston, Analyst, 2010, 135, 661Weston, Analyst, 2010, 135, 661Weston, Analyst, 2010, 135, 661----668668668668

DESI: principle and processes
Ifaet
al,
Anal
yst,
2010
, 135
, 669
–681
From surface deposit to ion:
1. Formation of charged primary droplets by electrospray source2. Flight of droplets to surface, wetting of surface, dissolvation3. Collision of charged droplets with surface => smaller droplets4. Takeoff of secondary droplets, ablated material, free ions5. Transport through atm. pressure interface6. Shrinking of droplets, electrostatic fission => free ions

Formation of secondary droplets
Costa, Cooks, Chemical Physics Letters 464 (2008) 1–8

Experimental parameters
Venter et al, Anal. Chem. 2006, 78, 8549-8555
- Solvent- Solvent flow- Gas flow- Spray angle- Capillary voltage- Distance to sample surface- Angle ion collection MS- Sample surface- Distance to MS inlet- MS parameters (incl. source temp)

Solvent and spray
Dissolution of analyte in microdroplets / solvent film
Ionization; similar to LC-ESI-MS solvents⇒ MeOH or ACN with water/acid
Option to add reagents (reactive DESI)
Flow rate: 1-5 µl/min
Nebulizer gas: 8-40 L nitrogen/min
Spray droplets: ≤ 10 µm (2-4), v ≥ 100 m/s (120)

Reactive DESI
Ifa et al, Analyst, 2010, 135, 669–681

Spray voltage (kV)
Higher V => more charges on droplet surface
Levels off around 5 kV (=> default)
Nebulizer gas pressure (psi)
Solvent flow rate µl/min
Venter et al, Anal. Chem. 2006, 78, 8549-8555

Geometry
α = 25-80°β = ~5-10°Spray tip to surface= 1-10 mmSurface to MS inlet = 1-5 mm
Standard configuration DESI sources
Venter et al, Anal. Chem. 2007, 79, 6398
Alternative configurations
Green et al, Anal. Chem. 2009, 81, 2286-2293

Geometry independent configurations

Sample surface (substrate)
Surfaces:
Sample itself
Wettability: solvent formation/dissolutionElectroconductivity: more charge maintained by substrate,
more charge in sec. droplets
Pear leaf
Substrates for liquids/extracts:- Glass- PTFE (teflon)- PMMA (polymethylmethacrylate)- Filter paper- TLC plates
2.5 mm
5 mm

DESI, instrumentation
Paracetamol
In principle…….you can misuse a Z-source….

DESI, instrumentation
Ion source assembly Mass spectrometer
OmniSpray ion source

DESI, instrumentationTop view DESI source assembly
OmniSpray ion source (Prosolia)

DESI-MS/MS (LXQ, linear ion trap)

Nub
uliz
erga
s (N
2)
Pote
ntia
l (V)
Solvent
camera
light
MS inlet
sample
DESI, instrumentation
motorized sample stage

DESI, MS inlet (sniffers)
Extended, bended
Standard LXQ MS inlet capillary
Extended, bended,enlarged opening


Front view DESIZ
X
Y
X
Y
Z
Spray head
Y Z
X

DESI applicationsDESI and related ESI approaches by far most utilized ambient MS technique*
Rapid analysis pharmaceutical productExplosivesBiological imagingForensic imaging of inksIllegal and counterfeit drugsDrug metabolites in biological matricesChemical warfare agentsTextilesPeptides and proteinsProteomicsMetabolomicsPlants / natural productsFood contaminants…….
*Weston, Analyst 135 (2010) 661-668

Test MRL compliance: Homogenisation (+extraction) => deposit on spots/slides(semi) Quantitative analysis
DESI in food contaminants control
Consideration MRL verification ⇒ MRLs expressed in mg/kg whole product⇒ requirements minimum sample size
In laboratoryDESI for fast
high throughput analysis of extracts
In laboratoryFast high throughput analysis of sampleDistribution on surface/cross sections
In-field DESI as on-site detection tool
Food forensicscrops, swops, clothing, containers, syringes
Test presence (screening, yes/no)Direct detection from sample surfaceor cross-sections of tissuesNo sample preparationQualitative

Feasibility Dithiocarbamates by DESIFungicides, widely used, high application ratesNon-systemic (residues on surface only)
PBDC = propylenebis(dithiocarbamate)
DMDC = bis(dimethyldithiocarbamate)
thiram zirampropineb
maneb
EBDC = ethylenebis(dithiocarbamate)

Groups and examples of individual products to which the MRLs apply (a)
Dithiocarbamates (dithiocarbamates expressed as CS2, including maneb, mancozeb, metiram, propineb, thiram
and ziram)
Propineb (expressed as
propilendiamine)
Thiram (expressed as
thiram) Ziram
Apples 5 0,3 5 0,1*Pears 5 0,3 5 1Strawberries 10 (ft) 0,05* 10 0,1*Lettuce 5 0,05* 2 0,1*
Solubility issues
Stability issues
Current method: hydrolysis to CS2
Legislation (396/2005): CS2 (sum) but specific MRL for 3 DTCs
Dithiocarbamates

……..+ 10 mM NH4CH3COO
081114_01 #56 RT: 0.54 AV: 1 NL: 3.20E1T: ITMS + p ESI Full ms [100.00-500.00]
100 150 200 250 300m/z
0
10
20
30
40
50
60
70
80
90
100
Rel
ativ
e A
bund
ance
263.0
273.3
295.1261.3
238.8 293.2229.3
217.2 246.9120.0 193.2183.3
208.9130.2152.8
081114_02 #8-22 RT: 0.07-0.21 AV: 15 NL: 6.40T: ITMS + p ESI Full ms [100.00-500.00]
100 150 200 250 300m/z
0
10
20
30
40
50
60
70
80
90
100
Rel
ativ
e A
bund
ance
217.2
120.0 241.0
149.1
228.3
287.0267.1
244.1251.2
195.3152.0193.2
130.2
MS: 263 [M+Na](MS/MS weak 143) MS: 241 [M+H]
MeOH/water 1:1 , 0.1% FA
MS/MS optimization (thiram)
081114_08 #22-76 RT: 0.28-0.99 AV: 55 SB: 31 1.10-1.50 NL: 8.01T: ITMS + p ESI Full ms2 [email protected] [65.00-300.00]
100 150 200 250 300m/z
0
10
20
30
40
50
60
70
80
90
100
Rel
ativ
e A
bund
ance
195.9
88.1
120.0 172.9 223.0139.072.0 235.0
Product ion spectrum

DESI parametersNitrogen sheath gas Incident angleSpray tip-to-surface distanceSurface to MS-inlet distanceScattering angle DESI spray
FlowScanning of the surfaceHeated capillary MS (LXQ)Substrate
120 psi (9 bar)55o
5 mm1 mmca. 10o to surfaceMeOH/water 1:1+ 10 mM NH4For. + 0.1% FA5 µl/min250 µm/sec50oCPTFE printed on glass

Thiram stnd solutions (teflon spots on glass)
RT: 0.00 - 2.10 SM: 3G
0.0 0.5 1.0 1.5 2.0Time (min)
0
20
40
60
80
100
0
20
40
60
80
100
RT: 1.38MA: 185 RT: 1.63
MA: 321
RT: 0.98MA: 179
RT: 0.77MA: 70.37
RT: 0.52MA: 17.19
RT: 0.18MA: 0.00
1.52
1.121.26
2.020.56 1.94
RT: 1.03MA: 3586
RT: 0.51MA: 3888 RT: 0.76
MA: 4079RT: 0.28MA: 3581 RT: 1.50
MA: 2474RT: 1.26MA: 3095
1.65
1.060.55
2.020.05 1.81
NL: 9.07E1m/z= 195.50000-196.50000 F: ITMS + c NSI Full ms2 [email protected] [80.00-250.00] MS 100422_31
NL: 1.62E3m/z= 371.50000-372.50000 F: ITMS + c NSI Full ms2 [email protected] [110.00-450.00] MS 100422_31
0 0.1 0.25 0.50.75 1.0
mg/LThiram
ISTDmm 307.5 22.5

Quantitative analysis?
Cal Curve Thiram 0-1 mg/kg Average n=3
y = 0.1428x - 0.0057
R2 = 0.9761
0
0.02
0.04
0.06
0.08
0.1
0.12
0.14
0.16
0 0.2 0.4 0.6 0.8 1 1.2
mg/L ~ mg/kg →

Direct analysis from sample surface

Alternative to direct analysis
Homogenization (plant juices); simple extraction procedure followed by rapid DESI detection
Options extraction:
Systemic: QuEChERS or other
Non-systemic: solvent rinse of intact product

QuEChERS: 1. Initial Extraction Step
Weigh 10 g Sample
Add 10 mL MeCN
Shake Intensively
for 1 min
Slides from Anastassiades et al, (JAOAC, 2003)

2. Extraction/Partitioning Step
(Pre-)Weigh 4 g MgSO4 + 1 g NaCl
Add to the Tube
Shake Intensively
for 1 min
Slides from Anastassiades et al, (JAOAC, 2003)

3. Addition of ISTD and Centrifugation
Add ISTD
Shake for 30 s
Centrifuge (ca. 5 min)
Separated Raw Extract
Slides from Anastassiades et al, (JAOAC, 2003)

4. Dispersive SPE Step
(Pre-) Weigh MgSO4 and PSA
Add Extract to Tube and Shake ca. 30 s
Centrifuge (ca. 2 min)
Cleaned up Extract
Slides from Anastassiades et al, (JAOAC, 2003)

Surface extraction

RT: 0.00 - 1.90 SM: 5G
0.0 0.2 0.4 0.6 0.8 1.0 1.2 1.4 1.6 1.8Time (min)
0
20
40
60
80
1000
20
40
60
80
1000.28
0.370.57
0.62
1.13
1.03
0.781.36
1.56 1.840.080.30
0.580.34
0.79
1.34
1.08 1.110.86 1.39 1.851.511.26
0.07
NL: 4.15E3m/z= 195.50000-196.50000 F: ITMS + c NSI Full ms2 [email protected] [80.00-250.00] MS 100415_34
NL: 1.68E3m/z= 371.50000-372.50000 F: ITMS + c NSI Full ms2 [email protected] [110.00-450.00] MS 100415_34
x15
Comparison of extraction methods (pear)solvent
Surface extract
QuEChERSThiram
ISTD
w/o buffer acetate buffer
no dSPE w dSPE

Spike experimentsVegetables/fruits spiked with thiram std and commercial PPP (TMTD)
1.5 µl strawberry extracts Ref. std thiram

RT: 0.00 - 2.10 SM: 7G
0.0 0.5 1.0 1.5 2.0Time (min)
0
20
40
60
80
1000
20
40
60
80
1001.53
1.320.78
0.871.63
1.07 2.020.60 1.790.400.130.63
1.54
0.84 1.33
1.06 1.610.540.28 2.021.790.08
NL: 1.46E2m/z= 195.50000-196.50000 F: ITMS + c NSI Full ms2 [email protected] [80.00-250.00] MS 100422_11
NL: 6.75E2m/z= 371.50000-372.50000 F: ITMS + c NSI Full ms2 [email protected] [110.00-450.00] MS 100422_11
Control Control Control Control
Spiked Spiked Spiked Spiked ThiramThiramThiramThiram
Spiked Spiked Spiked Spiked TMTDTMTDTMTDTMTD
Strawberry MRL level
ISTD ISTD ISTD ISTD
Results

100422_20 #61 RT: 0.38 AV: 1 NL: 8.60E3F: ITMS + c NSI Full ms2 [email protected] [80.00-250.00]
80 100 120 140 160 180 200 220 240m/z
0
20
40
60
80
100
Rel
ativ
e A
bun
dan
ce
195.9
87.9120.0 223.0151.9 183.1 209.0188.2 197.0167.0131.4112.8 140.097.185.1
DaughterscanDaughterscanDaughterscanDaughterscan m/z 241 @ CE25 Solvent Standardm/z 241 @ CE25 Solvent Standardm/z 241 @ CE25 Solvent Standardm/z 241 @ CE25 Solvent Standard
100422_20 #175 RT: 1.09 AV: 1 NL: 1.28E2F: ITMS + c NSI Full ms2 [email protected] [80.00-250.00]
80 100 120 140 160 180 200 220 240m/z
0
20
40
60
80
100
Rel
ativ
e A
bun
dan
ce
196.0
223.2188.1
206.2
183.0 205.2 224.2149.3 209.287.9 163.3143.1117.3109.196.9 125.1 178.9
DaughterscanDaughterscanDaughterscanDaughterscan m/z 241 @ CE25 Strawberry spikedm/z 241 @ CE25 Strawberry spikedm/z 241 @ CE25 Strawberry spikedm/z 241 @ CE25 Strawberry spiked
Results

thiram ISTD ratio1 3333 5568 0.602 9398 7561 1.243 6124 5759 1.064 6552 6623 0.995 3414 5054 0.686 5117 5490 0.93
average 5656 6009 0.92RSD% 40 15 26av. Rec.% 85
Results
Recovery and repeatability (matrix-matched calibration)
Pears spiked (10 mg/kg)

Strobilurin fungicides (Biocop)
BioCopSchurek et al, Anal. Chem. 80 (2008) 9567-9575

Azoxystrobin MS/MS on m/z 404
071102_hho__20 #239 RT: 7.13 AV: 1 NL: 1.14F: ITMS + p ESI Full ms3 [email protected] [email protected] [100.00-1250.00]
120 140 160 180 200 220 240 260 280 300 320 340 360 380 400m/z
0
5
10
15
20
25
30
35
40
45
50
55
60
65
70
75
80
85
90
95
100
Re
lativ
e A
bu
nda
nce
344.08
316.08
303.00
287.00172.00
326.08
272.08244.00201.00144.83 216.00134.00 184.92160.92 260.92 357.33
071109_hho__13 #13-24 RT: 0.34-0.66 AV: 12 NL: 2.51E1F: ITMS + p ESI Full ms3 [email protected] [email protected] [100.00-500.00]
100 120 140 160 180 200 220 240 260 280 300 320 340 360 380m/z
0
5
10
15
20
25
30
35
40
45
50
55
60
65
70
75
80
85
90
95
100
Re
lativ
e A
bu
nda
nce
344.08
316.08
303.00
287.08171.92
329.00201.00 274.08210.00134.00 145.00 260.17196.92 354.25229.00 372.25115.83
Standard 20 ng/spot Ziptip extraction

strobilurin DESI from PTFE Reactive DESI silver cationization
Metominostrobin "Z" + + Metominostrobin "E" + + Fenamidone + +/- Kresoxim-methyl - + Dimoxystrobin +/- + Epoxiconazole + +/- Famoxadone - +/- Pyraclostrobin - + Orysastrobin - + Azoxystrobin + + Trifloxystrobin - + Fluacrypyrim - + Fluoxastrobin + + Picoxystrobin + +
Strobilurins: Reactive DESI
DESI: ACN/water/FA (80:20:0.1)reactive DESI: ACN/water (75:25) + 5 mg/ml AgCF3COOH flow 2.5 ul.min-1

Pesticides in/on vegetables/fruits
Garía-Reyes et al, Anal. Chem. 81 (2009) 820-829
Optimization of spray solvent

DESI parameters garcia et al
Nitrogen sheath gas Incident angleSpray tip-to-surface distanceSurface to MS-inlet distanceScattering angle DESI spray FlowScanning of the surfaceHeated capillary MS (LTQ)Substrate
150 psi (10 bar)55o
5 mm1.5 mmca. 10o to surfaceacetonitrile/water 8:2+1% FA5 µl/min?200oCPTFE

Garía-Reyes et al, Anal. Chem. 81 (2009) 820-829
QuEChERS w/o buffer + PSA clean up; extract diluted 1:3 in acetonitrile
Pesticides in/on vegetables/fruits

Direct detection of imazalil from lemon peel
Full scan spectrum of peel
MS/MS spectrum standard
MS/MS spectrum m/z 297 peel
MS/MS spectrum m/z 299 peel
Pesticides in/on vegetables/fruits

Pesticides in/on vegetables/fruits
using deuterated imazalil as ISTD

Reactive DESI analysis on steroidsSteroids in urineSPME enrichmentDirect detection from fiber
Spray 3µl/min:MeOH/water 1/1 0.05% HAc, 5% hydroxylamine
Huang et al, Anal. Chem. 79 (2007) 8327-8332

Steroid cocktailO:\D ata_ D ESIMS\...\0 70 91 2\0 70 91 2_ hh o __ 40 9/1 2/20 07 12 :4 5 :5 8 PM rik 1 67 46 92 .5 µ l/m in MeOH /0 .2 % FA 1 /1 in j. vo l.: 0 .0 0 00 00
07 09 12 _h h o_ _4 0 #3 1 R T: 0 .08 AV: 1 N L : 5 .1 4E3T: ITMS + c ESI Fu ll m s [50 .0 0 -1 2 50 .0 0]
27 0 28 0 2 90 30 0 3 10 32 0 3 30 34 0 35 0 3 60 37 0 3 80 3 9 0 4 00 4 1 0 42 0 4 30 44 0 4 50 4 6 0m /z
0
5
10
15
20
25
30
35
40
45
50
55
60
65
70
75
80
85
90
95
10 0
Re
lativ
e A
bu
nd
an
ce
3 11 .52
3 87 .3 3
31 5.55
4 13 .4 830 3.6 028 5.64
32 8.3 72 83 .5 7 3 01 .5 9
3 37 .4 532 5.34
2 97 .6 44 43 .463 8 8.49
3 29 .4 23 09 .5 7 4 1 4.5231 6 .5 136 5.39
27 1.6 7 44 4.5 033 8.5728 6 .6 5 3 17 .47 3 3 1.36 3 73 .3 035 7.4 0 39 1.3 92 7 9.57 34 5.28 40 3.42 4 22 .4 3 44 5.3 3 4 57 .4 93 81 .4 2 4 31 .1 52 95 .57
MeBol
ChlT�Ac
MeT/Noreth Fluoxy
Prog
MP�Ac
T�cyp
T�phep
T�deca

0 7 0 9 12 _ h h o __ 4 0 # 53 RT : 0 .14 A V: 1 NL : 1 .2 6 E3F: IT M S + c ES I d Fu l l m s2 3 0 1.6 4 @cid 3 5 .0 0 [7 0 .0 0 -6 1 5 .0 0 ]
1 00 1 5 0 2 0 0 2 50 3 0 0
m /z
0
5
1 0
1 5
2 0
2 5
3 0
3 5
4 0
4 5
5 0
5 5
6 0
6 5
7 0
7 5
8 0
8 5
9 0
9 5
1 0 0
Re
lativ
e A
bun
da
nce
2 8 3 .1 8
1 49 .0 1
2 8 4 .2 412 1 .0 2 17 3 .0 2
1 6 3 .0 4 1 8 7 .1 1 2 0 1 .0 52 27 .1 4 2 5 5 .051 0 6 .9 89 3.0 2 2 9 3 .3 3 3 19 .9 7
070912_hho__40 #2-35 RT: 0.03-0.08 AV: 3 NL: 2.81E2F: ITMS + c ESI d Full ms2 [email protected] [80.00-685.00]
100 120 140 160 180 200 220 240 260 280 300 320 340m/z
0
5
10
15
20
25
30
35
40
45
50
55
60
65
70
75
80
85
90
95
100
Re
lativ
e A
bun
da
nce
281.18
299.19
317.20
263.23241.09
223.10
239.16319.23
257.24225.06207.13
291.23237.17159.16 301.22173.05 221.15145.08 185.13
199.02131.00171.13 273.14 305.20121.02 229.18195.10 243.14142.96109.06
322.55 333.21309.16102.93
Steroid cocktailMethylboldenone MS/MS m/z 301 Fluoxymesterone MS/MS on m/z 337

RT: 0.00 - 2.25 SM: 7B
0.0 0.2 0.4 0.6 0.8 1.0 1.2 1.4 1.6 1.8 2.0 2.2Time (min)
0
5
10
15
20
25
30
35
40
45
50
55
60
65
70
75
80
85
90
95
100
Re
lativ
e A
bu
nda
nce
1.911.88
1.86
1.93
1.96
1.79
1.151.13
1.11
1.201.08
1.22
1.03
2.190.80 1.461.01 1.39 1.48
NL:9.98
TIC MS 081010_081010140847
RIC MS2
360>316
DESI conditions
MeOH/H2O/FA (50:50:0.1) at 1.5 µl/min
Angles: impact 60°, collection 10°
Distances: ESI-chip 3 mm; chip-inlet 6 mm
X-position scanrate 170 µm/s; # tracks: 3
Nitrogen 120 psi
#1
#2
081010_081010140847 #8-126 RT: 0.85-2.22 AV: 59 NL: 3.07E-1F: ITMS + c ESI Full ms3 [email protected] [email protected] [85.00-400.00]
100 120 140 160 180 200 220 240 260 280 300 320 340 360 380 400m/z
0
5
10
15
20
25
30
35
40
45
50
55
60
65
70
75
80
85
90
95
100
Rela
tive A
bund
anc
e
245.12
285.06204.06
268.36231.37 315.93
245
360
316
081010_081010140847 #82-118 RT: 1.71-2.13 AV: 19 NL: 3.35F: ITMS + c ESI Full ms2 [email protected] [95.00-400.00]
100 120 140 160 180 200 220 240 260 280 300 320 340
m/z
0
5
10
15
20
25
30
35
40
45
50
55
60
65
70
75
80
85
90
95
100
Re
lativ
e A
bu
nd
an
ce
316.21
342.09
340.19314.01
302.54 344.25161.06 325.39292.09279.34238.73 267.23116.86 173.84 209.03
316
342
360
245
360
316
360
316
081010_081010140847 #82-118 RT: 1.71-2.13 AV: 19 NL: 3.35F: ITMS + c ESI Full ms2 [email protected] [95.00-400.00]
100 120 140 160 180 200 220 240 260 280 300 320 340
m/z
0
5
10
15
20
25
30
35
40
45
50
55
60
65
70
75
80
85
90
95
100
Re
lativ
e A
bu
nd
an
ce
316.21
342.09
340.19314.01
302.54 344.25161.06 325.39292.09279.34238.73 267.23116.86 173.84 209.03
316
342
360
Direct detection of IA captured fluoroquinolone
SPR biosensor chipImmunoaffinity bound enrofloxacin
Nielen et al, Poster ISMS, Bremen, 2009

Alkaloids on Senecio jacobaea L. Stinking Willie
O
O
HO CH3
H3C
O
N
HO
CH2
+
O-
O
O
HO CH3
H3C
O
N
HO
CH2
Reduction
Senecionine N�oxide Senecionine
Unable to passively permeate membranes
Nontoxic
Metabolically safe
Able to passively permeate membranes
Toxic after bioactivation
Metabolically unsafe

071003_hho__29 #16 RT: 0.38 AV: 1 NL: 6.49E2T: ITMS + c ESI Full ms2 [email protected] [95.00-450.00]
100 150 200 250 300 350m/z
0
10
20
30
40
50
60
70
80
90
100
Rel
ativ
e A
bund
ance
308.14
280.10
262.18
154.98120.03 282.29234.11200.11 324.24162.06 306.11244.11146.05 190.19 335.04 353.69
Senecionine
MS/MS spectrum m/z 352
Alkaloids on Senecio jacobaea L. Stinking Willie

SummaryDESI a useful option for food contaminant analysis/controlLots of research in progress, many papers appearingLike other ambient techniques, pro’s and con’s
Features: - Direct detection from substrates, TLC, sensor chips, sample surface- Reactive DESI- Spatial resolution- Rapid detection/high throughput of sample(extracts)Quantitative determination possible with use of internal standard
Limitations:- Sensitivity (matrix suppression)- Reproducibility- MSn or high res required - residues => targeted detection

OutlookIn lab analysis:- Further improvement robustness- Rapid straightforward and selective extraction- More applications- Combi sources to extent scope
ASAP+DESI (Lloyd et al, Anal. Chem. 81, 2009, 9158)
Towards in-field:- optimization of nongeometry dependent DESI source- coupling of DESI with portable MS instruments- …..

Too much, too little, too fast, not clear?
Submitted to Trends in Analytical Chemistry (March 2010)

Thank you for your attention
© Wageningen UR
DESI, spray video
Venter, Nefliu, Cooks, Trends in Anal. Chem. 27 (2008) 284-290
DESI spray on surface video clip.wmv

DESI, Alternative geometries
Ifa et al, Analyst 135 (2010) 669-681

DESI, instrumentation