design activity framework for visualization design appear in ieee transactions on visualization and...
TRANSCRIPT

To appear in IEEE Transactions on Visualization and Computer Graphics
Design Activity Framework for Visualization Design
Sean McKenna, Dominika Mazur, James Agutter, and Miriah Meyer
Abstract— An important aspect in visualization design is the connection between what a designer does and the decisions thedesigner makes. Existing design process models, however, do not explicitly link back to models for visualization design decisions.We bridge this gap by introducing the design activity framework, a process model that explicitly connects to the nested model, a well-known visualization design decision model. The framework includes four overlapping activities that characterize the design process,with each activity explicating outcomes related to the nested model. Additionally, we describe and characterize a list of exemplarmethods and how they overlap among these activities. The design activity framework is the result of reflective discussions froma collaboration on a visualization redesign project, the details of which we describe to ground the framework in a real-world designprocess. Lastly, from this redesign project we provide several research outcomes in the domain of cybersecurity, including an extendeddata abstraction and rich opportunities for future visualization research.
Index Terms—Design, frameworks, process, cybersecurity, nested model, decisions, models, evaluation, visualization
1 INTRODUCTION
As the field of visualization matures, theories and models that cap-ture the how of visualization design have become more prevalent,from evaluation strategies [11, 29, 34, 49, 55] to the design process it-self [32, 37, 54, 55, 60, 66]. While these theories and models for thedesign process largely address the how of visualization design, theyfail to explicitly describe the connections of those actions back to thewhy of visualization design decisions — these design decisions aredescribed instead by separate design decision models [44, 45]. Fur-thermore, visualization design is known to be messy, iterative, andcomplex [16, 32, 54, 60, 61, 66], characteristics that are not fully de-scribed in existing visualization process models.
In particular, we encountered the insufficiencies of current visual-ization process models while working on a project with a multidisci-plinary design team consisting of 2 visualization experts, 2 designers,and 1 psychologist. Our team was tackling the challenge of redesign-ing an existing visualization tool in the area of cybersecurity. As ourteam attempted to adopt the nine-stage framework for conducting de-sign studies [54], we struggled to answer questions such as: If I’m notstarting from the beginning, where exactly am I in the design process?What are the range of methods that are useful at any given point? Whattypes of outcomes should I be working towards along the way? Howdo I know my outcomes are good, or even just good enough, whenbalanced against real-world constraints? We believe that these ques-tions point to a lack of actionability in current visualization processmodels, or a lack of implementable and immediately usable guidancethat helps a visualization practitioner explicitly navigate a real-worldvisualization design process.
On the other hand, the two designers in the group were accustomedto working with an iterative and open design process, and to explor-ing a broad range of methods for generating and evaluating outcomesthroughout. Consequently, the two designers brought different expe-riences and a unique set of insights and tools to our collaborative vi-sualization design process. Although other visualization researchersstress that design and creativity research methods can play an effec-tive role in visualization design [23,37,61], design research also tendsto more explicitly emphasize and highlight the complex nature of thedesign process [2, 9], as well as put an emphasis on constraints fordesign [48, 52]. It is not clear, however, how this design research ex-plicitly addresses or captures well-established visualization design de-
• S. McKenna and M. Meyer are with the School of Computing, Universityof Utah, Salt Lake City, UT, 84112. E-mail: [sean,miriah]@cs.utah.edu
• D. Mazur is with the Department of Psychology, University of Utah, SaltLake City, UT, 84112. E-mail: [email protected]
• J. Agutter is with the College of Architecture and Planning, University ofUtah, Salt Lake City, UT, 84112. E-mail: [email protected]
cisions, namely those described by the levels of the nested model [45].As a team, we struggled to reconcile the visualization design decisionswe wanted to make with these various creative process models.
By reflecting on our own design process as a team, we identified aneed for a process framework that balances the flexibility and action-ability of models from the design community with the explicit out-comes and decisions necessary for visualization design. To meet thisgoal, we propose the design activity framework to explicitly bridgethe gap between the activities that visualization designers do withthe visualization decisions they make. This framework is composedof four overlapping activities: understand, ideate, make, and de-ploy. Each activity has a specific motivation to help place the visu-alization designer within the framework, as well as defined, tangi-ble outcomes that relate to the levels of the nested model. Visual-ization designers produce outcomes in each activity using both gen-erative methods as well as evaluative ones — the breadth and for-mality of these methods can, and should, be dictated by the real-world constraints of a project. We developed the design activityframework to overcome shortcomings in existing visualization de-sign process models [16, 23, 32, 37, 54, 60, 66] and to incorporateideas from a broad range of models in HCI [47, 63, 68] and de-sign [1, 6, 10, 14, 27, 30, 36, 38, 56, 59, 65, 67–69].
The primary contribution of this work is the new design activityframework for providing actionable guidance throughout the visual-ization design process. This framework makes explicit the link be-tween the design process and visualization design decisions. In addi-tion, we provide two secondary contributions: first, an extensive listof exemplar methods for use throughout the design activity frame-work, drawing on both well-known methods from the visualizationcommunity as well as many less common methods found in the designliterature; and second, we use the context of our redesign project toillustrate how the details of a real-world design process are capturedby the framework. Lastly, we highlight a tertiary contribution fromour cybersecurity redesign project, where the framework enabled usto produce research insights at both the domain characterization andabstraction levels of the nested model.
We first introduce related design decision and process models inSection 2, and then frame our real-world visualization redesign projectin Section 3. In Section 4 we present the primary contribution of thispaper, the design activity framework, using our redesign project as anillustrative example. Next we highlight a secondary contribution ofexemplar methods in Section 5. Finally, in Section 6, we provide ourtertiary contribution in the field of cybersecurity including an exten-sion of an existing data abstraction and several key opportunities forfuture visualization research, followed by a general discussion of thedesign activity framework in Section 7.
1

2 RELATED WORK
Visualization research often involves the creation of new visual en-codings, interaction techniques, and systems. This process of makingsomething new is why design plays an integral role in research [19].As such, there exist a variety of different theoretical models for visual-ization design and even more that have been adapted and used by visu-alization designers. In this work we focus on two kinds of models forvisualization design: decision models and process models [44]. Deci-sion models capture the what and why of design by characterizing therationale behind the decisions that a designer makes. Process models,on the other hand, capture the how of design, characterizing the actionsthat a designer takes as a series of steps. Linking a process model to adecision model enables a visualization designer to verify and validatethe design decisions they make along each step of the design process.This is highlighted by Schon’s reflection-in-action concept, which em-phasizes that the process of doing and thinking are complementary toeach other [53]; thus, the design process and its many design decisionsare intricately interconnected.
2.1 Design Decision Models
Many researchers have explored the general act of decision making indesign. A detailed model by Christiaans and Almendra captures boththe mindset and strategies of designers, such as problem-driven versussolution-driven, along with specific operationalization of that mindset,or how decisions get made by an individual or a team, such as auto-cratic versus autonomic [12]. Similarly, Tang et al. characterize designdecisions into three groups: planning, problem space, and solutionspace decisions, in order to better realize the effect decisions have ondesign [58]. Through studying the process of expert designers, Wu etal. identify three classes of design strategies: forward working, prob-lem switching, and backward working strategies [69]. Furthermore,several researchers have broken down decision making into differentkinds of high-level design judgments: e.g. appearance, compositional,navigational, etc. [46, 68]. While these many models have a utilityto analyze and compare general decisions and strategies for design,these models do not capture the specific decisions that visualizationdesigners face when representing and encoding data in an interactivevisualization system.
Within the visualization community, the well-cited nestedmodel [45] is the de facto design decision model. This model charac-terizes visualization design decisions as occurring at one of four lev-els: domain characterization, data and task abstraction, visual encod-ing and interaction, and algorithm. A recent extension to the model,called the nested blocks and guidelines model [44], provides a morefine-grained characterization of individual design decisions as blocksat each level, with guidelines describing the relationships betweenblocks. Together, blocks and guidelines relate the visualization de-cisions a designer makes, with regard to finding good blocks in the de-sign of a visualization. It is important to stress that the nested model, aswell as the nested blocks and guidelines model, are not process mod-els; they do not describe how to design a visualization, only the typesof decisions (what) and rationale (why) that a visualization designerneeds to make along the way [44].
2.2 Design Process Models
Unlike a decision model, a design process model focuses on describ-ing the specific steps a designer takes over the course of designinga visualization. In this regard, we consider design as a challengewhich combines and mixes both engineering and creative design pro-cesses [27, 38, 61, 68], and this balanced mixture is what we sought inthe synthesis of the design activity framework. An engineering designprocess begins with a problem definition, where the overall processis largely sequential and convergent towards a single solution [38].On the other hand, a creative design process begins with more grad-ual problem scoping, and the process has many overlapping activitieswhere many different possibilities are explored before choosing a sin-gle solution [38]. As recognized by researchers in the design [27],HCI [38,68], and visualization [61] communities, the combination and
balanced mixture of these two types of process models is useful forcharacterizing the design process.
Visualization-specific design process models describe unique as-pects for designing and evaluating visualization systems; however,they largely do not connect back to visualization design decisions anddo not explicitly incorporate aspects of a creative design process. Theseminal research method of multidimensional longitudinal case stud-ies [55] proposes a process and specific methods for assessing andevaluating visualization systems deployed in the wild. This model,however, does not cover the creation and development of a visualiza-tion system. More abstracted design process models for visualizationhave also been proposed in a variety of forms — waterfall, cyclical,and spiral, respectively — to perform user-centered design [32,60,66],but they are solely engineering design process models. The designprocess model used by both Lloyd et al. [37] and Goodwin et al. [23]is drawn from an international standard on human-centered design,ISO13407, which has recently been updated, ISO9241-210 [16]. Thisstandard’s model describes different design activities as a cycle, em-phasizing an engineering approach. Goodwin et al. accompany thisengineering process model with specific methods for eliciting creativ-ity from end users [23], a step towards including aspects of a creativedesign process. Vande Moere and Purchase further characterize therole of design in visualization, arguing for a balanced approach thatmixes both creative and engineering aspects [61]. While the visualiza-tion community is beginning to embrace aspects of a creative designprocess, none of these process models explicitly link back to visual-ization design decisions.
The model closest to the design activity framework is the nine-stage framework for conducting design studies [54], which capturesthe steps from initial planning through the reflective analysis of a com-plete project. The middle core stages of the model describe the stepsinvolved with designing a visualization system, with four stages that,at a high level, are similar in motivation to the proposed design activ-ity framework. In some of these middle stages, the levels of the nestedmodel are mentioned, however an explicit description of what types ofoutcomes should be expected at each step is not described. Further-more, the model as a whole only loosely captures the overlapping anditerative nature of visualization design, as well as the role of evalua-tion throughout. The nine-stage framework, while the first model ofits kind to provide guidance for conducting design studies, does notgive actionable advice for knowing what stage a designer is in, whatkinds of methods to employ, or the specific outcomes and decisions adesigner should make, particularly in the middle four design stages.The design activity framework is largely inspired by the nine-stageframework, in particular to provide actionable guidance not currentlyavailable within this process model.
3 VISUALIZATION REDESIGN PROJECT
The motivation behind the design activity framework stems from ourexperience of working as a multidisciplinary visualization design teamon a redesign project. This seven-month long project focused on im-proving the usability and effectiveness of an existing, robust visual-ization system (RVS) for cybersecurity analysis. Analysts workingwith cybersecurity data focus on maintaining the security of com-puter networks, relying on data about how a network is functioning,known network attack patterns, and a broad range of external sourcesof knowledge. Specifically, our team was tasked with providing ideasand mock-ups for how to redesign the visualizations within RVS— theimplementation of these redesigns within RVS was handled by devel-opers at the company that developed and maintains RVS.
Over the course of our redesign project we worked with: devel-opers, researchers, and managers at the RVS company; several De-partment of Defense intrusion analysts that use RVS; and several cy-bersecurity analysts at the University of Utah. This redesign projectincluded several real-world constraints for our design team, namely astrict time frame for producing redesign ideas, limited funding avail-able for implementing our ideas by software developers, confidential-ity issues surrounding cybersecurity data, and the engineering realitiesof working within a large software system.
2
To appear in IEEE Transactions on Visualization and Computer Graphics
Design Activity
motivation understand
make
ideate
deploy
Four Activities
generative
narrow broad
evaluative
informal formal
methods
outcomes
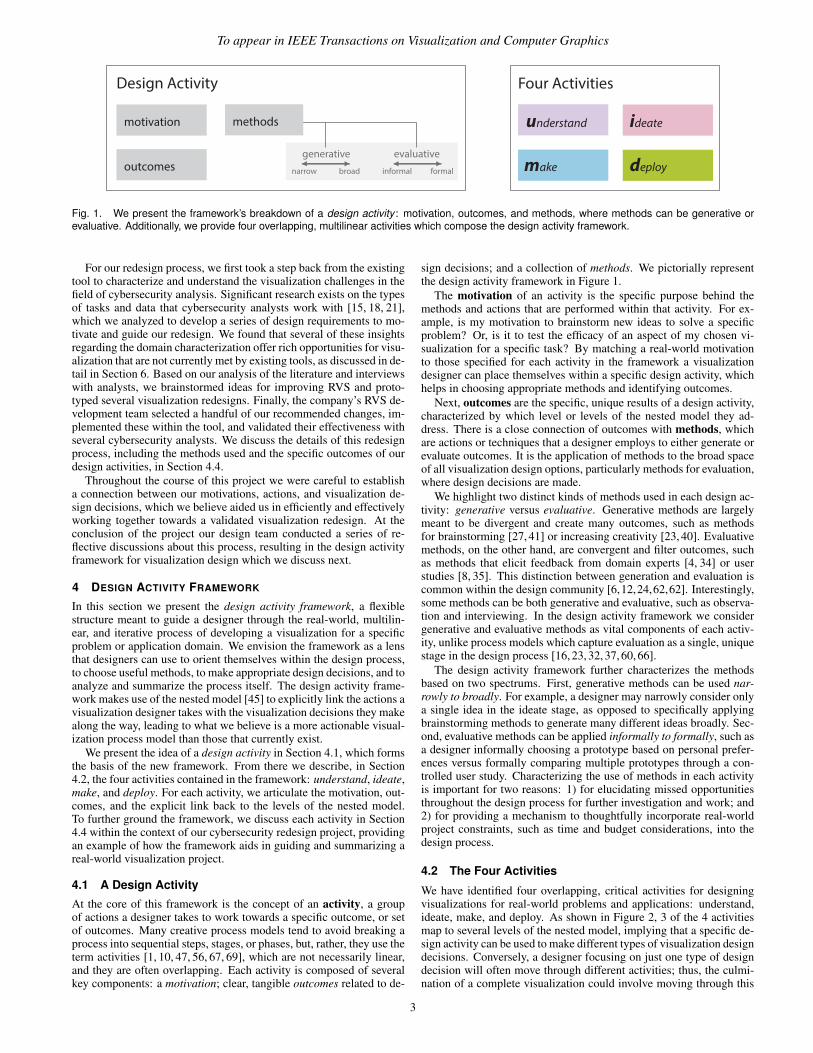
Fig. 1. We present the framework’s breakdown of a design activity : motivation, outcomes, and methods, where methods can be generative orevaluative. Additionally, we provide four overlapping, multilinear activities which compose the design activity framework.
For our redesign process, we first took a step back from the existingtool to characterize and understand the visualization challenges in thefield of cybersecurity analysis. Significant research exists on the typesof tasks and data that cybersecurity analysts work with [15, 18, 21],which we analyzed to develop a series of design requirements to mo-tivate and guide our redesign. We found that several of these insightsregarding the domain characterization offer rich opportunities for visu-alization that are not currently met by existing tools, as discussed in de-tail in Section 6. Based on our analysis of the literature and interviewswith analysts, we brainstormed ideas for improving RVS and proto-typed several visualization redesigns. Finally, the company’s RVS de-velopment team selected a handful of our recommended changes, im-plemented these within the tool, and validated their effectiveness withseveral cybersecurity analysts. We discuss the details of this redesignprocess, including the methods used and the specific outcomes of ourdesign activities, in Section 4.4.
Throughout the course of this project we were careful to establisha connection between our motivations, actions, and visualization de-sign decisions, which we believe aided us in efficiently and effectivelyworking together towards a validated visualization redesign. At theconclusion of the project our design team conducted a series of re-flective discussions about this process, resulting in the design activityframework for visualization design which we discuss next.
4 DESIGN ACTIVITY FRAMEWORK
In this section we present the design activity framework, a flexiblestructure meant to guide a designer through the real-world, multilin-ear, and iterative process of developing a visualization for a specificproblem or application domain. We envision the framework as a lensthat designers can use to orient themselves within the design process,to choose useful methods, to make appropriate design decisions, and toanalyze and summarize the process itself. The design activity frame-work makes use of the nested model [45] to explicitly link the actions avisualization designer takes with the visualization decisions they makealong the way, leading to what we believe is a more actionable visual-ization process model than those that currently exist.
We present the idea of a design activity in Section 4.1, which formsthe basis of the new framework. From there we describe, in Section4.2, the four activities contained in the framework: understand, ideate,make, and deploy. For each activity, we articulate the motivation, out-comes, and the explicit link back to the levels of the nested model.To further ground the framework, we discuss each activity in Section4.4 within the context of our cybersecurity redesign project, providingan example of how the framework aids in guiding and summarizing areal-world visualization project.
4.1 A Design Activity
At the core of this framework is the concept of an activity, a groupof actions a designer takes to work towards a specific outcome, or setof outcomes. Many creative process models tend to avoid breaking aprocess into sequential steps, stages, or phases, but, rather, they use theterm activities [1, 10, 47, 56, 67, 69], which are not necessarily linear,and they are often overlapping. Each activity is composed of severalkey components: a motivation; clear, tangible outcomes related to de-
sign decisions; and a collection of methods. We pictorially representthe design activity framework in Figure 1.
The motivation of an activity is the specific purpose behind themethods and actions that are performed within that activity. For ex-ample, is my motivation to brainstorm new ideas to solve a specificproblem? Or, is it to test the efficacy of an aspect of my chosen vi-sualization for a specific task? By matching a real-world motivationto those specified for each activity in the framework a visualizationdesigner can place themselves within a specific design activity, whichhelps in choosing appropriate methods and identifying outcomes.
Next, outcomes are the specific, unique results of a design activity,characterized by which level or levels of the nested model they ad-dress. There is a close connection of outcomes with methods, whichare actions or techniques that a designer employs to either generate orevaluate outcomes. It is the application of methods to the broad spaceof all visualization design options, particularly methods for evaluation,where design decisions are made.
We highlight two distinct kinds of methods used in each design ac-tivity: generative versus evaluative. Generative methods are largelymeant to be divergent and create many outcomes, such as methodsfor brainstorming [27, 41] or increasing creativity [23, 40]. Evaluativemethods, on the other hand, are convergent and filter outcomes, suchas methods that elicit feedback from domain experts [4, 34] or userstudies [8, 35]. This distinction between generation and evaluation iscommon within the design community [6,12,24,62,62]. Interestingly,some methods can be both generative and evaluative, such as observa-tion and interviewing. In the design activity framework we considergenerative and evaluative methods as vital components of each activ-ity, unlike process models which capture evaluation as a single, uniquestage in the design process [16, 23, 32, 37, 60, 66].
The design activity framework further characterizes the methodsbased on two spectrums. First, generative methods can be used nar-rowly to broadly. For example, a designer may narrowly consider onlya single idea in the ideate stage, as opposed to specifically applyingbrainstorming methods to generate many different ideas broadly. Sec-ond, evaluative methods can be applied informally to formally, such asa designer informally choosing a prototype based on personal prefer-ences versus formally comparing multiple prototypes through a con-trolled user study. Characterizing the use of methods in each activityis important for two reasons: 1) for elucidating missed opportunitiesthroughout the design process for further investigation and work; and2) for providing a mechanism to thoughtfully incorporate real-worldproject constraints, such as time and budget considerations, into thedesign process.
4.2 The Four Activities
We have identified four overlapping, critical activities for designingvisualizations for real-world problems and applications: understand,ideate, make, and deploy. As shown in Figure 2, 3 of the 4 activitiesmap to several levels of the nested model, implying that a specific de-sign activity can be used to make different types of visualization designdecisions. Conversely, a designer focusing on just one type of designdecision will often move through different activities; thus, the culmi-nation of a complete visualization could involve moving through this
3

mi dudomain characterization
data / task abstraction
encoding / interaction technique
algorithm design
Fig. 2. Here, we illustrate the overlap of the design activity frameworkwith respect to the levels of the nested model [45]. It is important tonote that all three inner levels of the nested model each exist acrosstwo activities in the framework; thus, a visualization designer must thinkcarefully about which levels of the nested model any process outcomecorresponds with.
framework in a complex, iterative, and multilinear fashion. By mul-tilinear we mean that a process combines forward, linear movementwith cyclic, backwards, and parallel movements.
Next, we articulate the unique motivations and outcomes for each ofthe four activities in the design activity framework. We present a list ofexemplar methods in Table 1, and a more extensive list in the Supple-mental Materials, with each method characterized by which activitiesit is effective for, and whether it can be used for generation, evalua-tion, or both — we provide a detailed discussion of these methods inSection 5.
4.2.1 Understand
The first activity in the framework is to understand the problem do-main and target users. The motivation for this activity is: to gather,observe, and research available information to find the needs of theuser. The outcomes of this activity are commonly referred to as de-sign requirements [16, 23, 30, 37, 43, 51]. We specifically characterizerequirements into one of three classes: opportunities, constraints, andconsiderations. Opportunities encompass the data and task abstrac-tion outcomes that have a potential to impact the work and field of thetarget users. They may also include higher level themes discoveredthrough the domain characterization, such as workflow inefficiencies.Constraints are rigid limitations from the project itself that the visu-alization designer must work with, such as tight deadlines or displaylimitations. Considerations, however, are a looser, more flexible formof constraints that a designer should strive to consider, such as the im-portance of aesthetics or usability. Together, these three classes ofoutcomes for the understand activity play a crucial role in all follow-ing activities, and they often get reconsidered, adjusted, and prioritizedthroughout the design process.
Outcomes for the understand activity fall into the outer two levelsof the nested model, the domain characterization and abstraction lev-els. These outcomes consist of acquired knowledge about the targetset of users, their domain-specific questions and goals, their work-flows, and the types of measurements or data they have acquired —this is referred to as situation blocks in the nested blocks and guide-lines model [44]. Furthermore, the outcomes also include contextualinformation about the project itself, such as real-world project con-siderations i.e. time, budget, expertise, etc. Outcomes can touch onthe abstraction level of design decisions through an identification ofthe tasks that users need to perform to reach their goals, as well asan initial data abstraction that describes the users’ measurements in astructured way.
4.2.2 Ideate
The second activity in the framework is the ideate activity, which hasthe motivation: to generate good ideas for supporting the understandoutcomes. The outcome of the ideate activity is a set of ideas thatare most often externalized in a variety of forms, from sketches to
wireframes to even low-fidelity prototypes. It is important to note thatthe act of externalizing an idea onto some medium often results in thegeneration of additional ideas as they become more concrete [19].
These ideas encompass design decisions made at both the abstrac-tion and technique levels of the nested model. More specifically, atthe abstraction level ideas reflect decisions made about how to struc-ture the data or derive new data types that will support the understandoutcomes. At the technique level the ideas reflect high-level design de-cisions about visual encoding and interaction technique choices basedon the abstraction decisions, such as choosing a specific visualizationtechnique, while ignoring lower level decisions about the details ofthat technique — exploring these low-level decisions is the functionof the make activity described in the next section. Thus, the ideateactivity supports very broad exploration of the high-level design spacefor supporting a specific problem, leaving more detailed design deci-sions to later activities. Ideation is commonly considered as a separateactivity in the design community [6,10,36,54,63,65,67], and this sep-aration highlights the different kinds of design decisions made withinthe visualization design process.
4.2.3 Make
The make activity is the third activity in the framework. This activ-ity’s motivation is: to concretize ideas into tangible prototypes. Theoutcome from the make activity is a set of prototypes, where proto-types are “approximations of a product along some dimensions of in-terest” [25]. These prototypes test aspects of design decisions made atthe inner two levels of the nested model, the technique and algorithmlevels. These prototypes explicitly explore the design decisions relatedto actualizing a specific visualization or interaction technique. Whilelow-fidelity prototypes can exist in the ideate activity, prototypes forthe make activity are usually of a higher fidelity and typically involveencoding of real data in order to evaluate the efficacy of the visualiza-tion technique for a specific problem. This activity is not just imple-menting a given design; rather, the activity, including development orcoding, also involves critical visualization design decisions [61].
We note that most engineering design process models couple theideate and make activities together — we believe that these two activ-ities have related, but different, motivations and hence outcomes forvisualization design, making their separation important for a carefulconsideration of all types of visualization design decisions. The ideateactivity is meant to free the designer from focusing on low-level de-sign decisions in order to broadly consider more abstract ones. Themake activity, on the other hand, focuses the designer on the low-leveldesign decisions necessary to actualize an idea into a concrete, testableprototype, such as the details of how to encode a data item or whichalgorithms to utilize.
4.2.4 Deploy
The fourth activity in the framework is the deploy activity, with themotivation: to bring a prototype into effective action in a real-worldsetting in order to support the target users’ work and goals. The over-all outcome of this activity is a usable visualization system. This activ-ity and its methods are largely dominated by those from software en-gineering, with the focus of supporting target users utilizing the tool.Thus, the outcomes of the deploy stage touch on decisions made atthe algorithm level of the nested model, as well as other decisionsthat are not necessarily about the visualization design itself, such asintegration with existing software, databases, etc. This activity is theultimate goal of problem-driven visualization design since it supportsreal-world users in their own work environments.
4.3 Flow of the Framework
In our experience, a visualization design process never seems toprogress cleanly through a set of designated stages; this fact motivatedour synthesis of the design activity framework, which can be piecedtogether in many different ways to best suit the needs of a project.This aligns with creative process models from the design community
4

To appear in IEEE Transactions on Visualization and Computer Graphics
plan
artifact analysis
literature review
open coding
identify key opportunities
concept sketches
analysts interview
developer interview
wireframes
time series ideation
interface mockups
developer prototype
A/B testing + questionnaire
May Jun Jul Aug Sep Oct Nov
2nd deadline 3rd deadline final deadline1st deadline
m d u i u u i i m
Fig. 3. This timeline provides a concise overview of our redesign project. Key design activities are located in the middle, highlighting bothbackwards movement and activities nesting within each other when team members worked separately. Our redesign project contained several keytime constraints, or deadlines, listed at the top. Towards the bottom, we highlight numerous methods and outcomes utilized throughout our project.
which already emphasize that design is messy, iterative, and multilin-ear [13, 33, 59]. These creative process models advocate that there isno one right way in which to engage in the activities of a framework.
There are two basic principles for the design activity frameworkwhen it comes to the flow of the design process. First, the activitiesare ordered when moving forward: understand, ideate, make, deploy.While a project can start with any activity, as with our cybersecurity re-design project which started from a tool in the deploy activity, forwardmovement must happen in an ordered fashion, even if the methodsused are very narrow and informal. Backward movement, however,can move to any previous activity. The second principle is that activ-ities can be nested or conducted in parallel, meaning that forward orbackward movement to a different activity can happen within an activ-ity, such as revisiting an understanding while brainstorming new ideas,or as two activities that occur concurrently. Taken together, these twomovement principles support both iteration and multilinearity.
Other visualization process models are also characterized in simi-lar ways, supporting ordered forward movement with iteration [16,32,54, 60, 66], and others that suggest an overlap between stages, suchas the nine-stage framework [54] and the international standard forhuman-centred design activities [16]. These models, however, are of-ten represented linearly or cyclically and imply the need to start at thebeginning of the process, making it difficult, for example, to capturethe process of a visualization redesign project.
To further illustrate the two movement principles we provide a time-line for our redesign project in Figure 3, where activities are repre-sented as colored boxes — we discuss our process in more detail inSection 4.4 This timeline shows the flow of the project through mul-tiple activities, including nested activities and both forward and back-ward movement. The timeline is annotated with many of the methodswe used and the outcomes we developed in our redesign process.
Other researchers have shown the feasibility and usefulness of adesign process timeline as an effective way to communicate a designprocess [43, 64], to foster collaboration [5], and to highlight some as-pects of the multilinear nature of a design process [1,68]. Communica-tion of the design process is important for not only understanding andevaluating the visualization research process itself, but also to supportreplicability of problem-driven work. Visualization models like thenested model [45] are now widely used to communicate design deci-sions made over the course of a visualization process, and we advocatefor the design activity framework to structure communication of a vi-sualization design process in a similar way.
4.4 Redesign Project: an Example
To provide context and ground the design activity framework in a real-world example, here we will walk through our redesign project anddescribe our design process using the framework. This section focuseson each activity of our redesign, presented in rough, chronologicalorder, and focusing on the methods we used and the outcomes weachieved. We will refer to methods listed in Table 1 using a prefix,such as the method of controlled experiments (M-28). We note thatthis description is a simplification of our process for the purposes of
illustration — Figure 3 presents further details.
4.4.1 Deploy — Redesign ProjectSince our redesign project focused on analyzing an existing visual-ization system, the RVS, we started our design process in the deployactivity. Rather than test RVS and simply clean up usability and aes-thetic issues, however, our design team was tasked with thinking ofthe broader task of cybersecurity analysis, the needs of users withinthat workflow, and the role of visualization for exploring computernetwork data. Ultimately, the RVS company was interested in incor-porating new visualization components into their tool.
Although deploy is commonly the final activity for a completed,successful visualization system, evaluating a deployed system may re-boot the entire design process to any earlier activity in order to extend,edit, or even redesign the system. In our redesign project we startedin the deploy activity with the existing RVS tool as the given deployoutcome, forming a constraint within our project. We received a copyof RVS in order to understand what needs it currently addressed andwhat constraints it already contained. We used a walkthrough tutorialand sample dataset (M-75) built by the RVS company to explore thefeatures and efficacy of the tool. Our analysis of RVS revealed that itwas necessary for us to take a step back to the understand activity sothat we could better discern the needs of cybersecurity analysts. Wehave not yet returned to the deploy activity as the RVS company is stillinvolved with major redesigns of the tool.
4.4.2 Understand — Redesign ProjectThe field of cybersecurity analysis has many types of users, from thosewithin companies that maintain their own networks, to the militarywhich maintains and monitors traffic across a global network grid. Anumber of cognitive scientists have spent significant time observingand interviewing cybersecurity analysts [15,18,21] across these differ-ent facets — we used the published work from these experts to formour base understanding of the field as we had limited access to cyber-security experts ourselves. First we conducted an extensive and broadliterature review (M-53) across a series of forty articles from severalkey domains: cybersecurity visualization, situational awareness, andcognitive task analysis. From this review we informally evaluated thearticles based on their relevance and descriptive quality, isolating threeof the articles as the best representative samples with the highest im-pact for forming our domain characterization.
Next, for these three articles each member of our team did an in-formal open coding of the papers (M-16) to pull out salient themes.As individuals we tagged information broadly, and we then adjustedthese tags as a team over a series of meetings to organize and consoli-date the key insights we pulled from the papers. These insights formedour initial set of outcomes, which pointed to a number of unmet needsand opportunities for visualization research. Some of these outcomesincluded opportunities such as: supporting provenance-based tasks,increasing the scalability of visualizations to real-world datasets, pre-serving data context as it is filtered across many different visualiza-tions, and optimizing the representations of temporal data.
5

a) b)
This is a sort of squished version of the overview screen. When content from the overview screen is explored in greater detail it automatically condences into this side bar format. The user can then toggle through
in the overview screen. This information is also live and auto updates as new messages and data are pushed through.
Here the message that is being examined is heighlighted making it clear to the user where this informa-tion is comming from and in what context.
Here there is a set of information that the message sender had linked to their message. In this case the message sender linked a recent user activity that had been saved. These windows auto populate allowing the message recever to assimilate the information quickly.
MENU BAR USER NAME
ALERTS
MESSAGES
NETFLOWUSER ACTIVITY
ANDREW SMITH 9:20 AM
Mauris sit amet ante metus. Cras eu vestibu-lum mi. Morbi condimentum urna vel nulla rhoncus tincidunt. Donec tortor dolor, suscipit et ornare non, mollis quis arcu. Proin aliquet non ipsum vel fermentum. Nam turpis lorem, ornare eget erat in, feugiat luctus massa. Donec eu risus enim. Mauris vestibulum augue id iaculis mollis. Nunc mollis rhoncus mi, ac lobortis nisl tempus ac.
9:20 AMJILL WHITEMauris sit amet ante metus. Cras eu vestibulum mi. Morbi condimentum urna vel nulla rhoncus tincidunt. Donec tortor dolor, suscipit et ornare non, mollis quis arcu. Proin aliquet non ipsum vel fermentum.
9:20 AMALLEN BOREMauris sit amet ante metus. Cras eu vestibulum mi. Morbi condimentum urna vel nulla rhoncus tincidunt. Donec tortor dolor, suscipit et ornare non, mollis quis arcu. Proin aliquet non ipsum vel fermen-tum.
9:20 AMALLEN BOREMauris sit amet ante metus. Cras eu vestibu-lum mi. Morbi condimentum urna vel nulla rhoncus tincidunt. Donec tortor dolor, suscipit et ornare non, mollis quis arcu. Proin aliquet non ipsum vel fermentum. Nam
Topology for Network Model Alerts
Real Time Attack Graph
CONTENT LINKED TO JILL’S MESSAGE
HOST NAME IP ADDRESS
DB_Server1 192.168.03
DB_Server1 192.168.03
DB_Server1 192.168.03
DB_Server1 192.168.03
DB_Server1 192.168.03
DB_Server1 192.168.03
DB_Server1 192.168.03
DB_Server1 192.168.03
DB_Server1 192.168.03
DB_Server1 192.168.03
DB_Server1 192.168.03
DB_Server1 192.168.03
DB_Server1 192.168.03
DB_Server1 192.168.03
DB_Server1 192.168.03
c) d) e)
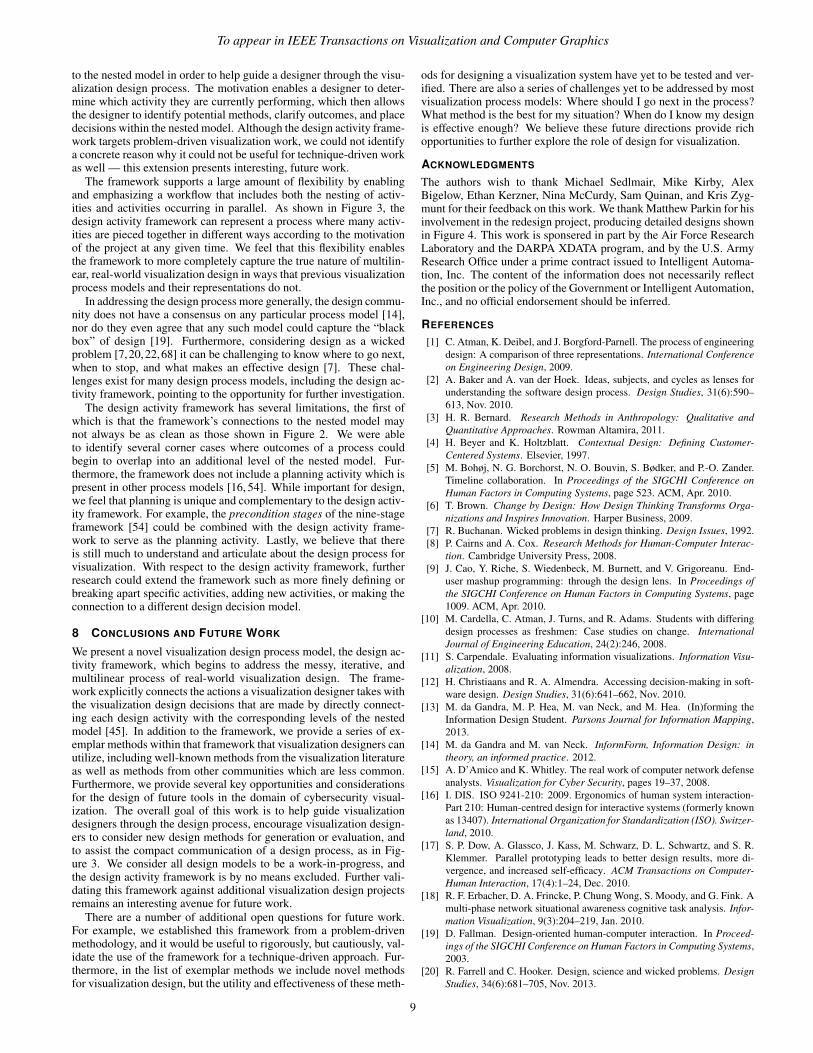
Fig. 4. We provide an overview of the outcomes for our redesign project, starting from our a) software analysis which resulted in b) initial conceptsketches and c) wireframes. As we focused on more of the details, we moved into the make activity with d) laying out interface components and e)designing a fully-detailed revised interface. These outcomes are provided at full-resolution in the Supplemental Materials.
We revisited the RVS system with these opportunities in mind.Since we were working with an existing, deployed version of the RVSsoftware, we performed a broad artifact analysis (M-8) on the cur-rent software architecture, illustrated in Figure 4a. By examining theworkflow supported by RVS we identified which opportunities the toolalready supported, which aspects of the tool could be improved, andevaluated these against our initial list of opportunities. These findingswere combined with our project-specific constraints and considera-tions, which included: four months of the design team’s time; onemonth of a developer’s time; and existing visual conventions in thefield such as highlighting critical alerts in red.
Lastly, we conducted a series of semi-structured interviews withdifferent stakeholders to identify needs and aspirations (M-51), wherethese stakeholders included a developer that works on RVS and sev-eral cybersecurity analysts at the University of Utah. Based on thisfeedback, we met as a design team and informally evaluated and fil-tered the list of opportunities by reaching a group consensus on thosewe felt best met the unmet needs of our target users, balanced againstthe strengths and weaknesses of RVS and taking into account the real-world constraints and considerations of the project. The final thematicdesign opportunities for our redesign were: 1) usability; 2) workflowimprovements; 3) desirability; and 4) temporal data representation.We also developed a more low-level list of all outcomes, which in-cluded a detailed data and task abstraction.
4.4.3 Ideate — Redesign Project
After our design team had identified the specific design opportuni-ties, constraints, and considerations for our redesign, we were readyto come up with ideas. This activity took up several months worth oftime as we sketched out a series of possible ideas for modifying thecurrent design of RVS. First, each member of our team began to de-velop separate concept sketches (M-23) tackling a specific opportunity,as illustrated in Figure 4b — we chose this first method based on theexperience of the designers in our group as they were used to sketch-ing out possible concepts. We then came together as a team to reviewthese sketches and evaluate them based on which ones possessed themost potential for impacting a redesign of RVS. This evaluation pro-cess was very informal; we met as a design team and discussed someof the pros and cons for each concept, ultimately coming to a groupconsensus. These meetings were conducted as informal design cri-tiques. We also shared a subset of these idealized sketches with theresearchers and managers at the RVS company in order to further val-idate, filter, and confirm the different design concepts.
The ideas and concept sketches relied on two key data abstractionsthat we identified: computer networks and time series data. For exam-ple, one of our ideas for the visualization of a computer network is a
simplification of the nodes into sub-groups and supporting details-on-demand in order to allow the visualization to scale to larger dataset.For the time-series data we explored ideas for derived data, such asnetwork alerts or general traffic and activity. For each data type we ex-plored various encodings and interaction techniques that would scaleto different levels of the data; this scaling is very critical due to thequantity and spread of real-world cybersecurity data.
While the concept sketches proved to be useful in exploring dif-ferent ideas, we wanted to explore some of these ideas in more depthand detail. Thus we synthesized the paper concept sketches into verylow-fidelity paper prototypes (M-61) that highlighted interactions in-side the tool. These ideas were eventually finalized into more concretewireframes (M-98), shown in Figure 4c, to mimic the look and feelof a real tool. Again, we evaluated these wireframes very informally,internally as a design team and with different members of the RVScompany, to check that our redesigns were on track for meeting theanalysts’ needs. Due to the main constraint of time within the projectwe were unable to evaluate these wireframes more formally with an-alysts. These sketches and wireframes formed the outcomes of ourideate activity.
4.4.4 Make — Redesign Project
The make activity was conducted in part by our design team and alsoin part by the RVS development team. As a design team we gener-ated a number of digital mockups; several of these were detailed wire-frames (M-98) that focused on the layout of different visualizationsand interaction mechanisms, as shown in Figure 4d. In addition, wealso mocked up more detailed prototypes (M-67) that showed how thedifferent visualizations would link together through user interactions.These prototypes synthesized all of our design ideas into an idealized,revised interface, as illustrated in Figure 4e. The purpose behind thismethod was to envision what RVS could be even though the softwareimplementation was beyond the scope of what the developers couldachieve given the constraint of one-month of their time.
After we finalized these detailed and revised mockups, the RVSdevelopment team focused on implementing these concepts into theexisting software. We note that the distinction here between the de-sign team and development team is somewhat unique to our redesignproject — most often in visualization design these two groups of peo-ple are the same. As a result of this implementation process, the devel-opment team created a software prototype (M-67), which they evalu-ated with several network security analysts who work with RVS. TheRVS company sought a quick and easy approach to minimize the timeneeded by analysts to participate; thus, this evaluation consisted ofan A/B testing method (M-1) coupled with a questionnaire (M-69).This evaluation received positive feedback over the previous version
6

To appear in IEEE Transactions on Visualization and Computer Graphics
of RVS, which we took as a validation of the design ideas that had be-came concretized within the final outcome: a new prototype of RVS.
5 EXEMPLAR METHODS
As a secondary contribution to this work, we present a list of exem-plar methods that can be used throughout the design activity frame-work. This list contains methods commonly found in the visualizationliterature, as well as many more that come from the design, human-computer interaction, software engineering, sociology, and anthropol-ogy literature. We present a shortened list of 40 methods in Table 1,and a more extensive list of 100 methods in the Supplemental Mate-rials. We shortened to these 40 methods by picking those which werementioned within the framework and redesign project, along with bothcommonly used and potentially novel or interesting methods for visu-alization design.
Each method is characterized as to which activities of the designactivity framework it can be used — understand (u), ideate (i), make(m), and deploy (d). It is important to note that many methods canand often are used in different design activities. The methods are alsocategorized as being either generative (g), evaluative (e), or both innature. There are several methods, e.g. graffiti walls (M-43), inter-viewing (M-51), and observation (M-58), which have more complexcharacterizations than presented in this table; please see the Supple-mental Materials for a more complete and detailed characterization.Some methods are also marked as appearing within the visualizationliterature (v). Finally, each method includes a definition and referenceto aid visualization designers in bringing these methods into practice.As the design activity framework targets problem-driven visualizationwork, it is worth noting that many of the listed methods involve do-main experts, such as bull’s-eye diagramming (M-12), contextual in-quiry (M-27), paper prototyping (M-61), and speed dating (M-80).
The list is by no means a complete compendium of methods for vi-sualization design, but rather a step towards understanding the largespace of actions a designer can take throughout the design process.Our goal in creating this list of methods is two-fold: first, the listserves as additional guidance for real-world, actionable usage of thedesign activity framework by finding potential methods within a spe-cific design activity; and second, the list contains many methods thatare not commonly, if at all, found in the visualization literature, there-fore providing new methods to potentially enhance the visualizationdesign process. For example, Goodwin et al. introduce several novelcreativity techniques for visualization design such as generating ideasusing the method of constraint removal (M-26) [23].
6 RESULTS OF THE REDESIGN PROJECT
A tertiary contribution of this work are several understand outcomeswhich consist of new considerations and rich opportunities for cyber-security visualization design — these types of domain characterizationand abstraction contributions have been advocated by others [44, 45].These outcomes were identified through both the open coding and in-terviews, as explained in Section 4.4.2. The new design considera-tions we introduce are a new data abstraction and a vital feedbackloop for cybersecurity analysis. These considerations stem from theoriginal data hierarchy model presented in a cognitive task analysis byD’Amico and Whitley, which illustrates how analysts process, filter,sort, and select important information out of the data and transformthat raw data into situational awareness for cybersecurity [15] (seeFigure 1 in their paper). In their work, analysts start with raw data,or network packets, and filter data from alerts to events and eventu-ally to rule sets, or high-level descriptions of a collection of multipleincidents. Based on our research and interviews, however, there areseveral other key types of data that analysts use: internal or “in-house”data such as firewall rules or incident reports; external data such ashacker websites and mailing lists; and processed output data, i.e. inci-dent reports. Additionally, rule sets often become detection signaturesto automatically filter raw data, creating a feedback loop in the ana-lysts’ workflow. This idea of a feedback loop is not new; we saw themin several different task diagrams for cybersecurity analysts [15, 18].Ideally, incident reports and other processed data by analysts would be
internalraw
rule sets
[DATA INPUTS]
[OUTPUTS]
external
incidentreports
Fig. 5. We present a simplified extension of a data hierarchy model forhow cybersecurity analysts transform raw data into cybersecurity situ-ational awareness [15]. This simplified model focuses on a novel dataabstraction: new data types such as internal data which is kept “in-house”, external data which may be shared or obtained from websites,social media, phone calls, etc., as well as processed data like incidentreports. There exists a data feedback loop from rule sets back to rawdata, and, ideally, such a loop would exist for incident reports, but this isan active research problem in this domain.
incorporated into this feedback loop, but currently this is difficult to dosince incident reports are disparate and not easily searchable [15]. Wepresent a new data abstraction for the data hierarchy model in Fig-ure 5, highlighting the additional data types as well as an idealizedfeedback loop from incident reports to internal data, and external dataif shared. This model established several key considerations for ourredesign process, and we suspect it could similarly aid future cyberse-curity visualization tools to better address the needs of analysts.
Based on our literature review, interviews, and new data abstractionwe identify several open opportunities for visualization in the fieldof cybersecurity: provenance; data type handling; and data hierar-chy continuity. For provenance, visualization researchers could focuson providing tools for analysts to track and document their findingswhile using a visualization tool to explore their data, ultimately for thepurpose of automatically generating reports and sharing their analysisprocess [15, 18]. The opportunity of data type handling would seek tovisualize a broader variety of data types, such as a variety of externaldata coming from websites, social media, images, etc. [21]. Lastly,related to the data hierarchy model, the continuity opportunity pointsto finding ways to scale visualizations to the current, massive datasetswhile retaining the ability to go back to the raw data [15, 18, 21].
7 DISCUSSION
Throughout our redesign project we worked closely as a design teamcomposed of designers, a psychologist, and visualization experts. Ourdifferent perspectives and experience led to a richer and more informeddesign process. When working together as a team we found that hav-ing common terms and definitions for design was critical in promotingeffective and efficient communication among all members — as such,we spent significant time and effort learning from each other to betterunderstand, and speak in, each other’s domain languages [31]. This al-lowed us to synthesize the ideas and perspectives on the design processfrom several different fields into the design activity framework.
As a process model, the main goal of the design activity frame-work is to guide visualization designers through a design process —we believe that the framework will be useful to those with a broadrange of expertise. The actionability of the framework stems from theinclusion of more than just activities and methods, as is done in othermodels like the nine-stage framework [54]. Specifically, the design ac-tivity framework also includes motivations, outcomes, and explicit ties
7

Tabl
e1.
This
tabl
epr
esen
tsse
vera
lexe
mpl
arm
etho
dsan
dw
here
they
fitw
ithin
the
fram
ewor
k;w
epr
ovid
ea
mor
eex
tens
ive
listo
f100
met
hods
inth
eS
uppl
emen
talM
ater
ials
.W
eco
ded
each
met
hod
into
one
orm
ore
ofth
efo
urde
sign
activ
ities
:un
ders
tand
(u),
idea
te(i
),m
ake
(m),
and
depl
oy(d
).A
dditi
onal
ly,w
eta
gged
whe
ther
each
met
hod
was
larg
ely
gene
rativ
e(g
)ore
valu
ativ
e(e
),or
both
.La
stly
,we
tagg
edth
em
etho
dsw
eha
vese
enco
mm
only
repo
rted
with
inth
evi
sual
izat
ion
com
mun
ity(v
)and
also
pres
ents
ucci
nctd
efini
tions
fore
ach
met
hod.
#m
etho
du
im
dg
ev
defin
ition
1A
/Bte
stin
grr
rr“c
ompa
retw
ove
rsio
nsof
the
sam
ede
sign
tose
ew
hich
one
perf
orm
s..
.bet
ter”
[42]
7ap
pear
ance
mod
elin
grr
rr“r
efine
dm
odel
ofa
new
idea
that
emph
asiz
esvi
sual
styl
ing”
[50]
8ar
tifac
tana
lysi
sr
rrr “s
yste
mat
icex
amin
atio
nof
the
mat
eria
l,ae
sthe
tic,a
ndin
tera
ctiv
equ
aliti
esof
obje
cts”
[42]
12bu
ll’s-
eye
diag
ram
min
grr
r“g
athe
rase
tofd
ata
(e.g
.iss
ues,
feat
ures
,etc
.)...
.plo
tthe
data
onth
eta
rget
[dia
gram
],an
dse
tpri
oriti
es”
[50]
13bu
ya
feat
ure
rrr
r“e
xpre
sstr
ade-
offd
ecis
ions
....
ask
[par
ticip
ants
]to
purc
hase
feat
ures
....
enco
urag
eth
emto
[jus
tify
deci
sion
s]”
[50]
16co
ding
rrr
rrr “b
reak
data
apar
tand
iden
tify
conc
epts
tost
and
fort
heda
ta[o
pen
codi
ng],
[but
]als
oha
veto
puti
tbac
kto
geth
erag
ain
byre
latin
gth
ose
conc
epts
[axi
alco
ding
]”[5
7]22
conc
eptm
apr
r“s
ense
-mak
ing
tool
that
conn
ects
ala
rge
num
bero
fide
as,o
bjec
ts,a
ndev
ents
asth
eyre
late
toa
cert
ain
dom
ain”
[42]
23co
ncep
tske
tchi
ngr
rr “c
onve
rtid
eas
into
conc
rete
form
sth
atar
eea
sier
toun
ders
tand
,dis
cuss
,eva
luat
e,an
dco
mm
unic
ate”
[33]
26co
nstr
aint
rem
oval
rrr
r “bar
rier
s[a
re]t
rans
form
edin
toa
posi
tive
reso
urce
thro
ugh
whi
chto
crea
tene
wid
eas”
[23]
27co
ntex
tual
inqu
iry
rrr
r “go
whe
reth
ecu
stom
erw
orks
,obs
erve
the
cust
omer
ashe
orsh
ew
orks
,and
talk
toth
ecu
stom
er”
[4]
28co
ntro
lled
expe
rim
ent
rrr
rrr “h
elp
usto
answ
erqu
estio
nsan
did
entif
yca
sual
rela
tions
hips
”[3
5]&
“wid
ely
used
appr
oach
toev
alua
ting
inte
rfac
esan
dst
yles
ofin
tera
ctio
n,an
dto
unde
rsta
ndin
gco
gniti
onin
the
cont
exto
fint
erac
tions
with
syst
ems”
[8]
29cr
eativ
em
atri
xr
r“[
spar
k]ne
wid
eas
atth
ein
ters
ectio
nsof
dist
inct
cate
gori
es..
..en
cour
age
the
team
sto
fille
very
cell
ofth
egr
id”
[50]
35ex
ampl
eex
posu
rerr
rr “e
xcite
idea
sby
expo
sing
the
subj
ectt
oa
solu
tion
fort
hesa
me
prob
lem
”[2
6]38
field
note
s(d
iary
,jou
rnal
)r
rr“f
ourt
ypes
offie
ldno
tes:
jotti
ngs,
the
diar
y,th
elo
g,an
dth
eno
tes”
&“k
eep
ano
tepa
dw
ithyo
uat
allt
imes
and
mak
efie
ldjo
tting
son
the
spot
”&
“adi
ary
chro
nicl
esho
wyo
ufe
elan
dho
wyo
upe
rcei
veyo
urre
latio
nsw
ithot
hers
”[3
]42
fram
eof
refe
renc
esh
iftin
gr
r“c
hang
eho
wob
ject
ives
and
requ
irem
ents
are
bein
gvi
ewed
,per
ceiv
ed,a
ndin
terp
rete
d”[2
6]43
grafi
ttiw
alls
rrrr
rr“o
pen
canv
ason
whi
chpa
rtic
ipan
tsca
nfr
eely
offe
rthe
irw
ritte
nor
visu
alco
mm
ents
,dir
ectly
inth
eco
ntex
tofu
se”
[42]
44he
uris
ticev
alua
tion
rrrr
“ass
ess
anin
terf
ace
agai
nsta
seto
fagr
eed-
upon
best
prac
tices
,oru
sabi
lity
’rul
esof
thum
b”’[
42]
48im
port
ance
/diffi
culty
mat
rix
rrr
r“p
lotti
ngite
ms
byre
lativ
eim
port
ance
and
diffi
culty
...l
ook
forr
elat
edgr
oupi
ngs,
and
setp
rior
ities
”[5
0]49
incu
batio
nr
r“a
ddpr
ogra
mm
edde
lay
toal
low
sub-
cons
ciou
spr
oces
sing
tota
kepl
ace”
[26]
51in
terv
iew
ing
rrrr
rrr “d
irec
tcon
tact
with
part
icip
ants
,[co
llect
]per
sona
lacc
ount
sof
expe
rien
ce,o
pini
ons,
attit
udes
,and
perc
eptio
ns”
[42]
53lit
erat
ure
revi
ewr
rrr “d
istil
linf
orm
atio
nfr
ompu
blis
hed
sour
ces,
capt
urin
gth
ees
senc
eof
prev
ious
rese
arch
”[4
2]54
love
/bre
akup
lette
rsrr
rrrr
“per
sona
llet
terw
ritte
nto
apr
oduc
t...
[to
reve
al]p
rofo
und
insi
ghts
abou
twha
tpeo
ple
valu
ean
dex
pect
”[4
2]56
min
dmap
ping
rr
“vis
ualt
hink
ing
tool
that
can
help
gene
rate
idea
san
dde
velo
pco
ncep
tsw
hen
the
rela
tions
hips
amon
gm
any
piec
esof
rela
ted
info
rmat
ion
are
uncl
ear”
&al
so:g
raph
icor
gani
zer,
brai
nsto
rmin
gw
eb,t
ree
diag
ram
,flow
diag
ram
[42]
58ob
serv
atio
nrr
rrrr
r “atte
ntiv
elo
okin
gan
dsy
stem
atic
reco
rdin
gof
phen
omen
a:in
clud
ing
peop
le,a
rtifa
cts,
envi
ronm
ents
,eve
nts,
beha
vior
san
din
tera
ctio
ns”
[42]
61pa
perp
roto
typi
ngrr
rr “c
reat
ea
pape
r-ba
sed
sim
ulat
ion
ofan
inte
rfac
eto
test
inte
ract
ion
with
aus
er”
[39]
62pa
ralle
lpro
toty
ping
rrr
r “cre
atin
gm
ultip
leal
tern
ativ
esin
para
llel
may
enco
urag
epe
ople
tom
ore
effe
ctiv
ely
disc
over
unse
enco
nstr
aint
san
dop
port
uniti
es,e
num
erat
em
ore
dive
rse
solu
tions
,and
obta
inm
ore
auth
entic
and
dive
rse
feed
back
”[1
7]63
pers
onas
rr
“con
solid
ate
arch
etyp
alde
scri
ptio
nsof
user
beha
vior
patte
rns
into
repr
esen
tativ
epr
ofile
s,to
hum
aniz
ede
sign
”[4
2]67
prot
otyp
ing
rrr
r “tan
gibl
ecr
eatio
nof
artif
acts
atva
riou
sle
vels
ofre
solu
tion,
ford
evel
opm
enta
ndte
stin
gof
idea
sw
ithin
desi
gn”
[42]
69qu
estio
nnai
rerr
rrrr
r “sur
vey
inst
rum
ents
desi
gned
for
colle
ctin
gse
lf-r
epor
tinf
orm
atio
nfr
ompe
ople
abou
tthe
irch
arac
teri
stic
s,th
ough
ts,
feel
ings
,per
cept
ions
,beh
avio
rs,o
ratti
tude
s,ty
pica
llyin
wri
tten
form
”[4
2]72
role
-pla
ying
rrrr
r“a
ctin
gth
ero
leof
the
user
inre
alis
ticsc
enar
ios
can
...h
ighl
ight
chal
leng
es,p
rese
ntin
gop
port
uniti
es”
[42]
73ro
se-t
horn
-bud
rrr
r“i
dent
ifyi
ngth
ings
aspo
sitiv
e,ne
gativ
e,or
havi
ngpo
tent
ial”
&ta
gou
tcom
esas
rose
,tho
rn,o
rbud
,acc
ordi
ngly
[50]
75sa
mpl
eda
tarr
r “pro
vide
real
data
and
task
s..
..ill
ustr
atin
g[t
ools
]with
conv
inci
ngex
ampl
esus
ing
real
data
”[4
9]80
spee
dda
ting
rrr
“com
pare
mul
tiple
desi
gnco
ncep
tsin
quic
ksu
cces
sion
”[4
2]81
stak
ehol
derf
eedb
ack
rrrr
rr“l
ettin
g[e
xper
ts]“
play
”w
ithth
esy
stem
and
/oro
bser
vety
pica
lsys
tem
feat
ures
”[3
4]85
susp
ende
dju
dgem
ent
rr
“pos
tpon
epr
emat
ure
deci
sion
sor
dism
issi
ngan
idea
”&
“gen
erat
eas
man
yid
eas
aspo
ssib
le”
[26]
86ta
skan
alys
isr
rrrr
r “bre
aks
dow
nth
eco
nstit
uent
elem
ents
ofa
user
sw
ork
flow
,inc
ludi
ngac
tions
and
inte
ract
ions
”[4
2]87
tech
nolo
gypr
obe
rrr
rrr “s
impl
e,fle
xibl
e,an
dad
apta
ble
tech
nolo
gies
with
thre
e..
.goa
ls:
...u
nder
stan
ding
the
need
san
dde
sire
sof
user
s,..
.fiel
d-te
stin
gth
ete
chno
logy
,and
...i
nspi
ring
user
san
dre
sear
cher
sto
thin
kab
outn
ewte
chno
logi
es”
[28]
89th
ough
texp
erim
ent
rrr
r“t
hink
abou
tres
earc
hqu
estio
nsas
ifit
wer
epo
ssib
leto
test
them
intr
ueex
peri
men
ts”
[3]
97w
eigh
ted
mat
rix
rrr
r“[
rank
]des
ign
oppo
rtun
ities
agai
nstk
eysu
cces
scr
iteri
a”&
“ide
ntif
yan
dpr
iori
tize.
..op
port
uniti
es”
[42]
98w
iref
ram
ing
rrr
r “sch
emat
icdi
agra
mm
ing:
anou
tline
ofth
est
ruct
ure
and
esse
ntia
lcom
pone
nts
ofa
syst
em”
[50]
8
To appear in IEEE Transactions on Visualization and Computer Graphics
to the nested model in order to help guide a designer through the visu-alization design process. The motivation enables a designer to deter-mine which activity they are currently performing, which then allowsthe designer to identify potential methods, clarify outcomes, and placedecisions within the nested model. Although the design activity frame-work targets problem-driven visualization work, we could not identifya concrete reason why it could not be useful for technique-driven workas well — this extension presents interesting, future work.
The framework supports a large amount of flexibility by enablingand emphasizing a workflow that includes both the nesting of activ-ities and activities occurring in parallel. As shown in Figure 3, thedesign activity framework can represent a process where many activ-ities are pieced together in different ways according to the motivationof the project at any given time. We feel that this flexibility enablesthe framework to more completely capture the true nature of multilin-ear, real-world visualization design in ways that previous visualizationprocess models and their representations do not.
In addressing the design process more generally, the design commu-nity does not have a consensus on any particular process model [14],nor do they even agree that any such model could capture the “blackbox” of design [19]. Furthermore, considering design as a wickedproblem [7,20,22,68] it can be challenging to know where to go next,when to stop, and what makes an effective design [7]. These chal-lenges exist for many design process models, including the design ac-tivity framework, pointing to the opportunity for further investigation.
The design activity framework has several limitations, the first ofwhich is that the framework’s connections to the nested model maynot always be as clean as those shown in Figure 2. We were ableto identify several corner cases where outcomes of a process couldbegin to overlap into an additional level of the nested model. Fur-thermore, the framework does not include a planning activity which ispresent in other process models [16, 54]. While important for design,we feel that planning is unique and complementary to the design activ-ity framework. For example, the precondition stages of the nine-stageframework [54] could be combined with the design activity frame-work to serve as the planning activity. Lastly, we believe that thereis still much to understand and articulate about the design process forvisualization. With respect to the design activity framework, furtherresearch could extend the framework such as more finely defining orbreaking apart specific activities, adding new activities, or making theconnection to a different design decision model.
8 CONCLUSIONS AND FUTURE WORK
We present a novel visualization design process model, the design ac-tivity framework, which begins to address the messy, iterative, andmultilinear process of real-world visualization design. The frame-work explicitly connects the actions a visualization designer takes withthe visualization design decisions that are made by directly connect-ing each design activity with the corresponding levels of the nestedmodel [45]. In addition to the framework, we provide a series of ex-emplar methods within that framework that visualization designers canutilize, including well-known methods from the visualization literatureas well as methods from other communities which are less common.Furthermore, we provide several key opportunities and considerationsfor the design of future tools in the domain of cybersecurity visual-ization. The overall goal of this work is to help guide visualizationdesigners through the design process, encourage visualization design-ers to consider new design methods for generation or evaluation, andto assist the compact communication of a design process, as in Fig-ure 3. We consider all design models to be a work-in-progress, andthe design activity framework is by no means excluded. Further vali-dating this framework against additional visualization design projectsremains an interesting avenue for future work.
There are a number of additional open questions for future work.For example, we established this framework from a problem-drivenmethodology, and it would be useful to rigorously, but cautiously, val-idate the use of the framework for a technique-driven approach. Fur-thermore, in the list of exemplar methods we include novel methodsfor visualization design, but the utility and effectiveness of these meth-
ods for designing a visualization system have yet to be tested and ver-ified. There are also a series of challenges yet to be addressed by mostvisualization process models: Where should I go next in the process?What method is the best for my situation? When do I know my designis effective enough? We believe these future directions provide richopportunities to further explore the role of design for visualization.
ACKNOWLEDGMENTS
The authors wish to thank Michael Sedlmair, Mike Kirby, AlexBigelow, Ethan Kerzner, Nina McCurdy, Sam Quinan, and Kris Zyg-munt for their feedback on this work. We thank Matthew Parkin for hisinvolvement in the redesign project, producing detailed designs shownin Figure 4. This work is sponsered in part by the Air Force ResearchLaboratory and the DARPA XDATA program, and by the U.S. ArmyResearch Office under a prime contract issued to Intelligent Automa-tion, Inc. The content of the information does not necessarily reflectthe position or the policy of the Government or Intelligent Automation,Inc., and no official endorsement should be inferred.
REFERENCES
[1] C. Atman, K. Deibel, and J. Borgford-Parnell. The process of engineeringdesign: A comparison of three representations. International Conferenceon Engineering Design, 2009.
[2] A. Baker and A. van der Hoek. Ideas, subjects, and cycles as lenses forunderstanding the software design process. Design Studies, 31(6):590–613, Nov. 2010.
[3] H. R. Bernard. Research Methods in Anthropology: Qualitative andQuantitative Approaches. Rowman Altamira, 2011.
[4] H. Beyer and K. Holtzblatt. Contextual Design: Defining Customer-Centered Systems. Elsevier, 1997.
[5] M. Bohøj, N. G. Borchorst, N. O. Bouvin, S. Bødker, and P.-O. Zander.Timeline collaboration. In Proceedings of the SIGCHI Conference onHuman Factors in Computing Systems, page 523. ACM, Apr. 2010.
[6] T. Brown. Change by Design: How Design Thinking Transforms Orga-nizations and Inspires Innovation. Harper Business, 2009.
[7] R. Buchanan. Wicked problems in design thinking. Design Issues, 1992.[8] P. Cairns and A. Cox. Research Methods for Human-Computer Interac-
tion. Cambridge University Press, 2008.[9] J. Cao, Y. Riche, S. Wiedenbeck, M. Burnett, and V. Grigoreanu. End-
user mashup programming: through the design lens. In Proceedings ofthe SIGCHI Conference on Human Factors in Computing Systems, page1009. ACM, Apr. 2010.
[10] M. Cardella, C. Atman, J. Turns, and R. Adams. Students with differingdesign processes as freshmen: Case studies on change. InternationalJournal of Engineering Education, 24(2):246, 2008.
[11] S. Carpendale. Evaluating information visualizations. Information Visu-alization, 2008.
[12] H. Christiaans and R. A. Almendra. Accessing decision-making in soft-ware design. Design Studies, 31(6):641–662, Nov. 2010.
[13] M. da Gandra, M. P. Hea, M. van Neck, and M. Hea. (In)forming theInformation Design Student. Parsons Journal for Information Mapping,2013.
[14] M. da Gandra and M. van Neck. InformForm, Information Design: intheory, an informed practice. 2012.
[15] A. D’Amico and K. Whitley. The real work of computer network defenseanalysts. Visualization for Cyber Security, pages 19–37, 2008.
[16] I. DIS. ISO 9241-210: 2009. Ergonomics of human system interaction-Part 210: Human-centred design for interactive systems (formerly knownas 13407). International Organization for Standardization (ISO). Switzer-land, 2010.
[17] S. P. Dow, A. Glassco, J. Kass, M. Schwarz, D. L. Schwartz, and S. R.Klemmer. Parallel prototyping leads to better design results, more di-vergence, and increased self-efficacy. ACM Transactions on Computer-Human Interaction, 17(4):1–24, Dec. 2010.
[18] R. F. Erbacher, D. A. Frincke, P. Chung Wong, S. Moody, and G. Fink. Amulti-phase network situational awareness cognitive task analysis. Infor-mation Visualization, 9(3):204–219, Jan. 2010.
[19] D. Fallman. Design-oriented human-computer interaction. In Proceed-ings of the SIGCHI Conference on Human Factors in Computing Systems,2003.
[20] R. Farrell and C. Hooker. Design, science and wicked problems. DesignStudies, 34(6):681–705, Nov. 2013.
9

[21] G. A. Fink, C. L. North, A. Endert, and S. J. Rose. Visualizing cybersecurity: Usable workspaces. In Visualization for Cyber Security. IEEE,Oct. 2009.
[22] W. Gaver. What should we expect from research through design? InProceedings of the SIGCHI Conference on Human Factors in ComputingSystems, page 937. ACM, May 2012.
[23] S. Goodwin, J. Dykes, S. Jones, I. Dillingham, G. Dove, A. Duffy,A. Kachkaev, A. Slingsby, and J. Wood. Creative user-centered visu-alization design for energy analysts and modelers. IEEE Transactions onVisualization and Computer Graphics, 19(12):2516–2525, Aug. 2013.
[24] B. Hanington. Methods in the making: A perspective on the state ofhuman research in design. Design Issues, 19(4):9–18, 2003.
[25] B. Hartmann, S. Klemmer, and M. Bernstein. Reflective physical pro-totyping through integrated design, test, and analysis. In Proceedings ofthe ACM Symposium on User Interface Software and Technology, pages299–308. ACM, 2006.
[26] N. Hernandez, J. Shah, and S. Smith. Understanding design ideationmechanisms through multilevel aligned empirical studies. Design Stud-ies, 31(4):382–410, 2010.
[27] T. Howard, S. Culley, and E. Dekoninck. Describing the creative designprocess by the integration of engineering design and cognitive psychol-ogy literature. Design Studies, 29(2):160–180, Mar. 2008.
[28] H. Hutchinson, W. Mackay, B. Westerlund, B. B. Bederson, A. Druin,C. Plaisant, M. Beaudouin-Lafon, S. Conversy, H. Evans, and H. Hansen.Technology probes: inspiring design for and with families. In Proceed-ings of the SIGCHI Conference on Human Factors in Computing Systems,pages 17–24. ACM, 2003.
[29] T. Isenberg, P. Isenberg, J. Chen, M. Sedlmair, and T. Moller. A system-atic review on the practice of evaluating visualization. IEEE Transactionson Visualization and Computer Graphics, 19(12):2818–2827, 2013.
[30] S. Jones, P. Lynch, N. Maiden, and S. Lindstaedt. Use and influence ofcreative ideas and requirements for a work-integrated learning system.In IEEE International Requirements Engineering, pages 289–294. IEEE,2008.
[31] R. M. Kirby and M. Meyer. Visualization collaborations: What worksand why. IEEE Comput. Graph. Appl., 33(6):82–88, Nov. 2013.
[32] L. C. Koh, A. Slingsby, J. Dykes, and T. S. Kam. Developing and apply-ing a user-centered model for the design and implementation of informa-tion visualization tools. Information Visualization, pages 90–95, 2011.
[33] V. Kumar. 101 Design Methods: A Structured Approach for Driving In-novation in Your Organization. 2012.
[34] H. Lam, E. Bertini, P. Isenberg, C. Plaisant, and S. Carpendale. Empiricalstudies in information visualization: Seven scenarios. IEEE Transactionson Visualization and Computer Graphics, 18(9):1520–1536, Nov. 2011.
[35] D. J. Lazar, D. J. H. Feng, and D. H. Hochheiser. Research Methods inHuman-Computer Interaction. John Wiley & Sons, 2010.
[36] W. Lidwell and K. Holden. Universal Principles of Design. RockportPublishers, 2010.
[37] D. Lloyd and J. Dykes. Human-centered approaches in geovisual-ization design: Investigating multiple methods through long-term casestudy. IEEE Transactions on Visualization and Computer Graphics,17(12):2498–2507, 2011.
[38] J. Lowgren. Applying design methodology to software development. InProceedings of the Conference on Designing Interactive Systems, pages87–95. ACM, Aug. 1995.
[39] M. Maguire. Methods to support human-centred design. InternationalJournal of Human-Computer Studies, 55(4):587–634, 2001.
[40] N. Maiden, S. Manning, S. Robertson, and J. Greenwood. Integratingcreativity workshops into structured requirements processes. In Proceed-ings of the Conference on Designing Interactive Systems, pages 113–122.ACM, 2004.
[41] N. Maiden, C. Ncube, and S. Robertson. Can requirements be creative?experiences with an enhanced air space management system. Interna-tional Conference on Software Engineering, pages 632–641, 2007.
[42] B. Martin and B. Hanington. Universal Methods of Design: 100 Waysto Research Complex Problems, Develop Innovative Ideas, and DesignEffective Solutions. Rockport Publishers, 2012.
[43] P. McLachlan, T. Munzner, E. Koutsofios, and S. North. LiveRAC: Inter-active Visual Exploration of System Management Time-Series Data. InProceedings of the SIGCHI Conference on Human Factors in ComputingSystems, page 1483. ACM, Apr. 2008.
[44] M. Meyer, M. Sedlmair, P. S. Quinan, and T. Munzner. The nested blocksand guidelines model. Information Visualization, 2013.
[45] T. Munzner. A nested model for visualization design and validation.IEEE Transactions on Visualization and Computer Graphics, 15(6):921–8, 2009.
[46] H. G. Nelson and E. Stolterman. The Design Way: Intentional Changein an Unpredictable World : Foundations and Fundamentals of DesignCompetence. Educational Technology, 2003.
[47] J. S. Olson and T. P. Moran. Mapping the method muddle: Guidance inusing methods for user interface design. In M. Rudisill, C. Lewis, P. G.Polson, and T. D. McKay, editors, Human-Computer Interface Design:Success Stories, Emerging Methods, and Real-World Context, pages 269–300. Morgan Kaufmann Publishers Inc., June 1996.
[48] B. Onarheim and S. Wiltschnig. Opening and constraining: constraintsand their role in creative processes. In Proceedings of the DESIRE Net-work Conference on Creativity and Innovation in Design, pages 83–89.Desire Network, Aug. 2010.
[49] C. Plaisant. The challenge of information visualization evaluation. InProceedings of the Conference on Advanced Visual Interfaces, pages109–116. ACM, May 2004.
[50] H. B. Review. Vision Statement: A Taxonomy of Innovation. http://hbr.org/2014/01/a-taxonomy-of-innovation/ar/1,2014. Accessed: 2014-02-20.
[51] W. W. Royce. Managing the development of large software systems. InProceedings of IEEE WESCON, volume 26. Los Angeles, 1970.
[52] J. C. Savage, C. J. Moore, J. C. Miles, and C. Miles. The interac-tion of time and cost constraints on the design process. Design Studies,19(2):217–233, Apr. 1998.
[53] D. A. Schon. The Reflective Practitioner: How Professionals Think inAction. Basic Books, 1983.
[54] M. Sedlmair, M. Meyer, and T. Munzner. Design study methodology:Reflections from the trenches and the stacks. IEEE Transactions on Visu-alization and Computer Graphics, 18(12):2431–2440, 2012.
[55] B. Shneiderman and C. Plaisant. Strategies for evaluating informationvisualization tools: multi-dimensional in-depth long-term case studies.In Proceedings of the AVI workshop on Beyond Time and Errors NovelEvaluation Methods for Information Visualization (BELIV), pages 1–7.ACM, 2006.
[56] C. M. Snider, S. J. Culley, and E. A. Dekoninck. Analysing creativebehaviour in the later stage design process. Design Studies, 34(5):543–574, Sept. 2013.
[57] A. Strauss and J. Corbin. Basics of Qualitative Research: GroundedTheory Procedures and Techniques. 1990.
[58] A. Tang, A. Aleti, J. Burge, and H. van Vliet. What makes softwaredesign effective? Design Studies, 31(6):614–640, Nov. 2010.
[59] R. Teal. Developing a (non-linear) practice of design thinking. Interna-tional Journal of Art & Design Education, 29(3):294–302, Oct. 2010.
[60] M. Tory and T. Moller. Human factors in visualization research. IEEETransactions on Visualization and Computer Graphics, 10(1):72–84,2004.
[61] A. Vande Moere and H. Purchase. On the role of design in informationvisualization. Information Visualization, 10(4):356–371, Sept. 2011.
[62] R. H. von Alan, S. T. March, J. Park, and S. Ram. Design science ininformation systems research. Management Information Systems Quar-terly, 28(1):75–105, 2004.
[63] K. Vredenburg, J. Mao, P. Smith, and T. Carey. A survey of user-centereddesign practice. Proceedings of the SIGCHI Conference on Human Fac-tors in Computing Systems, pages 471–478, 2002.
[64] D. B. Walz, J. J. Elam, and B. Curtis. Inside a software design team:knowledge acquisition, sharing, and integration. Communications of theACM, 36(10):63–77, Oct. 1993.
[65] C. Ware. Visual Thinking: for Design. Morgan Kaufmann, 2010.[66] I. Wassink, O. Kulyk, and B. van Dijk. Applying a user-centered approach
to interactive visualisation design. In Trends in Interactive Visualization,pages 175–199. Springer, 2009.
[67] A. Wodehouse, M. Ing, and W. Ion. The integration of information &ideas: Creating linkages through a novel concept design method. ParsonsJournal for Information Mapping, 2010.
[68] T. V. Wolf, J. A. Rode, J. Sussman, and W. A. Kellogg. Dispelling ”de-sign” as the black art of CHI. In Proceedings of the SIGCHI Conferenceon Human Factors in Computing Systems, page 521. ACM, Apr. 2006.
[69] J.-C. Wu, C.-C. Chen, and H.-C. Chen. Comparison of designer’s designthinking modes in digital and traditional sketches. Design & TechnologyEducation, 17(3):37–48, Nov. 2012.
10