design & implementation of digital channel selection filters for a combined bluetooth and
TRANSCRIPT

Design & Implementation ofdigital channel selection filtersfor a combined BlueTooth and
HiperLAN/2 receiver
Master’s Thesis
Lars van MourikUniversity of Twente
University of TwenteDepartment of Electrical Engineering
Chair of Signals & SystemsEnschede, The Netherlands
Supervisors: Prof. Dr. Ir. C.H. SlumpIr. F.W. HoeksemaIr. R. SchiphorstIr. V.J. Arkesteijn
Date: 22 August 2002Period: January 2002 - August 2002Report Code: SAS033N02

Abstract
In the context of a Software Defined Radio (SDR) receiver, digital channel selec-tion filters were researched for Bluetooth and HiperLAN/2 signals. The goal wasto derive the specifications and find suitable implementations, as well as buildinga simulation model. This model includes the digital channel selection system forboth Bluetooth and HiperLAN/2 with analog front-end and demodulators. ForHiperLAN/2 the proposed filter system is based on poly-phase low-pass FIR filtersand theoretical specifications. Due to late availability of a demodulator, this systemwas not further researched. For Bluetooth, The real and The complex filter systemswere researched including the feasibility of using (non linear phase) IIR filters. Thereal design was implemented and improved and is proposed as the optimal solutionfor the current requirements with respect to the derived performance figure. Theincoming quadrature signals are low-pass filtered by a pair of (real) FIR filters,implemented in polyphase. Then, they are converted to a bandpass signal by us-ing a FIR Hilbert transformer and adder. Changing the sign bit of the adder isthe first stage of channel selection. Then, the signals are band-pass filtering by avariable 4th order Chebyshev Type II IIR filter. The filter is variable in the sensethat filter coefficients must be updated every time the Bluetooth signal hops toanother frequency. Then the filtered signal is mixed to the required frequency fordemodulation. After a second band-pass filter (6th order Butterworth IIR filter)the signal is decimated again and ready for demodulation. The choice for IIR filterswas made to reduce filter operations. A FIR-only design was also proposed and canbe used in case IIR filters are not suitable for implementation. Both systems meetBER requirements as specified in the Bluetooth documentation.

Contents
Contents 1
1 Introduction 31.1 Background . . . . . . . . . . . . . . . . . . . . . . . . . . . . . . . . 31.2 Thesis objectives . . . . . . . . . . . . . . . . . . . . . . . . . . . . . 31.3 Thesis structure . . . . . . . . . . . . . . . . . . . . . . . . . . . . . . 4
2 Channel selection: initial requirements 52.1 Introduction . . . . . . . . . . . . . . . . . . . . . . . . . . . . . . . . 52.2 Analog front-end . . . . . . . . . . . . . . . . . . . . . . . . . . . . . 52.3 Digital channel selection . . . . . . . . . . . . . . . . . . . . . . . . . 72.4 Filter requirements . . . . . . . . . . . . . . . . . . . . . . . . . . . . 82.5 Demodulator imposed requirements . . . . . . . . . . . . . . . . . . . 102.6 Recapitulation of known parameters . . . . . . . . . . . . . . . . . . 11
3 Channel selection - detailed requirements 133.1 Introduction . . . . . . . . . . . . . . . . . . . . . . . . . . . . . . . . 133.2 Analog front-end . . . . . . . . . . . . . . . . . . . . . . . . . . . . . 133.3 Requirements imposed by the demodulator . . . . . . . . . . . . . . 163.4 Channel selection system . . . . . . . . . . . . . . . . . . . . . . . . 173.5 Conclusions . . . . . . . . . . . . . . . . . . . . . . . . . . . . . . . . 19
4 Filter and Decimate 214.1 Introduction . . . . . . . . . . . . . . . . . . . . . . . . . . . . . . . . 21
4.1.1 Design parameters . . . . . . . . . . . . . . . . . . . . . . . . 214.1.2 Filter performance . . . . . . . . . . . . . . . . . . . . . . . . 22
4.2 FIR . . . . . . . . . . . . . . . . . . . . . . . . . . . . . . . . . . . . 254.2.1 Least squared error . . . . . . . . . . . . . . . . . . . . . . . . 254.2.2 Windowing . . . . . . . . . . . . . . . . . . . . . . . . . . . . 254.2.3 Uniform approximation . . . . . . . . . . . . . . . . . . . . . 254.2.4 Influence of ∆f and δp on N . . . . . . . . . . . . . . . . . . 264.2.5 Multi-rate . . . . . . . . . . . . . . . . . . . . . . . . . . . . . 274.2.6 Polyphase filters . . . . . . . . . . . . . . . . . . . . . . . . . 334.2.7 Complex filters . . . . . . . . . . . . . . . . . . . . . . . . . . 36
4.3 CIC . . . . . . . . . . . . . . . . . . . . . . . . . . . . . . . . . . . . 364.4 IIR . . . . . . . . . . . . . . . . . . . . . . . . . . . . . . . . . . . . . 39
4.4.1 Bilinear transform . . . . . . . . . . . . . . . . . . . . . . . . 394.4.2 Group delay . . . . . . . . . . . . . . . . . . . . . . . . . . . . 394.4.3 Filter types . . . . . . . . . . . . . . . . . . . . . . . . . . . . 394.4.4 Demodulator sensitivity tests . . . . . . . . . . . . . . . . . . 414.4.5 Conclusions . . . . . . . . . . . . . . . . . . . . . . . . . . . . 45
1
2 CONTENTS
5 Digital Mixer 465.1 Introduction . . . . . . . . . . . . . . . . . . . . . . . . . . . . . . . . 465.2 Real Mixer . . . . . . . . . . . . . . . . . . . . . . . . . . . . . . . . 465.3 Hilbert-mixer . . . . . . . . . . . . . . . . . . . . . . . . . . . . . . . 465.4 Required mixer frequencies . . . . . . . . . . . . . . . . . . . . . . . 465.5 Conclusions . . . . . . . . . . . . . . . . . . . . . . . . . . . . . . . . 47
6 System 496.1 Introduction . . . . . . . . . . . . . . . . . . . . . . . . . . . . . . . . 496.2 Test environment and parameters . . . . . . . . . . . . . . . . . . . . 49
6.2.1 BER tests . . . . . . . . . . . . . . . . . . . . . . . . . . . . . 496.3 ASAP system 1 . . . . . . . . . . . . . . . . . . . . . . . . . . . . . 51
6.3.1 Introduction . . . . . . . . . . . . . . . . . . . . . . . . . . . 516.3.2 Hilbert transformer (Hb) design . . . . . . . . . . . . . . . . 526.3.3 Post mixer filter (BPF2) design . . . . . . . . . . . . . . . . . 526.3.4 Spectral analysis of the systems signals . . . . . . . . . . . . 536.3.5 Eye diagrams . . . . . . . . . . . . . . . . . . . . . . . . . . . 556.3.6 BER calculations . . . . . . . . . . . . . . . . . . . . . . . . . 576.3.7 ASAP system 1 specification . . . . . . . . . . . . . . . . . . 57
6.4 ASAP system 2 . . . . . . . . . . . . . . . . . . . . . . . . . . . . . 586.4.1 Introduction . . . . . . . . . . . . . . . . . . . . . . . . . . . 586.4.2 Moving the Hilbert bottle-neck . . . . . . . . . . . . . . . . . 586.4.3 Reduce aliasing, improve BPF1/BPF2 cooperation . . . . . . 596.4.4 BPF1/BPF2 filter re-design . . . . . . . . . . . . . . . . . . . 596.4.5 Sensitivities and trade-offs . . . . . . . . . . . . . . . . . . . . 606.4.6 ASAP system 2 specifications . . . . . . . . . . . . . . . . . . 60
6.5 ALAP system . . . . . . . . . . . . . . . . . . . . . . . . . . . . . . 616.6 Conclusions . . . . . . . . . . . . . . . . . . . . . . . . . . . . . . . . 61
7 Conclusions and Recommendations 627.1 Conclusions (Summary) . . . . . . . . . . . . . . . . . . . . . . . . . 627.2 Recommendations . . . . . . . . . . . . . . . . . . . . . . . . . . . . 63
A Quadrature signals 64A.1 In-phase and Quadrature signals . . . . . . . . . . . . . . . . . . . . 64A.2 Quadrature down conversion of signal chunks . . . . . . . . . . . . . 64
B The Hilbert transform 66B.1 Practical usage for channel selection . . . . . . . . . . . . . . . . . . 67B.2 Upper/lower sideband rejection . . . . . . . . . . . . . . . . . . . . . 67
C Noble identities 70
Bibliography 71
1Introduction
1.1 Background
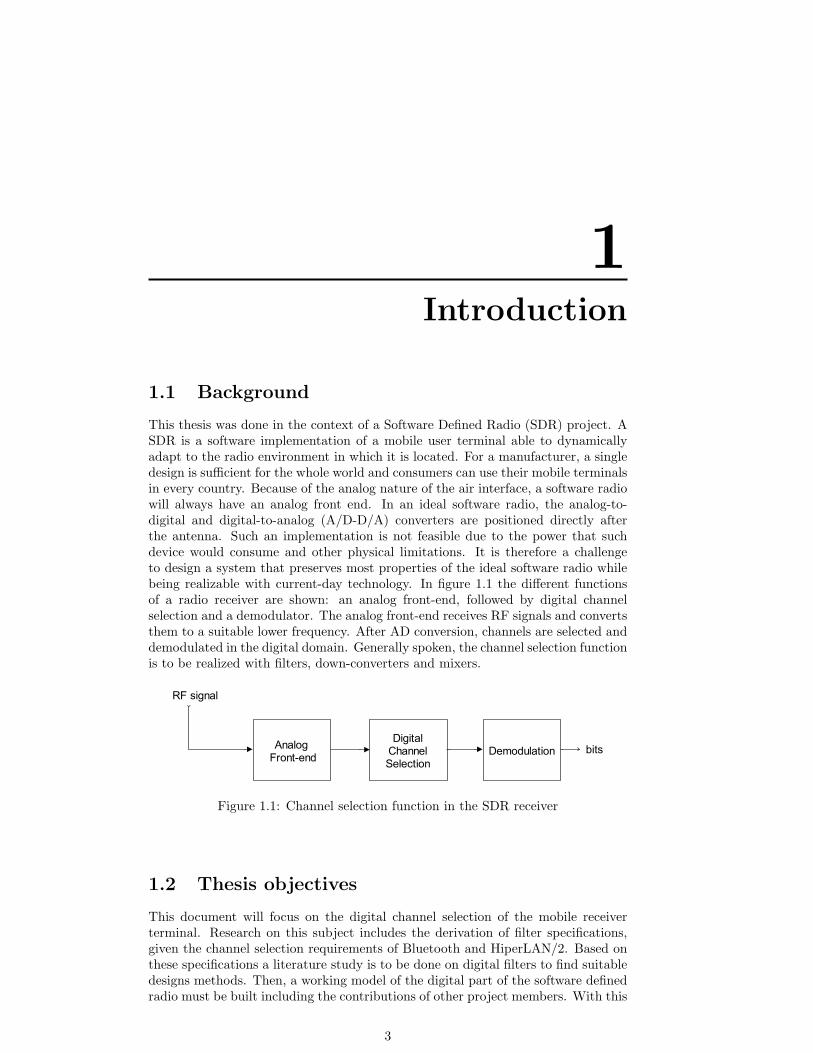
This thesis was done in the context of a Software Defined Radio (SDR) project. ASDR is a software implementation of a mobile user terminal able to dynamicallyadapt to the radio environment in which it is located. For a manufacturer, a singledesign is sufficient for the whole world and consumers can use their mobile terminalsin every country. Because of the analog nature of the air interface, a software radiowill always have an analog front end. In an ideal software radio, the analog-to-digital and digital-to-analog (A/D-D/A) converters are positioned directly afterthe antenna. Such an implementation is not feasible due to the power that suchdevice would consume and other physical limitations. It is therefore a challengeto design a system that preserves most properties of the ideal software radio whilebeing realizable with current-day technology. In figure 1.1 the different functionsof a radio receiver are shown: an analog front-end, followed by digital channelselection and a demodulator. The analog front-end receives RF signals and convertsthem to a suitable lower frequency. After AD conversion, channels are selected anddemodulated in the digital domain. Generally spoken, the channel selection functionis to be realized with filters, down-converters and mixers.
DigitalChannelSelection
DemodulationAnalog
Front-end
RF signal
bits
Figure 1.1: Channel selection function in the SDR receiver
1.2 Thesis objectives
This document will focus on the digital channel selection of the mobile receiverterminal. Research on this subject includes the derivation of filter specifications,given the channel selection requirements of Bluetooth and HiperLAN/2. Based onthese specifications a literature study is to be done on digital filters to find suitabledesigns methods. Then, a working model of the digital part of the software definedradio must be built including the contributions of other project members. With this
3
4 Chapter 1
model, simulations of selected filter designs are done to discover the design spaceand optimize the system with respect to power consumption.
1.3 Thesis structure
At the start of this assignment, a lot of design options for the entire receiver werestill left unanswered due to the state the project was in at that moment. Basedon an initial study into the Bluetooth and HiperLAN/2 specifications a generalcontext was created which was used as a starting point for the design process.This context is given in chapter 2, where an effort was made to cope with theuncertainties by defining scenario’s and configurations. As the project progressed,more information became available on the surrounding system components. Basedon this information, new insights and research area’s were uncovered and designschoices were rethought. The new and more detailed context is given in chapter 3.Based on the derived specifications, chapter 4 researches digital filters and suitableimplementations. Chapter 5 gives an overview of digital mixing, which is alsorequired for the channel selection. Then, chapter 6 discusses channel selectionmodels that were designed and compares their performance with respect to biterrors and filter operations. Design parameters, constraints, issues and trade-offsof the proposed systems are discussed and recommendations for future work aregiven.

2Channel selection: initial
requirements
2.1 Introduction
The channel selection system under research in this document is part of a largersystem, namely the receiver. Referring to [7], it is part of the subsystem in betweenthe Antenna Reference Point and the Channel Reference Point. Due to hardwareconstraints, both analog and digital processing is needed for channel selection. This
DigitalChannelSelection
DemodulationAnalog
Front-end
RF signal
z[n]x(t)
bits
d[n]
CRPARP
Figure 2.1: Channel selection function in the receiver
document describes the design of the digital part of the channel selection subsystem(see figure 2.1). The combined Bluetooth and HiperLAN/2 receiver terminal posesa list of demands on the signal conditioning for a well-defined signal configurationto achieve a certain BER. The subsystem under design is the interface between theanalog front-end and the demodulator, both introducing constraints. Initial con-straints, based on the specifications will be discussed in this chapter. For each ofthe three sub-blocks in figure 2.1 the known and unknown parameters will be listed.As the design of the receiver was an ongoing project more specific requirements be-came available at a later time. In this chapter it was assumed that the demodulatorwas not finished and that the exact output of the analog front-end is not specified.These specifications and resulting design choices for the digital channel selectionsystem are added in chapter 3.
2.2 Analog front-end
Generally, the analog front-end will contain an amplifier, band-pass filter and mixerto convert the received signal to a suitable intermediate frequency or baseband. Inthis case, the received signal can be either a part of the Bluetooth or HiperLAN/2spectrum. The Bluetooth spectrum resides in the 2.4 GHz band and the Hiper-
5

6 Chapter 2
LAN/2 signals in the 5 GHz band. Initially, this part of the system will be seen asa black box, outputting 10 or 20 MHz chunks of ”signal” at a low rate. This rate isdefined by the Analog to Digital Converter (ADC), which is assumed to be a partof the analog front-end. The actual sampling rate fAD and resolution of the ADconversion are not known yet, but for exploration purposes fAD=60, 80 and 100Mega samples per second (Ms/s) are assumed.
DigitalChannelSelection
DemodulationAnalog
Front-end
RF signal
z[n]x(t)
bits
d[n]
CRPARP
Figure 2.2: Analog front-end
Scenario’s
For convenience of reference, the incoming (RF) signal is called x(t) (refer to figure2.2). The positive half of the spectrum of the signal is depicted in figure 2.2.Theoretically, the width of the spectrum outputted by the front-end is only boundby the sample frequency of the ADC (fAD). Thus, the spectral location of theincoming Bluetooth or HiperLAN/2 signal chunks can be anywhere in between 0and fAD/2. In this region two fundamentally different locations can be identified,namely baseband and IF. IF is an Intermediate Frequency, and a distinction will bemade between low and medium IF. This distinction is arbitrary and will be explainedin section 2.5. With these distinctions, 3 scenario’s will be discussed separately forHiperLAN/2 and Bluetooth in the following sections. In chapter 3 the alternativespresented will be pinned further, as more project-knowledge is available there. Theoutput of the analog front-end (and thus the input of the digital channel selectionsubsystem) is called z(n) (see also figure 2.2).
f [Mhz]0 fcenterfstartfend
|X(f)|
Figure 2.3: Spectrum of a signal chunk at RF
HiperLAN/2
In case HiperLAN/2 signals are received, the Fourier transform X(f) of x(t) isshown in figure 2.2. This spectrum represents one HiperLAN/2 channel that isfrequency shifted from RF (≈ 5 GHz) to a much lower (intermediate) frequency.In figure 2.4, the shaded boxes represent the HiperLAN/2 spectra and the whiteboxes their negative mirrors. If the frequency of the local oscillator in the analogfront-end is chosen to equal the center frequency of this channel (fcenter in figure2.2), the result (after low-pass filtering) is shown in figure 2.4(a). In this case, theanalog front-end output is a complex (baseband) signal. If the local oscillator in theanalog front-end has a frequency equal to fstart in figure 2.2, the result is shown in

Channel selection: initial requirements 7
figure 2.4(b). With a local oscillator frequency lower than fstart, the spectrum islocated as in figure 2.4(c).
20-20 F [Mhz]
|Z(f)|
0
(a) Scenario 1: Baseband
20-20 F [Mhz]0
|Z(f)|
(b) Scenario 2: Low IF
20-20 F [Mhz]0
|Z(f)|
(c) Scenario 3: IF
Figure 2.4: Analog front-end output spectra (HiperLAN/2): three scenario’s
Bluetooth
For Bluetooth, the analog output scenario’s are generally the same as for Hiper-LAN/2. But now, X(f) in figure 2.2 represents 20 Bluetooth channels. In figure 2.5this is depicted by the shaded boxes (representing the positive spectra) numbered0−19. The white boxes are their corresponsing negative spectra. The Bluetooth de-modulator requires a band-pass signal (thus having an even spectrum). This meansthat in case of scenario 1, (the local oscillator in the analog front-end is equal tofcenter in figure 2.2), the resulting baseband signals require additional processingto be converted to band-pass.
2.3 Digital channel selection
Attenuation by propagation, path loss, multi-path fading and adjacent channel in-terference are just few of the unwanted effects that reduce the desired signal quality.In addition, the receiver system itself adds noise to the signal. A common methodof removing interference from a signal is filtering. For both Bluetooth and Hiper-LAN/2 worst case input scenario’s are given in [11]. These will be the basis uponwhich the filters are designed. Note however that exact requirements with respectto certain filter characteristics are not known yet. Unknown parameters include:maximum allowable values for the so-called pass-band ripple, phase non-linearityand required attenuation in the transition bands. These transition bands are thebands ”in between the channels” and defined as ”don’t care” bands in [11]. Thedemodulator performance reduction due to these effects should be more thoroughlyresearched or determined by for instance simulations. The Bluetooth modulation

8 Chapter 2
1112131415161719 10 18 2345679 018
f [Mhz]
|Z (f)|I
11 12 13 14 15 16 17 19101 82 3 4 5 6 7 90 18
0
(a) Scenario 1: Baseband
f [Mhz]
|Z (f)|I
11 12 13 14 15 16 17 19101 82 3 4 5 6 7 90 181112131415161719 10 18 2345679 018
0
(b) Scenario 2: Low IF
1112131415161719 10 18 2345679 018
f [Mhz]
|Z (f)|I
11 12 13 14 15 16 17 19101 82 3 4 5 6 7 90 18
0
(c) Scenario 3: IF
Figure 2.5: Analog front-end output spectra (Bluetooth): three scenario’s
DigitalChannelSelection
DemodulationAnalog
Front-end
RF signal
z[n]x(t)
bits
d[n]
CRPARP
Figure 2.6: Demodulator
scheme is GFSK [23], whereby the transmitted bits are frequency modulated. Itis therefore assumed that FIR filters are more suitable (than IIR) due to their ex-act linear phase response. HiperLAN/2 is modulated using OFDM which is alsosensitive to phase distortions, resulting in inter carrier interference (ICI) [16].
2.4 Filter requirements
HiperLAN/2
For a HiperLAN/2 signal, the channel selection is assumed to be mainly done by theanalog front end. The resulting spectrum may require some conditioning to achievethe specifications listed below. Depending on the final front-end architecture, oneof the three scenario’s below will be implemented. The filter specifications for achunk centered at baseband are:
• Pass-band: 8.28125 MHz
• Transition band: 8.28125 - 11.71875 MHz
• Stop band: 11.71875 - 28.8125 MHz, minimum attenuation: 32 dB
• Transition band: 28.28125 - 31.71875 MHz
• Stop band: ≥ 31.71875, minimum attenuation: 51 dB

Channel selection: initial requirements 9
A graphical representation of these is shown in figure 2.7 [11]. The three analogfront-end output scenario’s are depicted in figure 2.4.
dB
0
-32
-51
8.28125 11.71875 28.28125 31.71875
[Mhz]
Figure 2.7: Low-pass filter requirements HiperLAN/2 [11]
Bluetooth
The signal chunk from the analog front-end contains 10 or 20 Bluetooth channels.This means that for each selected channel, there are can be up to 19 interferers”polluting” the signal. The degree of interference for which the receiver must haveadequate performance has been quantified in the Bluetooth specifications [23]. Fourdifferent cases of strong interference are given for which the receiver must achievea maximum bit error rate (BER) of 0.1%. Filter specifications based on these testswere derived in [11], and specified for a Bluetooth signal, centered at baseband.The bandwidth of the signal holding 98% of it’s power is 0.675MHz. With equallyspaced channels, in between their 98% bandwidth is assumed to be a ”don’t care”region. The receiver must be able to sufficiently attenuate these strong interferers:
• Adjacent (1MHz) channel interferer: same strength
• Adjacent (2MHz) channel interferer: 30 dB stronger
• Adjacent (≥ 3MHz) channel interferer: 40 dB stronger
The fourth strong interference is in-band and 11 dB weaker than the wanted channel.From the adjacent channel tests, filter requirements were derived. Note that theserequirements seem to imply that all interferers are present simultaneously, but thisis not the case. Theoretically, three filter specification could have been made foreach case of strong interference, but that would require the receiver to have real-time”knowledge” of the interference levels. Thus, a composite filter response is givenfor all interferers, and more relaxed specifications must be derived while conductingBER tests. The following (composite) filter requirements are derived for a wantedchannel centered at baseband (see also figure 2.8):
• Pass-band: 0 - 0.34 MHz
• Transition band: 0.34 - 0.66 MHz
• Stop band: 0.66 - 1.34 MHz, minimum attenuation: 24 dB
• ”Don’t care” band: 1.34 - 1.66 MHz
• Stop band: 1.66 - 2.34 MHz, minimum attenuation: 54 dB
• ”Don’t care” band: 2.34 - 2.66 MHz
• Stop band: 2.66 - 3.34 MHz, minimum attenuation: 64 dB

10 Chapter 2
dB
0-24
-54-64
0.34 0.66 1.34 1.66 2.34 2.66 3.34freq [MHz]
Figure 2.8: Low-pass filter requirements Bluetooth [11]
Note that the requirements given apply to the combined analog and digital filtersbetween the ARP and CRP (refer to figure 2.6). However in [7] it is stated that afteranalog processing the given requirements are likely to remain valid for the digitalfilter system. This composite filter response assumes that the selected channel isat baseband. In practice, the selected channel can be anywhere in the frequencyinterval −fAD/2 ≤ fc ≤ fAD/2, depending on the output scenario of the analogfront-end. In addition, the selected channel will be frequency hopping12. Thisgenerally leaves two options:
1. Derive a different set of filter specifications for each possible (spectral) locationof the selected channel. The targeted filter response will then be a frequencyshifted version of the spectrum depicted in figure 2.8.
2. Use a frequency translation method to ”move” the selected channel to the(spectral) location specified by the filter
Further studies will be carried out to find a practical solution for this.
2.5 Demodulator imposed requirements
HiperLAN/2
The signal chunk provided by the analog front-end is already the input for itsdemodulator. The digital channel selection of the modulated sub-channels [11]is done in the HiperLAN/2 demodulator. This demodulator requires quadrature(baseband) inputs, thus for scenario 1 (refer to figure 2.4) low-pass filtering both Iand Q paths suffices and no additional processing is necessary. The input rate ofthe demodulator is likely to be an integer multiple of the channel width, which is20 MHz.
Bluetooth
Frequency translation
After filtering, the desired channel must be demodulated. Depending on the imple-mentation of the demodulator, it may require the channel to be frequency translated
1As stated in the Bluetooth specification [23], so the channel selection criteria ”change” every625µs
2Because of the frequency hopping scheme, it is probably assumed that these strong interferersdo not occur simultaneously for a significant time interval

Channel selection: initial requirements 11
Function Parameter ValueADC fAD[Ms/s] 60, 80 or 100
# Bits unknownAnalog front-end output Chunks 10 or 20 MHz
Rate [Ms/s] fAD
Filters Type FIR/IIR ?Phase Exactly linear ?Ripple [dB] unknownTransition bands Don’t care ?
Table 2.1: Parameters common to both Bluetooth and HiperLAN/2 channel selec-tion - part I
to a desired carrier frequency or to baseband. Initial assumptions are that the de-modulator will require the channel to be at a certain fdemod > 0, i.e. a band-passsignal. Now the subtle distinction can be made between the low IF and IF sce-nario’s discussed in section 2.2. Suppose the demodulator requires the selectedchannel centered at a carrier frequency fdemod = 1 MHz. If the signal chunk fromthe analog front-end has the first channel at frequency fstart > fdemod, the ”target”frequency is ”clear” (referring to the ”empty spot” at f = 1 MHz in figure 2.5(c)).In other words, no filtering is required to remove other channels or interferers aroundfdemod
3.
Sample rate conversion
The symbol rate of a single Bluetooth channel is 1 Mbps. With an 80 Ms/s ADCthis means 80 samples per symbol. Processing 80 samples to decide on whethera transmitted bit was ”0” or ”1” is very labor intensive and inefficient. Commondemodulators do not require such high rates and 8 (or another low integer number)samples per symbol is a more likely situation. Therefore a rate changer will also benecessary in the digital channel selection system.
2.6 Recapitulation of known parameters
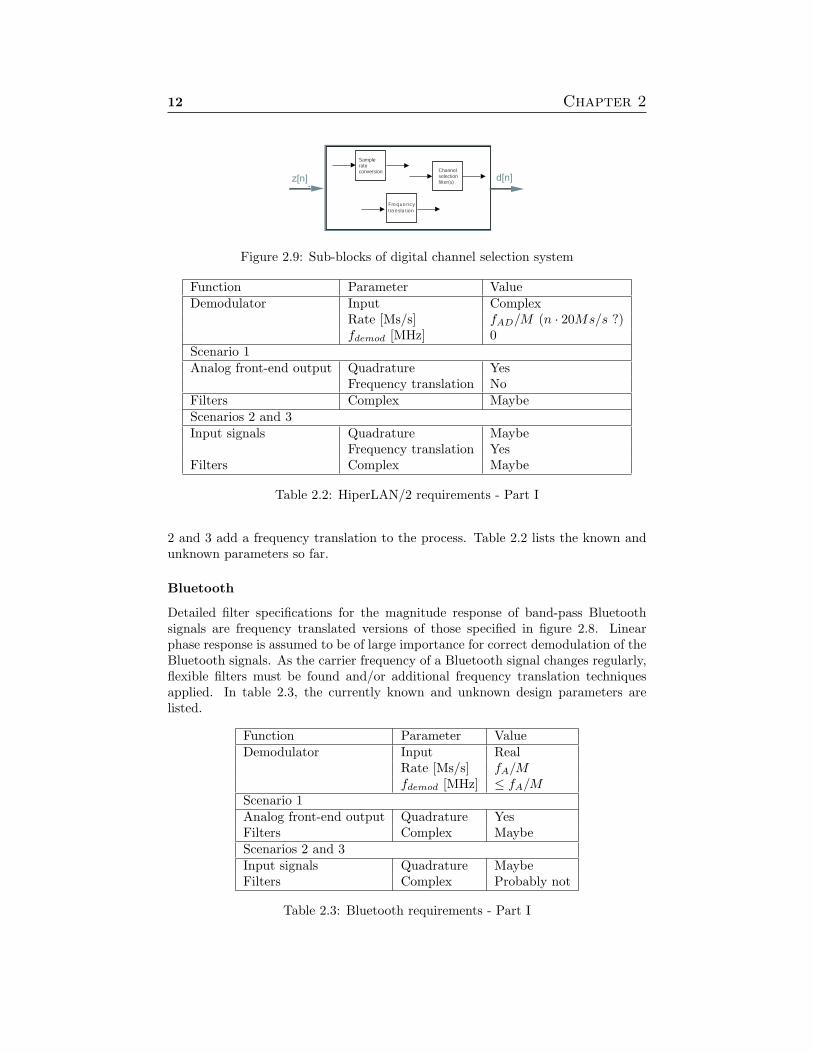
The general requirements of the digital channel selection for both Bluetooth andHiperLAN/2 reception have now been discussed. Based on this information, afunctional system architecture can be derived. There are three basic functions toconsider: filtering, frequency translation and sample rate conversion (see figure 2.9).The known and unknown parameters common to both channel selection systems arelisted in table 2.1. In the conclusions of the next chapter, some of the questions areanswered and listed in Part II. The sample rate of the input signal z[n] is equal tofAD. The sample rate of output signal d[n] is fAD/M , where M is the decimationfactor of the sample rate converter. The detailed filter specifications for Bluetoothand HiperLAN/2 are discussed in sections 2.4 and 2.4.
HiperLAN/2
HiperLAN/2 channel selection is relatively straightforward for scenario 1. No fre-quency translation is necessary (in the digital part) and the quadrature inputs bothpass through a low-pass filter, decimator and are ready for demodulation. Scenario’s
3The carrier frequency fdemod is the frequency of the selected channel after mixing. Thus asecond IF is used and the receiver is of the heterodyne type
12 Chapter 2
z[n]
Fre que ncy
tra nsla tion
Samplerateconversion
d[n]Channelselectionfilter(s)
Figure 2.9: Sub-blocks of digital channel selection system
Function Parameter ValueDemodulator Input Complex
Rate [Ms/s] fAD/M (n · 20Ms/s ?)fdemod [MHz] 0
Scenario 1Analog front-end output Quadrature Yes
Frequency translation NoFilters Complex MaybeScenarios 2 and 3Input signals Quadrature Maybe
Frequency translation YesFilters Complex Maybe
Table 2.2: HiperLAN/2 requirements - Part I
2 and 3 add a frequency translation to the process. Table 2.2 lists the known andunknown parameters so far.
Bluetooth
Detailed filter specifications for the magnitude response of band-pass Bluetoothsignals are frequency translated versions of those specified in figure 2.8. Linearphase response is assumed to be of large importance for correct demodulation of theBluetooth signals. As the carrier frequency of a Bluetooth signal changes regularly,flexible filters must be found and/or additional frequency translation techniquesapplied. In table 2.3, the currently known and unknown design parameters arelisted.
Function Parameter ValueDemodulator Input Real
Rate [Ms/s] fA/Mfdemod [MHz] ≤ fA/M
Scenario 1Analog front-end output Quadrature YesFilters Complex MaybeScenarios 2 and 3Input signals Quadrature MaybeFilters Complex Probably not
Table 2.3: Bluetooth requirements - Part I

3Channel selection - detailed
requirements
3.1 Introduction
This chapter contains more detailed information about the chosen receiver architec-ture. It is meant as an addition to the previous chapter, and discusses the designchoices made in response to the design choices made in the SDR project for theanalog front-end and both demodulators. The first section about the analog front-end goes into more detail regarding the incoming signals and the influence on thedesign choices for the channel selection system. Then, requirements imposed by thedemodulator are discussed and the consequences for the channel selection systemunder design.
3.2 Analog front-end
The currently proposed architecture for the analog front-end is shown in figure 3.1[6]. It is based on quadrature down conversion, meaning that two signal paths willbe present at the channel selection input. 20 MHz chunks are down-converted tobaseband, which was discussed in the previous chapter as scenario 1 (in section2.2). The quadrature down conversion method [15], [9], [7], [2] uses the architecture
x(t) z[n]
sin
cos
BPF
LPF
LPF ADC
ADC
LNA
HL2 RF signal
BT RF signal
x(t)
y (t)
y (t)
z (t)
z (t)
z [n]
z [n]
I
Q
I I
Q Q
LNA
Figure 3.1: Analog front-end demonstrator architecture
shown in figure 3.1. This is the analog front-end block of figure 2.2 in it’s expandedform. From now on, x(t) is defined as the real band-pass signal after the band-passfilter and LNA. The signal is shifted to baseband using a quadrature down mixer.
13

14 Chapter 3
The complex injection [13] LO(t) = ej2πfLOt is realized by using two signal paths.These are called In-phase and Quadrature path. The syntax used is defined as:
LO(t) ≡ (LOI(t), LOQ(t)) ≡ LOI(t) + j · LOQ(t) (3.1)
The complex injection can be described as:
LO(t) = ej2πfLOt = cos (2πfLOt) + j sin (2πfLOt) (3.2)
Thus, the quadrature mixer uses two local oscillators that are exactly 90 out ofphase. This is represented by a sine and a cosine. Verification can be done byadding their (complex) constituents given below using eq. 3.1.
LOI(t) = cos (2πfLOt) =e(j2πfLOt) + e(−j2πfLOt)
2(3.3)
LOQ(t) = sin (2πfLOt) =e(j2πfLOt) − e(−j2πfLOt)
2j(3.4)
Their amplitude spectra are shown in figure 3.2 (a) and (b). To see how the complexmixer operation results in an uneven output spectrum, eq. 3.2 is shown graphicallyin figures 3.2 (c) and (d). In (c) the Q path is placed ’in quadrature’ by multiplyingwith j. The resulting uneven spectrum is shown in figure 3.2(d). The magnitude
-fLO f
LO
Im
0
Re
0 f
(a) FLOI(t)
Im
Re
Im
Re
-fLO f
LO
00 f
(b) FLOQ(t)
Im
Re
-fLO
fLO
0 f
(c) j · FLOQ(t)
Im
Re
0
fLO
0 f
(d) FLOI(t) + j · LOQ(t)
Figure 3.2: Amplitude spectra of the complex mixer constituents
spectra of the RF signal is shown in figure 3.3(a). The magnitude spectra of thelocal sine and cosine oscillators are identical. Therefore, only |LOI(f)| needs to beshown in figure 3.3(b). The resulting down mixed signals I and Q also have identicalmagnitude spectra. |YI(f)| is shown in figure 3.3(c). The only difference is that thephase of the I path is 90 behind on Q. With these mathematical principles, theresulting signal obtained by quadrature down conversion of the band-pass signalx(t) is called y(t):
y(t) = x(t) · ej2πfLOt (3.5)
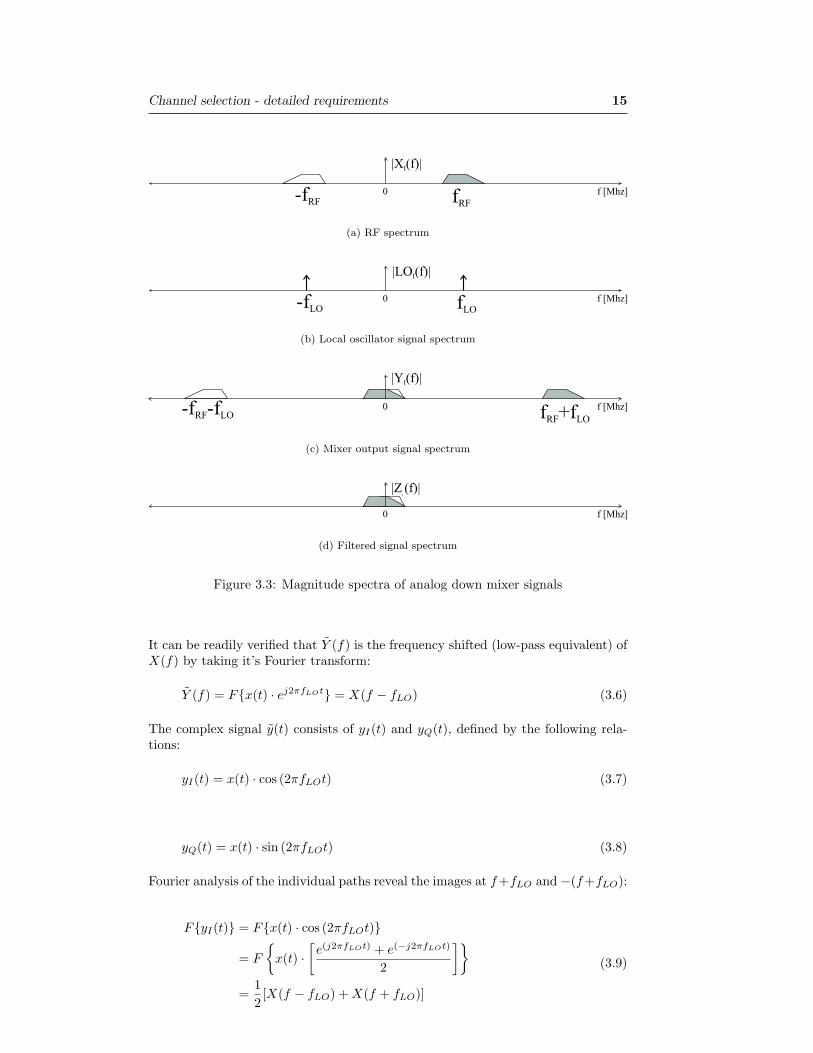
Channel selection - detailed requirements 15
f [Mhz]0
|X (f)|I
-fRF fRF
(a) RF spectrum
-fLO fLO
|LO (f)|I
f [Mhz]0
(b) Local oscillator signal spectrum
|Y (f)|I
f [Mhz]0-fRF-fLO fRF+fLO
(c) Mixer output signal spectrum
(d) Filtered signal spectrum
Figure 3.3: Magnitude spectra of analog down mixer signals
It can be readily verified that Y (f) is the frequency shifted (low-pass equivalent) ofX(f) by taking it’s Fourier transform:
Y (f) = Fx(t) · ej2πfLOt = X(f − fLO) (3.6)
The complex signal y(t) consists of yI(t) and yQ(t), defined by the following rela-tions:
yI(t) = x(t) · cos (2πfLOt) (3.7)
yQ(t) = x(t) · sin (2πfLOt) (3.8)
Fourier analysis of the individual paths reveal the images at f+fLO and −(f+fLO):
FyI(t) = Fx(t) · cos (2πfLOt)
= F
x(t) ·
[e(j2πfLOt) + e(−j2πfLOt)
2
]
=12[X(f − fLO) + X(f + fLO)]
(3.9)
16 Chapter 3
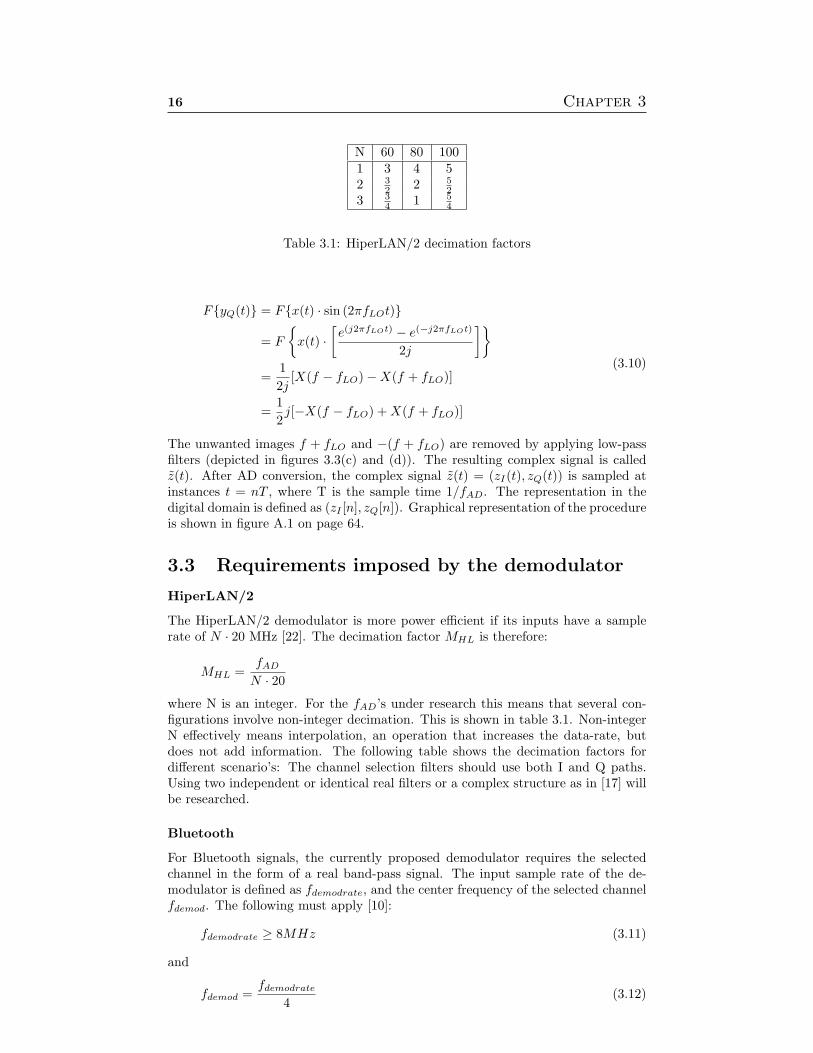
N 60 80 1001 3 4 52 3
2 2 52
3 34 1 5
4
Table 3.1: HiperLAN/2 decimation factors
FyQ(t) = Fx(t) · sin (2πfLOt)
= F
x(t) ·
[e(j2πfLOt) − e(−j2πfLOt)
2j
]
=12j
[X(f − fLO)−X(f + fLO)]
=12j[−X(f − fLO) + X(f + fLO)]
(3.10)
The unwanted images f + fLO and −(f + fLO) are removed by applying low-passfilters (depicted in figures 3.3(c) and (d)). The resulting complex signal is calledz(t). After AD conversion, the complex signal z(t) = (zI(t), zQ(t)) is sampled atinstances t = nT , where T is the sample time 1/fAD. The representation in thedigital domain is defined as (zI [n], zQ[n]). Graphical representation of the procedureis shown in figure A.1 on page 64.
3.3 Requirements imposed by the demodulator
HiperLAN/2
The HiperLAN/2 demodulator is more power efficient if its inputs have a samplerate of N · 20 MHz [22]. The decimation factor MHL is therefore:
MHL =fAD
N · 20
where N is an integer. For the fAD’s under research this means that several con-figurations involve non-integer decimation. This is shown in table 3.1. Non-integerN effectively means interpolation, an operation that increases the data-rate, butdoes not add information. The following table shows the decimation factors fordifferent scenario’s: The channel selection filters should use both I and Q paths.Using two independent or identical real filters or a complex structure as in [17] willbe researched.
Bluetooth
For Bluetooth signals, the currently proposed demodulator requires the selectedchannel in the form of a real band-pass signal. The input sample rate of the de-modulator is defined as fdemodrate, and the center frequency of the selected channelfdemod. The following must apply [10]:
fdemodrate ≥ 8MHz (3.11)
and
fdemod =fdemodrate
4(3.12)

Channel selection - detailed requirements 17
fdemod M fAD
[MHz] 60 80 1002 8 15
2 10 152
2.5 10 6 8 10
Table 3.2: Bluetooth decimation factors
To minimize processing, fdemodrate must be kept as low as possible. fdemod = 2MHz with 8 samples per symbol or with fdemod = 2.5 MHz with 10 samples persymbol will be researched. The decimation factor M (MBT for Bluetooth signals)thus becomes:
MBT =fAD
fdemod(3.13)
With fAD = 80MHz, MBT must be 10 or 8 respectively. For the other fAD’s underresearch the consequences are shown in table 3.2.
3.4 Channel selection system
The currently proposed analog front-end and demodulator architectures have sev-eral implications for the channel selection system. As shown in figure 3.4, twoseparate demodulators are used, the HiperLAN/2 demodulator requiring quadra-ture inputs, and the Bluetooth demodulator doesn’t. However, the incoming signalsare in quadrature, so for Bluetooth a suitable conversion method must be chosen.The following sections will discuss the matters separately for HiperLAN/2 and Blue-tooth.
bitsd[n]
d [n]bits
d [n]Q
I
HiperLAN/2
demodulator
bits Bluetooth
demodulator
d[n]
Figure 3.4: Demonstrator demodulators
HiperLAN/2
With the proposed demonstrator architecture, the filter requirements of section 2.4can be used. Both I and Q paths can be filtered independently or in quadrature witha complex filter structure (shown in figure 3.5). Generally, full complex filters have2 filters for each signal (one for the real part of the complex filter coefficients andone for the imaginary part) [13]. The advantage of complex filters is that frequencyresponses with uneven symmetry can be achieved. However, since the HiperLAN/2channel selection requirements do not specify this requirement, two identical realfilters can be used.
Bluetooth
A chunk of Bluetooth signals is presented at baseband by the analog front-end. Thepositive and negative spectra of the different channels are occupying the same space

18 Chapter 3
z[n]Filte r a nd
de cima te
z [n] a [n] = d [n]
z [n]a [n] = d [n]
I
Q
II
Q
d[n]
Q
Figure 3.5: HiperLAN/2 channel selection
(as shown in figure 2.5). Both I and Q paths are needed to preserve all information.On the other hand, the demodulator requires a single signal input, containing a realband-pass signal. Thus, somewhere inside the digital channel selection system, Iand Q paths must be combined. An important design option is when to do this.
As Soon As Possible (ASAP)
With two signal paths at the input, all signal processing operations must be donefor both paths. This roughly doubles the amount of work. A first impulse wouldbe to minimize filter operations by combining I and Q paths right away. This canbe done by using the Hilbert transform (discussed in Appendix B). By taking theHilbert transform of one signal path and adding it to the other, the upper or lowersideband is chosen. The sign bit of the adder changes the selection of upper/lowersideband. The consequences of this approach are that frequency translation must
z[n]Frequency
transla tion
Filte r and
decima te
Hilbe rt
and add
z [n] a[n] b[n]
z [n]Q
I d[n]c[n] d[n]
Filter
Figure 3.6: Bluetooth ASAP channel selection system
be done after some filtering, because mixer images of strong interferers can occupythe fdemod region. And after mixing the wanted channel to fdemod with a realmixer, additional filtering is required to remove the mixer image of the selectedchannel. This also implies that a channel selection filter (located in the filter anddecimate sub-block) must be reconfigured for every channel (and thus every hop).The filter specifications for Bluetooth channels with carrier frequencies ranging fromfdemod = 0.5, 1.5, 2.5, . . . , 9.5 MHz are frequency shifted versions of figure 2.8. Forinstance, if the selected channel has fc = 2.5MHz the specifications are:
• Minimum attenuation ≤ −0.838 MHz: 64 dB1
• Minimum attenuation at ≤ 0.838 MHz: 54 dB
• Stop band: 1.163− 1.838 MHz, minimum attenuation: 24dB
• Transition band: 1.838− 2.163 MHz
• Pass-band: 2.163− 2.838 MHz
• Transition band: 2.838− 3.163 MHz1The required attenuation of the negative frequencies must be provided by the Hilbert trans-
former.

Channel selection - detailed requirements 19
Function Parameter ValueADC fAD[Ms/s] 80Analog front-end output Chunks 20 MHz
Table 3.3: Parameters common to both Bluetooth and HiperLAN/2 channel selec-tion - part II
• Stop band: 3.163− 3.838 MHz, minimum attenuation: 24
• Minimum attenuation at ≥ 3.838 MHz: 54 dB
• Minimum attenuation at ≥ 4.838 MHz: 64 dB
As Late A Possible (ALAP)
If the complex signal pair (zI [n], zQ[n]) is preserved, channel selection filtering canbe done by using complex filters. One advantage of this approach is that the wantedchannel can be frequency shifted to fdemod without worrying about images. Withan fAD = 80 Ms/s, the fundamental interval of the filters (operating at the samerate) is twice the size of the signal band. All signals in the negative side of thefrequency spectrum can be shifted to −fdemod and everything in the positive sideto +fdemod. The stronger interference signals are also shifted but because of theavailable spectral space, they will not fold back into the +/− fdemod region. A fixedcomplex filter then filters out the signal at either +/− fdemod. After combination ofboth signal paths the signal spectrum is even again and ready for demodulation. Thepenalty for this functionality is that a complex filter is up to 4 times larger than areal filter. Furthermore, the local oscillator required for frequency translation mustbe running faster than the sample rate. A more feasible approach is to do filteringand decimation first, followed by a combined Hilbert and frequency translation.The mixer consists of two local oscillators with a 90 degrees phase difference. Then,the output signals can be added or subtracted to select the upper or lower sideband.This system will be referred to as the ALAP model and shown in figure 3.7. The
z[n]Fre que ncy
tra nsla tion
Filte r a nd
de cima te
Select
USB/LSB
z [n] a [n] b [n]
c[n]
(=d [n])
z [n] a [n] b [n]
I
Q
II
Q Q
d[n]
Figure 3.7: Bluetooth ALAP channel selection
filter specification are derived the same was as for ASAP but now also negativefrequencies are used.
3.5 Conclusions
From the information so far, the common system specifications in table 3.3 canbe derived. The filter type and phase requirements for both Bluetooth and Hiper-LAN/2 still aren’t fixed. FIR (and thus linear phase) filters will be used as a startingpoint. Referring to table 2.1 (part I) on page 11, two questions have been answeredfor the common requirements. These are listed in table 3.3 (part II).

20 Chapter 3
Function Parameter ValueDemodulator Input Complex
Rate [Ms/s] 20 or 40fdemod [MHz] 0
Analog front-end output Quadrature YesFrequency translation No
Filters Complex No
Table 3.4: HiperLAN/2 requirements - Part II
HiperLAN/2
HiperLAN/2 channel selection remains relatively straightforward. No digital fre-quency translation is necessary and the quadrature inputs both pass through a low-pass filter, decimator and are ready for demodulation. With fdemodrate,HL = N · 20Msps, the decimation factor MHL = 2 or 4. Table 3.4 lists the known and unknownparameters so far. The proposed system for design was discussed in section 3.4, andshown in figure 3.5. The proposed channel selection filters are real. Chapter 4 willdiscuss the possible contents of the sub-block filter and decimate.
Bluetooth
Filter specifications are (a frequency translated version of those) specified in figure2.8. Phase linearity is still assumed to be of large importance for correct demodula-tion of Bluetooth signals. Based on filter operations the first goal will be to designa channel selection system with real signals. The complex implementation will bethe alternative approach when the real system does not meet requirements. In table3.5, the known and unknown design parameters are listed. The proposed system for
Function Parameter ValueInput signals Quadrature YesFilters Complex MaybeDecimation M 10 or 8Demodulator Input Real
Rate [Ms/s] 8 or 10fdemod [MHz] 2.0 or 2.5
Table 3.5: Bluetooth requirements - Part II
design is the ASAP approach from section 3.4, and shown in figure 3.6. Chapter4 will discuss the possible contents of the sub-blocks filter and decimate and filter.In chapter 5 the frequency translation sub-block will be addressed.

4Filter and Decimate
4.1 Introduction
The top level design considerations discussed in chapter 3 have lead to two proposedsystems. Both systems contain a filter and decimate block of which the implemen-tation will be researched in this chapter. For HiperLAN/2 the proposed system fordesign was discussed in section 3.4, and shown in figure 3.5. A pair of real low-passfilters will be researched. For Bluetooth the proposed system design is the ASAPapproach from section 3.4, and shown in figure 3.6. In this case the aim is finding asuitable combination of (real) filters to do channel selection. Note that this chaptercontains valuable information for the design of the post-frequency-translation filter,but this filter will not be explicitly discussed until chapter 6. Filter design parame-ters are discussed, followed by a derivation of a performance figure to compare theirmerits. Then, several filter types and design methods are discussed. The primaryfocus will be on Finite Impulse Response (FIR) [8], [21], [12] filters because of theirstability 1 and linear phase characteristics. In digital signal processing CascadedIntegrator Comb (CIC) filters are also commonly used for decimation purposesand they will also be addressed. Then, a brief investigation into Infinite ImpulseResponse (IIR) filters is done.
4.1.1 Design parameters
To design a filter, the specifications must be translated into parameters for the de-sign. The following terminology is used (as in [21]). Strictly speaking, the termfrequency and the unit Hertz may only be used in the analog domain. But, foreasier comprehension and more intuitive filter design, these terms will also be as-sociated with the digital domain. Filter operations are now done on arrays ofnumbers, which are sampled (and quantified) representatives of the original analogsignal. The sample time is the inverse of the sample-rate (or -frequency) of theAD converter. The operating frequency of the digital filter defines its fundamental(Nyquist) interval. Digital filters are specified and designed relative to their operat-ing rate. If the digital filter operates at the sample frequency ffilter = fsample, it’sfundamental interval ranges from −ffilter/2 to ffilter/2. This can be related to theangular frequency interval −π to π (rad/s). The pass- and stop-band frequenciesare thus normalized and do not specify numbers in the (analog) unit Hz2. Otherdesign parameters (that are also illustrated in figure 4.1) are defined as follows:
1FIR filters do not have feedback and therefore do not oscillate, even with truncated coefficients2Although it is sometimes more intuitive to talk about digital filters as if they were specified
in the analog domain. In this report too, familiar terms like Hertz will sometimes be used.
21
22 Chapter 4
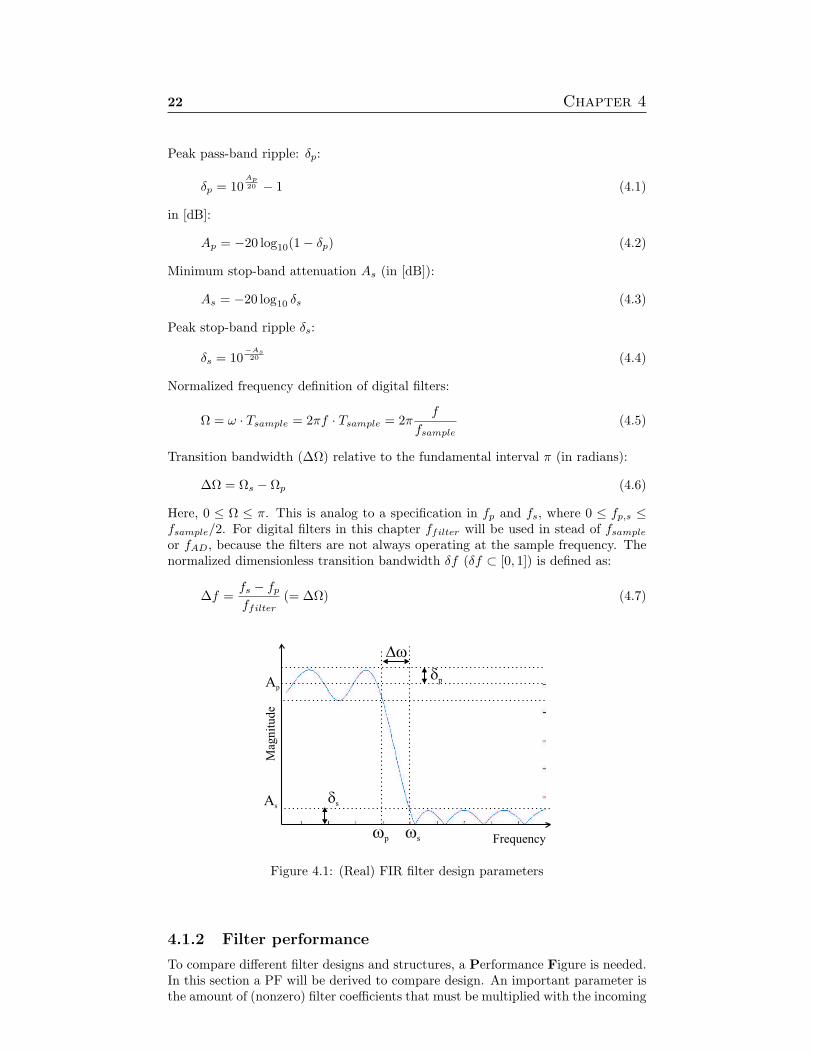
Peak pass-band ripple: δp:
δp = 10Ap20 − 1 (4.1)
in [dB]:
Ap = −20 log10(1− δp) (4.2)
Minimum stop-band attenuation As (in [dB]):
As = −20 log10 δs (4.3)
Peak stop-band ripple δs:
δs = 10−As20 (4.4)
Normalized frequency definition of digital filters:
Ω = ω · Tsample = 2πf · Tsample = 2πf
fsample(4.5)
Transition bandwidth (∆Ω) relative to the fundamental interval π (in radians):
∆Ω = Ωs − Ωp (4.6)
Here, 0 ≤ Ω ≤ π. This is analog to a specification in fp and fs, where 0 ≤ fp,s ≤fsample/2. For digital filters in this chapter ffilter will be used in stead of fsample
or fAD, because the filters are not always operating at the sample frequency. Thenormalized dimensionless transition bandwidth δf (δf ⊂ [0, 1]) is defined as:
∆f =fs − fp
ffilter(= ∆Ω) (4.7)
dp
wp ws
Mag
nit
ude
Frequency
ds
Ap
As
Dw
Figure 4.1: (Real) FIR filter design parameters
4.1.2 Filter performance
To compare different filter designs and structures, a Performance Figure is needed.In this section a PF will be derived to compare design. An important parameter isthe amount of (nonzero) filter coefficients that must be multiplied with the incoming

Filter and Decimate 23
samples. For FIR filters, this amount is equal to the impulse response length. Theamount of multiplications and additions performed per input sample is anotherparameter. Symmetrical FIR filters for instance can (in some cases) be implementedwith half the amount of multiplications per second. Other filters are optimized sothey do not need multiplications at all. The following subsections will define howthese properties are used.
Filter coefficients
The filter coefficients are generally stored in registers with delay lines in between.A FIR filter of order N has N+1 filter coefficients in the feed forward path. A directform FIR filter structure visualizes this best (see figure 4.2(a). This is a 2nd orderfilter (two delay elements) with 3 coefficients. An IIR filter of order N can have upto N+1 coefficients in the feed forward and feed-back path (see figure 4.2(b)). Thiscan amount up to 2 · (N + 1) filter coefficients. To reduce the amount of adders theIIR filter structure can also be implemented in canonical form (as shown in figure4.2(c)).
Operations per second
The calculation of one output sample involves multiplying (N+1) previous sampleswith the filter coefficients and adding their results. Thus, for each input sample,N+1 multiplies and N+1 accumulates are done. If symmetric filter coefficients areused, in common architectures one Multiply ACcumulate operation can process 2input samples [19]. So for each input sample (N + 1)/2 MACs are done. Other fil-ter implementations are optimized to remove multiplications, leaving only additionsand/or subtractions. Therefore, this thesis will talk about ACs/s (Accumulates persecond), and MULTs/s (MULTiplications per second) and MACs. The computa-tional complexity of a filter can thus be defined as a weighed3 sum of MACs/s,ACs/s and MULTs/s. The operating rate of the filter is equal to the incomingnumber of samples (per second). It is defined by the operating frequency4 of thefilter ffilter. Example: a FIR filter of order 32 processes 8 million samples persecond using only MAC operations will have a performance figure of:
PF = (N + 1) · ffilter = 33 · 8 · 106 = 264 · 106 MACs/s (4.8)
If the filter implementation takes advantage of the symmetric property this is di-vided by two:
PF =(N + 1) · ffilter
2= 132 · 106 MACs/s (4.9)
Now if the filter is followed by decimation, polyphase implementation can reduce thisfigure with a factor M (the decimation factor). Choosing M = 4 the performancefigure thus becomes:
PF =(N + 1) · ffilter
2 ·M = 33 · 106 MACs/s (4.10)
Power consumption
An important design constraint is the power consumption. In this report, it is as-sumed that the power is directly proportional to the aforementioned PF. In case of
3The weight factors for the performance figures are yet to be determined based on the soft- orhardware that will be used to implement the filters on (FPGA/DSP/GPP)
4The operating frequency of a filter is equal to the highest sample rate it processes, either atthe input or the output.

24 Chapter 4
z-1
z-1
C3C2C1
x(n) x(n-1) x(n-2)
y(n)
(a) FIR filter: only feed forward (nonrecursive)
z-1
z-1
z-1
z-1
z-1
C6C5C4
C3C2C1
x[n] x[n-1] x[n-2]
y[n-2] y[n-1]
y[n]
(b) IIR filter: additional feed back (recursive)
x[n]) x[n-1] x[n-2]
y[n-2] y[n-1]
y[n]
z-1
z-1
z-1
z-1
z-1
C6C5C4
C3C2C1
(c) IIR filter: reduced # adders
Figure 4.2: 2nd order FIR and IIR filter implementations
hardware implementation, the word lengths are also in important factor. The wordlength of the input samples will be specified as soon as an AD converter is chosen,which remains to be done in the future. However, as the stated power relationincreases or decreases linearly with different word lengths this does not hinder thegoal of finding optimal filter systems. Data-sheets of DSP processors usually specifypower consumption in terms of several milliwatts per million instruction per second(mW/MIPS) at a certain supply voltage. This can also be related to the perfor-mance figure of section 4.1.2. FPGA power consumption depends on the amountof configurable login blocks that are used for a specific design. With a given powerfigure for a fully ”loaded” FPGA board initial estimates can be given.

Filter and Decimate 25
4.2 FIR
4.2.1 Least squared error
This method optimizes a filter according to an error criterion based on the squareof the deviation of the actual response, compared to the desired (ideal) response.The error can be seen as the sum of neglected coefficients, because only a finitenumber of filter elements is used. Thus, smaller errors are obtained by increasingthe filter length. When a direct approximation of an ideal low-pass filter is doneusing the inverse Fourier transform, the sharp transition bands obtained from longfilters suffer from Gibbs’ phenomenon [8]. This phenomenon is the overshoot in theamplitude frequency response due to the discontinuity at cut-off and does not reduceto 0 as N →∞. By relaxing the constraints on the transition band (smoothing thediscontinuity), overshooting is greatly reduced. This is discussed in section4.2.2.Filter lengths are largely dependent on ∆f as defined in eq. 4.7. Reducing theprocessing speed (ffilter) of the digital filter effectively lowers the value for ∆f , thusreducing the filter length. Applications of this technique will be further discussedin section 4.2.5.
4.2.2 Windowing
To reduce the effects of truncation of the impulse response, filter coefficients can bewindowed [21]. The discontinuity of the impulse response is reduced by multiplyingthe coefficients with a window function. This way the coefficient values graduallydecrease to zero. The length of the window equals the number of filter taps. Table4.1 lists several window types and characteristics [4]. The parameter δm is defined asmin(δp, δs). In other words: a large stop-band attenuation automatically requiresa small pass-band ripple and vice versa. The shape of the window defines themaximum stop-band attenuation (and thus δp). The transition bandwidth of thewindow filters is defined by the filter order. The Kaiser window is actually a family ofwindows generated from a common equation (Bessel functions). Given a stop-bandattenuation, the β factor is calculated with eq. 4.11. Then, either N is determinedfrom the transition width or vice versa.
Window δp As [dB] ∆f
Rectangular 0.7416 21 0.9/NKaiser (β = 2.12) 0.270 30 1.5/NHann (Raised cosine) 0.0546 44 3.1/NKaiser (β = 4.55) 0.0274 50 2.9/NHamming 0.0194 53 3.3/NKaiser (β = 6.76) 0.00275 70 4.3/NBlackman 0.0017 74 5.5/NKaiser (β = 8.96) 0.000275 90 5.7/N
Table 4.1: Windowed filter design characteristics
β =
0.1102(As − 8.7) if As > 500.5842(As − 21)0.4 + 0.07886(As − 21) if 21 < As < 500 if As < 21
(4.11)
4.2.3 Uniform approximation
This design method, also referred to as equiripple method [21] aims to minimize themaximal deviation from the desired amplitude frequency response for a given filter

26 Chapter 4
length. A tolerance band may be defined in the pass- and stop-band wherein theapproximate amplitude of the frequency response follows a wave-like curve. Theminima and maxima of the curve touch the upper and lower limits of the band.The Parks-McClellan 5 algorithm finds optimum equiripple linear-phase FIR filters.They are ”optimal” in the minimax sense of magnitude frequency response. Inother words: the allowed error within the pass- and stop-bands is spread across thefrequency response. This spreading can be adjusted by changing the weight factorsand in the transition band there is no constraint. The algorithm finds the minimumamount of filter coefficients for which the maximum error is within the specifiedbounds. The maximum error is determined from the error function E(Ω), definedas:
E(Ω) = H(Ω)−Hdesired(Ω) (4.12)
Hdesired(Ω) is the magnitude response of the desired filter. By minimizing |E(Ω)| anoptimal (equiripple) filter design is obtained that approximates the desired responsewithin the specified error margin. Estimates of the required filter order based onthis method have been formulated by Kaiser (eq. 4.13) and Bellanger (eq. 4.14)[21],[12]. They found:
Nkai =−20 · log10
(√δpδs − 13
)
14.6∆f(4.13)
Nbel =23· log10
(1
10δpδs
)· 1∆f
(4.14)
In these formulae, the estimated filter order N is proportional to the maximumallowable pass-band ripple (Ap/δp), stop-band attenuation (As/δp) and inverselyproportional to the transition bandwidth. Strictly speaking, these estimation for-mulae are only valid for uniform approximation (optimum equiripple) FIR filterdesigns. However, for each set of parameters (fp, fstop, δp and δs) it turns out thatan equiripple filter has the smallest possible order N [21]. Hence, these estimationsfor the filter order can be used as a guideline (minimum boundary) for other FIRfilter designs. The filter specifications for Bluetooth and HiperLAN/2 (referringto section 2.4) do not specify the allowed pass-band ripple. Assuming δp = 0.01allows some estimates for N , but the required filter order does have a substantialdependency on the allowed pass-band ripple. Therefore, estimates can change sig-nificantly if other values for δp were to be used (see figure 4.4). The filter lengthsrequired for the Bluetooth case are unpractical. This is of course due to the small(normalized) transition bandwidth (∆f). To reduce the filter lengths, ∆f can beincreased by using multi stage and/or multi rate techniques.
4.2.4 Influence of ∆f and δp on N
The minimum stop-band attenuation (and thus the allowable stop-band ripple) isfixed by the specifications. The two remaining most important parameters de-termining the estimated required filter order N are the pass-band ripple δp andtransition bandwidth. The reduction of the filter order as a function of the pass-band ripple and transition band width will now be calculated by using thee examplefilters. These filters are designed using specifications that are loosely based on theBluetooth low-pass filter requirements of section 2.4. These specifications are shownin figure 4.3 and are only chosen as examples to demonstrate the behavior of theestimation formula for variations in δp and ∆F . The stop-band ripple is defined bythe stop-band attenuation using the relation from eq. 4.4.
5The Psrks-McClellan algorithm is also known as the Remez exchange algorithm

Filter and Decimate 27
dB
0-24
-54-64
0.34 0.66 1.34 1.66 2.34 2.66 3.34
f [MHz]
(a) Filter H1: -24 dB1.2 MHz
dB
0-24
-54-64
0.34 0.66 1.34 1.66 2.34 2.66 3.34
f [MHz]
(b) Filter H2: -54 dB2.8 MHz
dB
0-24
-54-64
0.34 0.66 1.34 1.66 2.34 2.66 3.34
f [MHz]
(c) Filter H3: -64 dB3.8 MHz
Figure 4.3: Filter specifications used for δp,∆f influence example
Variations in ∆f
Variations of ∆f cannot be directly applied because that would changes the givenfilter specifications. Although this is possible in an example such as this, the idea isto use the gained knowledge in the actual design. Therefore the operating frequencyof the filter is a variable, and equivalent by the following relation (eq. 4.7):
fs − fp
ffilter
In this case, the filter frequency is directly related to the AD converter frequency(ffilter = fAD). Appropriate values for this project are in the range of 60 to 100MHz. The fundamental interval of the filters (f = 0..ffilter/2) thus ranges from 30to 50 MHz. By increasing ffilter, the normalized transition bandwidth ∆f decreasesand the estimated required filter order goes up. The values for the estimated filterorder N are calculated using Bellangers formula (refer to eq. 4.14)). The resultsare shown in figure 4.4(a). Three lines are plotted for the three different filters asa function of the filter frequency. The transition bandwidth of H1 is very smallcompared to the fundamental interval of the filter and this causes the required filterorder to be high. For H2 and H3, ∆f is larger, resulting in lower filter orders.Note that this is despite the larger required stop-band attenuation. The gradientindicates the sensitivity of the order to a change in the transition band-width. inestimated filter order is larger for the sharpest filter (H1) and thus benefits mostfrom a relative decrease of ∆f .
Variations in δp
Figure 4.4(b) shows the influence of the allowed pass-band ripple at a fixed samplerate of 60 MHz for the same three filters . Again, H1 benefits most from variationsin the parameter. Its estimated order reduces by 50% with a factor 10 increaseof δp. For H2 and H3 the allowed stop-band ripple δs is smaller and the δp · δs
product remains small, allowing less drastic improvements. Thus the conclusioncan be drawn that for filters with large stop-band attenuation (resulting in a smallδs) the magnitude of pass-band ripple is not a significant factor in the given range.
4.2.5 Multi-rate
It has been shown in section 4.2.4 that for the Bluetooth channel selection filterssignificant size reduction can be achieved by lowering ffilter. In digital signal pro-

28 Chapter 4
–24 dB, f = 1.2 MHz
–54 dB, f = 2.8 MHz
–64 dB, f = 3.8 MHz50
100
150
200
250
300
350
N
60 70 80 90 100
f [MHz]filter
s
s
s
(a) ∆f influence, δp = 0.01
100
200
300
400
N
0.04 0.08 0.12 0.16 0.2
Passband ripple
–24 dB, f = 1.2 MHz
–54 dB, f = 2.8 MHz
–64 dB, f = 3.8 MHz
s
s
s
(b) δp influence (ffilter = 60 MHz)
Figure 4.4: Parameter sensitivities
cessing this can be done by decimation.
Decimation
The device lowering the rate at which input samples arrive is called a decimator[21]. A decimator periodically passes one sample through and discards the rest. Forexample, a decimation factor M = 10 means 1 sample is passed through and 9 arediscarded. The operating rate of the decimator output is thus one tenth of its input(eq. 4.15).
fout =fin
M(4.15)
The consequences of this rate change are alias spectra at multiples of fin/M . As-sume a filter system as shown in figure 4.5(d). To demonstrate the behavior ofdecimation, both filters are initially all-pass (all signals are passed through un-changed). The first filter operates at frequency ffilter = fin = FAD. At its input,a channel is present near baseband (shown in figure 4.5(a)). It is a real bandpasssignal with carrier frequency fc and having an even spectrum, both positive (grey,+fc) and negative frequency components (white, −fc) are shown. The fundamental
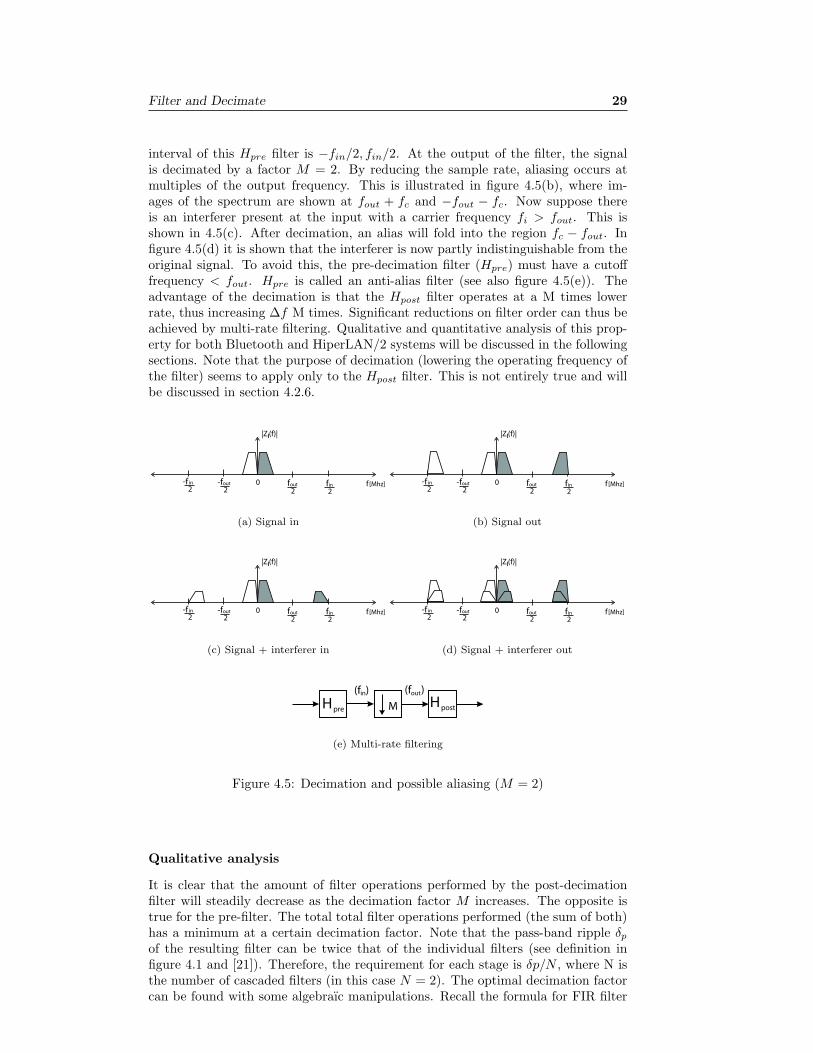
Filter and Decimate 29
interval of this Hpre filter is −fin/2, fin/2. At the output of the filter, the signalis decimated by a factor M = 2. By reducing the sample rate, aliasing occurs atmultiples of the output frequency. This is illustrated in figure 4.5(b), where im-ages of the spectrum are shown at fout + fc and −fout − fc. Now suppose thereis an interferer present at the input with a carrier frequency fi > fout. This isshown in 4.5(c). After decimation, an alias will fold into the region fc − fout. Infigure 4.5(d) it is shown that the interferer is now partly indistinguishable from theoriginal signal. To avoid this, the pre-decimation filter (Hpre) must have a cutofffrequency < fout. Hpre is called an anti-alias filter (see also figure 4.5(e)). Theadvantage of the decimation is that the Hpost filter operates at a M times lowerrate, thus increasing ∆f M times. Significant reductions on filter order can thus beachieved by multi-rate filtering. Qualitative and quantitative analysis of this prop-erty for both Bluetooth and HiperLAN/2 systems will be discussed in the followingsections. Note that the purpose of decimation (lowering the operating frequency ofthe filter) seems to apply only to the Hpost filter. This is not entirely true and willbe discussed in section 4.2.6.
f [Mhz]
|Z (f)|I
fout
2fin
2
0-fout
2
-f in
2
(a) Signal in
f [Mhz]
|Z (f)|I
fout
2fin
2
0-fout
2
-f in
2
(b) Signal out
f [Mhz]
|Z (f)|I
fout
2fin
2
0-fout
2
-f in
2
(c) Signal + interferer in
f [Mhz]
|Z (f)|I
fout
2fin
2
0-fout
2
-f in
2
(d) Signal + interferer out
MHpreHpost
(f ) (f )in out
(e) Multi-rate filtering
Figure 4.5: Decimation and possible aliasing (M = 2)
Qualitative analysis
It is clear that the amount of filter operations performed by the post-decimationfilter will steadily decrease as the decimation factor M increases. The opposite istrue for the pre-filter. The total total filter operations performed (the sum of both)has a minimum at a certain decimation factor. Note that the pass-band ripple δp
of the resulting filter can be twice that of the individual filters (see definition infigure 4.1 and [21]). Therefore, the requirement for each stage is δp/N , where N isthe number of cascaded filters (in this case N = 2). The optimal decimation factorcan be found with some algebraıc manipulations. Recall the formula for FIR filter

30 Chapter 4
order N (eq. 4.14):
N ≈ 23· log10
(2
10δpδs
)·(
1∆f
)
For a given filter specification, this can be reduced to:
N ≈ χ
∆fwhere χ > 0
Now recall the definition of the transition bandwidth ∆f (eq. 4.7):
∆f =fstop − fpass
ffilter
The post decimation filter operates at a frequency ffilter,post = fout = fin/M .Substituting into the approximation formula:
Npost ≈ χ · fin
(fstop − fpass) ·M
Thus, for a given filter specification and input frequency, the order of the postdecimation filter is inversely proportional to M:
Npost ∝ 1M
The amount of filter operations performed by this filter, defined as the filter ordermultiplied by the operating frequency (in short: FOPS ), is given by:
FOPSpost ≈ Npost · fin
M≈ χ · f2
in
(fstop − fpass) ·M2∝ 1
M2
The FOPS of the post-decimation filter thus decrease quadratically with M. Thecutoff frequency of the pre-filter must (at the least) be equal to the output frequencyafter decimation. The pass-band of the pre-filter is taken equal to the that of thepost-filter. The stop-band of the pre-filter is chosen to exactly to cancel (attenuatue)the alias of the post-filter (see figure 4.6). The ∆fpre can thus be defined as:
f out f infpass fstop
f out f infpass f -fout stop
/\f- pre
|H |
|H |
pre
post
f [MHz]
f [MHz]
Figure 4.6: Anti aliasing filter specifications

Filter and Decimate 31
∆fpre =fout − fstop − fpass
fin
Substitute in the estimation formula and assuming fstop + fpass << fin:
Npre ≈ χ ·M1−M ·
(fstop+fpass
fout
) ∝ M
Operating at the (constant) input rate fin, the expression for the FOPSpre becomes:
FOPSpre ≈ Npre · fin ≈ χ ·M · fin
1−M ·(
fstop+fpass
fin
) ∝ M
So while the pre-filter operations increase linearly with M, the post-decimation filteroperations decrease quadratically ! Thus, for given filter specifications an optimaldecimation factor M can be found for which FOPSpre + FOPSpost is minimal.FOPStotal is a parabolic function (valley):
FOPStotal ≈ χ′
M2+ χ′′ ·M where χ′, χ′′ > 0
The minimum is found by taking its derivative and finding the roots.
HiperLAN/2 decimation
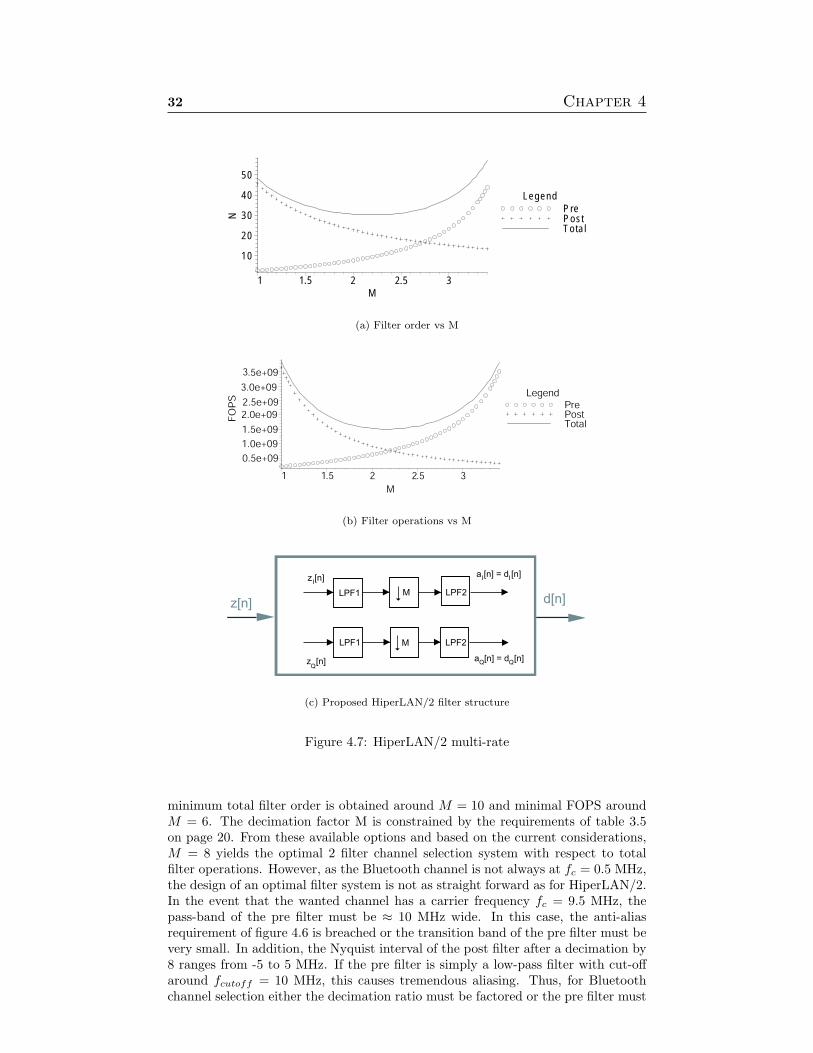
With the known parameters for HiperLAN/2, the optimal decimation factor M fora 2 filter system can be calculated with the aforementioned formulas. Referringto section 2.4 the parameters are: fpass = 8.3, fstop = 11.7 MHz, δp = 0.01 andAs = 32 dB ( δs = 2.5 · 10−2). The stop-band attenuation is chosen to be 32dB because the pre- and post-filter responses will add up to the required 51 dBattenuation as total filter response. The results in figures 4.7(a) and (b) show thatfor HiperLAN/2 a decimation factor of M = 2 is optimal for both combined filterorder and performance. The decimation factors permitted by the requirements oftable 3.4 on page 20 are 2 and 4, so based on the current calculations M = 2is chosen. The proposed filter system for HiperLAN/2 will thus be that of figure4.7(c). The first low-pass filter (LPF1) is an anti-alias filter and the second low-passfilter (LPF2) performs the sharp channel selection filtering.
Bluetooth decimation
The wanted channel has a carrier frequency fc = 0.5 MHz. The input rate isthe sample rate of the AD converter fin = fAD = 80 MHz. A channel selectionfilter is designed with fpass = 0.8, fstop = 1.2 MHz, δp = 0.01 and As = 64 dB(δs = 6.3 · 10−4). The stop-band attenuation is chosen to be 64 dB, which mayseem a bit excessive. The two resulting filters will both attenuate the signal 64dB in the stop-band, and intuitively a requirement of ≈ 64/2 = 32 dB is enough.However, recalling the filter specifications (of section 2.4 on page 9): a 40 dBstronger interferer may be present only 3 MHz away at carrier frequency fi = 3.5MHz. A minimum order (equiripple) low-pass filter with a transition band from0.8 to ≈ 8.8 MHz and a required stop-band attenuation of 64 dB attenuates thesignal with carrier frequency fi with only 5 dB. Specifying a stop-band attenuationof -32 dB reduces this to ≈ 2.8 dB. Thus, the transition band of the pre-filter doesnot guarantee sufficient attenuation of strong interferers and the post filter shouldhave a stop-band attenuation of at least 60 dB. [10pt] In figures 4.8(a) and (b) theresulting estimated filter order and FOPS are shown for these parameters. The
32 Chapter 4
PrePostTotal
Legend
10
20
30
40
50
N
1 1.5 2 2.5 3M
(a) Filter order vs M
PrePostTotal
Legend
0.5e+09
1.0e+09
1.5e+09
2.0e+09
2.5e+09
3.0e+09
3.5e+09
FOPS
1 1.5 2 2.5 3
M
(b) Filter operations vs M
z[n]
z [n] a [n] = d [n]
z [n] a [n] = d [n]
I
Q
II
Q
d[n]
Q
LPF1
LPF1 LPF2
LPF2M
M
(c) Proposed HiperLAN/2 filter structure
Figure 4.7: HiperLAN/2 multi-rate
minimum total filter order is obtained around M = 10 and minimal FOPS aroundM = 6. The decimation factor M is constrained by the requirements of table 3.5on page 20. From these available options and based on the current considerations,M = 8 yields the optimal 2 filter channel selection system with respect to totalfilter operations. However, as the Bluetooth channel is not always at fc = 0.5 MHz,the design of an optimal filter system is not as straight forward as for HiperLAN/2.In the event that the wanted channel has a carrier frequency fc = 9.5 MHz, thepass-band of the pre filter must be ≈ 10 MHz wide. In this case, the anti-aliasrequirement of figure 4.6 is breached or the transition band of the pre filter must bevery small. In addition, the Nyquist interval of the post filter after a decimation by8 ranges from -5 to 5 MHz. If the pre filter is simply a low-pass filter with cut-offaround fcutoff = 10 MHz, this causes tremendous aliasing. Thus, for Bluetoothchannel selection either the decimation ratio must be factored or the pre filter must

Filter and Decimate 33
PrePostTotal
Legend
20
40
60
80
100
120
N
6 8 10 12 14 16 18
M
(a) Filter order vs M
PrePostTotal
Legend
1e+09
2e+09
3e+09
4e+09
5e+09
6e+09
7e+09
FOPS
4 6 8 10 12 14 16
M
(b) Filter operations vs M
Figure 4.8: Bluetooth multi-rate filtering
be band-pass. The following section discussing polyphase implementation of filterswill lean the scale towards factoring of M. The pre-filter will then take the role ofanti-alias filter for the first decimation.
4.2.6 Polyphase filters
If a filter is directly followed by a decimator, a lot of the calculated filter outputvalues are discarded. To avoid these unnecessary calculations, filter designs can bemodified using the Noble identities [12],[21]. These are shown in section C for quickreference. The pre filter in the configurations of figure 4.5(a) can be implementedusing a transversal structure [12],[21],[19]. Using the aforementioned identities anefficient structure is obtained, shown in 4.9. Also based on this identity and havingthe same amount of filter operations is the polyphase structure (see figure 4.10).By performing the decimation before filtering, the required amount of calculationsis reduced by a factor M. Thus, combining a filter with a subsequent decimationreduces the filter operations significantly.
HiperLAN/2 filter and decimate (FIR-only)
This method can be used to reduce the filter operations performed by the Hiper-LAN/2 anti-alias filters of figure 4.7(c). The required filter operations based ontheoretical (filter) specifications (as described in section 2.4) are as listed in table4.2. The pass- and stop-bands are calculated using the specifications of figure 4.6.

34 Chapter 4
âMU(n) y(m)
z-1
z-1
h(0)
h(1)
h(N-1)
(a) Original
âMu(n) y(m)
z-1
z-1
h(0)
h(1)
h(N-1)
âM
âM
(b) Efficient
Figure 4.9: Transversal filter structure
âMU(z) Y(z)
z-1
z-1
H (z )0
M
H (z )1
M
H (z )M-1
M
(a) Original
U(z) Y(z)
z-1
z-1
H (z)0
H (z)1
H (z)M-1
âM
âM
âM
(b) Efficient
Figure 4.10: Polyphase filter structure
The FIR order is given for an individual LPF1 or LPF2 but the PF6 listed is thesum of both filters. The total PF of the HiperLAN/2 filter and decimate systemis the sum of the PFs of the individual filters: 360 + 960 = 1320 MMAC/s. Theirmagnitude responses are shown in figure 4.11.
Bluetooth filter and decimate (FIR-only)
For the pending Bluetooth multi-rate problem this approach leads to the followingconsiderations: the decimation factor M = 8 can be divided into M1 · M2 = 8or even M1 · M2 · M3 = 8. Two stage decimation with M1 = 4 and M2 = 2reduces the signal bandwidth from 80 to 20 MHz after the first stage. The prefilter is then a low-pass filter with cut-off near 10 MHz. The post filter will thenbe a band-pass filter with Nyquist interval ranging from -10 to 10 MHz. This alsorules out the decimation factor M = 10, where the Nyquist interval would be from
6For the derivation of the performance figure please refer to section 4.1.2.
Parameter LPF1 (2x) LPF2 (2x)Ωp (f/ffilter)) 0.10 (8.28/80) 0.21 (8.28/40)Ωs (f/ffilter)) 0.35 (40− 11.7)/80) 0.29 (11.7/40)δp [dB] 0.01 0.01As [dB] 32 (δs = 2.5 · 10−2) 32 (δs = 2.5 · 10−2)FIR order 8 23MAC/s [·106] 360 960
Table 4.2: Proposed HiperLAN/2 filter and decimate system performance

Filter and Decimate 35
0 5 10 15 20 25 30 35 407
-80
-60
-40
-20
0
20
Frequency (Hz)
Ma
gn
itud
e (
dB
)
(a) Pre filter
0 2 4 6 8 10 12 14 16 18 20-80
-60
-40
-20
0
20
Frequency (Hz)
Ma
gn
itud
e (
dB
)
(b) Post filter
Figure 4.11: Proposed HiperLAN/2 channel selection filters
-8 to 8 MHz. In that case the selection of channels at fc = 8.5 and 9.5 wouldbecome impossible. So by using M1 = 4 and M2 = 2 all incoming channels can beadequately filtered after the first decimation. The post filter will be operating atthe lower rate ffilter = fAD/M1 and subsequent decimation will reduce the amountof filter operations by a factor M2. The proposed filter structure for the BluetoothASAP model is therefore that of figure 4.12. The low-pass filter acts is an anti-aliasfilter and the band-pass filter does the sharp channel selection at the lower rate.Polyphase implementation reduces filter operations of both filters. Estimates for
a[n]b[n] c[n']
e[n'']d[n'] e[n'']a[n]
LPF M1 BPF M2
Figure 4.12: Filter and decimate proposal for Bluetooth ASAP model
the required filters7 of both filters is shown in table 4.3. The constraints on theanti-alias filter LPF have been reduced because the 7th order Butterworth filter inthe analog front-end already attenuates signals > 10MHz. The thermal noise inthe system is assumed to be in the order of −37 dB and can be permitted to foldback into the pass-band once. This increases the allowable transition bandwidthto fs = 20 MHz. The stop-band attenuation is chosen to equal the required SNRfor one Bluetooth channel. The required BPF filter order is quite large, but thelow operating rate of the filter reduces the PF considerably. The total requiredMMAC/s is 170 + 895 = 1065. This PF is ≈ 3/4 of the HiperLAN/2 system PF,but this is mainly because for HiperLAN/2 two signal paths are filtered.
7The estimated filter orders are obtained by using Matlabs filter design and analysis (FDA)tool

36 Chapter 4
Parameter LPF BPFΩp,s (f/ffilter)) 0.25 (10/40),0.5 (20)/40) 0.18 (1.8/10),0.22 (2.2/10)Ωs,p (f/ffilter)) - 0.28 (2.8/10),0.32 (3.2/10)δp [dB] 0.01 0.01As [dB] 21 (δs = 8.9 · 10−2) 64 (δs = 6.3 · 10−4)FIR order 16 178MAC/s [·106] 170 895
Table 4.3: Proposed Bluetooth filter and decimate system performance
4.2.7 Complex filters
Complex filters enable the system to reject signals at finterference while preservinga wanted signal at fsignal = −finterference. This type of filter is suitable for theALAP filter and decimate section. Complex filtering use two real filters for eachinput signal. By first comparison to the ASAP filter and decimate section, acomplex filter system roughly increases the total amount of filter operations by afactor 4 (as shown in figure 4.13). However, anti-alias filtering before decimation byM1 = 4 does not require complex filters. The filter operations of the anti-alias LPFfilter thus increases by a factor 2. For the full-complex BPF filters, methods areknown for optimization. In [20] a complex FIR filter implementation is discussedusing only three multipliers and two adders. Based on this information, performance
Re(H)
Q
I
+
-
Q
Iinout
inoutRe(H)
Im(H)
Im(H)
Figure 4.13: Complex filter structure [13]
figures for the ALAP filter and decimate block can be extrapolated from table 4.3.Roughly two real LPFs and three real BPFs are needed, resulting in a total PFof 2 · 170 + 3 · 895 = 3025 MMAC/s. So far, ALAP requires roughly 3 times theprocessing required by ASAP. The comparison is not completely fair, because theHilbert transformer and the post mixer filter of the ASAP system have not beenadded yet. The system comparison in chapter 6 will reveal the true performancechampion.
4.3 CIC
Cascaded Integrator-Comb (CIC) [24],[3],[13] filters8 are multiplier-less structures,consisting of only adders, subtractors and registers. Multiplier-less structures are
8CIC filters are also known as Hogenauer filters.

Filter and Decimate 37
usually very power efficient compared to regular structures. CIC filters are gener-ally applied when large rate changes are needed. This is related to its pass-bandcharacteristics which will be discussed in a moment. The two basic building blocksof a CIC filter are an integrator and a comb. An integrator is a single pole IIR filterwith a unity feedback coefficient (eq 4.16).
y[n] = y[n− 1] + x[n] ⇔ HI(z) =1
1− z−1(4.16)
A Comb filter, running at the high sampling rate with a rate change of M is anodd-symmetric FIR filter described by eq. 4.17.
y[n] = x[n]− x[n−MD] ⇔ HC(z) = 1− z−MD (4.17)
D is a design parameter called the differential delay and can be any positive integer(but is usually limited to 1 or 2). An N stage CIC filter combines N integrator andN comb stages to an efficient structure with system transfer function (eq. 4.18).
H(z) = HNI (z)HN
C (z) =(1− z−MD)N
(1− z−1)N=
(DM−1∑
k=0
z−k
)N
(4.18)
The composite CIC filter is thus equivalent to a cascade of N uniform FIR filterstages with unit coefficients, in other words: a cascade of N boxcar filters. Thefrequency response has a low-pass characteristic. It can be obtained by evaluatingeq. 4.18 at z = e
j2πfR , where F is the frequency relative to the low sampling rate
fout = fin/M (eq. 4.19).
|H(f)| =∣∣∣∣∣sin(πDf)sin(πf
R )
∣∣∣∣∣
N
≈∣∣∣∣MD
sin(πDf)πDf
∣∣∣∣N
for 0 ≤ f ≤ 1D
(4.19)
A single stage implementation example of a CIC filter is shown in figure 4.14.In the design process M, D and N are chosen to provide acceptable pass-band
+ -
Z-D -1
Z
M
(f ) (f )in out
Figure 4.14: Single stage CIC filter implementation
characteristics. This ranges over the frequencies from zero to a predeterminedcutoff frequency fcutoff , expressed relative to the low sampling rate. Frequencybands that will alias back into the filter pass-band are given in eq. 4.20.
k
D± fc where k = 1, 2, . . . , bM/2c (4.20)
The phase response is linear in the pass-band, and the design parameters controllingthe magnitude response are demonstrated in figure 4.15(a) (b) and (c). The inputfrequency fin = 80 MHz for all plots. In figure 4.15(a), the decimation factor M = 4and differential delay D = 2. It is clear that at least a 3 stage CIC is necessary toprovide sufficient attenuation. This is necessary to prevent signals aliasing back into

38 Chapter 4
the pass-band. In figure 4.15(b) the cut-off frequency of the pass-band is adjustedby the differential delay D. In figure 4.15(c) the decimation factor is changed. Incase of Bluetooth channel selection of a carrier at fc = 0.5 MHz, these parametersare sufficient to tailor the response to replace that of the low-pass pre-filter discussedin section 4.2.5. But for higher carrier frequencies the channels will attenuated bythe filter. None of the parameters discussed improve the pass-band characteristicsenough to make this filter a feasible alternative that fits in the filter configurationof figure 4.12. For HiperLAN/2 channel selection (relatively wide channels) usageof this filter would require additional equalization, and the stop-band attenuationis very poor which introduces significant aliasing.
0 10 20 30 40-60
-50
-40
-30
-20
-10
0
Frequency [MHz]
|H| [
dB]
N=1
N=3
N=6
(a) Varying stages N (D = 2, M = 4)
0 10 20 30 40-60
-50
-40
-30
-20
-10
0
Frequency [MHz]
|H| [d
B]
D=1
D=2
D=3
(b) Varying delay D (N = 3, M = 4)
0 10 20 30 40-60
-50
-40
-30
-20
-10
0
Frequency [MHz]
|H| [d
B]
M=2
M=4
M=8
(c) Varying rate change M (D = 2, N = 3)
Figure 4.15: CIC Magnitude responses

Filter and Decimate 39
4.4 IIR
IIR filters have several undesirable characteristics such as non-linear phase, sensitiv-ity to coefficient quantization and complexity of design and analysis [21],[19],[18].On the other hand, the amount of multiplications needed to perform filter oper-ations is low compared to comparable FIR designs. Implementations of IIR filterstructures are known that will inhibit them from instability [1]. The proposed Hiper-LAN/2 system of figure 4.7(c) requires a relatively small amount of filter operationsif polyphase implementations are applied. The sensitivity of the HiperLAN/2 de-modulator can not be tested at this time because it is still under development.This section will therefore focus on Bluetooth channel selection filters. A test en-vironment will be used which includes a Bluetooth demodulator to investigate thesensitivity of the demodulator to non-linear phase response of some IIR filters.
4.4.1 Bilinear transform
A classic analog filter model can be mapped into a digital IIR using for instancethe bilinear z-transform or the impulse invariant method. The latter guaranteesthat the impulse response of the digital transfer function is the same as that ofthe analog filter. The frequency response however can vary somewhat, favoring thebilinear transform method. Here, the analog Laplace operator s is substituted byits digital counterpart z as follows [21],[19]:
s =1− z−1
1 + z−1(4.21)
The jω axis of the s-plane is mapped into the unit circle in the z-plane. The lefthalf of the s-plane maps into the region within the unit circle (resulting in a stablesystem). The right half maps into the region outside the unit circle, representing anunstable system. Sometimes pre-warping is required to obtain the desired cut-offfrequency in the digital domain .
4.4.2 Group delay
The phase response of a digital filter θ(Ω) is obtained by taking the argument of it’stransfer function. To find the linear-ness of this response the (frequency) derivativeis taken. The function is the measure for phase non-linearity and called the Groupdelay τ :
τ(Ω) =dθ
dΩ(4.22)
For FIR filters this value is a constant, i.e. every spectral component of the inputsignal is delayed τ seconds. The frequency dependent variations in group delayfor IIR filters is different for several design methods. It can be seen as a designparameter and traded off against for instance transition band width. For instancean elliptic filter has very steep transitions, resulting in higher group delays. TheButterworth and Chebyshev Type II filters typically have low group delay, and thiscauses broader transition bands and stop-band ripples.
4.4.3 Filter types
Butterworth
A well known filter design method in the analog world can be used in the digitaldomain as well using (for instance) the bilinear transform. The pass-band is max-imally flat and the stop-band attenuation is well over 30 dB. The required filter

40 Chapter 4
order is 28. The magnitude response is given by:
|H(Ω)|2 =1
1 + (Ω)2N(4.23)
The poles are thus distributed along a circular arc at locations separated by π/Nradians.
Chebyshev
Chebyshev filters typically have narrower transition band widths compared to But-terworth filters. The penalty for this steeper transition is phase non-linearity. Thereare two types of filters based on the following Chebyshev polynomial:
ChN (ω) = cos (N cos(ω)) (4.24)
The first type (I) has a ripple in the pass-band and is smooth in the stop-band.The squared magnitude response is given by:
|H(Ω)|2 =1
1 + ε2Ch2N (Ω)
(4.25)
If maximal flatness is desired in the pass-band, this can be done at the expense ofripples in the stop-band. Now, the squared magnitude response is given by:
|H(Ω)|2 =1
1 + 1ε2Ch2
N (Ω)
(4.26)
This is called a Chebyshev Type II filter. Both types of filter meet specificationswith a minimal order of 12.
Elliptic
Elliptic or Cauer filters have both equiripple pass- and stop-bands and a very narrowtransition band. The phase is (therefore) highly nonlinear. The specified transitionband width is met with N=8.
All-pass correction filters
A technique that can be applied to reduce the non-linearities of IIR filter phaseresponses is the application of (all-pass) correction filters9 [18]. A filter can bedesigned to have arbitrary phase response and unity magnitude response. If usedin cascade with an IIR filter, the total phase response can be designed to be morelinear. The size of the all-pass correction filter must be equal to that of the filter itis cascaded with. Thus, the feasibility of this method is questionable and dependson the sensitivity of the demodulator to non-linear phase response.
Fixed point stability
The IIR filters that are used for this model were designed using the MATLAB fil-ter design and analysis toolbox. The filter transfer functions that have been usedare stable for 16 bit fixed point implementations. They can be implemented usingsecond order sections that will inhibit them from erratic behavior. The functionaltests however were conducted using floating point arithmetic for maximum flexi-bility. The actual implementation of the proposed IIR filters is recommended forfurther studies.
9All-pass correction filters are also known as phase equalizers

Filter and Decimate 41
Input fc [MHz] 2.5Rate [Ms/s] 80Noise [dB] -13Time [s] 0.1
Decimation M = M1 ·M2 8 = 4 · 2FIR Type Remez
Order 85Ωs,p[rad/s] [0.18,0.20]Ωp,s[rad/s] [0.30,0.32]
δp [dB] 0.690As [dB] -21BER 0.0237
FIR Type RemezOrder 55
Ωs,p[rad/s] [0.18,0.20]Ωp,s[rad/s] [0.30,0.32]
δp [dB] 1.175As [dB] -17BER 0.0658
Table 4.4: IIR test configuration
4.4.4 Demodulator sensitivity tests
This section will do a quantitative analysis of the Bluetooth demodulators sensitivityto non-linear phase response of the BPF channel selection filter(s). The referenceswill be two equiripple FIR filters of different order. The pass-band ripples of bothprototype filters are significantly larger than the previously assumed δp = 0.01. Thetolerance region of this parameter for practical filters (i.e. lowest possible order)appears to be around 1 dB for FIR filters. Furthermore, the filter specificationsare based on the band-pass requirements of section 3.4 after minor adjustments tocompensate for transition band-widths of the applied filters. The filter and decimatesystem that is used is based on the system of figure 4.12 on page 35. Thus, no Hilberttransform is applied and only real signals are present at the input. Furthermore,the anti-alias LPF filter is left out to make sure the only filter influence on thesignal is done by the test filter. The Simulink model used for testing is shown infigure 4.16. The BPF is implemented by using a FIR, IIR and IIR followed byan all-pass correction (APC) filter. The same input signal is thus filtered with 3different alternatives for implementing the BPF filter and demodulated separately.After demodulation, BER calculations are done to measure their performance. TheFIR block was tested with two equiripple prototypes of different order, with designparameters as shown in table 4.4. Since there are no strong adjacent interferences,filter orders have been chosen to produce similar results for comparison. The wantedchannel has a carrier frequency of fc = fdemod = 2.5 MHz. The noise level isarbitrary and chosen to cause sufficient bit errors for reliable BER calculation inthe available simulation time. The group delay of the IIR filters has peaks in thetransition region. Several tests are done with different pass-band widths to testthe sensitivity of the demodulator from a spectral location point of view. In otherwords: how does the spectral location of the phase distortion influence the BER.
Elliptic filter
The Elliptic filter has a high degree of phase non-linearity and narrow transitionband. The filter order is chosen to be N = 6, resulting in 13 filter coefficients in

42 Chapter 4
M1 FIR M2
c [n']a[n] b[n']
M2
APC M2
IIR
c [n']
c [n']
1
2
3
c [n'']3
c [n'']2
c [n'']1
Figure 4.16: Bluetooth: IIR band-pass filter test
both the numerator and denominator of the transfer function. The group delaycharacteristics for the filter with Ω1,2 = [0.18, 0.32] compared to the prototype FIRis shown in figure 4.17(a). The magnitude of the pass-band is very flat comparedto the FIR filter, and the stop-band response is comparable. From the group delay
1.5 2 2.5 3 3.5-40
-30
-20
-10
0
10
Frequency [MHz]
Ma
gn
itud
e r
es
po
ns
e [
dB
]
FIRIIRAPC
(a) Magnitude response
Normalized Frequency (×π rad/s ample)
Gro
up
de
lay
(sa
mp
les
)
0.1 0.15 0.2 0.25 0.3 0.35 0.40
20
40
60
80
100
120
140
160
180IIRAPCIIR+APC
(b) Group delay
Figure 4.17: Elliptic filter comparison, Ω1,2 = [0.18, 0.32], N = 6
plot (shown in figure ??(b)) it is clear that the phase is highly nonlinear aroundthe cut-off frequencies. The all-pass correction filter therefore delays the spectralcomponents in the pass-band, equalizing the group delay. The results in table??(a) and figure (b) show the bad performance of the IIR filter and the minimalimprovements by applying the correction filter. Apparently, the correction filterimposed group delay has too much ripple to significantly improve the linearity.The optimal pass-band width is 1.2 MHz. Referring to figure 4.17(b), the groupdelay without correction filter is quite flat from 0.2 to 0.3 π rad/sample. There ishowever a strange spike in the transition band region of Ω = 0.19 which I cannotfully explain. An IIR filter with a better intrinsic phase linearity at the cost oftransition band width is thus more likely to improve performance. Furthermore,a FIR filter with N = 55 outperforms the IIR filter for narrow pass band widths.Judging from the large pass-band ripple of this FIR, the sensitivity to δp is smallerthan sensitivity to linear phase.

Filter and Decimate 43
ωs,p[rad/s] BW [MHz] BER IIR BER IIR+APC[0.180, 0.320] 1.40 0.0576 0,0579[0.190, 0.310] 1.20 0.0491 0,0464[0.201, 0.299] 0.98 0.0606 0,0534[0.211, 0.289] 0.78 0.1317 0,1222
(a) BER results table
Pass-band width [Mhz]
BE
R
0.7 0.8 0.9 1 1.1 1.2 1.3 1.40.02
0.04
0.06
0.08
0.1
0.12
0.14
IIR
IIR+APC
FIR (N=85)
FIR (N=55)
(b) BER results plot
Figure 4.18: Elliptic IIR (with and without APC, N = 6) BER vs BW
Butterworth filter
The Butterworth filter has a lower degree of phase non-linearity compared to otherIIR filters. Again, the filter order is chosen to be N = 6 for a fair comparison. Thegroup delay characteristics for the filter with ω1,2 = [0.195, 0.305] compared to theprototype FIR is shown in figure 4.19(a). Again, the magnitude response in thepass-band is very flat compared to the FIR filter. The transition band width of theButterworth filter is slightly wider, the stop-band attenuation is larger. After the
1.5 2 2.5 3 3.5-40
-30
-20
-10
0
10
Frequency [MHz]
Ma
gn
itud
e r
es
po
ns
e [
dB
]
FIRIIRAPC
(a) Magnitude response
Normalized Frequency (×π rad/s ample)
Gro
up
de
lay
(sa
mp
les
)
0.1 0.15 0.2 0.25 0.3 0.35 0.40
20
40
60
80
100
120
140
160
180IIRAPCIIR+APC
(b) Group delay
Figure 4.19: Butterworth filter comparison, ω1,2 = [0.195, 0.305], N = 6
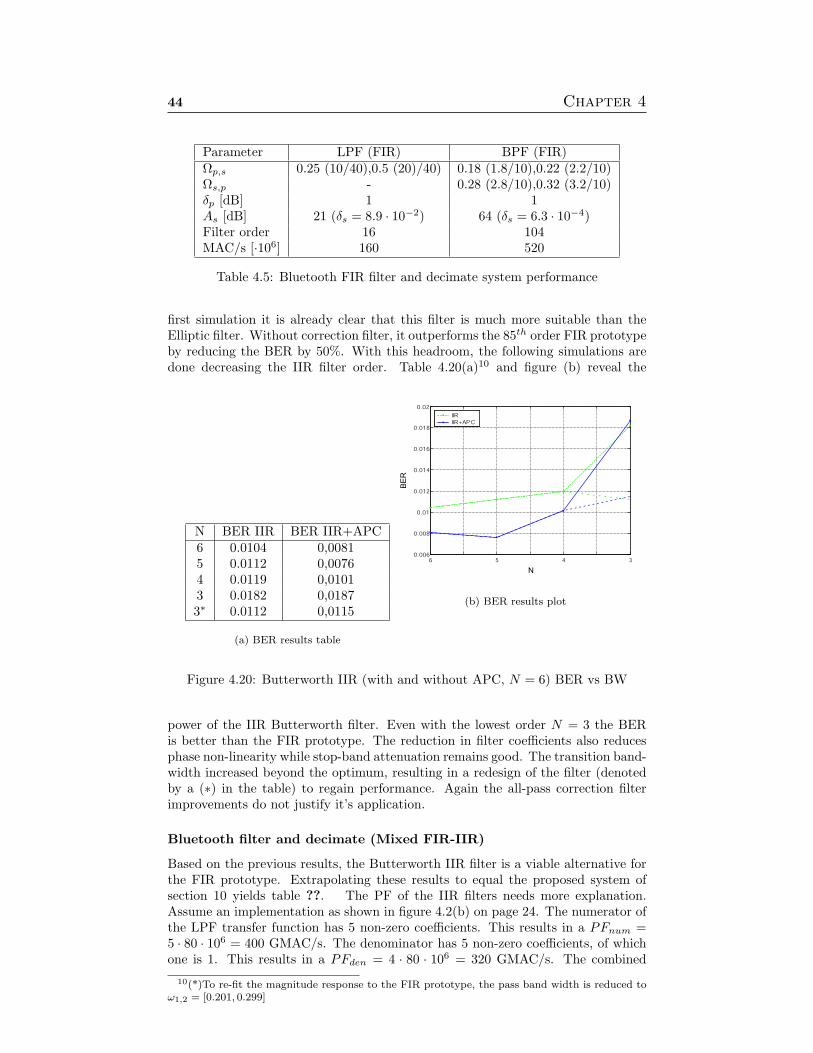
44 Chapter 4
Parameter LPF (FIR) BPF (FIR)Ωp,s 0.25 (10/40),0.5 (20)/40) 0.18 (1.8/10),0.22 (2.2/10)Ωs,p - 0.28 (2.8/10),0.32 (3.2/10)δp [dB] 1 1As [dB] 21 (δs = 8.9 · 10−2) 64 (δs = 6.3 · 10−4)Filter order 16 104MAC/s [·106] 160 520
Table 4.5: Bluetooth FIR filter and decimate system performance
first simulation it is already clear that this filter is much more suitable than theElliptic filter. Without correction filter, it outperforms the 85th order FIR prototypeby reducing the BER by 50%. With this headroom, the following simulations aredone decreasing the IIR filter order. Table 4.20(a)10 and figure (b) reveal the
N BER IIR BER IIR+APC6 0.0104 0,00815 0.0112 0,00764 0.0119 0,01013 0.0182 0,01873∗ 0.0112 0,0115
(a) BER results table
N
BER
6 5 4 3
0.006
0.008
0.01
0.012
0.014
0.016
0.018
0.02
IIR
IIR+APC
(b) BER results plot
Figure 4.20: Butterworth IIR (with and without APC, N = 6) BER vs BW
power of the IIR Butterworth filter. Even with the lowest order N = 3 the BERis better than the FIR prototype. The reduction in filter coefficients also reducesphase non-linearity while stop-band attenuation remains good. The transition band-width increased beyond the optimum, resulting in a redesign of the filter (denotedby a (∗) in the table) to regain performance. Again the all-pass correction filterimprovements do not justify it’s application.
Bluetooth filter and decimate (Mixed FIR-IIR)
Based on the previous results, the Butterworth IIR filter is a viable alternative forthe FIR prototype. Extrapolating these results to equal the proposed system ofsection 10 yields table ??. The PF of the IIR filters needs more explanation.Assume an implementation as shown in figure 4.2(b) on page 24. The numerator ofthe LPF transfer function has 5 non-zero coefficients. This results in a PFnum =5 · 80 · 106 = 400 GMAC/s. The denominator has 5 non-zero coefficients, of whichone is 1. This results in a PFden = 4 · 80 · 106 = 320 GMAC/s. The combined
10(*)To re-fit the magnitude response to the FIR prototype, the pass band width is reduced toω1,2 = [0.201, 0.299]

Filter and Decimate 45
Parameter LPF (IIR) BPF (IIR)Ωp,s 0.25 (10/40),0.5 (20)/40) 0.18 (1.8/10),0.22 (2.2/10)Ωs,p - 0.28 (2.8/10),0.32 (3.2/10)δp [dB] 1 1As [dB] 21 32Filter order 4 12MAC/s [·106] 180 190
Table 4.6: Bluetooth IIR filter and decimate system performance
PFLPF = PFnum + PFden = 720 GMAC/s. Polyphase implementation takingadvantage of M1 = 4 reduces this by a factor 4. The numerator of the BPFtransfer function has 13 coefficients, of which 7 are non-zero. This results in aPFnum = 7 ·20 ·106 = 140 GMAC/s. The denominator has 13 non-zero coefficients,of which one is 1. This results in a PFden = 12 · 20 · 106 = 240 GMAC/s. Thecombined PFIIR = PFnum + PFden = 380 GMAC/s. Polyphase implementationtaking advantage of M2 = 2 reduces this by a factor 2. Thus, the filter operationsof the BPF are significantly reduced if an IIR Butterworth filter is used. For theLPF implementation a FIR filter is preferred due to the better PF.
4.4.5 Conclusions
HiperLAN/2
With the known parameters for HiperLAN/2, the optimal decimation factor M hasbeen calculated for a 2 filter system. The proposed system is depicted in figure4.7(c). A FIR only implementation is targeted because the demodulator is notavailable for (IIR) phase (non-)linearity tests. The required filter operations basedon theoretical (filter) specifications (as described in section 2.4) are as listed in table4.2. The total PF estimate of the HiperLAN/2 filter and decimate system is thus360 + 960 = 1320 MMAC/s.
Bluetooth
For Bluetooth, the design procedure was a little more complicated than for Hiper-LAN/2. The proposed ASAP filter structure of figure 4.12 was derived and aFIR-only and combined IIR-only implementation were analyzed. Based on theseresults, a mixed FIR-IIR filter and decimate system is proposed. The PF estimateof this system can be obtained by adding the PF of the FIR LPF of table 4.5 andIIR BPF of table 4.6: 160 + 190 = 350 MMAC/s. Extrapolating again, the ALAPfilter structure will require roughly 2·160+3·190 = 890 MMAC/s. The performancegap is closing and the duel between ASAP and ALAP will become even closer inchapter 6. In the next chapter the frequency translation block is discussed, whichis also followed by a band-pass filter. The specifications of this filter will also bederived.
5Digital Mixer
5.1 Introduction
This chapter will go into the consequences of frequency translation. In general,a mixer implementation can be either real, half-complex or complex. One way ofimplementing a half-complex mixer was already discussed in section 3.2. For theASAP system (shown in figure 3.6 on page 18) this method can also be used, ora real mixer can be applied. The ALAP system (depicted in figure 3.7 on page19) would be best served by a full complex mixer. An overview of the pro’s andcon’s of these filter types will be discussed followed by methods to implement such amixer. Then, specific design choices are made concerning the layout of the frequencytranslation block of the proposed Bluetooth channel selection system.
5.2 Real Mixer
A real bandpass signal with carrier frequency fc, multiplied by a harmonic wave withfrequency flo produces sum- and difference spectra at flo + fc, flo − fc, −(flo + fc)and −(flo − fc). The functional block performing this operation is called a realmixer. In figure 5.1 the incoming signal x(nT ) is centered at fc = 0.5 MHz. Thepositive spectrum of the real signal is black and the negative spectrum is white.The real mixer is implemented as a cosine generator with flo = 2 MHz (white)and mirror frequency in black (at −flo = −2 MHz). The resulting spectra arethus located at −2.5,−1.5, 1.5and2.5 MHz. The spectra at −1.5 and 1.5 MHz areunwanted requires additional filtering to be removed.
5.3 Hilbert-mixer
The Hilbert transformation (refer to section B was discussed in it’s FIR filter im-plementation form. It can also be implemented by using a pair of local oscillators.The 90 degree phase difference is realized by multiplying the I path with a cosineand Q with a sine wave. This results in a double real mixer structure shown infigure 5.2. By adding or subtracting both paths afterwards the positive or negativespectrum is chosen and I and Q are combined to form a real band-bass signal.
5.4 Required mixer frequencies
The mixer frequency depends on the selected channel carrier frequency fc and therequired demodulator frequency fdemod. Based on the decimation factor considera-
46

Digital Mixer 47
cos(2 f nT)p lo
x(nT) X y(nT)
(a) Structure
fc-fc
f -c flo
flo-flo
-(f -c f )lo-(f +c f )lof +c flo
(b) Signal spectra
Figure 5.1: Real mixer (real input and injection)
cos(2 f nT) lo
X
x (nT)I
switch
Q
sin(2
π
f nT) lo
X
y(nT) +/-
π
x (nT)
Figure 5.2: Double real mixer (Hilbert transform)
tions of section 10 the demodulator requires the channel at fdemod = 2.5 MHz. Afterchannel selection filtering and the subsequent decimation, all selected channels arebetween -5 and 5 MHz due to aliasing. This was shown using frequency spectra infigure 4.5 of section 4.2.5. If the operation is viewed in the time domain it becomeseven more clear. In figure 5.3 a channel with fc = 7.5 MHz is shown before (a) andafter decimation by M2 = 2 (b). Based on this theory only two oscillator frequen-cies are required to mix all possible carriers to fdemod, as shown in table 5.1. Thefirst column is the original carrier frequency fc and the second column the aliasedfrequency f ′c. Column three lists the oscillator frequency required to mix the carrierto fdemod and either column four or five shows the unwanted images that have tobe filtered out afterwards.
5.5 Conclusions
For both ASAP and ALAP systems real mixers are proposed. (Half-) complexmixers have complex outputs that require an additional Hilbert transformer toconvert the signals to real signals. For the ALAP system a double real mixerwith 90 degrees out of phase oscillators is proposed. This will be referred to as theHilbert-mixer. Due to decimation it is possible to translate all carrier frequenciesto the required fdemod with only two oscillator frequencies. This makes the use ofIIR oscillators more feasible [13].

48 Chapter 5
0 0 .1 0.2 0 .3 0.4 0 .5 0.6 0 .7 0.8 0 .9 1-1
-0. 5
0
0. 5
1
t [s]
magnitude
(a) fc = 7.5, fs = 20 MHz
-1
-0. 5
0
0. 5
1
magnitude
0 0 .1 0.2 0 .3 0.4 0 .5 0.6 0 .7 0.8 0 .9 1
t [s]
(b) f ′c = 2.5, fs = 10 MHz
Figure 5.3: Aliasing due to sub-sampling
fc f ′c flo f ′c − flo f ′c + flo
[MHz] [MHz] [MHz] [MHz] [MHz]0.5 0.5 2.0 -1.5 (1.5) 2.51.5 1.5 1.0 0.5 2.52.5 2.5 - 2.5 2.53.5 3.5 1.0 2.5 4.54.5 4.5 2.0 2.5 6.5 (1.5)5.5 4.5 2.0 2.5 6.5 (1.5)6.5 3.5 1.0 2.5 4.57.5 2.5 - 2.5 2.58.5 1.5 1.0 0.5 2.59.5 0.5 2.0 -1.5 (1.5) 2.5
Table 5.1: Mixer frequencies for fdemod = 2.5 MHz
6System
6.1 Introduction
In the previous chapters most of the channel selection sub-systems were researchedand defined. For HiperLAN/2 the currently proposed system is somewhat imma-ture. A FIR-only implementation was derived in section 4.2.5. Due to the lateavailability of the demodulator further evolution of the model remains work for thefuture. A first model and test run of the HiperLAN/2 channel selection, basedon the early designs of 3.4 was carried out in [5]. For Bluetooth, two systems areproposed: ASAP and ALAP. These are shown in figure 6.1. Note that for conve-nience some optimizations are not explicitly modelled. These include the polyphaseimplementation and the 3 multiplier, 2 adder implementation of the complex BPFfilter (in the ALAP system, see section 4.2.7). After a description of the test en-vironment and the BER tests that will be conducted the proposed systems will beexamined.
6.2 Test environment and parameters
To test the proposed channel selection system a modulator and demodulator areadded to the system. The signal generation blocks and the analog front-end areshown in figure 6.2. The output signals zi[n], zQ[n] are the inputs to the channelselection system. Channel and interfering signals are generated by using a basebandBluetooth signal generator and the noise is bandlimited. The baseband channel andinterferer are mixed to a ”RF” frequency of 100 MHz. The actual RF frequenciesin the 2.4 GHz band are not used as this would needlessly increase simulationtimes. The composite signal is called x(t). The analog front-end is simulated witha quadrature down-mixer and analog low-pass filter (LPFA), followed by a zero-order-hold (ZOH) block. The ZOH block represents the AD converter and from thatpoint, the signals are considered digital (as shown in figure 6.2). The parametersused that are not part of the ASAP system are listed in table 6.1. The interferencesignal strengths are relative to that of the selected channel (and thus indicated bya +/− sign).
6.2.1 BER tests
The behavior of the system will be analyzed using the signals listed in table 6.2.With these signals, four combinations per channel selection system must be pro-cessed and a minimum BER of 0.1% must be achieved (without error correction).
49

50 Chapter 6
Hb
z
+/-
-N/2
LPF M1
LO[n']
xBPF1 BPF2M2
z[n] a[n]
switch
d[n']b[n] c[n] e[n'] e[n''] g[n''] h[n'']
(a) ASAP system
+/-
M1
LO [n']
xswitch
LPF
LPF M1
z[n] a[n] d[n'']b[n'] c[n'] e[n''] f[n'']
Im(BPF)
Im(BPF)
Re(BPF)
Re(BPF) +
++
-
LO [n']
xM2
M2
M2
M2
g[n'']
I
Q
(b) ALAP system
Figure 6.1: Bluetooth channel selection
sin(t)
cos(t)
LPF
LPF ZOH
ZOH
x(t)
y (t)
y (t)
z (t)
z (t)
z [n]
z [n]
I
Q
I I
Q Q
channel
interferer
noise A
A
wanted
Figure 6.2: Simulink model of test environment
This results in the four tests that will be referred to as BER test 1,2,3 and 4. Theinput signal x(t) for these test are listed below:
1. Selected channel + Noise + Co-channel interferer

System 51
Function Parameter ValueChannels and interferers RF Frequency [MHz] 90 ≤ fc,RF ≤ 110
IF Frequency [MHz] −10 ≤ fc,IF ≤ 10Selected channel Strength [dB] 0Co-channel interferer Strength [dB] -11Adjacent channel interference ≥ 1 MHz Strength [dB] 0Adjacent channel interference ≥ 2 MHz Strength [dB] +30Adjacent channel interference ≥ 3 MHz Strength [dB] +40Noise (bandwidth 400 MHz) Strength [dB] -37Local oscillator (analog) Frequency [MHz] 100Low-pass filter (analog) Type Butterworth
Order 7Cut-off frequency [MHz] 10
Zero-order-hold Frequency [MHz] 80Demodulator (Bluetooth) Input rate [MHz] 10
Samples per symbol 10fdemod [Mhz] 2.5
Table 6.1: Parameters of the channel selection test environment
2. Selected channel + Noise + Adjacent channel interference ≥ 1 MHz
3. Selected channel + Noise + Adjacent channel interference ≥ 2 MHz
4. Selected channel + Noise + Adjacent channel interference ≥ 3 MHz
As these four input signals will be referenced a lot in the following sections, it issometimes helpful to refer to them in a more descriptive manner. The experimentwith the four aforementioned configurations of x(t) will then be referred to as theco-channel, adjacent 1, adjacent 2 and adjacent 3 signals. The maximum durationof the BER tests that were done was 0.1 seconds. This is approximately 158 DH1frames containing 216 bits each. The number of erroneous bits was thus divided by≈ 34000 (the total amount of bits sent).
Signal fIF [MHz] Strength [dB]Selected channel 4.5 0Co-channel interferer 4.5 -11Adjacent channel interference ≥ 1 MHz 5.5 +0Adjacent channel interference ≥ 2 MHz 6.5 +30Adjacent channel interference ≥ 3 MHz 7.5 +40
Table 6.2: Wanted channel and interferer frequencies used for analysis
6.3 ASAP system 1
6.3.1 Introduction
The proposed demodulator system depicted in figure 6.1(a) contains two functionalblocks that have not been designed yet. For the Hilbert transformer, this will bedone in section 6.3.2. The post-mixer filter is designed in section 6.3.3. Then, thecomplete system is designed and can be tested following the BER tests specified inthe Bluetooth specifications. Based on these simulations, the design space of thesystem will be explored and optimization paths pursued.
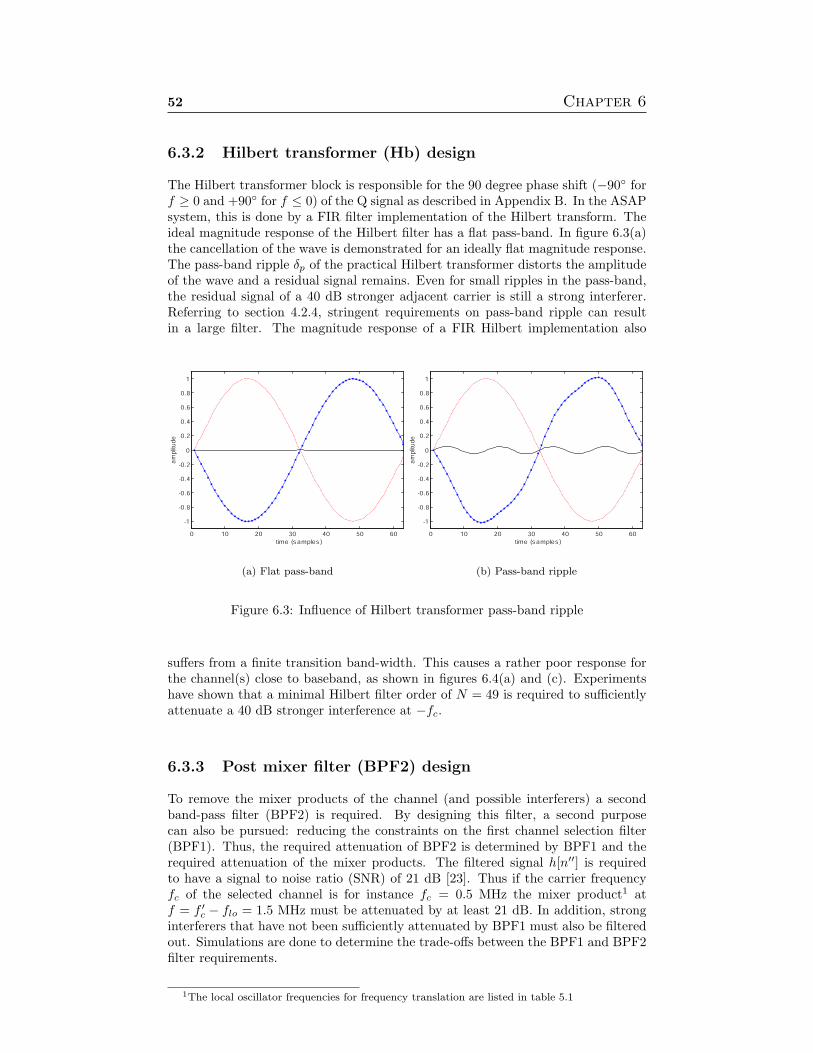
52 Chapter 6
6.3.2 Hilbert transformer (Hb) design
The Hilbert transformer block is responsible for the 90 degree phase shift (−90 forf ≥ 0 and +90 for f ≤ 0) of the Q signal as described in Appendix B. In the ASAPsystem, this is done by a FIR filter implementation of the Hilbert transform. Theideal magnitude response of the Hilbert filter has a flat pass-band. In figure 6.3(a)the cancellation of the wave is demonstrated for an ideally flat magnitude response.The pass-band ripple δp of the practical Hilbert transformer distorts the amplitudeof the wave and a residual signal remains. Even for small ripples in the pass-band,the residual signal of a 40 dB stronger adjacent carrier is still a strong interferer.Referring to section 4.2.4, stringent requirements on pass-band ripple can resultin a large filter. The magnitude response of a FIR Hilbert implementation also
0 10 20 30 40 50 60
-1
-0.8
-0.6
-0.4
-0.2
0
0.2
0.4
0.6
0.8
1
time (s amples )
am
plit
ud
e
(a) Flat pass-band
0 10 20 30 40 50 60
-1
-0.8
-0.6
-0.4
-0.2
0
0.2
0.4
0.6
0.8
1
time (s amples )
am
plit
ud
e
(b) Pass-band ripple
Figure 6.3: Influence of Hilbert transformer pass-band ripple
suffers from a finite transition band-width. This causes a rather poor response forthe channel(s) close to baseband, as shown in figures 6.4(a) and (c). Experimentshave shown that a minimal Hilbert filter order of N = 49 is required to sufficientlyattenuate a 40 dB stronger interference at −fc.
6.3.3 Post mixer filter (BPF2) design
To remove the mixer products of the channel (and possible interferers) a secondband-pass filter (BPF2) is required. By designing this filter, a second purposecan also be pursued: reducing the constraints on the first channel selection filter(BPF1). Thus, the required attenuation of BPF2 is determined by BPF1 and therequired attenuation of the mixer products. The filtered signal h[n′′] is requiredto have a signal to noise ratio (SNR) of 21 dB [23]. Thus if the carrier frequencyfc of the selected channel is for instance fc = 0.5 MHz the mixer product1 atf = f ′c − flo = 1.5 MHz must be attenuated by at least 21 dB. In addition, stronginterferers that have not been sufficiently attenuated by BPF1 must also be filteredout. Simulations are done to determine the trade-offs between the BPF1 and BPF2filter requirements.
1The local oscillator frequencies for frequency translation are listed in table 5.1

System 53
5 10 15 20 25 30 35-80
-60
-40
-20
0
20
Frequency (MHz)
Mag
nitud
e (dB
)
(a) Magnitude response
0.5 1 1.5 2 2.5 3 3.5
x 107
-3000
-2500
-2000
-1500
-1000
-500
0
Frequency (Hz)
Phase
(degrees)
(b) Phase response
0 0.5 1 1.5 2 2.5 3 3.5 4 4.5-30
-25
-20
-15
-10
-5
0
Frequency (MHz)
Mag
nitud
e (dB
)
(c) Magnitude response (zoomed)
Figure 6.4: Hilbert transformer
6.3.4 Spectral analysis of the systems signals
Input to LPF: b[n]
Now the signal spectra at the input of the channel selection system are examinedand the effect of the filter and decimate operations. Referring to figure 6.1(a), b[n]is the input for the low-pass filter. The four BER test signals are shown in the samefigure. The effect of the analog LPFA is best shown by the skirt of the strongestinterferer. The right side is a lot steeper than the left side due to attenuation inthe analog front-end.
Input to BPF1: d[n′]
Most of the channel selectivity is provided by BPF1. Here, adjacent channel in-terferers must be sufficiently attenuated to prohibit unwanted images in-band aftermixing. Furthermore, as the wanted channel is determined by frequency hopping,the filter coefficients must be updated every hop. So not only filter operations butalso memory is saved with minimizing coefficients here. Using specifications fromchapter 4, (refer to table 4.3 on page 36) a FIR filter of order 178 or an IIR filterof order 12 is necessary to achieve the specified BER. In figure 6.6 the 4 BER testsignals are shown including a 104th order FIR BPF1 filter response. This attenuatesthe interferers over 53 dB.
Input to BPF2: g[n′′]
After frequency translation, the signals are called g[n′′] and depending on the char-acteristics of BPF2 there can be quite some unwanted interference left. For the
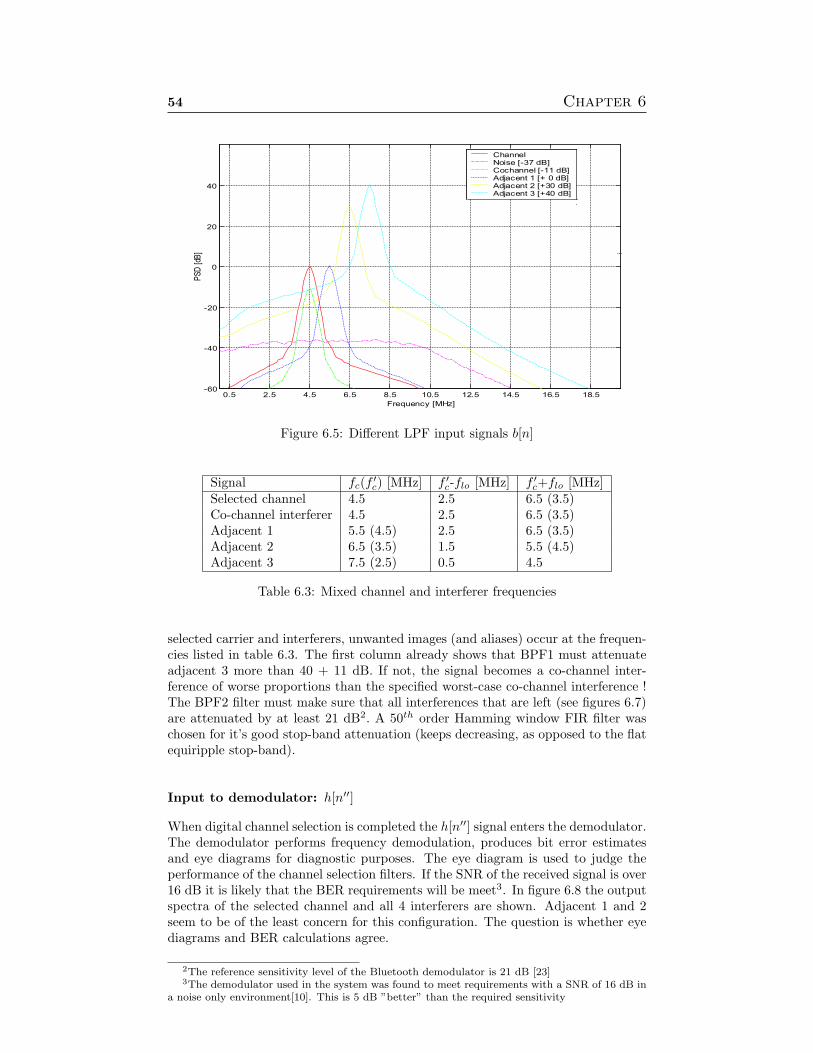
54 Chapter 6
0.5 2.5 4.5 6.5 8.5 10.5 12.5 14.5 16.5 18.5-60
-40
-20
0
20
40
Frequency [MHz]
PS
D [
dB]
ChannelNoise [-37 dB]Cochannel [-11 dB]Adjacent 1 [+ 0 dB]Adjacent 2 [+30 dB]Adjacent 3 [+40 dB]
Figure 6.5: Different LPF input signals b[n]
Signal fc(f ′c) [MHz] f ′c-flo [MHz] f ′c+flo [MHz]Selected channel 4.5 2.5 6.5 (3.5)Co-channel interferer 4.5 2.5 6.5 (3.5)Adjacent 1 5.5 (4.5) 2.5 6.5 (3.5)Adjacent 2 6.5 (3.5) 1.5 5.5 (4.5)Adjacent 3 7.5 (2.5) 0.5 4.5
Table 6.3: Mixed channel and interferer frequencies
selected carrier and interferers, unwanted images (and aliases) occur at the frequen-cies listed in table 6.3. The first column already shows that BPF1 must attenuateadjacent 3 more than 40 + 11 dB. If not, the signal becomes a co-channel inter-ference of worse proportions than the specified worst-case co-channel interference !The BPF2 filter must make sure that all interferences that are left (see figures 6.7)are attenuated by at least 21 dB2. A 50th order Hamming window FIR filter waschosen for it’s good stop-band attenuation (keeps decreasing, as opposed to the flatequiripple stop-band).
Input to demodulator: h[n′′]
When digital channel selection is completed the h[n′′] signal enters the demodulator.The demodulator performs frequency demodulation, produces bit error estimatesand eye diagrams for diagnostic purposes. The eye diagram is used to judge theperformance of the channel selection filters. If the SNR of the received signal is over16 dB it is likely that the BER requirements will be meet3. In figure 6.8 the outputspectra of the selected channel and all 4 interferers are shown. Adjacent 1 and 2seem to be of the least concern for this configuration. The question is whether eyediagrams and BER calculations agree.
2The reference sensitivity level of the Bluetooth demodulator is 21 dB [23]3The demodulator used in the system was found to meet requirements with a SNR of 16 dB in
a noise only environment[10]. This is 5 dB ”better” than the required sensitivity
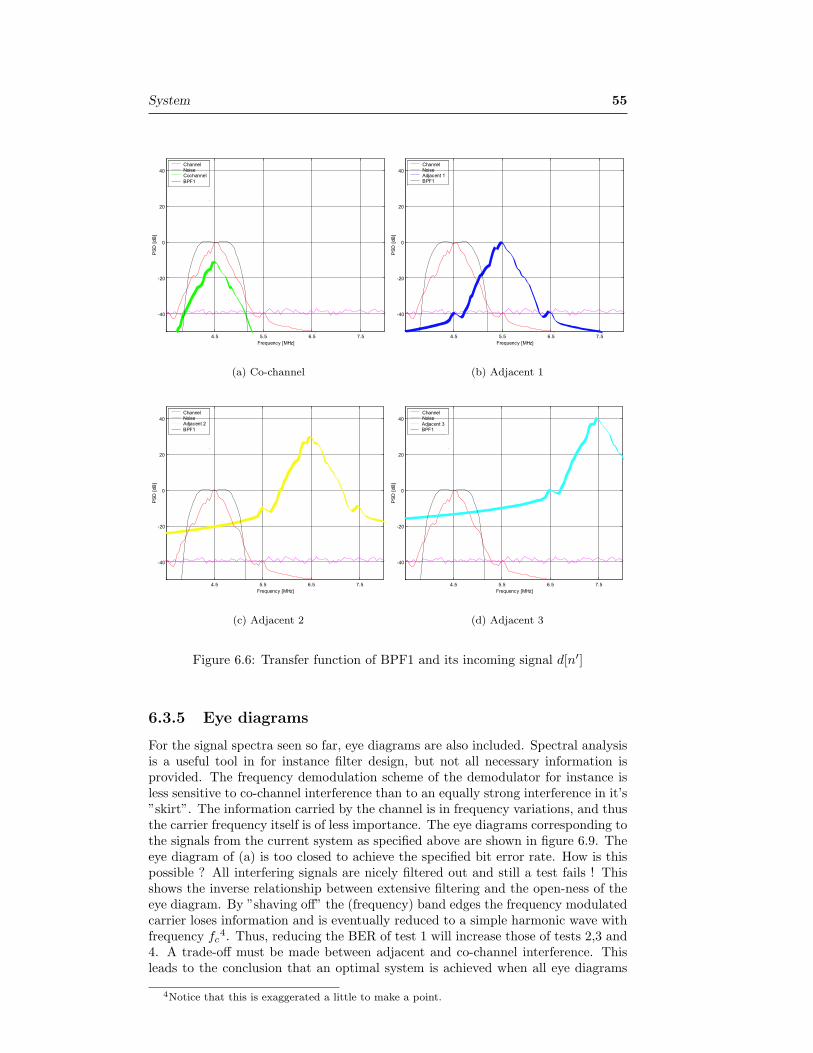
System 55
4.5 5.5 6.5 7.5
-40
-20
0
20
40
Frequency [MHz]
PS
D [
dB
]
ChannelNoiseCochannel
BPF1
(a) Co-channel
4.5 5.5 6.5 7.5
-40
-20
0
20
40
Frequency [MHz]
PS
D [
dB
]
ChannelNoiseAdjacent 1BPF1
(b) Adjacent 1
4.5 5.5 6.5 7.5
-40
-20
0
20
40
Frequency [MHz]
PS
D [
dB
]
ChannelNoiseAdjacent 2
BPF1
(c) Adjacent 2
4.5 5.5 6.5 7.5
-40
-20
0
20
40
Frequency [MHz]
PS
D [
dB
]
ChannelNoise
Adjacent 3BPF1
(d) Adjacent 3
Figure 6.6: Transfer function of BPF1 and its incoming signal d[n′]
6.3.5 Eye diagrams
For the signal spectra seen so far, eye diagrams are also included. Spectral analysisis a useful tool in for instance filter design, but not all necessary information isprovided. The frequency demodulation scheme of the demodulator for instance isless sensitive to co-channel interference than to an equally strong interference in it’s”skirt”. The information carried by the channel is in frequency variations, and thusthe carrier frequency itself is of less importance. The eye diagrams corresponding tothe signals from the current system as specified above are shown in figure 6.9. Theeye diagram of (a) is too closed to achieve the specified bit error rate. How is thispossible ? All interfering signals are nicely filtered out and still a test fails ! Thisshows the inverse relationship between extensive filtering and the open-ness of theeye diagram. By ”shaving off” the (frequency) band edges the frequency modulatedcarrier loses information and is eventually reduced to a simple harmonic wave withfrequency fc
4. Thus, reducing the BER of test 1 will increase those of tests 2,3 and4. A trade-off must be made between adjacent and co-channel interference. Thisleads to the conclusion that an optimal system is achieved when all eye diagrams
4Notice that this is exaggerated a little to make a point.
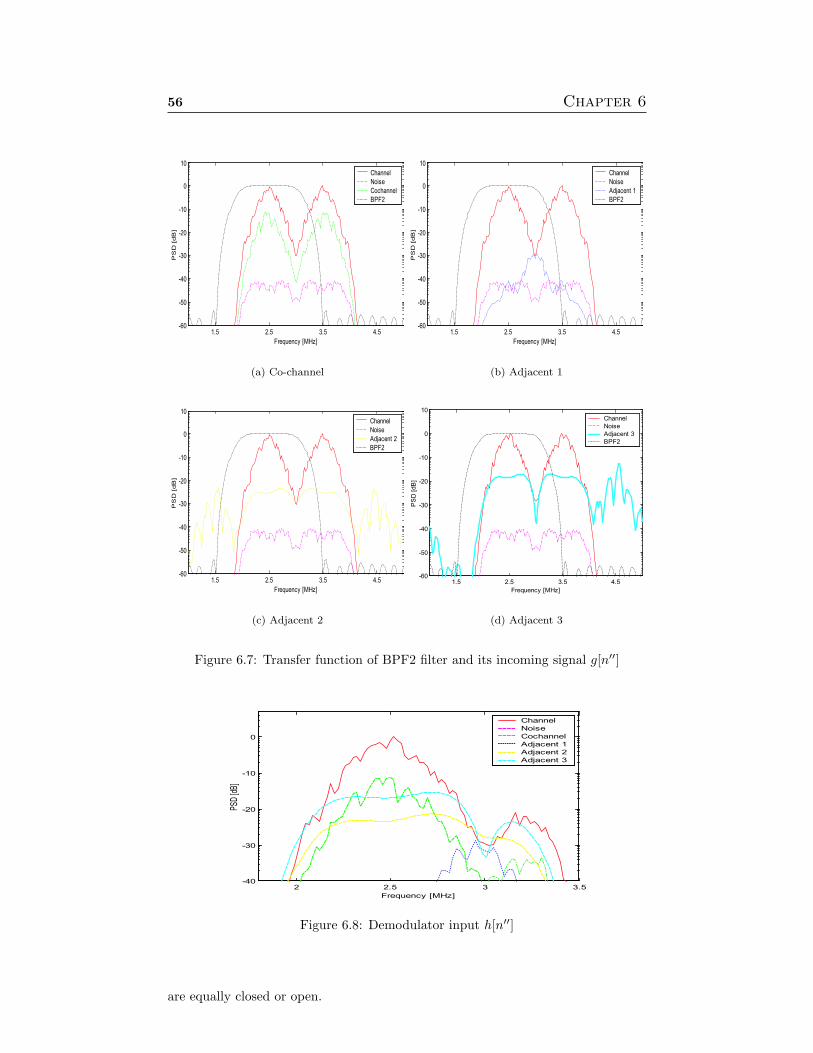
56 Chapter 6
1.5 2.5 3.5 4.5-60
-50
-40
-30
-20
-10
0
10
Frequency [MHz]
PS
D [
dB
]Channel
Noise
Cochannel
BPF2
(a) Co-channel
1.5 2.5 3.5 4.5-60
-50
-40
-30
-20
-10
0
10
Frequency [MHz]
PS
D [
dB
]
Channel
Noise
Adjacent 1
BPF2
(b) Adjacent 1
1.5 2.5 3.5 4.5-60
-50
-40
-30
-20
-10
0
10
Frequency [MHz]
PS
D [
dB
]
Channel
Noise
Adjacent 2
BPF2
(c) Adjacent 2
1.5 2.5 3.5 4.5-60
-50
-40
-30
-20
-10
0
10
Frequency [MHz]
PS
D [
dB
]Channel
Noise
Adjacent 3
BPF2
(d) Adjacent 3
Figure 6.7: Transfer function of BPF2 filter and its incoming signal g[n′′]
2 2.5 3 3.5-40
-30
-20
-10
0
Frequency [MHz]
PSD
[dB]
Channel
Noise
Cochannel
Adjacent 1
Adjacent 2
Adjacent 3
Figure 6.8: Demodulator input h[n′′]
are equally closed or open.

System 57
1 2 3 4 5 6 7 8 9 10-2
-1.5
-1
-0.5
0
0.5
1
1.5
2
(a) Co-channel
1 2 3 4 5 6 7 8 9 10-2
-1.5
-1
-0.5
0
0.5
1
1.5
2
(b) Adjacent 1
1 2 3 4 5 6 7 8 9 10-1.5
-1
-0.5
0
0.5
1
1.5
(c) Adjacent 2
1 2 3 4 5 6 7 8 9 10-1.5
-1
-0.5
0
0.5
1
1.5
(d) Adjacent 3
Figure 6.9: Eye diagrams of demodulated h[n′′] signals
6.3.6 BER calculations
The eye diagrams are obtained by repetitive plotting of one symbol period of thedemodulated wave. This is done separately for each frame. Not all frames are alike,and it is likely that some bit sequences of some frames combined with some semi-coincidental circumstance cause bit errors that were not expected by analyzing eyediagrams. Thus, for more reliable comparison between channel selection systems,BER calculations are used. The bit error rates of the test signals after processingby the current system are all zero, except for the co-channel experiment which hasBER = 0.024. This does not meet specifications and the filters must be redesigned.After several simulations, varying the transition band-width, pass-band ripple andfilter order a system was found that meets specifications. This system will bedescribed in the next section.
6.3.7 ASAP system 1 specification
Total filter operations for this FIR only approach is (values are taken from table6.3.7): 1000+160+430+525 = 2115 million MACs/s. This excludes the resourcesnecessary for mixing and changing filter coefficients for BPF1. The latter will
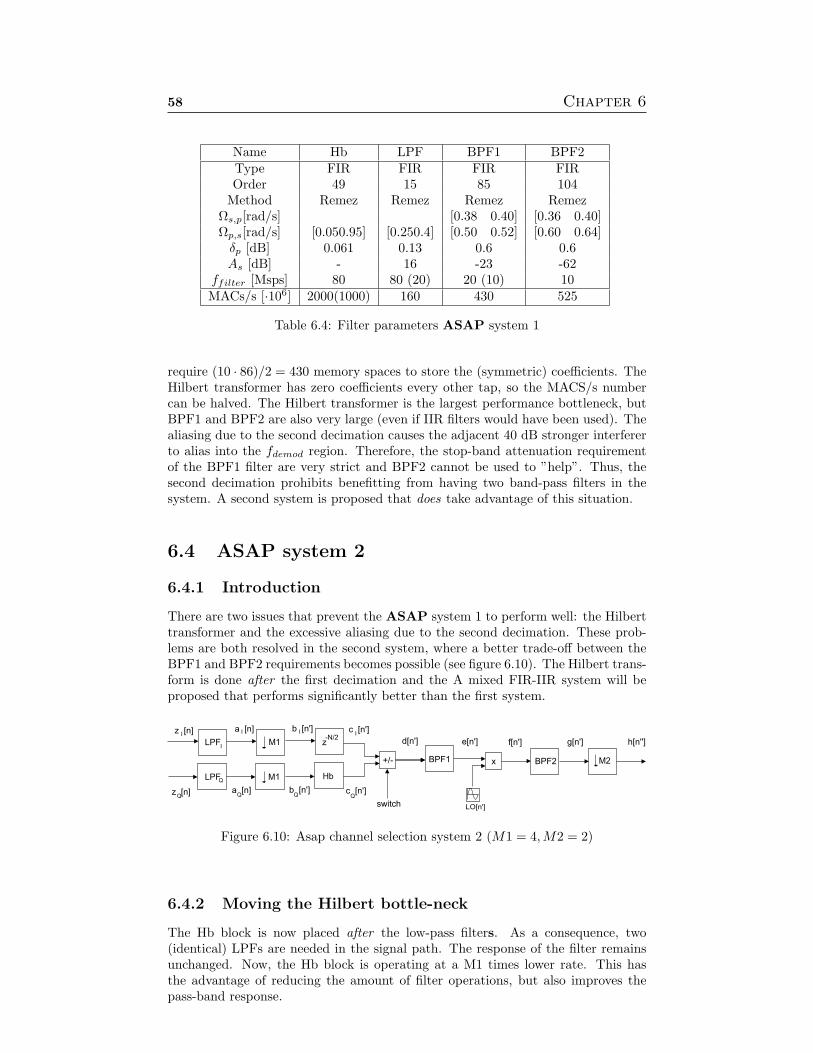
58 Chapter 6
Name Hb LPF BPF1 BPF2Type FIR FIR FIR FIROrder 49 15 85 104
Method Remez Remez Remez RemezΩs,p[rad/s] [0.38 0.40] [0.36 0.40]Ωp,s[rad/s] [0.050.95] [0.250.4] [0.50 0.52] [0.60 0.64]
δp [dB] 0.061 0.13 0.6 0.6As [dB] - 16 -23 -62
ffilter [Msps] 80 80 (20) 20 (10) 10MACs/s [·106] 2000(1000) 160 430 525
Table 6.4: Filter parameters ASAP system 1
require (10 · 86)/2 = 430 memory spaces to store the (symmetric) coefficients. TheHilbert transformer has zero coefficients every other tap, so the MACS/s numbercan be halved. The Hilbert transformer is the largest performance bottleneck, butBPF1 and BPF2 are also very large (even if IIR filters would have been used). Thealiasing due to the second decimation causes the adjacent 40 dB stronger interfererto alias into the fdemod region. Therefore, the stop-band attenuation requirementof the BPF1 filter are very strict and BPF2 cannot be used to ”help”. Thus, thesecond decimation prohibits benefitting from having two band-pass filters in thesystem. A second system is proposed that does take advantage of this situation.
6.4 ASAP system 2
6.4.1 Introduction
There are two issues that prevent the ASAP system 1 to perform well: the Hilberttransformer and the excessive aliasing due to the second decimation. These prob-lems are both resolved in the second system, where a better trade-off between theBPF1 and BPF2 requirements becomes possible (see figure 6.10). The Hilbert trans-form is done after the first decimation and the A mixed FIR-IIR system will beproposed that performs significantly better than the first system.
+/-
M1
LO[n']
xBPF1 BPF2 M2
switch
LPF
LPF M1 Hb
z-N/2
z [n] a [n]
d[n']
b [n'] c [n']
e[n'] f[n'] g[n'] h[n'']
z [n] a [n] b [n'] c [n']Q
I
Q Q Q
I II
I
Q
Figure 6.10: Asap channel selection system 2 (M1 = 4, M2 = 2)
6.4.2 Moving the Hilbert bottle-neck
The Hb block is now placed after the low-pass filters. As a consequence, two(identical) LPFs are needed in the signal path. The response of the filter remainsunchanged. Now, the Hb block is operating at a M1 times lower rate. This hasthe advantage of reducing the amount of filter operations, but also improves thepass-band response.

System 59
6.4.3 Reduce aliasing, improve BPF1/BPF2 cooperation
By delaying the second decimation until after BPF2, the required attenuation ofadjacent channel interferers can be shared among two filters. This leads to a signif-icant reduction in filter coefficients and compensates for the higher rate of BPF1.BPF1 is now the most critical filter with respect to performance. It is thereforea good approach to minimize BPF1 coefficients and compensate with BPF2. Thiscan be illustrated by the following: two coefficients less used in BPF1 reduces thefilter operations by (2 · 20 · 106)/2 = 20 MMAC/s (using the symmetric property)and memory usage by 1 ∗ 10 = 10 registers (each channel has a different filter).Increasing BPF2 with 2 coefficients results in ((2 · 20e6 · 106)/2)/2 = 5 MMAC/sand 1 extra register.
6.4.4 BPF1/BPF2 filter re-design
To design a BPF1 filter that will just allow the system to meet requirements, acloser look is taken into a so-called ”critical” region. This is the region where allinterferers ”intersect” the selected Bluetooth channel. Figure 6.11 zooms in on thecritical points of the BPF1 filter. α, β and γ show the interference floor of adjacentchannels 3, 2 and 1 respectively. The challenge is to accept an increase of theselevels that is as small as possible by choosing the optimal filter shape. The 45th
order FIR filter response shown in figure 6.11 intercepts the interferers at points δ, εand ζ. In this situation, the adjacent 3 channel is the strongest interferer. If a widertransition band is chosen, the ε intersection moves to the right. If fε approaches5.3 MHz it moves beyond δ and this makes the adjacent 1 channel the strongest(resulting) interference. The gradient of adjacent channel 1 at point ε thus imposesconstraints on the BPF1 filter. If a wider transition band is chosen, this is the firsttest that will fail. Adjacent 3 becomes a problem after mixing, as the stop-bandattenuation of BPF1 is poor (in an effort to save coefficients). BER experimentshave lead to a FIR BPF1 implementation of order N = 45. The trade-offs thathave been made are listed in the following section.
4.4 4.6 4.8 5 5.2 5.4 5.6
-20
-10
0
Frequency [MHz]
ChannelNoiseCochannelAdjacent 1Adjacent 2Adjacent 3BPF1
α
β
γ
δ
ε
ζ
Figure 6.11: BPF1 response and incoming signals, model 2

60 Chapter 6
Name LPF (2x) Hb BPF1 BPF2Type FIR FIR FIR FIROrder 15 49 50 45
Method Remez Remez Remez Hammingωs,p[rad/s] [0.38 0.40] [0.185]ωp,s[rad/s] [0.250.5] [0.10.9] [0.50 0.52] [0.315]
δp [dB] 0.13 0.061 0.7 0As [dB] 21 - -17 -62
ffilter [Msps] 80 (20) 20 20 (20) 10MACs/s [·106] 160 250 500 225
Table 6.5: Filter parameters ASAP system 2, FIR-only
6.4.5 Sensitivities and trade-offs
The sensitivities and trade-offs involving the reduction of filter operations whilemaintaining specified bit error rates are:
Filter order Higher order filters reduce the BER of the adjacent channel experi-ments (BER tests 2,3 and 4). On the other hand, it reduces the performanceof the co-channel experiment (BER test 1). The eye diagram shows a directinverse relation between the filter order and the ”open-ness” of the eye.
Filter bandwidth The width of the flat pass-band must be chosen as wide aspossible, without allowing too much adjacent channel interference. The de-modulator has a large dependency on the outer rims of the channel spectrum.The obvious solution to this problem is a very steep filter, but this is only fea-sible for IIR, which introduce the largest phase non-linearities in that criticalregion. Thus, the trade-offs are made in the transition bands.
Transition bands The critical points of the filter design are the intersections withthe adjacent channels. The optimal balance of the conflicting requirementsimposed by the 4 tests lie in the distribution of the interferences. In otherwords: the least amount of processing power is used when the eye diagramsof all 4 BER tests are equally closed.
6.4.6 ASAP system 2 specifications
The currently proposed system based on the ASAP model can be implemented byusing FIR-only or mixed FIR-IIR filter systems. The performance figures for theFIR-only system are listed in table 6.5. The bit error rate achieved was 1.16·10−4 foradjacent 3 and zero for the rest. The performance figures for the IIR replacementsfor BPF1 and BPF2 are listed in table 6.6. The bit error rates achieved are 1.16 ·10−4 for co-channel, 5.82 · 10−5 for adjacent 1 and zero for adjacent 2 and 3. TheChebyshev Type II design method was used for BPF1, as it has similar (and inthis case even better) linear phase response characteristics than Butterworth filters.These were not studied in chapter 4, section 4.4 but have been tested because of theirmoderate non-linear phase response. The Chebyshev Type II filter allows ripplesin the stop-band, and this can be used to reduce the pass-band width. Overall, theChebyshev filter behaves more like the Remez (BPF1) filter in the FIR-only modeland the Butterworth filter is more similar to the Hamming window filter (BPF2).The performance figure of the FIR-only system is PFFIR−only = 160 + 250 + 500 +225 = 1135 MMAC/s (refer to table 6.5). By replacing the FIR band-pass filters forIIR alternatives this becomes PFFIR−IIR = 160 + 250 + 200 + 140 = 750 MMAc/s(refer to table ??). The negative side-effects of the changes made to the system are

System 61
Name BPF1 BPF2Type IIR IIROrder 4 (5, 5) 6 (7, 7)
Method Chebyshev Type II ButterworthΩs,p[rad/s] [0.375,0.390] 0.2Ωp,s[rad/s] [0.505,0.525] 0.3
δp [dB] 0 0As [dB] 30 20 (at [0.16,0.37])
ffilter [Msps] 20 20 (10)Mac/s [·106) 200 140
Table 6.6: Filter parameters for IIR BPF1 and BPF2 (ASAP system 2)
that the number of required oscillator frequencies for the digital mixer have risenfrom 2 to 7 and the operating frequency of the local oscillator has doubled. Howeverthe reduction in filter operations and coefficients for reloading is a big advantage.
6.5 ALAP system
The ALAP model has been briefly simulated because BER tests were unsuccessfulfor filters under N = 150. Taking into account that 3 or 4 times 151 coefficientsmust be multiplied with 20 million incoming samples this system will need almosta GMAC/s to operate. If a future demodulator would require complex inputs, itmay be worth it to research this model further. In this work however, this was notdone.
6.6 Conclusions
Based on the systems that were researched the initial assumptions that a complexsystem is likely to require more processing proved valid. The real design was im-plemented and improved and is proposed as the optimal solution for the currentrequirements with respect to the derived performance figure. The PF of this sys-tem is 750 MMAC/s for a mixed FIR-IIR implementation and 1135 MMAC/s forFIR-only.

7Conclusions and
Recommendations
7.1 Conclusions (Summary)
Based on a derivation of Bluetooth and HiperLAN/2 channel selection requirements,filter specifications and overall system design options were formulated for the digitalchannel-selection system. Due to the nature of the project in which this work wasdone, several parameters were unknown at the start of my MSc-work. This calledfor an approach of scenario’s and broad system perspective.
After researching different filter types and structures a provisory channel se-lection system for HiperLAN/2 was proposed. The proposed HiperLAN/2 digitalchannel-selection system receives complex signals from the analog front-end pro-vides the wanted channel to the demodulator as a complex channel. The systemconsists of two (real) identical low-pass anti-alias filters followed by a decimator.After decimation by 2, a pair of identical (real) low-pass channel selection filtersare used to provide sufficient attenuation of the adjacent interferences. Due tolate availability of a demodulator, this system was not further researched and nochannel-selection tests or BER tests were executed.
For Bluetooth digital channel-selection, the input signals are complex, while theoutput signal, the input for the demodulator was required to be real. This lead totwo main scenario’s that were researched. The first was based on converting thecomplex signals to real as soon as possible, leading to the so-called ASAP system.The second scenario used the opposite approach and lead to the so-called as late aspossible ALAP-system, in which mixed real and complex filtering could be done.The initial assumptions that a (partly) complex system is likely to require moreprocessing proved valid. The real design was implemented and improved and isproposed as the optimal solution for the current requirements with respect to thederived performance figure (MMAC/s).
The original ASAP2 design in which only FIR filters are used (see section 6.4.6,table ), needs 1135 MMAC/s for channel selection. In it, the incoming quadraturesignals are low-pass filtered by a pair of (real) FIR filters, implemented in polyphase.Then, they are converted to a bandpass signal by using a FIR Hilbert transformerand adder. Changing the sign bit of the adder is the first stage of channel selection.Band-pass filtering is done by a 50th order Remez equiripple filter and a 45th orderHamming windows filter. To reduce filter operations the usage if IIR filters wasresearched, leading to a ASAP2 mixed FIR-IIR system. The FIR-only design ismaintained so it can be used in case IIR filters are not suitable for implementation.
The system that performed best, the ASAP2 mixed FIR-IIR system (see section
62

Conclusions and Recommendations 63
6.4.6, tables with BPF1 and BPF2 taken from 6.6) uses 750 MMAC/s for channelselection. The signals are band-pass filtering by a variable 4th order ChebyshevType II IIR filter. The filter is variable in the sense that filter coefficients mustbe updated every time the Bluetooth signal hops to another frequency. Then thefiltered signal is mixed to the required frequency for demodulation. After a secondband-pass filter (6th order Butterworth IIR filter) the signal is decimated again andready for demodulation.
Both ASAP systems meet BER requirements as specified in the Bluetooth doc-umentation. Thus, the currently proposed models use real filters and offers goodchannel selection and performance for the currently proposed demodulator.
7.2 Recommendations
There are six recommendations I would like to make:
• Starting with the analog front-end and the ADC. It is quite possible that dueto the analog filtering and low signal distortion by the ADC, the digital LPFcan be omitted entirely.
• Furthermore, the demodulator requires a real input signal, but internallymixes it to baseband, applies low-pass filtering and then demodulates. Ina more optimal design, the channel selection system converts the incomingsignal to baseband in stead of a second IF. In this situation, the total perfor-mance figures are likely to favor quadrature channel selection, as opposed tothe currently proposed real system.
• The current approach was based mainly on simulations. An interesting studywould be a formal analysis of the complete system, including demodulation.Based on the relations found between the filters and the sensitivity of thefrequency demodulation a more exact solution may be found for the filterdesigns.
• Automatic Gain Gontrol. The current simulation model has fixed gains, re-sulting in poor BER performance if the input signal becomes small. TheAGC implementation should be done in cooperation with the demodulatordesign(er). Automatic gain and gain adjustment for quantization may also bejointly researched, as the operations are similar.
• Fixed Point Analysis. Although the current system was designed with fixedpoint implementation in mind, it was not explicitly researched. The used filterresponses are nearly identical with 16 bit fixed point quantization. For IIRfilters, second order sections are needed to prevent instability.
• Filters. The IIR filter family also includes Bessel filters, which deserve acloser look. They are reported to have the best linear phase characteristicsand group delay response.

AQuadrature signals
A.1 In-phase and Quadrature signals
A real (band limited) signal s(t) is mixed with two local oscillators, represented bycos(2πflot) (in the I path) and sin(2πflot) (in the Q path). Mathematically, thiscan be represented by:
I(t) = s(t) · cos(2πflot) =s(t)2· e(j2πflot) +
s(t)2· e(−j2πflot)
and
Q(t) = s(t) · sin(2πflot) = j ·(
s(t)2· e(j2πflot) − s(t)
2· e(−j2πflot)
)
Multiplying Q by j 1 yields (bearing in mind that j2 = −1:
j ·Q(t) = −s(t)2· e(j2πflot) +
s(t)2· e(−j2πflot)
Addition of I(t) and jQ(t) yields:
s(t) ·(
12· e(j2πflot) − 1
2· e(j2πflot) +
12· e(−j2πflot) +
12· e(−j2πflot)
)
The first two terms inside the brackets cancel each other out, the last two termsadd up:
I + j ·Q(t) = s(t) · e(−j2πflot)
Subtracting I and jQ results in the opposite (positive) spectrum:
I − j ·Q(t) = s(t) · e(j2πflot)
A.2 Quadrature down conversion of signal chunks
The complex mix operation discussed in section 3.2 also applies to band-pass signals.The spectra of x(t) before and after quadrature down conversion are shown in figureA.1.
1expπ2 = cos(π
2) + j · sin(π
2) = 0 + j · 1 = j so we are changing the phase 90 degrees
64

Quadrature signals 65
Im
f [Mhz]0-fRFfRF
Re
(a) X(f)
Im
f [Mhz]0-fRF- fLO fRF+ fLO
Re
(b) 12[X(f − fLO) + X(f + fLO)]
f [Mhz]
0-fRF-fLO fRF+fLO
Im Re
(c) 12· j[−X(f − fLO) + X(f + fLO)]
Im
f [Mhz]
0
Re
f [Mhz]
-fRF-fLOfRF+fLO
(d) 12· [X(f − fLO)−X(f + fLO)]
Im
f [Mhz]0
Re
f [Mhz]fRF+fLO
(e) =(b)+(d) X(f − fLO)
Figure A.1: Spectra of even (I, Q) signal paths

BThe Hilbert transform
A Hilbert transform can be implemented by a FIR or IIR filter [14]. Then, it isdefined as an all-pass filter with an (ideal) transfer function given by [14],[13],[21]:
H(f) = −j for f ≥ 0H(f) = j for f < 0
(B.1)
The impulse response of a FIR Hilbert transformer is shown in figure B.1. Theleft half of the coefficients are the negative image of the positive half. Every othercoefficient is zero, reducing filter operations. The error caused by finite word andfilter lengths is in the output signal amplitude, rather than phase. The pass-band
0 5 10 15 20 25 30 35 40 45-0.8
-0.6
-0.4
-0.2
0
0.2
0.4
0.6
0.8
Figure B.1: FIR Hilbert transformer (N = 40) impulse response
width, ripple and overshoot characteristics are dependent on the number of tapsand window used to truncate the Fourier series. The rectangular windows producesthe largest pass-band and largest overshoot (Gibbs’ phenomenon, refer to section4.2.2).
66

The Hilbert transform 67
B.1 Practical usage for channel selection
Recall figure A.1 on page 65. By taking the Hilbert transform of zQ(n) andadding/subtracting the result to/from zI(n), the lower/upper half of the complexZ[f) spectrum is selected. Furthermore, the resulting signal is real and its fre-quency spectrum thus symmetrical around 0. Graphically, it is similar to figureA.1(c), but now the positive frequencies are rotated clockwise. To see what hap-pens, assume that the signal chunk in figures 3.3 and A.1 represent 10 Bluetoothchannels. After low-pass filtering and AD conversion, the zI(n) and zQ(n) signalscan be represented by figures B.2(a) and (b). After (ideal) Hilbert transformation,Hilbert(zQ(n)) = zQH(n) looks like (c). Now zI(n) and Hilbert(zQ(n)) can beadded (or subtracted), and a real signal is formed. This way, a (baseband) signalwith uneven spectrum is converted to a real signal with an even spectrum. In theprocess, half of the spectrum is lost. The sign of the final adder determines whichhalf. In literature this method is called upper/lower sideband selection. A generalpurpose sub-block to be used in the system, based on this principle is depicted infigure B.3.
B.2 Upper/lower sideband rejection
This signal consists of either the positive or negative half of the baseband spectrum(including it’s image, see figure B.2(d)). The degree of sideband rejection dependson the pass-band ripple and thus the amount of filter coefficients. To exactly cancelout a strong interferer by adding a delayed copy of itself requires a maximally flatmagnitude response. For Bluetooth, the worst-case would be a +40 dB strongerinterferer at −fc, requiring over 40 + 21 = 61 dB of rejection. This results in amaximum allowable ripple of (using eq. 4.4):
δp = 10−6120 ≈ 8.9 · 10−4
The transition bandwidth (as specified in 2.4) for a filter frequency of 20 Msps isequal to:
∆f =fp
ffilter=
0.16220
≈ 8.1 · 10−3
A FIR implementation of a Hilbert transformer using a Kaiser window, the requiredorder the filter becomes [14]:
N ≈ −0.61 · log10(δp)∆f
≈ 224 (B.2)

68 Appendix B
(a) ZI(f)
(b) ZQ(f)
(c) ZQH(f)
(d) ZI + ZQH(f))
Figure B.2: Create real USB/LSB signal

The Hilbert transform 69
Hilbe rt
i(n)
q(n) r(n)_+/
switch
Z-N/2
Figure B.3: USB/LSB selection using the Hilbert transform

CNoble identities
The scaling (a1) and (a2) of signals and the decimation (M) in the different branchesof the digital filter structures is independent of the sampling rate [12]. Therefore,the structures of C.1(a) and (b) are equivalent. A delay of M sample periodsbefore a down sampler, is equivalent to a delay of 1 sample period after the downsampler. This leads to the second identity shown in figures C.1(c) and (d). A usefulconsequence is the identity shown in C.1(e) and (f).
âM
x (n)1
x (n)2
a1
a2
y(m)
(a)
âMx (n)1
x (n)2
a1
a2
y(m)
âM
(b)
âMx(n)
z-M
y(m)
(c)
âMx(n) y(m)
z-1
(d)
âMU(z) Y(z)H(z )
M
(e)
âMU(z) Y(z)H(z)
(f)
Figure C.1: Noble identities
This is an interesting property of digital signal processing and by this switch-ing functin a hopping Bluetooth channel can be ”followed” more easily withoutreloading filter coefficients.
70

Bibliography
1 A. Antoniou. Digital filters: Analysis, design, and applications. McGraw-Hill,1993.
2 Conexant. On the direct conversion transceiver. http://www.conexant.com, 72001. Application note.
3 M. P. Donadio. Cic filter introduction, 7 2000. For free publication by Iowegian.
4 D. Grover et al. Digital Signal Processing and the Microcontroller. Prentice Hall,8 1998.
5 F.W. Hoeksema et al. Evaluation of hiperlan/2 channel selection filters. SDRproject R007v01 2, August 2002.
6 F.W. Hoeksema et al. Realization and testing of the software radio based blue-tooth - hiperlan/2 demonstrator, 7 2002.
7 F.W. Hoeksema et al. Specification for digital channel selection filters in abluetooth capable hiperlan/2 receiver. Conference Paper 1, 2 2002.
8 J.G. Proakis et al. Digital Signal Processing. Maxwell Macmillan, 1993.
9 L. Hanso et al. Single- and Multi-carrier Quadrature Amplitude Modulation.John Wiley & Sons, 2000.
10 R. Schiphorst et al. Bluetooth demodulation algorithms and their performance.Paper 1, 2 2002.
11 V.J. Arkesteijn et al. Physical layer functions of a software radio based bluetooth- hiperlan demonstrator. Project Internal TES.5177/ALL/MA/PI/D/002/01,University of Twente, 7 2001.
12 N.J. Fliege. Multirate Digital Signal Processing. John Wiley & Sons, 1994.
13 M.E. Frerking. Digital signal processing in communication systems. Chapman& Hall, 1993.
14 S.L. Hahn. Hilbert transforms in signal processing. 1996.
15 L.W. Couch II. Digital and Analog Communication Systems. Prentice Hall,2001.
16 T. Kaitz. Performance aspects of ofdm phy proposal. Technical report,March 2001. IEEE 802.16 Broadband Wireless Access Working Group¡http://ieee802.org/16¿.
17 K.D. Kammeyer. Nachrichtenubertragung. B.G. Teubner, 1996.
18 R. G. Lyons. Understanding digital signal processing, 1996.
71

72 BIBLIOGRAPHY
19 U. Meyer-Baese. Digital Signal Processing with Field Programmable Gate Ar-rays. Springer, 2001.
20 PACT. Fir filter for complex integers on the xpu128. http://www.pactcorp.com,9 2000. Application Note.
21 P.P. Vaidyanathan. Multirate Systems and filter banks. Prentice Hall, 1993.
22 L.F.W. van Hoesel. Design and implementation of hiperlan/2 physical layermodels for simulation purposes. Masters thesis, August 2002.
23 Various. Specification of the bluetooth system. Specification 1.1, 2 2001.
24 Xilinx. Cascaded integrator-comb (cic) filter. http://www.xilinx.com, 10 2001.Product specification.