design and characterization of multiwavelength fiber laser...
TRANSCRIPT

DESIGN AND CHARACTERIZATION OF MULTIWAVELENGTH
FIBER LASER IN O-BAND TRANSMISSION WINDOW
SITI FATIMAH BINTI NORIZAN
THESIS SUBMITTED IN FULLILMENT OF THE REQUIREMENTS FOR THE
DEGREE OF PHILOSOPHY
DEPARTMENT OF PHYSICS
FACULTY OF SCIENCE
UNIVERSITY OF MALAYA
2015
ii
Abstract
This thesis presents the research work that has been carried out on O-band transmission
windows as support to the saturated optical fiber transmission windows. O-band is
selected based on advantages it offer including operational cost effectiveness, low
absorption coefficient, low dispersion wavelength range and operated with existence
system. The aim of this research work is to investigate the components that could be
used in developing O-band as transmission windows. The components studied in this
research work are the optical amplifiers and multiwavelength fiber laser as the
transmitter. The optical amplifiers are Bismuth doped fiber amplifier (BiDFA), O-band
Raman fiber amplifier (RFA) and Booster optical amplifier (BOA). The BiDFA produce
low amplification (~2 dB) but high nonlinearity coefficient measured to be 13.98 W-1
km-1
utilizing the four wave mixing (FWM) effect. The RFA was tested with 4 different
types of fiber, where dispersion compensated fiber (DCF) shows the highest
amplification performance with gain of 12 dB for single pass configuration and 14 dB
for double pass at 1330 nm signal wavelength. The BOA is an improved version of
semiconductor optical amplifier (SOA) capable to amplify up to 28 dB and 31 dB at
1350 nm for single pass and double pass configuration respectively. The optical
amplifier is not only use as the amplifier but also to support the process of generating
multiwavelength fiber laser (MWFL). Three techniques demonstrated in this thesis
include; multiwavelength Brillouin fiber laser (MWBFL), Sagnac loop mirror (SLM)
and Fabry Perot Interferometer. The MWFL was demonstrated by various
configurations to investigate the performance including its peak power flatness and tune
ability. The MWBFL generated from nonlinear effect of stimulated Brillouin scattering
(SBS). The Brillouin threshold power required to generate SBS in O-band is less than
threshold of C-band. The MWBFL demonstrated in 2 different cavites namely linear
cavity and ring cavity. Both cavities produce 4 Stokes with the linear cavity giving a

iii
closed spacing of 12.5 GHz while ring cavity 25 GHz. Inserting BOA in the multi pass
linear configuration induce nonlinearity and hence produces 3 anti-Stokes signals. The
flatness of MWBFL achieved via 2 techniques namely by in cooperate the BiDF in the
cavity to provide FWM effects and by relocating the BOA. The spacing tunability for
MWBFL is limited to two spacing 12.5 GHz and 25 GHz. Sagnac loop mirror were also
demonstrated in linear and ring cavity, where the linear cavity provide stable and more
number of channels (~16). The uniformity of MWFL via SLM was provided by the
nonlinearity of BIDF. The tunability of the SLM is controlled by the length of
polarization maintaining fiber (PMF). The FPI was only demonstrated in linear
configuration. The spacing generated was double of SLM with the same length of PMF.
The uniformity of peak power was also improved by the incorporation of BiDF. The
tunability is achieved by controlling the polarization state. The spacing varied from 5.0
nm to 1.25 nm with 4 m PMF.

iv
Abstrak
Tesis ini membentangkan kerja-kerja penyelidikan yang telah dijalankan ke atas O-band
penghantaran tingkap sebagai sokongan kepada tingkap penghantaran tepu. O-band
terpilih berdasarkan kelebihan ia menawarkan keberkesanan operasi termasuk kos,
pekali penyerapan rendah, pelbagai serakan panjang gelombang rendah dan
dikendalikan dalam sistem kewujudan. Tujuan penyelidikan adalah untuk menyiasat
komponen yang boleh menjadi kegunaan dalam membangunkan O-band seperti
penghantaran tingkap. Komponen dikaji dalam penyelidikan ini adalah penguat optik
dan serat multiwavelength laser sebagai pemancar. Penguat optik termasuk Bismut
gentian terdop penguat (BiDFA), O-band Raman serat penguat (RFA) dan Booster
penguat optik (BOA). The BiDFA menghasilkan penguatan rendah (~ 2 dB) tetapi
pekali ketaklelurusan tinggi diukur menjadi 13,98 W-1
km-1
menggunakan empat
gelombang mencampurkan (FWM) kesan. RFA diuji dengan 4 jenis serat, di mana
penyebaran serat pampasan (DCF) menunjukkan prestasi penguatan yang paling tinggi
dengan keuntungan sebanyak 12 dB untuk konfigurasi pas tunggal dan 14 dB untuk
lulus dua di 1.330 nm panjang gelombang isyarat. BOA ini adalah versi semikonduktor
penguat optik (SOA) berjaya untuk menguatkan sehingga 28 dB dan 31 dB pada 1350
nm pas tunggal dan konfigurasi pas dua masing-masing. Penguat optik bukan sahaja
menggunakan sebagai penguat tetapi juga untuk menyokong proses menjana laser
gentian multiwavelength (MWFL). Tiga teknik ditunjukkan dalam tesis ini termasuk;
multiwavelength serat Brillouin laser (MWBFL), Sagnac gelung cermin (SLM) dan
Fabry Perot interferometer. The MWFL ditunjukkan oleh pelbagai konfigurasi untuk
menyiasat prestasi termasuk kuasa kebosanan kemuncaknya dan keupayaan lagu. The
MWBFL dijana daripada kesan tak lelurus dirangsang penyerakan Brillouin (SBS).
Kuasa ambang Brillouin diperlukan untuk menjana SBS dalam O-band adalah kurang
daripada C-band. The MWBFL menunjukkan dalam 2 rongga rongga yang berbeza dan
v
cincin iaitu linear rongga. Kedua-dua rongga menghasilkan 4 Stokes dengan rongga
linear memberikan jarak 12.5 GHz manakala cincin rongga 25 GHz. Masukkan BOA
dalam konfigurasi linear pas berbilang mendorong ketaklelurusan dengan itu
menghasilkan 3 anti-Stokes. Kebosanan MWBFL dicapai melalui 2 teknik iaitu dengan
bekerjasama dalam yang BiDF dalam rongga untuk meletakkan kesan FWM dan
menempatkan semula oleh BOA itu. The tunability jarak untuk MWBFL adalah terhad
kepada dua jarak 12.5 GHz dan 25 GHz. The Sagnac cermin gelung juga menunjukkan
dalam rongga linear dan cincin, di mana linear yang memberikan jumlah yang stabil dan
lebih saluran (~ 16). Keseragaman MWFL melalui SLM menyediakan oleh
ketaklelurusan daripada BIDF. The tunability daripada SLM adalah kawalan oleh
panjang polarisasi mengekalkan serat (PMF). FPI hanya ditunjukkan dalam konfigurasi
linear. Jarak dijana adalah dua daripada SLM dengan panjang sama PMF. Keseragaman
kuasa puncak juga bertambah baik dengan bekerjasama yang BiDF. Tunability ini
dicapai dengan mengawal keadaan polarisasi. Jarak yang berbeza dari 5.0 nm kepada
1.25 nm dengan 4 m PMF

vi
Acknowledgement
All Praise to God Almighty, I would like to express my special appreciation and
thanks to my advisor Professor Dr. Harith Ahmad and Dr. Zamani Zulkifli, you have
been a tremendous mentor for me. I would like to thank you for encouraging my
research and for allowing me to grow as a research scientist. Your advice on both
research as well as on my career have been priceless.
A special thanks to my family. Words cannot express how grateful I am to my
my mother, father, and siblings, for all of the sacrifices that you’ve made on my behalf.
Your prayer for me was what sustained me thus far. I would also like to thank all of my
friends; especially Amirah, Azura, Haniza and Ahya, who supported me in writing, and
incanted me to strive towards my goal. At the end I would like express appreciation to
my beloved husband Zarma Nurhaidan, who spent sleepless nights with and was always
my support in the moments when there was no one to answer my queries.
vii
Contents
Abstract ii
Abstrak iv
Acknowledgment vi
Contents vii
List of tables xi
List of figures xi
Acronyms xix
Nomenclatures xxii
Chapter 1 Introduction
1.1 Overview of fiber optic communication 1
1.2 Demand on expanding telecommunication capacity 2
1.3 Demand on improved transmitter 3
1.4 Demand on new optical amplifier 4
1.5 Research methodology 5
1.6 Objective of the thesis 6
1.7 Thesis review 7
Chapter 2 Theoretical Background
2.1 Introduction 9
2.2 Multiwavelength fiber laser by nonlinear effect 10
2.2.1 Nonlinear effect of optical material 10
2.2.2 Principle of Stimulate Brillouin Scattering (SBS) 14
viii
2.2.3 Principle of Four Wave Mixing (FWM) 16
2.3 Multiwavelength fiber laser by Interferometer 18
2.3.1 Introduction on interferometer 18
2.3.2 Principle of Sagnac Loop Mirror (SLM) 19
2.3.3 Principle of Fabry Perot Interferometer (FPI) 20
2.4 O-band Optical amplifiers 21
2.4.1 Rare-earth doped fiber optical amplifier 22
2.4.2 Nonlinear optical amplifier 24
2.4.3 Semiconductor optical amplifier 25
Chapter 3 Characterization of O-band Optical Amplifiers
3.1 Introduction 27
3.2
The Performance of Bismuth Doped Fiber Amplifier
(BiDFA)
29
3.2.1 Absorption wavelength 29
3.2.2 ASE at different pump wavelength 30
3.2.3 Gain Characterization 34
3.2.4 Gain improvement by double pass configuration 36
3.2.5 Determination of nonlinearity of BiDF 41
3.3 The Performance of O-band Raman Fiber Amplifier 48
3.3.1 Raman threshold 48
3.3.2 Gain characterization of Raman fiber amplifier 51
3.4 The Performance of Booster Optical Amplifier (BOA) 54

ix
Chapter 4 O-band Multiwavelength Fiber Laser
4.1 Introduction 63
4.2
Design and characterization of multiwavelength O-band
Brillouin Fiber Laser (MWBFL)
64
4.2.1 Experimental study of Brillouin threshold 66
4.2.2 Generating Multiwavelength Brillouin Fiber Laser
in Ring Cavity
71
4.2.3 Generating Multiwavelength Brillouin Fiber Laser
in Linear Cavity
73
4.2.4 Generating the MWBFL utilizing BOA 77
4.3
Design and characterization of multiwavelength O-band fiber laser by
Sagnac Loop Mirror technique
82
4.4
Design and characterization of multiwavelength O-band fiber laser by
Fabry Perot Interferometer technique
86
Chapter 5 Improvement of O-band multiwavelength fiber laser (MWFL)
5.1 Introduction 90
5.2
Improvement of the O-band multiwavelength Brillouin fiber laser
(MWBFL)
90
5.2.1 Design and characterization on improving flatness of MWBFL 91
5.2.2 Design and characterization of varied channel spacing of MWBFL 99
5.3 Improvement for the O-band multiwavelength fiber laser of Sagnac
Loop Mirror technique
101
5.3.1 Design and characterization on improves flatness of MWFL of
SLM
101
x
5.3.2 Design and characterization of varied channel spacing of MWFL
of SLM
103
5.4 Improvement for the O-band multiwavelength fiber laser of Fabry Perot
interferometer technique
105
5.4.1 Design and characterization on improves flatness of MWFLvia
FPI
106
5.4.2 Design and characterization of varied channel spacing of MWFL
via FPI
107
Chapter 6 Conclusion and future work
6.1 Conclusion 107
6.2 Future Works 111
Reference xxv
List of publications cxxxi
List of awards cxxxiv
Appendix

xi
List of Tables
Table 3.1 The parameters for Raman fiber amplifier
Table 4.1 The parameters for Brillouin threshold measurement for different
types of fibers
Table 4.2 The compilation of performance of multiwavelength fiber laser with
different techniques
List of figures
Figure 1.1 Flow chart of research methodology
Figure 2.1 Illustration of linear and nonlinear interaction
Figure 2.2 Fraction of nonlinear effects
Figure 2.3 Depletion of Brillouin pump and generation of Stokes signal
process
Figure 2.4 Four wave mixing with (a) non degenerate and (b) degenerate
Figure 2.5 Sagnac loop mirror
Figure 2.6 (a) intrinsic and (b) extrinsic Fabry Perot Interferometer
Figure 2.7 Cross section of semiconductor optical amplifier
Figure 3.1 The absorption spectrum of BiDF
Figure 3.2 Experimental setup for collecting ASE of the BiDF

xii
Figure 3.3 The Bi-DF ASE at different length
Figure 3.4 (a) ASE spectrum and (b) intensity of signal at wavelength
1200nm and 1450nm at different excitation wavelength
Figure 3.5 Experimental setup for gain charaterization of BiDF with co
pumping scheme
Figure 3.6 Gain performance of co pumping BiDFA
Figure 3.7 Experimental setup for gain charaterization of BiDFwith
bidirectional pumping scheme
Figure 3.8 Gain performance of bidirectional pumping of BiDFA
Figure 3.9 Experimental setup of Bismuth doped fiber amplifier with
doublepass Bi-DFA configuration
Figure 3.10 The spectrum of spontaneous emission of singlepass and
doublepass
Figure 3.11 Signal gain for single- and double-pass BiDFA with different
signal wavelengths.
Figure 3.12 Signal gain of single- and double-pass BiDFA at different
input power.
Figure 3.13 Signal gain as a relation of pump power.
Figure 3.14 the simulation of FWM power over FWM signal wavelength
Figure 3.15 Bandwidth of the PFWM against the spacing between ZDW and
signal wavelength
xiii
Figure 3.16 Four wave mixing ZDW nonlinearity measurement setup.
Figure 3.17 Spectrum of four wave mixing by the BiDF
Figure 3.18 The distribution of FWM intensity over wavelength spacing of
pump and 1550 nm signal
Figure 3.19 The bandwidth of FWM power distribution against signal
wavelength.
Figure 3.20 The PFWM distributions at signal wavelength of 1308nm
Figure 3.21 Fluctuation of PFWM at different dispersion slope
Figure 3.22 Experimental setup of backscattering RFA
Figure 3.23 Raman gain coefficient for different types of fibers
Figure 3.24 Experimental setup of Raman fiber amplifier
Figure 3.25 Performance of RFA against signal wavelength
Figure 3.26 Double-pass configuration of RFA
Figure 3.27 Gain performance of Double-pass RFA over (a) signal
wavelength (b) signal power
Figure 3.28 Experimental setup of single pass BOA
Figure 3.29 The ASE of BOA O-band
Figure 3.30 Characterization setup of ORP
xiv
Figure 3.31 Optical return power for BOA (a) at different wavelength (b)
at different operating current
Figure 3.32 Characterization of BOA with unidirectional device (a) gain
and (b) NF
Figure 3.33 BOA characterization over operating current
Figure 3.34 The performance of conventional SOA against signal
wavelength
Figure 3.35 The performance of BOA against signal wavelength
Figure 3.36 Characterization of BOA over the signal input power
Figure 3.37 The gain performance at various polarization state
Figure 3.38 Gain spectrum over wavelength for single and doublepass
Figure 4.1 Depletion of Brillouin pump and generation of Stokes signal
process
Figure 4.2 Basic setup of Brillouin scattering backscattered power.
Figure 4.3 Comparison of backscattered stokes power between three
different fibers under test.
Figure 4.4 Brillouin threshold power over length for different types of
fibers
Figure 4.5 Backscattered stokes power for BP wavelength of 1310 and
1550 nm.
Figure 4.6 Comparison of the line spacing between the BP and its Stokes
for (a) O-band and (b) C-band regions.

xv
Figure 4.7 The configuration of ring like shaped cavity.
Figure 4.8 Multiwavelength Brillouin fiber laser with ring cavity for
different couplers.
Figure 4.9 The performances of Multiwavelength Brillouin fiber laser with
ring cavity for different couplers.
Figure 4.10 Multiwavelength Brillouin fiber laser linear cavity
configurations
Figure 4.11 Brillouin fiber laser evolves at different Brillouin pump
powers for TWF
Figure 4.12 The performance of peak power and signal to noise ratio
(SNR) of each peaks.
Figure 4.13 The multi pass configuration of multiwavelength Brillouin
fiber laser
Figure 4.14 The spectrum of Multiwavelength Brillouin fiber laser with
multiple pass configuration.
Figure 4.15 The performances of Multiwavelength Brillouin fiber laser
with multiple-pass configuration.
Figure 4.16 Experimental set up of linear cavity for multiwavelength
Brillouin/BOA fiber laser.
Figure 4.17 Multiwavelength Brillouin/BOA fiber laser
Figure 4.18 Comparison of multiwavelength Brillouin fiber laser for the
first 4 peaks with and without BOA
xvi
Figure 4.19 The number of Stokes at different wavelength
Figure 4.20 Peak powers of transmitted Brillouin and the first three Stokes.
Figure 4.21 Multiwavelength fiber laser with (a) linear cavity (b) ring
cavity SLM fiber laser setup
Figure 4.22 The spectrum of ring cavity and linear cavity of fiber laser
SLM configuration.
Figure 4.23 Figure 4.23 The performance of (a) linear and (b) ring cavity
Figure 4.24 The spectrums of multiwavelength fiber laser by Sagnac loop
mirror with different BOA power.
Figure 4.25 The linear cavity of Fabry-Perot interference reflection based.
Figure 4.26 Spectrum of multiwavelength fiber laser via Fabry-Perot
Interferometer for (a) 1 m, (b) 2 m, (c) 3 m and (d) 4 m.
Figure 4.27 The comparison between linear cavity Fabry-Perot
Interferometer and SLM technique.
Figure 4.28 The SNR performance of multiwavelength fiber laser with
Fabry-Perot Interferometer
Figure 5.1 Experimental setup of linear cavity of multiwavelength
Brillouin/BOA fiber laser.
Figure 5.2 Spectrum of multiwavelength Brillouin fiber laser with even
peak power.
Figure 5.3 Peaks powers of transmitted Brillouin and the first 4 stokes

xvii
Figure 5.4 Number of Stokes with different BP power
Figure 5.5 The number of Stokes at different BP wavelength
Figure 5.6 Multiwavelength Brillouin/BOA fiber laser with additional
nonlinear medium.
Figure 5.7 Simulation of Brillouin thresholds for BiDF against length and
BP
Figure 5.8 Multiwavelength Brillouin/BOA fiber laser with BiDF (a)
multiwavelength spectrum (b) peak power for each channels.
Figure 5.9 Multiwavelength Brillouin/BOA fiber laser with addition of
RFA
Figure 5.10 Multiwavelength Brillouin/BOA/RFA fiber laser.
Figure 5.11 Characteristic of multiwavelength Brillouin/BOA/RFA fiber
laser
Figure 5.12 Number of Stokes through out O-band wavelength
Figure 5.13 Configuration of tuneable multiwavelength Brillouin fiber
laser
Figure 5.14 Spectrum of tuneable multiwavelength Brillouin fiber laser
Figure 5.15 Performance of multiwavelength fiber laser SLM with
different spacing
Figure 5.16 The peak power performance of Fabry Perot interferometer
with and without BiDF.

xviii
Figure 5.17 Demonstration of multiwavelength fiber laser SLM with
different PMF length
Figure 5.18 Channel spacing over PMF length
Figure 5.19 Performance of peak power and SNR of multiwavelength fiber
laser SLM
Figure 5.20 The flattening multiwavelength fiber laser FPI
Figure 5.21 Performance of even multiwavelength fiber laser FPI
Figure 5.22 The configuration of the multiwavelength fiber laser FPI with
even peaks power.
Figure 5.23 Multiwavelength fiber laser FPI with varied channel spacing
xix
Acronyms
ASE Amplified spontaneous emission
BiDF Bismuth doped fiber
BiDFA Bismuth doped fiber amplifier
BOA Booster optical amplifier
BP Brillouin pump
C Coupler
C-band Conventional band
CPM Cross phase modulation
DCF Dispersion compensated fiber
DP Double pass
DWDM Dense wavelength division multiplexing
EDF Erbium doped fiber
EDFA Erbium doped fiber amplifier
FWM Four wave mixing
FWHM Four width half maximum
FPI Fabry perot interferometer
FTTH Fiber to the home
FUT Fiber under test

xx
L-band Long band
MFD Mode field diameter
MWBFL Multiwavelength Brillouin fiber laser
MWFL Multiwavelength fiber laser
NF Noise figure
O-band Original band
OC Optical circulator
OCS Optical channel selector
OL Objective lens
OPM Optical power meter
OSA Optical spectrum analyser
PC Polarization controller
PCF Polarization crystal fiber
PMF Polarization maintaining fiber
RFA Raman fiber amplifier
RP Raman pump
S-band Short band
SBS Stimulated Brillouin scattering
SLM Sagnac loop mirror
xxi
SMF Single mode fiber
SNR Signal to noise ratio
SOA Semiconductor optical amplifier
SP Single pass
SPM Self phase modulation
SRS Stimulated raman scattering
TLS Tunable laser source
TWF True wave reach fiber
WDM Wavelength division multiplexing
ZDW Zero wavelength dispersion

xxii
Nomenclature
∆β Phase mismatching
∆νB Brillouin pump line width
∆νp Pump line width
Aeff Effective core area
D Displacement of electric field
E Electric field intensity
fs Stokes frequency
G Signal gain
gB Brillouin gain coefficient
gB(νB) Center of Brillouin gain coefficient
gR Raman gain coefficient
GR Raman gain spectrum
Ip Brillouin pump intensity
Is Stokes intensity
Leff Effective length
n Refractive index
NA Numerical aperture
P Polarization state
xxiii
PFWM Power of FWM signal
Pp Brillouin Pump power
Ps Signal power
Pth Threshold power
α Absorption coefficient
β Birefringence coefficient
γ Nonlinear coefficient
δFPI Phase changes for FPI
δSLM Phase changes for SLM
εo Permittivity
η Efficiency of FWM
λp Pump wavelength
λs Stokes wavelength
νa Acoustic velocity
χe Electric susceptibility
ω Frequency of optical signal

xxiv

1
Chapter 1 Introduction
1.1 Overview of fiber optic communication
Optical fiber is important for modern communication world especially in the
development of ultra-fast networking system. Rapid networking system through optical
communication started with the development of optical fiber with high attenuation of
1000 dB/km @1550nm (Charles, 1970) due to contamination in the fiber glass.
Eliminating the impurities of the material reduced the loss to 20dB/km (Kapron, et al.
1970) and not long after with further reduction to only 0.2dB/km (Miya, 1980) and
continue to improve. The improvements are not only on the fiber attenuation but also
against the quality of the signals such as chromatic dispersion. Optical fiber is a strain of
elliptical glass that transmitted light through total internal reflection (TIR) principle
(Bates, 2001).The imperfection of the fiber divides the signal into numbers of modes,
which disperse along the device. Step index fiber is proposed to overcome the chromatic
dispersion effect fiber with different layers of reflective index coating which controls
the propagation of the light can transmit single modes light by controlling the size of
fiber core is called as single mode fibre (Sanferrare, 1987).
Revolution of optical fiber technology leads to others inventions to support the
technology including the transmission source. The frequency of the transmitted signal is
around 800 nm and quite recently has improved to 2.0 µm due to current development
in the fiber technology. During the first generation of optical fiber communication, the
800 nm signal was used that utilized the GaAs semiconductor laser as transmitter. Then
it was replaced by the 1300 nm signal or is called as original window transmission (O-
band). The selection is made due to low absorption coefficient of the optical fiber
around this region which reduce optical electric (O/E) repeater. Furthermore, based on
the zero dispersion curves, the 1300 nm region provide lowest dispersion compared to
2
other available transmission wavelength. The improvement of absorption coefficient to
0.2 dB/km and the increment of bit rate up to 10 Gb/s has introduced the optical
communication to conventional window (C-band) operating at 1550 nm. The
conversion of the amplifier from electrical/optical to fully optical has increased the
speed of the optical communication and also extends the distance of access
transmission. The development of Erbium doped fiber leads to utilization of wavelength
division multiplexing which allows multiple signals to be transmitted and amplify
simultaneously.
As the traffic demand continue to grow the bit rates also rising in numbers of
generations starting with 45 Mbps in 1975 to 100 Tbps in 2010 which multiply the
speed almost 10 times for every 4 years. Therefore, proactive measures should be taken
to accommodate user needs. One of the measures is to maximising the use of all
transmission windows available which consists of expanding the optical amplifier
bandwidth, more efficient transceiver/receiver and also improves of optical fiber.
1.2 Demands on expanding telecommunication capacity
The demand for faster and wider capacity of transmission signals has contributed
to the fiber optics evolution. Therefore numerous studies have been carried out to find
alternatives to cater the demands. There are a number of alternatives to overcome the
issue including, increasing the channel bit rate (D. Hillerkuss, 2011), reducing the
channel spacing between existing channels to maximize the transmission window
utilization, or by exploring a new transmission windows (T. Kasamatsu, 2002). Between
these options, the extension of current transmission window is the only options that
utilize the existing optical and electrical technologies which minimize the
transformations cost. The C-band dominated most of optical communication system due
to the performance of EDFA. However, the capacity starts to saturate where it is

3
approaches the maximum capacity of 100 GHz. Thus, researchers began to explore new
transmission windows. Instead of exploring for new transmission windows, it is also
possible to extend the operation of existing windows. One of the potential windows that
can be extended is O-band operating at wavelength region 1260 nm to 1360 nm. This
window has a reliable background as transmission medium before the era of Erbium
doped fiber amplifier (E. Desurvire, 1987). There are various advantages of using O-
band as the transmission windows including; low fiber absorption coefficient, high
potential to be used in wavelength division multiplexing (WDM) system, and also the
zero dispersion for standard ITU fiber that makes it a highly potential windows to be
use in the long haul transmission system.
1.3 Demand on the improve transmitters
Operating in new transmission windows requires supporting components that
have to be compatible with operating wavelength including its transmitter and signal
amplifier. Current system is uses semiconductor laser to produce single channel
wavelength. The technology is convenience for small bandwidth but due to exponential
growth of capacity demand, the system requires high operational cost. Larger space is
needed to occupy large number of semiconductor laser for each channel. Moreover,
cooling system must be included since the laser diode produces heat and operates at
certain temperature. Therefore the transmitter must be improved together with the
expansion of transmission window so that the optical system operates effectively.
Optical fiber allows multiple wavelength signals to be transmitted in one single
fiber without interfering with each other. This gives a promising solution to the high
capacity demands. During 1990s, the exponential growth of the data speed is
contributed by the use of the WDM. The WDM is a component that multiplex and
demultiplex the signals according to their wavelengths when the signal enters or exit the

4
fiber optic cable. The technology enables simultaneous data transfer. The WDM is
identified using its spacing between adjacent signals.
One of the solutions to minimize the expenses of O-band transmission system is
by producing multiwavelength fiber laser (MWFL). The MWFL is a system sequence of
lasers at different wavelength which can be used as individual channels. There are
various techniques of producing multiwavelength lasers including Fabry Perot
interference, multiple fiber Bragg grating, Sagnac loop mirror, and nonlinear effect like
Brillouin or four wave mixing effect. Each one has its own characteristic. This thesis
focuses on the design and characterization of MWFL using nonlinear techniques and
interferometers
1.4 Demands on the new optical amplifier.
The development of optical amplifiers has spawned new generation of
telecommunication systems starting with the EDFA for 1.55 µm signal. Optical
amplifiers can reduce the dependency on optical-electrical-optical (O/E/O) repeater; it
also shortens the time of data transmission since the O/E/O repeater is time consuming.
Optical amplifier helps to improve the distance requirement between repeaters from 50
km to 160 km.
Over the years the optical amplifier has undergone several upgrades in terms of
type of amplifiers, wavelength ranges, and the quality of the output signal. There are 3
types of optical amplifiers; rare-earth doped optical fiber amplifier, semiconductor
optical amplifiers, and also amplifiers generated from manipulating the nonlinearity
effects of optical fibers.
Extending the transmission windows required modifications of optical amplifier
to ensure the performance of optical communication system. The optical amplifier is not
only being used as an amplifier, but it is also been acknowledged to be used as an
5
optical gain block, optical linear repeater, preamplifier for the weak signal and also as
signal seed for fiber laser. In terms of generating fiber lasers, the optical amplifier is one
of the important components in many fiber laser demonstrations. It is either used as
optical amplifier, signal seeding or both.
In O-band region there are various amplifiers known including Neodymium
Doped Fiber Amplifier (NdDFA), Dysprosium Doped Fiber Amplifier (DDFA), Raman
Fiber Amplifier (RFA), and Semiconductor Optical Amplifier (SOA). Each of the above
amplifiers has its own characteristic, advantages and disadvantages. This thesis will
discuss on the characteristic of three amplifiers used in the making of multiwavelength
fiber laser. These three amplifiers are a new Bismuth doped fiber amplifier (BiDFA)
which is believed to cater amplification for most of the available transmission windows
from O-band (1260 nm) to L-band (1620 nm); O-band Raman fiber amplifier (RFA),
and integrated circuit amplifier called as O-band Booster optical amplifier (BOA).
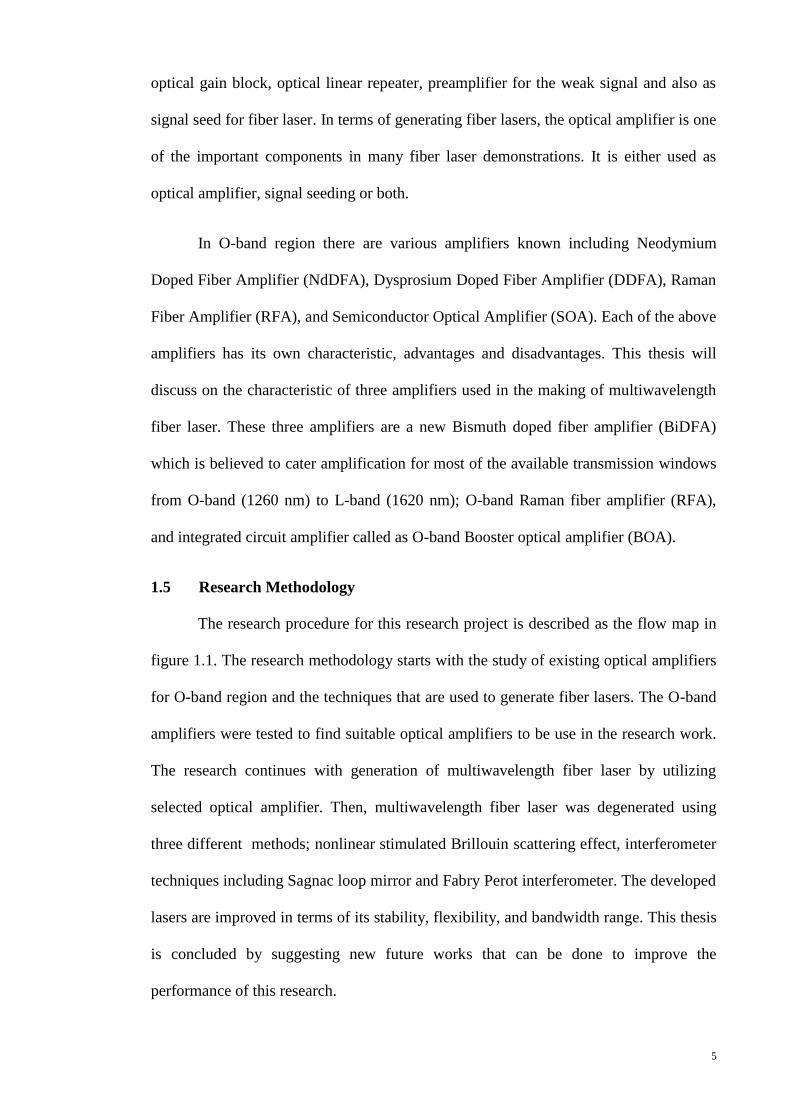
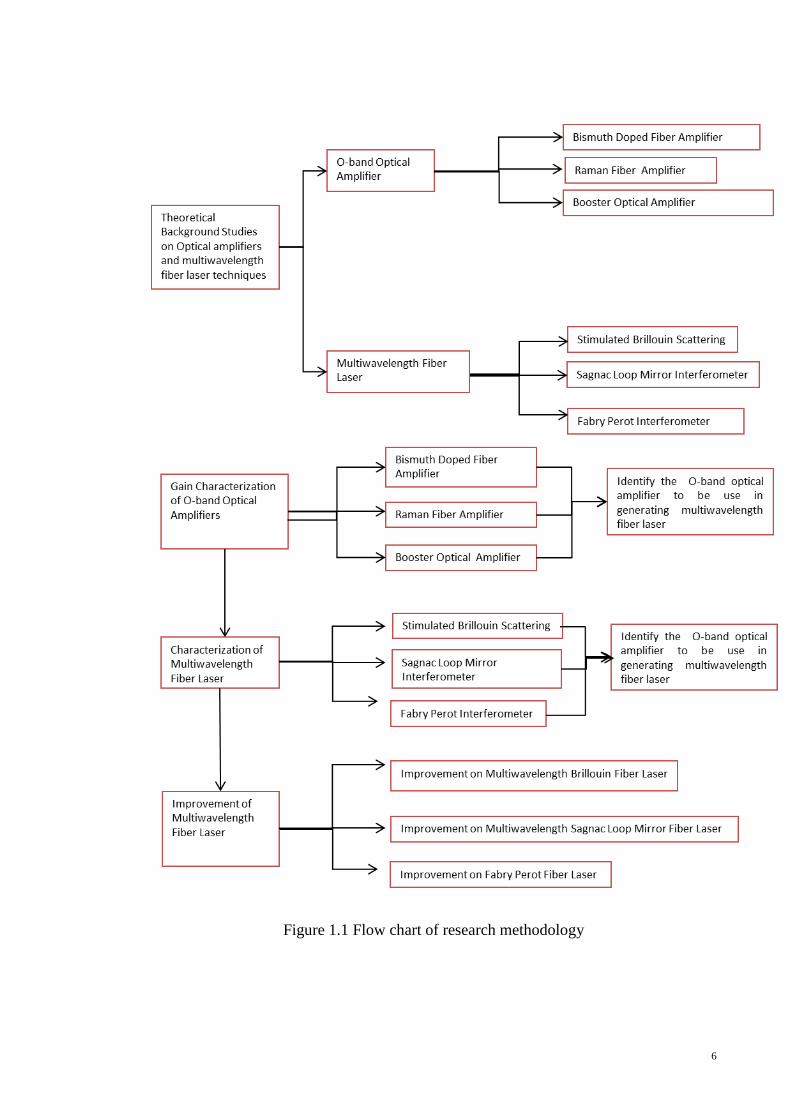
1.5 Research Methodology
The research procedure for this research project is described as the flow map in
figure 1.1. The research methodology starts with the study of existing optical amplifiers
for O-band region and the techniques that are used to generate fiber lasers. The O-band
amplifiers were tested to find suitable optical amplifiers to be use in the research work.
The research continues with generation of multiwavelength fiber laser by utilizing
selected optical amplifier. Then, multiwavelength fiber laser was degenerated using
three different methods; nonlinear stimulated Brillouin scattering effect, interferometer
techniques including Sagnac loop mirror and Fabry Perot interferometer. The developed
lasers are improved in terms of its stability, flexibility, and bandwidth range. This thesis
is concluded by suggesting new future works that can be done to improve the
performance of this research.
6
Figure 1.1 Flow chart of research methodology

7
1.6 Objective of the thesis
Main objective of the research works are;
1) Characterizing the existing O-band amplifier and identifying suitable amplifiers
to be used in the generation of multiwavelength fiber laser
2) Designing and characterizing the multiwavelength O-band fiber laser
3) Identify the deficiency of generated O-band multiwavelength fiber laser and to
improve the work.
4) Identify the multiwavelength fiber laser techniques that are suitable to be used in
WDM system for O-band transmission windows.
1.7 Thesis overview
In this thesis, the focus is given to the development of O-band transmission
windows. O-band transmission windows was chosen because of its many advantages
mentioned in section 1.2, where the system provides less coefficient absorption and
near zero dispersion in ITU standard SMF-28 fiber which minimize the need of optical
amplifier. It also requires no extra compensating fiber to be used to suppress the
dispersion during transmission. Therefore, the cost expenses to improve from
conventional fiber optic communications system can be reduced as compared to other
current available transmission windows.
The knowledge on the new transmission windows are not only beneficial to fiber
optics communication but can also improve many other applications like development
of high power fiber laser, and remote sensory system.
The thesis consists of six chapters where chapter 1 is the introduction to the
thesis. Apart from the introduction, three types of optical amplifiers for O-band region
are demonstrated in chapter 2, where the characteristics such as gain, noise, stability and

8
other properties are studied. From the study, the best optical amplifier was chosen
according to the requirements needed to develop the O-band multiwavelength fiber
laser. In chapter 4, multiwavelength fiber laser are produced by demonstrating three
techniques to generate multiwavelength fiber laser, including nonlinear technique which
is Stimulated Brillouin Scattering technique, two interferometer techniques one is
Sagnac Loop mirror and also Fabry Perot interferometer. From the demonstration, we
indicate the techniques that represent certain properties and have different advantages.
In the chapter 5, improvements are made to overcome issues such as uneven peak
power, unstable output channels and also flexibility on the channels availability. The
summary and the future work of this research work are outlined in chapter 6.
9
Chapter 2 Theoretical Background
2.1 Introduction
Optical fiber technology was not designed solely for application of optical
communication, but many other applications including sensor system, navigation
system, and a lot more. The use of optical fibers in other fields has stimulated photonic
research field including the laser technology. By propagating the laser into the fiber,
data communication can be send throughout the world. In early days, the light emitting
diode (LED) is used as the transmitter, but due to the increase of the data capacity, LED
is no longer an ideal transmitter since its broad emission spectrum limits the ability to
increase the transmission capacity. Therefore, the laser is an ideal solution due to its
coherence properties, mobility, compact and availability in various frequencies. Laser
can be found in many forms like gas laser, semiconductor laser and also optical fiber
laser. Optical fiber laser have numerous advantages compared to the others including
ultra-narrow emission spectrum, that is useful especially for high precision
technologies. The first pulsed optical fiber laser was discovered in 1973, (Stones, 1973)
and continuous wave was discovered shortly after.
A part of optical fiber laser, multiwavelength fiber laser also generates interest
especially towards improving the wavelength division multiplexing (WDM) system.
The multiwavelength lasers have been demonstrated in various techniques including
increasing the capacity of the transmission windows. This development has forced and
enabled the O-band transmission windows to be reactivated, since the research in this
area is less active since the emergence of the Erbium doped fiber amplifier (EDFA) in
1980 that boosted the use of C-band transmission window.

10
2.2 Multiwavelength Fiber Laser by Nonlinear Effect
2.2.1 Nonlinear effect on optical material
Nonlinear effect is defined as phenomena that depend on the intensity of electric
field (Digonnet, 1993). Nonlinearity could be understood through study of dielectric
material. Dielectric is typically used to describe materials with high polarity, where
whenever the electric field enters the material, the electric charges will not flow through
the material as in conductor material. Instead, it will rearrange so that positive charges
are displaced toward the field and negative charges shift in the opposite that
causes dielectric polarization. Optical fiber is one of the examples of dielectric material,
where by making the optical fiber dependent on the intensity of the electric field.
In linear optics, the displacement of electric field, D is defined by the equation
2.1;
𝐷 = 휀0𝐸 + 𝑃 (2.1)
where P represents the polarization induced in the optical medium. In linear and
isotropic optical media, the polarization is linearly proportional to the E field and is in
the same direction as D
𝑃 = 휀0𝜒𝑒𝐸 (2.2)
where the permittivity is represented by 휀0 in vacuum and χe is the electric
susceptibility. Under small intensity the electrons oscillates with the same frequency as
the incident field, therefore the conditions optical properties of the medium (e.g
refractive index and absorption coefficient) are independent of the light intensity.
However, high intensity electric field rearrange the electron to form an-harmonic
motion that makes P satisfies frequencies that does not include the incident frequency

11
(Boyd, e al. 2003) as given by equation 2.3 as well as linear and nonlinear interactions
are illustrated by figure 2.1.
𝑃 = 휀0(𝜒1𝐸 + 𝜒2𝐸2 + 𝜒3𝐸3 + ⋯) (2.3)
Figure 2.1 Illustration of linear and nonlinear interaction
The relation can be explained through equation of polarization with numbers of
susceptibility parameters. The dominant parameters in the equation 2.3 are χ1 the χ
2 that
contributed by the second harmonics generation and sum of frequency generation.
Meanwhile, the lowest-order nonlinear effect is contributed by the third susceptibility
coefficient, χ3. The quantity in parentheses indicates that the susceptibility changes with
light intensity. In fact, this relation is far a material with a refractive index and
absorption coefficient that is intensity dependent. High electromagnetic field in optical
fiber may change the orientation of the molecules which results as many implacable
such as nonlinear refractive index and inelastic scattering as illustrated in figure 2.2.
The nonlinear effect in optical fiber is divided into two categories, which is in nonlinear
refractive index effects and inelastic scattering effects.

12
Figure 2.2 Fraction of nonlinear effects
The nonlinear refractive index is an effect when the refractive index changes with
the intensity of electric field. This effect includes self-phase modulation (SPM), cross
phase modulation (XPM), and four wave mixing (FWM), which is depends on the type
of electric field source. Meanwhile, the inelastic scattering effects are generated when
the signal channels collides with phonon that stimulate scattering. The stimulated
Raman scattering (SRS) is an example of incident electric field that collides with optical
phonon while the stimulated Brillouin scattering (SBS) is the collision with acoustic
phonon. The intensity of scattered power increases exponentially after the electric field
exceeds the threshold value. Brief explanations on each nonlinear effect are summarized
below;
(i) Self-Phase Modulation (SPM)
The refractive index depends on the intensity of electric field. If pulse of electric
field is used, the leading edge of the source will have different refractive index with the
trailing edge. Therefore, it results in temporally varying indexes which leads to
temporally varying phase change. This nonlinear phenomenon of self-induced phase
modulation is called as Self Phase Modulation (SPM).

13
(ii) Cross Phase Modulation (XPM)
SPM is a major problem in single channel optical communication. In multiple
channels optical communication system, nonlinear effect leads to another problem.
Whenever two of more optical pulse propagates in single optical fiber simultaneously,
the SPM is generated not only by the modulation of refractive index of the channels but
also is affected by other channels. By having multiple numbers of channels in the
optical system, another nonlinear phenomenon called Cross Phase Modulation (XPM) is
generated. The XPM are twice effective than the SPM with the same amount of electric
field intensity.
(iii) Four Wave Mixing (FWM)
All nonlinear effects will generate new channels and suppressing other except for
SPM and XPM effect. The FWM generated through the third susceptibility coefficient
(χ3) where whenever there are three different channels propagating in the medium, this
(χ3) will generates the fourth channels that have frequency equals to the frequency sum
of all three channels. Meanwhile the power of three initial channels will be suppressed.
Detail on FWM effect will be discussed on section 2.2.3.
(iv) Stimulated Raman Scattering (SRS)
Phonon is an excitation of quantum atomic cell at an early stage. Whenever the
unit cell contains more than one atom as in optical fiber, two types of phonon will be
generated, namely optical phonon and acoustic phonon. Optical phonon is generated
when the positives and negatives ions swing against each other. The collision of
incident electric field generates SRS. The power of initial high intensity electric field
will be transferred into different frequency. Brief explanation is in section 3.3.

14
(v) Stimulated Brillouin Scattering (SBS)
The collision between incident signal and acoustic phonon generates phenomena
which is called as stimulated Brillouin scattering (SBS). The acoustic phonon is produce
by the shift of positive and negatives ions that swing together like a moving grating due
to the propagation of the electric field. Any photons that collide with this acoustic
phonon will generate signals with different frequency. The generated frequency depends
on the difference of incident frequency with acoustic phonon frequency which is around
12 THz depending on various parameters of medium and electric field source. Section
2.2.2 will briefly explain the process of stimulated Brillouin scattering.
Previously all these effects are avoided in the optical communication system.
However, recent demands on the advanced optical communication technology have
encouraged the research towards nonlinear properties of optics. Researches have
brought up various applications that have been commercially used today such as
multiwavelength fiber laser. The research works here cover the multiwavelength fiber
laser generation in the O-band region.
The nonlinear effects that are used to generate the O-band multiwavelength fiber
laser are SBS and FWM. The selections are made due to low development cost and
minimum adjustment of current system.
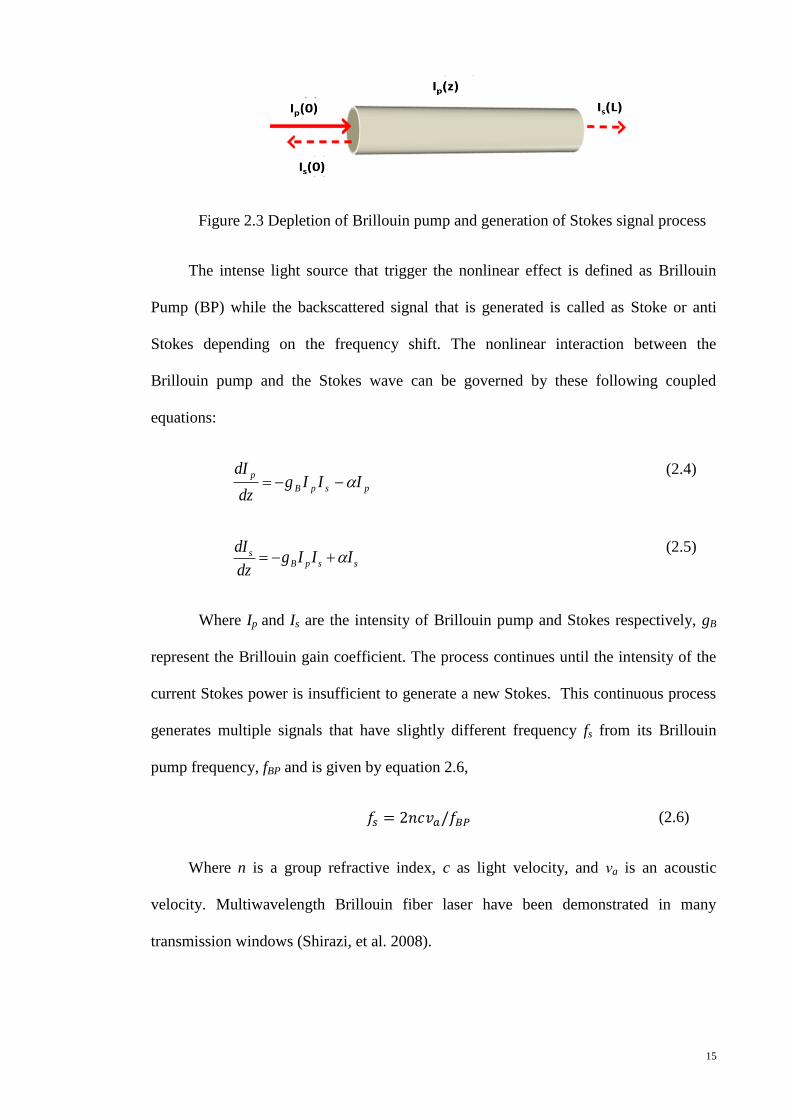
2.2.2 Principles of Stimulated Brillouin Scattering
Stimulated Brillouin scattering is generated through an electrostriction process of
dielectric medium. High electric field rearranges the refractive index of the medium that
changes it into an acoustic phonon and acts like a moving grating. The resulting
scattering from collision between the incident light and the acoustic wave is called as
Brillouin scattering which moves in backward direction of the incident light as depicted
by figure 2.3.
15
Figure 2.3 Depletion of Brillouin pump and generation of Stokes signal process
The intense light source that trigger the nonlinear effect is defined as Brillouin
Pump (BP) while the backscattered signal that is generated is called as Stoke or anti
Stokes depending on the frequency shift. The nonlinear interaction between the
Brillouin pump and the Stokes wave can be governed by these following coupled
equations:
pspB
pIIIg
dz
dI
(2.4)
sspB
s IIIgdz
dI
(2.5)
Where Ip and Is are the intensity of Brillouin pump and Stokes respectively, gB
represent the Brillouin gain coefficient. The process continues until the intensity of the
current Stokes power is insufficient to generate a new Stokes. This continuous process
generates multiple signals that have slightly different frequency fs from its Brillouin
pump frequency, fBP and is given by equation 2.6,
𝑓𝑠 = 2𝑛𝑐𝑣𝑎/𝑓𝐵𝑃 (2.6)
Where n is a group refractive index, c as light velocity, and νa is an acoustic
velocity. Multiwavelength Brillouin fiber laser have been demonstrated in many
transmission windows (Shirazi, et al. 2008).
16
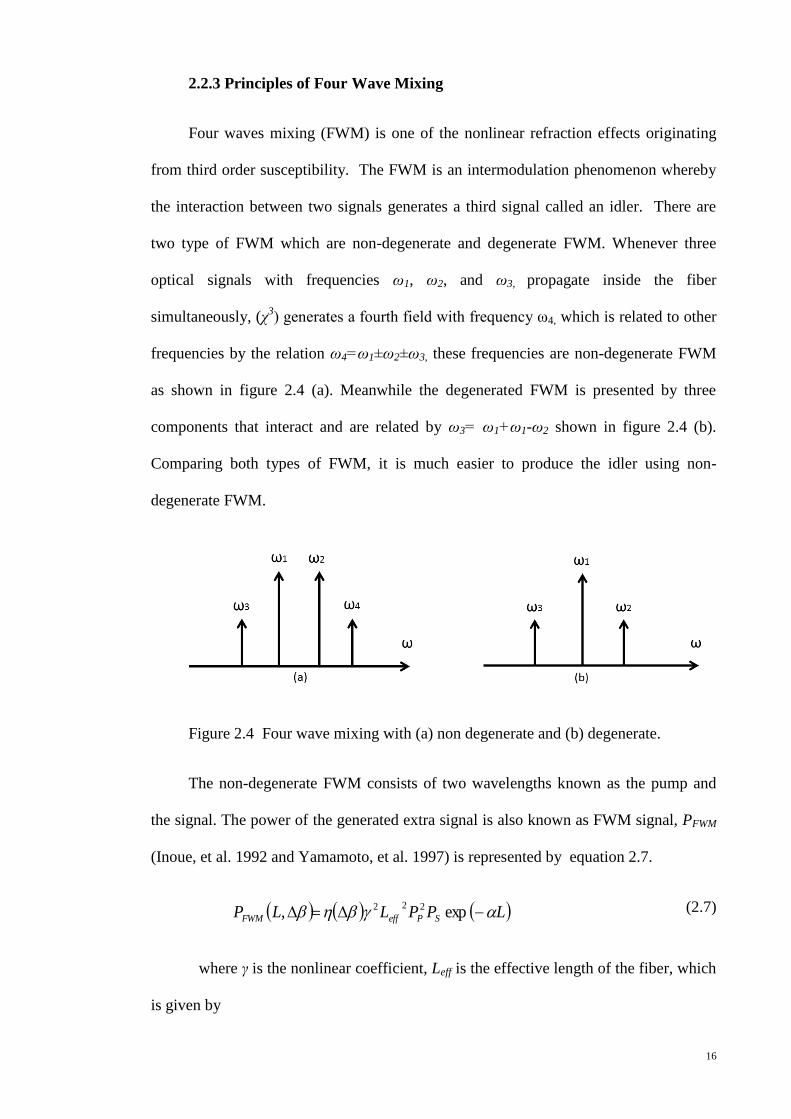
2.2.3 Principles of Four Wave Mixing
Four waves mixing (FWM) is one of the nonlinear refraction effects originating
from third order susceptibility. The FWM is an intermodulation phenomenon whereby
the interaction between two signals generates a third signal called an idler. There are
two type of FWM which are non-degenerate and degenerate FWM. Whenever three
optical signals with frequencies ω1, ω2, and ω3, propagate inside the fiber
simultaneously, (χ3) generates a fourth field with frequency ω4, which is related to other
frequencies by the relation ω4=ω1±ω2±ω3, these frequencies are non-degenerate FWM
as shown in figure 2.4 (a). Meanwhile the degenerated FWM is presented by three
components that interact and are related by ω3= ω1+ω1-ω2 shown in figure 2.4 (b).
Comparing both types of FWM, it is much easier to produce the idler using non-
degenerate FWM.
Figure 2.4 Four wave mixing with (a) non degenerate and (b) degenerate.
The non-degenerate FWM consists of two wavelengths known as the pump and
the signal. The power of the generated extra signal is also known as FWM signal, PFWM
(Inoue, et al. 1992 and Yamamoto, et al. 1997) is represented by equation 2.7.
LPPLLP SPeffFWM exp, 222 (2.7)
where γ is the nonlinear coefficient, Leff is the effective length of the fiber, which
is given by
17
𝐿𝑒𝑓𝑓 =
1
∝(1 − 𝑒−∝𝐿)
(2.8)
The α represent as absorption coefficient, L length of fiber, and Ps, Pp are power
for signal and pump respectively, while η(Δβ) is the efficiency of FWM in terms of
phase mismatching . The FWM efficiency is a ratio of FWM power over FWM
power at equal to zero,
LP
LP
FWM
FWM
,0
,
. Another definition of η(Δβ) is written
as in equation 2.9.
22
2
22
2 2/sinexp41
effL
LL
(2.9)
The ∆β is given by the difference between the propagation constant
PSFWM 2 and βFWM, βS where βP are phase for FWM, the signal and propagation
constant respectively. When there is no phase mismatching, is equal to zero which
makes to be maximum 1. By replacing the value into equation 2.7 the nonlinear
coefficient can be determined. Another solution for phase mismatching is shown in
equation 2.10.
sp
cp
op
pPP
d
dD
cff
cf
22
22
2
(2.10)
where p is pump wavelength, of , pf and sf are represented as zero dispersion,
pump and signal frequency respectively, sp fff , and d
dDc is the dispersion slope.
The term sp PP 2 represents the nonlinear phase matching factor NL which is
small and can be neglected (Mollenauer, et al. 1996 and Vinegoni, et al. 2002). The four
wave mixing is proven technique in producing multiwavelength fiber laser
18
2.3 Multiwavelength Fiber Laser by Interferometer techniques
2.3.1 Introduction on Interferometer
An interferometer technique is a technique that employs the superposition of
electromagnetic waves. The technique is used in many applications including;
telecommunication number of sensor applications, military defends, astronomical and
also medical. There are number of categories in utilizing this technique, which differ in
terms of the properties that includes the properties of EM waves, the propagation path
and also the method of splitting and combining the waves.
The properties of EM waves describe the sources that have been used in the
interferometer technique. If the waves that superposition have same wavelength it is
called as Homodyne otherwise it is called as Heterodyne. The interferometer by
Homodyne techniques will affect the intensity and also the pattern of the outgoing
signals, where else Heterodyne can be used to generate new wavelength and also to
amplify weak signals.
The propagation properties describe the paths that the waves travel before the
interference take place. Interferometer process that makes the beams to travel in
different paths is called as double paths for example as is Michelson interferometer.
Meanwhile, if the beams travel on the same path and interfere between the path it is
called as common path. Common path have numbers of example configuration
including the Sagnac Loop Mirror, Fabry Perot and gyroscope.
Last categories of interferometer technique are method of splitting and combining
waves. If the splitting involving only the amplitude waves it called as amplitude
splitting; such as Mach Zehnder, Fabry Perot and Michelson interferometer. The
technique is different with the splitting of wave front called as wave front splitting;

19
Young slit experiment and also Lloyd mirrors. Generating multiwavelength fiber laser
utilizing these techniques has been demonstrated through number of experiment.
This project explored 2 interferometer techniques namely, Sagnac Loop mirror
and Fabry Perot Interferometers. The selection of these techniques is based on its
advantages including; the compactness, low cost expenses, tunability, and possible of
future implementation. Furthermore, generating MWFL with the Mach-Zehnder and
Michelson interferometer experience polarization induce fading (PIF) effect from
propagation into 2 different medium that varies the state of polarization of incident light
in an unpredictable manners and leads to interferometric optical mixing efficiency and
loss of interference source (Stowe et al. 1982)
2.3.2 Principles of Sagnac Loop Mirror (SLM)
Named after the French physicist Georges Sagnac, Sagnac loop mirror is under a
category of homodyne interferometer with a common path way. It also represents
interferometer phenomenon that depends on the polarization of light. The effect is
generated from one beam source that is spliced into two identical beams and propagates
in direction opposite to each other and travel in a ring shape as shown in figure 2.5.
Figure 2.5 Sagnac loop mirror
20
Initially identical beams travel in the same distance path but due to rotation of the
ring, both beams experience changes of phase which can be determined according to
equation 2.11
𝛿𝑆𝐿𝑀 =
2𝜋
𝜆𝐵𝐿
(2.11)
The birefringence coefficient, B is the product of the difference between effective
indices of fast and slow modes. The interference between two beams occurs at the point
of entry. The product of the interference is in fringe pattern that has periodic spacing.
The Sagnac loop mirror provides many advantages including high sensitivity on rotation
which makes it favourable for sensor application.
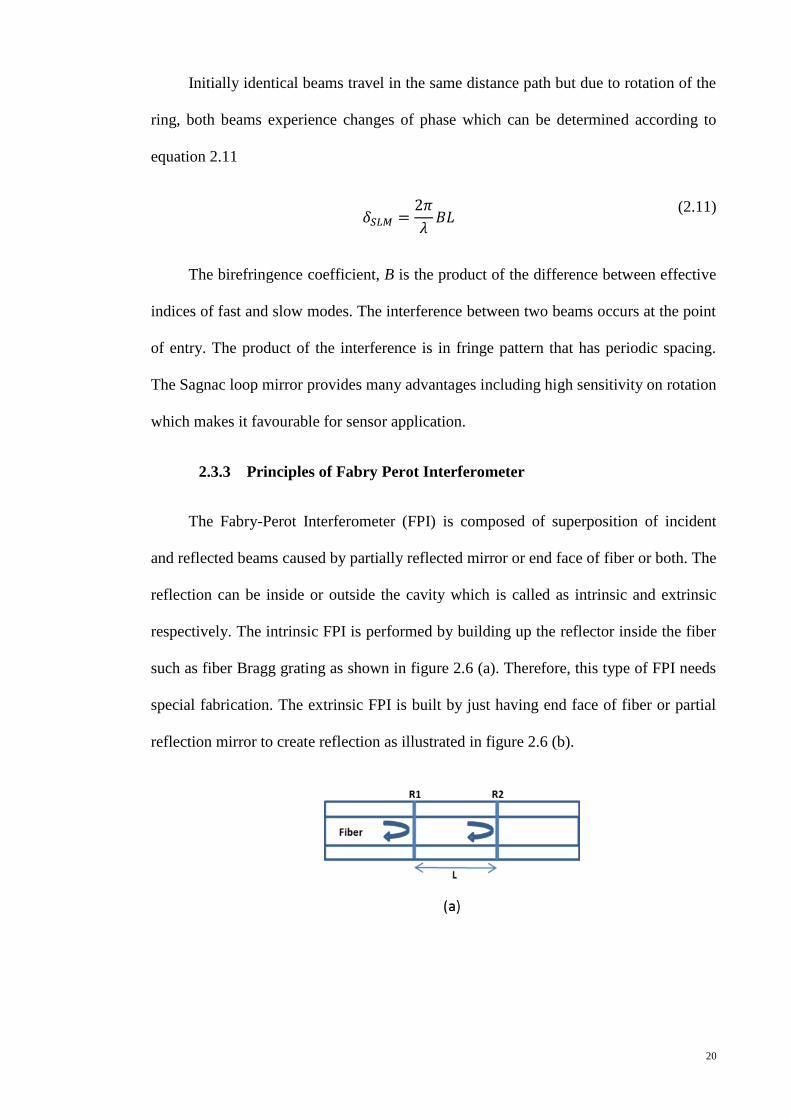
2.3.3 Principles of Fabry Perot Interferometer
The Fabry-Perot Interferometer (FPI) is composed of superposition of incident
and reflected beams caused by partially reflected mirror or end face of fiber or both. The
reflection can be inside or outside the cavity which is called as intrinsic and extrinsic
respectively. The intrinsic FPI is performed by building up the reflector inside the fiber
such as fiber Bragg grating as shown in figure 2.6 (a). Therefore, this type of FPI needs
special fabrication. The extrinsic FPI is built by just having end face of fiber or partial
reflection mirror to create reflection as illustrated in figure 2.6 (b).
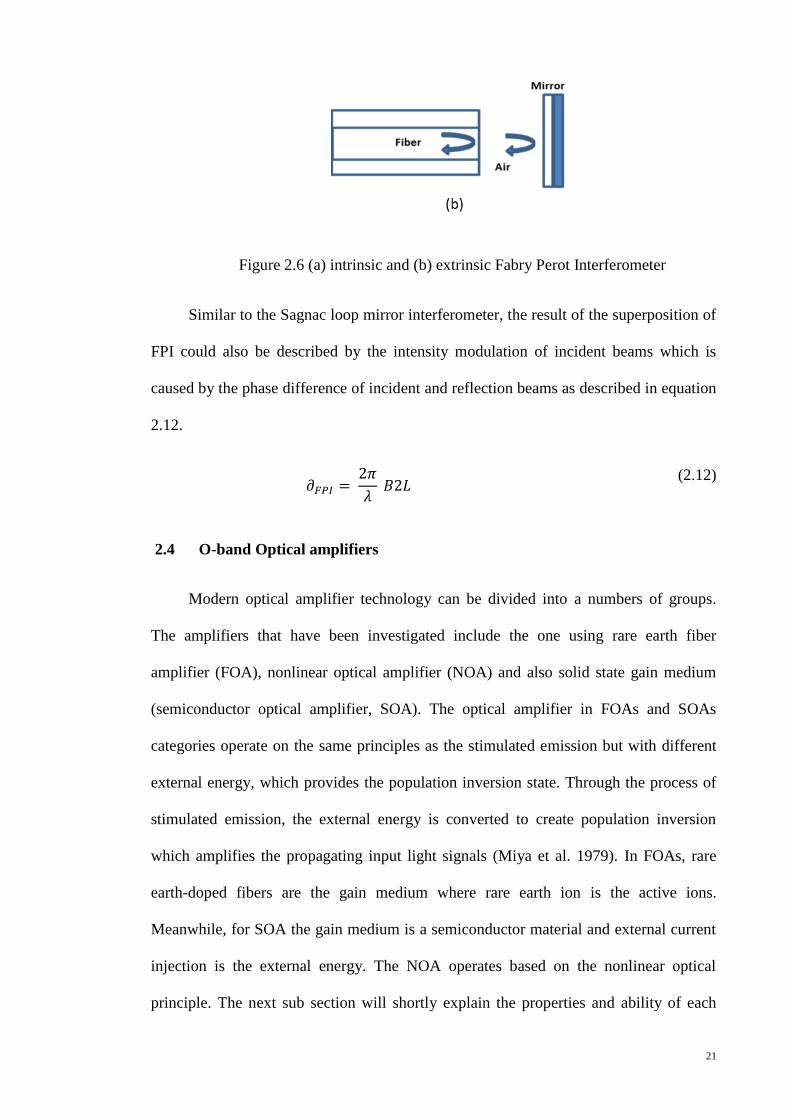
21
Figure 2.6 (a) intrinsic and (b) extrinsic Fabry Perot Interferometer
Similar to the Sagnac loop mirror interferometer, the result of the superposition of
FPI could also be described by the intensity modulation of incident beams which is
caused by the phase difference of incident and reflection beams as described in equation
2.12.
𝜕𝐹𝑃𝐼 =
2𝜋
𝜆 𝐵2𝐿
(2.12)
2.4 O-band Optical amplifiers
Modern optical amplifier technology can be divided into a numbers of groups.
The amplifiers that have been investigated include the one using rare earth fiber
amplifier (FOA), nonlinear optical amplifier (NOA) and also solid state gain medium
(semiconductor optical amplifier, SOA). The optical amplifier in FOAs and SOAs
categories operate on the same principles as the stimulated emission but with different
external energy, which provides the population inversion state. Through the process of
stimulated emission, the external energy is converted to create population inversion
which amplifies the propagating input light signals (Miya et al. 1979). In FOAs, rare
earth-doped fibers are the gain medium where rare earth ion is the active ions.
Meanwhile, for SOA the gain medium is a semiconductor material and external current
injection is the external energy. The NOA operates based on the nonlinear optical
principle. The next sub section will shortly explain the properties and ability of each

22
amplifier, and will determine suitable amplifier to be utilized in generating
multiwavelength O-band fiber laser.
2.4.1 Rare earth doped fiber amplifier (FOA)
The amplification source for FOA is an external optical laser source which is
different for every fiber depending on their absorption wavelength. The absorption
wavelength is the wavelength region where the energy is similar or equal to the energy
gap of the active ions that excites to the next energy level. Usually the wavelength of
external laser source is lower than the wavelength of the generated signal. Sufficient
power of external laser source will generate a population inversion which is the
phenomenon that describes higher energy level that has more active ions compared to
its lower level. At this stage, the incoming photon from the external laser source will
collide with the excited ions and generates another photon with coherence properties as
the photons strike it. This process is called as stimulated emission amplification, where
the generated photons will collide with the rest of the excited photons and multiply the
numbers of coherent photons instantly, therefore created an amplification effect.
The important parameters to determine good optical amplifier are high signal
gain, lower noise figure, high signal to noise ratio, high power conversion efficiency
and wide wavelength range.
Signal gain of an optical amplifier can be described as ratio of output power, Pout
over input power, Pin as shown in equation 2.13
𝐺 =
𝑃𝑜𝑢𝑡
𝑃𝑖𝑛
(2.13)
Noise figure determine the level of noise in the signal. It is represent as input
signal to noise ratio, SNRin over output signal to noise ratio, SNRout describe equation
2.14
23
𝑁𝐹 =
𝑆𝑁𝑅𝑖𝑛
𝑆𝑁𝑅𝑜𝑢𝑡
(2.14)
The signal to noise ratio (SNR) is another way to determine the noise level in the
signal by differentiating the signal power to the noise power generated by amplified
spontaneous emission (ASE). The ASE spectrum is photons generated when the excited
ions decay to the lower ground without any external energy because the ions already
exceeded their half lifetime. Meanwhile the power conversion efficiency measures the
generated amplified power in comparison to the power from external laser source. The
wavelength range is simply the range of wavelength covered by amplifier.
Rare earth doped fiber amplifier or often call as fiber optical amplifier (FOA)
was first discovered in Optoelectronic Research Center, Southampton University of
London, where the active medium used is trivalent Erbium which amplified mostly in
the C-band region (1530 nm-1580 nm). Until now the modified Erbium doped fiber
manages to amplify up to 360 nm which cover most of available transmission windows
except for O-band. As for O-band there are numbers of rare earth fiber that have been
tested with hope it can supply the amplification needs for the future optical
telecommunication demand as good as Erbium doped fiber to C-band region. These
include Praseodymium Doped Fiber Amplifier (PdDFA), Neodymium Doped Fiber
Amplifier (NdDFA), and Dysprosium Doped Fiber Amplifier (DDFA).
Recently, there has been another doped fiber optical amplifier which is proposed
through modelling that claims to amplify most of the transmission windows starts from
O-band till L-band using Bismuth ions (Chun, 2009). However, until now there are still
no demonstration on Bismuth doped fiber that can amplify all transmission windows as
claimed. In the case of Bismuth doped fiber, active ion are still undetermined and
suggested its contributed by number of other ions.
24
2.4.2 Nonlinear effect amplifier (NOA)
As described by the title, this type of amplifier utilizes the nonlinear optical effect
as the amplification principle. Most of the nonlinear effect can generate amplification
but most have efficiency obstacle, where high power is required to produce even a small
amplification. However, there are nonlinear effect that can produce exceptional
amplification including Raman fiber amplifier (RFA) and also optometric amplifier.
The Raman fiber amplifier (RFA) is a nonlinear effect amplifier that manipulates
the stimulated Raman scattering (SRS). The scattering resulted from collision between
the photon and the phonon that generates new photons at a lower energy. The rest of the
energy will be transferred as non-radiate waves called as phonon. The amplification of
RFA, Po can be described by equation 2.15
𝑃𝑜 = 휀0(𝜒1 + 𝜒3𝐸𝑝𝑢𝑚𝑝2 )𝐸𝑠𝑖𝑔𝑛𝑎𝑙 (2.15)
The 휀𝑜 is the permittivity of fiber, 𝜒1 and 𝜒3 first and third susceptibility
respectively also electric field of pump and signal represent as 𝐸𝑝𝑢𝑚𝑝 and 𝐸𝑠𝑖𝑔𝑛𝑎𝑙
respectively. The pump changes the absorption coefficient of the material, making it
negative and producing gain at the signal frequency. The advantage of utilizing this type
of amplifier is that the amplification can happen at any frequency depending on the
frequency of the pump as long as the pump intensity exceeds its threshold. The spacing
between the pump frequency and amplification frequency vary with different type of
optical fibers.
25
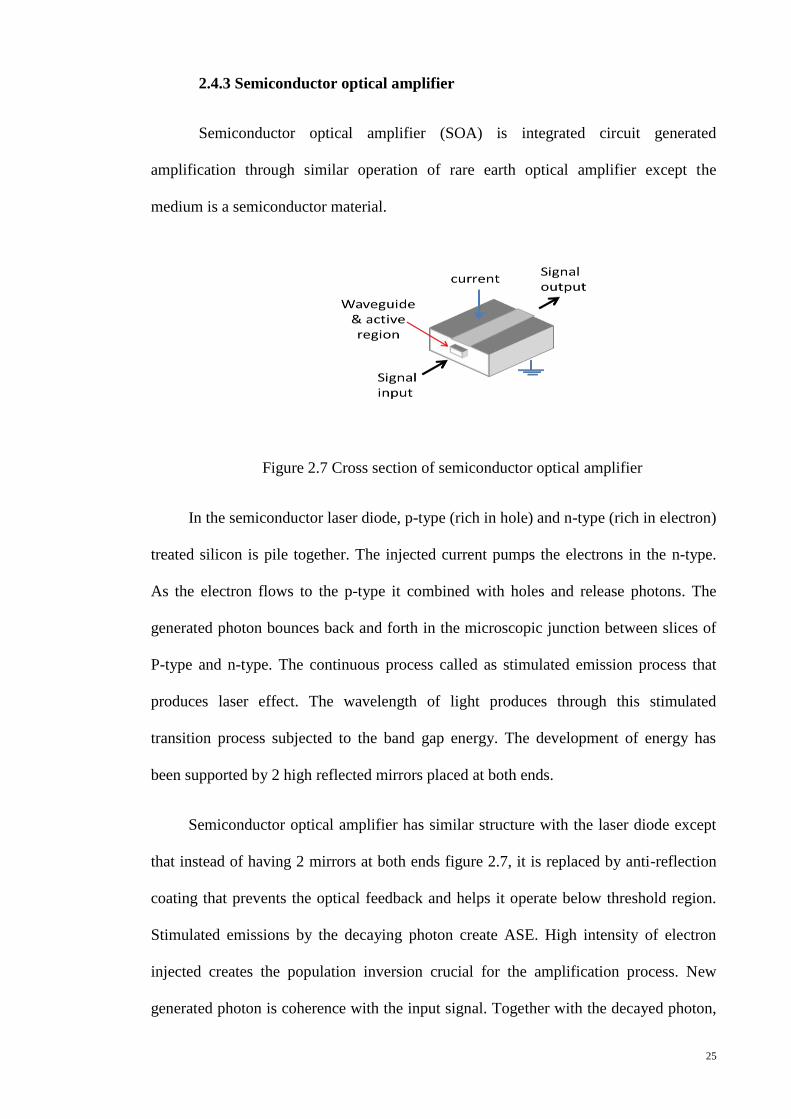
2.4.3 Semiconductor optical amplifier
Semiconductor optical amplifier (SOA) is integrated circuit generated
amplification through similar operation of rare earth optical amplifier except the
medium is a semiconductor material.
Figure 2.7 Cross section of semiconductor optical amplifier
In the semiconductor laser diode, p-type (rich in hole) and n-type (rich in electron)
treated silicon is pile together. The injected current pumps the electrons in the n-type.
As the electron flows to the p-type it combined with holes and release photons. The
generated photon bounces back and forth in the microscopic junction between slices of
P-type and n-type. The continuous process called as stimulated emission process that
produces laser effect. The wavelength of light produces through this stimulated
transition process subjected to the band gap energy. The development of energy has
been supported by 2 high reflected mirrors placed at both ends.
Semiconductor optical amplifier has similar structure with the laser diode except
that instead of having 2 mirrors at both ends figure 2.7, it is replaced by anti-reflection
coating that prevents the optical feedback and helps it operate below threshold region.
Stimulated emissions by the decaying photon create ASE. High intensity of electron
injected creates the population inversion crucial for the amplification process. New
generated photon is coherence with the input signal. Together with the decayed photon,

26
the signals travel though the SOA and producing more stimulated emission and if the
amount of photon emitted from the process is more than its absorption (generated from
reabsorption of signal by valance band), the signal will be amplified.
The performance of SOA depends on two factors; SOA design (facet reflectivity)
and gain medium. The SOA design affect the ripple generated from amplification
process meanwhile the gain medium gives effect on its gain, noise figure and ASE
pattern.
27
Chapter 3 Characterization of O-band Optical
Amplifiers
3.1 Introduction
There have been tremendous studies on the multiwavelength fiber laser since
1980’s. Through that, various amplifiers systems are used either to amplify the seeding
signal (Al-Mansoori, et al. 2009) or as seeding signal source itself (Ahmad, et al. 2009).
Optical amplifier can be divided into two categories, namely fiber optic based and
integrated circuit based amplifier. The properties of optical amplifier for generating
multiwavelength fiber laser include providing high gain, low noise figure and also able
to amplify multiple signal simultaneously (Nusinsky et al., 2004) without being
suppressed.
In the case of C-band multiwavelength fiber laser, an EDFA is the widely used
amplifier where it can produce high gain of over 30dB. Unfortunately, the signal
dependency of gain characteristic and profile has causing problem in cascading the
EDFAs (Mrinmay et al., 2007). Another choice is to use integrated circuit amplifier like
C-band SOA. Gain mode competition does not occur in SOA since it is inhomogeneous
gain medium (Wang, et al. 2003), but with its high noise figure and low gain
characteristic it might pose a problem.
In O-band region, there are a numbers of commercialized amplifiers including,
Raman Fiber Amplifier (RFA) (Dianov, et al. 1994), Semiconductor Optical Amplifier
(SOA) (Assadihagni et al. 2008) and fiber optical amplifier (FOA) such as Neodymium
Doped Fiber Amplifier (Naftaly, et al. 2000) and Praseodynium Doped Fiber Amplifier
(Ohishi, et al. 1991). Unfortunately none can be as efficient as EDFA for C-band
amplification. Most of the FOA, for O-band require high pumping power, meanwhile

28
the SOA suffer from high noise figure and low gain. This chapter will discuss the
characteristic of three amplifiers for multiwavelength fiber laser.
Recently another new fiber is believed that to be able to provide amplification to
most of the available transmission windows from 1260nm to 1620nm which is Bismuth
doped fiber (BiDF). First broad emission of Bismuth silica glass was discovered by
(Fujimoto et al. 2001). In section 3.2, the performance of Bismuth doped fiber is studied
by characterizing its absorption spectrum, ASE, and gain. The double pass configuration
was used to study the improvement in its gain properties. Apart from general studies of
amplifier parameters, the nonlinear coefficient value is also included in that section.
As discussed earlier, the nonlinear effect can be manipulated and used as an
amplifier such as stimulated Brillouin scattering or stimulated Raman scattering. The
stimulated Raman scattering is proven to produce better performance among nonlinear
amplifier, therefore O-band Raman fiber amplifier (RFA) was included and discussed in
next section. O-band RFA has high dependency on fiber nonlinear value and length,
hence different fibers and length are used to study the Raman gain coefficient value.
The final section of this chapter will discuss on the improvement of integrated circuit
amplifier, which is called Booster optical amplifier (BOA). The gain and noise figure
characteristics of BOA is measured together with the performance of polarization
dependent gain (PDG). Multiple pass amplification happens during the process of
generating multiwavelength fiber laser. Hence, the performance of BOA with double
pass configuration is also demonstrated.

29
3.2 The performance of Bismuth Doped Fiber Amplifier
Bismuth was first used in the optical fiber to overcome the quenching effect of
Erbium doped fiber amplifier and to improve the amplification in the L-band (Cheng, et
al. 2009), where bandwidth have improve to 90 nm (1530 nm to 1620 nm). Bismuth
was next used as the nonlinear medium, which was doped on the oxide base optical
fiber (Lee, et al. 2006). The highest nonlinear coefficient recorded for Bismuth-oxide
nonlinear fiber was 1360 W-1
km-1
(Sugimoto, et al. 2004). Meanwhile, infrared
luminescent from bismuth-doped silica glass was first discovered (Fujimoto et al. in
2001) that show wide luminescent from 1000nm to 1600nm.
The Bismuth doped fiber (BiDF) used for the following experiments is obtained
from the Optical Research Center (ORC), Southampton University, UK and is labelled
as L30157-T0220. The Bismuth fiber is doped together with alumina, germanium
oxide, phosphate and bismuth as an active ion (BiSiO2GeO2P2O5).
3.2.1 Absorption Spectrum
The absorption spectrum provides information on absorption losses along the
operating wavelength and also clues on available pumping wavelength for the
respective fiber amplifier. The cut back method is a commonly uses to measure the
attenuation loss due to the absorption of active ion. By inserting a broad spectrum of
white light source into 1m of BiDF that connected with connectors at both ends, the
spectrum of the loss is gathered. Next the 1m BiDF will be cut into 5cm pieces to ensure
that no absorption takes place is other than the splicing loss. The spectrum from the 1 m
BiDF will be deducted with the 5 cm BiDF spectrum to show the actual absorption loss.
The absorption coefficient is shown in figure 3.1.

30
Figure 3.1 The absorption spectrum of BiDF
Due to the limitation of optical spectrum analyzer (OSA) the spectrum can only
be analyzed from 600 nm to 1700 nm, high absorption spectrum was observed from 600
nm to 850 nm which is around 35 dB/m and 5 dB/m for the aimed region of 1310 nm.
The absorption spectrum shows a broad selection of pump wavelengths. The broad
absorption spectrum is caused by the multiple active ions present in the fiber (Omenetto,
et al. 2006).
3.2.2 ASE at different excitation wavelength
A broad pumping wavelength is an advantage as a variety of pump wavelength
could be used to excite the doped ion in the fiber. Therefore in this section, the BiDF is
tested with various pump wavelengths to observe the efficiency of the pumping scheme.
Figure 3.2 Experimental setup for collecting ASE of the BiDF
31
Experimental configuration in figure 3.2 consist of the Ti:Sapphire laser used to
generate tuneable wavelength with ranges from 800 nm to 890 nm and the power output
is up to 1.0 W for each selected wavelength. The excitation source output is directly
coupled into the input of the WDM using a 20X magnification objective lens (OL). The
direct coupling of the excitation source into the WDM minimizes fibre mode mismatch
which may occur if a separate fibre is used for coupling. The free space – fibre coupling
efficiency measured to be more than 60%. The laser then enters the BiDF system
through 800/1300 wavelength division multiplexer (WDM) with 1 dB loss. The power
coupled into the BiDF is around 390 mW. The ASE spectrums were extracted at the
WDM signal output and analysed using OSA which was fixed to be at a resolution of
2.0 nm (Seongwoo, et al. 2009).
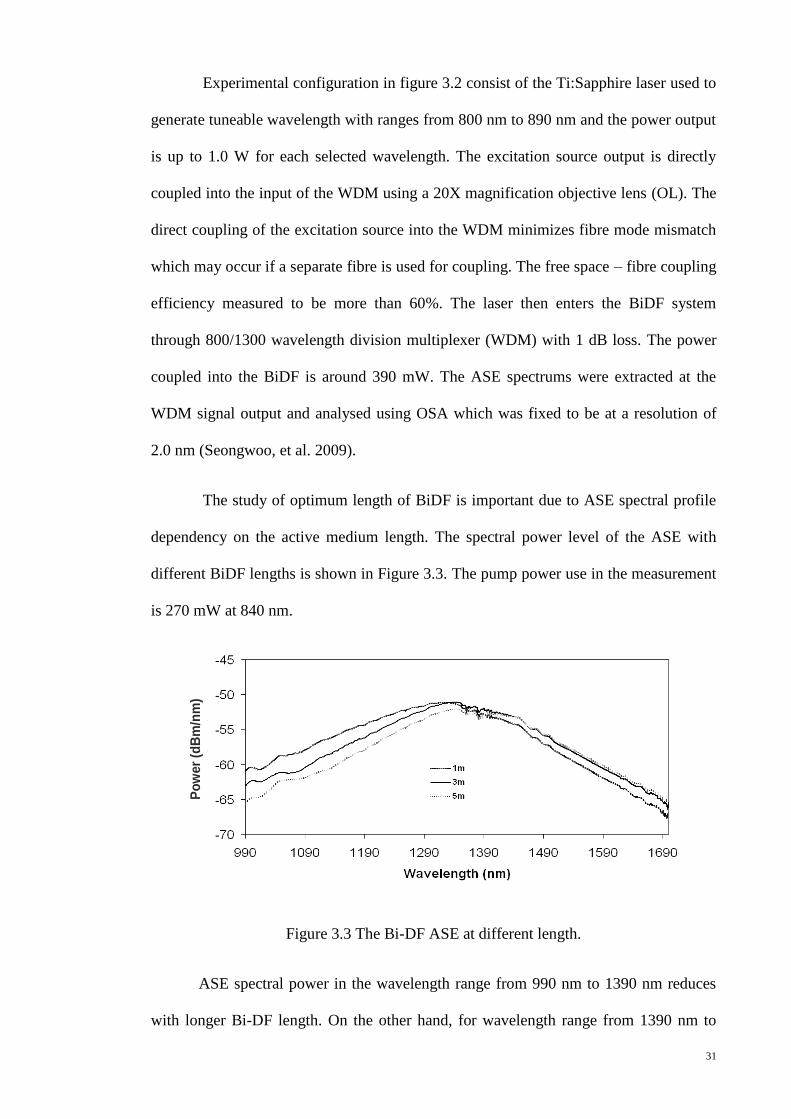
The study of optimum length of BiDF is important due to ASE spectral profile
dependency on the active medium length. The spectral power level of the ASE with
different BiDF lengths is shown in Figure 3.3. The pump power use in the measurement
is 270 mW at 840 nm.
Figure 3.3 The Bi-DF ASE at different length.
ASE spectral power in the wavelength range from 990 nm to 1390 nm reduces
with longer Bi-DF length. On the other hand, for wavelength range from 1390 nm to
Po
wer
(dB
m/n
m)
Po
wer
(dB
m/n
m)
32
1690 nm, ASE spectral power for 1 m of Bi-DF is lower compared to the of 3 m and 5
m length. These characteristic is similar to Erbium-doped fibre in which, by utilizing a
longer length fiber, the ASE spectrum power shift to the longer wavelength. This
condition is due to re-absorption of the signal at a shorter wavelength by the BiDF
followed by re-emission at longer wavelengths. This effect is proportional to the length
of BiDF used as higher re-absorption rate occurs in a longer active fiber length
(Seongwoo, et al. 2009).
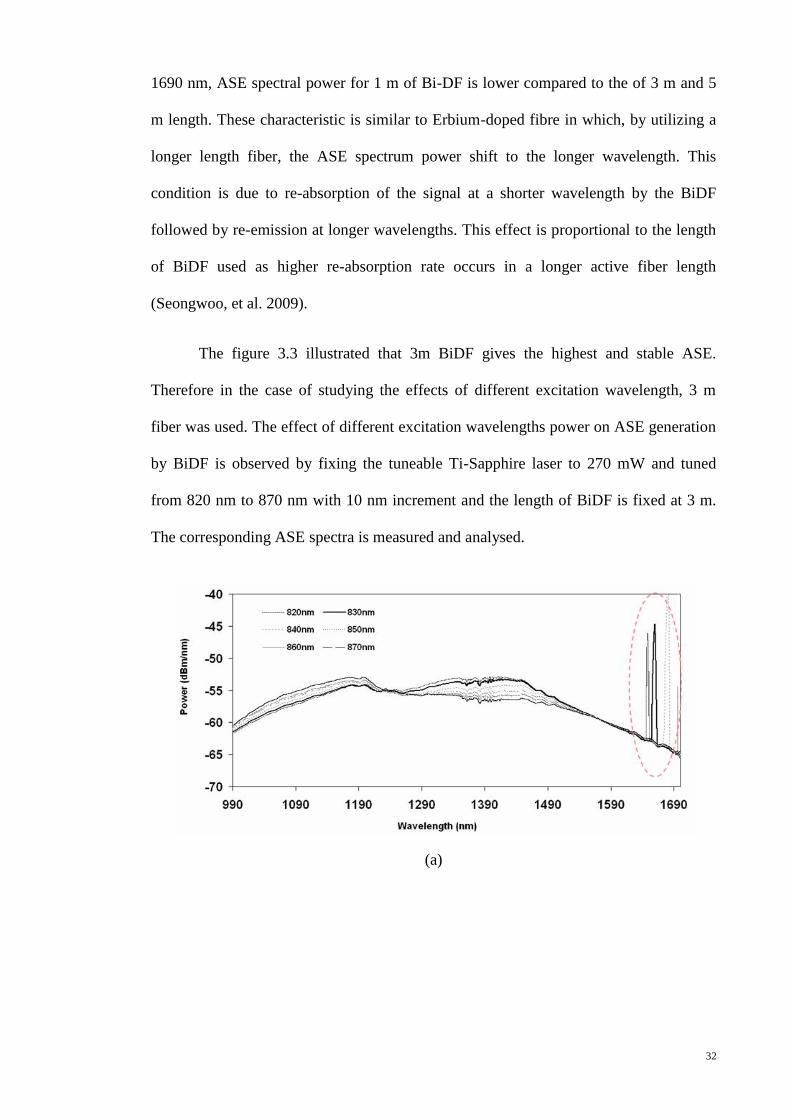
The figure 3.3 illustrated that 3m BiDF gives the highest and stable ASE.
Therefore in the case of studying the effects of different excitation wavelength, 3 m
fiber was used. The effect of different excitation wavelengths power on ASE generation
by BiDF is observed by fixing the tuneable Ti-Sapphire laser to 270 mW and tuned
from 820 nm to 870 nm with 10 nm increment and the length of BiDF is fixed at 3 m.
The corresponding ASE spectra is measured and analysed.
(a)

33
(b)
Figure 3.4 (a) ASE spectrum and (b) intensity of signal at wavelength 1200nm and
1450nm at different excitation wavelength
Figure 3.4(a) shows the ASE spectra of BiDF when excited with different
excitation wavelengths. The peaks at the end of the spectrum in figure 3.4(a) are the
harmonics of the excitation source. The spectra show visible changes of the ASE
spectrum when different excitation wavelengths are used. The ASE power level at
longer wavelength range (1245 nm – 1560 nm) decreases when longer excitation
wavelengths are used, while at shorter wavelength range (950 nm – 1245 nm), the ASE
power level increases with increasing excitation wavelengths. Spectral power at
1200nm (representing shorter wavelength range) and 1450 nm (representing longer
wavelength range) when excited with different excitation wavelengths are shown in
Figure 3.4(b). The figures show an increase in spectral power at 1200 nm when longer
excitation wavelength is used. At 1450 nm, the spectral power decreases towards longer
excitation wavelength. This condition is caused by the presence of different active
centre sites in the BiDF with slightly different transition energy levels. This observation
is believed to be similar to that reported by (Gumenyuk et al.2011), where signal at
shorter wavelength is higher when longer excitation wavelengths in the absorption band
were used. Spectral power level of the two wavelengths is observed to be the same
34
when the excitation wavelength is set at 840 nm, indicating a relatively uniform
spectrum profile when 840 nm optical source is used for excitation.
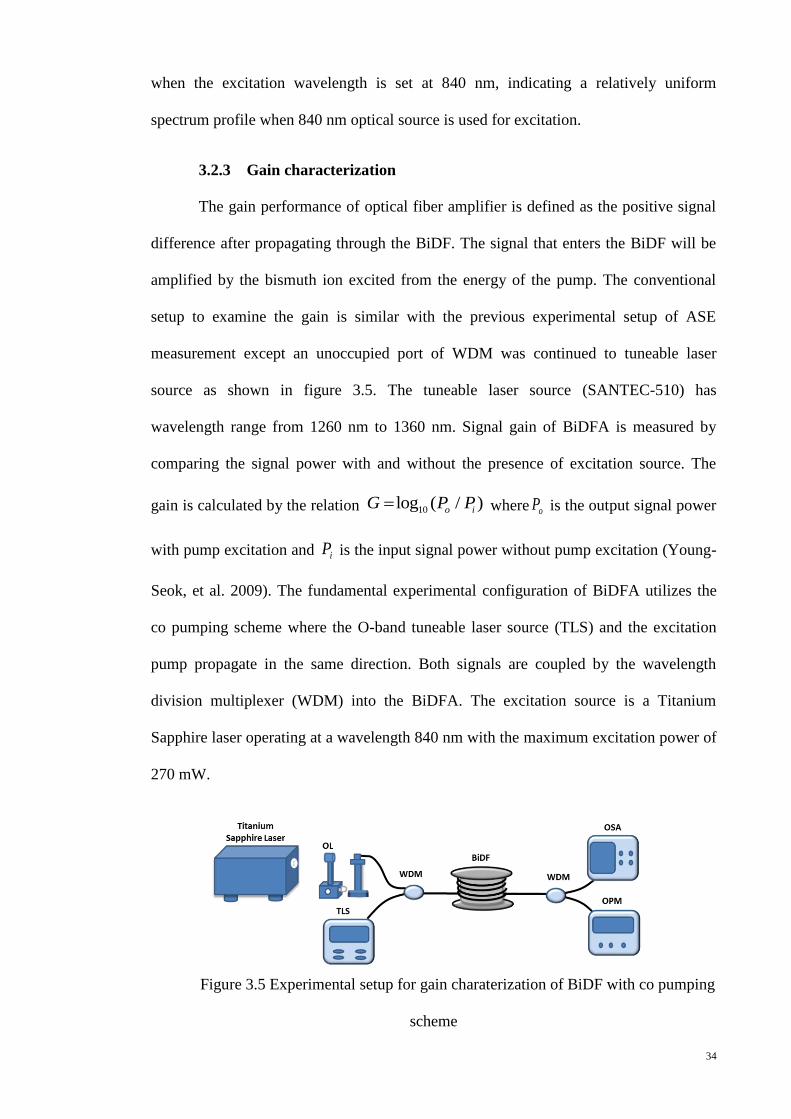
3.2.3 Gain characterization
The gain performance of optical fiber amplifier is defined as the positive signal
difference after propagating through the BiDF. The signal that enters the BiDF will be
amplified by the bismuth ion excited from the energy of the pump. The conventional
setup to examine the gain is similar with the previous experimental setup of ASE
measurement except an unoccupied port of WDM was continued to tuneable laser
source as shown in figure 3.5. The tuneable laser source (SANTEC-510) has
wavelength range from 1260 nm to 1360 nm. Signal gain of BiDFA is measured by
comparing the signal power with and without the presence of excitation source. The
gain is calculated by the relation 10log ( / )
o iG P P
where oP is the output signal power
with pump excitation and iP is the input signal power without pump excitation (Young-
Seok, et al. 2009). The fundamental experimental configuration of BiDFA utilizes the
co pumping scheme where the O-band tuneable laser source (TLS) and the excitation
pump propagate in the same direction. Both signals are coupled by the wavelength
division multiplexer (WDM) into the BiDFA. The excitation source is a Titanium
Sapphire laser operating at a wavelength 840 nm with the maximum excitation power of
270 mW.
Figure 3.5 Experimental setup for gain charaterization of BiDF with co pumping
scheme

35
The performance of BiDF for single-pass configuration with co pumping scheme
is shown in figure 3.6. The experiment was repeated for 3 different fiber lengths namely
1 m, 3 m, and 4 m. Input signal power and excitation power are set at -30 dBm and 270
mW, respectively for both configurations.
Figure 3.6 Gain performance of co pumping BiDFA
The co pumping scheme shows better performance for the 3 m length compared
to that 4 m due to insufficient pumping power to pump the overall 4 m length of BiDF
which resulted in the absorption of the generated signal. To overcome this issue and to
provide more power into the fiber, bidirectional pumping scheme is used.
Figure 3.7 Experimental setup for gain charaterization of BiDFwith bidirectional
pumping scheme

36
As illustrated in figure 3.7 the bidirectional pump can be achieved by placing a 3
dB coupler before the WDM1. The fiber is pumped from both ends. The signal is
amplified at the start of the fiber and has a loss in the middle of fiber due to insufficient
pump power but later the signal is amplified again at the end of the fiber.
Figure 3.8 Gain performance of bidirectional pumping of BiDFA
Figure 3.8 shows an increase of 50% in gain from the co-pumping configuration.
Unfortunately the gain generated from both pumping scheme, are still very low to act as
the O-band amplifier. Hence double-pass configuration is demonstrated as it has been
one of the methods commonly used in improving signal amplification for the S-band
(Roselem, et al. 2005), C-band (Nishi, et al. 1990), and L-band (Harun, et al. 2003,
Aozasa, et al. 2002) amplifiers. The solution is also cost effective and a compact
solution to amplifier performance gain as no additional active fibre length or excitation
source is required.
3.2.4 Gain improvement by double-pass configuration
Due to low amplification in single pass configuration, the double pass technique
was proposed. Double pass configuration is a basic technique to increase the gain of an
amplifier. It still resembles the fundamental fiber amplifier setup except with an
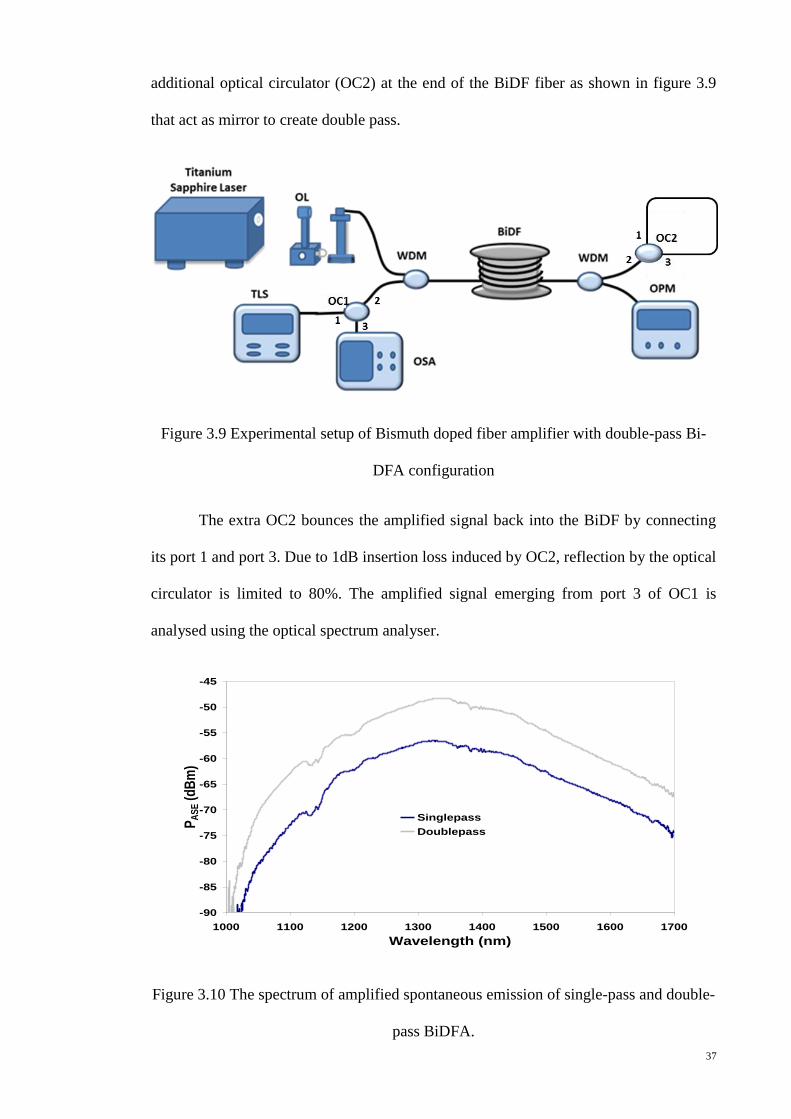
37
additional optical circulator (OC2) at the end of the BiDF fiber as shown in figure 3.9
that act as mirror to create double pass.
Figure 3.9 Experimental setup of Bismuth doped fiber amplifier with double-pass Bi-
DFA configuration
The extra OC2 bounces the amplified signal back into the BiDF by connecting
its port 1 and port 3. Due to 1dB insertion loss induced by OC2, reflection by the optical
circulator is limited to 80%. The amplified signal emerging from port 3 of OC1 is
analysed using the optical spectrum analyser.
Figure 3.10 The spectrum of amplified spontaneous emission of single-pass and double-
pass BiDFA.
-90
-85
-80
-75
-70
-65
-60
-55
-50
-45
1000 1100 1200 1300 1400 1500 1600 1700
Wavelength (nm)
PA
SE (
dB
m)
Singlepass
Doublepass

38
An improvement of ASE spectra of double-pass as compared to single-pass
BiDFA is as shown in figure 3.10 by having the excitation power fixed at the same
power as the single-pass configuration (270 mW). Both single- and double-pass
configurations exhibit similar ASE profile, with a peak level of -48 dBm at 1340 nm for
the double-pass BiDFA. The ASE level for the double-pass BiDFA increases by 8 dB at
1340 nm over that of the single-pass BiDFA. The ASE enhancement between 7 dB - 8
dB is observed throughout the measured wavelength range. The ASE 3 dB bandwidth
for double-pass BiDFA is 188 nm. The ASE bandwidth is limited by the 1310 nm
optical circulator which has a spectral transmission window that reduces towards the
shorter (1100 nm) and longer (1700 nm) wavelength range being measured. The 3dB
bandwidth of the ASE is expected to be wider if optical circulators with broader flat
transmission range are used.
Figure 3.11 Signal gain for single- and double-pass BiDFA with different signal
wavelengths.
Signal gain for single- and double-pass BiDFA at different signal wavelengths is
shown in Figure 3.11. By keeping the parameter the same as for single pass
configuration the maximum signal gain is obtained at 1340 nm with 1.0 dB for single-
pass and 2.0 dB for double-pass BiDFA. Double-pass BiDFA shows a 25% gain
0.0
0.5
1.0
1.5
2.0
2.5
1240 1260 1280 1300 1320 1340 1360 1380
Wavelength (nm)
Ga
in (
dB
)
Singlepass
Doublepass
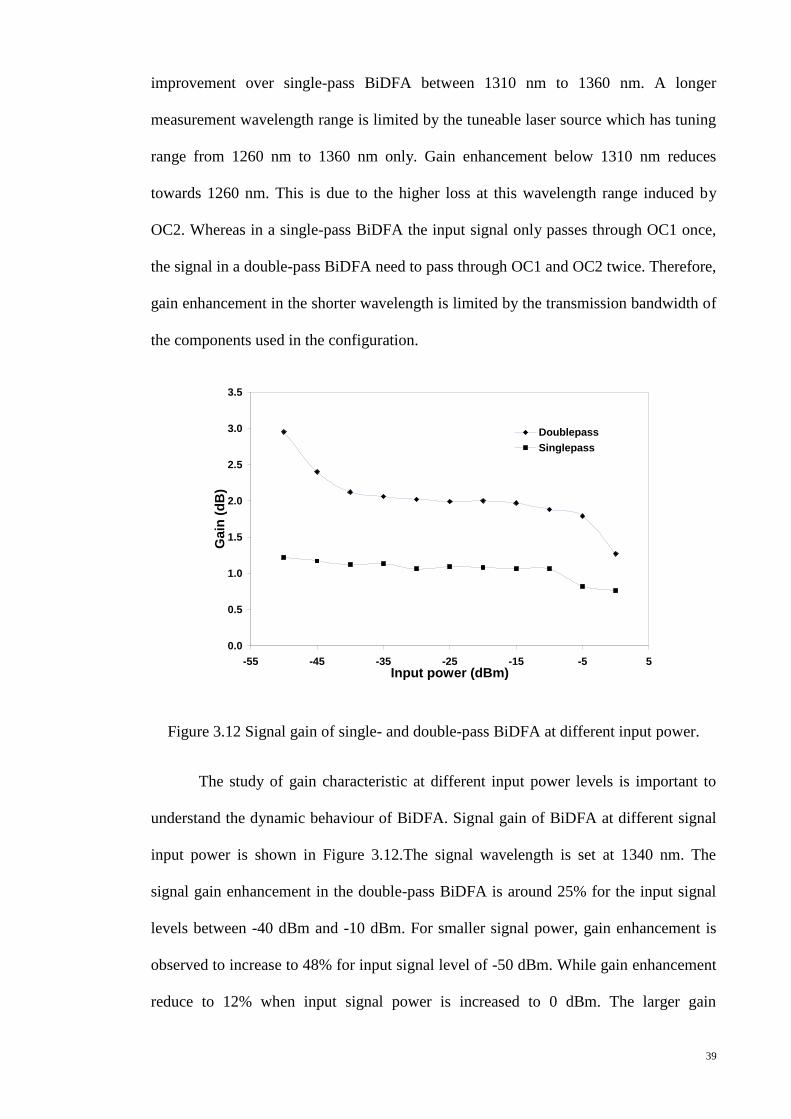
39
improvement over single-pass BiDFA between 1310 nm to 1360 nm. A longer
measurement wavelength range is limited by the tuneable laser source which has tuning
range from 1260 nm to 1360 nm only. Gain enhancement below 1310 nm reduces
towards 1260 nm. This is due to the higher loss at this wavelength range induced by
OC2. Whereas in a single-pass BiDFA the input signal only passes through OC1 once,
the signal in a double-pass BiDFA need to pass through OC1 and OC2 twice. Therefore,
gain enhancement in the shorter wavelength is limited by the transmission bandwidth of
the components used in the configuration.
Figure 3.12 Signal gain of single- and double-pass BiDFA at different input power.
The study of gain characteristic at different input power levels is important to
understand the dynamic behaviour of BiDFA. Signal gain of BiDFA at different signal
input power is shown in Figure 3.12.The signal wavelength is set at 1340 nm. The
signal gain enhancement in the double-pass BiDFA is around 25% for the input signal
levels between -40 dBm and -10 dBm. For smaller signal power, gain enhancement is
observed to increase to 48% for input signal level of -50 dBm. While gain enhancement
reduce to 12% when input signal power is increased to 0 dBm. The larger gain
0.0
0.5
1.0
1.5
2.0
2.5
3.0
3.5
-55 -45 -35 -25 -15 -5 5Input power (dBm)
Ga
in (
dB
)
Doublepass
Singlepass

40
enhancement for small signal is due to low extraction of energy from the gain medium
in the single-pass BiDFA and hence higher population inversion is available for signal
amplification for double-pass BiDFA. On the other hand, gain enhancement reduces
towards the large input signal region as BiDFA reached gain saturation with high input
signal power.
Figure 3.13 Signal gain as a relation of pump power.
Figure 3.13 shows the signal gain variation with pump power. The input signal
wavelength is set at 1340nm with input power of -30dBm. Gain enhancement increases
with increasing pump power from 0.4 dB to 1.1 dB with pump power of 270 mW and
360 mW, respectively. Gain efficiency for single-pass and double-pass BiDFA are 5.9
dBW-1
and 10.0 dBW-1
, respectively. Gain enhancement is believed to be higher if a
longer length of bismuth-doped fiber is used as reported by other research groups
(Mridu, et al. 2009). Another area that requires research attention to realize ultra-
broadband fiber amplifier is the improvement of transmission bandwidth for optical
components used to construct BiDFA. Nevertheless, results obtained in this work are
0.0
0.5
1.0
1.5
2.0
2.5
0 50 100 150 200 250 300 350 400
Pump power (mW)
Ga
in (
dB
)
Doublepass
Singlepass
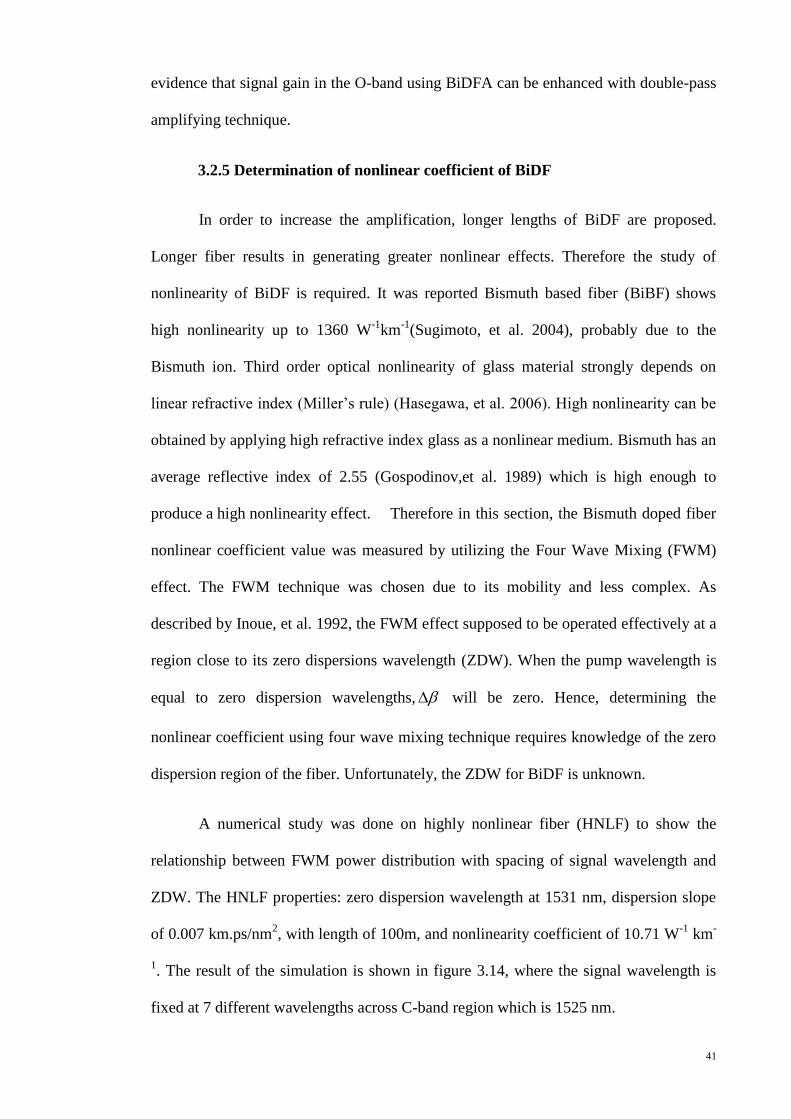
41
evidence that signal gain in the O-band using BiDFA can be enhanced with double-pass
amplifying technique.
3.2.5 Determination of nonlinear coefficient of BiDF
In order to increase the amplification, longer lengths of BiDF are proposed.
Longer fiber results in generating greater nonlinear effects. Therefore the study of
nonlinearity of BiDF is required. It was reported Bismuth based fiber (BiBF) shows
high nonlinearity up to 1360 W-1
km-1
(Sugimoto, et al. 2004), probably due to the
Bismuth ion. Third order optical nonlinearity of glass material strongly depends on
linear refractive index (Miller’s rule) (Hasegawa, et al. 2006). High nonlinearity can be
obtained by applying high refractive index glass as a nonlinear medium. Bismuth has an
average reflective index of 2.55 (Gospodinov,et al. 1989) which is high enough to
produce a high nonlinearity effect. Therefore in this section, the Bismuth doped fiber
nonlinear coefficient value was measured by utilizing the Four Wave Mixing (FWM)
effect. The FWM technique was chosen due to its mobility and less complex. As
described by Inoue, et al. 1992, the FWM effect supposed to be operated effectively at a
region close to its zero dispersions wavelength (ZDW). When the pump wavelength is
equal to zero dispersion wavelengths, will be zero. Hence, determining the
nonlinear coefficient using four wave mixing technique requires knowledge of the zero
dispersion region of the fiber. Unfortunately, the ZDW for BiDF is unknown.
A numerical study was done on highly nonlinear fiber (HNLF) to show the
relationship between FWM power distribution with spacing of signal wavelength and
ZDW. The HNLF properties: zero dispersion wavelength at 1531 nm, dispersion slope
of 0.007 km.ps/nm2, with length of 100m, and nonlinearity coefficient of 10.71 W
-1 km
-
1. The result of the simulation is shown in figure 3.14, where the signal wavelength is
fixed at 7 different wavelengths across C-band region which is 1525 nm.
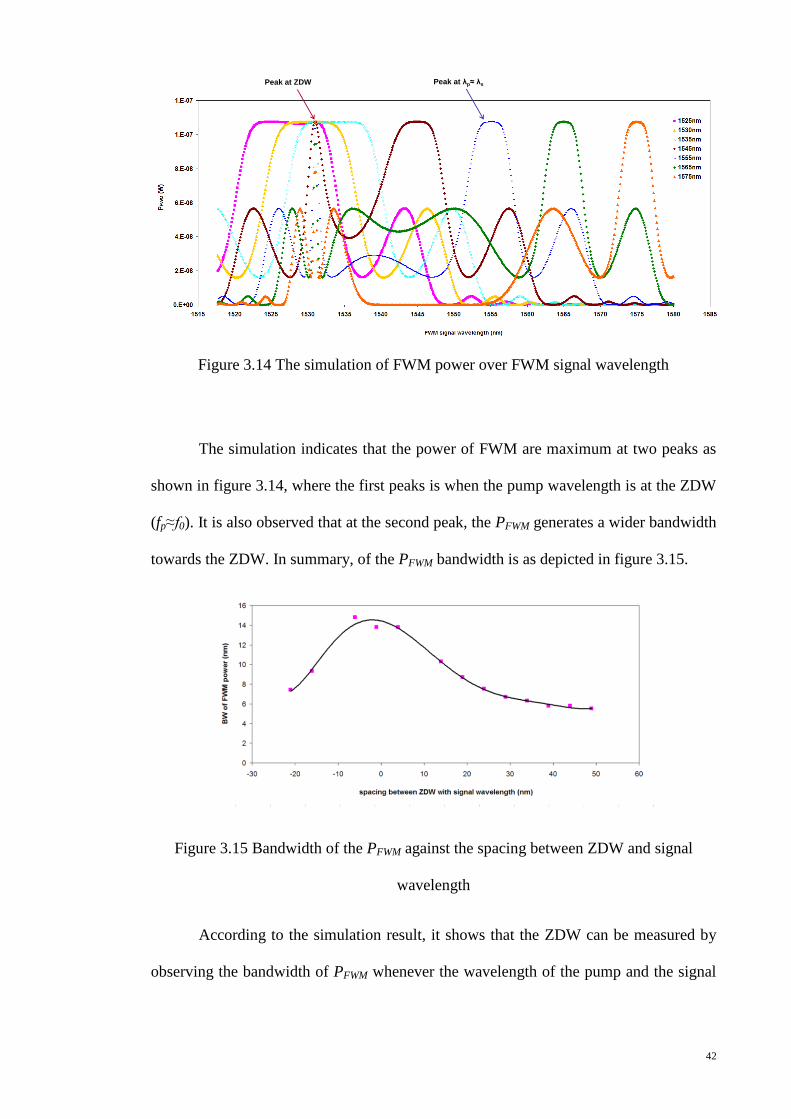
42
Figure 3.14 The simulation of FWM power over FWM signal wavelength
The simulation indicates that the power of FWM are maximum at two peaks as
shown in figure 3.14, where the first peaks is when the pump wavelength is at the ZDW
(fp≈f0). It is also observed that at the second peak, the PFWM generates a wider bandwidth
towards the ZDW. In summary, of the PFWM bandwidth is as depicted in figure 3.15.
Figure 3.15 Bandwidth of the PFWM against the spacing between ZDW and signal
wavelength
According to the simulation result, it shows that the ZDW can be measured by
observing the bandwidth of PFWM whenever the wavelength of the pump and the signal
Peak at ZDW Peak at λp≈ λsPeak at ZDW Peak at λp≈ λs

43
are closely spaced. The experiment was done to measure the ZDW of BiDF. The FWM
nonlinearity measurement setup is illustrated in figure 3.16
Figure 3.16 Four wave mixing ZDW nonlinearity measurement setup.
The measurement was conducted in 2 wavelengths regions, O and C band. Two
external laser source (LS) is use as the pump and signal. The signal source is fixed at
one wavelength with power of 11 dBm (LS1) or mark as signal while the pump source
is a tuneable laser source with power of 12 dBm (LS2) marked as pump as refer to
figure 3.17. The signals are coupled into the Bismuth doped fiber (BiDF) by using a 3
dB coupler. The power of both LS1 and LS2 was observed by the optical power meter
(OPM) thru tapping 1% of its power by the 99:1 dB coupler. The FWM power can be
observed from the FWM spectrum by OSA at the end of BiDF. By measuring the
bandwidth of FWM signal for each different signal wavelength, the zero dispersion
wavelength (ZDW) can be obtained.

44
Figure 3.17 Spectrum of four wave mixing by the BiDF
In the case of BiDF, due to the limitation of the second tuneable laser source at
the O-band region, the bandwidth can only be fully observed at the C-band region. As
for the O-band region the signal source is extracted from the fiber laser which is
adjusted to have similar properties as the other tuneable laser source. The fixed laser
sources for the O-band region were at 1300 nm, 1308 nm, 1310 nm and 1340 nm using
the FBG technique
An example of FWM power distribution against the spacing of signals and pump
wavelength is as shown in figure 3.18, where the signal wavelength is fixed at 1550 nm
and the pump signals are varied with an increment of 0.1 nm. The bandwidth of the
distribution was measured by taking the width at half of the maximum intensity which
is 0.39 nm wide.
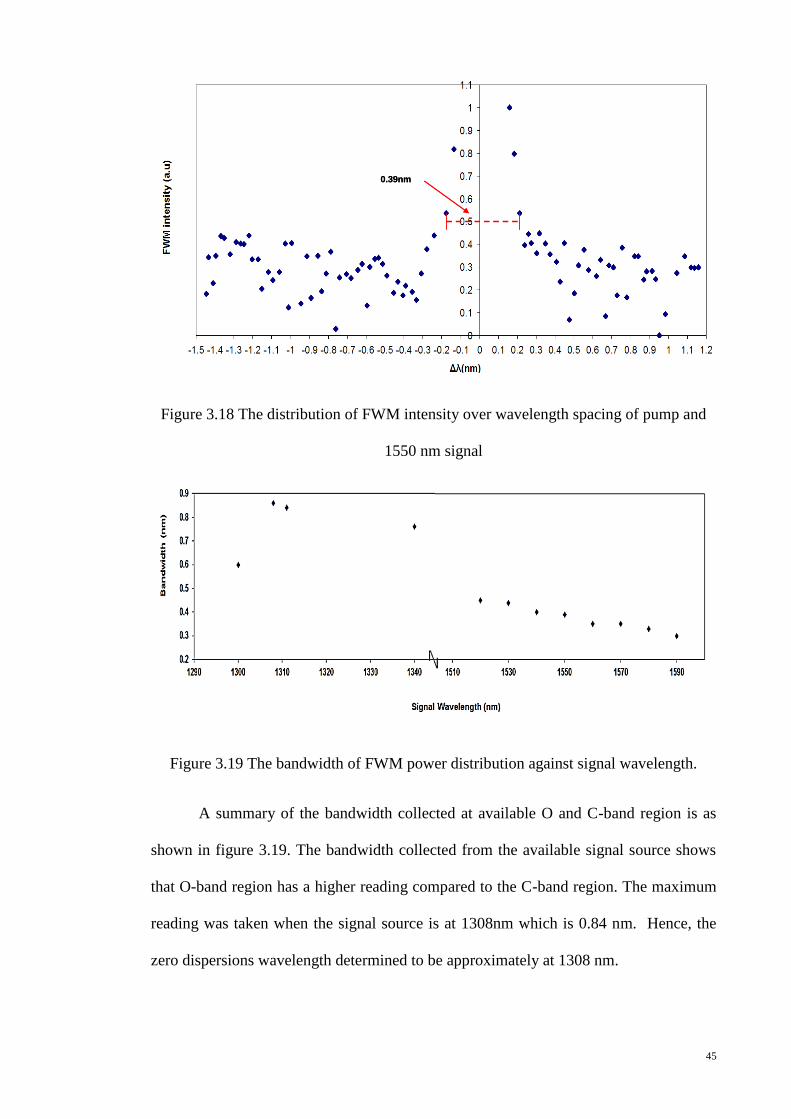
45
Figure 3.18 The distribution of FWM intensity over wavelength spacing of pump and
1550 nm signal
Figure 3.19 The bandwidth of FWM power distribution against signal wavelength.
A summary of the bandwidth collected at available O and C-band region is as
shown in figure 3.19. The bandwidth collected from the available signal source shows
that O-band region has a higher reading compared to the C-band region. The maximum
reading was taken when the signal source is at 1308nm which is 0.84 nm. Hence, the
zero dispersions wavelength determined to be approximately at 1308 nm.
0.39nm0.39nm0.39nm
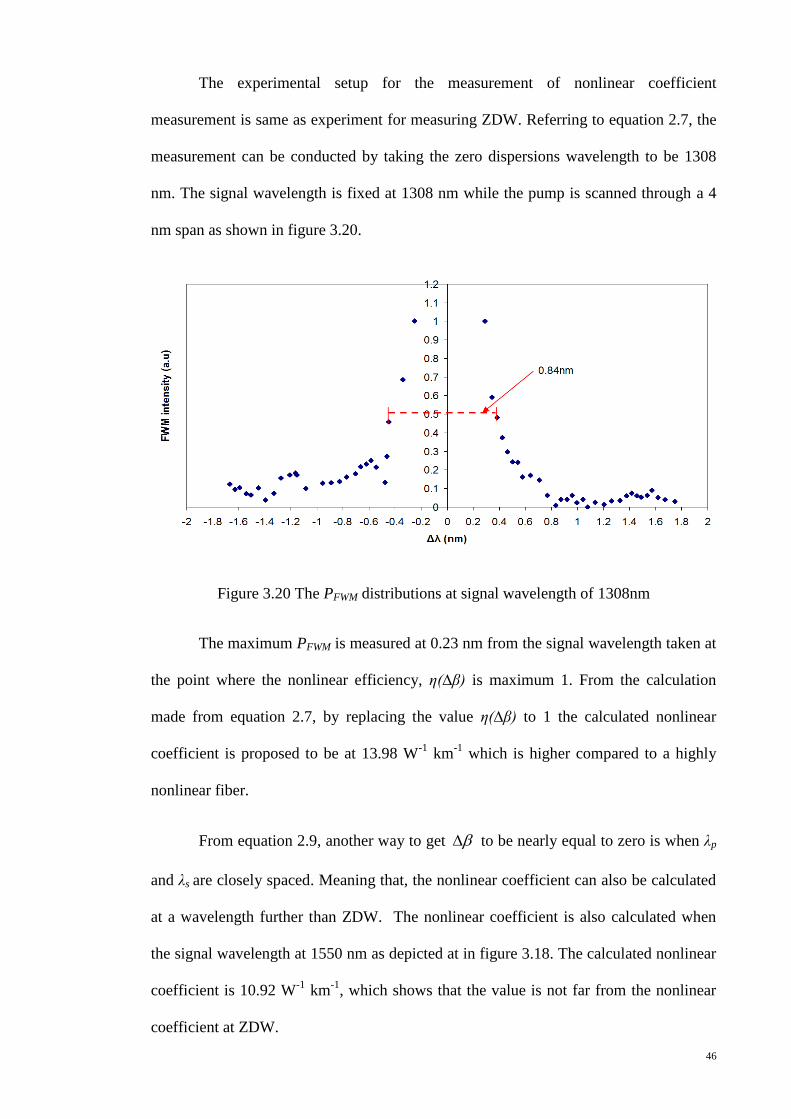
46
The experimental setup for the measurement of nonlinear coefficient
measurement is same as experiment for measuring ZDW. Referring to equation 2.7, the
measurement can be conducted by taking the zero dispersions wavelength to be 1308
nm. The signal wavelength is fixed at 1308 nm while the pump is scanned through a 4
nm span as shown in figure 3.20.
Figure 3.20 The PFWM distributions at signal wavelength of 1308nm
The maximum PFWM is measured at 0.23 nm from the signal wavelength taken at
the point where the nonlinear efficiency, η(∆β) is maximum 1. From the calculation
made from equation 2.7, by replacing the value η(∆β) to 1 the calculated nonlinear
coefficient is proposed to be at 13.98 W-1
km-1
which is higher compared to a highly
nonlinear fiber.
From equation 2.9, another way to get to be nearly equal to zero is when λp
and λs are closely spaced. Meaning that, the nonlinear coefficient can also be calculated
at a wavelength further than ZDW. The nonlinear coefficient is also calculated when
the signal wavelength at 1550 nm as depicted at in figure 3.18. The calculated nonlinear
coefficient is 10.92 W-1
km-1
, which shows that the value is not far from the nonlinear
coefficient at ZDW.

47
According to equation 2.10, the value of chromatic dispersion slope d
dDc is
proportional to the which affects the power of FWM. The simulation of FWM
power at various value of d
dDc is shown in figure 3.21. The perfect match for chromatic
dispersion slope value is at 0.079 ps.nm/km. The chromatic dispersion value is vital
because high chromatic dispersion will reduces the FWM effects as the signals losses
coherence
Figure 3.21 Fluctuation of PFWM at different dispersion slope
The responsible nonlinear refractive index n2 that causes the nonlinear refractive
related to nonlinear coefficient is given by;
𝛾 =𝑛2𝜔
𝑐𝐴𝑒𝑓𝑓 (3.1)
where c is speed of light, ω is the frequency of propagation optical field and Aeff is the
effective cross section of fiber used and is given by;
𝐴𝑒𝑓𝑓 =
𝜋(𝑀𝐹𝐷)2
4
(3.2)

48
The MFD, which represent mode field diameter is given by;
𝑀𝐹𝐷 = 2𝜔𝑜 =
2𝛼
√𝑙𝑚 𝑉
(3.3)
with V is the number taken to be 𝑉 =2𝜋𝛼(𝑁𝐴)
𝜆, NA is a numerical aperture
𝑁𝐴 = √𝑛22 − 𝑛1
2 or from the measured value of 0.25. Meanwhile ɑ represent the radius of
the fiber core which is given as 5 μm. Hence give the MFD at wavelength 1310 nm is
7.9 μm and the Aeff is 50.09 μm2. By taking γ to be 13.98 W
-1km
-1, and ω is to be at
0.229 THz, so the n2 is calculated to be 0.917x10⁻²⁰
m2/W.
3.3 The performance of O-band Raman Fiber amplifier
Another optical amplifier tested in this chapter is Raman fiber amplifier (RFA).
As discussed in chapter 2, the RFA is an amplifier generated from the nonlinear effect
of the optical fiber, where a portion of the energy is transferred from the pump signal to
the new generated signal. Like any other nonlinear effect, a high intensity of the light is
needed to trigger the nonlinear effect. For RFA, the pump wavelength depends on the
target signal region. Raman scattering effect is the result of the incident of light collides
with the optical phonon (vibration of molecule), resulting in the transfer of energy that
causes the incident light to lose some of its power. Hence, new shorter wavelength is
generated call as Stokes. The new wavelength generated will have an absorption
coefficient of be negative value, thus providing gain to the incoming signal. The
frequency difference between the incident or pump wavelength with the new generated
signal is around 100 nm@13 THz depending on the material of the nonlinear medium.
3.3.1 Determining the Raman Threshold
The power needed for a pump to generate Raman effects is called Raman
threshold. It is defined as the power of the pump at which the Stokes power equals

49
pump power at the output ends 𝑃𝑠 (𝐿) = 𝑃𝑂exp (−𝛼𝑝𝐿). The Raman threshold can be
approximated as
𝑃𝑡ℎ =
16 𝐴𝑒𝑓𝑓
𝑔𝑅𝐿𝑒𝑓𝑓
(3.4)
where 𝑔𝑅 represents Raman gain coefficient, which depends on the dopant of the fiber.
The 𝑔𝑅 can also be measured by analysing the backscattering ASE of RFA (Zhao, et al.
2010). The technique requires measuring the ASE of the RFA before and after the
stimulated emission occurs.
Figure 3.22 Experimental setup of backscattering RFA
The simple setup of backscattering ASE measurement is shown in figure 3.22.
The Raman gain spectrum can be obtained by measuring the ratio between the
backscattering ASE at low pump power and high pump power. This was tested with
different fiber under test (FUT). The ratio between both spectrums is defined as 𝐺𝑅 and
is given by;
𝐺𝑅 = 𝑒𝑥𝑝
𝑔𝑅𝑃𝑝𝐿𝑒𝑓𝑓
𝐴𝑒𝑓𝑓
(3.5)
Where 𝑃𝑝 represent the pump power. By obtaining the Raman gain spectrum the
Raman gain coefficient can be obtained mathematically.
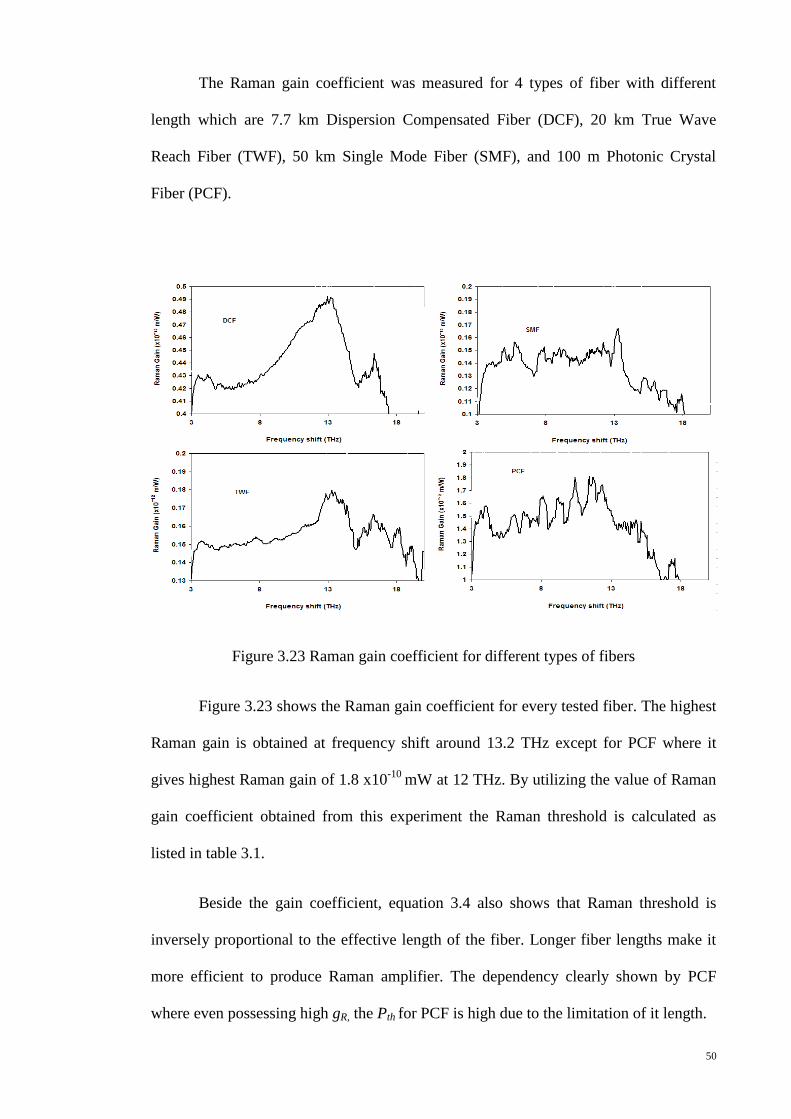
50
The Raman gain coefficient was measured for 4 types of fiber with different
length which are 7.7 km Dispersion Compensated Fiber (DCF), 20 km True Wave
Reach Fiber (TWF), 50 km Single Mode Fiber (SMF), and 100 m Photonic Crystal
Fiber (PCF).
Figure 3.23 Raman gain coefficient for different types of fibers
Figure 3.23 shows the Raman gain coefficient for every tested fiber. The highest
Raman gain is obtained at frequency shift around 13.2 THz except for PCF where it
gives highest Raman gain of 1.8 x10⁻¹⁰
mW at 12 THz. By utilizing the value of Raman
gain coefficient obtained from this experiment the Raman threshold is calculated as
listed in table 3.1.
Beside the gain coefficient, equation 3.4 also shows that Raman threshold is
inversely proportional to the effective length of the fiber. Longer fiber lengths make it
more efficient to produce Raman amplifier. The dependency clearly shown by PCF
where even possessing high gR, the Pth for PCF is high due to the limitation of it length.

51
The DCF requires the lowest power to initiate the Raman scattering effect.
Table 3.1 The parameters for Raman fiber amplifier
Optical Fiber Type Aeff (μm2) Leff (km)
𝒈𝑹
(𝒙𝟏𝟎−𝟏𝟐𝒎/𝑾)
Pth (dBm)
Single Mode Fiber (SMF) 69.40 12.56 0.17 15.05
Dispersion Compensated Fiber (DCF) 16.62 5.76 0.49 7.69
Photonic Crystal Fiber (PCF) 63.17 0.03 1.8 42.58
True Wave Reach Fiber (TWF) 55.42 10.00 0.18 14.87
3.3.2 Gain Characterization of Raman Fiber Amplifier
Raman amplifier is a reliable choice for optical amplifier due to its advantages
of its ability to generate amplification in any fiber. As a result, it can minimize the
upgrading cost, and it can provide a flat gain spectrum which depends on the pump
distribution and the RFA can also have gain in entire transmission region. This section
describes a demonstration of O-band Raman fiber amplifier for different types of fibers.
Figure 3.24 Experimental setup of Raman fiber amplifier

52
To generate the amplification at the O-band region, a 1240 nm Raman pump
with 280 mW was used. By utilizing the fundamental experiment setup of FOA with
addition of RP, the RFA can be characterized as shown in figure 3.24. The gain
characteristic was done by analysing the on/off gain, which is the gain is ratio between
the signals of pumped fiber over the signal of the un-pumped fiber.
Figure 3.25 Performance of RFA against signal wavelength
The performance of the on/off gain against the signal wavelength is shown in
figure 3.25. From the figure, the DCF shows the highest gain even though PCF gives
the highest gR. Unfortunately due to the limitation of the PCF length, high gain cannot
be obtained. Besides that, the Pth of DCF of length 7.7 km is the lowest among all the
tested fiber.
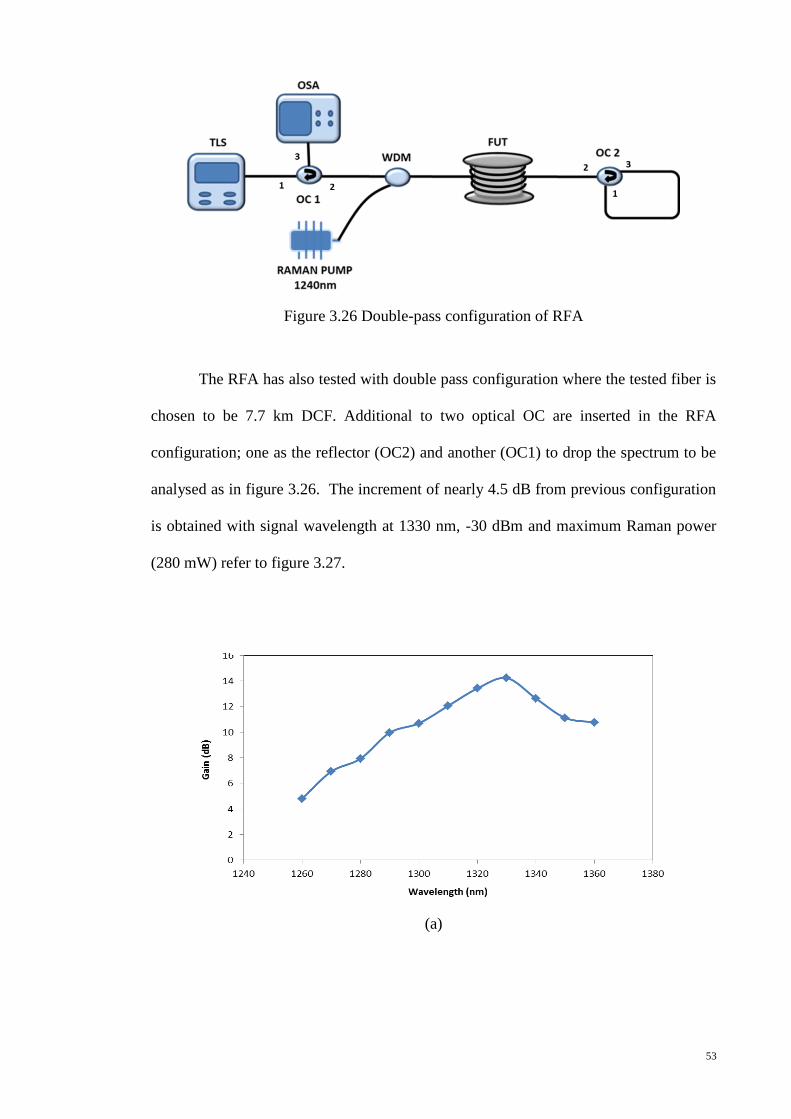
53
Figure 3.26 Double-pass configuration of RFA
The RFA has also tested with double pass configuration where the tested fiber is
chosen to be 7.7 km DCF. Additional to two optical OC are inserted in the RFA
configuration; one as the reflector (OC2) and another (OC1) to drop the spectrum to be
analysed as in figure 3.26. The increment of nearly 4.5 dB from previous configuration
is obtained with signal wavelength at 1330 nm, -30 dBm and maximum Raman power
(280 mW) refer to figure 3.27.
(a)

54
(b)
Figure 3.27 Gain performance of double-pass RFA over (a) signal wavelength (b) signal
power
3.4 The performance of O-band Booster Optical Amplifier (BOA)
As mentioned previously, optical amplifiers can be divided into two categories,
namely generated from fiber optics and those generated from the integrated circuit. Both
types of amplifiers fall under the category of fiber optic amplifier (FOA). The
semiconductor optical amplifier (SOA) is generated from integrated circuit where the
amplification process of SOA is similar with that of conventional FOA; however instead
of using light as the pump source, an external current is used in the process of
generating population inversion state. The current injection excites the electrons from
the conduction band into the valence band. Simultaneously that leaves the holes in
conduction band, which is similar to the inversion population of the FOA process. The
band gap energy defines the wavelength region of amplification, therefore the signal
frequency need to coincide with the energy of the band gap. The signal enters the
medium of SOA to generate amplification through the process of stimulated emission.
The performances of the SOA characteristic depends on two factors namely, the
design of the SOA and the material used as the gain medium. The SOA design
determines on the reflectivity of the whole SOA chip to avoid gain ripple. Meanwhile
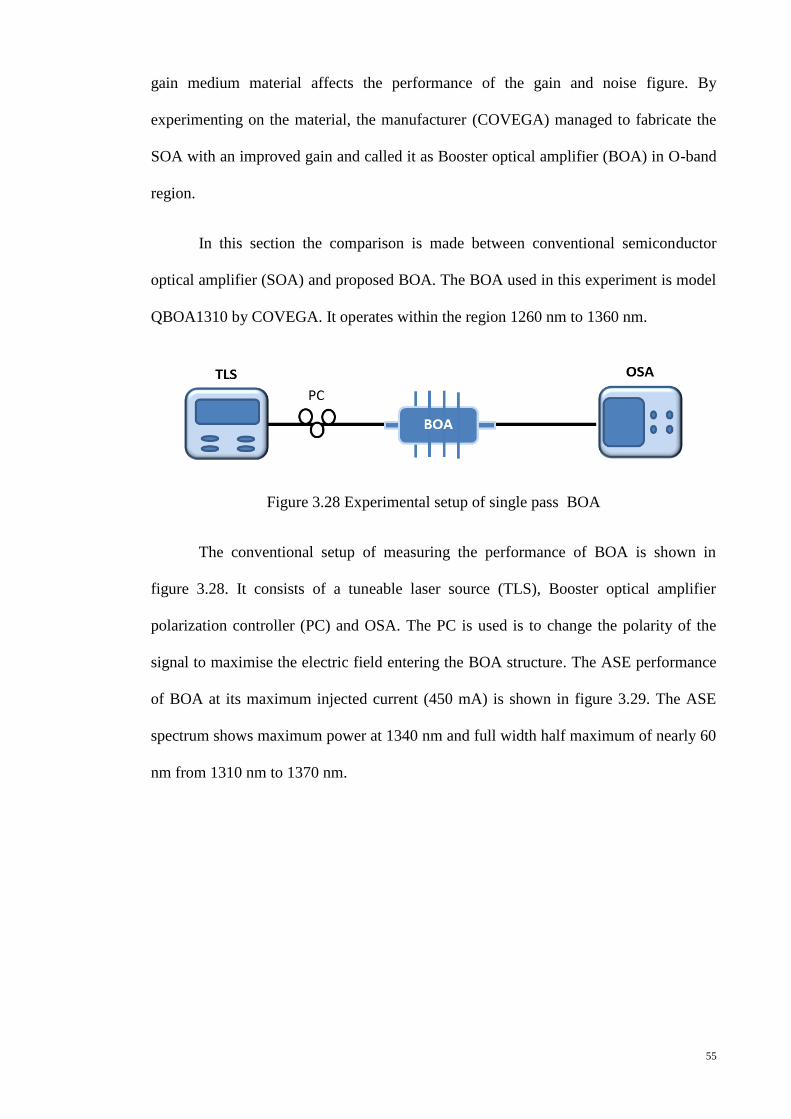
55
gain medium material affects the performance of the gain and noise figure. By
experimenting on the material, the manufacturer (COVEGA) managed to fabricate the
SOA with an improved gain and called it as Booster optical amplifier (BOA) in O-band
region.
In this section the comparison is made between conventional semiconductor
optical amplifier (SOA) and proposed BOA. The BOA used in this experiment is model
QBOA1310 by COVEGA. It operates within the region 1260 nm to 1360 nm.
Figure 3.28 Experimental setup of single pass BOA
The conventional setup of measuring the performance of BOA is shown in
figure 3.28. It consists of a tuneable laser source (TLS), Booster optical amplifier
polarization controller (PC) and OSA. The PC is used is to change the polarity of the
signal to maximise the electric field entering the BOA structure. The ASE performance
of BOA at its maximum injected current (450 mA) is shown in figure 3.29. The ASE
spectrum shows maximum power at 1340 nm and full width half maximum of nearly 60
nm from 1310 nm to 1370 nm.
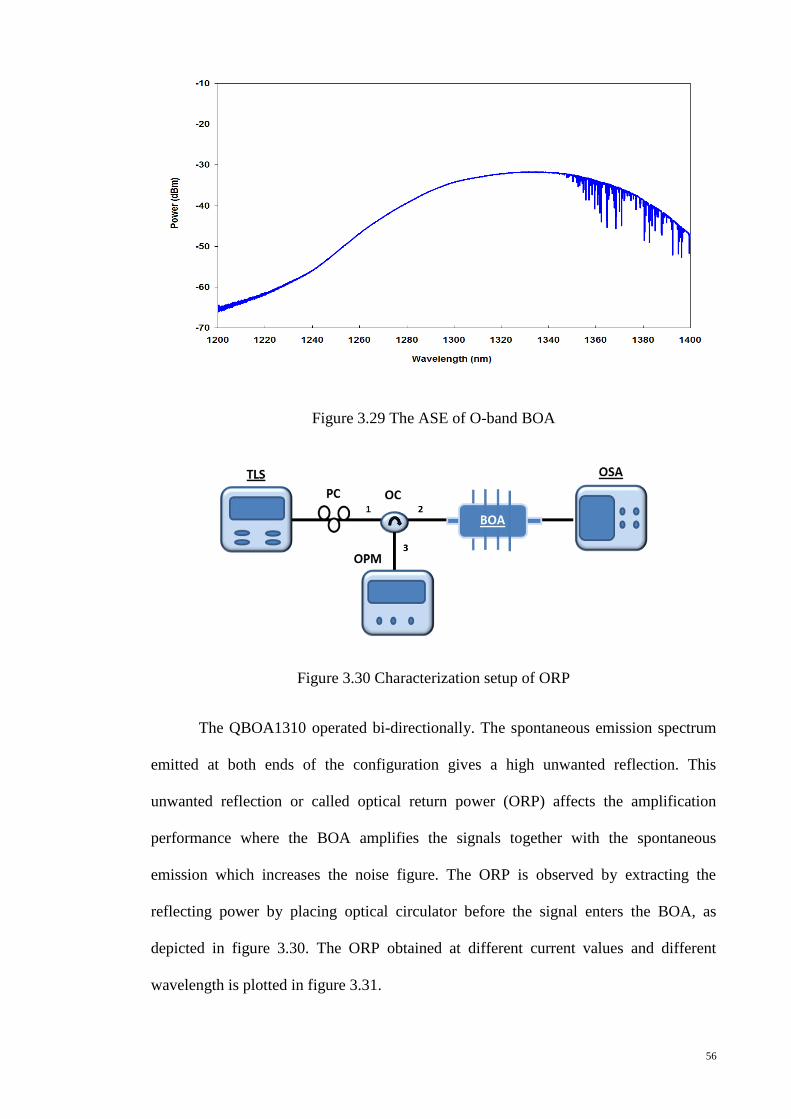
56
Figure 3.29 The ASE of O-band BOA
Figure 3.30 Characterization setup of ORP
The QBOA1310 operated bi-directionally. The spontaneous emission spectrum
emitted at both ends of the configuration gives a high unwanted reflection. This
unwanted reflection or called optical return power (ORP) affects the amplification
performance where the BOA amplifies the signals together with the spontaneous
emission which increases the noise figure. The ORP is observed by extracting the
reflecting power by placing optical circulator before the signal enters the BOA, as
depicted in figure 3.30. The ORP obtained at different current values and different
wavelength is plotted in figure 3.31.

57
Figure 3.31 Optical return power for BOA (a) at varies wavelength (b) at varies
operating current
In order to prevent the ORP, additional components were included in the setup. An
isolator or an angle cleave connector is used. The isolator creates a unidirectional path
and here the isolator is placed at both ends of the BOA. Meanwhile angle connectors
prevent the Fresnel reflection at the air gap of the connector. The reflection of the ASE
increases the NF of BOA, therefore all flat connector replaced by angle connector. The
effects of the isolator and the angle connector on the gain and noise figure for various
wavelengths are as shown in figure 3.32.
(a)
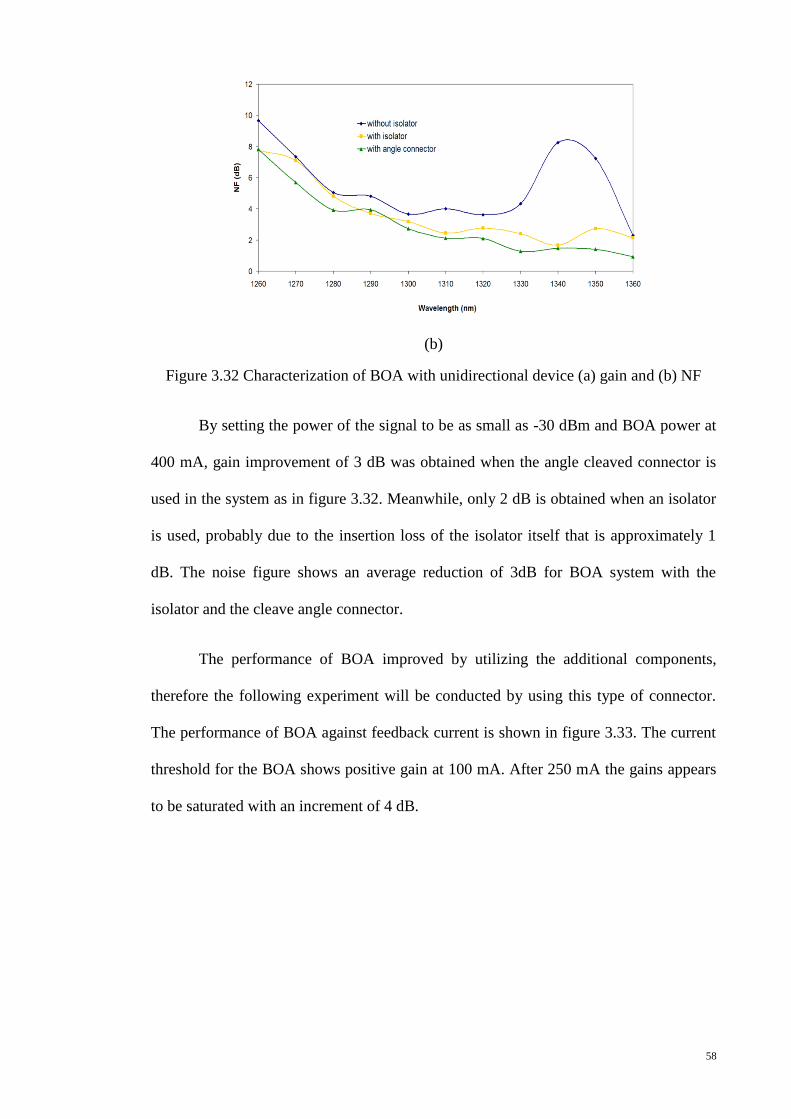
58
(b)
Figure 3.32 Characterization of BOA with unidirectional device (a) gain and (b) NF
By setting the power of the signal to be as small as -30 dBm and BOA power at
400 mA, gain improvement of 3 dB was obtained when the angle cleaved connector is
used in the system as in figure 3.32. Meanwhile, only 2 dB is obtained when an isolator
is used, probably due to the insertion loss of the isolator itself that is approximately 1
dB. The noise figure shows an average reduction of 3dB for BOA system with the
isolator and the cleave angle connector.
The performance of BOA improved by utilizing the additional components,
therefore the following experiment will be conducted by using this type of connector.
The performance of BOA against feedback current is shown in figure 3.33. The current
threshold for the BOA shows positive gain at 100 mA. After 250 mA the gains appears
to be saturated with an increment of 4 dB.
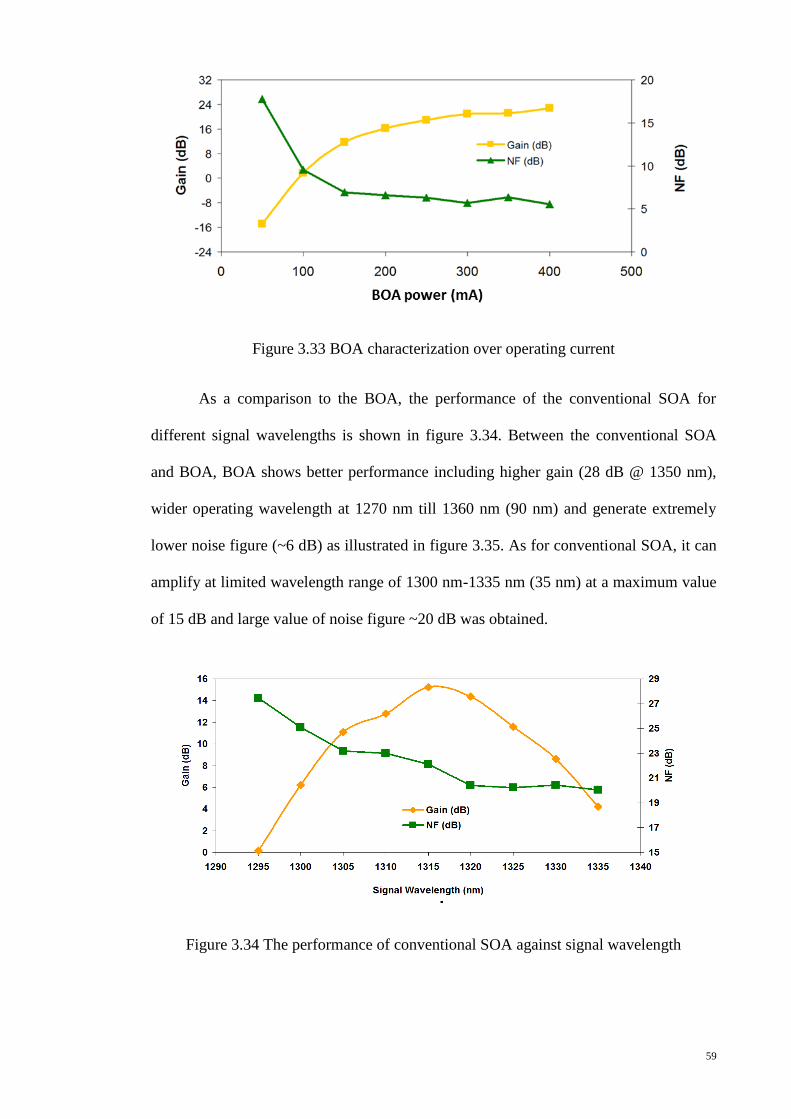
59
Figure 3.33 BOA characterization over operating current
As a comparison to the BOA, the performance of the conventional SOA for
different signal wavelengths is shown in figure 3.34. Between the conventional SOA
and BOA, BOA shows better performance including higher gain (28 dB @ 1350 nm),
wider operating wavelength at 1270 nm till 1360 nm (90 nm) and generate extremely
lower noise figure (~6 dB) as illustrated in figure 3.35. As for conventional SOA, it can
amplify at limited wavelength range of 1300 nm-1335 nm (35 nm) at a maximum value
of 15 dB and large value of noise figure ~20 dB was obtained.
Figure 3.34 The performance of conventional SOA against signal wavelength

60
Figure 3.35 The performance of BOA against signal wavelength
The gain performance against signal input power is important to predict the
maximum input power before it reaches its saturated point. Referring to the figure 3.36,
saturated point of BOA occurs when the input power is at -10 dBm @ 1340 nm, at
which spectrum gain decrease gradually. If the input power is higher than -10 dBm it
will experience a small amplification from the BOA due to the lack of active ion
(electrons) to reacts with all the photon that enters the medium.
Figure 3.36 Characterization of BOA over the signal input power
As discussed in chapter 2, SOA experience a polarization dependent of gain
(PDG). The PDG is defined as the difference between minimum and maximum gain
obtained when the polarization of the system. Due to the same structure, BOA inherit

61
the same properties. Since optical fiber random polarizer and the BOA provide different
gain for each TM and TE modes, the differences obtained is large. In this case, the
maximum and minimum gain obtain can be observe at figure 3.37.
Figure 3.37 The gain performance at ar various polarization state
The maximum gain obtained is the same as the previous result shown in figure
3.35 . Certain polarization not only reduce the gain but also cause negative gain where
the signal experience losses instead of amplification due to components attenuation.
This greatly affect the generation of multiwavelength fiber laser. The polarization of the
system need to be observed to generate better multiwavelength fiber laser performance.
Figure 3.38 Configuration of doublepass BOA
Some of the techniques of producing multiwavelength fiber laser system require
the generated signal to be reamplified in the same amplifier. Therefore, the performance
of doublepass configuration is vital. The doublepass configuration for BOA assemble
-15
-10
-5
0
5
10
15
20
1240 1260 1280 1300 1320 1340 1360 1380
Wavelength (nm)
Gain
(d
B)
min gain
Max gain

62
mirror at end of the configuration as illustrated in figure 3.38. For BOA, the result of
doublepass configuration is shown in figure 3.39. The mirror is placed at one end of the
BOA and the gain is measured by tapping the power using the ocillator placed between
the BOA and the TLS.
Figure 3.39 Gain spectrum over wavelength for single and doublepass
The result of figure 3.39 shows a comparison being made between a single and
doublepass performance. The doublepass BOA configuration produces a maximum of
31 dB gain, however the gain flattening quality is reduced to 40 nm. Moreover the NF
of the doublepass BOA configuration is around 3dB higher than singlepass
configuration. This means that, in the case of multiwavelength fiber laser with multiple
pass amplification for BOA, the gain might be higher at certain wavelength, where an
uneven amplification of the channels is shown.
The next chapter will demonstarate the generation of multiwavelength fiber laser
utilizing the optical amplifiers. The Booster optical amplifier is utilized as the main
amplifier, together with the Raman fiber optical amplifier. The bismuth doped fiber will
be used as the nonlinear medium to increase the stability of the multiwavelength fiber
laser.

63
Chapter 4 Generation of O-band Multiwavelength
Fiber Laser
4.1 Introduction
There has been much interest in multiwavelength fiber laser (MWFL) with
promising applications in the area of fiber optics sensor system (Talaverano, et al. 2001
and Sun, et al. 2010), precision spectroscopy (Denizman, et al. 1993 and Yumoto, et al.
2010), optical testing of components, and as a source for wavelength division
multiplexing system (Hurh, et al. 2005 and Tkach, et al. 1989)
There are numerous demonstrations on the multiwavelength fiber laser but
mainly in C-band (Peng, et al. 2003), L-band (Zhao, et al. 2002), and lately in S-band
(Zulkifli, et al. 2013). The need of generating multiwavelength fiber laser in the O-band
region is due to support the possible application in the FTTH project. It is also required
in the component testing of devices used in the optical network system. Therefore, this
chapter proposes 3 techniques to generate O-band multiwavelength fiber laser and
demonstrates its advantages as comparison to the other bands. Various techniques has
been proposed and utilized to generate the multiwavelength output namely, the
technique of polarization hole burning (PHB) (Chen, et al. 2007 and Yeh, et al. 2008),
fiber Bragg grating (Ahmad, et al. 2009 and Liu, et al. 2008), utilizing the arrayed
waveguide grating (Latif, et al. 2010) and also the stimulated Brillouin scattering effect
in optical fiber (Zhan, et al. 2006).
However, only 3 techniques will be discussed in this chapter. In section 4.2,
multiwavelength generation by Stimulated Brillouin Scattering (SBS) effect is proposed
where the study of its threshold and the pattern generated with different cavity
configuration setup are discussed. Another technique is using interferometer to generate

64
MWFL. Only two methods using interferometer are adopted namely the Sagnac Loop
Mirror (SLM) which is discussed in section 4.3 and Fabry Perot Interferometer in
section 4.4.
4.2 Design and Characterization of Multiwavelength O-band Brillouin Fiber
Laser (MWBFL)
As discussed in chapter 2, the stimulated Brillouin Scattering (SBS) is one of the
nonlinear effects in optical fiber that can generate the multiwavelength fiber laser. The
presence of high electric field modifies the refractive index of the medium that changes
it into an acoustic phonon which acts like a moving grating. The scattering resulted
from the collision between this incident light and acoustic wave is called Brillouin
scattering which moves in a backward direction of the incident light. The process last
until there is no sufficient Brillouin pump power to produces new laser at shorter
wavelength. The multiwavelength fiber laser produce is call as multiwavelength
Brillouin fiber laser (MWBFL).
Figure 4.1 Depletion of Brillouin pump and generation of Stokes signal process
There has been greater interest in using the Brillouin effect to generate
multiwavelength fiber laser, partly due to its simple approach and its ability to produce
multiple wavelengths in a single mode optical f iber . Requirements s u c h as low
threshold power and narrow linewidth pump source are attractive area of study (Zhu, et
al. 2005, Bakar, et al. 2009 and Al-Mansoori, et al. 2009). However there have been
65
numerous demonstrations in the literature on the operation of multiwavelength Brillouin
fiber laser (MWBFL) in the C-band region (Shirazi, et al. 2008, and Harun, et al. 2007),
S-band and also L-band (Al-Mansoori et al. 2007, 2008 and 2009).
In order to generate the MWBFL, the intensity of electric field generated by the
laser source has to exceed the Brillouin threshold. Brillouin threshold estimated by
neglecting pump depletion of equation 2.4 and equation 2.5 that would be simplified to
equation 4.1 and 4.2;
𝐼𝑝(𝑧) = 𝐼𝑝(0)𝑒−∝𝑧 (4.1)
𝐼𝑠(𝑂) = 𝐼𝑠(𝐿)𝑒𝑥𝑝 (
𝑔𝐵𝑃0𝐿𝑒𝑓𝑓
𝐴𝑒𝑓𝑓−∝ 𝐿)
(4.2)
The depletion of Brillouin pump intensity and the growth of Stokes intensity can
be represented as equation 4.1 and 4.2 respectively. Equation 4.2 shows that Stokes is
generated in the backward direction. Both equations suggest that the Brillouin threshold
can be manifested when the power of the backward scattering Stokes is equal to the
initial power of the Brillouin pump. The closest approximation of the non-ideal
condition, the Brillouin threshold is estimated at the backward scattering power of 10-1
to 10-4
of the Brillouin pump power. By considering that the Brillouin gain spectrum to
have a Lorentzian shape, the Brillouin threshold power (Pth) is defined as;
𝑃𝑡ℎ =
21𝐴𝑒𝑓𝑓
𝑔𝐵(𝑣𝐵)𝐿𝑒𝑓𝑓[1 +
∆𝑣𝑃
∆𝑣𝐵]
(4.3)
where, Aeff is the effective cross section of the fiber used, gB(νB) is the peak value of the
Brillouin gain coefficient, 𝛥𝜐𝑝
𝛥𝜐𝐵 for is the ratio of frequency linewidth of the pump over
the spontaneous Brillouin linewidth (Bayvel, et al. 1990) and Leff is the effective length.
The Stokes energy has a slightly lower energy than the Brillouin pump and resulted in a
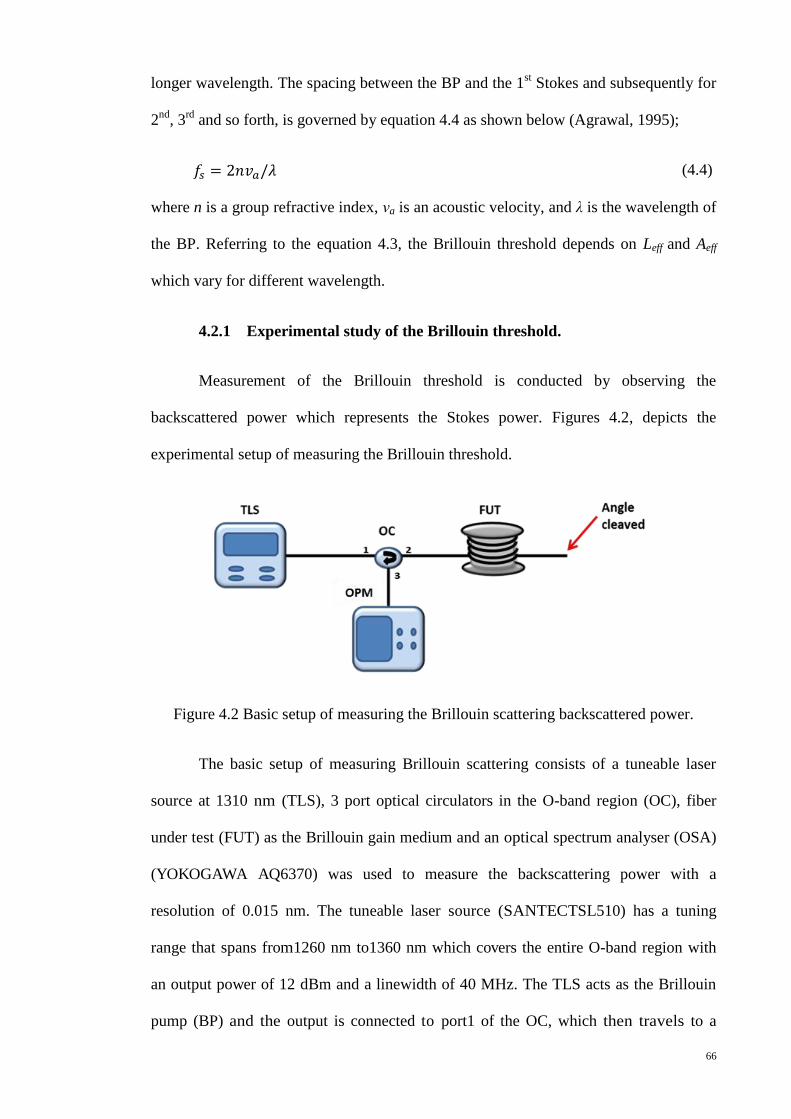
66
longer wavelength. The spacing between the BP and the 1st Stokes and subsequently for
2nd
, 3rd
and so forth, is governed by equation 4.4 as shown below (Agrawal, 1995);
𝑓𝑠 = 2𝑛𝑣𝑎/𝜆 (4.4)
where n is a group refractive index, νa is an acoustic velocity, and λ is the wavelength of
the BP. Referring to the equation 4.3, the Brillouin threshold depends on Leff and Aeff
which vary for different wavelength.
4.2.1 Experimental study of the Brillouin threshold.
Measurement of the Brillouin threshold is conducted by observing the
backscattered power which represents the Stokes power. Figures 4.2, depicts the
experimental setup of measuring the Brillouin threshold.
Figure 4.2 Basic setup of measuring the Brillouin scattering backscattered power.
The basic setup of measuring Brillouin scattering consists of a tuneable laser
source at 1310 nm (TLS), 3 port optical circulators in the O-band region (OC), fiber
under test (FUT) as the Brillouin gain medium and an optical spectrum analyser (OSA)
(YOKOGAWA AQ6370) was used to measure the backscattering power with a
resolution of 0.015 nm. The tuneable laser source (SANTECTSL510) has a tuning
range that spans from1260 nm to1360 nm which covers the entire O-band region with
an output power of 12 dBm and a linewidth of 40 MHz. The TLS acts as the Brillouin
pump (BP) and the output is connected to port1 of the OC, which then travels to a

67
spool of nonlinear optical fiber from port 2. The Brillouin pump generates an acoustic
wave which acts as a moving grating which then interacts back with the Brillouin pump.
This generates a backscattered Stokes signal which travel backwards relative to the
Brillouin pump and this is labelled as 1st Stokes. The end of the fiber was angle cleaved
to minimize Fresnel reflection. The reflection can affect the measurement of the
backscattered power. The backscattered power is measured by optical power meter
(OPM) at port 3 of OC. Whenever the backscattered power reach 10% of its BP power,
that particular BP power will be considered as the threshold power (Pth)
The experimental results shows the measurements on FUT for three different
types of fibers, namely, the normal single mode optical fiber (SMF-28) of length 50 km,
dispersion compensated fiber (DCF) of length 7.7 km and Truewave Reach fiber (TWF)
with a length of 20 km. Figure 4.3 shows the backscattered power against the Brillouin
pump power for all the three fibers tested.
Figure 4.3 Comparison of backscattered stokes power between there different fibers
under test.
The red dotted line and dotted vertical lines as indicated in the figure show the
points where the backscattered Stokes power readings are 10% of the input power as
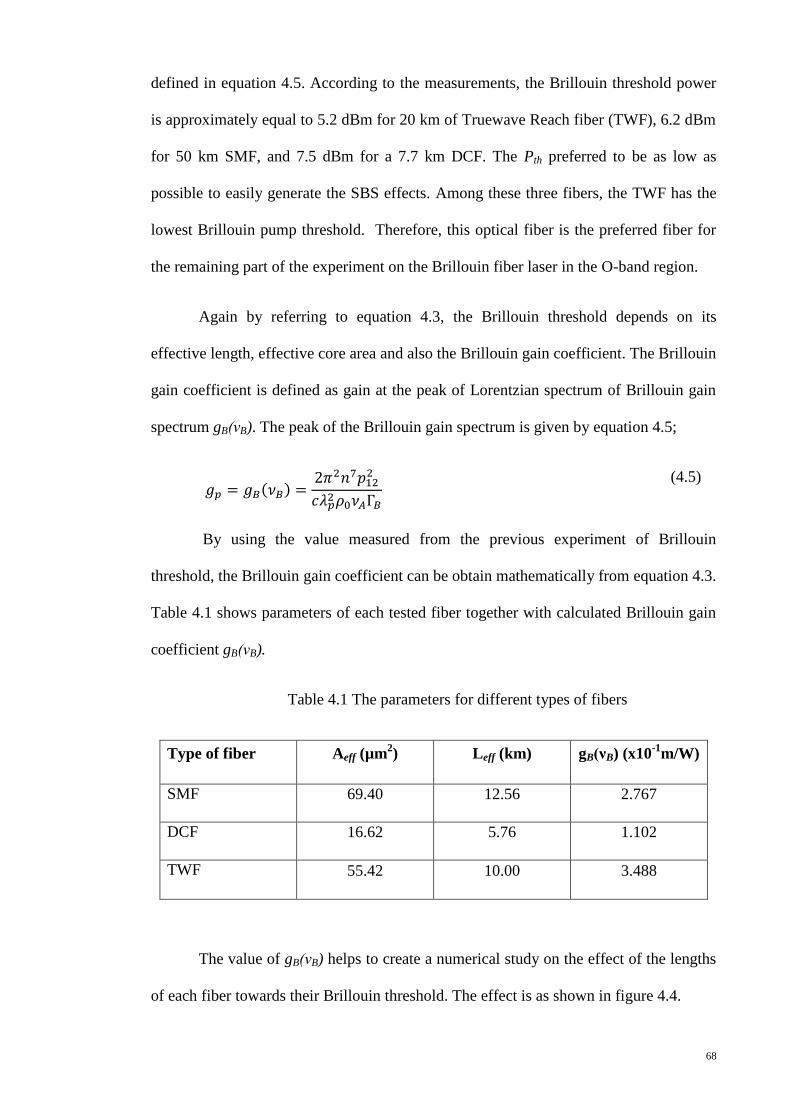
68
defined in equation 4.5. According to the measurements, the Brillouin threshold power
is approximately equal to 5.2 dBm for 20 km of Truewave Reach fiber (TWF), 6.2 dBm
for 50 km SMF, and 7.5 dBm for a 7.7 km DCF. The Pth preferred to be as low as
possible to easily generate the SBS effects. Among these three fibers, the TWF has the
lowest Brillouin pump threshold. Therefore, this optical fiber is the preferred fiber for
the remaining part of the experiment on the Brillouin fiber laser in the O-band region.
Again by referring to equation 4.3, the Brillouin threshold depends on its
effective length, effective core area and also the Brillouin gain coefficient. The Brillouin
gain coefficient is defined as gain at the peak of Lorentzian spectrum of Brillouin gain
spectrum gB(νB). The peak of the Brillouin gain spectrum is given by equation 4.5;
𝑔𝑝 = 𝑔𝐵(𝜈𝐵) =
2𝜋2𝑛7𝑝122
𝑐𝜆𝑝2 𝜌0𝜈𝐴Γ𝐵
(4.5)
By using the value measured from the previous experiment of Brillouin
threshold, the Brillouin gain coefficient can be obtain mathematically from equation 4.3.
Table 4.1 shows parameters of each tested fiber together with calculated Brillouin gain
coefficient gB(νB).
Table 4.1 The parameters for different types of fibers
Type of fiber Aeff (µm2) Leff (km) gB(νB) (x10
-1m/W)
SMF 69.40 12.56 2.767
DCF 16.62 5.76 1.102
TWF 55.42 10.00 3.488
The value of gB(νB) helps to create a numerical study on the effect of the lengths
of each fiber towards their Brillouin threshold. The effect is as shown in figure 4.4.
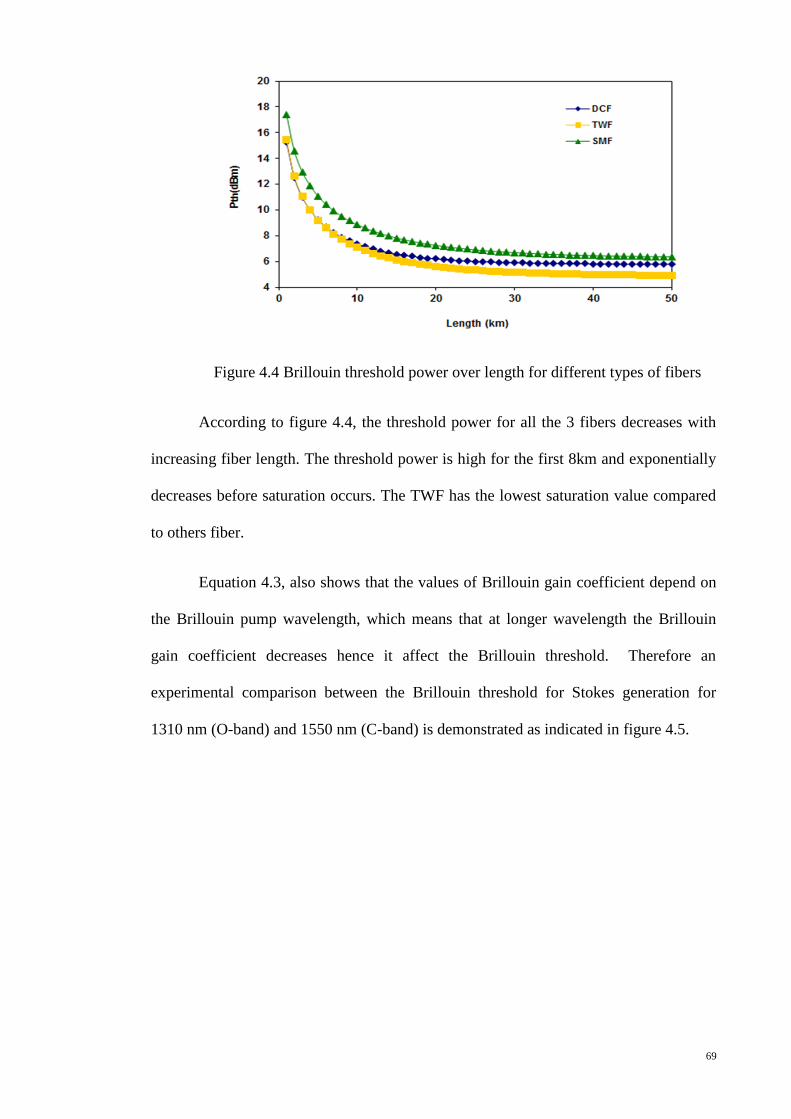
69
Figure 4.4 Brillouin threshold power over length for different types of fibers
According to figure 4.4, the threshold power for all the 3 fibers decreases with
increasing fiber length. The threshold power is high for the first 8km and exponentially
decreases before saturation occurs. The TWF has the lowest saturation value compared
to others fiber.
Equation 4.3, also shows that the values of Brillouin gain coefficient depend on
the Brillouin pump wavelength, which means that at longer wavelength the Brillouin
gain coefficient decreases hence it affect the Brillouin threshold. Therefore an
experimental comparison between the Brillouin threshold for Stokes generation for
1310 nm (O-band) and 1550 nm (C-band) is demonstrated as indicated in figure 4.5.

70
Figure 4.5 Backscattered stokes power for BP wavelength of 1310 and 1550 nm.
By utilizing the same technique and employing 20 km of the TWF, it can be
shown that the BP threshold for operation in the 1310 nm is lower than that for 1550 nm
with values of 5.2 dBm and 8.5 dBm, respectively.
Figure 4.6 Comparison of the line spacing between the BP and its Stokes for (a) O-band
and (b) C-band regions.
From figure 4.6, the spacing between the BP and the 1st Stokes is 12.72 GHz for
O-band and 10.41 GHz for the C-band. This can be verified using equation 4.4. From

71
these measurements and the results obtained, the operation of the Brillouin fiber laser in
the O-band gives a better performance as compared to the C-band region.
4.2.2 Generating Multiwavelength Brillouin Fiber Laser in Ring Cavity
Once the threshold of Brillouin pump is known, the multiwavelength Brillouin
fiber laser can be generated and controlled by manipulating the Brillouin pump power.
In this technique, the nonlinear medium is desired to have a high value of Brillouin gain
coefficient gB(νB) and low threshold power. Therefore, the True wave Reach Fiber
(TWF) is selected as the medium to generate multiwavelength Brillouin fiber laser in
the following sections. Multiwavelength Brillouin fiber laser is generated by either a
ring or linear cavity. Therefore, both configurations are demonstrated in this section
starting with the ring cavity configuration as shown in figure 4.7 that allows
unidirectional pathway.
Figure 4.7 The configuration of ring like shaped cavity.
The MWBFL by ring cavity configuration is obtained by using an optical
coupler (C1) where the BP signals from TLS enters the C1 and stimulated Brillouin
scattering generated from the nonlinear medium of TWF. The generated SBS signals
then travel to another coupler of which 10% of its power is tapped to be analysed by the
OSA. The remaining signals are then feedback into the TWF through C1. An isolator is
placed in between C1 and TWF to prevent any signal from damaging the TLS. By
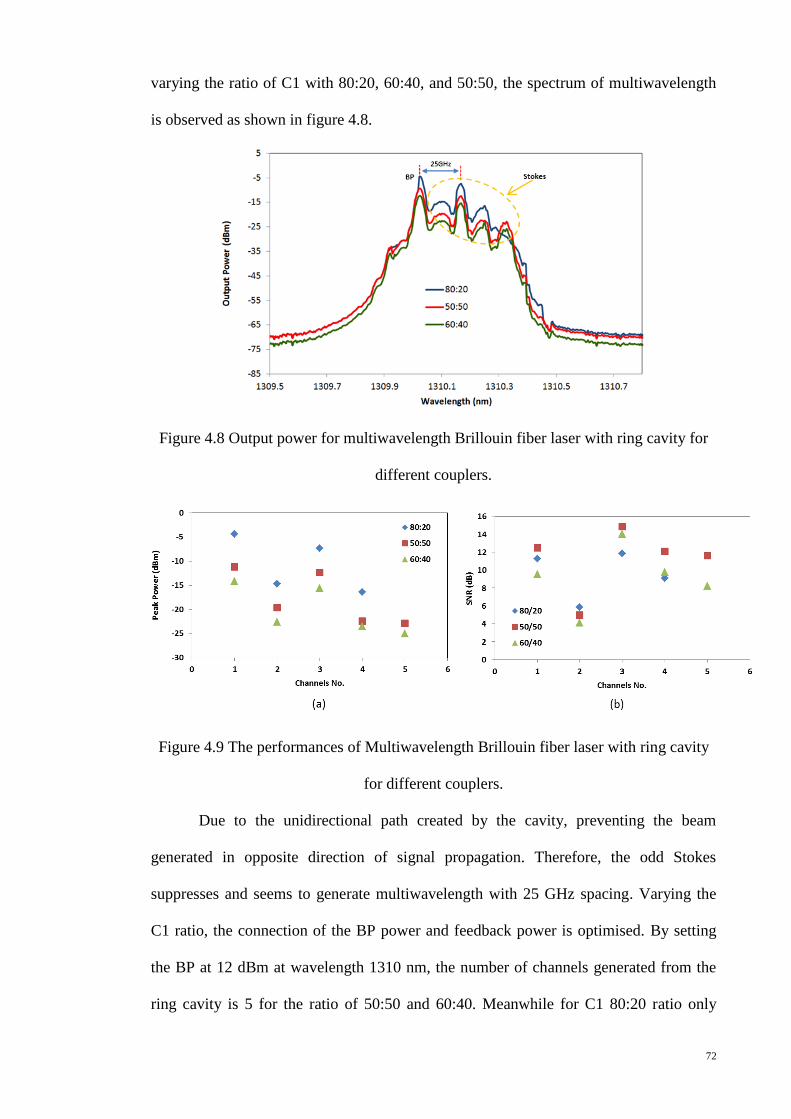
72
varying the ratio of C1 with 80:20, 60:40, and 50:50, the spectrum of multiwavelength
is observed as shown in figure 4.8.
Figure 4.8 Output power for multiwavelength Brillouin fiber laser with ring cavity for
different couplers.
Figure 4.9 The performances of Multiwavelength Brillouin fiber laser with ring cavity
for different couplers.
Due to the unidirectional path created by the cavity, preventing the beam
generated in opposite direction of signal propagation. Therefore, the odd Stokes
suppresses and seems to generate multiwavelength with 25 GHz spacing. Varying the
C1 ratio, the connection of the BP power and feedback power is optimised. By setting
the BP at 12 dBm at wavelength 1310 nm, the number of channels generated from the
ring cavity is 5 for the ratio of 50:50 and 60:40. Meanwhile for C1 80:20 ratio only
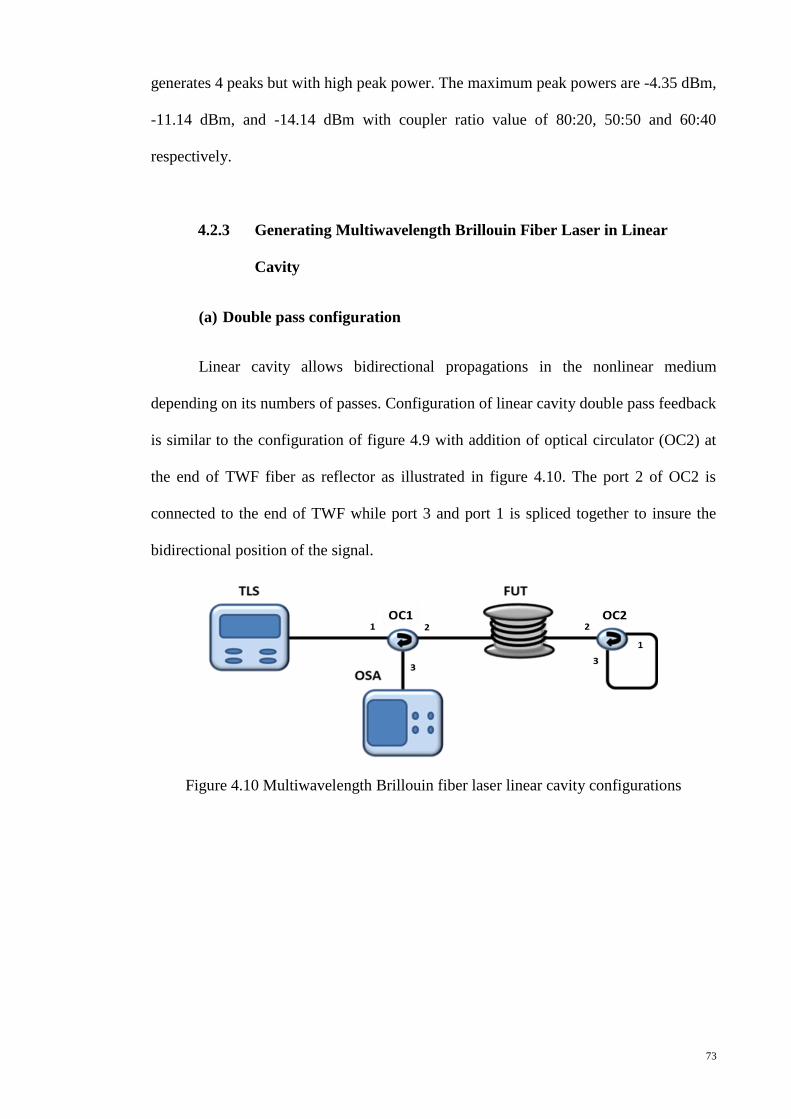
73
generates 4 peaks but with high peak power. The maximum peak powers are -4.35 dBm,
-11.14 dBm, and -14.14 dBm with coupler ratio value of 80:20, 50:50 and 60:40
respectively.
4.2.3 Generating Multiwavelength Brillouin Fiber Laser in Linear
Cavity
(a) Double pass configuration
Linear cavity allows bidirectional propagations in the nonlinear medium
depending on its numbers of passes. Configuration of linear cavity double pass feedback
is similar to the configuration of figure 4.9 with addition of optical circulator (OC2) at
the end of TWF fiber as reflector as illustrated in figure 4.10. The port 2 of OC2 is
connected to the end of TWF while port 3 and port 1 is spliced together to insure the
bidirectional position of the signal.
Figure 4.10 Multiwavelength Brillouin fiber laser linear cavity configurations
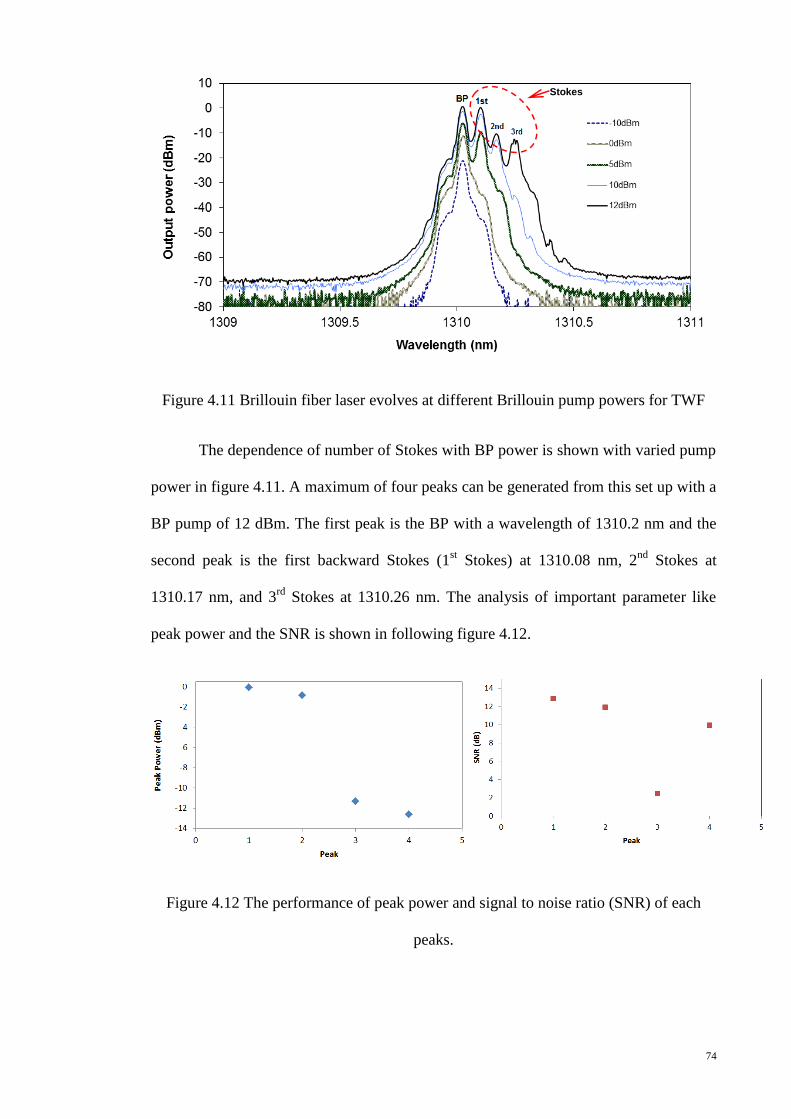
74
Figure 4.11 Brillouin fiber laser evolves at different Brillouin pump powers for TWF
The dependence of number of Stokes with BP power is shown with varied pump
power in figure 4.11. A maximum of four peaks can be generated from this set up with a
BP pump of 12 dBm. The first peak is the BP with a wavelength of 1310.2 nm and the
second peak is the first backward Stokes (1st Stokes) at 1310.08 nm, 2
nd Stokes at
1310.17 nm, and 3rd
Stokes at 1310.26 nm. The analysis of important parameter like
peak power and the SNR is shown in following figure 4.12.
Figure 4.12 The performance of peak power and signal to noise ratio (SNR) of each
peaks.
StokesStokes
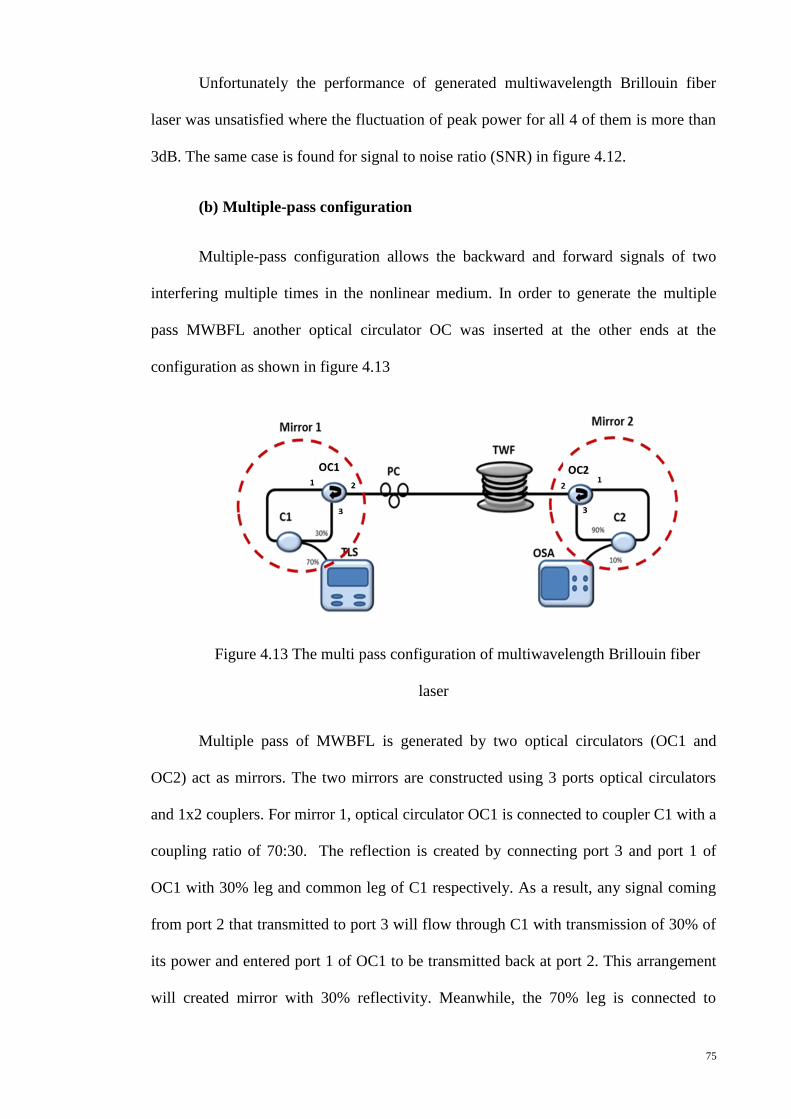
75
Unfortunately the performance of generated multiwavelength Brillouin fiber
laser was unsatisfied where the fluctuation of peak power for all 4 of them is more than
3dB. The same case is found for signal to noise ratio (SNR) in figure 4.12.
(b) Multiple-pass configuration
Multiple-pass configuration allows the backward and forward signals of two
interfering multiple times in the nonlinear medium. In order to generate the multiple
pass MWBFL another optical circulator OC was inserted at the other ends at the
configuration as shown in figure 4.13
Figure 4.13 The multi pass configuration of multiwavelength Brillouin fiber
laser
Multiple pass of MWBFL is generated by two optical circulators (OC1 and
OC2) act as mirrors. The two mirrors are constructed using 3 ports optical circulators
and 1x2 couplers. For mirror 1, optical circulator OC1 is connected to coupler C1 with a
coupling ratio of 70:30. The reflection is created by connecting port 3 and port 1 of
OC1 with 30% leg and common leg of C1 respectively. As a result, any signal coming
from port 2 that transmitted to port 3 will flow through C1 with transmission of 30% of
its power and entered port 1 of OC1 to be transmitted back at port 2. This arrangement
will created mirror with 30% reflectivity. Meanwhile, the 70% leg is connected to
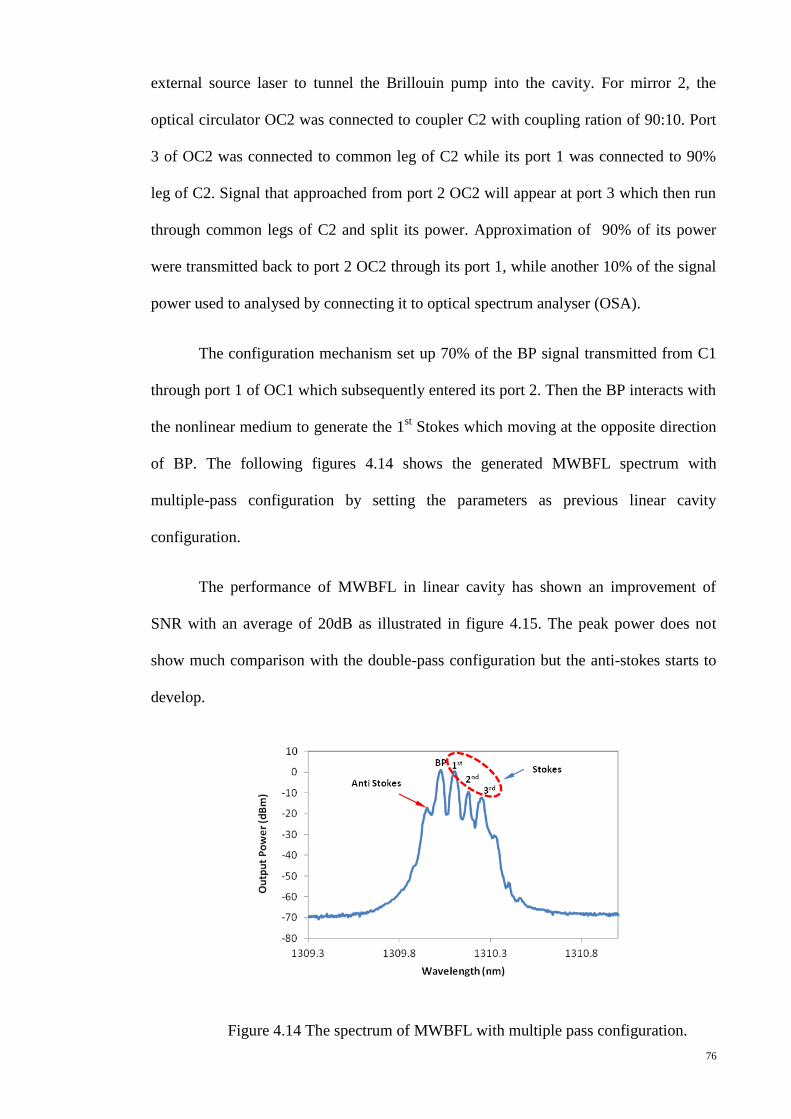
76
external source laser to tunnel the Brillouin pump into the cavity. For mirror 2, the
optical circulator OC2 was connected to coupler C2 with coupling ration of 90:10. Port
3 of OC2 was connected to common leg of C2 while its port 1 was connected to 90%
leg of C2. Signal that approached from port 2 OC2 will appear at port 3 which then run
through common legs of C2 and split its power. Approximation of 90% of its power
were transmitted back to port 2 OC2 through its port 1, while another 10% of the signal
power used to analysed by connecting it to optical spectrum analyser (OSA).
The configuration mechanism set up 70% of the BP signal transmitted from C1
through port 1 of OC1 which subsequently entered its port 2. Then the BP interacts with
the nonlinear medium to generate the 1st Stokes which moving at the opposite direction
of BP. The following figures 4.14 shows the generated MWBFL spectrum with
multiple-pass configuration by setting the parameters as previous linear cavity
configuration.
The performance of MWBFL in linear cavity has shown an improvement of
SNR with an average of 20dB as illustrated in figure 4.15. The peak power does not
show much comparison with the double-pass configuration but the anti-stokes starts to
develop.
Figure 4.14 The spectrum of MWBFL with multiple pass configuration.
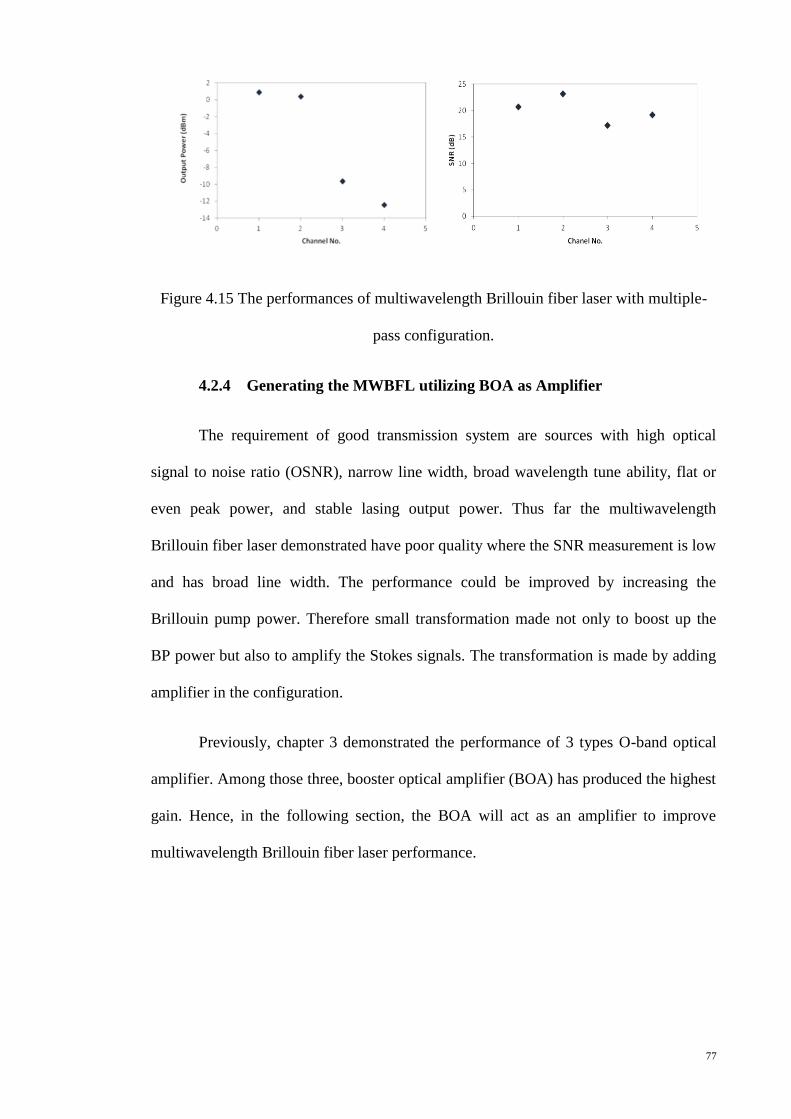
77
Figure 4.15 The performances of multiwavelength Brillouin fiber laser with multiple-
pass configuration.
4.2.4 Generating the MWBFL utilizing BOA as Amplifier
The requirement of good transmission system are sources with high optical
signal to noise ratio (OSNR), narrow line width, broad wavelength tune ability, flat or
even peak power, and stable lasing output power. Thus far the multiwavelength
Brillouin fiber laser demonstrated have poor quality where the SNR measurement is low
and has broad line width. The performance could be improved by increasing the
Brillouin pump power. Therefore small transformation made not only to boost up the
BP power but also to amplify the Stokes signals. The transformation is made by adding
amplifier in the configuration.
Previously, chapter 3 demonstrated the performance of 3 types O-band optical
amplifier. Among those three, booster optical amplifier (BOA) has produced the highest
gain. Hence, in the following section, the BOA will act as an amplifier to improve
multiwavelength Brillouin fiber laser performance.
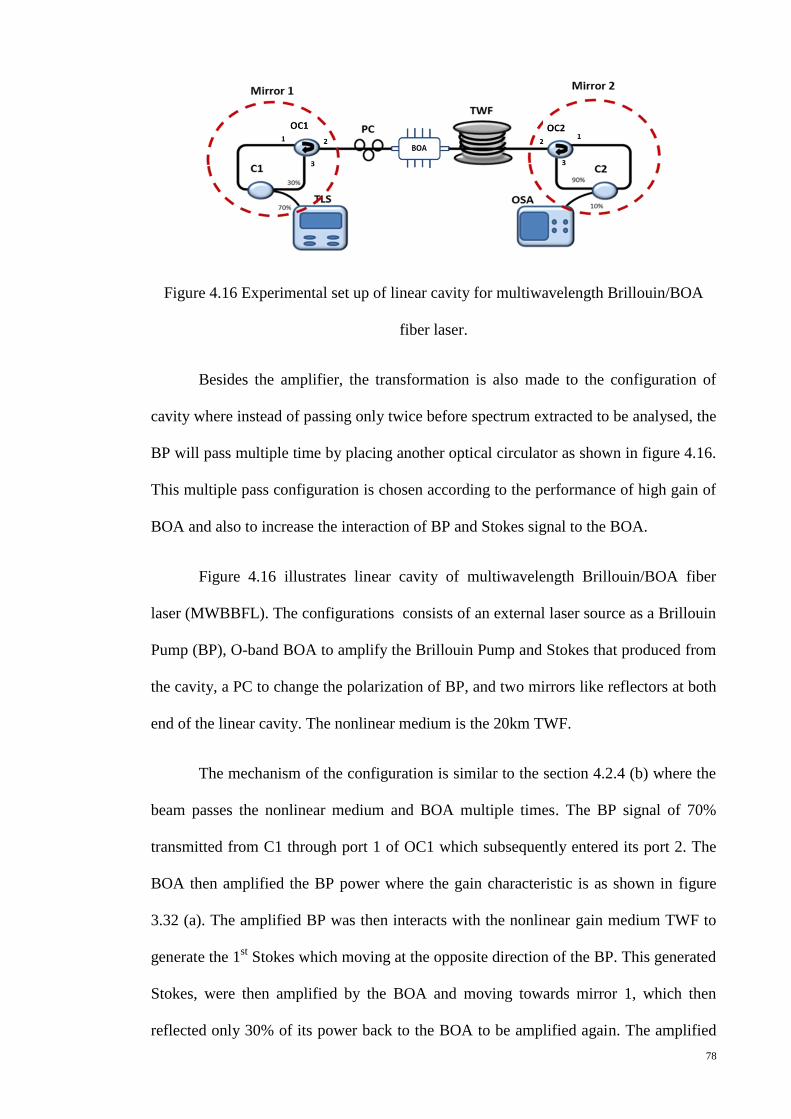
78
Figure 4.16 Experimental set up of linear cavity for multiwavelength Brillouin/BOA
fiber laser.
Besides the amplifier, the transformation is also made to the configuration of
cavity where instead of passing only twice before spectrum extracted to be analysed, the
BP will pass multiple time by placing another optical circulator as shown in figure 4.16.
This multiple pass configuration is chosen according to the performance of high gain of
BOA and also to increase the interaction of BP and Stokes signal to the BOA.
Figure 4.16 illustrates linear cavity of multiwavelength Brillouin/BOA fiber
laser (MWBBFL). The configurations consists of an external laser source as a Brillouin
Pump (BP), O-band BOA to amplify the Brillouin Pump and Stokes that produced from
the cavity, a PC to change the polarization of BP, and two mirrors like reflectors at both
end of the linear cavity. The nonlinear medium is the 20km TWF.
The mechanism of the configuration is similar to the section 4.2.4 (b) where the
beam passes the nonlinear medium and BOA multiple times. The BP signal of 70%
transmitted from C1 through port 1 of OC1 which subsequently entered its port 2. The
BOA then amplified the BP power where the gain characteristic is as shown in figure
3.32 (a). The amplified BP was then interacts with the nonlinear gain medium TWF to
generate the 1st Stokes which moving at the opposite direction of the BP. This generated
Stokes, were then amplified by the BOA and moving towards mirror 1, which then
reflected only 30% of its power back to the BOA to be amplified again. The amplified
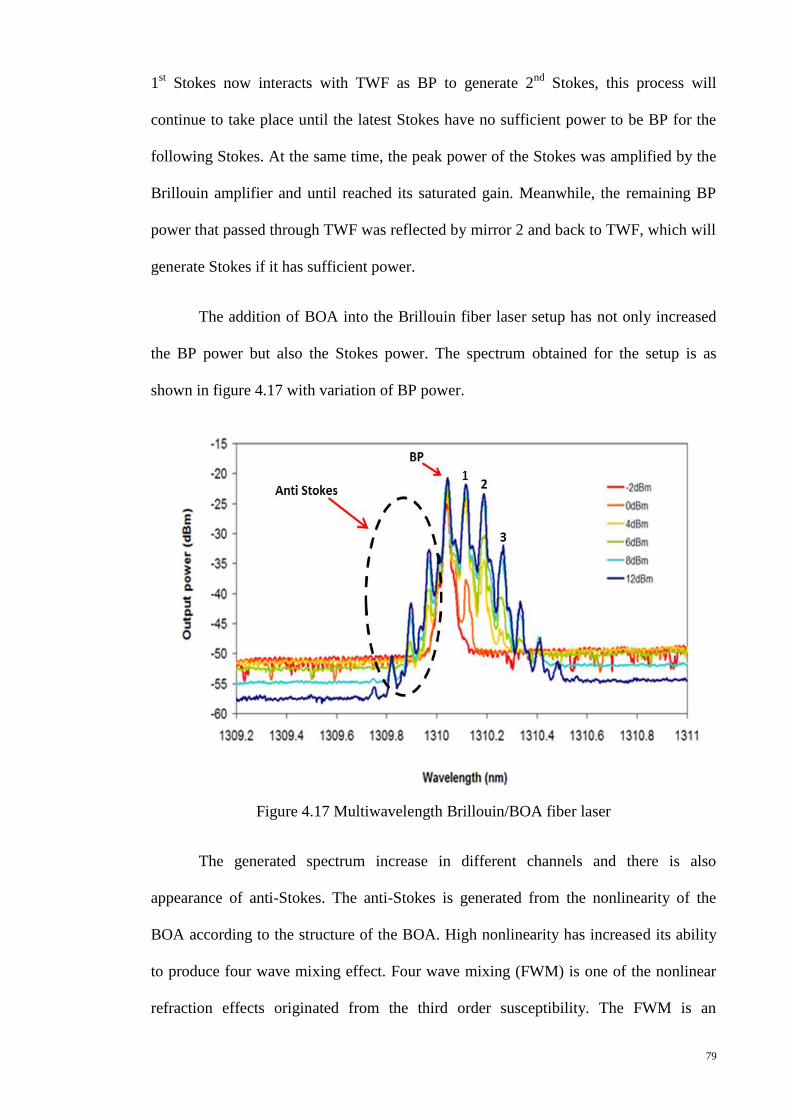
79
1st Stokes now interacts with TWF as BP to generate 2
nd Stokes, this process will
continue to take place until the latest Stokes have no sufficient power to be BP for the
following Stokes. At the same time, the peak power of the Stokes was amplified by the
Brillouin amplifier and until reached its saturated gain. Meanwhile, the remaining BP
power that passed through TWF was reflected by mirror 2 and back to TWF, which will
generate Stokes if it has sufficient power.
The addition of BOA into the Brillouin fiber laser setup has not only increased
the BP power but also the Stokes power. The spectrum obtained for the setup is as
shown in figure 4.17 with variation of BP power.
Figure 4.17 Multiwavelength Brillouin/BOA fiber laser
The generated spectrum increase in different channels and there is also
appearance of anti-Stokes. The anti-Stokes is generated from the nonlinearity of the
BOA according to the structure of the BOA. High nonlinearity has increased its ability
to produce four wave mixing effect. Four wave mixing (FWM) is one of the nonlinear
refraction effects originated from the third order susceptibility. The FWM is an
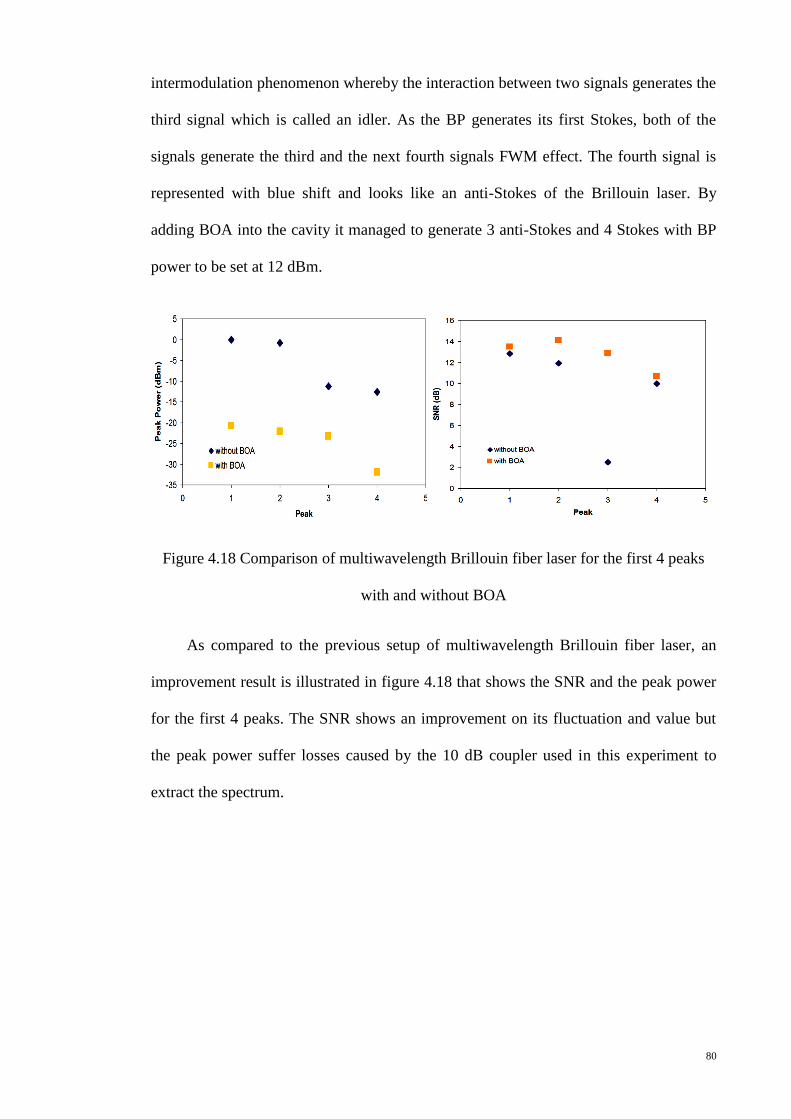
80
intermodulation phenomenon whereby the interaction between two signals generates the
third signal which is called an idler. As the BP generates its first Stokes, both of the
signals generate the third and the next fourth signals FWM effect. The fourth signal is
represented with blue shift and looks like an anti-Stokes of the Brillouin laser. By
adding BOA into the cavity it managed to generate 3 anti-Stokes and 4 Stokes with BP
power to be set at 12 dBm.
Figure 4.18 Comparison of multiwavelength Brillouin fiber laser for the first 4 peaks
with and without BOA
As compared to the previous setup of multiwavelength Brillouin fiber laser, an
improvement result is illustrated in figure 4.18 that shows the SNR and the peak power
for the first 4 peaks. The SNR shows an improvement on its fluctuation and value but
the peak power suffer losses caused by the 10 dB coupler used in this experiment to
extract the spectrum.

81
Figure 4.19 Number of Stokes at different wavelength
By utilizing the BOA the numbers of stokes generated will depend on the gain of
the BOA. As depicted in figure 4.19, the highest number of peak generated at 1340 nm
is compatible with the gain spectrum of the BOA.
Figure 4.20 peak powers of transmitted Brillouin and the first three Stokes.
As mentioned previously, flatness of the peaks power is one of the requirements of
decent multiwavelength laser source. Therefore the details of multiwavelength
Brillouin/BOA fiber laser flatness are shown in figure 4.20. Unfortunately the channels
show irregularity in peak power. All first 3 Stokes have at least 1 dB separation between
each other at 12 dBm BP power and have larger difference for the 3rd
Stokes due to
(a) (b)(a) (b)

82
insufficient power of Stokes. Hence improvement shall be made to the flatness of the
MWBFL.
4.3 Design and characterization of multiwavelength O-band fiber laser by
Sagnac Loop Mirror technique
Another way of producing multiwavelength fiber laser is by utilizing Sagnac
Loop Mirror (SLM) technique. The SLM is the assembly of slicing technique, where the
SLM acts as comb filter through interferometer principle towards a broad band source
such as the ASE used as the signal seed.
The O-band SLM multiwavelegth fiber laser produced by employing the BOA
as an ASE source due to its high ASE peak power level and broad bandwidth. As
illustrated in figure 4.21, the BOA is placed right before the SLM. Once the ASE of the
BOA reach the SLM, the power will split evenly into two beams and both beams will
interfere at the PMF. The SLM generate multiwavelength fiber laser due to constructive
and destructive interference which resulted from slicing of the ASE. The cavity or
resonance architecture can be either ring or linear as shown in figure 4.21(a) and 4.21
(b) respectively.
Linear cavity generated by placed mirrors at the both end of the SLM setup so
that the generated beams can pass through the BOA repeatedly for multiple
amplifications. As for the ring cavity configuration, the setup is assembled by
connecting the end of the 2x2 coupler with the BOA to ensure the feedback of the
beams in unidirectional pass. The 10dB coupler in placed between to extract the
spectrum generated.

83
(a)
(b)
Figure 4.21 Multiwavelength fiber laser with (a) linear cavity (b) ring cavity SLM fiber
laser setup
Both cavities result in different spectrum as shown in figure 4.22. The spectrum
generated by taking the length of PMF to be 2m and the BOA power to be set at
400mA.

84
Figure 4.22 The spectrum of the ring cavity and the linear cavity of fiber laser SLM
configurations.
The ring cavity generates only few number of channels with poor SNR due to
high ASE noise which also been amplified by the BOA as in figure 4.23. The ring
cavity generates only 5 high peak channels (>-30 dBm) meanwhile the linear cavity
managed to generate more than 10 channels. Linear cavity also generates better
performance of SNR which average value is more than 30dB. Due to this improvement,
therefore for the next experiment related to SLM fiber laser, linear cavity configuration
is utilized.
(a)
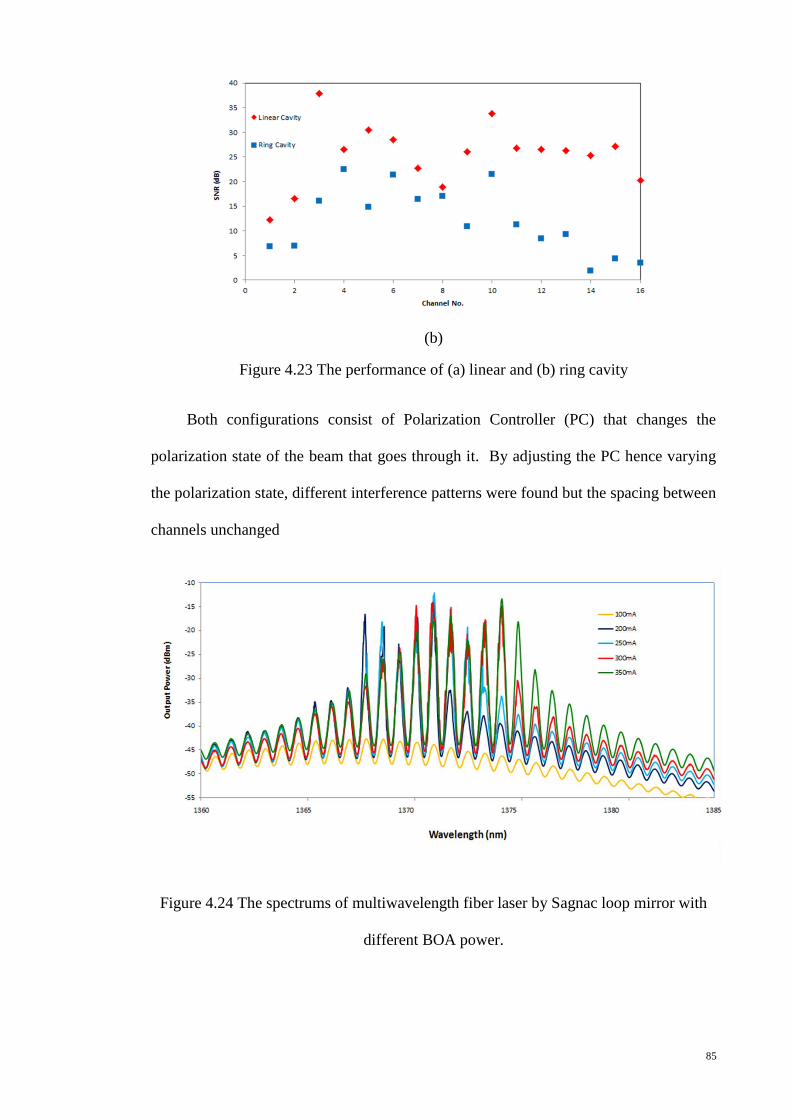
85
(b)
Figure 4.23 The performance of (a) linear and (b) ring cavity
Both configurations consist of Polarization Controller (PC) that changes the
polarization state of the beam that goes through it. By adjusting the PC hence varying
the polarization state, different interference patterns were found but the spacing between
channels unchanged
Figure 4.24 The spectrums of multiwavelength fiber laser by Sagnac loop mirror with
different BOA power.

86
4.4 Design and characterization of multiwavelength O-band fiber laser by
Fabry Perot Interferometer technique
Another interferometer technique that benefit the multiwavelength fiber laser is
Fabry Perot interferometer. In this section, we propose and demonstrate a
multiwavelength BOA fiber laser scheme using a Fabry–Perot reflector inside linear
cavity. The Fabry-Perot interferometer usually consists of two parallel (highly)
reflective surfaces separated by a small gap. The Fabry-Perot interferometer is able to
produce sharp interference peaks because it uses multiple beam interference.
The advantage of utilizing this technique was not only for its simple configuration
but also its ability to generate higher resolution or SNR. High SNR can be produced by
generating multiple pass of beam employing linear cavity as illustrated in figure 4.25.
The configuration consists of BOA as the seed source and amplifier, PMF with different
length, PC to change the polarization state of the beam, mirror with reflectivity of 90%,
coupler 90:10 (C) and OSA. The PMF is the gap where the interference occurs. The
seed source of the BOA travels into the PMF where 4% of the light is reflected back due
to the Fresnel reflection of air. The reflected beams then interfere with the incidence
beam, where the pattern described by the intensity modulation of incident beams which
caused by the phase different cause by the PMF. The phase difference is described as in
equation 3.2. The channel spacing is predicted to be twice the spacing channel of SLM
with similar length of PMF.
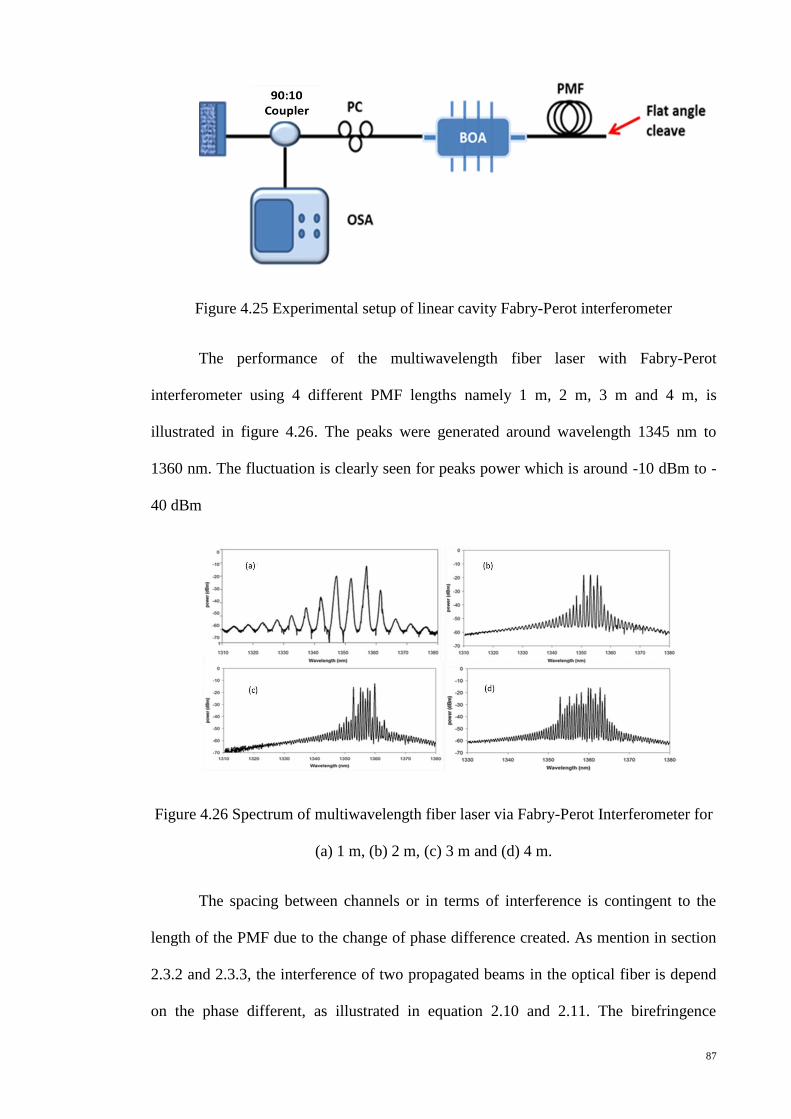
87
Figure 4.25 Experimental setup of linear cavity Fabry-Perot interferometer
The performance of the multiwavelength fiber laser with Fabry-Perot
interferometer using 4 different PMF lengths namely 1 m, 2 m, 3 m and 4 m, is
illustrated in figure 4.26. The peaks were generated around wavelength 1345 nm to
1360 nm. The fluctuation is clearly seen for peaks power which is around -10 dBm to -
40 dBm
Figure 4.26 Spectrum of multiwavelength fiber laser via Fabry-Perot Interferometer for
(a) 1 m, (b) 2 m, (c) 3 m and (d) 4 m.
The spacing between channels or in terms of interference is contingent to the
length of the PMF due to the change of phase difference created. As mention in section
2.3.2 and 2.3.3, the interference of two propagated beams in the optical fiber is depend
on the phase different, as illustrated in equation 2.10 and 2.11. The birefringence
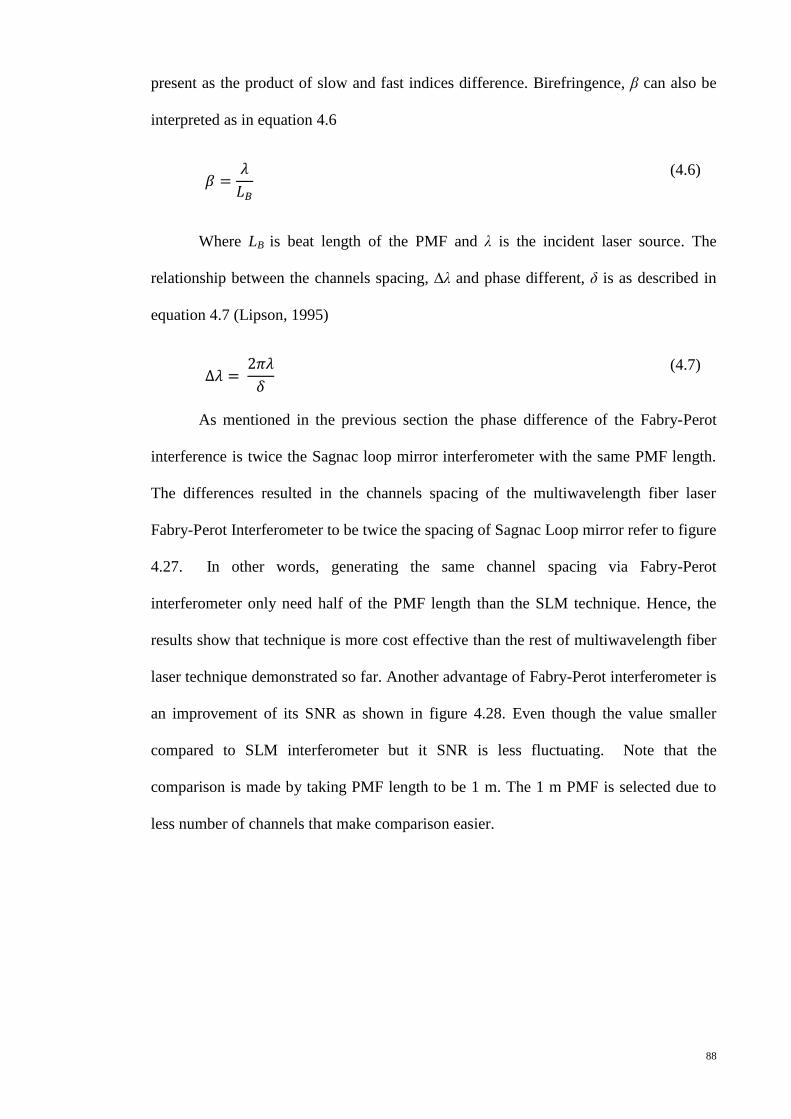
88
present as the product of slow and fast indices difference. Birefringence, β can also be
interpreted as in equation 4.6
𝛽 =
𝜆
𝐿𝐵
(4.6)
Where LB is beat length of the PMF and λ is the incident laser source. The
relationship between the channels spacing, ∆λ and phase different, δ is as described in
equation 4.7 (Lipson, 1995)
∆𝜆 =
2𝜋𝜆
𝛿
(4.7)
As mentioned in the previous section the phase difference of the Fabry-Perot
interference is twice the Sagnac loop mirror interferometer with the same PMF length.
The differences resulted in the channels spacing of the multiwavelength fiber laser
Fabry-Perot Interferometer to be twice the spacing of Sagnac Loop mirror refer to figure
4.27. In other words, generating the same channel spacing via Fabry-Perot
interferometer only need half of the PMF length than the SLM technique. Hence, the
results show that technique is more cost effective than the rest of multiwavelength fiber
laser technique demonstrated so far. Another advantage of Fabry-Perot interferometer is
an improvement of its SNR as shown in figure 4.28. Even though the value smaller
compared to SLM interferometer but it SNR is less fluctuating. Note that the
comparison is made by taking PMF length to be 1 m. The 1 m PMF is selected due to
less number of channels that make comparison easier.
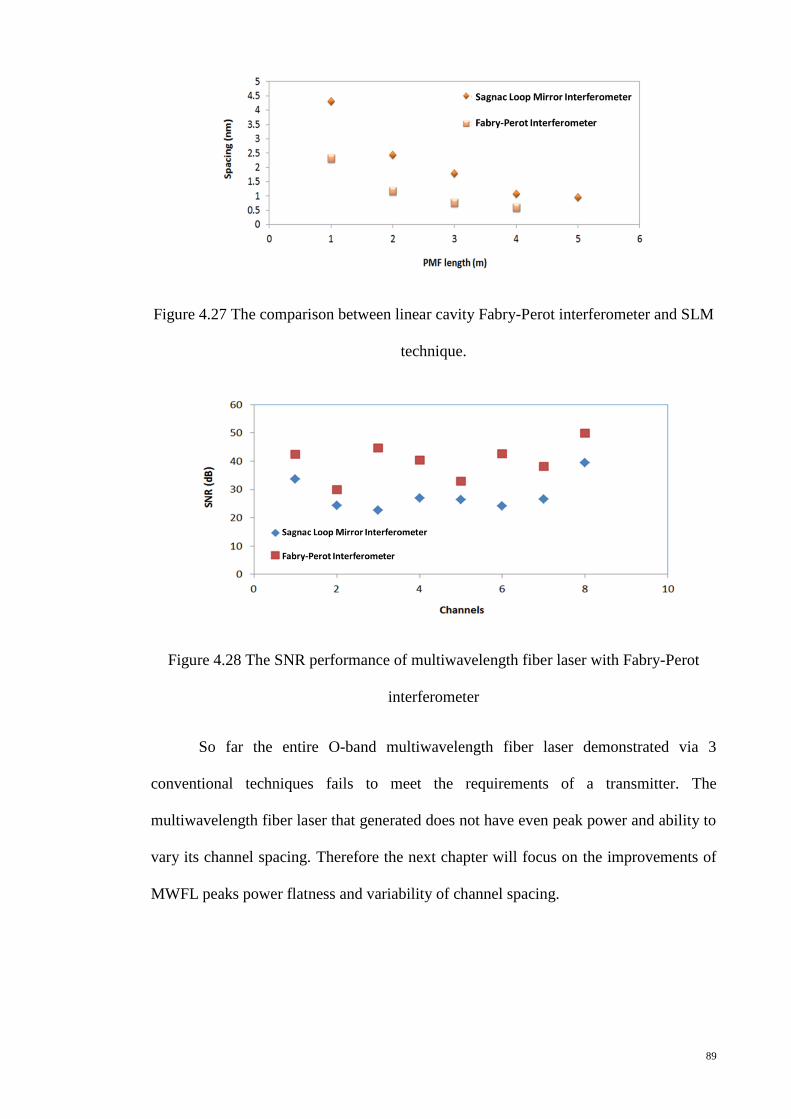
89
Figure 4.27 The comparison between linear cavity Fabry-Perot interferometer and SLM
technique.
Figure 4.28 The SNR performance of multiwavelength fiber laser with Fabry-Perot
interferometer
So far the entire O-band multiwavelength fiber laser demonstrated via 3
conventional techniques fails to meet the requirements of a transmitter. The
multiwavelength fiber laser that generated does not have even peak power and ability to
vary its channel spacing. Therefore the next chapter will focus on the improvements of
MWFL peaks power flatness and variability of channel spacing.

90
Chapter 5 Improvements of O-band
multiwavelength fiber laser (MWFL)
5.1 Introduction
The multiwavelength fiber laser can be useful not only for DWDM system but
also for various applications such as sensory system (Venkataraayan, et al. 2011).
Unfortunately the required properties of multiwavelength fiber laser for each application
are different from each other. One of the requirements is the channels spacing. The
channels spacing in multiwavelength Brillouin fiber laser could be obtained by
combining the ring and linear configurations. Meanwhile in order to vary spacing for
interferometer technique, the phase has to be manipulated (Lee, et al. 2012).
Apart from varying the channel spacing, multiwavelength fiber laser also needs
to have even peak power. Even peak power allows better maintenance and calibration
especially in the DWDM system. The even peak power for multiwavelength Brillouin
fiber laser could be achieved by adjusting the optical amplifier, adding more optical
amplifiers or accompanying nonlinear effect such as four waves mixing to levelled the
peak power.
5.2 Improvement of O-band multiwavelength Brillouin fiber laser (MWBFL)
As demonstrated in section 4.2.4, the generated multiwavelength Brillouin fiber
laser consist of spectrum with uneven peak power fluctuating from 3 dB to 20dB. A key
concern in operating communication system as mentioned previously is to have source
with even peak power and less fluctuating in order to provide stable data transmission
performance. Synchronous signals are also important for DWDM calibration process.
This gives motivation to run an experiment to improve the flatness of output spectrum
BFL. There are few ways discussed in this section to generate flatter peak power

91
multiwavelength Brillouin fiber laser including relocating amplifier, utilizing highly
nonlinear fiber and hybrid amplifier.
5.2.1 Design and characterization to improve flatness of MWBFL
(a) Relocating the amplifier
In the conventional MWBFL setup in section 4.2.4, the BOA was used to
amplify the power of BP and Stokes signal was generated from the setup. The BP was
the first to be amplified by the BOA, then followed by generation of Stokes, where the
number of Stokes depending on the power of BP. By the time Stokes reaches the BOA,
the amplification of BOA was dominated by the BP signals. Hence, the
multiwavelength spectrum resulted in uneven peak power
Figure 5.1 Experimental setup of linear cavity of multiwavelength Brillouin/BOA fiber
laser.
Therefore an investigation on the effect of amplifier location in the Brillouin
fiber laser system to the output flatness was conducted. The BOA was relocated after
the TWF as depicted in figure 5.1. Thus, the BP will interact with TWF initially to
produce 1st Stokes before it was amplified by the BOA. At that point, the BP power has
less power and Stokes already started to grow, therefore the BOA amplification is no
longer dominated by the BP but the 1st stokes.

92
Figure 5.2 Spectrum of Multiwavelength Brillouin Fiber Laser with even peak power.
Even peak power is generated, as shown in following figure 5.2. There are 9
peaks generated by maintaining the BP power at 12 dBm at a wavelength of 1310 nm
and BOA current at 400 mA. Between these 9 peaks, 4 peaks including the BP have
even peak power with fluctuation of less than 1dB. Moreover, this setup reduces the
effect of FWM due to low power of BP and Stokes entering the BOA. The growth of the
transmitted BP and the first 3 Stokes is shown in figure 5.3
Figure 5.3 Peaks powers of transmitted Brillouin and the first 4 stokes
The result shows that each Stokes has its own threshold BP power. The 1st
Stokes generated together with the transmitted BP as low as -5 dBm, and once the 1st
(a) (b)(a) (b)
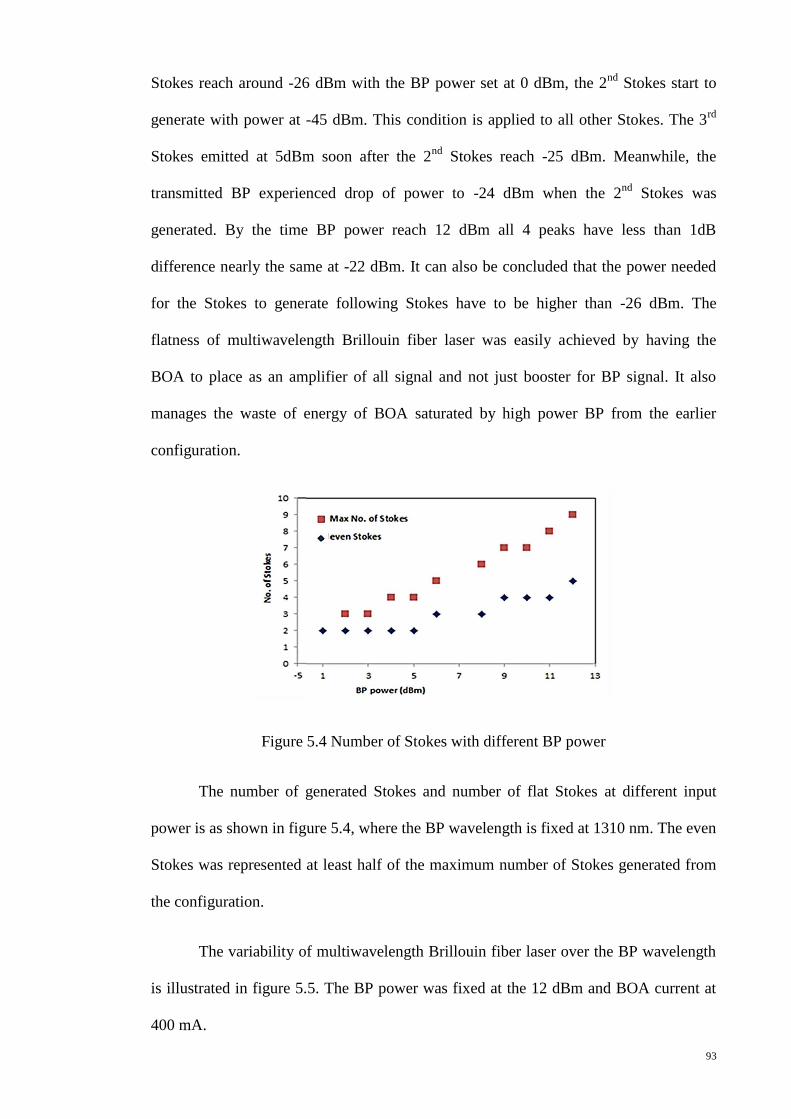
93
Stokes reach around -26 dBm with the BP power set at 0 dBm, the 2nd
Stokes start to
generate with power at -45 dBm. This condition is applied to all other Stokes. The 3rd
Stokes emitted at 5dBm soon after the 2nd
Stokes reach -25 dBm. Meanwhile, the
transmitted BP experienced drop of power to -24 dBm when the 2nd
Stokes was
generated. By the time BP power reach 12 dBm all 4 peaks have less than 1dB
difference nearly the same at -22 dBm. It can also be concluded that the power needed
for the Stokes to generate following Stokes have to be higher than -26 dBm. The
flatness of multiwavelength Brillouin fiber laser was easily achieved by having the
BOA to place as an amplifier of all signal and not just booster for BP signal. It also
manages the waste of energy of BOA saturated by high power BP from the earlier
configuration.
Figure 5.4 Number of Stokes with different BP power
The number of generated Stokes and number of flat Stokes at different input
power is as shown in figure 5.4, where the BP wavelength is fixed at 1310 nm. The even
Stokes was represented at least half of the maximum number of Stokes generated from
the configuration.
The variability of multiwavelength Brillouin fiber laser over the BP wavelength
is illustrated in figure 5.5. The BP power was fixed at the 12 dBm and BOA current at
400 mA.
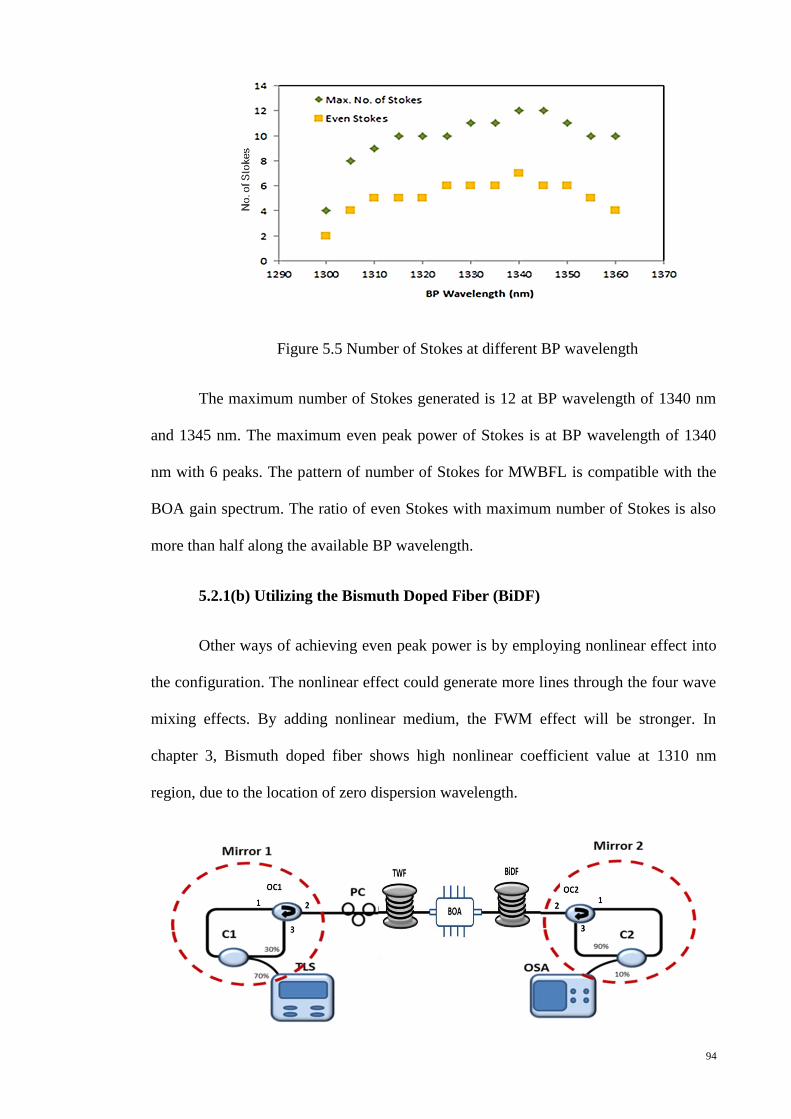
94
Figure 5.5 Number of Stokes at different BP wavelength
The maximum number of Stokes generated is 12 at BP wavelength of 1340 nm
and 1345 nm. The maximum even peak power of Stokes is at BP wavelength of 1340
nm with 6 peaks. The pattern of number of Stokes for MWBFL is compatible with the
BOA gain spectrum. The ratio of even Stokes with maximum number of Stokes is also
more than half along the available BP wavelength.
5.2.1(b) Utilizing the Bismuth Doped Fiber (BiDF)
Other ways of achieving even peak power is by employing nonlinear effect into
the configuration. The nonlinear effect could generate more lines through the four wave
mixing effects. By adding nonlinear medium, the FWM effect will be stronger. In
chapter 3, Bismuth doped fiber shows high nonlinear coefficient value at 1310 nm
region, due to the location of zero dispersion wavelength.

95
Figure 5.6 Multiwavelength Brillouin/BOA fiber laser with additional nonlinear
medium.
The BiDF was placed after the BOA as illustrated in figure 5.6. As in section
5.2.1(a), this experiment is repeated without changing any setup parameter, where the
BOA is driven by the same current with same BP power and all parameters are left
intact. The only difference is the 4m BiDF was placed after BOA to induce the FWM
effect. The BP generates Stokes at the TWF and then amplified by the BOA. Both of the
peaks then enter the BiDF which generates FWM which then emits new channels with
the same spacing. All the channels bounce inside the cavity and generate more new
signals. The spectrum of the multiwavelength Brillouin/BOA fiber laser with an
additional nonlinear medium is as shown in figure 5.7. The spectrum shows an increase
of anti-Stokes which are tagged as the 6th
and the 7th
Stokes and also the increasing of
the 5th
Stokes.
Figure 5.7 Multiwavelength Brillouin/BOA fiber laser with BiDF

96
All 7 peaks show even peak power in figure 5.8 with lower average peak power
of -32 dBm and the fluctuation less than 3 dB. Lower peak power resulted from the loss
contributed by the BiDF with amount of 4-5 dB/m.
Figure 5.8 Properties of peak power for multiwavelength Brillouin/BOA fiber laser with
BiDF
5.2.1(c) Multiple optical amplifiers
Other method of generating more channels and even peaks is by adding another
amplifier in the configuration. An extra amplifier not only increases channels and
flattening the peak power, but also it increases the peak power level. An amplifier that
suitable for this task is Raman fiber amplifier (RFA). The RFA can be added into the
setup by inserting a Raman Pump1250 nm in between TWF and BOA. No extra fiber
needed to create RFA as shown in figure 5.9.
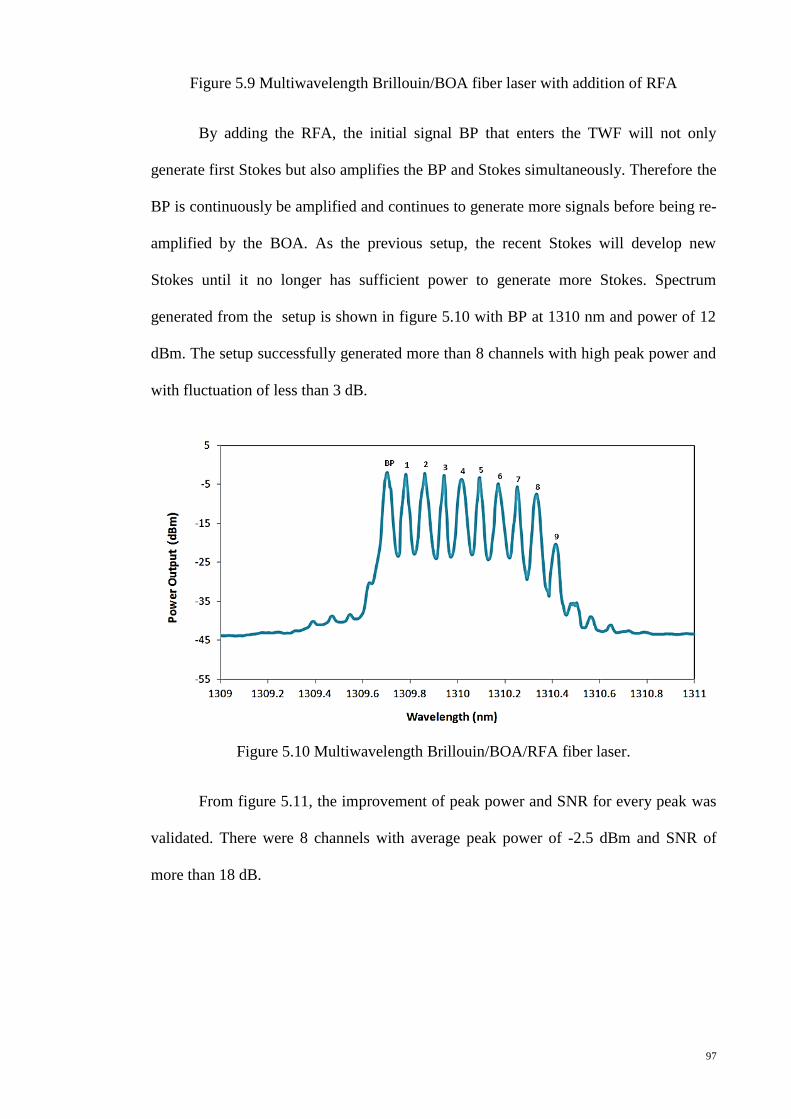
97
Figure 5.9 Multiwavelength Brillouin/BOA fiber laser with addition of RFA
By adding the RFA, the initial signal BP that enters the TWF will not only
generate first Stokes but also amplifies the BP and Stokes simultaneously. Therefore the
BP is continuously be amplified and continues to generate more signals before being re-
amplified by the BOA. As the previous setup, the recent Stokes will develop new
Stokes until it no longer has sufficient power to generate more Stokes. Spectrum
generated from the setup is shown in figure 5.10 with BP at 1310 nm and power of 12
dBm. The setup successfully generated more than 8 channels with high peak power and
with fluctuation of less than 3 dB.
Figure 5.10 Multiwavelength Brillouin/BOA/RFA fiber laser.
From figure 5.11, the improvement of peak power and SNR for every peak was
validated. There were 8 channels with average peak power of -2.5 dBm and SNR of
more than 18 dB.

98
Figure 5.11 Characteristic of multiwavelength Brillouin/BOA/RFA fiber laser (a) peak
power (b) SNR.
The combination of 2 amplifiers increased the variability along the BP
wavelength. According to figure 5.12, the number of even Stokes that is generated is
approximately 8 from 1311 nm to 1350 nm with highest number of even Stokes of 12 at
wavelength 1340 nm.
Figure 5.12 Number of Stokes through out O-band wavelength
Therefore, it could be concluded that generating a MWBFL is much more
effective by combining 2 amplifier or by increasing gain performance of BOA.
5.2.2 Design and characterization of varied channel spacing of MWBFL
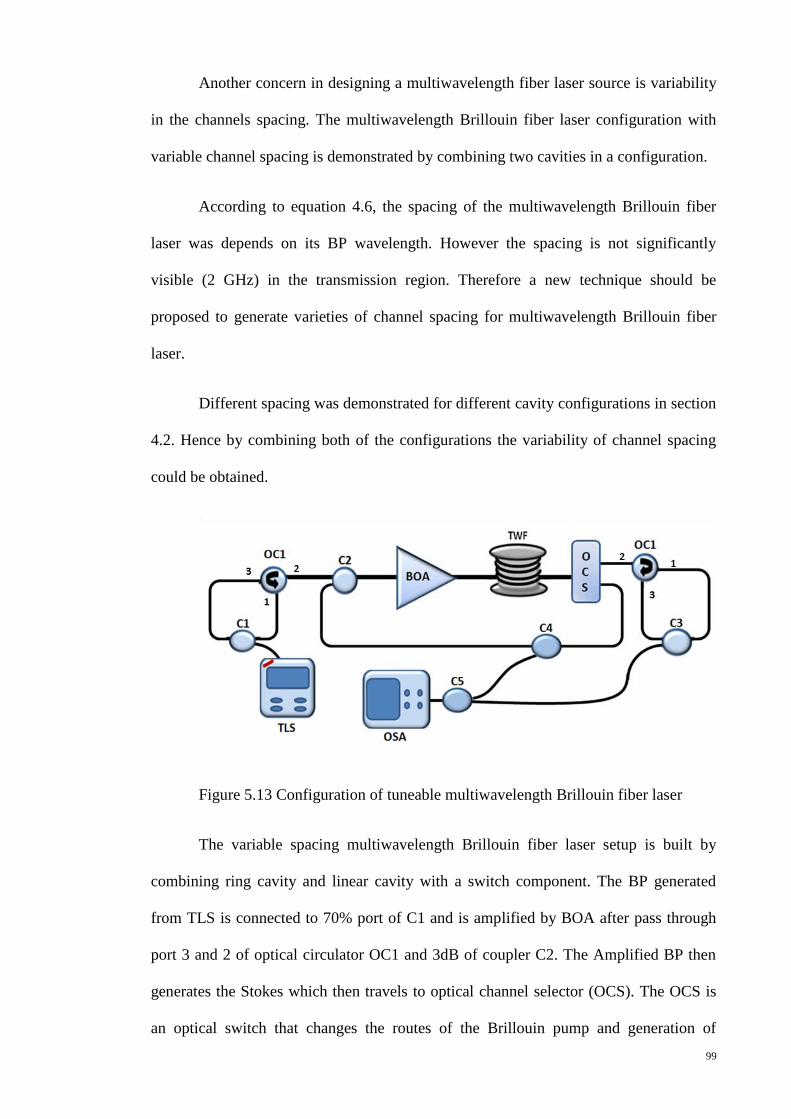
99
Another concern in designing a multiwavelength fiber laser source is variability
in the channels spacing. The multiwavelength Brillouin fiber laser configuration with
variable channel spacing is demonstrated by combining two cavities in a configuration.
According to equation 4.6, the spacing of the multiwavelength Brillouin fiber
laser was depends on its BP wavelength. However the spacing is not significantly
visible (2 GHz) in the transmission region. Therefore a new technique should be
proposed to generate varieties of channel spacing for multiwavelength Brillouin fiber
laser.
Different spacing was demonstrated for different cavity configurations in section
4.2. Hence by combining both of the configurations the variability of channel spacing
could be obtained.
Figure 5.13 Configuration of tuneable multiwavelength Brillouin fiber laser
The variable spacing multiwavelength Brillouin fiber laser setup is built by
combining ring cavity and linear cavity with a switch component. The BP generated
from TLS is connected to 70% port of C1 and is amplified by BOA after pass through
port 3 and 2 of optical circulator OC1 and 3dB of coupler C2. The Amplified BP then
generates the Stokes which then travels to optical channel selector (OCS). The OCS is
an optical switch that changes the routes of the Brillouin pump and generation of
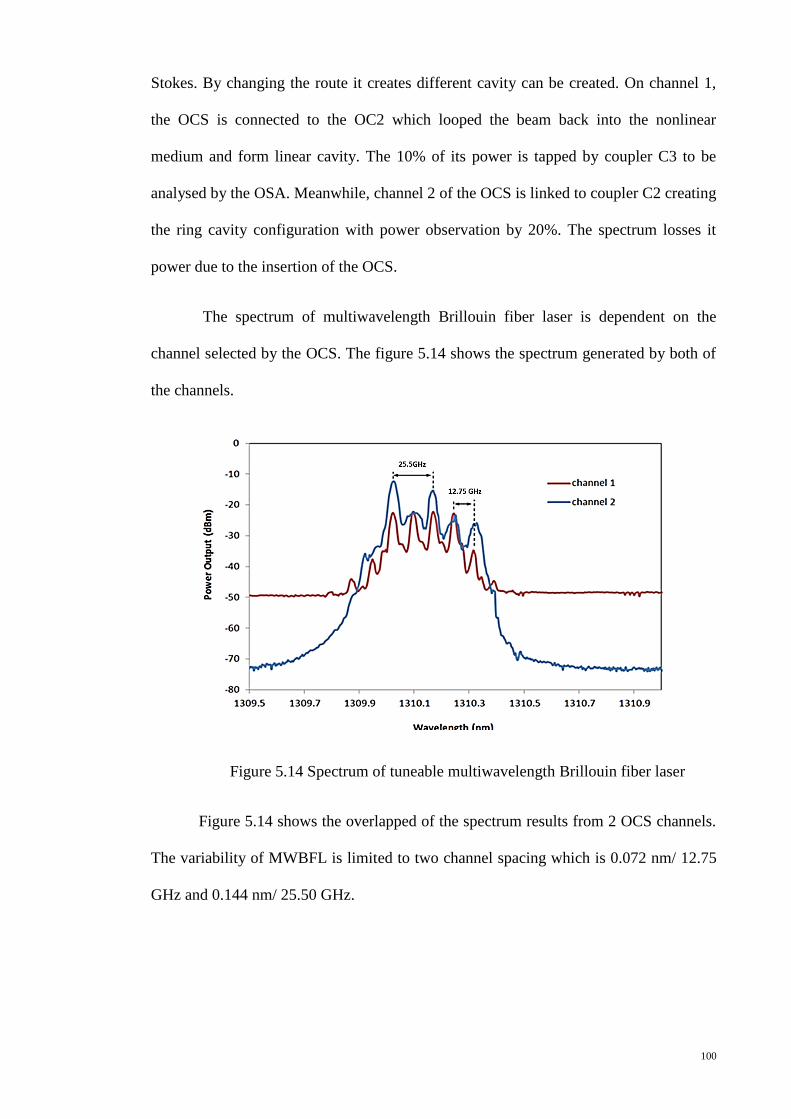
100
Stokes. By changing the route it creates different cavity can be created. On channel 1,
the OCS is connected to the OC2 which looped the beam back into the nonlinear
medium and form linear cavity. The 10% of its power is tapped by coupler C3 to be
analysed by the OSA. Meanwhile, channel 2 of the OCS is linked to coupler C2 creating
the ring cavity configuration with power observation by 20%. The spectrum losses it
power due to the insertion of the OCS.
The spectrum of multiwavelength Brillouin fiber laser is dependent on the
channel selected by the OCS. The figure 5.14 shows the spectrum generated by both of
the channels.
Figure 5.14 Spectrum of tuneable multiwavelength Brillouin fiber laser
Figure 5.14 shows the overlapped of the spectrum results from 2 OCS channels.
The variability of MWBFL is limited to two channel spacing which is 0.072 nm/ 12.75
GHz and 0.144 nm/ 25.50 GHz.

101
5.3 Improvement for O-band Multiwavelength fiber laser of Sagnac Loop
Mirror technique
5.3.1 Design and characterization of improved flatness of MWFL via SLM
Generation of even peak power of multiwavelength fiber laser by Sagnac Loop
Mirror (SLM) can be achieved by utilizing nonlinear effect which is by adding 4m
BiDF in the cavity. The BiDF was placed in between coupler and the PC. High
nonlinearity of BiDF generates four wave mixing effect that helps to improve the
quality of multiwavelength fiber laser (Cholan et al. 2012).
By maintaining the parameter from the previous setup of the multiwavelength
Fabry-Perot Interferometer fiber laser, the performance is as shown in figure 5.15. The
performance of the peak power is more stable. Meanwhile, number of channels above
power of -50 dBm has increased. The uniformity of peak power is shown in figure 5.16
by comparing the performance of 1m PMF with and without BiDF. The peaks powers
are stable with BiDF show stability at -17 dBm with fluctuation less than 3 dB.
Figure 5.15 Performance of multiwavelength fiber laser SLM with different spacing for
(a) 1m, (b) 2m, (c) 3m and (d) 4m
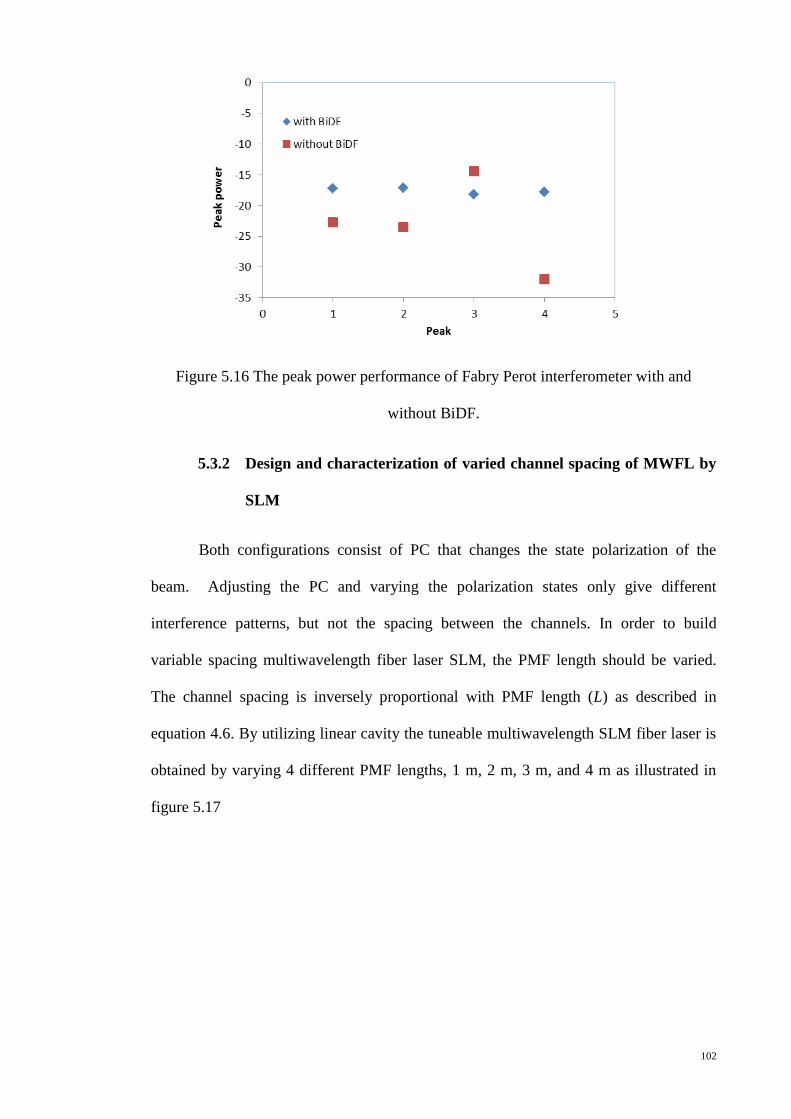
102
Figure 5.16 The peak power performance of Fabry Perot interferometer with and
without BiDF.
5.3.2 Design and characterization of varied channel spacing of MWFL by
SLM
Both configurations consist of PC that changes the state polarization of the
beam. Adjusting the PC and varying the polarization states only give different
interference patterns, but not the spacing between the channels. In order to build
variable spacing multiwavelength fiber laser SLM, the PMF length should be varied.
The channel spacing is inversely proportional with PMF length (L) as described in
equation 4.6. By utilizing linear cavity the tuneable multiwavelength SLM fiber laser is
obtained by varying 4 different PMF lengths, 1 m, 2 m, 3 m, and 4 m as illustrated in
figure 5.17
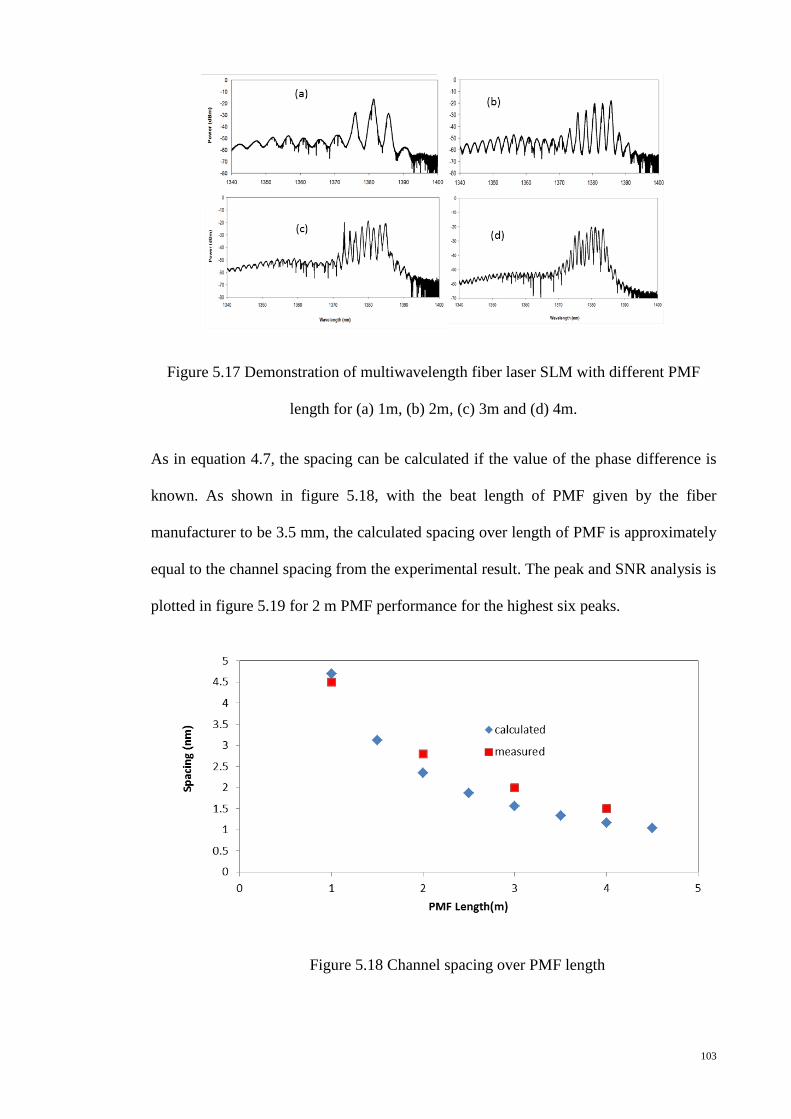
103
Figure 5.17 Demonstration of multiwavelength fiber laser SLM with different PMF
length for (a) 1m, (b) 2m, (c) 3m and (d) 4m.
As in equation 4.7, the spacing can be calculated if the value of the phase difference is
known. As shown in figure 5.18, with the beat length of PMF given by the fiber
manufacturer to be 3.5 mm, the calculated spacing over length of PMF is approximately
equal to the channel spacing from the experimental result. The peak and SNR analysis is
plotted in figure 5.19 for 2 m PMF performance for the highest six peaks.
Figure 5.18 Channel spacing over PMF length

104
Figure 5.19 Performance of (a) peak power and (b) SNR of multiwavelength fiber laser
SLM
The variability of multiwavelength fiber laser SLM was demonstrated but
unfortunately this technique required manual adjustment to the configuration. Direct
adjustment might interrupt its actual performance as multiwavelength fiber laser.
5.4 Improvement for O-band Multiwavelength fiber laser of Fabry Perot
Interferometer technique
5.4.1 Design and characterization of flatness of MWFL via Fabry Perot
Interferometer
In generating uniform peak power of the MWFL by FPI again utilizing the BiDF in the
configuration to induces the nonlinear effects. The BiDF was inserted before the BOA
to insure that the generated multiwavelength fiber laser FPI to be amplified first by the
BOA as illustrated in figure 5.20. The nonlinear BiDF was inserted between the mirror
and the BOA.
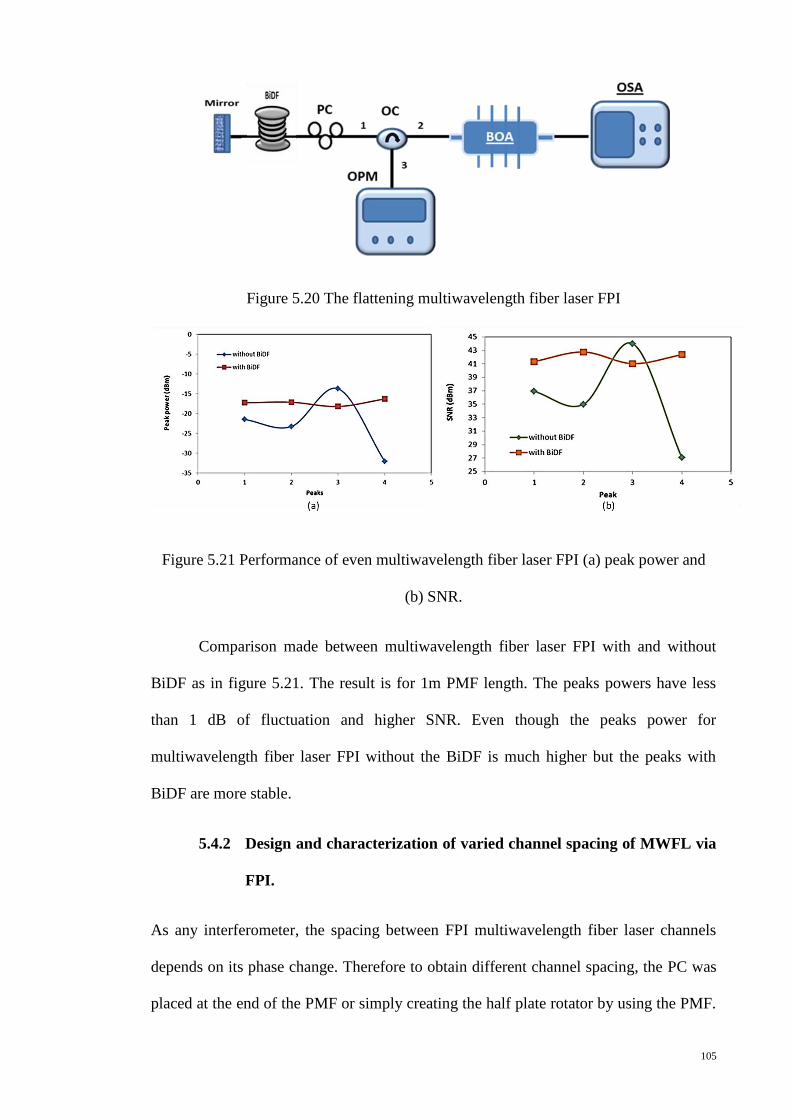
105
Figure 5.20 The flattening multiwavelength fiber laser FPI
Figure 5.21 Performance of even multiwavelength fiber laser FPI (a) peak power and
(b) SNR.
Comparison made between multiwavelength fiber laser FPI with and without
BiDF as in figure 5.21. The result is for 1m PMF length. The peaks powers have less
than 1 dB of fluctuation and higher SNR. Even though the peaks power for
multiwavelength fiber laser FPI without the BiDF is much higher but the peaks with
BiDF are more stable.
5.4.2 Design and characterization of varied channel spacing of MWFL via
FPI.
As any interferometer, the spacing between FPI multiwavelength fiber laser channels
depends on its phase change. Therefore to obtain different channel spacing, the PC was
placed at the end of the PMF or simply creating the half plate rotator by using the PMF.

106
By placing the PC at the end of the PMF, the beam from the Fresnel reflection will have
different polarization state which resulted in change of channel spacing. Phase
difference change simultaneously with the change of polarization state therefore,
different channels spacing produce.
Figure 5.22 The configuration of the multiwavelength fiber laser FPI with even peaks
power.
The 4 m PMF is used in these demonstration due to its performance on
producing the smallest spacing. The spacing channel was successfully varied from 5.0
nm to 1.25 nm around the region of 1350 nm to 1370 nm as shown in figure 5.23. This
technique is non-invasive and cost effective where changes were only made without
changing the PMF length physically.
Figure 5.23 Multiwavelength fiber laser FPI with varied channel spacing

107
Chapter 6 Conclusion and Future Works
6.1 Thesis Summary
The demonstration and findings of the research work are summarized and
discuss in this chapter. The works focused on the research on the multiwavelength O–
band fiber laser for the WDM use. These research works are necessary to cater the
exponential growth in the transmission capacity. In order to overcome the issue, the
transmission window must be expanded from C-band to O-band.
The research works start with the characterization of the O-band optical
amplifier. The optical amplifier is a crucial component to generate the multiwavelength
fiber laser and also help to boost up the power of generated signals. There are 3 types of
optical amplifier tested in this work. The first optical amplifier tested is Bismuth doped
fiber laser (Bi-DF) that could amplify throughout the entire available transmission
windows. The ASE of BiDF cover wide range of transmission window, unfortunately
the gain generated from this amplifier is very low which is around ~2 dB. The BiDF
also measured for its nonlinearity effects. The next optical amplifier that was tested is
the nonlinear effect which called Raman fiber amplifier (RFA) where its performance
depends on the gain medium used. Another type of optical amplifier is the
semiconductor amplifier that provides the highest performance among all three types.
Therefore semiconductor optical amplifier is selected for the generation of
multiwavelength fiber laser setup.
The optical amplifier is a vital component in communication systems.
Conventionally the optical amplifier only used to amplify signal. However the
development in laser and optical fiber industries provides more capabilities to the
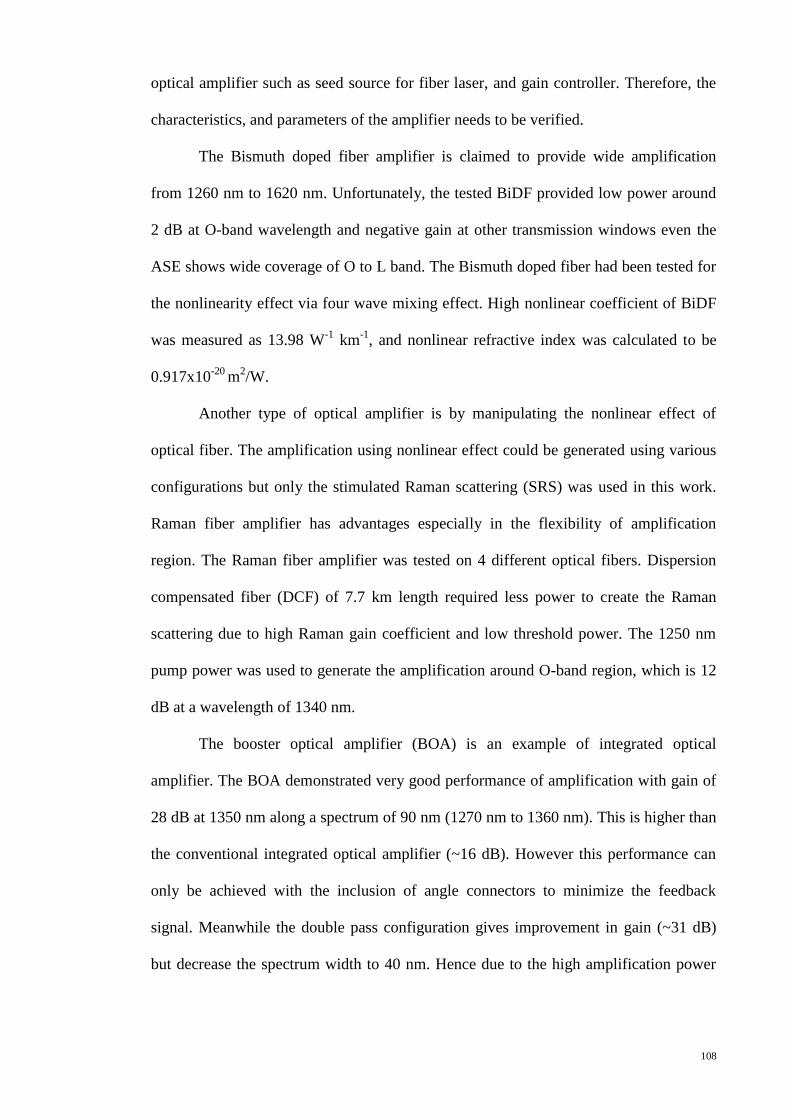
108
optical amplifier such as seed source for fiber laser, and gain controller. Therefore, the
characteristics, and parameters of the amplifier needs to be verified.
The Bismuth doped fiber amplifier is claimed to provide wide amplification
from 1260 nm to 1620 nm. Unfortunately, the tested BiDF provided low power around
2 dB at O-band wavelength and negative gain at other transmission windows even the
ASE shows wide coverage of O to L band. The Bismuth doped fiber had been tested for
the nonlinearity effect via four wave mixing effect. High nonlinear coefficient of BiDF
was measured as 13.98 W-1
km-1
, and nonlinear refractive index was calculated to be
0.917x10⁻²⁰
m2/W.
Another type of optical amplifier is by manipulating the nonlinear effect of
optical fiber. The amplification using nonlinear effect could be generated using various
configurations but only the stimulated Raman scattering (SRS) was used in this work.
Raman fiber amplifier has advantages especially in the flexibility of amplification
region. The Raman fiber amplifier was tested on 4 different optical fibers. Dispersion
compensated fiber (DCF) of 7.7 km length required less power to create the Raman
scattering due to high Raman gain coefficient and low threshold power. The 1250 nm
pump power was used to generate the amplification around O-band region, which is 12
dB at a wavelength of 1340 nm.
The booster optical amplifier (BOA) is an example of integrated optical
amplifier. The BOA demonstrated very good performance of amplification with gain of
28 dB at 1350 nm along a spectrum of 90 nm (1270 nm to 1360 nm). This is higher than
the conventional integrated optical amplifier (~16 dB). However this performance can
only be achieved with the inclusion of angle connectors to minimize the feedback
signal. Meanwhile the double pass configuration gives improvement in gain (~31 dB)
but decrease the spectrum width to 40 nm. Hence due to the high amplification power

109
provided by the BOA, the multiwavelength fiber laser was demonstrated using the BOA
as the optical amplifier and as seed source.
The multiwavelength fiber laser had been demonstrated by 3 different
techniques; Brillouin scattering effect, Sagnac Loop mirror and Fabry Perot
Interferometer. The multiwavelength Brillouin fiber laser (MBFL) will be generated
whenever the incident source or Brillouin pump power equals or exceed its Brillouin
threshold. The Brillouin threshold was measured for different types of fiber and shows
that the 20 km True Wave Reach fiber (TWF) required lowest power to generate the
Brillouin effect of 5.2 dBm. The Brillouin threshold studies was also extended by
comparing the Brillouin threshold for O and C band, which shows that the O-band has
small Brillouin threshold compared to C band. The MBFL was generated from 2 cavity
setup, namely ring and linear cavity configurations. Both cavities generate 4 Stokes
channels but linear cavity provides much higher peak power and narrower spacing
between channels which is ~0 dBm and 12.5 GHz respectively. By inserting the BOA
into the multiple pass configuration the channels peaks power lowered to -20 dBm but
adds 3 anti-Stokes channels into the linear spectrum. The multiwavelength fiber laser
utilizing the Sagnac loop mirror (SLM) also demonstrated in 2 pattern of cavity, and
shows better performance from linear cavity where the number of channels generated
are 16 with even peak power of -20 dBm. Meanwhile another multiwavelength fiber
laser generated from basic interferometer technique is the Fabry Perot Interferometer
(FPI). The FPI was demonstrated using the end face reflector. The channel spacing was
twice the value generated from multiwavelength fiber laser of SLM for same length of
gain medium.
The improvements of the multiwavelength fiber laser were also demonstrated.
The improvements include the flatness of peak power and varying channel spacings.
The peaks power of multiwavelength Brillouin fiber laser was levelled by utilizing three
110
different techniques, which are relocating the optical amplifier, utilizing the BiDF, and
adding an extra amplifier. Locating the BOA after the nonlinear medium reduced the
effect of FWM and enables the Stokes to be amplified when the BOA is not saturated
with the BP signal. Then another nonlinear effect is applied by adding the 4m BiDF.
The even peak power obtained was the result of the four waves mixing effect generated
in the BiDF. Another proposed technique is by adding additional RFA, which
minimizes the absorption loss of the TWF fiber and also amplified the generated signals
all in one fiber. The improvements of levelling the peaks power of multiwavelength
fiber laser using Sagnac Loop Mirror and Fabry Perot Interferometer were demonstrated
by utilizing the BiDF techniques. The BiDF was placed before the BOA to ensure that
the powers of the generated signals are amplified to generate FWM effect.
Due to the various applications, which required different specific spacing, the
multiwavelength fiber laser should be able to vary its channels spacing. The spacing of
multiwavelength Brillouin fiber laser could be changed between 12.5 GHz to 25 GHz,
by combining two cavities into one configuration with an optical switch included to
adjust the spacing. Meanwhile for multiwavelength fiber laser that use interferometer
technique, the change of phase is important to vary the multiwavelength fiber laser
spacing. The change of phase for Sagnac loop mirror was obtained by changing the
length of PMF. Utilizing 1 m, 2 m, 3 m and 4 m PMF length the channel spacing varied
from 0.8 nm to 4.5 nm. As for the Fabry Perot Interferometer, the channel spacing was
varied by inserting the PC at the fiber end to change its phase. The spacing varied from
5.0 nm to 1.25 nm around the region of 1350 nm to 1370 nm by utilizing the 4 m PMF.
6.2 Future Works
The mutiwavelength fiber laser in O-band have demonstrated in this thesis work
could be futher improved in few ways including;

111
Expanding the transmission capacity
The extension of the research work of the multiwavelength fiber laser with
conbination of all available tranmission windows to study the effectiveness of
transmitting signals in multiple communication bands simultaneously. The combination
might required numerous components combinations to producing the multiwavelength
fiber laser for each windows. This increase the complexity of the configuration and the
maintance. Therefore, further study should be undertake to propose new components
that are compatible to all transmission windows. The example is by usingBismuth
doped fiber. Detailed analysis should be made to overcome the Bismuth doped fiber
problem, where there is still no sign of successful broad optical amplifier, BiDF at the
moment.
Commercialization the O-band transmission window
Since the thesis only proposed the techniques of generating multiwavelength in
O-band, a complete system that uses this multiwavelength fiber laser could be further
investigated. Furthe research of should be include to utilize the proposed
multiwavelength fiber laser in the CWDM or DWDM transmission system. This study
includes the data test such as eye diagrams, jitter performance, BER tests, and optical
modulation analysis.

112

cxiii
References
1. K.C. Kao and G.A. Hockham, “Dielectric-Fibre Surface Waveguides for optical
frequencies” Proc. IEEE. 113(3), 1151-1158 (1966).
2. T. Miya, Y. Terunuma, T. Hosaka, and T. Miyashita,” Ultimate low-loss single-
mode fiber at 1.55 μm” Electron. Lett. 15, 106-108 (1979)
3. D. Gloge “Weakly guiding fibers” Appl. Opt. 10, 2252-2258 (1971)
4. H. Huang, “ Microwave approach to highly-irregular fiber optics” Wiley, New
York (1998)
5. K. Inoue, H. Toba, “Wavelength conversion experiment using fiber four-wave
mixing”, IEEE Photon. Technol. Lett. 14 (1) pp. 69-72 (1992).
6. D. Hillerkuss, R. Schmogrow, T. Schellinger, M. Jordan, “26Tb/s line rate
super channel transmission utilizing all optical fast Fourier transform processing”
Nature Photonics, 5, pp. 356-371 (2011)
7. Tadashi Kasamatsu, Yutaka Yano, and Takashi Ono, “1.49-µm -Band Gain-
Shifted Thulium-Doped Fiber Amplifier for WDM Transmission Systems” ,
Journal of Lightwave Technology, Vol. 20, Issue 10, pp. 1826-1829 (2002)
8. E. Desurvire, J.R. Simpson and P.C. Becker, “High-gain erbium-doped traveling-
wave fiber amplifier” Optics letters, 12, (11), (1987)
9. T. Yamamoto, M. Nakazawa, “Highly efficient four-wave mixing in an optical
fiber with intensity dependent phase matching” , IEEE Photon. Technol. Lett. 9
(3), 327-329 (1997).
10. M. R. Shirazi, N. S. Shahabuddin, S. N. Aziz, K. Thambiratnam, S. W.
Harun, and H. Ahmad, “A linear cavity Brillouin fiber laser with multiple
wavelengths output”, Laser Phys. Lett. 5(5), 361-365 (2008).
cxiv
11. M. R. Shirazi, S. W. Harun, M. Biglary, and H. Ahmad, “Linear cavity Brillouin
fiber laser with improved characteristics” Opt. Lett. 33(8), 770-772 (2008).
12. S. Song, C.T. Allen, K.R. Demarest, R. Hui, “Intensity-Dependent Phase-
Matching Effects on Four-Wave Mixing in Optical Fibers”, J. Lightwave Technol.
17 (11), 2285-2289 (1999)
13. H. Chen, “Simultaneous measurements of non-linear coefficient, zero-dispersion
wavelength and chromatic dispersion in dispersion-shifted fibers by four wave
mixing”, Optics Communications 220 (2003) 331-335.
14. M.L.F. Mollenauer, P.V. Mamyshev, M.J. Nuebelt, “Method for facile and
accurate measurement of optical fiber dispersion maps”Opt. Lett. 21(21), 1724-
1726 (1996).
15. C. Vinegoni, H. Chen, M. Leblanc, G. Schinn, M. Wegmuller, N. Gisin,
“Distributed measurements of chromatic dispertion and non-linear coefficient in
DSF fiber with non-negligible values of PMD”, Paper WA5, OFC_2002,
Anaheim,CA, USA.
16. IEEE Journal Of Selected Topics In Quantum Electronics, Vol. 15, No. 2,
March/April 2009 415 Novel Multiwavelength L-Band Brillouin–Erbium Fiber
Laser Utilizing Double-Pass Brillouin Pump Preamplified Technique Mohammed
Hayder Al-Mansoori, Mohd Adzir Mahdi, and Malin Premaratne
17. H. Ahmad , n. S. Shahabuddin, s. S. W. Harun” Multi-Wavelength Source Based
On SOA And Loop Mirror” Optoelectronics And Advanced Materials – Rapid
Communications, 3(1) 1 – 3 (2009)
18. H. Ahmad, S. F. Norizan, M. Z. Zulkifli & S. W. Harun “Dual-Wavelength
Erbium Fiber Laser In A Simple Ring Cavity” Fiber And Integrated Optics, 28(6),
430-439 (2009)

cxv
19. D.N. Wang, F.W. Tong , Xiaohui Fang, W. Jin,P.K.A. Wai, J.M. Gong,“
Multiwavelength Erbium-Doped fiber Ring Laser Sourcewith A Hybrid Gain
Medium” Optics Communications 228, 295–301 (2003)
20. M. Naftaly, A. Jha, "Nd3+
-Doped Fluoroaluminate Glasses For A 1.3 µm
Amplifier," Journal Of Applied Physics , 87(5),2098-2104, (2000)
21. Yasutake Ohishi, Terutoshi Kanamori, Takeshi Kitagawa, Shiro Takahashi, Elias
Snitzer, And George H. Sigel, Jr. , “Pr3+
-Doped Fluoride Fiber Amplifier
Operating At 1.31 µm” Optics Letters, 16(22),1747-1749 (1991)
20. M. Dianov, D. G. Fursa, A. A. Abramov, M. I. Belovolov, M. M. Bubnov, A. V.
Shipulin, A. M. Prokhorov, G. G. Devyatykh, A. N. Gur'yanov and V. F. Khopin
“Raman Fibre-Optic Amplifier Of Signals At The Wavelength Of 1.3 µm”
Quantum Electronics, 24(9) 749-751, (1994)
21. A. Assadihaghi, H. Teimoori, R. Millett, A. Benhsaien, V. Tolstikhin, T. Hall, K.
Hinzer, "O-Band Semiconductor Optical Amplifier Design For CWDM
Applications," presented at Microsystems and Nanoelectronics Research
Conference, 89-92,(2008)
22. Fujimoto, Y., Matsubara, H. ,Nakatsuka, M., "New Fluorescence From Bi-Doped
Silica Glass And Its 1.3-Μm Emission With 0.8-Μm Excitation For Fiber
Amplifier," The 4th Pacific Rim Conference On Lasers And Electro-Optics,
2001. CLEO/Pacific Rim 2001., 2, 462-463(2001)
23. X. S. Cheng, R. Parvizi, H. Ahmad, S. W. Harun “Wide-Band Bismuth-Based
Erbium-Doped Fiber Amplifier With a Flat-Gain Characteristic”, IEEE Photonics
Journal, 1(5) (2009)
cxvi
24. Ju Han Lee, Tatsuo Nagashima, Tomoharu Hasegawa, Seiki Ohara, Naoki
Sugimoto, and Kazuro Kikuchi, “Bismuth-Oxide-Based Nonlinear Fiber With a
High SBS Threshold and Its Application to Four-Wave-Mixing Wavelength
Conversion Using a Pure Continuous-Wave Pump”, Journal of Lightwave
Technology, 24(1), 22-25(2006)
25. Sugimoto, N.; Nagashima, T.; Hasegawa, T.; Ohara, S. , "Bismuth-based optical
fiber with nonlinear coefficient of 1360 W/sup -1/ km/sup -1/," Optical Fiber
Communication Conference, 2004. OFC 2004 , vol.2, no., pp.3 pp. vol.2, 23-27
Feb.
26. Yasushi Fujimoto and Masahiro Nakatsuka 2001 Jpn. J. Appl. Phys. 40 L279
doi:10.1143/JJAP.40.L279Infrared Luminescence from Bismuth-Doped Silica
Glass
27. F. G. Omenetto, N. A. Wolchover, M. R. Wehner, M. Ross, A. Efimov, A. J.
Taylor, V. V. R. K. Kumar, A. K. George, J. C. Knight, N. Y. Joly, and P. St. J.
Russell, “Spectrally smooth supercontinuum from 350 nm to 3 μm in sub-
centimeter lengths of soft-glass photonic crystal fibers,” Optics Express Vol. 14,
pp. 4928-4934, 2006.
28. Seongwoo Yoo, Mridu P. Kalita, Johan Nilsson, And Jayanta Sahu, “Excited State
Absorption Measurement In The 900–1250 Nm Wavelength Range For Bismuth-
Doped Silicate Fibers”, Optics Letters / Vol. 34, No. 4 / February 15, 2009
29. Young-Seok Seo, Changwan Lim, Yasushi Fujimoto, And Masahiro Nakatsuka,
9.6 Db Gain At A 1310nm Wavelength For A Bismuth-Doped Fiber Amplifier,
Journal Of Optical Society Of Korea, Vol. 11, No. 2, June 2007, Pp. 63-66.

cxvii
30. J. B. Rosolem, A. A. Juriollo, R. Arradi, A. D. Coral, J. C. R. F. Oliveira, And
Murilo A. Romero, “All Silica S-Band Double-Pass Erbium-Doped Fiber
Amplifier,” IEEE Photonics Technology Letters, Vol. 17, No. 7, July 2005 1399
31. S. Nishi, K. Ainda, And K. Nakagawa, “Highly Efficient Configuration Of
Erbium Doped Fiber Amplifier,” In Eur. Congress Optical Communication
(ECOC), Vol. 1, Amsterdam, The Netherlands, 1990, Pp. 99–102.
32. S. W. Harun, N. Tamchek, P. Poopalan, And H. Ahmad, “Double-Pass L-Band
EDFA With Enhanced Noise Figure Characteristics,” IEEE Photon. Technol.
Lett., Vol. 15, No. 8, Pp. 1055–1057, Aug. 2003.
33. S. Aozasa, H. Masuda, T. Sakamoto, K. Shikano, And M. Shimizu, “Gain Shifted
TDFA Employing High Concentration Doping Technique With High Internal
Power Conversion Efficiency De 70%,” Electron. Lett., Vol. 38, No. 8, Pp. 3612–
3613, Apr. 2002.
34. Mridu P. Kalita, Seongwoo Yoo, And Jayanta K. Sahu, "Influence Of Cooling On
A Bismuth-Doped Fiber Laser And Amplifier Performance," Appl. Opt. 48, G83-
G87 (2009)
35. Hasegawa, T.; Nagashima, T.; Ohara, S.; Sugimoto, N., "High Nonlinearity
Bismuth Fibers And Their Applications," Optical Fiber Communication
Conference, 2006 And The 2006 National Fiber Optic Engineers Conference.
OFC 2006 Vol., No., Pp.3 Pp., 5-10 March 2006.
36. M.L.F. Mollenauer, P.V. Mamyshev, M.J. Nuebelt, Opt. Lett. 21 (1996) 1724.
37. Zhao, Yu; Jin, Yongxing; Wang, Jianfeng; , "Measurement Of The Raman Gain
Coefficient In Optical Fibers By Using The Spontaneous Technique," Photonics

cxviii
And Optoelectronic (SOPO), 2010 Symposium On , Vol., No., Pp.1-3, 19-21 June
2010
38. L. Talaverano, S. Abad, S. Jarabo, and M. López Amo, “Multiwavelength fiber
laser sources with Bragg-grating sensor multiplexing capability” J. Lightwave
Technol. 19, 553-558 (2001).
39. Z. Sun, D. Liu, H. Liu, and Q. Sun, “ The Design of SOA-based
Multiwavelength Fiber Ring Laser for Fiber Sensing”, Network Comp. Inform.
Sci. 3, 41 (2010).
40. L. Denizman, T. Koktay, M. Hack, and T. Eker, “Multi-wavelength
spectroscopy of the stable shell star HD 193182”Astrophys. Space Sci. 208(1),
135-151 (1993).
41. M. Yumoto, Y. Maeda, N. Saito, T. Ogawa, M. Yamashita, and S. Wada,
“Multi-Wavelength Spectroscopic Application Using Rapid and Random
Wavelength-Tuned Mid-Infrared Light Source” Jpn. J. Appl. Phys. 49, 010209
(2010).
42. Y. S. Hurh, G. S. Hwang, J. Y. Jeon, K. G. Lee, K. W. Shin, S. S. Lee, K.
Y. Yi, and J. S. Lee, IEEE Photon. Technol. Lett. 17, 696 (2005).
43. Peng-Chun Peng, Hong-Yih Tseng, and Sien Chi A Tuneable Dual-Wavelength
Erbium-Doped Fiber Ring Laser Using a Self-Seeded Fabry–Pérot Laser Diode
IEEE Photonics Technology Letters, 15(5), 61-663 (2003)
44. Chun-Liu Zhao, Shiquan Yang, Hongyun Meng, Zhaohui Li, Shuzhong Yuan,
45. Kai Guiyun, Xiaoyi Dong Efficient multi-wavelength fiber laser operating in L-
band Optics Communications 204 (2002) 323–326

cxix
46. Zulkifli MZ1, Ahmad H, Taib JM, Muhammad FD, Dimyati K, Harun SW. “S-
band multiwavelength Brillouin/Raman distributed Bragg reflector fiber lasers”,
Optics Communications 52 (2013) 3753-3756
47. R. W. Tkach, A. R. Chraplyvy, R. M. Derosier, “Performance of
WDM network based on stimulated Brillouin scattering,” IEEE
Photon. Technol. Lett. 1, 111–113 (1989)
48. D. Chen, ”Stable multi-wavelength erbium-doped fiber laser based on a photonic
crystal fiber Sagnac loop filter” Laser Phys. Lett., 4(6), 437-439 (2007).
49. C. H. Yeh, F. Y. Shih, C. T. Chen, C. N. Lee, and S. Chi, “Multiwavelength
erbium fiber ring laser using Sagnac loop and Fabry-Perot laser diode” Laser
Phys. Lett. 5, 210-212 (2008).
50. H. Ahmad, S. F. Norizan, M. Z. Zulkifli, and S. W. Harun, Fiber
Integrat. Opt. 28, 430 (2009).
51. Z. Y. Liu, Y. G. Liu, J. B. Du, S. Z. Yuan, and X. Y. Dong, “Channel-
spacing and wavelength switchable multiwavelength erbium-doped fiber laser
using sampled Hi-Bi fiber grating and photonic crystal fiber loop mirror ”Laser
Phys. Lett. 5, 122-125 (2008).
52. A. Latif, M. Z. Zulkifli, N. A. Hassan, S. W. Harun, Z. A. Ghani, and H.
Ahmad, “ A compact O-plus C-band switchable quad-wavelength fiber laser
using arrayed waveguide grating” Laser Phys. Lett. 7, 597-602 (2010).
53. L. Zhan, J. H. Ji, J. Xia, S. Y. Luo, and Y. X. Xia, Opt. Express. 14, 519 (2006).
54. Z. Zhu, D. J. Gauthier, Y. Okawachi, J. E. Sharping, A. L. Gaeta, R. W. Boyd,
and A. E. Willner, J. Opt. Soc. Am. B 22, 2378 (2005).
55. A. A. Bakar, M. H. Al Mansoori, M. A. Mahdi, M. S. Zainal Abidin, and M.
A. Mohd Azau, “ Fiber break location technique utilizing stimulated Brillouin
scattering effects in optical fiber ” Laser Phys. Lett. 6, 59-62 (2009).

cxx
56. M. H. Al Mansoori, M. K. Abd Rahman, F. R. Mahamd Adikan, and M. A.
Mahdi, “Widely tuneable linear cavity multiwavelength Brillouin-Erbium fiber
laser”, Opt. Express 13, 3471-3476 (2005).
57. M. R. Shirazi, N. S. Shahabuddin, S. N. Aziz, K. Thambiratnam, S. W.
Harun, and H. Ahmad, “A linear cavity Brillouin fiber laser with multiple
wavelengths output”, Laser Phys. Lett. 5, 361-363 (2008).
58. S. W. Harun, S. D. Emami, F. Abd Rahman, S. Z. Muhd Yassin, M. K.
Abd Rahman, and H. Ahmad, “Multiwavelength Brillouin/Erbium-Ytterbium
fiber laser”,Laser Phys. Lett. 4, 601-603 (2007).
59. M. R. Shirazi, S. W. Harun, M. Biglary, and H. Ahmad, “Linear cavity Brillouin
fiber laser with improved characteristics” Opt. Lett. 33, 770-772 (2008).
60. M. H. Al Mansoori and M. A. Mahdi, “Multiwavelength L-Band Brillouin–
Erbium Comb Fiber Laser Utilizing Nonlinear Amplifying Loop Mirror”J.
Lightwave Technol. 27(22), 5038-5044 (2009).
61. M. H. Al Mansoori, M. A. Mahdi, and A. K. Zamzuri, “Tuneable
multiwavelength Brillouin-Erbium fiber laser with intra-cavity pre-amplified
Brillouin pump” Laser Phys. Lett. 5, 139 (2008).
62. M. H. Al Mansoori, A. W. Naji, S. J. Iqbal, M. K. Ab dullah, and M. A.
Mahdi, “L-band Brillouin-Erbium fiber laser pumped with 1480 nm pumping
scheme in a linear cavity”, Laser Phys. Lett. 4, 371-375 (2007).
63. P. Bayvel and P. M. Radmore, Elect. Lett. 7, 434 (1990).
64. T. Shimizu, K. Nakajima, K. Shiraki, K. Ieda, and I. Sankawa, “Evaluation
methods and requirements for the stimulated Brillouin scattering threshold in a
single-mode fiber”, Opt. Fiber Technol. 14, 10-15 (2008).
65. G. P. Agrawal, Nonlinear Fiber Optics, 2nd ed. (Academic, San Diego, 1995),
p. 356.
cxxi
66. Venkataraayan, K.; Askraba, S.; Alameh, K.E.; Smith, C.L., "Optical-Cavity-
Based Multiwavelength Sensor for Spectral Discrimination and Object Position
Detection," Lightwave Technology 29(16), pp. 2365-2371, ( 2011)
67. B. H. Lee, Y. H. Kim, K. S. Park, J. B. Eom, M. J. Kim, B. S. Rho, H. Y. Choi
“Interferometric fiber optic sensors”, Sensors, 12(3), pp. 2467-2486 (2012)
68. Bunch, Bryan H; Hellemans, Alexander “The History of Science and
Technology”, Houghton Mifflin Harcourt. pp. 695. (April 2004).
69. Chun Jiang “Modelling a Broadband Bismuth-Doped Fiber Amplifier”, IEEE
Journal Of Selected Topics In Quantum Electronics, Vol. 15, No. 1, pp. 79 (Feb
2009)
70. Mrinmay P; Somanath B; Palas B; Rimlee D; Paul M.C; Rajan s; Kamal D;
Bhadra S.K. “ Study of gain flatness for multi-channel amplification in single
stage EDFA for WDM applications” Optics Quantum Electronics 39 pp. 1231-
1243 (2007)
71. Nusinsky I and Amos A. Hardy “Multichannel Amplification in Strongly Pumped
EDFAs” Journal of Lightwave Technology, 22, No. 8, pp. 1946 (Aug 2004)
72. Gumenyuk R.; Golant K.; Okhotnikov O.G. “ Energy transition characterization
of 1.18 and 1.3 µm bands of Bismuth fiber by spectroscopy of the transient
oscillations” Applied Physic Letter 98, No. 19 pp. 191108 (2011)
73. D.W. Stowe, D. R. Moore, and R. G. Priest, “Polarization fading in fiber
interferometric sensors,” IEEE J. Quantum Electron., QE-18, pp. 626-665 (1982).
74. Lipson, S.G.; Lipson, H.; Tannhauser, D.S. (1995). Optical Physics (3rd ed.).
London: Cambridge U.P. pp. 248
75. M . Gospodinov , P . Sveshtarov , N . Petkov , T . Milenov , V . Tassev , and A .
Nikolov , ‘‘Growth of Large Crystals of Bismuth-Germanium Oxide and Their
Physical Properties , ’’ Bulgarian J . Phys . 16 : 520 – 522 (1989) .

cxxii
76. A. Cholan, M. H. Al-Mansoori, A. S. M. Noor, A. Ismail and M. A. Mahdi
“Flattening effect of four wave mixing on multiwavelength Brillouin-erbium fiber
laser”, Appl. Phys. B, pp. 112-215 (2013)
List of Publications
Publications related to the thesis title:
1. H. Ahmad, S. F. Norizan, M. Z. Zulkifli, Z. A. Ghani and S. W. Harun,
Operation of Brillouin fiber laser in the O-band region as compared to that
in the C-band region, Laser Physics, Vol. 21, No. 1, pp. 1-5 2011.
2. H. Ahmad, S. F. Norizan, M. Z. Zulkifli, C. H. Pua, Z. A. Ghani and S. W.
Harun, Investigation of O-band Brillouin Fiber Laser Flatness at Different
SOA Location, Journal of Modern Optics, Vol. 58. No.7, pp.580-586 2011
3. S. F.Norizan, W. Y. Chong, S. W. Harun, H. Ahmad, O-Band Bismuth-
Doped Fiber Amplifier With Double-Pass Configuration, IEEE Photonics
Technology Letters Vol. 23 Issue 24 pp. 1860-1862 (2011)
4. H. Ahmad, S. F. Norizan, N.A. Awang , Tunable Microwave Photonic
Frequencies Generation Based on Stimulated Brillouin Scattering
Operating in the L-Band Region, Microwave and Optical Technology
Letters Vol.53, Issue 8, pp. 1710-1713 (2011)
Other publications:
1. H. Ahmad, S. F. Norizan, M. Z. Zulkifli, S. W. Harun, Dual-Wavelength
Erbium Fiber Laser in a Simple Ring Cavity, Fiber and Integrated Optics,
Vol. 28, Issue 6 pp. 430 – 439, 2009
cxxiii
2. H. Ahmad, M. Z. Zulkifli, S. F. Norizan, and A. A. Latif, Controllable
Wavelength Channels for Multiwavelength Brillouin Bismuth/Erbium
Based Fiber Laser, Progress In Electromagnetics Research Letters, Vol. 9,
9 18, 2009
3. Ahmad, H., S. F. Norizan, A. Hamzah, and S. W. Harun, Double-pass
Raman amplifier for gain enhancement and gain clamping,
Optoelectronics and Advanced Materials Rapid Communication, Vol. 3,
No. 9, 924-926, 2009.
4. H. Ahmad, M.Z. Zulkifli, K. Thambiratnam, S.F. Norizan, S.W. Harun,
High power and compact switchable bismuth based multiwavelength
fiber laser, Laser Physics Letters, Volume 6 Issue 5, pp 380 – 383,
(2009).
5. N.A. Awang, M. Z. Zulkifli, S. F. Norizan, S. W. Harun, Z. A. Ghani, H.
Ahmad, Highly Efficient and High Output Power of Erbium Doped Fiber
Laser in a Linear Cavity Configuration, Laser Physics, Vol. 20, Issue
10, pp. 1894-1898, 2010.
6. H. Ahmad, A.A. Latif, S.F. Norizan, M.Z. Zulkifli and S.W. Harun, Flat
and compact switchable dual wavelength output at 1060 nm from
ytterbium doped fiber laser with an AWG as a wavelength selector,
Optics & Laser Technology, Vol. 43, Issue 3, pp.550-554, 2011.
7. S. Shahi, S.W. Harun, S.F Norizan, H. Ahmad, Brillouin–Raman Multi-
Wavelength Laser Comb Generation Based On Bi-Edf By Using Dual-
Wavelength In Dispersion Compensating Fiber Journal Of Nonlinear
Optical Physics & Materials, Vol. 19, Issue. 1 pp. 123-130 (2010)
cxxiv
8. H. Ahmad, M.Z. Zulkifli, S. F. Norizan, M. H. Jemangin, and S. W.
Harun, S-band multiwavelength Brillouin Raman Fiber Laser, Optics
Communications Vol. 284 Issues 20 pp. 4971-4974 (2011)
9. Electrically Tunable Microfiber Knot Resonator Based Erbium-Doped
Fiber Laser, IEEE Journal of Quantum Electronics, Vol. 48, Issues 4, pp.
443-446 (2012)
10. A.Sulaiman, S.W. Harun, F. Ahmad, S.F. Norizan, H. Ahmad, Tunable
laser generation with erbium-doped microfiber knot resonator, Laser
Physic, Vol. 22 Issue 3 pp. 588-591 (2012)
List of Awards
1. Silver Medal “Tunable Multiwavelength Fiber Laser using AWG and
FBG” University of Malaya, Research and Invoation Expo 2009
(UMEXPO)
2. Gold Medal “An All-Optical Frequency Up/Down Converter Utilizing
Stimulated Brillouin and Raman Scattering in Truewave Reach Fiber and
Dispersion Compensating Fiber for Radio Over Fiber Application”
University of Malaya, Inovation and Creativity Expo 2010
3. Bronze “Low Cost Tunable Laser Diode” University of Malaya,
Inovation and Creativity Expo 2010