design and conduct of randomised controlled trials (part ii)stats773/2012-05-09 design and... ·...
TRANSCRIPT

Design and Conduct of
Randomised Controlled Trials
(Part II)
STATS 773: DESIGN AND ANALYSIS OF CLINICAL TRIALS
Dr Yannan Jiang
Department of Statistics
May 9th 2012, Wednesday, 08:30-10:00

More on Sample Size
• The following questions should be clarified before carrying out a sample size calculation:
– Study design • Parallel, cross-over, factorial, cluster?
– Primary objective and outcome • Variable definition: post-measure, or change from baseline?
• Type of measurement: continuous, binary, or time to event?
– Data collection and planned analysis • Repeated measures?
• Simple test, or covariate-adjusted?
• Test for equality, non-inferiority, superiority, or equivalence?
2

Hypothesis Tests
• Equality (Test drug vs. Placebo)
• Superiority (Test drug vs. Standard therapy)
• Non-Inferiority (Standard therapy vs. Test drug)
• Equivalence (Test drug vs. Standard therapy)
3
𝜹 = 𝟎
𝜹 > 𝟎

Hypothesis Tests
• Superiority Test – Equivalent to a one-sided test on Equality
– The true research assumption in most clinical trials
• Non-Inferiority Test – Defines a NI margin with an upper bound
– Needs a better study design to avoid measurement error and potential bias
• Equivalence Test – Mostly for bioequivalence trials that aim to compare
a generic drug with the original commercial drug
– Not appropriate for therapeutic trials
4

5

A Standard Setting
• Design – Two-arm, parallel, individual randomised
controlled trial
• Primary outcome – Continuous variable, e.g. change in BP
– Comparison of means between groups
• Data collection and analysis – Baseline and post-intervention measures
– Simple two-group test (two-sided)
– Equality:
6

Continuous Outcome
Study power (1-β)
Level of significance (α)
Variability of primary outcome (SD = σ)
- Generally assume the same for both groups
Size of treatment effect (Δ)
Sample size required per arm
- Most efficient with equal treatment allocation (i.e. n=n1=n2)
- Unequal group sizes (𝑛1= 𝑘𝑛2)
2
22
)2/1(
2
)(1
zz
k
kn
7

Z-score for α and β
• Z ~ Normal (0, 1)
• Bell-Shaped density (total area under curve = 1)
• Z1-α/2 = z-quantile from where the upper area under curve = α/2
• Zβ = z-quantile from where the lower area under curve = β
• Most software can do the calculation
α/2
Z1-α/2
8
Zα/2
α/2

The Z-score Table
• With a fixed size of treatment effect and variability of the primary outcome, the term reflects the scale of change in power when the sample size changes
2
)2/1( )( zz
95% 90% 85% 80% 75%
5% 12.99 10.51 8.98 7.85 6.94
1% 17.81 14.88 13.05 11.68 10.56α
β
2
22
)2/1(
2)(
zzn
9

Binary Outcome
Study power (1-β)
Level of significance (α)
Control event rate (p0)
Size of treatment effect (Δ = p1-p0)
- Related to the target event rate in the intervention group (p1)
Sample size required per arm (n)
10
subjects total
events total ,
)1(2)(
)1()1()(
2
2
)2/1(
2
1100
2
)2/1(
pppzz
ppppzzn

• In clinical trials the investigator is often interested in a specific event, e.g. death (bad) or complete healing (good)
• Time-to-event may be of considerable clinical or scientific importance in these studies – Also known as survival or failure time
– Normally treated as continuous measures
• Censoring: – Event may not be observed for some patients during the study period
– Time to event is therefore missing (censoring)
– Special methods are required (survival analysis)
Time-to-Event Outcome
11

Kaplan-Meier Survival Curve
• Non-parametric estimate of the survival function s(t)
• Take into account the "censored" data
• No information on survival after trial finished
A series of horizontal
steps of declining
magnitude approaches
the true survival function.
12

Log-Rank Test
• Non-parametric test comparing differences in the survival experiences of two groups
– Null hypothesis: Survival curves in the two groups are the same
– Make no assumption about survival distributions
– Comparing at many time points simultaneously
– Appropriate to use with censored data
• The difference between two survival curves can be summarised by the hazard ratio
13

Cox Proportional Hazards
• It assumes that the hazard function 𝜆(𝑡) for the survival time t given the predictors, (𝑥1, 𝑥2, …, 𝑥𝑘), has the following regression model:
where 𝜆0(𝑡) is a fixed baseline hazard function
• The hazard ratio, with 1 unit increase in 𝑥𝑗, is
defined as 𝑒𝛽𝑗
14
kk xxxtXt ...)(/)|(log 22110
XetXt )()|( 0

Freedman Equation
• Suppose the survival rates in two treatment groups are P1 and P2 respectively, with
• The total number of events (d) needed to be observed in the trial is:
• The total number of patients required can be estimated by:
15
Freedman (1982), Statistics in Medicine, 1:121-129
2
2
)2/1(1
1)(
zzd
)2/(2 21 PPdN

Cox Regression Equation
• We want to test the effect of a specific predictor, 𝑥𝑗, possibly in the presence of other predictors or
covariates, on the response variable
– E.g. treatment vs. control group
• The total number of patients required can be estimated by:
where R is the overall event rate in all patients
2
2
)2/1(
)][log(
)(4
R
zzN
16

Software for Sample Size
PASS (Power Analysis and Sample Size)
http://www.ncss.com/pass.html
Packages in SAS / STATA / R
Simulations
17
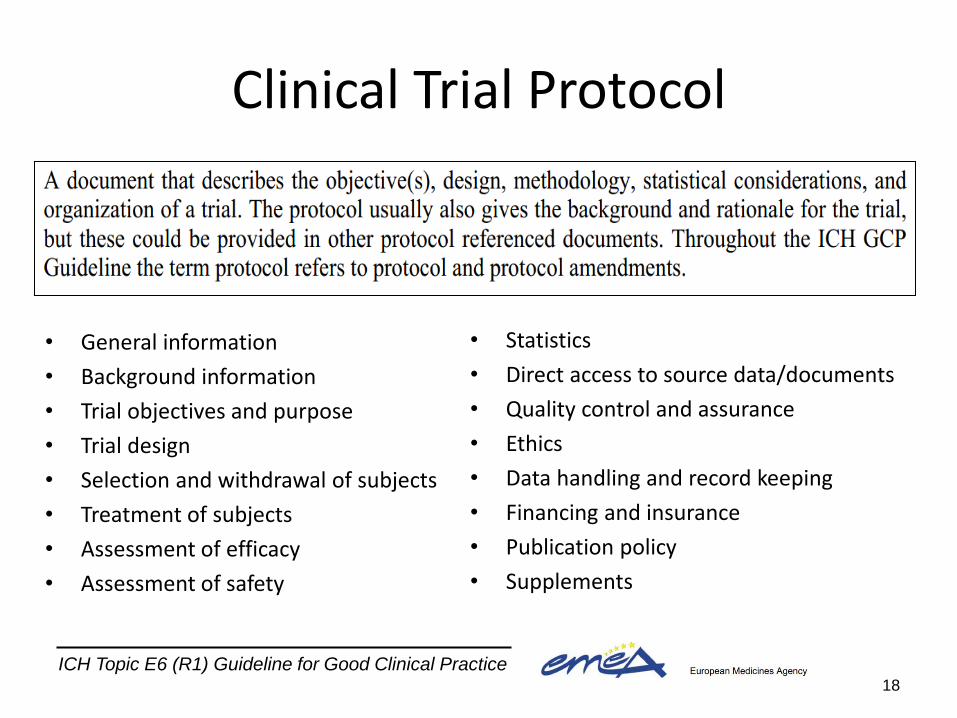
Clinical Trial Protocol
• General information
• Background information
• Trial objectives and purpose
• Trial design
• Selection and withdrawal of subjects
• Treatment of subjects
• Assessment of efficacy
• Assessment of safety
• Statistics
• Direct access to source data/documents
• Quality control and assurance
• Ethics
• Data handling and record keeping
• Financing and insurance
• Publication policy
• Supplements
18
ICH Topic E6 (R1) Guideline for Good Clinical Practice

General Information
19

• Steering group committee members • Study management committee members • Project coordinator • Study centers • Coordinating center staff • Study center staff • Project sponsors • Source of study treatment • Signature page
20

Background Information
21

22
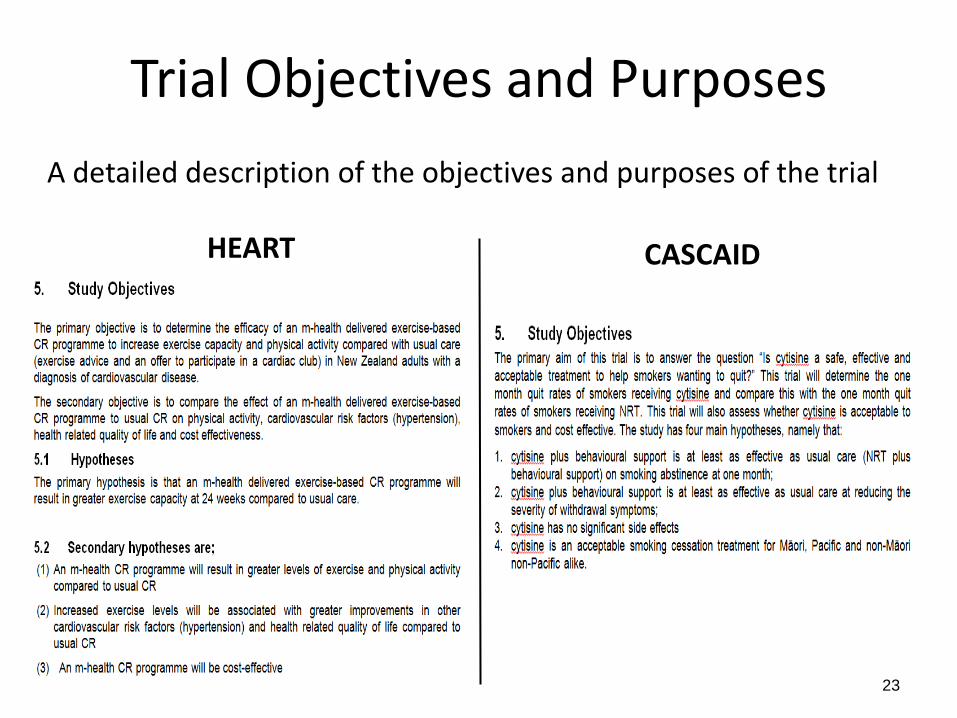
Trial Objectives and Purposes
HEART CASCAID
23
A detailed description of the objectives and purposes of the trial

Trial Design
• Primary and secondary endpoints
• Type of trial to be conducted, with schematic diagram of trial design, procedures and stages
• Randomisation and Blinding
• Trial treatment(s) and the dosage regimen
• Duration of the trial periods
• “Stopping rules” or “discontinuation criteria” for individual subjects
• Accountability procedures for the investigational product(s), including the placebo and comparator, if any
• Maintenance of trial treatment randomisation codes and procedures for breaking codes
• Identification of any data to be recorded directly on CRFs, and to be considered as source data
24

Selection and Withdrawal of Subjects
25

Treatment and Assessment
26 ICH Topic E6 (R1) Guideline for Good Clinical Practice

Statistical Considerations
27

HEART Trial – an example
28

Ethnics Approval • The principles of ICH-GCP indicate that,
29
• Independent Ethics Committee (IEC) is,

30

Data Handling & Record Keeping
• Data collected from trial participants are normally recorded on Case Record Forms (CRFs) at scheduled visits
• Standard procedures are required to:
– Design and pilot the CRFs before the study starts
– Enter correct data in paper and/or electronic forms
– Quality assurance and data monitoring!
31

Study Case Record Forms
32

Basics in CRF: Identifiers, Signature & Version
33

Question Style
• DO
– Use simple language
– Ask specific questions
– Specify time points clearly
• DON’T
– Use double negatives
– Ask compound questions (2 in 1)
– Ask loaded questions
CRF content is based on the protocol and statistical analysis plan !!
34

Statistical Analysis Plan (SAP)
(PI) (BS) (DM) (PM)
Study starts SAP CRFs Protocol
35

Development of SAP
• Primary responsibility of the project statistician – Main, Addendum, Amendment(s)
• A separate document to be completed after finalizing the protocol with pre-planned analyses – Should be reviewed by the steering committee
– Possibly updated as a result of the blind review of the data
– Only results from analyses envisaged in the protocol and amendments can be regarded as confirmatory
• Principal guide to CRF design, data collection and analysis
36

SAP Template
• Study title, identifying number, and date
• Names of the author and who have been involved in the discussion of analysis
• Name and title of the person(s) authorized to sign the SAP and addendum/amendment(s)
• Preface and Scope of SAP
• Main sections (see next)
37

Main Sections • Key trial information from the protocol
– Study objectives and outcomes – Study design including: eligibility criteria, randomisation,
blinding, and sample size – Study intervention and follow up schedules – Data source and quality assurance
• Variable definitions – Full definition of outcome measures and any derived variables
• Statistical analysis methods – Full details of the analysis population, efficacy and safety
evaluations
• Statistical results and report – Listing, table and figure templates – Statistical analysis report (a technical report of the trial results)
38

39

Statistical Analysis Report
• A technical report of the full trial results
– Complete statistical reference to the investigators
– Contributing to Clinical Study Report (CSR)
• See ICH-E3 “Structure and Content of Clinical Study Reports”
– A well-presented document with the following attachments:
• Listing, tables and figures (as in templates)
• Addendum (for additional exploratory analyses)
• Primary responsibility of the project statistician
40

Reporting RCT
• The CONSORT statement (http://www.consort-statement.org/) – CONsolidated Standards Of Reporting Trials
– Intended to improve the reporting of RCT, enabling readers to understand a trial’s design, conduct, analysis and interpretation, and to assess the validity of its results
• Most up-to-date revision is CONSORT 2010
41

CONSORT checklist
42

CONSORT checklist
43

Participant Flow Diagram
• A diagram showing the flow of participants from enrollment to analysis
• It provides an aid to trialists when writing trial results, and assist readers in the critical appraisal of the internal and external validity of a trial
44
Value of flow diagrams in reports of randomized controlled trials, Egger et al. 2001 JAMA

CONSORT Criteria
45

Summary
• Randomised Controlled Trials (RCTs) – Definition:
• A prospective study to compare one or more intervention techniques against a control group, with the assignment of the participant to a group determined by the formal procedure of randomisation
– Design of RCT:
• Parallel, Cross-over, Factorial, Cluster Randomised Trials
• Randomisation and Blinding
• Selection of Outcomes and Sample Size Estimation
– Conduct of RCT: • ICH guidelines (http://www.ich.org/products/guidelines.html)
• Development of study protocol, SAP and SAR
– Reporting of RCT: • The CONSORT statement (http://www.consort-statement.org/)
46

References
• Fundamentals of clinical trials, 3rd Edition (Friedman et al. 1998)
• Sample size calculations in clinical research (Chow et al. 2003)
• Tables of the number of patients required in clinical trials using the logrank test (Freedman 1982, Statistics in Medicine, 1:121-129)
• ICH-E3 (1996): structure and content of clinical study reports
• ICH-E6 (2002): guideline for good clinical practice
• ICH-E9 (2003): statistical principles for clinical trials
• CONSORT 2010 Statement: updated guidelines for reporting parallel group randomised trials
47