design and conduct of the surveydmg.utoronto.ca/pdf/tts/2016/2016tts_conduct.pdfp a g e | 2 2016...
TRANSCRIPT

.
Andreas Rose, Vice-President - Research
1201 – 415 Yonge St.
Toronto, ON M5B 2E7
Phone: 1-800-665-5848 ext. 408
E-mail: [email protected]
www.malatest.com
DESIGN AND CONDUCT OF THE SURVEY
MAY 2018

P a g e | 2
2016 TTS: Design and Conduct of the Survey Transportation Tomorrow Survey
Further Information
The Transportation Tomorrow Survey (TTS) are parts of an ongoing data collection program by the Transportation Information Steering Committee (TISC). The survey data (2016, 2011, 2006, 2001, 1996, 1991 and 1986) are currently under the care of the Data Management Group. This group is responsible for maintaining the TTS databases and making available appropriate travel information for any urban transportation study in the area. Requests for information from the TTS, or enquiries related to the contents of this report, should be directed to the address below.
Data Management Group Department of Civil Engineering University of Toronto 35 St. George Street Toronto, Ontario M5S 1A4 Tel: (416) 978-3913 Fax: (416) 978-3941 Email: [email protected] Web: www.dmg.utoronto.ca

P a g e | 3
2016 TTS: Design and Conduct of the Survey Transportation Tomorrow Survey
TABLE OF CONTENTS
FURTHER INFORMATION ....................................................................................................................2
ACKNOWLEDGEMENTS ......................................................................................................................6
SECTION 1 : INTRODUCTION ...........................................................................................................9 1.1 PROJECT SCOPE ............................................................................................................................... 10 1.2 BACKGROUND ................................................................................................................................. 11 1.3 OVERVIEW OF THE SURVEY APPROACH ................................................................................................ 12
SECTION 2 : PLANNING AND DESIGN ............................................................................................. 14 2.1 SURVEY DESIGN AND SURVEY INSTRUMENT .......................................................................................... 14
2.1.1 Questions associated with data validation of online surveys ............................................. 15 2.1.2 Changes to the survey instrument and software ................................................................ 16
2.2 INTEGRATION OF ONLINE SURVEY IN CALLWEB ..................................................................................... 16 2.3 SURVEY AREA .................................................................................................................................. 17 2.4 SAMPLING METHODOLOGY ................................................................................................................ 18
2.4.1 Address-based sample ........................................................................................................ 20 2.4.2 Supplemental phone-only sample ....................................................................................... 20
2.5 ADVANCE MAIL-OUT PACKAGE ........................................................................................................... 20 2.6 COMMUNICATION STRATEGIES ........................................................................................................... 21
2.6.1 TTS 2016 website ................................................................................................................ 21 2.6.2 Municipal websites .............................................................................................................. 21 2.6.3 Earned media ...................................................................................................................... 21 2.6.4 Social media ........................................................................................................................ 22 2.6.5 Communication activities undertaken by survey partner agencies .................................... 22
SECTION 3 : CALL CENTRE ................................................................................................................. 24 3.1 CALL CENTRE LOCATION .................................................................................................................... 24
3.1.1 Interview site ....................................................................................................................... 24 3.2 EQUIPMENT .................................................................................................................................... 25
3.2.1 Computers ........................................................................................................................... 25 3.2.2 Wiring structure .................................................................................................................. 26 3.2.3 Computer network and servers ........................................................................................... 26 3.2.4 Telephone ............................................................................................................................ 27 3.2.5 Backup schedule .................................................................................................................. 27
SECTION 4 : PILOT TEST .................................................................................................................... 28
SECTION 5 : SAMPLING PLAN AND SAMPLE MANAGEMENT .............................................................. 31 5.1 MAILING PLAN ................................................................................................................................ 31 5.2 SAMPLE DISTRIBUTION...................................................................................................................... 33 5.3 SAMPLING PLAN BY MUNICIPALITY ...................................................................................................... 34 5.4 SAMPLE MANAGEMENT .................................................................................................................... 35
SECTION 6 : HUMAN RESOURCES ...................................................................................................... 39 6.1 RECRUITMENT ................................................................................................................................. 39 6.2 TRAINING ....................................................................................................................................... 41
6.2.1 Supervisory and support staff training ................................................................................ 42 6.2.2 Geocoding training .............................................................................................................. 42

P a g e | 4
2016 TTS: Design and Conduct of the Survey Transportation Tomorrow Survey
6.2.3 Online survey validation training ........................................................................................ 43 6.3 HOURS OF WORK ............................................................................................................................. 43 6.4 RATES OF PAY ................................................................................................................................. 43 6.5 INCENTIVES ..................................................................................................................................... 44
SECTION 7 : CONDUCT OF THE SURVEY ............................................................................................. 45 7.1 DATA COLLECTION PROCESS ............................................................................................................... 45
7.1.1 Voice mail strategy.............................................................................................................. 46 7.1.2 Inbound telephone calls ...................................................................................................... 46
7.2 NON-ENGLISH INTERVIEWS ............................................................................................................... 46 7.3 PARTIALLY COMPLETED ONLINE SURVEYS ............................................................................................. 47
SECTION 8 : QUALITY CONTROL ........................................................................................................ 49 8.1 LOGIC CHECKS ON DDE AND ONLINE ................................................................................................... 49 8.2 MONITORING LIVE INTERVIEWS ON DDE ............................................................................................. 49 8.3 PERFORMANCE STATISTICS ON DDE AND ONLINE .................................................................................. 50 8.4 VISUAL REVIEW OF DDE AND ONLINE SURVEY COMPLETIONS .................................................................. 51 8.5 TRANSIT REVIEW .............................................................................................................................. 53 8.6 CALLBACKS FOR DDE AND ONLINE SURVEY COMPLETIONS ...................................................................... 53 8.7 FEEDBACK FROM THE DDE CODING PROCESS ........................................................................................ 54 8.8 ROTATION OF SAMPLE BETWEEN INTERVIEWERS.................................................................................... 54 8.9 RANDOM QUALITY CONTROL AUDITS ................................................................................................... 55 8.10 PAPER MANAGEMENT ...................................................................................................................... 55
SECTION 9 : GEOCODING AND POST-PROCESSING ......................................................................... 56 9.1 OVERVIEW ..................................................................................................................................... 56
9.1.1 Geocoding in DDE ................................................................................................................ 56 9.1.2 Geocoding of online survey data ......................................................................................... 57
9.2 POST-PROCESSING ........................................................................................................................... 57 9.2.1 Post-process in DDE ............................................................................................................. 58 9.2.2 Post-processing online survey data ..................................................................................... 59 9.2.3 Final post-processing of the final combined dataset .......................................................... 59
SECTION 10 : COMPLETION STATISTICS ............................................................................................. 61 10.1 SURVEY COMPLETIONS BY SAMPLE TYPE AND SURVEY PLATFORM ............................................................. 61 10.2 HISTORICAL OVERVIEW OF SURVEY STATISTICS ...................................................................................... 61 10.3 2016 TTS SURVEY COMPLETIONS BY TTS REGION ................................................................................ 64 10.4 SURVEY COMPLETIONS BY TRIP DAY ..................................................................................................... 66
SECTION 11 : CONCLUSIONS ............................................................................................................. 68
SECTION 12 : RECOMMENDATIONS FOR 2021 ................................................................................... 71

P a g e | 5
2016 TTS: Design and Conduct of the Survey Transportation Tomorrow Survey
LIST OF TABLES
Table 2-1: Information collected by the survey .......................................................................................... 15 Table 2-2: Information available by sample type ....................................................................................... 19 Table 2-3: Survey partner agencies and activities ...................................................................................... 22 Table 4-1: Method of completion by sample type based on pilot test ...................................................... 29 Table 5-1: Mailing plan - address-only sample ........................................................................................... 31 Table 5-2: Mailing plan - address-and-phone sample ................................................................................ 32 Table 5-3: Expected and actual distribution of sample and completions by sample type ......................... 34 Table 5-4: Target survey completions and actual completions by Municipality ........................................ 35 Table 6-1: Distribution of TTS 2016 tasks by Malatest office ..................................................................... 39 Table 6-2: Number of North York call centre staff...................................................................................... 40 Table 8-1: Quality control measures in the DDE and online (CallWeb) ...................................................... 49 Table 10-1: Total of complete surveys by method of completion and sample type .................................. 61 Table 10-2: Historical overview of statistics ............................................................................................... 62 Table 10-3: Historical statistics for different sample types ........................................................................ 63 Table 10-4: Completed surveys by TTS region ............................................................................................ 64 Table 10-5: Surveys by sample type and survey method by region ........................................................... 65 Table 10-6: Completed surveys by trip day ................................................................................................ 66 Table 10-7: Survey completions by week of trip day .................................................................................. 67 Table 10-8: Cumulative survey completions by week of trip day ............................................................... 67
LIST OF FIGURES
Figure 2-1: Survey area ............................................................................................................................... 18 Figure 3-1: TTS North York call centre layout ............................................................................................. 24 Figure 4-1: Pilot survey response ................................................................................................................ 29 Figure 5-1: Sample life cycle - DDE and online survey ................................................................................ 37 Figure 8-1: Typical DDE performance printout ........................................................................................... 51
APPENDICES
Appendix A: Organizational structure of 2016 TTS ..................................................................................... 76 Appendix B: Transportation Tomorrow Survey (TTS) - Fact Sheet ............................................................. 78 Appendix C: Suggested Press Release by R. A. Malatest ............................................................................ 80 Appendix D: 2016 TTS Promotional Poster ................................................................................................. 82 Appendix E: Advance Letters ...................................................................................................................... 84 Appendix F: Exploration of the Concordance between Google-Geocoded Destinations in Online Surveys and the Land Information Ontario Geographic Base .................................................................................. 89

P a g e | 6
2016 TTS: Design and Conduct of the Survey Transportation Tomorrow Survey
Acknowledgements Twenty-two agencies funded the 2016 Transportation Tomorrow Survey (TTS):
Ministry of Transportation of Ontario City of Barrie City of Brantford City of Guelph City of Hamilton City of Kawartha Lakes City of Peterborough City of Toronto County of Brant County of Dufferin County of Peterborough County of Simcoe County of Wellington Metrolinx Regional Municipality of Durham Regional Municipality of Halton Regional Municipality of Halton Municipality of Niagara Regional Municipality of Peel Regional Municipality of Waterloo Regional Municipality of York Toronto Transit Commission Town of Orangeville
Transportation Information Steering Committee (TISC) participated in planning and directing the 2016 TTS. The committee also has conducted the previous TTS studies since 1986. The representatives who served on the 2016 TTS steering committee were:
Michael Casey Ministry of Transportation of Ontario Muhammad Khan Ministry of Transportation of Ontario Ahsan Alam Ministry of Transportation of Ontario Philip Mohan City of Hamilton Mike Wehkind City of Toronto Chris Livett Metrolinx Chris Leitch Regional Municipality of Durham Patrick Monaghan Regional Municipality of Halton Sabbir Saiyed Regional Municipality of Peel Ahmad Subhani Regional Municipality of York Bernard Farrol, Conor Adami Toronto Transit Commission
The Data Management Group at the University of Toronto provided guidance on data collection and data processing methodologies, documentation from previous survey cycles, and support for the Direct Data Entry system used in the conduct of telephone surveys. Key DMG staff involved in the project included:

P a g e | 7
2016 TTS: Design and Conduct of the Survey Transportation Tomorrow Survey
Susanna Choy Project/Technical Advisor Reuben Briggs Project/Technical Advisor Jason Chan Computer System Manager and Support
A sub-committee of TISC, the Technical Advisory Committee (TAC), provided ongoing oversight and guidance of the 2016 TTS and made recommendations to TISC on matters requiring decisions. TAC was represented by representatives from the Ministry of Transportation of Ontario (MTO), the DMG, the Toronto Transit Commission (TTC) and the Regional Municipalities of Peel and York.
The survey was managed by R.A. Malatest & Associates Ltd. (Malatest), a Program Evaluation & Market Research company. Key members of the management team consisted of:
Andreas Rose Project Advisor Bess Ashby Project Manager Matt Jackson Assistant Project Manager Luke Rowland Director of Call Centre Operations David Santos Call Centre Site Manager Patrick Tremblay Computer System Manager and Support Nickolas Rajack DDE Geocoding Manager Pam Toovey Human Resources Director
Malatest subcontracted subject matter experts in transportation studies and GIS mapping to support discussions on methodological issues and reporting work:
David Kriger David Kriger Consultants Inc. Rhys Wolff, Yunfei Zhang HDR Inc.
Malatest subcontracted integral staff with involvement in previous Transportation Tomorrow Surveys to assist in the conduct of the survey and provide guidance on methodological and technical issues. The subcontracted team consisted of:
Peter Dalton Advisor Ian Fisher Advisor, Interviewer Training Manager Sharon Kashino Advisor, Visual Review/Edits Training
The hiring process was supervised by Malatest’s Director of HR, Pam Toovey, and the training of interview staff was led by Ian Fisher. The interview team leaders over the course of the data collection and verification phase of the survey of 2016 were:
Matthias Mayer DDE team leader Sayeeda Hosein-Silochan DDE team leader David Piller DDE team leader
Key resources for the management of the online survey data were: Golnar Zokai CallWeb Database Manager / GIS Analyst Steacy Henry CallWeb Visual Review Coordinator Corey Burger CallWeb Visual Review Coordinator / Database Analyst
Conor Adami, of the Toronto Transit Commission, provided assistance in reviewing the logic and consistency of all the transit route information collected.

P a g e | 8
2016 TTS: Design and Conduct of the Survey Transportation Tomorrow Survey
Muhammad Khan of the Ministry of Transportation of Ontario was instrumental in providing assistance in the procurement of various governmental services and also acting as a day to day liaison between the survey management and the Ministry.
More than 400 interview and coding staff contributed and played a fundamental role in the success of the data collection and verification process of the 2016 Transportation Tomorrow Survey. Their work and dedication is greatly appreciated.
This report was prepared for the Transportation Information Steering Committee by Malatest. Malatest recognizes and appreciates all the support and cooperation from the TISC committee throughout the project.

P a g e | 9
2016 TTS: Design and Conduct of the Survey Transportation Tomorrow Survey
SECTION 1: Introduction The Transportation Tomorrow Survey (TTS) is a confidential and voluntary travel survey on how Ontarians in the Greater Toronto and Hamilton Area (GTHA) and Greater Golden Horseshoe (GGH) use the transportation system. The research helps local and regional governments, as well as the province and its agencies, make transportation planning and investment decisions. The 2016 TTS is one of the largest and most comprehensive travel surveys in North America, and the seventh in a series of surveys conducted every five years since 1986.
The goal for the 2016 TTS was to complete 161,200 surveys, via telephone and online. The actual number of survey completions, at 171,300 prior to data cleaning, surpassed this goal. Surveys failing validation tests were discarded, yielding a final dataset of 162,708 surveys.
R.A. Malatest & Associates Ltd. (Malatest) was retained by the Ministry of Transportation of Ontario (MTO) to conduct the 2016 Transportation Tomorrow Survey. The 2016 cycle of the survey was undertaken with the cooperation of the Transportation Information Steering Committee (TISC), the TTS Technical Advisory Committee (TAC) composed of selected TISC representatives, and the Data Management Group (DMG) from the University of Toronto. Some integral members of the management team of previous TTS years were also contracted to assist and advise the 2016 TTS. The organizational structure and the roles of each partner of the 2016 Transportation Tomorrow Survey are outlined in an organizational chart presented in Appendix A.
Malatest’s web portal (CallWeb) was used for the completion of online surveys, while the Direct Data Entry (DDE) system furnished by DMG was used for the completion of telephone surveys. While the CallWeb system is an integrated telephone/web interview system, use of DDE for telephone surveys was a requirement to ensure continuity with the way telephone interviews had been conducted in previous cycles. The integration of CallWeb for online surveys was a major change from the previous survey. Another major change was the move from directory-listed phone number sampling to an address-based sampling approach employing three different types of contact sample (i.e., address-and-phone, address-only, and phone-only). Other key updates to the 2016 study included: the addition of a survey consent question before starting the survey; the inclusion of paid ride share as a travel mode option; the inclusion of the income question at the end of the survey; and the use of Google Maps based coordinates for geocoded locations captured via the online survey. In addition, the 2016 TTS data collection was completed in a single year, whereas data collection in recent prior cycles was carried out over two years.
This report on the design and conduct of the survey outlines the approach selected for the completion of the survey, including work completed for both the telephone and online survey components of the study.
Readers are referred to the 2016 TTS: Data Guide and the 2016 TTS: Data Expansion and Validation report available under separate covers for additional detail on the content of the survey data file and the data processing methods used to expand and weight the survey data to better represent the surveyed population. These reports include further detail on differences between the 2016 TTS and previous survey cycles with respect to survey content, data definitions, survey samples, and data expansion methods.
P a g e | 10
2016 TTS: Design and Conduct of the Survey Transportation Tomorrow Survey
1.1 Project scope The purpose of this project was to collect comprehensive data on trip patterns and choices made by Ontarians living in the Greater Golden Horseshoe (GGH). The data collection phase was conducted in the fall; a time of more stable travel patterns compared to other seasons. Malatest provided office space, recruited project staff, and provided all of the equipment required to carry out the project. The Data Management Group (DMG) provided the telephone survey software used in the 2011 TTS, set up the software on all applicable servers and computer equipment, and provided guidance on hiring onsite technical support staff. The DMG was also available to Malatest to provide advice on survey administration based on its previous data collection experience with the TTS.
The major requirements of this project were to:
Plan the data collection, including procuring the sampling frame and developing a sampling plan for the survey;
Set up meetings with the DMG and the Transportation Information Steering Committee (TISC) and provide regular updates on the progress of the survey;
Complete the travel data collection via telephone and online surveys;
Check and geocode all geographic locations collected;
Validate, correct and expand data to create a final database; and
Provide reports, documentation, and materials related to the project and data.
The original concept for the 2016 TTS was to replicate the 2011 TTS using a telephone survey approach. However, in recognition of the limited representativeness of a telephone-only approach, TISC approved the adoption of an online option so that surveys could be conducted with households that did not have a landline telephone, using an address-based sampling approach. Malatest developed and tested an online survey that collected data consistent with the DDE telephone survey provided by DMG. Both online and telephone surveys were used concurrently throughout the study period.
The 2016 TTS could be considered a ‘hybrid’, combining the traditional telephone approach to TTS data collection and the new online approach. Use of the DDE telephone survey ensured that the process used to conduct surveys via telephone would be very similar to the process used in the 2011 study, to support comparability with prior cycles. The adoption of the online option (CallWeb), approved in June 2016, increased the representativeness of the data collected by enabling survey completion among households for which no listed landline was available (only an address). These households received a letter that invited them to participate in the survey and included survey access information; i.e., a toll-free telephone number, and a link to access the survey online. Households with addresses that could be matched to a listed telephone number received a similar invitation letter, but could also be followed up with by telephone to conduct the survey via telephone interview.
Data from the regions listed below were combined into a single database that would serve as the Ministry’s primary source of travel data and included data from the following regions:
P a g e | 11
2016 TTS: Design and Conduct of the Survey Transportation Tomorrow Survey
City of Barrie
City of Brantford
City of Guelph
City of Hamilton
City of Kawartha Lakes
City of Orillia
City of Peterborough
City of Toronto
County of Brant
County of Dufferin\
County of Peterborough (partial)
County of Simcoe
County of Wellington (partial)
Regional Municipality of Durham
Regional Municipality of Halton
Regional Municipality of Niagara
Regional Municipality of Peel
Regional Municipality of Waterloo
Regional Municipality of York
Town of Orangeville
1.2 Background The 2016 TTS was a joint undertaking by 22 local, regional, provincial and transit operating agencies in the Greater Golden Horseshoe (GGH). These included the MTO, Metrolinx/GO Transit, the TTC, and cities and municipalities spanning the GGH. The TTS was arranged to collect three categories of information: household data (e.g., number of members in the household), demographics (e.g., employment status, age), and trip data (e.g., method of transportation, origin, destination).
The first TTS was conducted in 1986 and surveyed 4.2% of randomly selected households in the GTHA1. The DMG began managing the TTS data in 1988 and managed the second TTS cycle undertaken in 1991. The surveys have typically targeted uniform sampling rates across the entire study area, with the exception of the 1991 TTS, which employed a stratified sample, with a completion target of 4.5% in high growth areas and 0.5% in low growth areas. One of the achievements of the 1986 TTS survey was the automation of geocoding. This achievement was followed, in 1991, by the development of the DDE system for stand-alone computers. The DDE and automated geocoding were used in all subsequent survey cycles. In 2001, the computers were first networked together to a central server system.
Prior to 1996, the geographical regions included in the TTS were limited to the GTHA. In 1996, the scope of the TTS expanded to include the Regional Municipalities of Niagara and Waterloo, the Counties of Wellington, Peterborough, Simcoe, the Cities of Guelph, Barrie, Kawartha Lakes, Peterborough, and the Town of Orangeville. The 1996 survey cycle included approximately 115,200 completed interviews and represented about 5% of randomly selected households within the survey area2. The DMG continued to independently execute the TTS survey until 2011.
The 2001 TTS was very similar to the 1996 cycle although the Regional Municipality of Waterloo was excluded in 2001, and the City of Orillia and all of the County of Simcoe were included. Approximately 137,000 interviews were completed in 20012, representing an average sampling rate of 5.7% of households (though with certain geographies sampled at higher rates than others). All of the geographical areas involved in 2001 were also surveyed in 2006, with the addition of the Regional Municipality of Waterloo, the City of Brantford, and the County of Dufferin. Approximately 149,000 interviews were completed in 2006 (5.2% of households), demonstrating a continued increase of surveys collected over the years.
1 According to the 2011 TTS Design and Conduct of the Survey, prepared by DMG in 2014. 2 According to the 2011 TTS Design and Conduct of the Survey, prepared by DMG in 2014.

P a g e | 12
2016 TTS: Design and Conduct of the Survey Transportation Tomorrow Survey
The 2011 TTS covered an additional geographical area, the County of Brant, and included 159,000 survey completions (5.1% of households).
The 1996, 2001, 2006, and 2011 surveys were all conducted in two phases. In the 1996 and 2001 cycles, the survey geographies external to the GTHA were surveyed in the previous year to the main survey phase. In 2006, all areas were surveyed in Phase 1 (2005), to provide greater uniformity in the sampling and to allow the sampling plan to be modified in Phase 2 to reflect the observed response rates from Phase 1. The 2011 TTS was also completed in two phases, with the second phase taking place in 2012.
In the 2016 TTS, the interviewing phase was completed over the course of one data collection period, running from September to December of 2016. A total of 162,708 surveys were completed and included in the final data set in 2016, which surpassed the minimum target of 161,200 survey completions. In 2016, the overall sampling rate was 3.0% for Hamilton, and 5.0% for the rest of the TTS area.
Readers are referred to the 2016 TTS: Data Guide, under a separate cover, for more detail on differences between the survey cycles in terms of sampling approaches, data definitions, and survey methods.
1.3 Overview of the survey approach Using telephone calls to complete the survey over the years has been an effective and cost-efficient method of conducting this type of survey; however, the increase in cell-phone-only households necessitated provision of an online survey option, which also proved to be effective and cost-efficient. The use of the online survey option was quite high: over 60% of all 2016 surveys completed were filled out by respondent online. While the 2011 TTS included an online completion method, these represented only 11% of the total surveys.
Data collection for the 2016 TTS began on September 7, 2016 and the survey closed on December 19, 2016. The telephone and online surveys were conducted concurrently. Approximately 5% of households in the survey area participated in the 2016 TTS study, with the exception of Hamilton, for which the sampling rate was 3%. The lesser sampling rate should not have a significant impact on the overall reliability of the overall survey results across the TTS area or even the overall results for Hamilton as a whole, although it should be mentioned that smaller sub-samples of the data for geographies within Hamilton will be subject to greater sampling error than if a 5% sample had been obtained, which may limit some of the uses of the data for this municipality. Surveys were conducted from Sunday to Saturday for trips made from Monday to Friday, during the data collection period. Some surveys were completed during the day with daytime staff as they were available to accept inbound calls from respondents who called in with questions or to complete the survey. However, the majority of surveys were completed in the evening hours or on weekdays. Having the call centre staffed Sunday to Saturday helped to maximize productivity.
As previously mentioned, the 2016 study enhanced the representativeness of the sample by including both households with a listed landline number as well as households for which a corresponding landline number was not available. These two groups are referred to as the ‘address-and-phone sample’ (i.e., a telephone number existed for the home) and the ‘address-only’ sample (i.e., only the address was available). A third sample was implemented for which only a phone number was available, however, this sample was soon found to have a low response rate and high cost, and thus the ‘phone-only’ sample type was removed early on during the data collection. More information on phone-only sample is found in the next section.

P a g e | 13
2016 TTS: Design and Conduct of the Survey Transportation Tomorrow Survey
The survey asked participants questions about their household, their demographic profile, and about all the trips made on the previous day by each person eleven years of age and older in their household. This included asking the participants the method of transportation used to get to and from their destination(s) on a given day (i.e., whether they drove or were a passenger in a vehicle, used a motorcycle, taxi, walked, biked, used transit, a school bus, or other).
Overall, prior to data cleaning, over 60,800 (about 36%) of the total 2016 survey completes were conducted via telephone and over 110,500 (about 64%) were completed online. This surpassed the initial expectation of about 50% online survey completions.
In terms of survey completions by survey method and sample type, the address-and-phone sample was used to complete the majority (85%) of the telephone surveys (51,677 surveys prior to data cleaning); the address-only sample was used to complete 13% of the telephone surveys (8,007 surveys), which were either call-ins to the toll-free number or phone follow-ups to partially completed online surveys; and the phone-only sample resulted in just 1,075 telephone surveys, due to the high refusal rates and consequent exclusion of this sample type. A small number of phone surveys (67) were completed with those who were not included in any of the samples but who asked to be surveyed after finding out about the survey.
The online survey completions were largely associated with the address-only sample type, with 75,427 online completes prior to data cleaning (or 69% of the online surveys), although this mode was also fairly popular with the address-and-phone sample, with 35,064 online completes (or 31% of the online surveys). The remaining 29 online surveys were completed with individuals in the phone-only sample or those who were not included in any of the samples but who asked to be surveyed after finding out about the survey.
Malatest was able to successfully merge data from the telephone platform (DDE) and the online platform (CallWeb) and was able to obtain a more representative sample of the region’s population by reaching those without a landline.
The following sections of this report provide more detail on various aspects of the planning, design and execution of this survey.

P a g e | 14
2016 TTS: Design and Conduct of the Survey Transportation Tomorrow Survey
SECTION 2: Planning and design The 2016 TTS project was successful, from planning and implementation to analysis and reporting, due to the support and experience of the DMG and contracted staff from previous TTS cycles, and the transportation sector experience of Malatest staff. Effective collaboration among Malatest, the DMG and staff from previous TTS projects was vital to the successful execution of the 2016 TTS. Numerous meetings were organized to plan and design the 2016 TTS, and these were attended by the Malatest project management team and the various committees.
To facilitate tracking and comparability, the questions within the 2016 survey remained largely the same as in prior cycles. The DDE telephone survey instrument from previous cycles of the research was also used in 2016 to ensure consistency with the way telephone surveys had been administered in previous cycles. The online CallWeb survey instrument was created to provide participants with the option of completing the survey online, and was programmed with scripts in both official languages. The online CallWeb survey mimicked the DDE version, and both platforms were used simultaneously to increase respondent participation. The CallWeb system was also set up with scripts and call management to accommodate telephone interviewing as required. This also provided backup for a telephone interviewing in an emergency should there be any problems with the DDE system. A small portion of telephone interviews were conducted using CallWeb rather than DDE, mostly for surveys that had been started online in the CallWeb system and then completed over the phone.
This section details the evolution of the survey instrument, the survey study area, the sampling methodology, the different sample types, and the communication strategies used in the administration of the 2016 cycle of the TTS survey.
2.1 Survey design and survey instrument To ensure that the 2016 TTS telephone data would be comparable with data collected in prior cycles, Malatest continued to employ the DDE software in the 2016 cycle of TTS. Malatest developed a new bilingual online survey tool for the 2016 TTS using the CallWeb software platform. Although, the previous cycle of TTS 2011 offered an online version of the survey, this copy of the online survey was not used in the 2016 cycle of TTS. One of the reasons was due to the high cost and time necessary to make it bilingual. Malatest developed a new bilingual online survey tool for the 2016 TTS using the already established CallWeb software platform, while using the DDE survey as a guideline to ensure the online survey would be as identical as possible to the DDE survey version. Participants were able to login and complete the TTS survey online via a secure (HTTPS) website developed and hosted by Malatest (tts2016.ca). Those using the survey website also had access to Frequently Asked Questions (FAQs), information about the survey partners, and telephone and email contact information for additional questions or support completing the survey.
As previously discussed, the online platform ensured that GGH residents who do not use a landline could participate in the survey (i.e., residents included in the address-only sample). The development of the online survey and the introduction of different sample types in the 2016 cycle of TTS represented significant improvements from the 2011 cycle of the TTS. In 2011 the data were primarily collected from households with landlines (i.e., address-and-phone sample).
Table 2-1 details the type of information collected via questions asked in the 2016 TTS.

P a g e | 15
2016 TTS: Design and Conduct of the Survey Transportation Tomorrow Survey
Table 2-1: Information collected by the survey
Household Demographic/Person Trip (Persons 11+ years of age) Informed consent (new in
2016)
Confirm address (geocode home XY coordinates)
Travel day surveyed (date and day of week)
Dwelling type
Received survey notification letter?
Household size (number of persons)
Number of vehicles available to householders (including company vehicles)
Household income (new in 2016)
Household’s type(s) of phone service
Agree to participate in future research (online respondents only, new in 2016)
Gender
Age (or age range if exact age refused)
Driver’s license
Transit pass
Employment status (Full or Part time)
Workplace location
Availability of free parking at work
Type of occupation
Student status (Full or Part time)
School name/location
Transit pass
Made any trips between 4:00 a.m. and 3:59 a.m. on travel date
Origin of first trip (Geocode origin XY coordinates)
Destination location of all trips (Geocode destination XY coordinates)
Primary mode of travel (with paid rideshare a new option in 2016)
Trip departure time
Trip purpose
Transit access mode (if transit taken)
Transit route(s) (if transit taken) (i.e., transit system and route name or number)
Transit boarding and alighting stations (if transit used TTC Subway or GO Train)
Transit egress mode (if transit taken)
Number of vehicle occupants (if auto driver)
Use of Hwy 407 (if auto driver and appropriate O-D combination)
2.1.1 Questions associated with data validation of online surveys Specific to the online version of the 2016 TTS were several validation questions that were added for quality control purposes to improve the quality of online responses. These additional questions were not used for analysis of the TTS data, and are not included in the final dataset. Nonetheless, the use of the validation questions is mentioned, as they were useful to confirm the following details regarding survey responses:
Confirmation of whether the main respondent was answering for another household member, or whether another household member completed their own answers;
Confirmation of the reason if a household member was reported as not having taken any trips;
Confirmation of the reason if the first origin of the day was not home;
Confirmation that a household member was at their last reported location until the end of the travel day (i.e., 3:59 a.m.) if their last destination of the day was not home;
Confirmation of mode of travel if a household member was reported as the auto driver for a trip but indicated that they do not hold a valid driver’s licence;
Confirmation of mode of travel if a household member was reported as the auto driver for a trip but indicated that no one in the household owned a vehicle;
Confirmation of whether a household member worked from home if they were reported as employed, with their primary work location being outside their home, but they did not take any trips with work as a purpose or a destination; and

P a g e | 16
2016 TTS: Design and Conduct of the Survey Transportation Tomorrow Survey
Confirmation of whether a household member attended school if they were reported as being a student, at a school location outside their home, but they did not take any trips with school as a purpose or a destination.
As a reminder to respondents, the definition of a valid trip was noted in the main survey introduction page, within the introductory section to recording trips, and was available as a pop up window feature on every page of the survey that included questions about householder trips. The TTS trip definition is noted below.
Trip definition: A trip is a one-way journey from one location to another for a single main purpose. A single trip may include more than one mode of travel, such as car and transit (Kiss & Ride or Park & Ride). The TTS trip definition does not include incidental stops along the way (such as stopping at dry cleaner’s on the way to work); does not include round trips for leisure/exercise (such as going for a jog or bicycle ride around the block); and, walking trips are only captured for trips to/from school or work or when connecting to other modes.
2.1.2 Changes to the survey instrument and software The 2016 TTS asked the same set of questions as the 2011 TTS, with the addition of a two new questions. One of these new questions related to informed consent; this was added to ensure participants gave their consent to providing survey data about their household, to conform to PIPEDA and FOIPPA requirements. The consent question was asked at the beginning of every telephone survey, and was the first question asked in the online survey. Also new to the 2016 TTS was a question asking respondents to report their household income. Collecting household gross income provided additional demographic information that could be used to ensure the data were representative of all household types. Additional updates in 2016 were the addition of a ‘paid rideshare’ response option to the modes of travel question, the addition of ‘Presto’ as a transit pass response option, and removal of ‘GO Pass’ as a transit pass option.
The DMG’s DDE telephone survey was used as a guide in the design and programming of the 2016 online version of the TTS. As previously mentioned, the 2016 TTS online survey was programmed using CallWeb computer software. To ensure the online survey would function as intended, the survey was piloted prior to the full launch of the survey. More information on the pilot test is found in Section 4 of this report.
2.2 Integration of online survey in CallWeb Integrating the online survey was essential to include the address-only sampling type. Since the address-only sample was not linked to a phone number, the only way to have the participation of those households without a landline was incorporating the option to complete the survey online or for such individuals to contact the call centre using the toll-free telephone number provided.
Using Malatest’s CallWeb platform for the administration of the online survey improved the user experience and the accuracy of the data collected. For example, the online survey incorporated Google location databases that allowed online respondents to identify their locations using Google Maps, a tool that is familiar and easy to use for most people. Data quality was maintained through the use of Google’s extensive search input capabilities as participants completed the survey. Locations were

P a g e | 17
2016 TTS: Design and Conduct of the Survey Transportation Tomorrow Survey
reviewed by geocoding staff in post-processing of the data, and geographic coordinates captured by the Google Maps tool in the online survey were found to be accurate and consistent, and in some instances were more accurate than the street-segment civic-number interpolations used for most locations in the DDE system (as respondents could select their specific destination on a large university campus or business complex, and address locations in the Google database may be more accurate for curved street segments or certain addresses). The online survey also made use of automated probing questions (data validation questions) by programmatically installing similar logic checks to those seen in the DDE survey software, as well as a few additional questions to clarify certain kinds of survey responses.
The online survey included a page at the beginning of the survey that collected a contact name, email address and/or phone number, to allow for follow-up with online respondents if clarification was required after survey responses were reviewed by the geocoding /data review team.
The final question added to the online survey asked participants if they were willing to be contacted for future transportation related research. Those who indicated they were willing to be contacted were asked to confirm the phone number and email address that they had provided at the beginning of the survey. The DMG are the caretakers of this list of respondents who are willing to be contacted for future transportation related research. This list of respondents is stored separately from the survey data to protect the identities of those participating; contact information and TTS survey responses will never be linked.
2.3 Survey area The TTS study area included all of the partner municipalities across the Greater Golden Horseshoe (GGH). The goal of the TTS study was to complete surveys with a representative random sample made up of 5% of households within the study area, with the exception of Hamilton, which was sampled at 3%. The following image (Figure 2-1) displays the study area for the 2016 TTS and shows all geographies where households were sampled to obtain a balanced and representative distribution of the population covering the study area as a whole.

P a g e | 18
2016 TTS: Design and Conduct of the Survey Transportation Tomorrow Survey
Figure 2-1: Survey area
2.4 Sampling methodology Previous cycles of the TTS have relied on the use of white pages telephone listings for landline telephone numbers with mailing addresses. Traditionally, telephone surveying has been the primary mode of data collection for TTS because the majority of households had a landline. However, over the last 15 years, there has been a steep decline in the number of households that have a listed telephone landline, and a considerable increase in the percentage of cell-phone-only households. This is especially true for households that include only younger residents and households in densely populated areas with smaller dwelling unit (e.g., one- or two-person condominiums and rental apartments).
In recognition of the increased number of cell-phone-only households, the 2016 TTS methodology was modernised to ensure the data set would be more representative than if previous sampling methods had been used. Concerns about the representativeness of the data collected first arose in the 2006 TTS, and were even more apparent in the 2011-2012 cycle of the TTS, particularly for areas with larger populations of younger residents, residents who frequently move dwellings, and smaller households, all of which are less likely to have a landline (e.g., with resulting bias particularly apparent in downtown Toronto in the 2011-2012 TTS data collection). To address these concerns, in 2016, a primarily address-based sampling approach was adopted to increase the representativeness of the survey sample. Addresses were drawn from a Canada Post database of all mailable addresses in the study area, including both households with landlines and without. The telephone component was retained so that higher response rates could be obtained with the portion of the addresses that could be matched to listed phone numbers. The final sampling plan included a mixed sampling approach involving address-and-phone, address-only, and phone-only samples. This approach was deemed to be the optimal means of maximizing the representativeness of the final dataset.
Survey access and completion methods for the different sample types are outlined below:

P a g e | 19
2016 TTS: Design and Conduct of the Survey Transportation Tomorrow Survey
Address-and-phone: Received a notification letter. Households could complete the survey online, by telephoning the North York call centre using a toll-free/local number, or wait until they received a call from the centre to complete the survey over the phone.
Address-only: Received a notification letter. Households could complete the survey online or by telephoning the North York call centre using a toll-free/local number. These individuals did not receive calls as there was no telephone number associated with their address.
Phone-only: Did not receive a notification letter. Households were ‘cold-called’ by the North York call centre. Those who refused to complete via telephone were offered the option of completing the survey online and provided with their secure web access code and the study webpage URL (www.tts2016.ca). The phone-only sample was seen as an alternate way of reaching households without directory-listed landlines and was expected to have some overlap with the address-only sample.
Self-selected: Heard about the 2016 TTS study, either through the media or word of mouth. These households were not initially selected through the random sample but could participate by contacting Malatest either through the website or the toll-free number provided on media communication. From a public relations perspective, it was not desirable to turn people away who were interested in participating, and the number of such surveys obtained was negligible. These surveys were allowed to remain in the final dataset, as the self-selection bias for only 67 such surveys from across the entire study area should have no real appreciable impact on the overall survey results.
The address-and-phone and address-only samples were purchased from Canada Post. The phone-only sample was purchased from Canadian-based survey sampling firm ASDE.
The information available for each household in each sample type is outlined in Table 2-2.
Table 2-2: Information available by sample type
Sample Type Name Phone
number Street
Address Unit Municipality
Postal Code
Dwelling Type
Address-and-phone
Address-only
Phone-only
Verified Cell Phone
Random Digit *
White pages, no address
*
White pages listing with address**
**
*Only 3-digit postal FSA (Forward Sortation Area) available (assigned on the basis of telephone exchange). ** White pages listings with addresses were not drawn from when preparing the 2016 survey contact samples. This sample source is listed above for reference only. It may be noted that the white pages listings often are inconsistent as to whether or not dwelling unit numbers are included in the public listing. The sample provider for the 2011 TTS apparently provided directory listings including unit numbers for all apartment listings; however, it is not clear whether this was available because the company also handled work with billing addresses for telephone providers or because of improvements to the quality of directory listing information. Initial enquiries in 2016 suggested that unit numbers were not consistently available for all apartments listed in the white pages, even from the same sample provider used for the 2011 TTS.

P a g e | 20
2016 TTS: Design and Conduct of the Survey Transportation Tomorrow Survey
2.4.1 Address-based sample The advantage of the address-based sampling approach was increased coverage of dwellings in the TTS area, including better coverage of apartments. In comparison to the phone-only sample, this allowed households with cell phones and/or household without landline phone service to participate. For the 2016 TTS, the primary sample was pulled from the Canada Post mailing address database. A portion of the sample included only addresses, while a portion included listed telephone numbers that could be matched to addresses.
Appropriate volumes of each type of sample were drawn in order to achieve the desired number of survey completions for each sample type. The samples were drawn as random selections within the survey geographies, which were organized by postal code forward sortation area (FSA), or for areas where more precision was required to reflect municipal boundaries, by 4-, 5-, or 6-digit postal codes. The samples were further stratified into apartments and non-apartments to allow some fine-tuning of survey samples to meet targets by dwelling type should response rates for apartments and non-apartments be found to differ. More detail on sample management can be found in Section 5 of this report.
2.4.2 Supplemental phone-only sample Although the phone-only sample was not used throughout the data collection, it was tested and yielded a modest number of survey completions. The phone-only sample type was made up of approximately equal thirds in:
White page listings without a listed address;
‘Random Digit Dial’ (RDD) samples consisting of phone numbers for landline exchanges that were randomly generated from unlisted phone numbers ; and
Verified cell phone samples that had been ‘pinged’ to verify a functional number.
All phone-only samples were randomly selected from within the available sample for the TTS area, although less geographic precision was possible than for listings with addresses. The phone-only samples could be expected to overlap with the address-only sample, and the verified cell phone portion of the phone-only sample could be expected to overlap with both the address-only and address-and-phone samples. For these reasons, and other reasons previously mentioned (poor response rates and poor cost-efficiency), the phone-only sample type was removed in early October 2016.
2.5 Advance mail-out package An advance letter was sent to the address-only and the address-and-phone samples. This letter served to introduce the study, outline the type of data the survey was collecting, and provide contact information along with the access code for survey completion. The advance letter included the Ontario Coat of Arms, the return office of the Office of the Minister of Transportation, the signature of the Minister of Transportation and partner agency logos. Different variations of the letter content were used for the address-only and address-and-phone samples, with the main difference being the statement in the letter for the address-and-phone sample noting that the respondent may receive a call to complete the survey over the phone. Letters sent to households in the GTHA and external municipalities were differentiated only by the logos included on the bottom of the letter. See Appendix E for examples of the advance letter. Receiving the letter in advance of the call from the call centre served to increase response rates because letter recipients were informed that they would be called, they were encouraged to participate, and the importance of the study had been communicated to them.

P a g e | 21
2016 TTS: Design and Conduct of the Survey Transportation Tomorrow Survey
All letters were addressed to ‘resident’ rather than the name associated with the address because it was understood the name associated with the address could be incorrect.
The advance letter was accompanied by a fact sheet that included detailed instructions on how to access the survey, the types of survey questions they would be asked, and how a ‘trip’ is defined by the TTS. Envelopes bore the Ontario logo, the title of the Ministry of Transportation, and the return address of the North York call centre. All materials in the advance letter mail-out packages were provided in both official languages.
2.6 Communication strategies Malatest prepared a comprehensive package of communications material that was distributed to partner agencies by MTO along with recommendations for implementation. Partner agencies could make use of these recommendations, in whole or in part, at their discretion. The target audience for this information was City Councils, Transit and Transportation officials, transportation advocacy groups and advisory committees, municipal client service centres and front-line call centre staff, police, and other government groups. The packages included:
TTS 2016 fact sheet (see Appendix B);
TTS 2016 Frequently Asked Questions;
TTS Study Launch opinion editorial;
TTS 2016 Press Release (see Appendix C) ;
Promotional poster along with design elements so it could be adapted to fit other spaces (see Appendix D); and
Advance letters (see Appendix E).
2.6.1 TTS 2016 website A dedicated website for this cycle of the survey was established (www.TTS2016.ca). This website served as a form to access additional information about the study and as a portal to complete the survey online. The different areas presented on the website are listed below:
Home
About
FAQ
Survey Questions
Participants
Agencies
2.6.2 Municipal websites The TTS was also featured prominently on the MTO website as a way of promoting the survey and confirming the legitimacy of the study. Participating agencies were invited to add information regarding the TTS to their official websites.
2.6.3 Earned media The following items were provided to partner agencies for distribution to media outlets:
Press releases: A press release template was provided at the beginning of the study. It outlined the background and purpose of the TTS and included information about how residents who
P a g e | 22
2016 TTS: Design and Conduct of the Survey Transportation Tomorrow Survey
were randomly selected could participate (see Appendix C). Partner agencies may have adapted this release as appropriate to their communications approach.
Op-ed articles: An article for publication in community papers, school papers, councillors’ columns and websites, and other newsletters was provided for use. This piece outlined the background and purpose of the TTS and encouraged those who had been selected to participate to respond.
2.6.4 Social media Malatest set up a project specific twitter account3 to publicize the study. This account also provided another means by which Malatest could address, in both official languages, questions and complaints made by the members of the public. MTO tweeted about the project from their official accounts and retweeted Malatest tweets. Partner agencies were encouraged to promote the study though their existing social media accounts (i.e., Facebook, Twitter, Instagram), as well as other platforms such as e-newsletter lists. In addition to the twitter account, Malatest established a dedicated email address4 and toll-free numbers5 for residents who had questions or concerns about the survey. MTO Info also fielded questions from the public regarding the survey. Complaints that were addressed to the Ministry and required follow-up were forwarded to Malatest.
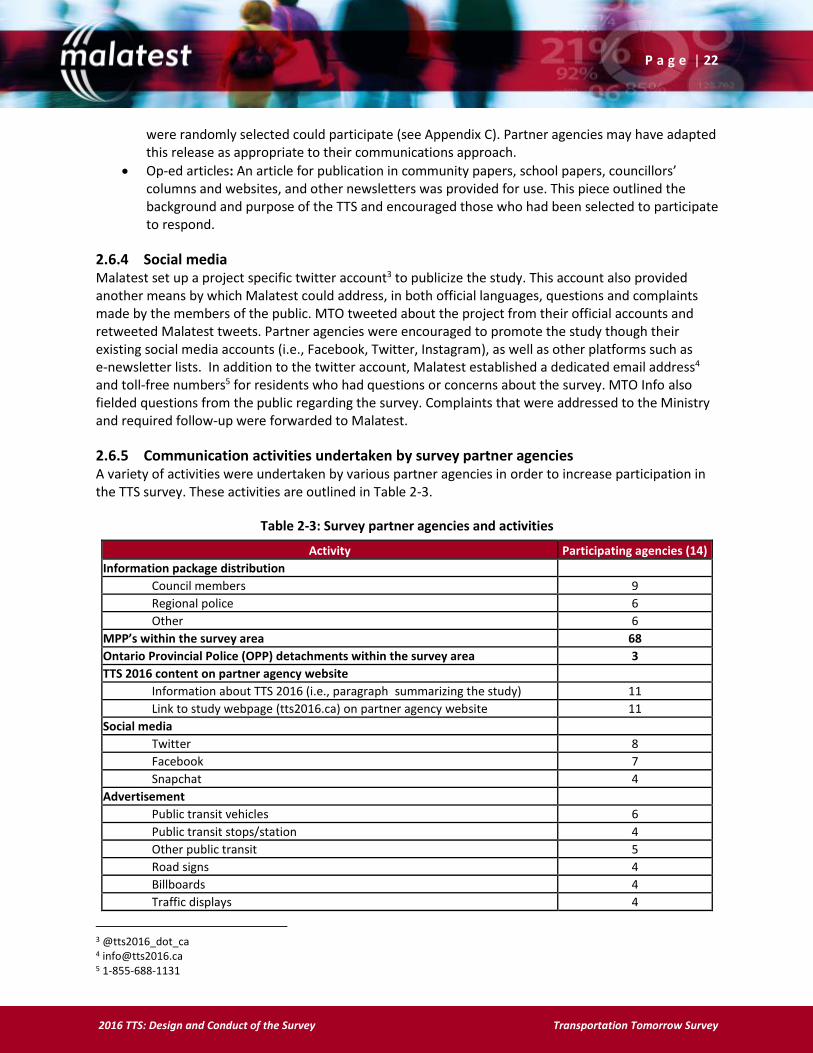
2.6.5 Communication activities undertaken by survey partner agencies A variety of activities were undertaken by various partner agencies in order to increase participation in the TTS survey. These activities are outlined in Table 2-3.
Table 2-3: Survey partner agencies and activities
Activity Participating agencies (14)
Information package distribution
Council members 9
Regional police 6
Other 6
MPP’s within the survey area 68
Ontario Provincial Police (OPP) detachments within the survey area 3
TTS 2016 content on partner agency website
Information about TTS 2016 (i.e., paragraph summarizing the study) 11
Link to study webpage (tts2016.ca) on partner agency website 11
Social media
Twitter 8
Facebook 7
Snapchat 4
Advertisement
Public transit vehicles 6
Public transit stops/station 4
Other public transit 5
Road signs 4
Billboards 4
Traffic displays 4
3 @tts2016_dot_ca 4 [email protected] 5 1-855-688-1131

P a g e | 23
2016 TTS: Design and Conduct of the Survey Transportation Tomorrow Survey
Activity Participating agencies (14)
Daily papers (i.e., Toronto Star, Hamilton Spectator) 5
Community newspapers (i.e., East York Mirror, Toronto Hispano) 7
Commuter papers (i.e., Metro, 24 Hours) 5
Other 6
Distributed press release 5
Distributed/published op-ed article 5
Other communication activities 6

P a g e | 24
2016 TTS: Design and Conduct of the Survey Transportation Tomorrow Survey
SECTION 3: Call centre The call centre that was set up specifically for the purpose of executing the 2016 TTS could accommodate approximately 145 work stations. Each station was equipped for its purpose, whether that be for conducting surveying, geocoding, administrative tasks, supervisory tasks, or facilitating a managerial function. The following sections provide details relating to the call centre location, interview site, and the equipment used.
3.1 Call centre location The search for an appropriate interview site began in the spring of 2016. Starting August 2016, the lease was signed for the office space located at 2550 Victoria Park Avenue, Suite 300, Toronto, ON, M2J 5A9. The selected location had the capacity to accommodate the required number of staff and was accessible to those residing in the City of Toronto as well as nearby subdivisions.
3.1.1 Interview site As the site was not previously utilized as a call centre, construction work was required to ensure that the space would be viable for this project. This process included revising the floor plan to incorporate the necessary interviewing stations in compliance with mechanical, electrical, and safety standards. After the plan had been developed and approved, existing workspaces and some external offices were modified or removed to accommodate the new reception, training, interviewing and monitoring areas. Networking cable connections were then installed where necessary and tested to ensure their functionality.
Surveyors were seated in individual cubicles with dividers approximately six feet tall between them. The fabric coverings reduced noise levels to the extent possible. Supervisors were seated at stations with low cubicle walls to allow for visual monitoring of the floor so that they could quickly assist surveyors during calls. Each team occupied a separate area on the floor which also helped to reduce noise levels. A layout of the final survey site for the TTS of 2016 is shown in Figure 3-1.
Figure 3-1: TTS North York call centre layout
P a g e | 25
2016 TTS: Design and Conduct of the Survey Transportation Tomorrow Survey
Malatest organized the floor layout into three distinct areas for each of the three main survey interviewing teams. Teams A, B, and C, each had their own bank of approximately 40 stations. Each trainee group was given a tour of the floor and familiarized with the section they would occupy. Each team lead made use of the floor layout to create a daily seating plan for every surveyor on their team. Due to the large size of the call centre, signs identifying the location of each team were posted in various locations within the call centre.
To gain access to the building, each employee was issued a pass card issued in their name. During regular office hours (8:00am to 6:00pm) staff could enter the building and use the elevator, but once arriving at the survey floor a pass card was needed to enter the survey space. Outside regular office hours the pass card was also needed to enter the building and operate the elevators.
3.2 Equipment During the set up of the call centre space, a significant amount of time and energy was dedicated to purchasing and installing the equipment required for the successful execution of the study. The necessary steps were taken to ensure internet and phone connections were reliable, uninterrupted, and secure.
3.2.1 Computers The call centre site was equipped with approximately 140 HP computers (Intel Core i5-2400 CPU, 3.10GHz Processor, 4GB RAM). The interviewing stations were divided into three main teams, each with approximately 40 stations. A number of stations were initially used for training purposes and eventually became surveying stations. Geocoding staff generally worked outside interviewing hours and could, therefore, utilize available interviewing stations for their work. The remaining computers were operated by the management team, supervisors, and the monitoring team.
All surveying stations were set up with Debian Linux and customized to create specific and limited profiles for each of the staff roles (i.e., training, interviewing, reviewing and geocoding). Each of the monitoring stations was set up to mirror the screen of any of the surveying workstations and audio monitor the interview in progress using a silent telephone monitoring system. Non-surveying stations were configured with Windows 7 Professional.
Internet access from the non-management computers was not permitted except by the geocoders who were assigned a specific profile that allowed them to access the internet. The same workstation model was used throughout the call centre: HP 6200, Intel Core i5-2400, 3.10 GHz, 4GB RAM, 250 GB disk, with a 19 inch LCD display. Surveyor and geocoding stations were set up with Debian Linux and configured with the DDE software package.
The call centre workstations were set up to use Debian Linux, and the workstations were set up appropriately to allow storage of used sample on each station in a local PostgreSQL database. This was an essential reliability feature to ensure that the information provided by a respondent would not be lost if the software crashed, power was lost, or another technical problem occurred. A profile was created for the interviewer/reviewer/post-processor, and the geocoder user classes. Different profiles had different passwords associated with them to comply with the requirements of the Debian install. A special training profile was created which used a specially configured DDE to ‘talk’ to the training sample server. Supervisory and coaching stations were configured with Windows 7 Professional to facilitate the consistent formatting of documents across the company. All stations were installed with Zoiper client software to make use of the VoIP implementation.

P a g e | 26
2016 TTS: Design and Conduct of the Survey Transportation Tomorrow Survey
3.2.2 Wiring structure Due to renovation of the leased space, the floor was wired with brand new CAT 6 cabling running a gigabit network. With the layout of the wiring runs, Malatest was able to limit the required switches to just six to cover the entire network, ensuring that switches, routers and servers all remained in secure locations to prevent tampering or unauthorized access.
3.2.3 Computer network and servers A single network was created using the 10.0.5.0/24 address range that covered all devices on the network. Surveying stations and servers were assigned static IP addresses with remaining devices provisioned via DHCP. The host part of each IP address corresponded to the extensions in the VoIP system. This arrangement permitted team leads and coaches to easily locate and monitor the performance of each staff member.
A Linux-based firewall solution (Pfsense) was used as the firewall and router between the network and internet. IPS/IDS and usage monitoring was installed on the firewall to protect against unauthorized access into the network, and to monitor internal usage of the internet. The servers used to support the DDE system, their specifications, and server configurations are outlined below. The CallWeb system for online surveys was supported by Malatest’s own internal server resources housed in offices within Canada (no data were stored in cloud systems or outside the country).
In the 2016 TTS, there were two Dell Power Edge R430 servers. The configuration of these servers was as follows:
OS: Windows Server 2012 R2 Data Center Intel Xeon E5-2650L v3 1.8GHz, 30M Cache, 9.60GT/s QPI, Turbo, HT, 12C/24T (65W) Intel s3500 SSD 600GB * 4 in Raid 10 configuration 64 GB
Each TTS server ran Windows with Debian Linux stable-version virtual machines containing the following elements (similar to 2011):
Java Sample Management System server application;
PostgreSQL database for samples;
PostgreSQL database for reference data-lighttpd web server for displaying the HTML reports generated daily; and
System access for administrators to extract real-time statistics from the sample containing databases.
Other server hardware included:
Firewall: Lenovo System x3250 M5 1 x Intel Xeon E3-1271v3 8GB DDR3 4 x 1TB SATA drive (Raid 10) 2 x 460W Hot swap power supply
VoIP Server: ThinkServer RD350 2 x Intel Xeon E5-2603v3

P a g e | 27
2016 TTS: Design and Conduct of the Survey Transportation Tomorrow Survey
16GB DDR4 4x 600GB SAS drive (Raid 10) 2 x 550W hot swap power supply
Numerous scripts from the previous survey runs were reused to aid in operational decision making. Some scripts were developed on the fly to accommodate new operational requirements, such as more detailed daily and weekly reporting than was undertaken in previous survey cycles, or to accommodate the data logistics associated with running the survey concurrently on both DDE and CallWeb platforms for telephone and online surveying.
The DDE system was set up to run three virtual servers to manage approximately equal portions of the survey contact sample. The three virtual servers were set up to ensure that the system response times were faster than if the entire sample had been managed by a single server instance, and this also helped to organize the workload responsibilities for each survey interview team. A fourth virtual server was later set up to run separately to compensate for limitations of the DDE system with respect to the quantity of sample that could be uploaded.
Each workstation computer was capable of fulfilling any role in the survey, with the appropriate user log-in. This feature was used to increase interviewing capacity by converting monitoring and reviewing stations into interviewing stations when necessary for the evening shift.
3.2.4 Telephone Similar to 2011, the 2016 TTS used regular phone lines, with Ministry of Transportation’s consent to have “ONT GOVT” shown on the call display of the household receiving the call. The call display was intended to add validity to the survey and increase interviewers’ chances of conducting interviews. A VoIP PBX system using SIP trunking was used to provide telephony to the entire call centre. SUIP services were provided by Rogers for a total of 175 lines.
Specific systems used were CentOS 6.8, Asterisk 13, and FreePBX 13. The benefits of these systems included lower cost, forced call recording functionality, and an ability to have granular control over all features such as call records inbound and out, IVR functionality, call display, and other functions of the telephony system. Each team lead and team was provided with a hard phone for surveyors to call in for HR & admin related issues. Surveyors and coaches used USB headsets to conduct surveying and call monitoring.
3.2.5 Backup schedule The backup schedule was set to run overnight before the TTS software would move samples between top level stages. A backup of the database was synchronized from the DDE servers to the file server. As part of Malatest’s disaster recovery plan, the file server was backed up nightly (via encrypted protocols) to its main office in Victoria, BC, and an additional offsite location. CallWeb servers were also backed up nightly as part of the standard Malatest disaster recovery plan.

P a g e | 28
2016 TTS: Design and Conduct of the Survey Transportation Tomorrow Survey
SECTION 4: Pilot test A pilot survey was conducted prior to the full survey administration, from July to August of 2016. The results of the pilot test served to assess the integration of the CallWeb-CAWI survey instrument used for online survey completions. Results of the pilot also provided an indication of the response rates that could be expected for the different sample types during full launch, and the efficacy of the different communication pieces. With respect to the communication materials, different options for the advance letters that would be mailed to potential respondents during the full launch were tested. In addition, the pilot mail-out tested the types of sample to be utilized during the full launch, postage options, the inclusion of a detailed instruction sheet, and the use of the listed name in the address block. The results of the pilot survey were essential in preparing for the launch of the TTS survey in September, 2016.
Prior to sending out the advance letters, Malatest programmed and thoroughly tested the CallWeb CATI/CAWI survey instrument that was later used for the online survey completions. The preparation of the sample was then arranged and the pilot survey initiated with the distribution of the advance letters on Friday, July 22nd. Field test respondents who required support were provided with a toll-free number and email address to contact the Transportation Tomorrow Survey Team. Field-testing activities included verification of the Call Web - CAWI survey programming, minor programming corrections, training of support staff, field testing of the online questionnaire, and obtaining feedback from participants and support staff.
The pilot survey sample included 2,998 randomly selected cases purchased from Canada Post. Half the sample (1,499) cases had both address and phone number information (i.e., address-and-phone sample), and the other half included an address but no phone number (address-only sample). The sample was stratified further to test the impact of the following items on the online response rate to the survey: postage (Letter Mail vs. Personalized Mail); inclusion (or not) of a detailed instruction sheet; and addressee in address block (i.e., listed name from the Canada Post database compared to ‘Occupant’ or ‘Resident’.) Personalized Mail, previously known as Addressed Admail, is a form of mail that applies to the mailing of materials approved as ‘promotional’ in nature, but which sometimes requires more time for Canada Post to process and deliver it. When letter processing volumes are high, regular Letter Mail has priority. Response rates for Personalized Mail were tested against those for regular Letter Mail to determine whether respondents were more likely to receive and respond to letters sent via Letter Mail. It may be noted that the field test sample was mailed from a British-Columbia based mail house, which may have affected the relative delivery dates of the Personalized Mail and Letter Mail samples.
During the pilot survey, a total of 333 surveys were completed, one of which was completed in French. The cumulative number of responses by day is shown below. The cumulative response by Personalized Mail and Letter Mail is also shown.

P a g e | 29
2016 TTS: Design and Conduct of the Survey Transportation Tomorrow Survey
Figure 4-1: Pilot survey response
Results of the pilot indicated that households that abandoned the survey before completing were more likely to be larger. During full survey administration, timely telephone follow-up with partial completes was used to increase the overall response rate of the study.
Of the 333 surveys completed, most (88%) were completed entirely online by the participant with no support required. A small percentage of participants began the survey online and completed it over the telephone. However, for the most part, those who telephoned support staff completed the survey entirely by phone. The most common reason provided for not completing the survey online was not having a computer in the household. Households from the address-and-phone sample were more likely to phone in for assistance than those in the address-only sample.
During the pilot test, the response rate for the address-and-phone sample was higher than the address-only sample. Although letters sent with Personalized Mail arrived two days later than those sent with Letter Mail, there was no significant difference between the response rates of the two groups. In terms of receiving instructions in the communications package, there was no significant difference in the response rate of those who received instructions and those who did not. In fact, the response rate was slightly higher for those who did not receive instructions. However, the sample sizes were not sufficiently robust to definitively conclude that the survey instructions were without positive effect.
Table 4-1: Method of completion by sample type based on pilot test
Sample
Response entirely online
Started online, completed by phone
(called in for assistance)
Response entirely by
phone (call in)
Total Response Rate
Address &phone 1499 12.1% 0.5% 1.3% 13.9%
Address-only 1499 7.5% 0.1% 0.7% 8.3%

P a g e | 30
2016 TTS: Design and Conduct of the Survey Transportation Tomorrow Survey
Results of the pilot survey indicated a median survey duration time of approximately 23.5 minutes. It should be noted that the pilot survey version included additional questions for testing purposes and to obtain feedback from respondents. Participant feedback and pilot survey data was used to make slight improvements to the survey before the full survey launch. For example, an update was made to the Google Maps function within the CAWI software in order to reduce the time it took for participants to complete the survey.
Based on the results of the pilot, the following recommendations for full survey administration were made and implemented:
sending advance letters via Personalized Mail, (although Personalized Mail has a longer service standard for delivery, and the transit time for Personalized Mail proved to be two days slower than Letter Mail, use of Personalized Mail was justified by the considerable savings this postage option would realize);
monitoring the use of instructions page for address-only sample (to further explore the initial pilot test finding that the instructions page did not appear to positively impact response rates);
addressing all letters to ‘Resident’ (survey invitations addressed to Resident were more likely to be answered than those addressed to ‘Occupant’), (this was to imply that even if an individual had relocated, the current resident in that household could still participate); and lastly,
updating communications material to indicate the online survey would take approximately 20 minutes to complete, while estimated time for telephone completions was approximately 10 minutes (this is wan in part due to more accurate results via telephone survey, but also an option for those willing to complete the survey but preferring a shorter time frame).
Subsequent to implementation of these recommendations in full survey administration, further testing of the inclusion/exclusion of the instructions page with much larger mail-out samples revealed higher online response rates amongst households receiving the instructions page. Thereafter, it was included in all subsequent mail outs.

P a g e | 31
2016 TTS: Design and Conduct of the Survey Transportation Tomorrow Survey
SECTION 5: Sampling plan and sample management A sampling plan served as a guide to determine the quantities of households by different sample type in each of the municipalities included in the 2016 TTS survey to periodically mail out letters to. The target number of surveys to obtain for each TTS region was set based on 2016 dwelling estimates by municipality developed by DMG from forecasts based on growth trends observed in past cycles as 2016 Census data were not yet available. The survey targets by region agreed on with the TTS partner agencies were followed. In some cases, the actual 2016 dwelling counts from the 2016 Census may differ from the original forecasts, so the final sampling rate actually achieved may occasionally differ slightly from the target 5% sampling rate for most of the study area (3% in Hamilton).
Sampling control was achieved at the level of forward sortation area, FSA (first three digits of the postal codes), or full six-digit postal code for large rural areas, or, for FSAs that crossed municipal boundaries, the first four-, five- or six-digits of the postal code. Data on available mailable addresses for apartments and non-apartments and available address-only and address-and-phone sample was used to develop detailed targets by sample type and apartments/non-apartments by municipality within each region and for the detailed postal geographies within each municipality.
A mailing plan outlined the number of letters that would be mailed out on a given day to ensure that interviewing would not be delayed by the delayed delivery of letters. Each mail-out included a cross-section of available sample for all geographies, in order to ensure that the survey completions within each geography were distributed across the full fall data collection period.
With the use of the online component in the 2016 TTS, all samples had to be uploaded to the DDE and CallWeb independently. The following sections further discuss implementation of the mailing and sampling plan.
5.1 Mailing Plan The mailing plan was updated throughout the data collection phase of the project based on performance statistics. A full schedule of the final mailing plan developed for the address-only and for the address-and-phone sample types is presented below in Table 5-1 and Table 5-2. As survey progress was regularly assessed, and geographic quotas were met, the sizes of the mailout batches were adjusted accordingly, with the last few mailouts including smaller quantities of letters targeted for sample groups that were below target. The November 28 address-and-phone mail flight was considerably larger than other mailouts of the same time, in order to target more survey completions from certain areas for which response rates had recently been reassessed as having declined, and to include a recently received sample of farm addresses which Canada Post had inadvertently excluded from previous sample draws (farm addresses are sometimes business addresses, sometimes jointly business and residential).
Table 5-1: Mailing plan - address-only sample
Mailing Date Flight Code Number of Letters
6-Sep-16 202 15,498
8-Sep-16 203 15,498
15-Sep-16 204 15,498
30-Sep-16 205 41,141
6-Oct-16 206 38,552
12-Oct-16 207 38,558
14-Oct-16 208 38,532

P a g e | 32
2016 TTS: Design and Conduct of the Survey Transportation Tomorrow Survey
Mailing Date Flight Code Number of Letters
18-Oct-16 209 38,544
20-Oct-16 210 38,550
25-Oct-16 211 38,584
27-Oct-16 212 38,550
1-Nov-16 213 43,998
4-Nov-16 214 43,998
9-Nov-16 215 45,567
15-Nov-16 216 48,292
18-Nov-16 217 48,292
22-Nov-16 218 48,291
24-Nov-16 219 51,511
29-Nov-16 220 51,507
29-Nov-16 221 12,735
8-Dec-16 222 6,228
8-Dec-16 223 8,819
Total Mailed 766,743
Table 5-2: Mailing plan - address-and-phone sample
Mailing Date Flight Code Number of Letters
2-Sep-16 101 6,000
6-Sep-16 102 7,200
8-Sep-16 103 7,200
13-Sep-16 104 7,200
15-Sep-16 105 7,200
20-Sep-16 106 7,270
22-Sep-16 107 8,649
5-Oct-16 108 8,649
7-Oct-16 109 8,648
12-Oct-16 110 8,648
14-Oct-16 111 8,648
17-Oct-16 112 8,648
19-Oct-16 113 8,648
21-Oct-16 114 8,648
26-Oct-16 115 8,648
2-Nov-16 116 8,648
10-Nov-16 117 10,744
14-Nov-16 118 10,744
16-Nov-16 119 10,743
18-Nov-16 120 10,716
21-Nov-16 121 9,526
23-Nov-16 122 6,198
25-Nov-16 123 6,205
28-Nov-16 250 24,801
29-Nov-16 124 668
8-Dec-16 125 4,606
Total Mailed* 223,503 *Note: The total address-and-phone sample used was 223,640 cases. 137 cases were added to the address-and-phone sample in the DDE system and were called even though they were never mailed as part of the mailing plan.
P a g e | 33
2016 TTS: Design and Conduct of the Survey Transportation Tomorrow Survey
When sample files were received from Canada Post, the files were processed to exclude address listings for Forward Sortation Area (FSA)/postal codes that had reached target in the interval between ordering and receiving the sample files from Canada Post. The remaining records were sorted using a random number generator and assigned to mailing flights.
Each case was assigned a TTSID (a six-digit number used to access the case in DDE) and a secure alphanumeric online access which was featured prominently in the letter. Those who wished to phone in provided their secure online access code, which was searched within the master sample database by reception staff who routed the call to the appropriate team.
Letters were printed at and sent by a mailing house. The files for each mailing group were sent to the mailing house by email at least five days before each mail-out. All letters were sent by Personalized Mail (return postage guaranteed, with the tracking of returned mail providing a possible means to identify errors in the Canada Post address database or issues with the mail-outs, should any errors or issues arise). Two mail houses printed and processed different portions of the sample: the address-and-phone sample was mailed from a mail house based within the GTHA to ensure the earliest possible delivery for better coordination of telephone calling start dates for each flight of letters, whereas the larger-volume address-only sample was sent from a British Columbia-based mail house. In practice, delivery turnaround times from date of mailing were somewhat variable for sample sent from both mail houses, perhaps dependent on mail processing workloads at Canada Post mail sortation facilities, although major delays in delivery were uncommon.
The sample for the mailing lists was selected based on the total number of completions remaining to meet the target for each FSA or postal code. The targeted number of surveys to obtain in each geography was based on the projected number of completions for the sample drawn at that time in consideration of the response rate for the sample that had been in the field for greater than three weeks.
All samples were uploaded to the data collection systems prior to being delivered to the mail house. Address-and-phone sample was activated for outbound dialing one week after they had been mailed. The white-pages-with-address sample type was used during live training in late-August and when a delay in the delivery of a batch of Canada Post sample occurred.
5.2 Sample distribution Usage of each sample type was adjusted over the course of data collection, based on actual response rates achieved. As noted, use of phone-only sample was discontinued, after a small amount of this sample had been utilized. Table 5-3 outlines the distribution of sample by source, the expected and actual response rates, and percentage of final completions for each sample type. As indicated, even though response rates differed from what was planned, and the phone-only sample was considerably reduced after it proved to be cost-inefficient, through careful sample management, a generally equal balance was obtained between the address-and-phone and address-only sample types.

P a g e | 34
2016 TTS: Design and Conduct of the Survey Transportation Tomorrow Survey
Table 5-3: Expected and actual distribution of sample and completions by sample type
Planned Actual Sample Type Planned
Percentage of Total Contact Sample
Expected Response
Rate
Expected Percentage
of Final Completions
Actual Percentage
of Total Contact Sample
Actual Response
Rate*
Actual Percentage
of Final Completions*
Address-and-phone 14% 44% 47% 22% 37% 51%
Address-only 86% 7% 47% 76% 10% 49%
Phone-only 5% 17% 7% 1% 7% 1%
Total 1,243,067 13% 161,200 1,004,840 16% 162,708
*Final figures based on valid cleaned surveys in the final dataset after removal of excess/rejected surveys.
5.3 Sampling plan by municipality Based on the response to the online survey during the pilot test, the telephone response for previous cycles of TTS, and household counts from Canada Post, a sampling plan was developed outlining the sample size requirement for each municipality. As mentioned, the different types of samples utilized for the full launch included address-and-phone, address-only, phone-only, and white pages with addresses. The phone-only sample was cancelled shortly after the launch of the survey due to the number of reasons mentioned previously.
Table 5-4 on the following page outlines the targeted and actual survey completions for each in-scope municipality. The overall target was also surpassed by the total number of surveys completed. It may be noted that while more than 171,300 surveys were obtained, after data cleaning and validation, the final dataset was 162,708 records. The majority of municipalities achieved a higher number of survey completions than targeted. Only the cities of Brantford and Peterborough achieved less than 99.5% of target. It may be noted that geographic targeting for certain municipalities was difficult, as the postal code FSAs (and even some of the smaller postal geographies used) did not always conform to municipal boundaries. For example, even though initial tallies by postal geography suggested that targets were met for City of Peterborough, after final geocoding of household coordinates, some households assigned by FSA to the City were reassigned to Peterborough County, with the final number of confirmed surveys for the City being under target (although a 5% sampling rate was actually achieved). Conversely, the sampling rate is sometimes less than 5% for certain municipalities that exceeded targets. This is due to the survey targets having been developed in early 2016 for a target 5% sampling rate (3% in Hamilton) applied to a forecast estimate of dwelling counts; The forecast estimates differed from the eventual 2016 Census dwelling counts, which were released in February 2017 after survey administration had ended. It may be noted that the TISC reviewed and approved the survey targets with the understanding that the forecast estimates on which they were based might not perfectly align with the actual 2016 Census counts.

P a g e | 35
2016 TTS: Design and Conduct of the Survey Transportation Tomorrow Survey
Table 5-4: Target survey completions and actual completions by Municipality
TTS Regions (Municipalities)
2016 Initial
Forecast (DMG)
2016 Address Counts
(Canada Post)
2016 Census Counts (private
dwellings occupied by
usual residents)
Target Survey
Completions
Final Survey Completions
(after validation)
% of Survey Target
Achieved
Actual Sampling
Rate Achieved
Toronto 1,083,285 1,015,584 1,112,929 53,547 54,350 101% 4.9%
Durham 233,850 217,644 227,906 11,559 11,700 101% 5.1%
York 372,178 342,463 357,084 18,397 18,374 100% 5.1%
Peel 449,174 408,568 430,180 22,203 22,105 100% 5.1%
Halton 198,294 181,752 192,977 9,802 9,772 100% 5.1%
Hamilton 211,580 212,634 211,596 6,275 6,424 102% 3.0%
Niagara 181,508 176,783 183,828 8,972 9,098 101% 4.9%
Waterloo 194,548 199,195 203,832 9,617 9,790 102% 4.8%
Guelph 49,884 53,586 52,090 2,466 2,487 101% 4.8%
Wellington 22,821 17,775 22,121 1,128 1,207 107% 5.5%
Orangeville 11,224 8,953 10,565 555 554 100% 5.2%
Barrie 59,611 51,131 52,476 2,947 2,956 100% 5.6%
Simcoe 116,025 112,873 117,583 5,735 5,817 101% 4.9%
Kawartha Lakes 31,541 32,015 31,106 1,559 1,556 100% 5.0%
City of Peterborough 33,390 38,695 34,710 1,650 1,580 96% 4.6%
Peterborough County 17,727 14,770 17,455 876 931 106% 5.3%
Orillia 13,380 14,827 13,477 661 665 101% 4.9%
Dufferin 11,881 12,756 11,353 587 637 109% 5.6%
Brantford 39,406 41,198 39,215 1,948 1,912 98% 4.9%
Brant 14,507 10,881 13,507 717 793 111% 5.9%
Total 3,345,811 3,164,083 3,335,990 161,200 162,708 101% 4.9% Notes: The target number of survey completions was based on 2016 dwelling forecasts prepared by DMG (as 2016 Census data were not available at the time survey planning was undertaken) and targets were agreed on by participating agencies in early 2016. The Canada Post address counts are listed in the table for reference. The Canada Post address counts for some municipalities were approximate based on apportionment of addresses to municipalities for FSAs that straddle municipal boundaries. Canada Post address counts may include unoccupied dwellings, but may exclude a portion of dwelling units enumerated by the Census, such as a basement apartment in a single detached house without a separate mailing address. The Sampling Rate is the ratio of surveys to 2016 Census private dwelling counts.
5.4 Sample management As the DDE and CallWeb were two different ways to complete the survey, all sample had to be uploaded to each system independently. Many households in the address-and-phone sample might elect to complete the survey online in the CallWeb system after receiving their survey invitation letter, while others might only complete when contacted by telephone via the DDE system. Similarly, some of the households in the phone-only sample contacted by telephone might request the URL and an access code to complete the survey online. While most households in the address-only sample were expected to complete the survey online, some might elect to call the toll-free number to complete the survey via telephone interview via the DDE system.
Within the DDE software, the sample was split into three portions, each uploaded to a different virtual server, although any given survey case (and associated server) could be accessed from any survey station. Within the DDE software, the 2016 TTS Sample Management System (SMS) unified all aspects of interviewing and the subsequent validation stages within a single environment. This allowed each

P a g e | 36
2016 TTS: Design and Conduct of the Survey Transportation Tomorrow Survey
sample for which telephone contact was made to be identified in full detail at each step through the interviewing, reviewing, geocoding and post-processing top-level stages.
For online surveys, the sample was uploaded to Malatest’s CallWeb servers so that any case could be accessed by a responding household at any time. All households sampled, including those from the phone-only sample type, were eligible to complete the survey online. The online survey was open to participants to begin participating at any time between the receipt of their advance letter and the final day to begin a new survey (December 19, 2016). For data security reasons, once a survey was completed, the case was locked and could not be entered again through the web interface. Survey validation and subsequent edits were performed on a database that was updated automatically overnight each day.
The sample was imported into the SMS and CallWeb before sending out each mailing block. Within the DDE system, each mailing block was split between the three interviewing team virtual servers according to their staffing levels and relative productivities. A fourth virtual server was set up when it became apparent that the DDE system could only accommodate a maximum of 900,000 cases (with household ID’s limited to six digits, or from 100000 to 999999), while the conduct of survey required in excess of 1,004,000 cases to be uploaded. The fourth virtual server was set up with a separate sample containing cases that could not be housed in the regular three-server system, with temporary IDs assigned between 100000 and 999999 that duplicated IDs on other servers. These cases were later integrated into the full sample, overwriting the temporary duplicate IDs in the final dataset with the actual household ID assigned in the master sample file.
Malatest originally proposed developing a bridge that would load data from CallWeb surveys directly into the DDE system, which would have had the advantage of being able to leverage the DDE system’s visual review reports and processes, instead of having to develop a parallel version using CallWeb data extracts. After discussion with subcontractors as well as DMG, it was determined that a bridge between the data collection systems was not a viable solution, as direct access to the underlying DDE data tables might cause unintended consequences. Due to the way sample was managed within the DDE system, there was a possibility that updates from the CallWeb server might compete with updates to the SMS for sets of cases managed by the virtual servers in virtual working tables. The existing programming associated with updating and acting on changes to internal fields in the SMS/DDE system was complex, and any errors or glitches in the updates to the data tables might interfere with the usual case management workflow. Instead, a simpler approach known as the ‘bot transfer’ was developed that sent keystrokes to the DDE module in order to update individual cases, thus ensuring that the usual processes to update case statuses and workflow would be applied appropriately by way of programming that was already well-tested. This approach had to be run manually once per day. This involved pulling the TTS identifications for cases that had been completed online the previous day and initiating the transfer.
In addition to the development of the bot that would transfer data from CallWeb to DDE, regular transfers of data were undertaken in the opposite direction, from DDE to CallWeb, in order to ‘lock out’ online survey cases that had already been completed in DDE. In doing so, it prevented duplicate surveys being completed over the phone and online by the same household.
A process was developed to enable the online survey completions go through the same validation process as the telephone surveys, including visual review of printouts and tracking of the review stages

P a g e | 37
2016 TTS: Design and Conduct of the Survey Transportation Tomorrow Survey
and validation outcomes. A database system was set up to conduct a battery of validation tests identical to those in the DDE system and to allow edits to completed online surveys.
Both telephone and online survey completions went through a process with four top-level stages: interviewing, reviewing, geocoding and post-processing. These are outlined in Figure 5-1. At each top-level stage there are three options: the stage is not yet complete (circle x), the sample is rejected at that stage (squared checkmark) or the sample is complete and can be transitioned into the next top-level stage (circled checkmark). This process is the same one used in 2011 TTS, and was applicable to surveys completed online and over the phone.
Figure 5-1: Sample life cycle - DDE and online survey
The SMS server software controlled access to the sample and invoked a transition process that would take place overnight which would change samples between the top-level stages. Access to sample was controlled through a variety of queues for interviewers and geocoders. These queues supplied the available sample when requested by the interviewer or geocoder. Reviewers manually searched for a household to view and post processors used a sophisticated search query interface to identify which samples were most in need of additional work.
Import household sample by mailing
block
Perform reviewing
Perform geocoding
Perform post-processing
Reject from interviewing
Reject from reviewing
Reject from geocoding
Reject from post-processing
Export household sample into iDRS
format
Perform interviewing: telephone and online

P a g e | 38
2016 TTS: Design and Conduct of the Survey Transportation Tomorrow Survey
The Administration Client (AC) used in 2011 was also used in the 2016 TTS to apply the management control on the SMS for the management of telephone survey administration. As in 2011, the AC included the following features:
• Activation/Deactivation of Mailing Blocks; • Activation/Deactivation of Forward Sortation Areas; • User creation and role assignment including role specific details such as assigning languages
for interviewers and coding zones for geocoders; • Generation of interviewing and geocoding performance statistics for weekly, monthly and
arbitrary date ranges; and • Control of which optional batch processes were executed during the nightly transition
process. Only the transition from Interviewing to Reviewing was automatic. The transitions from Reviewing to Geocoding, Geocoding to Post-processing and Post-processing back into Geocoding all required manual Management intervention.
Similarly, the 2016 TTS also performed daily monitoring of the disposition of samples in each stage of the survey using both real-time and daily generated reports, as was done in 2011. These were used to determine the following:
• Changes required in the mailing schedule; • The appropriate time to activate a new mailing block; • The number of geocoding samples per coding zone; • The appropriate allocation of interview staff to interview stations; and • The de-activation of Forward Sortation Areas that had achieved their completion targets.
Information from both the DDE and CallWeb systems was regularly integrated for tracking, sample management, and ongoing progress reporting purposes.
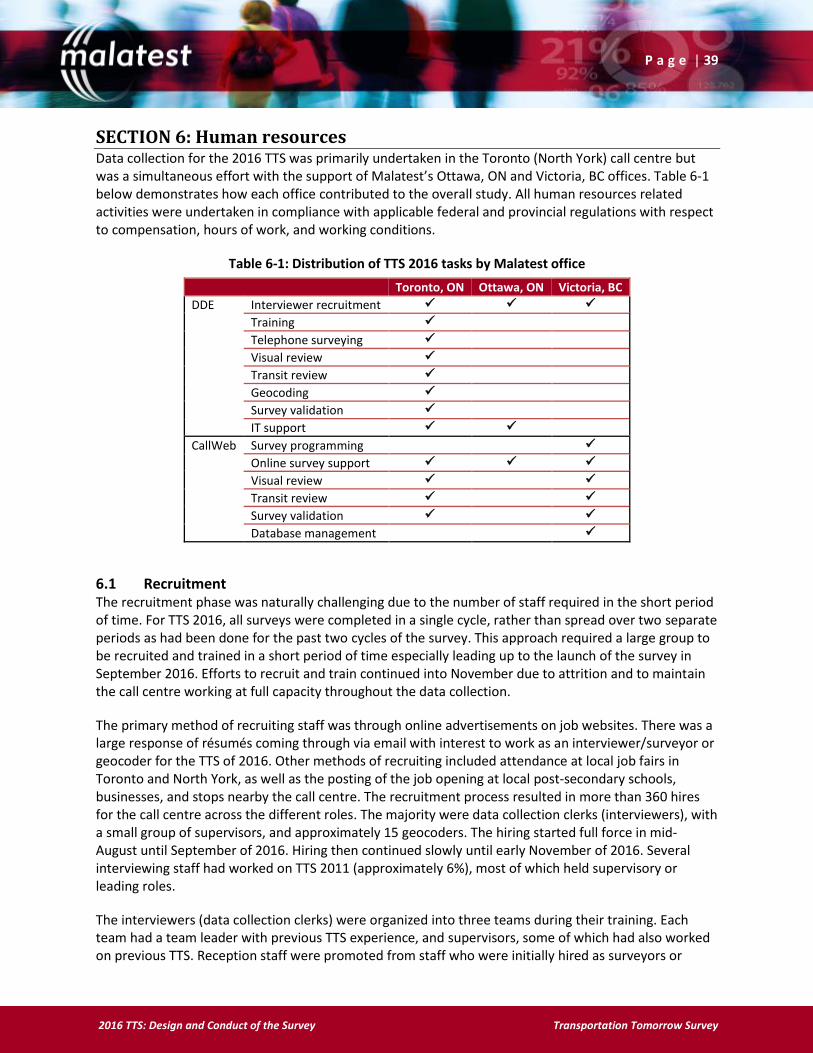
P a g e | 39
2016 TTS: Design and Conduct of the Survey Transportation Tomorrow Survey
SECTION 6: Human resources Data collection for the 2016 TTS was primarily undertaken in the Toronto (North York) call centre but was a simultaneous effort with the support of Malatest’s Ottawa, ON and Victoria, BC offices. Table 6-1 below demonstrates how each office contributed to the overall study. All human resources related activities were undertaken in compliance with applicable federal and provincial regulations with respect to compensation, hours of work, and working conditions.
Table 6-1: Distribution of TTS 2016 tasks by Malatest office
Toronto, ON Ottawa, ON Victoria, BC
DDE Interviewer recruitment
Training
Telephone surveying
Visual review
Transit review
Geocoding
Survey validation
IT support
CallWeb Survey programming
Online survey support
Visual review
Transit review
Survey validation
Database management
6.1 Recruitment The recruitment phase was naturally challenging due to the number of staff required in the short period of time. For TTS 2016, all surveys were completed in a single cycle, rather than spread over two separate periods as had been done for the past two cycles of the survey. This approach required a large group to be recruited and trained in a short period of time especially leading up to the launch of the survey in September 2016. Efforts to recruit and train continued into November due to attrition and to maintain the call centre working at full capacity throughout the data collection.
The primary method of recruiting staff was through online advertisements on job websites. There was a large response of résumés coming through via email with interest to work as an interviewer/surveyor or geocoder for the TTS of 2016. Other methods of recruiting included attendance at local job fairs in Toronto and North York, as well as the posting of the job opening at local post-secondary schools, businesses, and stops nearby the call centre. The recruitment process resulted in more than 360 hires for the call centre across the different roles. The majority were data collection clerks (interviewers), with a small group of supervisors, and approximately 15 geocoders. The hiring started full force in mid-August until September of 2016. Hiring then continued slowly until early November of 2016. Several interviewing staff had worked on TTS 2011 (approximately 6%), most of which held supervisory or leading roles.
The interviewers (data collection clerks) were organized into three teams during their training. Each team had a team leader with previous TTS experience, and supervisors, some of which had also worked on previous TTS. Reception staff were promoted from staff who were initially hired as surveyors or

P a g e | 40
2016 TTS: Design and Conduct of the Survey Transportation Tomorrow Survey
supervisors and who had the skills, availability, and interest to work in an administrative role. These staff members helped with the administrative process of the ongoing hiring until November of 2016 and with overall payroll. They were available to assist those working at the call centre with inquires regarding their pay and to support the teams with scheduling tasks.
As the project initiated, an inbound group of staff for daytime was formed in one of the teams, to keep up with the frequent daytime calls from participants. As in the previous TTS, a daytime supervisor was appointed with responsibility for ensuring that enough staff was available during the day to carry out functions such as answering the phone and making scheduled callbacks. The scheduling of staff to review the interviews conducted the previous day was the responsibility of the individual team leaders.
Table 6-2 shows how the number of staff varied over the course of the 2016 data collection. Some staff stayed on throughout the course of the data collection and others worked for a short period of time. Due to the nature of the work taking place mostly in the evenings, some staff were students, others were taking up extra work in addition to a regular job, others were new to Canada and obtaining their first job, and others were looking for a part-time role that offered them the flexibility to balance other responsibilities.
Table 6-2: Number of North York call centre staff
Duration of employment
# of employees % of employees
1-7 days 45 13%
8 – 30 65 18%
31-60 72 20%
61+ 178 49%
Total 360 100%
Over 500 job recruitment interviews were conducted by Malatest staff overall. Approximately 360 staff members were on the payroll at the North York call centre throughout the project period of late August 2016 to March 2017. Approximately 45 staff members were hired in the Victoria, BC, office, and approximately 25 in the Ottawa office.
Overall, Malatest hired approximately 430 staff across all roles, part-time and full-time across all Malatest offices to support the 2016 TTS. The methods used to recruit staff included:
Contacting existing Malatest staff members who have worked as surveyors on other projects and would be suitable for the TTS;
Contacting interested individuals who worked on prior cycles of the TTS;
Contacting individuals recommended by existing staff; and
Completing additional recruitment via other methods such as: o Posting job ads on online job sites, including LinkedIn, Government of Canada Job Bank,
and monster.ca, as well as social media; and o Attending and recruiting individuals at job fairs (Toronto and North York).
Job advertisements were posted starting in July 2016 and remained active for the duration of the survey period. Applications were continuously reviewed and phone interviews were conducted well into the early stages of the survey until November of 2016. As staff attrition occurred, the survey continued at

P a g e | 41
2016 TTS: Design and Conduct of the Survey Transportation Tomorrow Survey
full capacity as a result of the ongoing recruitment of surveyors up until one month before the end of the data collection period.
The recruiting process was strongly supported by Malatest’s Ottawa office who conducted preliminary interviews via telephone. Successful preliminary interview candidates were then interviewed in person by a Malatest staff member in the Toronto office or in the North York call centre once it was set up.
Malatest’s hiring requirements for staff included being reliable and professional, proactive and independent; Integrity and an understanding of respondent rights and information security/privacy; Attention to detail; Good time management and a willingness to be flexible with scheduling; legally entitled to work in Canada; and Fluency in a language other than English and French is considered an asset.
6.2 Training The training program started on August 22, 2016 and continued accordingly until November 2016. The training consisted of three consecutive evening sessions with groups of 8 to 16 interviewers (average of 12 people per session). The week before the kick off, the survey had four training sessions ongoing. After the kick off, there were generally two training sessions per week, typically Tuesday to Thursday and Thursday to Saturday. Weekday training sessions took place during evening hours similar to the peak time of outbound calling.
The first evening of training introduced new hires to the DDE software. The training manager took all new staff through the DDE training manual, dedicated time for questions and answers, and supported trainees as they familiarised themselves with the software by working together through interview examples.
On the second day of training, the candidates continued practising by interviewing each other. Supervisors were then available to answer questions and provide guidance. A review meeting was held towards the end of the evening to provide a recap about certain aspects of the software and to provide another opportunity for questions and answers.
During the third training session, the new staff continued to practice interviewing while the supervisors went around testing each person’s readiness. Once the training supervisor was satisfied that a trainee was ready to start live interviewing, that person would be assigned to one of the teams and moved to the main interview floor. The gradual transition of having new interviewers come on to the floor one at a time enabled the team leaders and their monitoring staff to provide additional support as necessary to each person during their first few live interviews. The software allowed new interviewers to be assigned only new households (which had not yet been contacted, thus simplifying their initial interviews.)
Overall each interviewer received 12 hours of training, which included:
Project overview, administrative, and human resources (4 hrs);
DDE software overview (2 hrs);
DDE software hands on training (4 hrs); and
Live telephone interviewing (2 hrs) with a sample of 5,000 households drawn for this purpose. These completions did not count towards the final data set.

P a g e | 42
2016 TTS: Design and Conduct of the Survey Transportation Tomorrow Survey
In addition to the initial training, supplementary interviewer training occurred throughout the survey administration period as required for new staff and/or additional training for existing staff members. Outside of additional training, team leads and floor supervisors were available to answer questions and respond to problems throughout regular interview shifts.
The initial geocoder training took place over the course of two days before the launch of the survey. Since they were a relatively smaller group of staff, much of the training beyond this point was arranged or supplemented as required based on staff turnover and/or the need to increase geocoding capacity throughout the data collection phase.
A number of reviewers were selected before the launch of the survey, and provided with both interviewing and reviewing training. As the data collection progressed, additional reviewers were later selected from the pool of interviewers based on their performance conducting the TTS survey. The necessary training was then provided accordingly.
Supervisors were also selected from the pool of interviewers, the majority having had experience and good performance on previous TTS survey cycles and demonstrating leadership skills. An initial group was selected to receive training prior to the launch of the survey. As in other roles, additional supervisors were selected and trained as the work increased.
Prior to the launch of the survey in September of 2016, training was also conducted with field staff located in Malatest’s Ottawa call centre so that, if necessary, the Ottawa call centre could supplement the Toronto team with conducting interviews. The Ottawa call centre was prepared to conduct interviews using the Call Web online survey form. It should be noted the Ottawa call centre was managed by senior Malatest staff and equipped with members who understood Call Web and had been trained on the DDE software. The Ottawa call centre provided support with fielding requests for assistance with the online survey and follow-up calls to conduct telephone interviews to finish partially completed online surveys with respondents. The call centre staff received training specific to these tasks in addition to the usual orientation.
6.2.1 Supervisory and support staff training In order to fulfill the challenging supervisory and support staff roles, Malatest looked for staff with a background and past experience with TTS, as this role does play a large and crucial part in quality control. Early in the preliminary interviewing stage, previous supervisors and interviewers that were in good-standing were contacted with an offer of employment. Approximately 240 past TTS staff were contacted in the selection process, roughly 50 members were invited to work with Malatest, and approximately 20 were retained. This included team leaders, interviewers and supervisors all with previous experience who were selected for the additional responsibility roles. In addition, training managers and project advisors were also returning to maintain the same level of integrity with previous surveys. In order to maintain this method, efforts were made to build a foundation of staff that will want to return to future TTS projects, as well as contact lists and employment details.
6.2.2 Geocoding training After the preliminary phone interview, candidates that had shown interest in the Geocoding position were sent a geocoding test. This test involved commonly mispronounced locations with clues as to where this might be and would be very representative of what they would be put through as a geocoder. Once these results were compiled, geocoders were selected based on knowledge of transit routes, as well as the time taken to complete the geocoding test.

P a g e | 43
2016 TTS: Design and Conduct of the Survey Transportation Tomorrow Survey
Malatest had selected 10 geocoders with a small transit review team of 4 amongst that team. They were taken through the general overview of project processes from interviewing to visual review and geocoding. These staff were taken through the Geocoding Manual6 and introduced to screenshots of the geocoding console. After this review, these staff were taken through test cases to geocode on the training server until both supervisors were comfortable with the geocoders’ ability to do the task.
6.2.3 Online survey validation training Staff working with the CallWeb platform were trained similarly to those who used the DDE platform. Staff in Victoria, BC, received training in a couple of ways, first by participating remotely in the regular DDE training that was conducted at the North York call centre. Second, they had the support of one of the project consultants who provided additional in-person training. The consultant’s visit to the Victoria office provided the team working primarily on CallWeb to ask questions and also receive an in-person direct training of the visual review, editing, geocoding, and post-processing stages, identical to that of the training provided in the North York call centre. During this visit, supportive material was also provided for future reference.
The team of staff in Victoria, BC also received local area familiarization training, which prepared the staff to be familiar with the Greater Toronto and Greater Golden Horseshoe areas. The local area familiarization training outlined important factors to consider when visual reviewing the trips, they provided the staff with insight on transit systems, key land marks, neighbourhood names, regions, and highways of the survey area. All in all this helped the staff in Victoria to conduct a thorough validation process of survey completes just as effectively as a staff member residing in the GTHA.
6.3 Hours of work Standard evening interview shifts ran from 5:00 to 9:30 p.m. on weekdays, and 10:00 a.m. to 6:00 p.m. on Saturdays. With a significant number of participants calling in to complete the survey over the phone, or with questions regarding the web completion, a daytime team was soon incorporated and available from as early as 9:00 a.m. to answer respondents. Between the day time staff and evening staff, the call centre was available and ready to respond to inbound calling from 9:00 a.m. until 9:30 p.m. on weekdays. On weekends staff was available from 10:00 a.m. to 6:00 p.m. The inbound team of staff included those who could conduct the survey in several languages.
Similar to the previous TTS cycles, evening staff conducting outbound calls, were instructed not to start any new interviews after 9:30 p.m. but were encouraged to complete any interviews in progress. If surveyors had a live interview in progress past 9:35p.m they were credited an additional 15 minutes to their time worked. This encouraged interviewers to dial right up until the end of their 9:30 shift, maximizing potential completions for the day. Interviewers who preferred to not work overtime could opt to work on their callbacks in the last few minutes of the shift, a practice carried over from past iterations of TTS.
6.4 Rates of pay The majority of interviewers were paid $14 per hour + vacation pay, throughout their employment including training in TTS 2016. Daily and weekly performance reports were shared among supervisors which showed the productivity, trip rate, refusals, etc. of each staff member conducting interviews. As in previous TTS, Malatest also provided incentives for outstanding performance including gift cards and
6 See the following for full geocoding manual http://dmg.utoronto.ca/pdf/tts/2006/geocode2006.pdf
P a g e | 44
2016 TTS: Design and Conduct of the Survey Transportation Tomorrow Survey
pay increases, as well as general incentives such as donuts or pizza on Saturdays and coffee for staff. Both statistic performance and general work ethic were considered when increasing staff hourly pay.
All staff except supervisors was paid at the $14 rate from the start, including data collection clerks during interviewing and non-interviewing hours, as well as geocoders and reception staff. Staff was paid bi-weekly on Fridays via direct deposit.
6.5 Incentives The TTS call centre was a dynamic place of work for all of those who were hired onto the project. There was an ongoing effort from administrative staff and human resources to keep the call centre a safe and welcoming place to work. Due to the nature of the project, the job appealed to those seeking temporary and /or part-time work and Malatest did its best to accommodate staffing arrangements accordingly.
Various techniques were used to encourage staff retention, promote increased shift scheduling, ensure quality work, and increase job satisfaction. Each staff member was treated with respect and as a vital part of the Malatest organization and the team project overall. Stationary resources were available to all staff (notepad, pen, and disinfecting wipes for shared workstation headsets) to use throughout the process of their work shift. Even though the work involved a large group of staff for a short term period, management on-site made an effort to get to know everyone and address each interviewer by name.
Two lunch/break room areas were set up and provided everyone with a space to go to outside of the surveying areas. This helped to maintain the surveying areas focused on the ongoing calls without interruption, and provided a comfortable and quiet place for staff to recharge. Each lunch room had coffee and filtered water provided free of charge, along with a fridge and microwave. On some weekends, donuts and/or pizza were provided. Other quiet break rooms were also available give the size of the call centre, including inter-faith empty rooms for prayer.
Management was available to address concerns and feedback brought forth by staff in a timely manner. The ongoing team meetings generally before the interviewing shift was also a time where staff was recognized individually and for team successes, as well as updated on the latest news, and given an opportunity to bring forth any concerns. Daily posting on white boards also kept staff up to date on the progress of the number of completions. Strong staff members also had the opportunity to move up into other roles as they became available during the process of the project.
During major holidays the call centre was decorated to celebrate the season, and an end-of-the survey party was held as an appreciation for everyone’s effort and work well done. This also gave everyone an opportunity to celebrate the success of each team and help build the foundation of staff that will want to return to future TTS projects.
Letters of reference in accordance with staff roles were provided to all deserving employees who finished the project. Staff feedback demonstrated they had a good experience while working on TTS and as a result of their work in the project they gained valuable experience transferable to potential employment. For some staff this was their first employment in Canada while for others it offered flexibility to work while in school.

P a g e | 45
2016 TTS: Design and Conduct of the Survey Transportation Tomorrow Survey
SECTION 7: Conduct of the survey The data collection took place from September 7 to December 19, 2016, with a target of 161,200 surveys. Within this time frame, approximately 171,300 surveys were completed, surpassing the initial response rate target, with 162,708 surveys in the final dataset after data validation. The total number of completions obtained is reflective of the predictions made with regard to use of a ‘hybrid’ approach to the sampling methodology (contacting households with and without landline telephone listed phone numbers) and a mixed-mode survey design. Malatest anticipated that the option of completing the survey online would be preferred by many participants, which was in fact the result. The re-design and development of the online survey option yielded very positive results with over 60% of the survey completions obtained online. The emphasis on the online option and its elevated use by respondents was one of the significant differences from the previous cycle of TTS.
The North York call centre administered the survey by phone in English, French and several other languages. The call centre also served as an important point of contact for study participants that had questions regarding their survey experience, or who required feedback regarding the survey process and/or survey questions.
7.1 Data collection process Letters were mailed out by the printing companies in batches, with calling scheduled to begin about a week after the letters had arrived to increase the possibility of both earning online completions from proactive respondents and increasing knowledge of the survey in advance of calling. Sample was divided between call center teams based on the average number of staff working on each team. For instance, one team had a smaller proportion of the sample because approximately half of their seats were being used for training as part of the staffing ramp up. Staffing levels, productivity and remaining sample per team all played a part in how sample was split.
Participants were generally asked about the previous weekday’s travel (i.e. if the survey was accessed on a Tuesday, the survey would ask about Monday’s trips). This travel day calculation was more flexible on weekends, since the survey only collects data related to weekday travel. Saturday shifts collected information on Thursday or Friday’s travel depending on the standing week to week of total completions by travel day. When the survey was accessed on a Sunday or Monday, travel was collected for Friday’s trips, to ensure the best recall of trip details.
The survey was offered in both official languages on the telephone and online. French speaking respondents who called in to the project helpline or who were contacted over the telephone to engage their participation in the study were transferred to a French speaking interviewer to complete the study in their first language.
Provincial requirements for compliance with the Accessibility for Ontarians with Disabilities Act (AODA) were followed throughout the survey administration period.
A household was removed from the active telephone sample / calling queue under the following circumstances:
If a case was accessed eight times by an interviewer;
If five calls were made consecutively resulting in a ‘No Answer’ call status code;
Cases where telephone contact was deemed not possible by the call centre staff, such as cases with call status codes of not in service, non-home based business telephone numbers etc.
P a g e | 46
2016 TTS: Design and Conduct of the Survey Transportation Tomorrow Survey
If the household was completed online, Malatest staff would remove the case from the calling queue; and
If a household refused to participate.
All households that were completed either by telephone or via the online survey were considered valid potential completions and proceeded to the data review and geocoding process. At the North York call centre, all survey completions obtained by telephone interviews were printed and reviewed by team leads to determine suitability for pursuing corrections or clarifications to the household’s trip data. For example, if the trip data was nearly complete, but eight call attempts had been made prior, the team lead might judge that another calling attempt be made to reach out to the respondent and finalize their survey data, or they might decide that the case was not resolvable or that it could be fixed by imputing a small detail and editing the survey data. Surveys completed online underwent similar review processes, which are detailed in sections 8 and 9 of this report.
At various points in the survey, to capture trips equally across travel days, fresh sample was continuously provided to staff. In the final week of the project, fresh sample was used almost continuously to maximize completions within the remaining outbound calling data collection window.
7.1.1 Voice mail strategy Malatest employed a similar voicemail/call strategy in 2016 as in the 2011 TTS. When interviewers called a household the first time, no message was left and a callback was scheduled for the next available week-day. The second call (assuming the first call encountered an answering machine) with no answer proceeded with the surveyor leaving a detailed message providing similar content to that of the advance letter. The voicemail also advised the recipient that an interviewer would call that evening or the next day, and left a phone number at which the recipient could callback to complete the survey. Voicemails were left on every 2 calls thereafter up to the call limit of 8 calls.
7.1.2 Inbound telephone calls The 2016 TTS handled inbound telephone calls similarly to the 2011 TTS. Whether participants were calling in response to a voice message from an outbound call or voluntarily calling in as a response to the advance letter, a small group of inbound staff were available to assist them. As calls increased, a bigger team was soon formed after the launch of the survey. This team consisted of 5-10 staff who could also accommodate many of the non-English interviews. During downtime these staff members conducted the non-English callbacks.
The call-in area was staffed from 9:00am to 9:30pm on weekdays, and 10:00am to 6:00pm on weekends. In most cases the staff working on the inbound team worked throughout the majority of the data collection period of the 2016 TTS.
7.2 Non-English interviews As previously mentioned, the 2016 TTS survey staff included surveyors fluent in a diverse range of languages. Malatest anticipated that some participants would prefer to complete the survey in other languages and took it into consideration throughout the recruitment process to onboard staff with different language backgrounds. Respondents were called by English speaking surveyors, and if a preference was expressed to complete the survey in a different language the interviewer made note and coded the case appropriately. If the respondent seemed to not understand the purpose of the call, the interviewer tried to ascertain the language the respondent spoke and coded those cases according to specific languages for callbacks by a non-English interviewer.

P a g e | 47
2016 TTS: Design and Conduct of the Survey Transportation Tomorrow Survey
Once the survey launched, the cases of participants requesting to complete the survey in other languages quickly increased, creating a demand for more staff with diverse language competences and in some cases multiple surveyors speaking the more common languages. Emphasis was quickly placed on this in order to get maximum coverage of the population and not exclude any demographic segment.
To meet the rising requirements of interviews in different languages, a non-English group of staff was formed and led by a multi-lingual supervisor with previous surveying management experience. The operators who conducted surveys in languages other than English and French were given additional training. According to the feedback, non-English respondents appreciated the efforts made to include their participation and were glad their transportation input was valued.
The non-English surveys made up approximately 1% of the total surveys completed, and 2% of telephone surveys completed via the DDE system. Approximately 221 French surveys were completed, with 204 of these being online. Malatest was staffed with surveyors who could conduct interviews over the phone in several languages, especially the predominant ones in the area, which were: Italian, Mandarin, Portuguese, Russian, Cantonese, Polish, and Spanish. Other languages also spoken by the staff included: Punjabi, Vietnamese, Tamil, Farsi, Serbian, German, Bengali, Czech/Slovak, Hindi, Romanian, Hungarian, Tagalog, and Ukrainian; these resulted in another 945 surveys conducted in non-official languages. In total, at least 1,166 surveys were completed in a language other than English, with at least 962 completed over the phone.7 This compares to 1,292 non-English surveys completed in 2011, which represented 1% of surveys completed over the telephone. In 2016, the uptake of the online survey in both English and French may have also provided an alternative method of participation for some non-English speakers. Those with reasonably good written English or French comprehension could have completed the online survey at their own convenience and at their own pace.
7.3 Partially completed online surveys As households from the address-only sample type did not have telephone numbers associated with their case, a question asking the participant’s phone number was added to the online survey. There was also a field where the participant could provide an email address, though this was not mandatory. Collecting both phone numbers and email addresses proved invaluable, as Malatest was able to contact respondents with partially completed surveys to encourage them to complete their responses. Contact information for online respondents was also used by data review staff in following up to clarify or correct survey responses during the visual review and editing process.
Malatest made considerable effort to review and address abandonment rates for the online survey, by measuring web traffic and analysing survey pages where abandonment rates were high. Survey pages were adapted and improved as a result of this analysis, also taking into account feedback from respondents obtained via the project support email. Malatest considered surveys that had progressed to the following points to be eligible to be contacted as part of the partial completion recovery strategy:
Address-only sample were eligible for follow-up upon provision of providing a phone number; and
Address-and-phone sample were eligible for follow-up once they entered the number of vehicles in the household (indicating they had opened the survey online and answered the first few questions).
7 These numbers are based on reported non-English cases only, which may be an underrepresentation of how many non-English surveys were actually completed, as it is believed that some surveys may have been conducted with staff speaking another language but were not reported as having been completed in another language.

P a g e | 48
2016 TTS: Design and Conduct of the Survey Transportation Tomorrow Survey
Professional interviewers from Malatest’s Ottawa call centre made up to five outbound telephone calls to users who abandoned the survey. In many cases, participants started the survey online and called in to the project helpline for support. Of all surveys completed online, 5,488 (approximately 5%) were started online by the participant and subsequently completed over the phone by Malatest staff. Often the telephone follow-up to respondents with partially completed surveys resulted in the survey being revisited and completed online by the respondent, as they had stopped due to technical issues or difficulty with the survey questions. The process of telephone follow-up with surveys that were partially completed online assisted the high response rates achieved for this survey mode.
On a weekly basis, Malatest also sent emails to users who recently abandoned the survey after completing at least the few initial questions capturing their contact information. The sample for this email was cross referenced against the call statuses of these cases in the DDE call queue to eliminate emails being sent to any cases that had already completed the survey via DDE phone interview, or who had refused further participation upon being called or who had refused during telephone follow-up by the Ottawa survey house team that was aiding participants with partially completed surveys.
Emails to partially completed cases were sent via CallWeb’s integrated e-mail function; typically on Fridays, or Saturday mornings, as the weekend proved to be the optimal time for participants to reengage with the survey and / or call the project helpline. Emails were sent in the early morning hours (between 3-5 AM), as this time frame was when server traffic was very low allowing for large numbers of emails to be sent out without effecting the usability of the online survey tool. Emails were split into two groups, a mass email was sent to respondents who had partially completed the survey, while another email was sent to those whose cases were identified as requiring a callback during the visual review process. Emails sent to cases in callback directed participants to call the Victoria survey house toll-free line so that the data review team could be reached directly to resolve the cases in follow-up; meanwhile the partial completions were directed to call a toll-free number that routed to the Ottawa survey house so that respondents following up regarding their partially completed surveys were directed to the follow-up team undertaking these calls.
Emails were also sent to households who had critical errors in their survey identified during visual review but could not be reached by telephone. This was done in an effort to recover online surveys that would otherwise have been rejected by the data review team. A specific email account8 was established for these follow-up emails, while the main project email9 was used to email respondents with partial completions.
The two email follow-up campaigns were very successful. Approximately 17,200 completed online cases requiring a callback received a follow-up email from Malatest. Of these, 90% (roughly 15,500) of cases in callback were resolved either through email and/or telephone communication with the data review team based in Malatest’s Victoria office. Approximately 28,600 of online partially completed cases requiring follow-up also received an email. Of these, approximately 50% of cases (roughly 14,500) were eventually completed post email and/or telephone communication, proving the value of follow-up with online survey respondents and ensuring quality data was recorded from online survey participants.

P a g e | 49
2016 TTS: Design and Conduct of the Survey Transportation Tomorrow Survey
SECTION 8: Quality control A set of quality control measures were applied to help ensure that surveys were being conducted with professionalism and with a focus on high-quality data results. These measures are presented below in Table 8-1, for both DDE and CallWeb. These measures are further discussed in the subsequent paragraphs.
Table 8-1: Quality control measures in the DDE and online (CallWeb)
Measures DDE Online (CallWeb) Logic checks within survey Monitoring of live interviews N/A Performance statistics Visual review of completed surveys Callbacks Feedback from the coding process Rotation of sample between interviewers N/A Random quality control audits
8.1 Logic checks on DDE and online Logic checks were conducted on both survey platforms (DDE and CallWeb). In the 2016 TTS, the DDE logic checks were largely identical to the ones used in the 2011 TTS. In the online survey, the process was slightly different as the participant was not on the telephone with a surveyor while completing the survey; the logic checks were thus more virtual in nature.
In the DDE software logic checks controlled the flow of the interview, and prevented the interviewer from moving on until a valid response had been entered for each question. At the end of completing the telephone interview, the DDE software performed a second check to verify the consistency and completeness of the information. When applicable, errors and warning messages appeared on the screen prompting the interviewer to go back and make corrections immediately while still on the phone with the respondent. Any errors that were not corrected during the interview appeared on the printout of the completed survey.
In the online survey accessed through CallWeb, an error message to the participant was also prompted when conflicting survey responses were entered. These initial checks happened live as the participant filled out the survey. Since the participant completed the survey independently, the second series of validation checks were completed through an external database; survey reports were then printed out and moved onto the visual review process.
Any uncertainties or blanks found in the visual review process by a staff member were corrected by performing a callback if required. For online survey completions some uncertainties were corrected by email communication, as discussed in the previous section of this report.
8.2 Monitoring live interviews on DDE In the call centre, all supervisor stations had the ability to remotely monitor any interviewer’s computer and phone call, and this formed the basis for monitoring and coaching staff. Wireless headphones with remote monitoring capability were provided to each team to allow one member of each group to leave the monitoring station and stand beside an interviewer if necessary as they conducted the call.
P a g e | 50
2016 TTS: Design and Conduct of the Survey Transportation Tomorrow Survey
Given the staffing ramp-up to meet project demands, two to three groups of approximately eight newly hired staff were being introduced each week into the call centre. Freshly trained interviewers were monitored more closely during their third training session, as this is when they began making live calls; close monitoring continued during the first couple of shifts for each new employee, and as needed thereafter.
Once telephone interviewers were confident in their role, adept in the project goals and expectations, and supervisors felt that an overall knowledge base of the study had been achieved, telephone interviewers were monitored less regularly so that supervisory attention could be refocused on staff that required additional coaching or training. Supervisory staff walking the floor were available to answer questions, assist surveyors on any technical issues with the DDE software, resolve any potential incidences on the survey floor, and address any monitoring concerns that arose. The team lead was always available and actively involved in managing staff by answering questions and attending to any challenges that arose. Each telephone interviewer had a record in which supervisors added performance review comments and noted suggested areas of improvement based on monitoring and their interactions with the interviewer on the survey house floor; these files were used to track if/when coaching was required and ensure all members of the supervisory team were aware of coaching and review comments from their peers. Any serious concerns were forwarded to the team lead and/or site manager for immediate follow-up.
8.3 Performance statistics on DDE and online The DDE software produced daily and weekly data files with statistics on the performance of the surveyors. These statistics were posted publicly for staff to view their performance relative to their peers. The performance scores took into account the various statistics generated by each surveyor, (e.g. trip rates, survey completions rates, refusal rates, etc). Similar to the purpose of monitoring, these scores were used to aid the team leaders in coaching their staff if/when necessary, as well as reward top performers with incentive such as gift cards. See Figure 8-1 on the next page for an example of a typical printout of interviewer performance.
The online CallWeb servers produced performance statistics similar to that of DDE, including outlining the number of completions, number of household members, number of trips per household member, and abandonment rate of people who accessed the survey for the first time as well as all whom accessed the survey that day. This helped to demonstrate the effectiveness of the online survey process and was useful throughout to make changes or improvements if they were necessary. CallWeb also captured information such as the browser type used, which helped to identify if respondents experienced difficulties related to the browser. Malatest used this feedback to support and troubleshoot when participants called or emailed with similar difficulties completing their survey.
Other performance statistics collected information on the completion rate by mail flight, response rate by region, response by day of the week, and abandonment rates by server daily. The feedback on abandonment rate enabled Malatest to add servers until rates were acceptable and accommodated the high level of traffic on the online servers. The performance statistics also made it possible to be able to target specific areas that were underrepresented, and ensure enough servers were operating to handle the web traffic. CallWeb also provided reports on the specific pages or sections where respondents were abandoning the survey and programming staff made improvements accordingly, e.g. adding instructions and/or improving the design so that the survey pathway was more obvious. Essentially, although a live interviewer was not on a telephone to guide the respondent through the survey, all of these performance statistics helped to focus on the areas that required improvement and to ensure a

P a g e | 51
2016 TTS: Design and Conduct of the Survey Transportation Tomorrow Survey
seamless and simple online survey completion process. Malatest ensured the use of all available resources and reacted quickly to performance feedback in order to provide online participants with smooth survey functionality.
Figure 8-1: Typical DDE performance printout
8.4 Visual review of DDE and online survey completions The visual review process of survey completions was fairly similar whether the survey was completed via telephone interview (DDE) or online through Malatest’s CallWeb software platform. Regardless of survey mode, once a survey was completed, a report was printed for each survey and forwarded to a team of staff to perform visual review tasks and organize the paper reports according to the outcome of
P a g e | 52
2016 TTS: Design and Conduct of the Survey Transportation Tomorrow Survey
visual review. For the online surveys, PDF documents were generated, and could be printed on paper for the appropriate team to review.
The visual review process considered many aspects of data verification, including checking for the following:
Review of error messages that flagged conflicting survey responses;
Examine responses for consistency and logic behind the information collected, (visual review staff were trained to examine the survey data and ask questions such as do the modes reported for each trip make sense, do times and distances recorded for each trip seem logical, were realistic distances to school or work from the household recorded etc.);
Review the manner in which descriptive information, such as trip destinations, was recorded; and
Whether transit routes connected and made sense for the transit system type(s) used on each trip.
All completed surveys underwent visual review and were sorted for callbacks to adjust or fill in any missing information. These details were put back into the survey in the edit correction phase and moved to geocoding and/or edits. If an edited survey was put through to the geocoding/editing phase and was flagged with errors that could not be corrected, the survey was passed back to visual review with high priority for follow-up.
Due to the volume of online survey completions that required review, once a survey was marked as complete it went through the same logic checks as the DDE and geocoding software (via an external database). Surveys were then printed and sorted into a visual review status of complete, pending edits, or incomplete-requires callback. Every survey that involved a transit trip was passed along to the TTC for trip logic checks before being sent back to data review team members and organized accordingly. The printed survey reports would then be visually reviewed and prioritized for callback based on whether the error was related to person-level demographic information (home, work, or school locations) or trip-level information (specific trip details related to mode or destination). Cases with errors identified at the trip level were categorized as high priority for callback, while corrections to demographic information were of secondary priority for callback. Using this callback sorting method, cases with trip-level information for which respondent recall was time-sensitive were called back first.
Following the visual review and sorting process, online paper survey reports were scanned to a database to update the status of the case and facilitate the tracking of callbacks and edits to completed surveys. The online survey data validation, callback, and editing processes differed slightly from the DDE system in that cases were a collective responsibility of the data review team in the Victoria office as opposed to the case being sent back to the original surveyor for correction. The team of staff working on the online survey completions were trained on all data validation processes so that the same staff who conducted visual review could also simultaneously help with edit corrections, callbacks, geocoding, and post processing tasks.
A streamlined process was created to promptly conduct the visual review of online survey completions as they occurred. As the number of cases being completed online quickly increased, a transition was required to apply an import processing system using custom scripts to load the data to a separate SQL server set up to store this very large dataset and perform validation tests on it. Management of the data

P a g e | 53
2016 TTS: Design and Conduct of the Survey Transportation Tomorrow Survey
management and data validation processes required a dedicated group of Malatest research staff who carried a high a level of technical expertise.
As a backlog of visual review cases began to accumulate, additional staff were hired to the visual review teams, and some of the workload of the visual review of online surveys was shared with visual review staff in the North York call centre. To better manage backlogs that arose, an automated system triaged new online surveys and set a priority for review on the basis of the type of information captured and the number and type of data validation tests with flags for each survey. For example, cases with transit information or trip logic warnings were categorized as high priority for review, in case clarification calls needed to be made while respondents could still remember their trip details.
8.5 Transit review Surveys that included at least one trip made via transit went through transit review prior to being passed on to the visual review team. For the DDE system, this was managed via paper printouts. For the online surveys, once the survey data were imported to the validation database, sets of PDF documents were generated, and securely transmitted to the North York call centre or to the TTC for transit review. Transit review was led by Conor Adami, of the Toronto Transit Commission who worked alongside staff in the North York office. Since the survey was conducted in a single fall period in 2016, rather than spread across two fall periods as in previous cycles, volumes of cases for transit review were very large, especially as the 2016 cycle also captured more households who reported using transit. The TTC was not able to complete transit review for all surveys that included public transit trips. Early on, the TTC and Malatest both worked in concert on the review of both DDE and online survey completions. However, the process was adapted during survey administration so that Malatest staff in the North York call centre administered transit review for all DDE completions, and TTC worked exclusively in transit review of survey data from online completions. Transit review conducted by Malatest staff in the North York office was completed by geocoders who spent the first several weeks of the study working alongside TTC staff reviewing DDE completions and thus benefitted from this hands-on training from the TTC.
8.6 Callbacks for DDE and online survey completions The goal of the visual reviewers working out of the North York office was to visually review the survey printout the day after the survey was conducted, and complete the reviews in time for the shift start time of 5:00pm, in order for staff to receive their corrected work and perform any required callbacks within one to two days of the initial survey completion, especially for trip related callbacks. Overall, callbacks were split into two groups: priority 1: information that would not easily be recalled after several days had passed (i.e., trip info), and priority 2: easy to recall information (i.e., demographics).
The feedback from visual reviewers of the DDE completions also provided a form of guidance to surveyors, that they could implement in interviews going forward. If the surveyor wasn’t working the next day, the papers would be placed in their folder for the next day they were in. If there was a long delay before their next shift, the work was assigned to a surveyor or a supervisor to make callback attempts. Staff were required to continue to callback cases multiple times to try and resolve problems as soon after the interview as possible. Team leads gathered relevant feedback from their visual reviewers or common concerns that applied to the whole group, and shared the feedback with the entire team at a pre-shift meeting. When surveyors got the corrections or clarifications requested by the visual reviewers, the visual review team checked the employee folders each day for corrected surveys and entered those corrections into the DDE system.

P a g e | 54
2016 TTS: Design and Conduct of the Survey Transportation Tomorrow Survey
Surveys completed in CallWeb had a continuous callback process for any cases that failed programmatic data validation tests; a minimum of three callback attempts were made per household to try and clarify vague or unclear (or illogical) survey responses, before retiring the case as unreachable. There was also a continuous editing process that made corrections to cases that had completed the review cycle, with some cases only requiring an edit without callback (as the error was obvious). Other cases were corrected based on the details given by the respondent during follow-up. As surveys completed online did not benefit from a live interviewer, more callbacks were required for surveys completed online than for surveys completed via telephone interview on the DDE system.
8.7 Feedback from the DDE coding process When the visual review was done, surveys were coded as either ‘hold back from geocoding’, ‘force into geocoding’, or ‘complete’. The ‘force into geocoding’ code was made for surveys that had errors but could not be corrected in the edit corrections stage, such as coordinates missing for locations. The ‘hold back from geocoding’ status code was for trip information missing on key trips (such as work locations) that may be too ambiguous to code, and remained in callback status. ‘Complete’ surveys were sent straight through in batch geocoding to the post-processing stage (all coordinates were present and there were no remaining errors on the survey).
When surveys were pushed into geocoding manually in the DDE Administrative Console (AC), trips were put through either batch, manual or related location geocoding. These surveys, again, were checked through logic checks, as well as the geocoding team for interviewer feedback and quality control. In the case of newer developed houses where the address was not found in the Geocoding Consoles street range, Google or real estate websites were used to identify newer areas and coordinates were given in Universal Transverse Mercator (UTM). Once these coordinates were assigned, a list was created and given to DMG as a ‘Reference Update’ to be updated in the next batch geocoding process.
Problems encountered in manual geocoding were monitored continuously and reported to reduce the probability of poor geocoding or interviewer habits, and corrective action measures were taken. Another problem involved the pushing of updates across all servers which did not execute for one of the servers, as well as premature pushing of some interviews to geocoding, forcing updates to be done either in post-processing or geocoding. The majority of geocoding was done within a few days after a push to geocoding, depending on the sample pushed, but pushing a sample to geocode took an extra day to run logic checks (for example, if the push to geocoding occurred on Monday, the sample would be ready for geocoding on Wednesday). This process was not required of surveys completed online.
8.8 Rotation of sample between interviewers The survey cases managed within the DDE software were assigned to the surveyor who had accessed it, much like in the 2011 TTS. Cases that were not accessed within an appropriate window of time after the last contact were passed into a general calling queue, however, when possible, the same interviewer would call the same household each time to ensure continuity if the interview was completed over multiple calls and to allow for familiarity with the household for improved accuracy of data collection.
Fresh sample was periodically released to balance completions by travel date. As noted previously, in the final week of the project fresh sample was used continuously to maximize completions within the remaining outbound data collection window.

P a g e | 55
2016 TTS: Design and Conduct of the Survey Transportation Tomorrow Survey
8.9 Random quality control audits The random quality controls performed were similar to the 2011 TTS data processing; where the team leads conducted ad hoc quality control audits at several levels during the interview process, in support of the Supervisors’ quality control function. The random quality control audits included the following:
Ad hoc real-time monitoring of interviewers, including callbacks;
Periodic review of team monitoring sheets to assess consistency of monitoring overall, ensure monitoring of each interviewer on a regular basis, and identify reoccurring issues;
Assessment of visual reviews for each team, and for each reviewer, to assess quality of work produced and ensure the completeness and correctness of comments provided by reviewing staff;
Random supervisor callbacks to confirm and/or supplement data originally collected;
Random confirmation of completeness based on information entered by supervisors; and
Duplicate assignment of ad hoc households to multiple geocoders to check for consistent coding methods.
In geocoding, if a member of the team was let go from the project, all previously coded work was reviewed to ensure proper coding procedures were followed.
8.10 Paper management In order to maintain confidentiality and to have a paper record of edits and callback history, Malatest followed past TTS practice in managing completed surveys, by printing out each survey and storing it securely on site each night. Papers were organized by cabinets set in each team area, and were added to each day as new surveys were generated, visually reviewed, and placed in callback folders for interviewers along with any edit corrections noted to be made by a supervisor. Supervisors reorganized the paper copies by travel date as a final step in tracking the printed survey files.
Printing all completed surveys for visual review turned out to be a fairly cumbersome process. Many of the errors identified in visual review were also flagged through programmed and database automated data validation checks, rather than through a manual review process. The printing and management of a very large volume of paper survey reports was a step that added to the time and resources required to complete the review process. This being said, the visual review tasks undertaken did form an additional level of quality checks and flagging of surveys for follow-up. Although the database printouts differed slightly in formatting from the two database systems (DDE and online), the processes of paper print out management and organization were almost identical in nature.

P a g e | 56
2016 TTS: Design and Conduct of the Survey Transportation Tomorrow Survey
SECTION 9: Geocoding and post-processing 9.1 Overview In order to produce an accurate database of travel summaries, location data must be collected, coded, and checked for validity. Once a survey completed the visual review and/or edit correction stage, the responses were run through a series of checks that analyzed trip logic. The series of data validation and logic checks that were run on the 2016 TTS dataset included verification of household information (such as address, dwelling type, number of persons in the household etc.) person information (such as age, gender, employment status and work location, student status and school location etc.), trip information (such as departure time of each trip, location, mode(s) of travel for each trip etc.), and transit information (number of routes, transit system type, access and egress stations, mode to and from transit station). Database validation tests were designed to check for common errors and inconsistencies in the data as well as flag any anomalies or outliers for review. During this process, cases were at times sent back to the callback or geocoding stages of data review to confirm responses or location information and make corrections to the survey data accordingly.
This final stage of post processing began when all collected data were passed through geocoding and visual review checks, had completed callbacks and/or corrections if required and had passed all data validation tests and logic checks. This phase involved running final checks based on post-processing parameters to identify any errors that may still be considered unsuitable for trip, household, or person information that may have occurred after the re-geocoding and data review process. Cases deemed as non-fixable due to critical errors (that could not be corrected during data review, callback etc) were flagged for removal from the final dataset; Approximately 5% of survey completions were removed from the final dataset as a result of the final post processing stage of data review.
9.1.1 Geocoding in DDE The geocoding console was the primary platform for coding locations. DDE geocoding used Land Information Ontario (LIO) street segment files as the basis of most geocoding street address locations to coordinates with the exception of popular landmarks like Pearson International Airport or schools and universities, which had standard coordinates as ‘monuments’ (many of which have large footprints covering multiple street addresses). The DDE LIO method used the straight-line interpolation of the location of specific civic numbers within the civic number range for the LIO street segment end coordinates, offsetting 22m to the side of the street on which the odd or even civic number belongs.
During the survey interview, locations were captured by survey interviews by typing in addresses or landmark descriptions in the DDE system. The interviewer could select a match with the established street segment database or monument database, or enter a new description not yet captured in the street segment database. The locations were later assigned x-y coordinates in the geocoding stage. This was done by one of three methods: batch, interactive manual geocoding, or cross-referencing. Batch geocoding ran automatically at 3AM once a sample had been pushed to geocoding, with this process assigning x-y coordinates to locations that were matched by address to the street segment database. Once the batch process had been completed, any locations not coded through this process were to be coded via manual review. When a household was pulled up through the geocoding console, trip locations identified with blue font and white background were to be manually coded. In interactive manual geocoding, locations were searched (preferably by Google Maps, but also via 411.ca and through the use of real estate or planning documents) and assigned to the appropriate street range to match with the street segment database. In the cross-referencing method, if a trip involved a popular landmark or destination, previously confirmed monument locations were assigned to the trip

P a g e | 57
2016 TTS: Design and Conduct of the Survey Transportation Tomorrow Survey
destination. For example, verbatim responses of ‘Pearson Airport’, ‘Lester B. Pearson International Airport’, ‘Mississauga Airport’, and so on were all coded to one standardized monument code for ‘Pearson International Airport’. In the 2016 TTS, the monuments list compiled from previous years was trimmed down to an essential base of common locations, but added to if there was a significant response from surveys to a certain destination. These monuments were set up in frequent reference updates and batch geocoded.
If a location was too ambiguous, the surveys were reprinted (which took two days to move through the process), and feedback was given to the team leaders to assign the surveys for callback. These printouts were printed on blue legal sized paper to avoid any mix-ups in paper management, but also tracked to make sure all paper was called and returned. After the survey trips were verified and returned to the geocoding team, the changes were input on the module and the survey was marked as complete. These complete surveys would now have coordinates attached to all locations captured, and the survey could be passed onto the post-processing phase.
9.1.2 Geocoding of online survey data Malatest employed a Google Maps Application Programming Interface (API) in CallWeb which allowed participants to search for locations or identify locations by double-clicking on the map or by drag-and-drop of location markers on the map. Google Maps returned latitude and longitude coordinates for the confirmed location(s), which obviated a need for batch processing or manual processing to assign coordinates. This method of employing on-the-fly geocoding proved extremely effective and decreased the level of geocoding effort required while data review tasks were underway. Locations geocoded via this method could later be revised in the data review and edit stages and assigned new coordinates if errors were detected via inspection during visual review or as flagged by validation tests.
The concordance between coordinates assigned via the LIO street segment interpolation method used in the DDE system and the Google API coordinates used in online surveys was explored by Malatest, making use of a sample of over 299,000 trip destinations captured in online surveys during the first weeks of data collection. Inspection of the data revealed that in a number of instances the Google coordinates were more accurate, particularly for curved street segments (like crescents) and for large complexes, such as university campuses, shopping plazas, and large work campuses, as respondents could select the actual location they visited. A very high proportion of the Google API coordinates were within 100m of the same address as coded via LIO street segment interpolation, and a very high proportion of the traffic zone codes assigned using each method were identical. Due to the high degree of concordance between the two coordinate systems (LIO and Google API), Malatest’s recommendation to accept the use of Google coordinates from online surveys ‘as is’ (rather than re-geocoding the Google API-captured locations to LIO street segments interpolations) was accepted by the steering committee. Malatest prepared a report on the Exploration of the Concordance between Google-Geocoded Destinations in Online Surveys and the Land Information Ontario Geographic Base, which is included in Appendix F of this report.
9.2 Post-processing Post-processing data review task assignments were slightly different for data from the DDE and online versions of the survey. In the North York office, completed DDE survey print out reports were passed through the geocoding team. This team ran final checks based on established post-processing parameters to identify any outstanding errors that may still be considered unsuitable at the trip, household, or person level, checking for any additional information that may be required or new errors

P a g e | 58
2016 TTS: Design and Conduct of the Survey Transportation Tomorrow Survey
that occurred in the data after the re-geocoding process. Data validation and post-processing checks for the online survey data mirrored the DDE post- processing parameters, using different database systems, but did not require the initial geocoding phase, as all locations were already assigned coordinates on-the-fly during completion of the online survey.
9.2.1 Post-process in DDE In TTS 2016, the post-processing phase began once all surveys were pushed into geocoding and no outstanding cases in ‘incomplete’ or ‘callback’. Here, logic and computerised checks began to isolate and identify errors for correction by post-processing staff. The majority of these checks look at both speed and distance to better identify questionable cases. Some errors included: ‘Trip Speed in excess of 130km/h’, ‘Walking distance over 3km limit’, ‘Mode is Drive but no car available’, or ‘Work trip exceeds limit’. In the Post-processing Console, errors were sorted categorically, and by frequency and severity. For example, cases could be sorted from farthest to shortest distance walked. Once these errors were fixed, surveys were coded to the following list:
Confirmed
Confirmed Final
Initial Batch Required
Post-processing Incomplete
Post-processing Required
Regeocoding Required
Regeocoding Complete
Rejected Invalid
Rejected Uncodable
Typically, if a survey’s trip destination was changed at any point in the post-processing phase, it was passed through batch geocoding, and if batch geocoding failed, re-geocoded as necessary. If no trips were changed, or trips were changed and batch geocoding was successful and did not generate new errors, it was coded to ‘Confirmed Final’. Surveys could also be rejected if clarifying information could not be obtained or if the survey was unsalvageable. Surveys were pushed back to geocoding as required, repeating the process as necessary until there were no critical errors left on any survey.
It may be noted that a few error codes were not seen as critical, and surveys could be accepted even if subject to these flags:
Household moved flag invalid
Household mailing received invalid
Person free parking invalid
Person consecutive work trips exceeds limit
Person zero home trip
Person IWTR (invalid walking trip records) delete all and next
Person IWTR delete all person trips
Person IWTR consolidate not pair
Person invalid walk trips made
Person adjacent external location range
Trip mode drive no vehicle
Trip car pooling invalid
Intersection data not preferred

P a g e | 59
2016 TTS: Design and Conduct of the Survey Transportation Tomorrow Survey
9.2.2 Post-processing online survey data Post-processing the online survey data mirrored the DDE processes. Every completed survey was imported to a sophisticated database where the data underwent hundreds of automated data validation tests and logic checks to flag potential errors for the data review team. Every survey completion was printed and given to the data review team with the print-outs noting which validation tests flagged potential errors or logical inconsistencies. This process also identified possible geocoding errors from the latitude and longitude location data provided by the Google Maps API used in the online survey, as well as ensured regular DDE post processing principles and parameters for generating ‘geocoding callbacks’ were followed and applied to the online survey data. Cases were sorted based on the same logic checks that were applied via the DDE software (complete, needs edits, incomplete-callback). Further sorting was done to prioritize cases flagged for callback, so that any case with trip logic errors could be called first. The secondary level of priority was errors identified at the demographic or household level, clarification of which was less time-sensitive. As surveys were reviewed they were either edited and marked as complete or called back until survey responses were appropriately clarified. The battery of data validation tests was run overnight on the data set from completed online surveys, so that any uncorrected errors or errors made during the editing process by the data review team could be identified and re-flagged for correction. After undergoing the various stages of visual review, callback and/or edits, all completed online surveys were eventually assigned a final status in the database of ‘completed review’ or ‘rejected’. Cases with a final status of ‘rejected’ were flagged for removal from the final dataset as they contained critical unresolved errors.
9.2.3 Final post-processing of the final combined dataset The DDE and CallWeb data were exported from their internal working data formats into the same format as used in previous survey cycles (with a few additional fields and code changes), then merged as a single dataset. Summary data to be included in the data records was calculated, such as the total numbers of trips, workers, students, and drivers licences associated with each household.
All location coordinates within the data (home, work, school, trip origins, destinations, and transit boarding/alighting stations) were spatially joined via GIS to various administrative boundary systems that could be used for either data expansion or analysis of the data, including: Census Tracts, Census Subdivisions, expansion zones, 2006 TTS traffic zones, TTS planning districts, TTS regions, and municipal wards. A few passes of this process were required, as some further corrections were made to the data.
Various queries and tabulations of the data were undertaken, scan for inconsistencies, values where values should not be expected for given cases, missing values where values should be expected, or issues with the translation of the data either from DDE to the final format or from CallWeb to the final format. In some cases, further adjustments were made to the code lists (e.g., changes to the transit route list requested by DMG, consolidation of some entries on the schools list), and mass updates were made as necessary to the data. Some additional review of individual survey records was also undertaken by senior research staff, corrections made to the data as necessary, and the spatial joins to administrative geographies undertaken again.
Even after all substantive corrections were made to the survey response data, it was found that the traffic zones, planning districts, regions, and ward files often did not share identical boundaries, and there were also occasional slivers between geographies for certain boundary file systems. This resulted in some apparent contradictions within the data. For example, location coordinates spatially joined to a ward for a given municipality could be also spatially joined to a traffic zone associated with a different

P a g e | 60
2016 TTS: Design and Conduct of the Survey Transportation Tomorrow Survey
municipality, or might fall in the gap between two traffic zones. Working in collaboration with DMG, some adjustments were made to certain boundaries of the geographic systems, some manual adjustments were made to the individual x-y coordinates of survey locations, and some further manual adjustments were made to the geographic codes assignments from the spatial joins, so that summed counts of locations from different geographical systems would line up better at the aggregate level.
The survey data were then weighted to address non-response bias and better represent the characteristics of all households and population in the study area. This process is documented under a separate cover in the TTS 2016 Survey Data Expansion and Validation report.

P a g e | 61
2016 TTS: Design and Conduct of the Survey Transportation Tomorrow Survey
SECTION 10: Completion statistics
10.1 Survey completions by sample type and survey platform Table 10-1 summarizes the number of valid survey completions obtained for each sample type and method of completion. It may be noted that approximately 5,488 of the surveys completed on the online platform were conducted in whole or in part via telephone (usually follow-up with a respondent who started the survey online and abandoned it or called in with questions about filling out the survey).
Table 10-1: Total of complete surveys by method of completion and sample type
Completed Surveys Sample Type DDE Telephone Surveys CallWeb Online Platform
Address-only 49,134 33,326
Address-and-phone 7,718 71,508
Phone-only 940 16
Volunteer* 55 11
Total 57,847 104,861
* ‘Volunteer’ sample includes households who contacted the call centre via phone or email who asked to be included in the survey and could not be matched to an existing address or phone number in the sample. As the number of volunteers was negligible, and unlikely to impact the representativeness of the randomly selected sample, they were included in the final dataset.
10.2 Historical overview of survey statistics Since 1986, the household sample participating in TTS has increased from 61,453 to 162,708 in 2016. The geographic scope has widened to include more geographical areas, and population has grown, requiring more surveys to obtain the target 5% sample rate in most of the cycles.
A historical overview of survey completions from 1986 until 2016 is provided in Table 10-2. The lower overall response rate in 2016 can be attributed to the change in method to include address-only sample. About half of all survey completions were obtained from address-only sample, which could not be followed up with by telephone, and which was introduced to reach out to cell-phone-only households which would have been excluded from a listed land-line sample. Without the benefit of telephone follow up, a very large quantity of letters was required to obtain the same response as with address-and-phone sample. This is detailed in the breakdown of response by sample type presented in Table 10-3, following Table 10-2.
It may be noted that the daily trip rate per person in 2016 is lower than in 2011 and previous cycles. At this stage, it is not known whether this is related to changes in travel habits, different biases within the samples that remain after data weighting in the expansion process, differences in the data weighting methods, and/or differences in the survey methods (such as a possible increase in under-reporting of discretionary trips by online respondents). There do appear to be differences between 2016 and 2011 cycles in terms of the representation of households by dwelling type, cell-phone only households, total population, employed population, post-secondary students, and population by age group. There may also be different biases in the data in the different cycles with respect to other unknown characteristics not measured by the survey. Readers are referred to the TTS 2016: Data Expansion and Validation Report for a more detailed discussion of the data expansion base (households vs. population), data expansion methods, observed biases within the data, and validation against Census data.

P a g e | 62
2016 TTS: Design and Conduct of the Survey Transportation Tomorrow Survey
In reviewing the differences between cycles in the overall completion rate, readers are reminded that the 2016 survey required the use of both address-and-phone and address-only sample in order to obtain a representative sample from cell-phone only households, which was a major departure from the sampling approach used in previous cycles, for which the listed land-line samples excluded cell-phone-only samples. The response rates by sample type are discussed further below. In reviewing the differences between cycles in the number of interview stations and staff, readers should keep in mind that the 2016 cycle was conducted over one fall season (while other recent cycles were conducted over two fall seasons), and the 2016 cycle had considerably more online survey completions (64%) compared to 2011 (12%) and had different requirements for interviewer staff available to conduct outgoing calling and for providing telephone support to online respondents.
Table 10-2: Historical overview of statistics
1986 1991 1996 2001 2006 2011 2016
Households in study area (million) 1.47 1.71 2.32 2.51 2.87 3.12 3.34
Target sample 4% 5%* 5% 5% 5% 5% 3%, 5%†
Completed sample 4.2% 1.4% 5% 5.5% 5.2% 5.1% 3.0%, 5.0%†
Sample used 102,606 34,167 158,753 215,000 340,820 345,541 1,004,840‡
Overall completion rate 59.9% 71.7% 72.6% 63.4% 43.9% 46.1% 16.2%^
Final database
Household records 61,453 24,507 115,193 136,379 149,631 159,157 162,708
Person records 171,086 72,496 312,781 374,182 401,653 410,404 395,885
Trip records 313,633 142,453 587,676 817,744 864,348 858,848 798,093
Transit records 56,615 14,896 70,295 85,095 87,244 86,703 91,437
Mean household size (expanded data) (persons)
2.77 2.77 2.71 2.70 2.68 2.73 2.43
Trips per person 11 or older (expanded data)
2.35 2.54 2.48 2.54 2.47 2.40 2.26
Interview stations 86 33 120 120 121 120 145
Interviewers and supervisors 390 75 300 275 370 395 410
Coding staff n/a 6 17 13 14 13 25
*In 1991: high growth areas 4.5%, low growth areas 0.5%. †In 2016: Hamilton 3.0%, rest of TTS area 5.0% ‡In 2016: Sample used includes all cases either mailed a letter or dialled. Phone-only sample was not mailed a letter, and address-only sample would only have telephone contact if initiated by the respondent. ^ The 2016 completion rate is the combined result of a 36.9% completion rate for the address-and-phone sample, 10.3% for the address-only sample, and 6.6% for the phone-only sample.
Table 10-3 provides a historical comparison to allow comparisons of survey response in context of the sample type, excluding the 71 cases in the ‘volunteer’ sample (respondents who were not randomly sampled but heard about the survey and asked to be included). For phone-and-address sample, the table shows a general decline in valid contact rates (the proportion of the sample that leads to either a completion or a refusal), with notably steep drops between 2001 and 2006 (from 81% to 62%) and again between 2011 and 2016 (from 60% to 50%). Of note, the refusal rate for the 2016 sample was lower than for the previous two cycles, indicating that the positive contacts were generally more successful. It should be noted that online surveys, which may not have required any phone calls for respondents who went online immediately after receiving the letter, are counted towards the valid contacts. This speaks to the benefit of promoting the online survey as a method of completion.

P a g e | 63
2016 TTS: Design and Conduct of the Survey Transportation Tomorrow Survey
The phone-only sample, which was composed of equal portions of cell-phones, listed land lines with no address, and random-digit dialed (RDD) telephone numbers showed a much lower contact rate (31%), which may be expected given the nature of the sample (particularly a high not-in-service rate for the RDD telephone numbers. This sample did not receive the introductory letter, and may also yield more unanswered calls and refusals, particularly for the cell-phone sample (as cell-phones may yield contacts with people engaged in activities outside the home which for a survey interview is an inconvenient interruption). The refusal rate for phone-only sample (75%) was much higher than expected in the planning stages of the project, and use of this type of sample was subsequently discontinued after its initial trial.
As might be expected, with only a letter and without the benefit of follow-up phone calls, the valid completion rate for address-only sample was 10.3%. As noted elsewhere, the address-only sample was essential in order to reach cell-phone-only households and obtain a more representative survey sample, although one subject to greater non-response bias (within the types of households and population that comprise this portion of the population universe). In the table, valid contact rates and refusal rates are not presented as they would not be meaningful measures of productivity for this type of sample: contacts and refusals are only logged if the respondent either accesses the survey online or calls into the toll-free number, and outbound calling is not possible for this sample.
Table 10-3: Historical statistics for different sample types
1986 1991 1996 2001 2006 2011 2016 PHONE-AND-ADDRESS SAMPLE Sample mailed letter* 102,606 34,167 158,753 215,000 340,820 345,541 223,640 Valid contacts (complete or refused) † 83,764 27,813 139,952 174,000 207,082 207,209 111,408 Valid contact rate (of sample used) 81.6% 81.4% 88.0% 81.2% 62.0% 60.0% 49.8% Refusals ~21,700 ~3,200 ~30,500 ~36,700 ~55,100 54,314 22,737 Refusal rate (of valid contacts) 25.9% 11.4% 21.8% 21.1% 26.6% 25.1% 20.4% Valid completed surveys‡ 61,453 24,507 115,193 136,379 149,631 159,157 82,460 Completion rate (of sample mailed letter) 59.9% 71.7% 72.6% 63.4% 43.9% 46.1% 36.9%
PHONE-ONLY SAMPLE Sample dialled - - - - - - 14,386 Valid contacts (complete or refused) † - - - - - - 4,471 Valid contact rate (of sample used) - - - - - - 31.1% Refusals - - - - - - 3,351 Refusal rate (of valid contacts) - - - - - - 74.9% Valid completed surveys‡ - - - - - - 956 Completion rate (of sample dialled) - - - - - - 6.6%
ADDRESS-ONLY SAMPLE Sample mailed letter - - - - - - 766,743 Refusals - - - - - - 422 Valid completed surveys‡ - - - - - - 79,226 Completion rate (of sample mailed letter) - - - - - - 10.3%
* Sample mailed letter includes all sample mailed, whether or not dialled. From the 2011 TTS documentation, it appears that somewhere between 5,000 and 11,000 sample that were mailed letters were never dialled (and did not complete online). In 2016, address-and-phone sample never dialled (and not completing online) comprised over 43,000 cases.
† Valid contacts includes refusals and valid completions (for 2011 and 2016, this includes both phone surveys and online surveys). For 2016, the count of valid contacts includes interrupted phone surveys, survey completions rejected in visual review, and over-quota online surveys that were completed after the geographic quota for the household had been filled and which were never processed through visual review.
‡ Valid completed surveys includes all surveys that were accepted in visual review and data validation, whether completed by phone (all cycles) or online (2011 and 2016 cycles).

P a g e | 64
2016 TTS: Design and Conduct of the Survey Transportation Tomorrow Survey
10.3 2016 TTS Survey completions by TTS region Table 10-4 summarizes the number of completed surveys in the final database for the areas represented by each of the participating municipal agencies. The table also includes the dwelling unit and population counts from the 2016 Census of Canada. The 2016 survey differs from the 2011 survey in that households were used as the basis of data expansion, not total population, and there were other differences in the data expansion method. As the target population of the survey is residents living in private dwellings, the survey data does not represent the population living in collective residences. Furthermore, while the 2016 TTS data match Census counts of private dwellings the data slightly under-represent the Census counts of population living in private residences (by 0.7%). While non-response bias amongst larger households was mitigated by data weighting adjustments for household size, some under-representation remains due to non-response bias amongst the largest households (those with six or more people).
Table 10-4: Completed surveys by TTS region
Municipality
TTS record count Dwelling units Population Mean expans-
ion factor
Sample rate
House Person Census TTS Diff. Census Total
Census in pvt. dwell.*
TTS Diff.* House Person
*
Total survey area 162,708 395,885 3,335,990 3,335,990 0.0% 9,006,535 8,887,935 8,822,802 -0.7% 20.50 4.9% 4.5%
Survey area excluding Hamilton (5% sample)
156,284 381,657 3,124,394 3,124,478 0.0% 8,469,618 8,360,005 8,297,291 -0.8% 19.99 5.0% 4.6%
Hamilton (3% sample) 6,424 14,228 211,596 211,512 0.0% 536,917 527,930 525,511 -0.5% 32.93 3.0% 2.7%
GTHA 122,725 304,863 2,532,672 2,532,639 0.0% 6,954,433 6,873,665 6,813,937 -0.9% 20.64 4.8% 4.4%
Non-GTHA 39,983 91,022 803,318 803,351 0.0% 2,052,102 2,014,270 2,008,865 -0.3% 20.09 5.0% 4.5%
Toronto 54,350 122,807 1,112,929 1,112,970 0.0% 2,731,571 2,691,665 2,671,491 -0.7% 20.48 4.9% 4.6%
Durham 11,700 29,603 227,906 227,906 0.0% 645,862 639,510 634,559 -0.8% 19.48 5.1% 4.6%
York 18,374 51,623 357,084 357,043 0.0% 1,109,909 1,100,935 1,090,995 -0.9% 19.43 5.1% 4.7%
Peel 22,105 61,885 430,180 430,110 0.0% 1,381,739 1,372,670 1,352,146 -1.5% 19.46 5.1% 4.5%
Halton 9,772 24,717 192,977 193,099 0.1% 548,435 540,955 539,235 -0.3% 19.76 5.1% 4.6%
Hamilton 6,424 14,228 211,596 211,512 0.0% 536,917 527,930 525,511 -0.5% 32.93 3.0% 2.7%
Niagara 9,098 19,628 183,828 183,861 0.0% 447,888 438,130 436,946 -0.3% 20.21 4.9% 4.5%
Waterloo 9,790 23,109 203,832 203,832 0.0% 535,154 527,340 524,474 -0.5% 20.82 4.8% 4.4%
Guelph 2,487 5,676 52,090 52,157 0.1% 131,794 130,095 129,405 -0.5% 20.97 4.8% 4.4%
Wellington 1,207 2,972 22,121 22,054 -0.3% 59,820 58,985 59,275 0.5% 18.27 5.5% 5.0%
Orangeville 554 1,355 10,565 10,565 0.0% 28,900 28,355 28,332 -0.1% 19.07 5.2% 4.8%
Dufferin 637 1,594 11,353 11,361 0.1% 32,835 32,485 32,228 -0.8% 17.83 5.6% 4.9%
Barrie 2,956 6,775 52,476 52,476 0.0% 141,434 139,050 138,029 -0.7% 17.75 5.6% 4.9%
Simcoe 5,817 13,512 117,583 117,565 0.0% 307,050 302,080 301,459 -0.2% 20.21 4.9% 4.5%
Orillia 665 1,351 13,477 13,475 0.0% 31,166 29,965 29,991 0.1% 20.26 4.9% 4.5%
Kawartha Lakes 1,556 3,342 31,106 31,129 0.1% 75,423 73,385 73,420 0.0% 20.01 5.0% 4.6%
Peterborough City 1,580 3,258 34,710 34,710 0.0% 81,032 78,535 78,308 -0.3% 21.97 4.6% 4.1%
Peterborough County 931 2,104 17,455 17,444 -0.1% 44,798 44,225 44,064 -0.4% 18.74 5.3% 4.8%
Brantford 1,912 4,319 39,215 39,225 0.0% 97,496 95,780 96,659 0.9% 20.52 4.9% 4.5%
Brant 793 2,027 13,507 13,497 -0.1% 37,312 35,860 36,275 1.2% 17.02 5.9% 5.7%
* The population sampling rate and the difference of the TTS expanded population from the 2016 Census count are both calculated relative to the Census counts of population living in private dwellings (which is the target sampling frame of the survey) rather than relative to Census counts of total population (which also includes population in collective dwellings).

P a g e | 65
2016 TTS: Design and Conduct of the Survey Transportation Tomorrow Survey
Table 10-5 highlights the proportions of surveys obtained in each TTS region that were completed for different types of sample, and via different survey methods. It may be noted that the initial contact sample used in survey administration was not distributed evenly by sample type across all regions. For example, in areas with a greater proportion of Canada Post addresses that could not be matched to listed land-lines (such as downtown Toronto), the contact list drew more heavily on the address-only sample. Other areas with higher proportions of addresses that could be matched to listed landlines drew more heavily on the address-and-phone sample. The proportion of online surveys was influenced by the predominant sample type in each region (with address-only sample more likely to do the survey online than call in to the toll-free line to complete a telephone interview), although there also appeared to be varying levels of online engagement amongst the address-and-phone sample as well. For example, the York Region, with a majority address-and-phone sample (57%) and a lower proportion of address-only survey completions (42% of all surveys for this region), nevertheless had a high uptake of online surveys (65%).
Table 10-5: Surveys by sample type and survey method by region
Sample Type Survey Method
Region Surveys Address-and-
phone Address-only Phone-only DDE
CallWeb (online)
Toronto 54,350 42% 57% 0% 31% 69%
Durham 11,700 60% 40% 1% 41% 59%
York 18,374 57% 42% 1% 35% 65%
Peel 22,105 54% 45% 1% 36% 64%
Halton 9,772 61% 39% 0% 38% 62%
Hamilton 6,424 52% 47% 1% 44% 56%
Niagara 9,098 55% 45% 0% 42% 58%
Waterloo 9,790 51% 48% 1% 36% 64%
Guelph 2,487 56% 44% 1% 37% 63%
Wellington 1,207 50% 49% 1% 41% 59%
Orangeville 554 51% 48% 1% 36% 64%
Barrie 637 57% 43% 0% 39% 61%
Simcoe 2,956 50% 48% 2% 41% 59%
Kawartha Lakes 5,817 41% 58% 1% 40% 60%
Peterborough City 665 57% 42% 1% 45% 55%
Peterborough County 1,556 41% 57% 2% 36% 64%
Orillia 1,580 53% 46% 1% 43% 57%
Dufferin 931 27% 72% 1% 27% 73%
Brantford 1,912 53% 47% 0% 41% 59%
Brant 793 41% 58% 1% 33% 67%
Total 162,708 51% 49% 1% 36% 64%

P a g e | 66
2016 TTS: Design and Conduct of the Survey Transportation Tomorrow Survey
10.4 Survey completions by trip day Table 10-6 highlights the distribution of surveys completed by trip day, as well as the unexpanded trip rates relative to total household members, with comparisons to the previous two survey cycles. Similar to previous cycles, the distribution of the surveys by day of week is somewhat loaded towards Thursday and Friday, although unweighted trip rates on these days were not that much different from trip rates on other days of the week. Attempts were made to distribute the letter delivery across days of the week (with two mail outs per week on different days of the week), albeit, after the letters were dropped off at Canada Post, the actual delivery date might vary depending on workload. The TTS is a 24-hour recall survey, which requires surveys to be completed within a reasonable enough time of the weekday surveyed to allow for accurate recall of trip details, with the trip day typically set to the most recent previous weekday. However, compared to other trip days, respondents could complete the survey on more days of the week (Saturday, Sunday, and Monday) with respect to Friday travel. To help balance this, a portion of surveys started on a Saturday or Sunday were directed to report on Thursday travel rather than Friday travel.
Table 10-6: Completed surveys by trip day
Households Surveyed
Unexpanded trip rates (total trip records / total household members)
2016 2011 2006 2016 2011 2006
Monday 17% 18% 17% 1.96 2.06 2.10 Tuesday 17% 17% 17% 2.04 2.08 2.13 Wednesday 17% 19% 19% 2.05 2.09 2.13 Thursday 24% 23% 21% 2.02 2.11 2.14 Friday 24% 23% 23% 2.01 2.13 2.22
Table 10-7 highlights the distribution by week across the surveyed period, and Table 10-8 highlights the cumulative number of surveys by week across the surveyed period. The figures illustrate a ramp up in productivity as the staff complement grew and the size of mail outs was increased, and a steep drop off at the start of December, as geographic quotas were filled and mail outs were reduced. Given the short timelines to implement the project, the scope changed to allow for address-based sampling and online completions, initial address-only mail outs were initially reduced to allow for the procedures for data processing online surveys to be fine-tuned and confirmed to mirror DDE processes, which was made up for by ramping up the size of the mail outs later in the survey administration period. It should also be noted that surveying was not conducted regarding travel on the statutory holidays of Labour Day (September 5) and Thanksgiving (October 10). The number of days of outbound telephone surveying was reduced on these weeks, as well as on the week of the non-statutory holiday of Remembrance Day on November 11 (with calling shifts cancelled for both the holiday and the day after the holiday), and the number of weekdays on which Canada Post delivered survey invitation letters was also reduced around these holidays.

P a g e | 67
2016 TTS: Design and Conduct of the Survey Transportation Tomorrow Survey
Table 10-7: Survey completions by week of trip day
Table 10-8: Cumulative survey completions by week of trip day
0
5000
10000
15000
20000
25000
Total Surveys
Online Surveys
DDE Surveys
0
20000
40000
60000
80000
100000
120000
140000
160000
180000
Total Cumulative Surveys
Online Surveys
DDE Surveys

P a g e | 68
2016 TTS: Design and Conduct of the Survey Transportation Tomorrow Survey
SECTION 11: Conclusions The 2016 TTS was the seventh in a series of surveys that were initiated in 1986, intended to capture travel patterns of those living in the GTHA. The purpose of conducting this form of longitudinal research is to support local and regional governments in making suitable decisions regarding transportation developments. With changing times, every TTS has attempted to improve and collect the best possible dataset to truly represent commuters across the GTHA. The 2016 TTS did this by a shift to address-based sampling with a strong online data collection component. In doing so the 2016 TTS was able to still reach households with landlines as well as reach households who rely greatly on mobile phones and internet as their primary forms of communication. Having done so, the 2016 TTS was successful overall. It not only achieved more survey completions than targeted but also obtained data from a better distribution of households relative to the 2016 census study than would have been possible if address-based sampling had not been adopted. Data was collected from approximately 5% of the households in the survey area with the exception of Hamilton, which was funded for a 3% sampling rate. The survey consisted of questions regarding household data, demographic data, and trip data.
In planning the 2016 TTS data collection, Malatest worked collaboratively with Ministry of Transportation of Ontario, the Transportation Information Steering Committee (TISC), the Technical Advisory Committee (TAC), the Data Management Group (DMG) at the University of Toronto, and the Toronto Transit Commission (TTC). Through a series of meetings beginning in the spring of 2016, the survey scope was modified to expand the sampling frame to include address-based sample in order to reach cell-phone-only households and enhance the tools used in previous TTS studies. The set up of the survey in 2016 was supported with findings from a pilot test conducted before the launch. The pilot test served to collect feedback regarding the different sample types that would be used and the functionality of the online survey.
The DDE software was used for telephone surveys and the same survey questions were asked as in the 2011 TTS. The 2016 TTS focused on creating an online survey to mimic the DDE software for comparability and to enable a greater response from participants more likely to opt for the online alternative method of completing the survey. The online survey also enabled the completion of the survey in French. This was not the first introduction of the online component in the TTS study series. The online option was first introduced as an English-only version in 2011 and resulted in approximately 11% of total completions. In 2016, the online surveys resulted in well over 60% of overall completions, demonstrating that this was a well-accepted and widely used option among those randomly selected to participate in the survey, especially for the address-only sample type. The address-and-phone sample also demonstrated strong online response rates. While online responses were often obtained without any outbound calling, it should be noted that considerable effort went into providing email and telephone support to online respondents, follow-up with partial online survey completions (including survey interviews with abandoners to complete the survey with them over the phone), and data review and follow-up to clarify answers to the online survey.
Apart from the new version of the online survey, other main changes to the 2016 TTS included the addition of the household income question; the addition of ‘paid ride share’ as a travel mode response option; the addition of ‘Presto’ as a transit pass response option (and removal of ‘GO Pass’); provisions to obtain informed consent to conform with privacy regulations; a trial of phone-only sample; and inclusion of two types of address-based sample: address-and-phone (which could be surveyed by phone the same way as in previous cycles) and address-only (which could be recruited only via the survey letter). As well, all data collection occurred in one year as compared to a two-year window for past TTS

P a g e | 69
2016 TTS: Design and Conduct of the Survey Transportation Tomorrow Survey
cycles. The phone-only sample was observed to have a low response rate and did not warrant the additional cost, and this sample was soon removed after launch. The address-only sample was generally successful, albeit with a lower response rate than the address-and-phone sample, and comprised about half of all survey completions.
As in previous years, advance letters were sent out to notify households about the study; this not only emphasized the legitimacy of the study but also made the telephone calls to households less unexpected, increasing the chance of higher response rates. The media was used to inform the public about the survey and made contact information available for individuals who had questions, complaints, or wanted to voluntarily participate in the survey.
The call centre was set up in the North York area to carry out the telephone survey completions using the DDE software. The call centre space accommodated approximately 145 workstations that were generally filled from September to December of 2016 to achieve the targeted telephone survey completions over the course of a single data collection period. All the required resources and equipment were acquired and installed accordingly for the launch of the survey in early September 2016. The location was accessible to the large group of staff hired over the duration of the project. Other Malatest offices in Victoria, BC and Ottawa, ON supported the Toronto office in executing the data collection and analysis portion of the study. The office in Victoria largely supported the online survey completions, while the North York call centre focused on telephone (DDE) completions. Ottawa supported both offices, especially throughout recruiting for the call centre, and provided assistance with visual review, callbacks, and the post processing of completed surveys. Overall approximately 430 staff were newly hired and worked at the 2016 TTS call centre and other Malatest supporting offices.
A sample design was created prior to the launch of the survey in September 2016, outlining the target number of completions for each municipality of the survey area by postal code geography, by sample type (address-only, address-and-phone, phone-only), and by dwelling type (apartment vs. non-apartment flag in the Canada Post address base), to achieve the required number of funded surveys for each participating municipal agency. The sampling plan served as a guide throughout the course of data collection. Most municipalities exceeded the target of surveys and a few were just under target. Over the course of data collection, completion rates among the different municipalities were observed, updates were made to the sampling plan, and action was taken accordingly to increase calls or mail-outs to low response areas in order to achieve as representative of a sample as possible. A mailing plan was developed to spread out the advance letters across the survey period. Mail-outs, whether address-only or address-and-phone, started with smaller batches sent out in early September, increasing in October and November, and decreasing in early December.
With two survey platforms to complete surveys, the sample had to be uploaded to each system independently. Each sample set was imported into the Sample Management System (SMS) associated with the DDE system as well as to the CallWeb online survey platform, before sending out each mailing block, but all who received an advance letter were eligible to complete the survey online. Any voluntary cases who phoned in received a secure access code. Staff performed daily monitoring of the disposition of sample groups in each stage. This later allowed them to make necessary changes such as modifying the mailing plan, allocating additional interview staff, or reducing or stopping mail-outs to a given areas close to or exceeding completion targets.

P a g e | 70
2016 TTS: Design and Conduct of the Survey Transportation Tomorrow Survey
The 2016 TTS process of conducting the survey was similar to previous years. Although surveys were conducted online or by telephone with an interviewer, all completed surveys went through the procedure of visual review (with editing and callback as required), geocoding, and post-processing.
Staff was trained for its main roles prior to the launch of the survey, and training was available throughout part of the surveying period as recruitment continued. Emphasis was placed on hiring staff who also spoke French as well as other languages. Over the course of data collection, there were numerous non-English surveys completed. The demonstrated need for interviewers who spoke other languages only increased throughout the survey period, and positive feedback was provided by respondents who were happy to be able to participate.
A series of quality control measures were closely exercised to ensure the data collection phase resulted in high-quality data. All measures applied to the telephone survey (DDE) were also applied to the online survey (CallWeb). These measures included: logic checks to ensure all the data was properly collected, monitoring of live interviews on DDE, performance statistics to analyse information such as telephone refusal rates and online abandonment rates, visual review of completed surveys to ensure each survey was comprehensive, and callbacks on surveys missing information or needing clarification whether completed over the telephone or online. Other measures applicable to the DDE system included feedback from the coding process regularly delivered to interviewers and rotation of sample between interviewers. Lastly, random quality control audits were exercised for data collected from both platforms of the survey to ensure all other measures were being well executed.
Another process specific to the DDE system was the geocoding process. Once surveys went through a visual review and were either fully complete or corrected, they proceeded to the geocoding process to make sure the locations in the travel data collected were valid and correctly assigned to x-y coordinates. For online surveys, locations were geocoded to x-y coordinates during data capture using a Google-Map based system, and may later have been corrected by reviewers if locations were identified as erroneous as flagged by validation tests or in the visual review process. After surveys were verified by geocoders, they then moved on to the post-processing stage where final checks were performed to identify any remaining errors in household, demographic, or trip data. All surveys, whether completed over the telephone or online, went through these last steps. Final data processing included assigning x-y coordinates to traffic zones and other geographic boundary systems to be used for analysis, and data weighting and expansion.
In conclusion, over 171,300 surveys were completed via telephone and online. After data cleaning, a total of 162,708 validated cases were ultimately included in the final dataset, which was still over the initial target of 161,200 surveys. The online survey demonstrated a higher-than-anticipated response rate, and resulted in well over 60% of the overall survey completions. The online platform was particularly successful in including participants from the address-only sample, which enabled many households without a landline to participate, resulting in a more balanced representation of the population in the GTHA. Notwithstanding that the 2016 expanded survey results appear to provide a representative cross-section of the population in the GTHA, comparisons with previous cycles should be undertaken with caution. There are differences between TTS cycles in terms of the samples, survey methods, and post-survey data processing. Readers are referred to the 2016 TTS: Data Guide and the 2016 TTS: Data Expansion and Validation report available under separate covers for further detail on differences between the 2016 TTS and previous survey cycles with respect to survey content, data definitions, bias in the survey samples, and data expansion methods.

P a g e | 71
2016 TTS: Design and Conduct of the Survey Transportation Tomorrow Survey
SECTION 12: Recommendations for 2021 Having facilitated the 2016 TTS survey, Malatest has prepared a number of recommendations or suggested strategies for future TTS projects. These include recommendations regarding the general set up of the project, sampling, staffing challenges, managing operations, and data processing.
Considering the overall execution of the TTS, Malatest suggests that there be additional time between the award of the contract and the launch of the study. There are several components of the general process of the project that could benefit from having additional time to plan and execute prior to launch. Some of the areas that it would particularly benefit are outlined below:
allowing time for any changes to the methodology and survey design to be adequately considered and planned for, if such changes are to take place after award of the data collection contract;
better accommodation of the timelines for committee approvals for survey materials (such as survey invitation letters and the survey website content) as well as for approvals from participating agencies and the Minister’s office;
scheduling of pilot testing either during the previous fall season, or, at minimum, the spring prior to data collection (as the July 2016 field testing was rushed, and gave little time to make changes prior to the full launch); and
development of visual review and validation requirements and testing prior to the launch of survey administration.
Malatest’s suggestions for the survey software platform are outlined below:
If possible, a single integrated CATI/CAWI data collection platform be used.
If a single data collection platform is not possible, it is important to allow sufficient time to explore and set up linkages/bridges between systems (at least three to four months with working systems already in place if the systems are complex or if one system is to be loaded with complete data from the other system; less time would be required if the systems merely need to update each other with lists of completions to block further call attempts).
Any data collection systems developed by the client and provided to a subcontractor for use should be adequately supported by useful documentation and technical staff resources.
Given the challenges in making changes to and supporting the DDE system, continued use in future cycles may not be desirable. However, functions and features of the DDE system should be considered in the development of new systems, particularly with respect to the efficiency of data entry.
If the data collection system is to be developed by the client, it should be set up to handle contact samples in excess of 1,000,000 records to accommodate the large contact sample required given the lower response rates for address-only sample.
The use of Google Map APIs was quite successful, and in fact the Google coordinates often are more precise than the Land Information Ontario (LIO) street segment base. Accordingly, use of built-in map features for online surveys such as Google Map APIs is recommended.
It is also suggested that the sampling plan be approved at least three months (even longer if possible) prior to the data collection, to allow the vendor sufficient time to plan and implement the necessary processes and print appropriate quantities of materials as appropriate for the volumes by sample type, as well as hire and train sufficient staff to complete the required tasks as appropriate for the anticipated
P a g e | 72
2016 TTS: Design and Conduct of the Survey Transportation Tomorrow Survey
mix of telephone and online surveys. Based on the experience of the 2016 TTS, Malatest suggests the following regarding the sample types:
address-based sampling should be used in future studies as it improved coverage and better represented the population universe;
the proportion of address-only and address-and-phone sample types to use should be assessed based on current information on the prevalence of such households in the population (in order to ensure that the sample collected has appropriate representation of land-line and cell-phone-only households); and
use of phone-only sample in future studies should be considered with caution, as it did not provide additional demographic coverage and was far less productive than expected.
Staffing is crucial to execute a successful TTS. Based on Malatest’s experience, it is suggested that recruitment focus more on local hiring to remove the barrier of turnover due to long employee commute. It is also useful to cross-train staff to perform other duties when possible, to reduce turnover in case of delays. For example, in the 2016 cycle, there were technical issues with the DDE’s geocoding module which delayed the start of geocoding, so staff hired to the geocoding team were trained to perform other functions. Pilot testing of the data validation processes is also recommended so that productivity rates can be assessed, and appropriate numbers of staff trained for visual review and edits.
In terms of survey operations, it is suggested that the survey invitation letter (both for pilot survey and full survey) continue to be printed on the letterhead of the Minister’s office, and again with the logos of project partners. The letter appeared quite official, which is believed to have driven the high online response. See Appendix E for an example of the advance letter. While in2016, there may have been cost with the MTO undertaking envelope printing (with better rates from the Queen’s Printer than from commercial printers), the logistics of managing timelines and delivery of envelopes were sometimes challenging; accordingly, envelope printing may be better coordinated directly by the survey contractor, and an appropriate budget for envelope printing should be allocated for the survey contract. Outbound calling to 9:30 p.m. should be maintained, as the hours from 7:30 to 9:30 p.m. are typically the most productive. If there are significant changes from prior methodology, a slow start to data collection should be employed, with consideration of the impacts on the data collection schedule to allow for survey volumes to be made up while still allowing for a gradual ramp-down period at the tail end for the fine-tuning of geographic targets.
Planning should consider whether an even greater proportion of surveys might be completed online in future studies. In 2016, there was considerably more interest in the online survey than originally expected, even from the address-and-phone sample. Pilot testing at an equivalent time of year (i.e., not the height of summer) would provide a better sense of the online responses rates to expect from the letter mail-out).
The level of effort required to support the online surveys should not be underestimated. While budget may be saved on the actual entry of survey responses, more letters must be sent to obtain the same number of responses as when phone follow-up is possible, and surveys of all modes require considerable work beyond the entry of survey responses. Sufficient time and resources should be allocated to tasks such as: providing e-mail and telephone support to respondents with questions about the survey or how to answer survey questions; monitoring and identifying causes of online abandonment and implementing reduction strategies; making improvements to the online survey tool if required on the basis of respondent feedback; and recovering partially completed surveys, including a

P a g e | 73
2016 TTS: Design and Conduct of the Survey Transportation Tomorrow Survey
telephone follow-up component. Further improvements to the online survey should be considered both in terms of questionnaire design, programming and the user experience. These may further decrease abandonment rates.
For surveys on the scale of the TTS, templates for common questions and complaints from the public should be developed to ensure a timely response and consistent messaging about the survey. Sufficient resources should be allocated to responding to and tracking issues and complaints received via email, via the toll-free line, and referred to the contractor by other channels (concerns communicated directly to the Minister’s office, MTO, or partner agencies) and identifying responses to new issues that might arise.
Client requirements for the detailed processing and validation of the data should be developed and documented prior to survey administration, rather than relying on the corporate knowledge of previous staff. As valuable as the involvement of the 2011/12 TTS training manager, site managers, and project lead was in ensuring continuity between cycles, these individuals’ involvement is not necessarily guaranteed to continue into 2021. Therefore, thought may need to be given as to what the workflow process requirements might be, as well as specifying thresholds for acceptance/rejection of surveys (explicitly identifying scenarios for rejection/inclusion of surveys, which data fields are essential or optional, which validation tests are critical to address, and which validation tests can still fail and allow surveys to be accepted, and so on). Client requirements for data deliverables should also be well defined prior to project start, including requirements for variables required for the internal data deliverable that are not listed in the public version of the data tables and data guide. If data are to conform to pre-determined formats from previous cycles, examples should be provided well in advance of when the data must be delivered.
Malatest also suggest implementing processes for electronic form of workflow management to reduce the amount of paper managed in the visual review process, and to consider whether all cases need to be visually reviewed. The DDE system was set up to print out every single survey for visual review and various workflow steps. To match this process, the online surveys were also printed, even though there were already provisions to review and edit the surveys in database forms. This generated a considerably quantity of paper that had to be carefully managed. The survey committee and DMG may wish to consider whether validation tests may be further developed to allow error-free surveys to be identified and set aside for random quality control spot-checking, rather than detailed review of each case on paper. Many surveys with no issues at all were printed and reviewed without requiring any edits. While it is likely that the visual review process identified some data problems that may have escaped the validation tests, the benefit in terms of incremental improvement to the data quality could be assessed against the cost of reviewing all such surveys. Malatest recommends testing the success rate for automated identification of error-free surveys prior to making a decision to limit the amount of visual review required, as this would be a departure from all previous survey cycles. If the data platform is to be client-supplied, such testing should be completed prior to the scoping out of the final data collection and data processing requirements for full survey administration.
Malatest recommends that prior to the launch of the survey project, GIS files for traffic zones, municipal boundaries, and other administrative boundaries (such as municipal wards) should be updated and harmonized. The boundary files should: follow standard topology rules (for example: must not have gaps between features, must not overlap with each other), be free of errors in the official names of municipalities and planning districts, be updated with any changes to municipal boundaries applicable to the survey year, and harmonized such that traffic zones boundaries line up aggregate properly to

P a g e | 74
2016 TTS: Design and Conduct of the Survey Transportation Tomorrow Survey
planning districts, regions, wards and other any other desired reporting geographies. In the 2016 cycle, considerable time was required to identify and investigate issues, address problems with the GIS files, make fixes in the coding and/or x-y coordinates in the survey data (including some that required manual review), repeat spatial joins in GIS, verify changes, and retabulate results. Given that individual agencies may need to be consulted for the implementation of improvements to the GIS boundary files, we recommend this process be initiated six months to a year prior to the contract start, so that complete geographic definitions can be provided at the start of the project.
If TTC staff is to review surveys with transit trips, sufficient TTC resources and appropriate data access protocols should be planned for to handle the anticipated volume. Planning for the number of survey completions required should take into account the survey rejection rate (in 2016, about 5% for both the online and the DDE survey platforms). The proportion of surveys completed online and the greater level of effort required to validate the surveys and achieve the same rejection rate should be considered when hiring and scheduling staff. As possible, more of the survey validation tests could be integrated into the online survey to trigger corrections or clarifications by respondents and reduce the amount of follow-up that may be required. These tests could be integrated within the survey itself and/or at the end of the survey, prior to submission.
If it is up to the data collection contractor to develop workflow processes and data processing rules using client-supplied technology, sufficient time should be provided in the project schedule to allow for the development and testing of the workflow. If client-supplied technology is used, sufficient documentation should be provided (including data dictionaries, relational data structures, and an explanation of the internal processing of the data) to allow for the contractor to fully understand the software platform and make appropriate use of the software and the data tables. If the data collection contractor provides the data collection systems, the contractor may already have workflow processes set up, and less time may be required to develop workflows or investigate how the client data systems work.
In the conduct of the 2016 cycle and in previous cycles, continuity has played a role in building on the success of previous surveys. A number of individuals involved in previous cycles participated again in the current cycle, including members of the steering committee, DMG staff, and senior 2011 TTS staff under subcontract to Malatest. These individuals provided invaluable knowledge and perspectives in the planning and execution of this major data collection undertaking, including: providing technical training, advising on potential pitfalls, and offering insight on potential impacts of changes in methodology on the final data, based on first-hand experience with the complex technical issues of the survey. Compared to 2011, the 2016 cycle also saw a number of significant new challenges, including a further increase in cell-phone-only households (thus increased sampling and survey challenges), a move to address-based sampling, increased acceptance of and reliance on online surveying, use of new software systems and geocoding methods, and implementation of more complex data weighting (to mitigate for biases in the data sample collected). In this regard, it would be desirable in the next cycle to involve key contributors to the 2016 TTS in the preliminary planning and design of the next Transportation Tomorrow Survey, whether in a short-term consulting capacity during the planning phases or pilot testing, or involved in full survey administration.

P a g e | 75
2016 TTS: Design and Conduct of the Survey Transportation Tomorrow Survey
Appendices
P a g e | 76
2016 TTS: Design and Conduct of the Survey Transportation Tomorrow Survey
Appendix A: Organizational structure of 2016 TTS

P a g e | 77
2016 TTS: Design and Conduct of the Survey Transportation Tomorrow Survey
Organizational structure of TTS 2016
Vendor Team
Project Manager
Site Manager Training Manager
Consulting
Coordination Coordination
Supervision
Supervision
Project Advisor
Training & Supervision
Advice
Direction
Coordination
Other TTS Participating Agencies TTS Technical Advisory Committee
Transportation Information Steering Committee (TISC)
MTO
DMG Computer System
Manager
Assistance
Financial Administration & Project Management
Progress/QA Monitoring
Report & Technical Advice
Financial/Administration Advice
TTS Staff
Supervision Supervision Supervision
Computer Technicians
Geo-coders Reviewers Interviewers
Coding Team Leader
Review Team Leader
Interview Team Leader

P a g e | 78
2016 TTS: Design and Conduct of the Survey Transportation Tomorrow Survey
Appendix B: Transportation Tomorrow Survey (TTS) - Fact Sheet

P a g e | 79
2016 TTS: Design and Conduct of the Survey Transportation Tomorrow Survey
Transportation Tomorrow Survey (TTS) - Fact sheet
The Transportation Tomorrow Survey (TTS) is a confidential and voluntary travel survey on how Ontarians in the Greater Toronto Area and the Greater Golden Horseshoe area use the transportation system. The data collected helps local and regional governments, as well as the province and its agencies make transportation planning and investment decisions. The survey is repeated every five years.
The TTS is jointly undertaken by 22 funding agencies including the Ministry of Transportation of Ontario (MTO), Metrolinx/GO Transit, the TTC, and municipalities across the Greater Toronto Area and Greater Golden Horseshoe area. Starting in late August 2016, pre-survey letters will be sent to randomly selected households with details about the survey. Participants can take the survey by phone or online. (A limited field test will be conducted in July-August 2016, with up to 3,000 randomly sampled households contacted by letter and/or phone.)
1. Survey Type: Household travel survey. 2. Survey Methodology: Interviews conducted by telephone or online to collect information related to
household travel on the previous weekday. 3. Type of Information Collected: There are three types of factual information collected in the survey:
o Household Information: Home location, number of people, dwelling type (single family, apartment) total household income range
o Individual Information: Age range, gender, employment status (work full-time, part-time), work location, parking arrangements at work (free, paid), work at home, student status (attend school), school location, transit pass, occupation
o Trip Information: Origin and destination, mode of travel (car driver, car passenger, transit, walk, taxi/Uber, etc), trip purpose (work, school, etc.), start time, travel route information (transit trips only)
4. Survey Letters and Phone Contact: Most households will receive a pre-survey invitation letter. Households with listed phone numbers will also receive phone calls (caller display: “Ontario Gov’t”). A small sample will not receive the letter, but will be contacted via random digit dialled landline or cell phone number.
5. Survey Duration: Starts in early September 2016 and continues until the third week of December 2016. (A limited field test will be conducted in July-August 2016.)
6. Telephone Call Timing: Telephone calls will be made from 5:30 PM to 9:30 PM on weeknights and from 10:00 AM to 5:00 PM on weekends.
7. Survey Sample: About 163,500 households will be surveyed.
8. Survey Area: The survey area includes the Greater Toronto and Hamilton Area (GTHA), the regional municipalities of Niagara and Waterloo, the counties of Brant, Dufferin, Peterborough, Simcoe and Wellington, the cities of Barrie, Brantford, Guelph, Kawartha Lakes, and Peterborough, and the town of Orangeville.
Staff Contact:
Systems Analysis and Forecasting Office: Muhammad Khan (416) 585-7310

P a g e | 80
2016 TTS: Design and Conduct of the Survey Transportation Tomorrow Survey
Appendix C: Suggested Press Release by R. A. Malatest

P a g e | 81
2016 TTS: Design and Conduct of the Survey Transportation Tomorrow Survey
Press Release Template Provided to Funding Agencies
NEWS RELEASE for immediate release: Ontario’s Transportation Planning Survey
TORONTO— This fall, more than 160,000 households in Central Ontario will be asked to take part in the Transportation Tomorrow Survey, an exciting travel study looking at their travel habits and preferences. Results from this survey, which represents a partnership between the Ontario government, the Toronto Transit Commission, Metrolinx/GO Transit, and 20 municipal governments in the Greater Toronto and Greater Golden Horseshoe areas, will help in the long-term planning of the transportation system in these regions.
"This survey will help us better respond to each community's needs," said Clark. "We are looking at today's travel patterns to help us plan responsibly for the future— ensuring our growth is Smart Growth."
The Transportation Tomorrow Survey will provide input into highway improvements, development proposals, improving transit services, and determining needs for GO transit improvements.
Randomly selected household will receive an official letter letting them know they have been selected to take part and providing a secure access code they will need to take part. They can participate in the 5-10 minute survey online at the project website TTS2016.ca, or by calling the survey hotline at 1-855-586-3800. Questions will focus on trip information for each household member, including origin, destination, time, reason for travel, mode of transportation, as well as some basic demographic questions. All personal information will be kept confidential and used for statistical purposes only. Households that complete the survey will be eligible to receive one of twenty-five $1,000 prize draws.
The survey is being conducted by R.A. Malatest & Associates Ltd., the one of the largest independent consulting firms in Canada, in conjunction with the University of Toronto's Data Management Group. The study runs will run until the end 2016 and the results will be and released in 2017. The Transportation Tomorrow Survey has been administered every five years since 1986.
Media Contacts:
[Agencies to insert their media contacts as appropriate]
Disponible en français
For more information visit TTS2016.ca

P a g e | 82
2016 TTS: Design and Conduct of the Survey Transportation Tomorrow Survey
Appendix D: 2016 TTS Promotional Poster

P a g e | 83
2016 TTS: Design and Conduct of the Survey Transportation Tomorrow Survey

P a g e | 84
2016 TTS: Design and Conduct of the Survey Transportation Tomorrow Survey
Appendix E: Advance Letters

P a g e | 85
2016 TTS: Design and Conduct of the Survey Transportation Tomorrow Survey
Advance Letter Address-Only Sample (with GTHA Set of Logos) Ministry of Transportation Office of the Minister Ferguson Block, 3rd Floor 77 Wellesley St. West Toronto, Ontario M7A 1Z8 www.ontario.ca/transportation
Ministère des Transports Bureau du ministre Édifice Ferguson, 3e étage 77, rue Wellesley ouest Toronto (Ontario) M7A 1Z8 www.ontario.ca/transports
Your household has been randomly selected to represent your community in the 2016 Transportation Tomorrow Survey. The Transportation Tomorrow Survey is an important travel survey, conducted on behalf of the Province of Ontario, your municipality and other municipalities in central Ontario. Every five years for the past 30 years, this survey has collected travel information of people in your community to support planning for transportation infrastructure and services.
You may complete the survey online or by phone:
Log in online at TTS2016.ca using the secure access code at the top of this letter.
Complete the survey by phone with a professional interviewer by calling 1-855-688-1133 (toll-free). The phone interview will take about 10 minutes.
Your survey responses will be anonymous, and all information collected will be kept confidential. Your responses will be combined with other responses in your area and used to identify travel patterns. No information collected through this survey will be able to be traced to your household.
Your household’s participation in this survey is critical to the project’s success. The Transportation Tomorrow Survey is an important tool to support planning for transportation infrastructure and services across central Ontario. If you have any questions, please call the Ministry of Transportation at 1-800-268-4686, or visit our web site at TTS2016.ca.
Thank you for participating.
Sincerely, Steven Del Duca Minister of Transportation
Log in at TTS2016.ca Your secure access code is
1234ABCD

P a g e | 86
2016 TTS: Design and Conduct of the Survey Transportation Tomorrow Survey
Advance Letter Address-Only Sample – Instructions Page
2016 Transportation Tomorrow Survey
How it works A sample list of the questions to be asked is shown below. You can participate in two ways:
1. You may fill out the survey online by going to our secure website TTS2016.ca and using the access code provided on the first page of this letter. If you require assistance, we provide phone-in support between 9 a.m. and 9:30 p.m. on weekdays and 10 a.m. to 6 p.m. on weekends at 1-855-688-1133 (toll-free).
2. You may also call 1-855-688-1133 (toll-free) during those same hours and one of our professional interviewers will be happy to conduct the survey with you over the telephone.
Survey Questions Most of the questions asked will be about your travel and that of other members of your household on the previous weekday. We will only be collecting trip data for individuals 11 years of age or older. We would like to know specific information about where and when trips were taken by each member of your household. This information, collected from approximately 163,000 households in Central Ontario, will give us a better picture of changing travel patterns to assist in the planning of improved transportation services in your area.
Here is a sample of the questions asked:
A. About your household
Type of building (house or apartment)
Number of people
Number of vehicles available for personal use
B. About each person’s
Age
Driver’s licence status
Workplace or school address
C. About each trip made by each person on the previous day
Origin and destination (from where to where?)
Reason for making the trip (e.g. shopping)
Start time of the trip
Mode of transportation (bus, car, bicycle, etc.)
A trip is a one-way journey from one location to another by any form of motorized transportation or bicycle. We will request some information on walking, but only for trips to and from work or school. These details provide an understanding of how members of a household interact with the transportation system. This level of understanding leads to better estimates of future needs for roads and transit as your area grows.
Authority for collection of this information has been obtained from the Government of Ontario and each of the Regional and Local governments participating in this survey. Confidentiality of this information is
protected under the Freedom of Information and Protection of Privacy Act.

P a g e | 87
2016 TTS: Design and Conduct of the Survey Transportation Tomorrow Survey
Advance Letter Address-and-Phone Sample (with Non –GTHA Set of Logos)
Ministry of Transportation Office of the Minister Ferguson Block, 3rd Floor 77 Wellesley St. West Toronto, Ontario M7A 1Z8 www.ontario.ca/transportation
Ministère des Transports Bureau du ministre Édifice Ferguson, 3e étage 77, rue Wellesley ouest Toronto (Ontario) M7A 1Z8 www.ontario.ca/transports
Your household has been randomly selected to represent your community in the 2016 Transportation
Tomorrow Survey. The Transportation Tomorrow Survey is an important travel survey, conducted on
behalf of the Province of Ontario, your municipality and other municipalities in central Ontario. Every
five years for the past 30 years, this survey has collected travel information of people in your community
to support planning for transportation infrastructure and services.
You will be contacted by telephone next week and asked to spend about 10 minutes answering transportation-related questions. You can also complete the survey online at TTS2016.ca using your secure access code at the top of this letter or by calling
1-855-688-1133 (toll-free). It’s important that one person complete the survey for the entire household (regarding the travel of household members 11 years of age and older).
Your survey responses will be anonymous, and all information collected will be kept confidential. Your responses will be combined with other responses in your area and used to identify travel patterns. No information collected through this survey will be able to be traced to your household.
Your household’s participation in this survey is critical to the project’s success. The Transportation
Tomorrow Survey is an important tool to support planning for transportation infrastructure and services
across central Ontario. If you have any questions, please call the Ministry of Transportation at 1-800-
268-4686, or visit our web site at TTS2016.ca.
Thank you for your participation.
Sincerely, Steven Del Duca Minister of Transportation
Log in at TTS2016.ca Your secure access code is

P a g e | 88
2016 TTS: Design and Conduct of the Survey Transportation Tomorrow Survey
Advance Letter Address-and-Phone Sample – Instructions Page
2016 Transportation Tomorrow Survey
How it works
A sample list of the questions to be asked is shown below. You can participate in three ways:
1. You may fill out the survey online by going to our secure website TTS2016.ca and using the access code provided on the first page of this letter. If you require assistance, we provide phone-in support between 9:00 a.m. and 9:30 p.m. on weekdays and 10:00 a.m. to 6:00 p.m. on weekends at 1-855-688-1133 (toll-free).
2. You may call 1-855-688-1133 (toll-free) during those same hours and one of our professional interviewers will be happy to conduct the survey with you over the telephone.
3. If we have not heard from you, your household will be contacted by a professional interviewer. On weeknights, the calls will be made between 9:00 a.m. and 9:30 p.m. If the interviewer calls on a weekend, it will be between 10:00 a.m. and 6:00 p.m.
Survey Questions
Most of the questions asked will be about your travel and that of other members of your household on the previous weekday. We will only be collecting trip data for individuals 11 years of age or older. We would like to know specific information about where and when trips were taken by each member of your household. This information, collected from approximately 163,000 households in Central Ontario, will give us a better picture of changing travel patterns to assist in the planning of improved transportation services in your area.
Here is a sample of the questions asked:
A. About your household
Type of building (house or apartment)
Number of people
Number of vehicles available for personal use
B. About each person’s
Age
Driver’s licence status
Workplace or school address
C. About each trip made by each person on the previous day
Origin and destination (from where to where?)
Reason for making the trip (e.g., shopping)
Start time of the trip
Mode of transportation (bus, car, bicycle, etc.)
A trip is a one-way journey from one location to another by any form of motorized transportation or bicycle. We will request some information on walking, but only for trips to and from work or school. These details provide an understanding of how members of a household interact with the transportation system. This level of understanding leads to better estimates of future needs for roads and transit as your area grows.
Authority for collection of this information has been obtained from the Government of Ontario and each of the Regional and Local governments participating in this survey. Confidentiality of this information is
protected under the Freedom of Information and Protection of Privacy Act.

P a g e | 89
2016 TTS: Design and Conduct of the Survey Transportation Tomorrow Survey
Appendix F: Exploration of the Concordance between Google-Geocoded Destinations in Online Surveys and the Land Information Ontario Geographic Base

A p p e n d i x F P a g e | 1
TTS 2016 Survey Design and Conduct Transportation Tomorrow Survey
TRANSPORTATION TOMORROW SURVEY Exploration of the Concordance between Google-Geocoded Destinations in
Online Surveys and the Land Information Ontario Geographic Base
FEBRUARY 24, 2017
Andreas Rose, Vice President – Research Phone: 1-800-665-5848 ext. 408 858 Pandora Ave E-mail: [email protected] Victoria, BC V8W 1P4 www.malatest.com

A p p e n d i x F P a g e | 2
2016 TTS: Design and Conduct of the Survey Transportation Tomorrow Survey
Transportation Tomorrow Survey
Exploration of the Concordance between Google-Geocoded Destinations in Online Surveys and the Land Information Ontario Geographic Base
Table of Contents
1 BACKGROUND ................................................................................................................................3 1.1 LAND INFORMATION ONTARIO ..................................................................................................... 3 1.2 DDE USE OF LIO ............................................................................................................................. 3 1.3 GOOGLE MAPS LOCATIONS ........................................................................................................... 3
2 RATIONALE FOR EXPLORING THE CONCORDANCE BETWEEN LIO AND GOOGLE ................................4
3 STEPS IN EXPLORING CONCORDANCE..............................................................................................4
4 MATCHING GOOGLE LOCATIONS TO LIO STREET SEGMENTS ............................................................6 4.1 TEXT MATCHING GOOGLE ADDRESS DESCRIPTIONS TO LIO STREET SEGMENTS .......................... 6 4.2 SPATIALLY MATCHING GOOGLE COORDINATES TO THE CLOSEST LIO STREET SEGMENT ............. 7 4.3 ASSESSING THE SPATIAL CONCORDANCE BETWEEN GOOGLE AND LIO COORDINATES ............... 9 4.4 ASSESSING TRAFFIC ZONE CONCORDANCE BETWEEN GOOGLE AND LIO COORDINATES ........... 14 4.5 CONCORDANCE FOR DIFFERENT GOOGLE GEOCODING METHODS ............................................ 15 4.6 CONCORDANCE FOR STUDY GEOGRAPHIES ................................................................................ 17
5 RECOMMENDATIONS ................................................................................................................... 21
List of Exhibits
Exhibit 1 - Google address mapped to the closest LIO Street Segment. Same street name. ....................... 7 Exhibit 2 - Google address mapped to the closest LIO Street Segment. Different street name. ................. 8 Exhibit 3 - Distance Concordance by Google-to-LIO Match Type ................................................................. 9 Exhibit 4 - Large university campus causing difference in geocoding, Waterloo ....................................... 10 Exhibit 5 - Large complex causing difference in geocoding, North York .................................................... 11 Exhibit 6 - Crescent street causing difference in geocoding, Mississauga .................................................. 12 Exhibit 7 - Good Alignment between Google and LIO, City of Hamilton .................................................... 13 Exhibit 8 - Poor Alignment between Google and LIO. Google road network has slight offsets from LIO. . 13 Exhibit 9 - Traffic Zone Concordance by Google-to-LIO Match Type .......................................................... 14 Exhibit 10 - Concordance by Google Geocoding Method ........................................................................... 16 Exhibit 11 - Average Difference in Distance per Planning District for all match types ............................... 17 Exhibit 12 - Average Difference in Distance per Planning District and per FSA – Textual Matches Only ... 18 Exhibit 13 - Concordance by Municipality / Planning District ..................................................................... 18

A p p e n d i x F P a g e | 3
2016 TTS: Design and Conduct of the Survey Transportation Tomorrow Survey
1 Background
1.1 Land Information Ontario
The Transportation Tomorrow Survey has traditionally made use of street segment files as the basis of geocoding the great majority of all locations, most recently using the Land Information Ontario (LIO) street segment file. The LIO file includes street segments with civic number ranges on each side of the street (‘From Left’ to ‘To Left’; ‘From Right’ to ‘To Right’).
1.2 DDE use of LIO
For telephone surveys completed via the Direct Data Entry (DDE) system, the DDE allows interviewers to enter and match to a list of LIO-based standardized addresses and allows geocoders to geocode new place descriptions to LIO-based addresses. As the street segment only defines the ends of the street segment, when a specific civic number and street name are entered for a given city, the DDE uses an algorithm to interpolate the location of the specific address along the street segment. For example, within a given municipality, “175 Main Street” may match to an LIO street segment that, on the left side, has civic numbers ranging from 101 Main Street to 199 Main Street; the DDE would place the x,y coordinates at 76% of the way along the street segment, with an offset 22m to the left.
1.3 Google Maps Locations
The CallWeb online surveys use Google Maps APIs to allow online respondents to search for and confirm locations. The Google utilities yield locations found either through ‘auto-complete’ suggestions (offered as the respondent starts to type the description of a location), through best matches of location description text to a places database (when there are no correct auto-complete suggestions), or via interaction with a map (drag-and-drop, double-click). The user is asked to review the location on the map and confirm that it is correct or revise the location, before continuing in the survey. If the result returned is too imprecise (e.g., just a city name and latitude and longitude of the centre of the city), the online survey does not allow the respondent to proceed. Typically, the CallWeb surveys are self-completed by the respondent, although some that have been started in CallWeb may be completed over the telephone with interview staff (e.g., respondent partially completed the survey before calling the toll-free line or receiving a follow-up call).
The Google locations are recorded with latitude and longitude, a description from Google’s places databases, and the type or types of location represented, and some information about the search history. Depending on the type of location and/or match to the Google database, there may be varying levels of ‘precision’ in the resulting coordinates. For example, the location may have rooftop precision for a business or place of interest, interpolation of a civic number along a street segment (much as with how DDE uses the LIO segment file), a location identified as being within a limited civic address range (e.g., the centre point of somewhere between civic numbers 35 and 85), a street centre point (if only the street is known), an intersection, a specific transit stop, etc.
Post-survey, a small portion of online surveys may also have geocodes (latitude, longitude) manually entered by data review staff in order to correct locations online respondents had mistakenly confirmed as correct.

A p p e n d i x F P a g e | 4
2016 TTS: Design and Conduct of the Survey Transportation Tomorrow Survey
2 Rationale for Exploring the Concordance between LIO and Google
Differences may exist in how a given location might be geocoded via the LIO base and how the same location might be geocoded via Google Maps. For example, locations coded via the LIO base will always be offset 22 metres from the street centre line, and civic addresses are presumed to be equally spaced between the ‘from’ and ‘to’ end points of the street segment. Google Maps may sometimes furnish results that are similarly interpolated along street segments, but with a different offset from the centre line, but other times will furnish results that more precisely identify the specific location along the street segment, and sometimes will even identify the location as the centroid of the actual building (i.e., with a much greater offset from the street centre line in the case of a shopping centre or other large building).
Some questions have been raised as whether the location coordinates captured via online surveys in CallWeb should be recoded to match the LIO base or whether the Google-returned coordinates can stand alone and coexist with LIO-based coordinates. The objective of the current exercise is to explore the extent to which online trip destination coordinates would differ if they were coded via the DDE/LIO approach and the extent to which those differences might matter to the eventual analysis of the data.
3 Steps in Exploring Concordance
In order to explore the concordance between LIO and Google, the following steps were planned:
1. Undertake textual matches of location descriptions captured by online surveys to the LIO street
segments file, as possible given the text descriptions of addresses recorded in the online surveys
a. Report on the overall match success rate;
b. Report on the match success rate for different Google-based location types;
2. For locations that can be text-matched, explore the extent to which the coordinates returned by
Google differ from the coordinates returned by the LIO street segment interpolation.
a. Discard cases that are obvious poor matches (which may occur if the same street name
exists in different parts of the same city);
b. For locations considered to be good matches, determine the distance between the
Google-based and LIO-based coordinates, and the proportion of cases that are very
close, moderately close, etc.;
3. For the locations that cannot be matched according to the description, undertake matching of
the latitude/longitude returned by Google to the closest LIO street segment, and determine the
civic number range corresponding to the closest point on the LIO street segment.
a. For these locations, randomly check results and review against the Google-based
location description first to confirm that the matches are generally good.
b. Discard cases that are obviously poorly geocoded in one system or the other (and flag
for follow up geocoding review if necessary).
c. Determine the distance between the Google-based and LIO-based coordinates, and the
proportion of cases that are very close, moderately close, etc.
4. Once the preceding steps have been undertaken, plot both the Google-based coordinates and
the corresponding LIO-based coordinates, and undertake spatial joins to the TTS Traffic Zone
system to determine the extent to which they systems might return similar or different kinds of
A p p e n d i x F P a g e | 5
2016 TTS: Design and Conduct of the Survey Transportation Tomorrow Survey
results for zone-based analysis. This task would exclude locations coded to intersections, which
have yet to be offset away from where the street centre-lines meet.
5. Collaborate with the UofT DMG to undertake an overall assessment of the concordance
between Google-based coordinates and LIO-based coordinates, and the likely impact it may
have on analysis, in order to make recommendations as to how Google-based geocodes should
be treated in the final dataset. Options may include:
a. take no action, i.e., accept Google-based geocodes as reasonably precise (and
sometimes even more precise than LIO coordinates);
b. match Google locations to LIO via textual matches as possible;
c. re-geocode Google locations that do not have addresses (e.g., a park; a transit stop; or
that have addresses which do not match to the LIO via textual matches) to addresses
that can match to the LIO segments file via spatial matches to the closest LIO street
segment; and
d. re-geocode Google locations that do not have addresses (e.g., a park; a transit stop;
etc.) to addresses that match to the LIO segments file via matches to the closest
segment via manual review.
Of the options, the latter is to be avoided, if possible, as manually re-geocoding locations would consume resources and delay the project.

A p p e n d i x F P a g e | 6
2016 TTS: Design and Conduct of the Survey Transportation Tomorrow Survey
4 Matching Google Locations to LIO Street Segments
4.1 Text Matching Google Address Descriptions to LIO Street Segments
The first step undertaken was to match address descriptions in Google against the street names and civic number ranges in the LIO street segments file. Good matches would then used to explore how closely or far apart the Google-based coordinates would be compared to the LIO-based coordinates for the same address.
It may be noted that Google returns descriptions that often include the names of villages, small towns, and historic municipality names (e.g., Etobicoke, North York). By contrast, the LIO street segment file only includes the same city/town name for each Census Subdivision (e.g., streets in Etobicoke and North York are all identified as being in Toronto), but it does include the Planning District (PD) for each location. In order to maximize the match potential, as a precursor to the textual matches, the Google-based coordinates were first spatially joined to the TTS municipality/PD system, and the municipality or Toronto planning district was substituted in for the city/town name in the Google-based description of the location. A number of operations were also undertaken to parse the Google-based address descriptions to break out the component parts of each address description and better match against the LIO street names, e.g. standardizing “Ave” and “Avenue” to match how the street types are described in the LIO.
In total, 88.5% matched: 86.3% had a good text match to a unique LIO street segment within the same municipality or planning district (Type 1 matches); a further 2.2% could be matched to more than one LIO street segment with the same street name and civic number range (Type 2).
Possible reasons for Google descriptions not matching an address in LIO might include:
possible errors or issues in the automated algorithms to parse the address descriptions in
Google into their component parts for matching;
differences in how roads are described in Google compared to the LIO. For example, Google
might return “14TH LINE” as a street name, where as LIO may have the street listed as “14
LINE”; or, Google might return the number of a highway passing through an urban area,
whereas LIO may have the street segment listed under the local street name of the highway;
areas of more complete coverage in Google than in LIO or vice versa;
imprecise address descriptions in Google (e.g., very occasionally if a user double-clicks on, or
drags the marker to, a location on the Google Map, Google will return an address with a civic
number range within which the clicked point on the map might be found); or
location description in Google does not contain a specific address (e.g., a place of interest like a
park, or a transit stop) even though it is accurately geocoded.

A p p e n d i x F P a g e | 7
2016 TTS: Design and Conduct of the Survey Transportation Tomorrow Survey
4.2 Spatially Matching Google Coordinates to the Closest LIO Street Segment
For the remaining 11.5% of locations for which no textual match was found, the Google coordinates were mapped to the closest street segment within a radius of 500m.
In the text matching exercise, a small portion of all cases (1,365 or 0.5%) had been found to have a street name from Google that matched identically to one or more segments in LIO, but the civic number provided by Google could not be found within any of the civic number ranges of the LIO street segments. For these cases, the Google coordinates were matched with the closest LIO street segment with the same name (Type 3 matches). In a number of cases, the closest LIO street segment did not have civic number ranges on either side of the street (e.g., left from = 0, left to = 0, right from = 0, right to = 0).
The remaining 33,000 cases were spatially matched to the closest LIO street segment within 500m (Type 4 matches). For this match type, a sample of 336 cases was visually reviewed. In total, 68% of the matched LIO street segments have the same street name as the address given by Google, but a different format, different spelling, and/or differing information (e.g., missing street direction on one side of the join). Exhibit 1 shows an example for “Seventh Concession Road” in Google description vs. “7th Concession Road” in the LIO base.
Exhibit 1 - Google address mapped to the closest LIO Street Segment. Same street name.

A p p e n d i x F P a g e | 8
2016 TTS: Design and Conduct of the Survey Transportation Tomorrow Survey
The following figure (Exhibit 2)shows examples of spatial matches to street segments of different names. In the figures, the red dots identify the Google-based coordinates, the black lines illustrate the LIO street segments, and the green lines illustrate the distance between the Google-based coordinates and the LIO-derived coordinates. In the example below, for most of the locations noted at the top of the map, the locations are identified by Google as being addresses on Highway 2, but have been matched to the LIO segment for the cross-street of Boswell Drive, as it is closer to the Google coordinates. It is worth noting that even if LIO-based coordinates had been assigned for the civic address on Highway 2 street segment with just a 22-m offset from Highway 2, it is likely that the LIO-derived coordinates would fall within the same traffic zone as the Google coordinates.
Only 116 cases could not be mapped to a LIO street segment (i.e., no street segment was found within 500m of the Google coordinates).
Exhibit 2 - Google address mapped to the closest LIO Street Segment. Different street name.
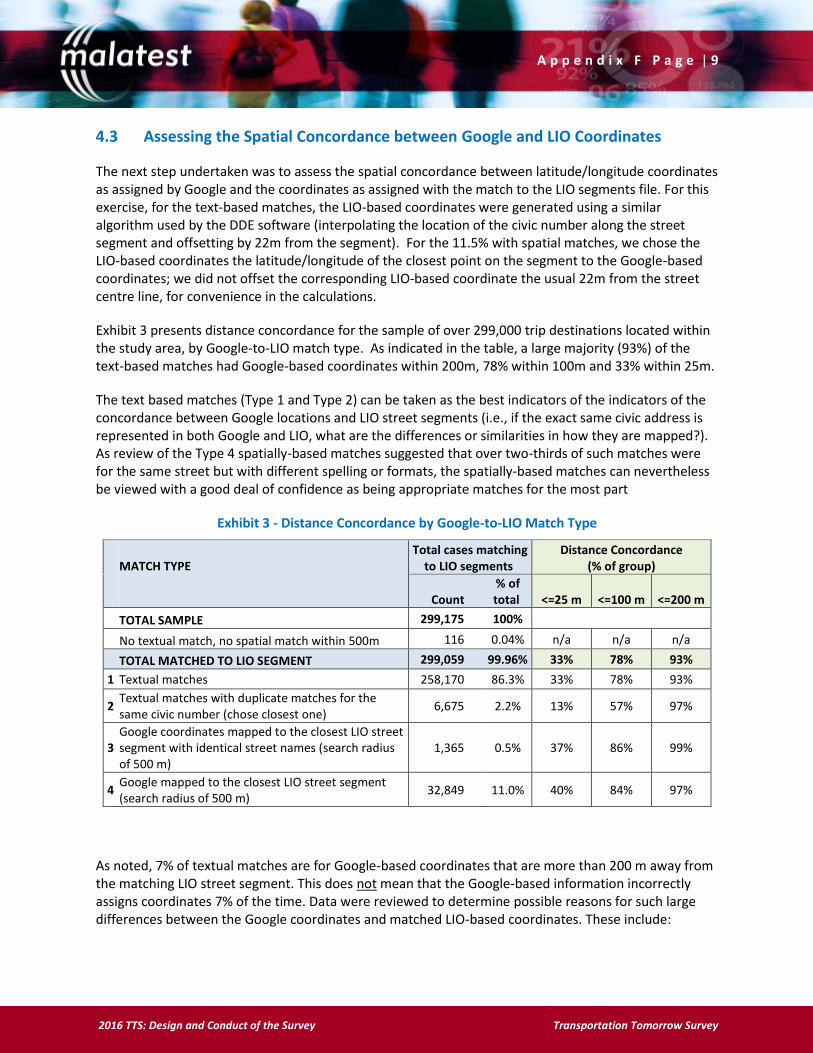
A p p e n d i x F P a g e | 9
2016 TTS: Design and Conduct of the Survey Transportation Tomorrow Survey
4.3 Assessing the Spatial Concordance between Google and LIO Coordinates
The next step undertaken was to assess the spatial concordance between latitude/longitude coordinates as assigned by Google and the coordinates as assigned with the match to the LIO segments file. For this exercise, for the text-based matches, the LIO-based coordinates were generated using a similar algorithm used by the DDE software (interpolating the location of the civic number along the street segment and offsetting by 22m from the segment). For the 11.5% with spatial matches, we chose the LIO-based coordinates the latitude/longitude of the closest point on the segment to the Google-based coordinates; we did not offset the corresponding LIO-based coordinate the usual 22m from the street centre line, for convenience in the calculations.
Exhibit 3 presents distance concordance for the sample of over 299,000 trip destinations located within the study area, by Google-to-LIO match type. As indicated in the table, a large majority (93%) of the text-based matches had Google-based coordinates within 200m, 78% within 100m and 33% within 25m.
The text based matches (Type 1 and Type 2) can be taken as the best indicators of the indicators of the concordance between Google locations and LIO street segments (i.e., if the exact same civic address is represented in both Google and LIO, what are the differences or similarities in how they are mapped?). As review of the Type 4 spatially-based matches suggested that over two-thirds of such matches were for the same street but with different spelling or formats, the spatially-based matches can nevertheless be viewed with a good deal of confidence as being appropriate matches for the most part
Exhibit 3 - Distance Concordance by Google-to-LIO Match Type
MATCH TYPE Total cases matching
to LIO segments Distance Concordance
(% of group)
Count % of total <=25 m <=100 m <=200 m
TOTAL SAMPLE 299,175 100%
No textual match, no spatial match within 500m 116 0.04% n/a n/a n/a
TOTAL MATCHED TO LIO SEGMENT 299,059 99.96% 33% 78% 93%
1 Textual matches 258,170 86.3% 33% 78% 93%
2 Textual matches with duplicate matches for the same civic number (chose closest one)
6,675 2.2% 13% 57% 97%
3 Google coordinates mapped to the closest LIO street segment with identical street names (search radius of 500 m)
1,365 0.5% 37% 86% 99%
4 Google mapped to the closest LIO street segment (search radius of 500 m)
32,849 11.0% 40% 84% 97%
As noted, 7% of textual matches are for Google-based coordinates that are more than 200 m away from the matching LIO street segment. This does not mean that the Google-based information incorrectly assigns coordinates 7% of the time. Data were reviewed to determine possible reasons for such large differences between the Google coordinates and matched LIO-based coordinates. These include:

A p p e n d i x F P a g e | 10
2016 TTS: Design and Conduct of the Survey Transportation Tomorrow Survey
LIO-derived street address coordinates are close to the edge of the property, whereas
coordinates assigned by Google are the centre of a very large building (e.g., shopping mall,
recreation centre), complex (e.g., university campus) or other large property (e.g., park, parking
lot). Exhibit 4 shows an example of large differences in the Google and LIO versions of the
coordinates caused by a large university complex (University of Waterloo). Red points show
address coordinates from Google. Black lines are LIO street segments. Blue lines represent
distances greater than 500m between Google and the matched LIO coordinates. The Google-
based coordinates for the eight locations to the north of Columbia St. W all have the same street
address of “200 Columbia St. W”, even though they are different buildings on campus (user
might have double-clicked on their building on the map or dragged the marker to their building).
The LIO street segment to which these match (to the west of the map on Columbia St W) has a
civic number range of 200 to 350. For Columbia St W, LIO also has a number of street segments
to the northeast of this segment which have no civic numbers (from = 0, to = 0). A similar
pattern is present for the two locations on campus both returned from Google with street
address of “200 University Dr.” that match to the LIO street segment to the east of the map.
Exhibit 4 - Large university campus causing difference in geocoding, Waterloo

A p p e n d i x F P a g e | 11
2016 TTS: Design and Conduct of the Survey Transportation Tomorrow Survey
Similarly, in the map below (Exhibit 5), the Google locations all match to a street segment with civic number range from 123 to 123 Garratt Blvd. The Google locations are all between 200m to 500m from the LIO street segment. The Google locations appear to be a more accurate positioning for where their activities would take place at the destination (Bombardier Aerospace complex with address of 123 Garratt Blvd). The LIO version of the location appears to be on the incorrect side of the street for the Bombardier complex.
Exhibit 5 - Large complex causing difference in geocoding, North York
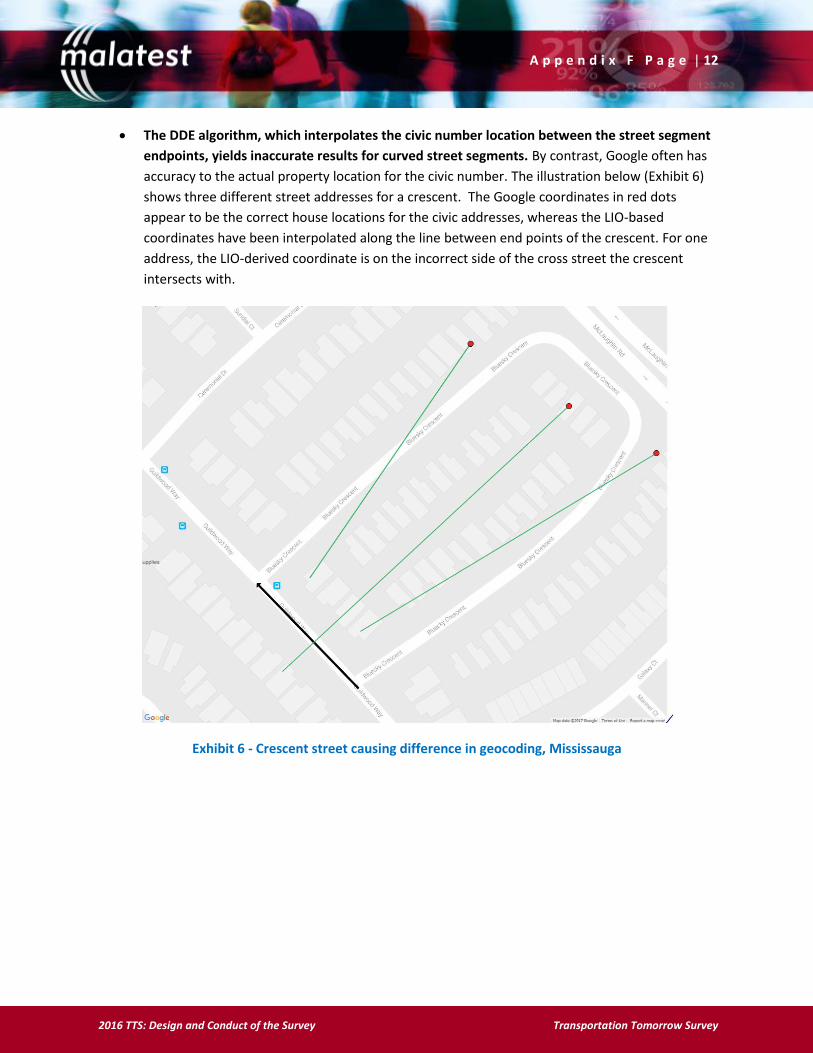
A p p e n d i x F P a g e | 12
2016 TTS: Design and Conduct of the Survey Transportation Tomorrow Survey
The DDE algorithm, which interpolates the civic number location between the street segment
endpoints, yields inaccurate results for curved street segments. By contrast, Google often has
accuracy to the actual property location for the civic number. The illustration below (Exhibit 6)
shows three different street addresses for a crescent. The Google coordinates in red dots
appear to be the correct house locations for the civic addresses, whereas the LIO-based
coordinates have been interpolated along the line between end points of the crescent. For one
address, the LIO-derived coordinate is on the incorrect side of the cross street the crescent
intersects with.
Exhibit 6 - Crescent street causing difference in geocoding, Mississauga
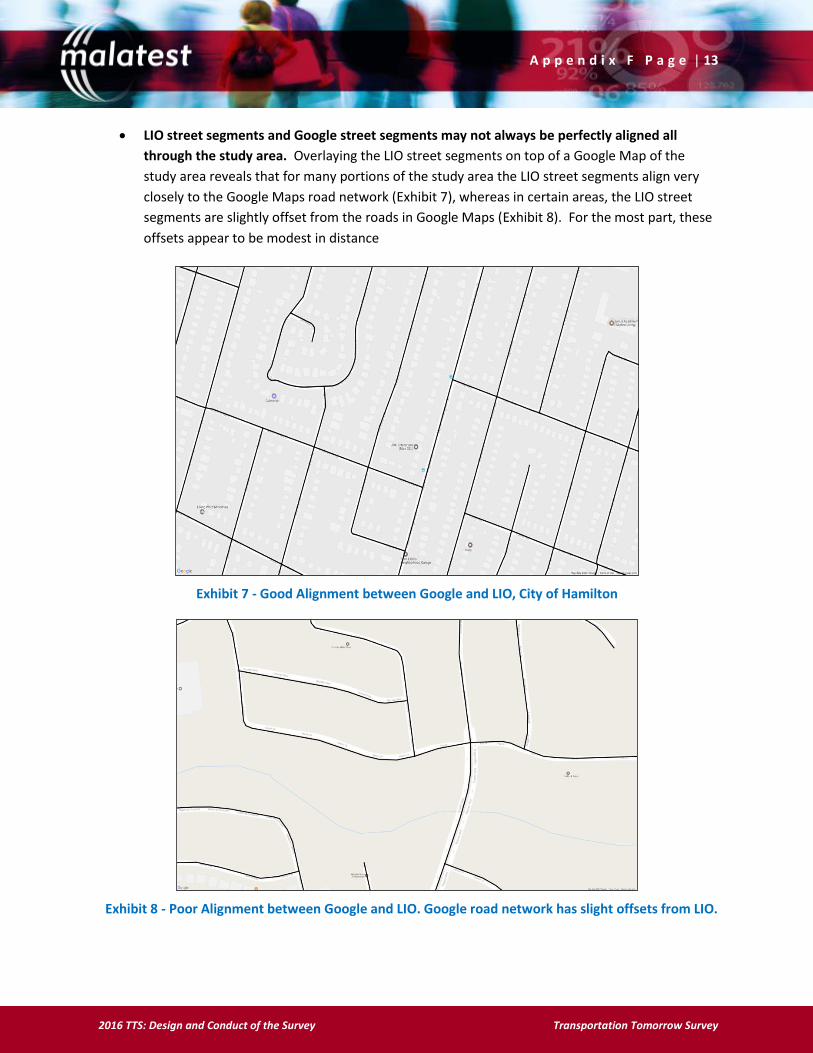
A p p e n d i x F P a g e | 13
2016 TTS: Design and Conduct of the Survey Transportation Tomorrow Survey
LIO street segments and Google street segments may not always be perfectly aligned all
through the study area. Overlaying the LIO street segments on top of a Google Map of the
study area reveals that for many portions of the study area the LIO street segments align very
closely to the Google Maps road network (Exhibit 7), whereas in certain areas, the LIO street
segments are slightly offset from the roads in Google Maps (Exhibit 8). For the most part, these
offsets appear to be modest in distance
Exhibit 7 - Good Alignment between Google and LIO, City of Hamilton
Exhibit 8 - Poor Alignment between Google and LIO. Google road network has slight offsets from LIO.

A p p e n d i x F P a g e | 14
2016 TTS: Design and Conduct of the Survey Transportation Tomorrow Survey
4.4 Assessing Traffic Zone Concordance between Google and LIO Coordinates
Setting aside for the moment the reasons for differences in distances between Google-based coordinates and LIO coordinates, and the relative accuracy of the two geocoding methods, the question remains as to whether the introduction of Google-based coordinates to the TTS will affect the results of data analysis. For example, given that 22% of coordinates furnished by Google are more than 100m away from the coordinates that would have been obtained if the same address was geocoded using the LIO-based street segment civic number interpolation, how much of a difference would this make to a typical analysis of the data using the 2006 TTS traffic zone system? Therefore, after the matches were completed, the next step was to determine the extent to which the use of Google-based coordinates may result in changes in the distribution by traffic zone. The results are presented in Exhibit 9, below.
In 95% of the cases, the destination coordinates fall in the same traffic zones. This high level of concordance is encouraging and suggests that most analyses would provide similar results regardless of whether the coordinates were coded via Google or via the LIO-based algorithm. This would be even more true for analyses that aggregated traffic zones, given that in many instances the Google-based coordinates were in a neighbouring traffic zone to that of the LIO-based coordinates.
Exhibit 9 - Traffic Zone Concordance by Google-to-LIO Match Type
MATCH TYPE Total cases matching
to LIO segments Traffic Zone
Concordance
Count % of
sample % within same
traffic zone
TOTAL SAMPLE 299,175 100%
No textual match, no spatial match within 500m 116 0.04% n/a
TOTAL MATCHED TO LIO SEGMENT 299,059 99.96% 95%
1 Textual matches 258,170 86.3% 96%
2 Textual matches with duplicate matches for the same civic number (chose closest one)
6,675 2.2% 83%
3 Google coordinates mapped to the closest LIO street segment with identical street names (search radius of 500 m)
1,365 0.5% 92%
4 Google mapped to the closest LIO street segment (search radius of 500 m)
32,849 11.0% 86%

A p p e n d i x F P a g e | 15
2016 TTS: Design and Conduct of the Survey Transportation Tomorrow Survey
4.5 Concordance for Different Google Geocoding Methods
When locations were captured in the online surveys, the type of Google-based geocoding method was recorded for reference, e.g., whether the search yielded a location that matched to a specific street address, intersection description, point of interest such as a business, postal code, etc. If the respondent interacted in the map (12.3% of all geocoded locations) by double clicking or dragging the marker, this was recorded as the geocoding method. A very small proportion of all locations were re-geocoded by data reviewers post-survey. The geocoding method was not returned by the Google search function or the map for another small proportion of all locations.
The sample was explored to determine whether there were differences by geocoding method in terms of the degree of concordance. The results are presented in the table on the following page.
Amongst the more common types of geocoding results in the survey data, Google street addresses (being 71% of all locations) had a concordance rate matching the average (97%), places of interest (office buildings, business establishments, shopping centres, parks, etc.) concorded 94% of the time, and locations geocoded via the respondent interacting with the map concorded only slightly less often (double-click, 93%; drag and drop, 94%). Of the common methods used to geocode the vast majority of locations, there does not appear to be a geocoding method that yielded poor levels of concordance. I.e., there should be no need to have to troubleshoot pockets of data for specific geocoding methods.

A p p e n d i x F P a g e | 16
2016 TTS: Design and Conduct of the Survey Transportation Tomorrow Survey
Exhibit 10 - Concordance by Google Geocoding Method
ID Accuracy
Total number of
cases matching
to LIO segments
Distance Concordance (% within distance) Traffic Zone
Concordance % within same
traffic zone <=25m <=100m <=200m
Total n 299,059 99,733 232,878 278,035
95% % 100% 33% 78% 93%
Location Geocoded via Google Places Autocomplete / Geocode
11 Street Address (Google) 213,288 39% 83% 95% 96%
12 Intersection (Google) 6 50% 83% 83% 100%
13 POI (Google) 39,453 16% 59% 85% 92%
14 Postal Code (Google) 6 0% 50% 100% 100%
15 Neighborhood (Google) 1 0% 0% 0% 100%
16 Route/Street Name (Google) 17 0% 100% 100% 76%
17 Locality (Google) 5 60% 100% 100% 100%
18 Transit Station 1,051 6% 47% 68% 89%
Location Geocoded via Google Map Interaction
96 Double Click 19,850 21% 67% 88% 91%
97 Drag and Drop 17,055 27% 72% 91% 92%
Assigned manually during visual review / follow up
1 Full Address 1,057 27% 68% 87% 90%
2 Intersection 100% 3 Landmark 5 20% 40% 100% 80%
6 Address Range
7 Street Name 9 56% 89% 100% 100%
8 FSA 4 0% 75% 100% 0%
Unknown 7,247 25% 70% 89% 93%

A p p e n d i x F P a g e | 17
2016 TTS: Design and Conduct of the Survey Transportation Tomorrow Survey
4.6 Concordance for Different Study Geographies
Concordance was explored by municipality and planning district to determine whether there were any systematic differences in concordance by geography. Exhibit 11 illustrates average distances between the Google and LIO coordinates for all match types, while Exhibit 12 presents this for only the textual matches. Exhibit 13 details the distance and travel zone concordances by municipality/planning district.
Selected geographies were explored to determine potential reasons for higher averages . For example, it was found that the results for parts of Waterloo were influenced by a sizable number of locations being mapped to university campuses differently via Google than via LIO street segment, as illustrated in Exhibit 4 earlier in this report.
While there is some variance by planning district, there are only six planning districts for which more than 10% percent of samples fall in different traffic zones. All are small municipalities (Brock, East Garafraxa, Amaranth, Puslinch, Guelph/Eramosa), with the exception of PD 10 of Toronto.
Exhibit 11 - Average Difference in Distance per Planning District for all match types

A p p e n d i x F P a g e | 18
2016 TTS: Design and Conduct of the Survey Transportation Tomorrow Survey
Exhibit 12 - Average Difference in Distance per Planning District and per FSA – Textual Matches Only
Exhibit 13 - Concordance by Municipality / Planning District
Region Municipality / Planning District
Total number of cases
matching to LIO segments
Distance Concordance Traffic Zone Concordance
% within same traffic zone <=25 <=100 <=200
Barrie Barrie 4,570 29% 74% 93% 97%
Brant Brant 1,184 34% 72% 85% 98%
Brantford Brantford 3,051 34% 80% 95% 96%
Kawartha Lakes Kawartha Lakes 2,016 29% 70% 92% 98%
Dufferin Amaranth 90 57% 81% 93% 87%
Dufferin East Garafraxa 65 54% 95% 95% 88%
Dufferin East Luther Grand Valley 23 48% 70% 91% 100%
Dufferin Melancthon 50 50% 90% 90% 90%
Dufferin Mono Township 212 26% 71% 79% 94%
Dufferin Mulmur 54 48% 61% 76% 96%
Dufferin Shelburne 84 56% 90% 96% 99%
Durham Ajax 2,663 26% 74% 91% 97%
Durham Brock 240 71% 88% 93% 88%
Durham Clarington 2,080 39% 82% 95% 96%
Durham Oshawa 4,403 35% 73% 90% 99%
Durham Pickering 2,441 25% 71% 91% 97%
Durham Scugog 707 32% 75% 91% 93%
Durham Uxbridge 664 41% 76% 90% 95%
Durham Whitby 3,856 27% 71% 91% 98%
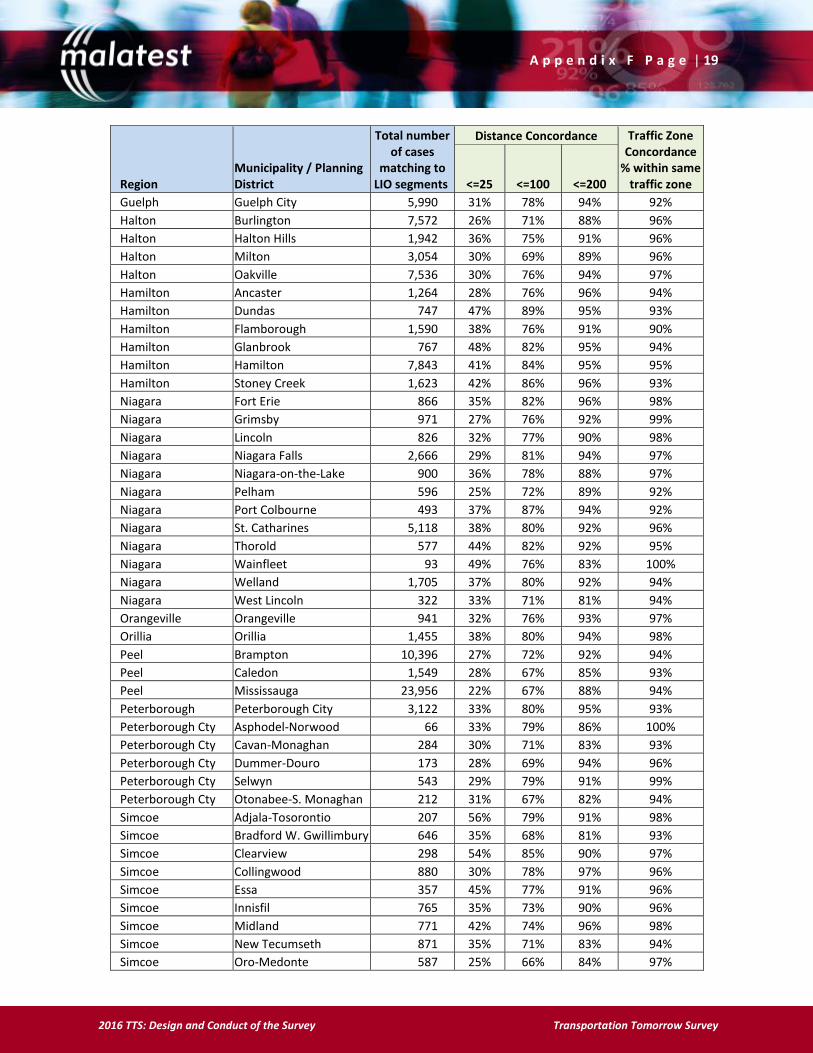
A p p e n d i x F P a g e | 19
2016 TTS: Design and Conduct of the Survey Transportation Tomorrow Survey
Region Municipality / Planning District
Total number of cases
matching to LIO segments
Distance Concordance Traffic Zone Concordance
% within same traffic zone <=25 <=100 <=200
Guelph Guelph City 5,990 31% 78% 94% 92%
Halton Burlington 7,572 26% 71% 88% 96%
Halton Halton Hills 1,942 36% 75% 91% 96%
Halton Milton 3,054 30% 69% 89% 96%
Halton Oakville 7,536 30% 76% 94% 97%
Hamilton Ancaster 1,264 28% 76% 96% 94%
Hamilton Dundas 747 47% 89% 95% 93%
Hamilton Flamborough 1,590 38% 76% 91% 90%
Hamilton Glanbrook 767 48% 82% 95% 94%
Hamilton Hamilton 7,843 41% 84% 95% 95%
Hamilton Stoney Creek 1,623 42% 86% 96% 93%
Niagara Fort Erie 866 35% 82% 96% 98%
Niagara Grimsby 971 27% 76% 92% 99%
Niagara Lincoln 826 32% 77% 90% 98%
Niagara Niagara Falls 2,666 29% 81% 94% 97%
Niagara Niagara-on-the-Lake 900 36% 78% 88% 97%
Niagara Pelham 596 25% 72% 89% 92%
Niagara Port Colbourne 493 37% 87% 94% 92%
Niagara St. Catharines 5,118 38% 80% 92% 96%
Niagara Thorold 577 44% 82% 92% 95%
Niagara Wainfleet 93 49% 76% 83% 100%
Niagara Welland 1,705 37% 80% 92% 94%
Niagara West Lincoln 322 33% 71% 81% 94%
Orangeville Orangeville 941 32% 76% 93% 97%
Orillia Orillia 1,455 38% 80% 94% 98%
Peel Brampton 10,396 27% 72% 92% 94%
Peel Caledon 1,549 28% 67% 85% 93%
Peel Mississauga 23,956 22% 67% 88% 94%
Peterborough Peterborough City 3,122 33% 80% 95% 93%
Peterborough Cty Asphodel-Norwood 66 33% 79% 86% 100%
Peterborough Cty Cavan-Monaghan 284 30% 71% 83% 93%
Peterborough Cty Dummer-Douro 173 28% 69% 94% 96%
Peterborough Cty Selwyn 543 29% 79% 91% 99%
Peterborough Cty Otonabee-S. Monaghan 212 31% 67% 82% 94%
Simcoe Adjala-Tosorontio 207 56% 79% 91% 98%
Simcoe Bradford W. Gwillimbury 646 35% 68% 81% 93%
Simcoe Clearview 298 54% 85% 90% 97%
Simcoe Collingwood 880 30% 78% 97% 96%
Simcoe Essa 357 45% 77% 91% 96%
Simcoe Innisfil 765 35% 73% 90% 96%
Simcoe Midland 771 42% 74% 96% 98%
Simcoe New Tecumseth 871 35% 71% 83% 94%
Simcoe Oro-Medonte 587 25% 66% 84% 97%

A p p e n d i x F P a g e | 20
2016 TTS: Design and Conduct of the Survey Transportation Tomorrow Survey
Region Municipality / Planning District
Total number of cases
matching to LIO segments
Distance Concordance Traffic Zone Concordance
% within same traffic zone <=25 <=100 <=200
Simcoe Penetangushene 276 35% 79% 89% 99%
Simcoe Ramara 220 24% 66% 76% 100%
Simcoe Severn 312 26% 57% 76% 95%
Simcoe Springwater 249 35% 76% 88% 96%
Simcoe Tay 180 34% 76% 88% 99%
Simcoe Tiny 225 28% 69% 79% 99%
Simcoe Wasaga Beach 559 30% 73% 93% 97%
Toronto PD 1 of Toronto 27,442 42% 93% 99% 93%
Toronto PD 10 of Toronto 3,338 22% 67% 90% 87%
Toronto PD 11 of Toronto 7,038 27% 83% 96% 93%
Toronto PD 12 of Toronto 3,230 23% 72% 94% 97%
Toronto PD 13 of Toronto 6,411 27% 73% 92% 95%
Toronto PD 14 of Toronto 1,577 45% 90% 97% 95%
Toronto PD 15 of Toronto 1,716 34% 79% 93% 96%
Toronto PD 16 of Toronto 6,202 23% 72% 93% 94%
Toronto PD 2 of Toronto 7,647 63% 94% 99% 97%
Toronto PD 3 of Toronto 5,399 46% 85% 95% 91%
Toronto PD 4 of Toronto 10,125 48% 88% 95% 95%
Toronto PD 5 of Toronto 4,683 21% 78% 93% 96%
Toronto PD 6 of Toronto 7,613 65% 95% 99% 97%
Toronto PD 7 of Toronto 2,230 43% 87% 98% 94%
Toronto PD 8 of Toronto 7,209 32% 77% 93% 95%
Toronto PD 9 of Toronto 2,308 20% 69% 87% 96%
Waterloo Cambridge 4,512 30% 72% 87% 93%
Waterloo Kitchener 9,017 30% 77% 94% 93%
Waterloo North Dumfries 338 22% 62% 85% 92%
Waterloo Waterloo 5,779 24% 74% 94% 91%
Waterloo Wellesley 259 35% 73% 88% 98%
Waterloo Wilmot 627 30% 77% 92% 93%
Waterloo Woolwich 1,069 35% 80% 93% 97%
Wellington Centre Wellington 937 36% 76% 92% 95%
Wellington Erin 373 50% 82% 95% 91%
Wellington Guelph/Eramosa 570 39% 71% 92% 78%
Wellington Puslinch 277 47% 73% 85% 84%
York Aurora 1,943 30% 76% 94% 95%
York East Gwillimbury 722 28% 69% 89% 95%
York Georgina 904 33% 78% 93% 94%
York King 659 24% 69% 85% 94%
York Markham 13,344 29% 72% 92% 95%
York Newmarket 2,839 30% 76% 94% 93%
York Richmond Hill 6,607 24% 69% 91% 94%
York Vaughan 9,225 28% 73% 92% 94%
York Whitchurch-Stouffville 1,276 30% 76% 90% 97%

A p p e n d i x F P a g e | 21
2016 TTS: Design and Conduct of the Survey Transportation Tomorrow Survey
5 Recommendations
Based on the high degree of concordance between Google-based coordinates and corresponding LIO-based coordinates, Malatest recommends the use the Google coordinates from online surveys completed via CallWeb ‘as-is’ in the final data file along with the LIO-derived coordinates from DDE. We do not recommend further post-processing of either the CallWeb or DDE data.
There does not appear to be a need to translate the Google coordinates to LIO-based coordinates or apply systemic corrections. In fact, in many cases the Google coordinates are more precise than those derived via the LIO-based interpolation method. Google appears to have more street segments with civic number information, often has rooftop-precision coding, and allows user interaction with maps to refine locations.
Similarly, the high degree of concordance both in terms of the proximity of the coordinates determined by each method and in terms of traffic analysis zone coding suggests that it is not necessary to translate locations that were captured in DDE and assigned coordinates via the LIO interpolation method into Google-based coordinates to improve their accuracy.
The occasional differences between Google- and LIO-based coordinates do not appear to be widespread enough to have a major impact on most forms of data analysis. It may be noted that some differences might be apparent in the case of microanalysis that look at specific areas containing university campuses or industrial sites – nevertheless, it appears that in most cases the Google-based coordinates are more precise representations of where people travelled.