design and experimental testing of metamaterial …
TRANSCRIPT
DESIGN AND EXPERIMENTAL TESTING OF
METAMATERIAL-BASED AGITATORS
__________________________________________________________
A Thesis
Presented to
the Faculty of the Graduate School
at the University of Missouri-Columbia
____________________________________________________________
In Fulfillment
of the Requirements for the Degree
Master of Science
____________________________________________________________
by
Keyu Zhou
Dr. Guoliang Huang, Thesis Supervisor
December 2016
The undersigned, appointed by the dean of the Graduate School, have examined the thesis
entitled
DESIGN AND EXPERIMENTAL TESTING OF
METAMATERIAL-BASED AGITATORS
presented by Keyu Zhou,
a candidate for the degree of Master of Science,
and hereby certify that, in their opinion, it is worthy of acceptance.
______________________________________________
Dr. Guoliang Huang
______________________________________________
Dr. Chung-Lung Chen
______________________________________________
Dr. Jae W. Kwon
ii
ACKNOWLEDGEMENTS
I would first like to thank my advisor Dr. Guoliang Huang for his valuable guidance,
patience, motivation, enthusiasm, and immense knowledge. Without his guidance and
persistent help, this thesis would not have been possible. I would also like to thank my
other panel professors, Dr. Chung-Lung Chen and Dr. Jae W. Kwon for their support.
My sincere thanks also go to the participants in this project. Every result described in this
thesis was accomplished with their help and support. They provided a friendly and
cooperative atmosphere at work and also useful feedback on my work. Particularly, I would
like to thank Yangyang Chen and Zheng Li for their computer simulation results.
I would like to thank my fellow labmates, who have supported me throughout the entire
process, both by keeping me harmonious and helping me putting pieces together. I am
grateful to Miles V. Barnhart and Xiaoxu Zhang for their valuable comments and help in
my thesis writing. I am indebted to my friend Xianchen Xu who deserves the credit for
introducing me to the project as well for the support on the way.
Finally, I must express my very profound gratitude to my parents for providing me with
unfailing support and continuous encouragement throughout my years of study. You are
always there for me.

iii
TABLE OF CONTENTS
ACKNOWLEDGEMENTS ................................................................................................ ii
LIST OF FIGURES ............................................................................................................ v
ABSTRACT ....................................................................................................................... vi
Chapter 1. INTRODUCTION ........................................................................................ 1
Chapter 2. EXPERIMENTAL SETUP ........................................................................... 6
Chapter 3. DATA MEASUREMENT AND PROCESSING METHOD ..................... 10
3.1 Measuring Flow Rate through the Heat Sinks ........................................................ 10
3.2 Measuring Pressure Drop across the Heat Sinks .................................................... 11
3.3 Measuring Temperatures across the Heat Sinks ..................................................... 11
3.4 Measuring the Heat Supplied to the Heat Sinks ..................................................... 12
3.5 Data Processing Method ......................................................................................... 13
Chapter 4. STRUCTURE MODIFICATION AND DATA ANALYSIS .................... 15
4.1 Basic Structure of an Agitator ................................................................................. 15
4.2 Fluttering Mode ...................................................................................................... 19
4.3 Rectangular-wing Agitator...................................................................................... 21
4.3.1 Single-rectangular-wing Agitator .................................................................... 21
4.3.2 Double-rectangular-wing Agitator ................................................................... 23
4.4 Fishtail-wing Agitator ............................................................................................. 25

iv
4.4.1 Types of Fishtails ............................................................................................. 25
4.4.2 Size Effect ........................................................................................................ 28
Chapter 5. RESULTS ................................................................................................... 30
Chapter 6. CONCLUSION ........................................................................................... 33
APPENDIX A: GEOMETRY OF THE HEAT SINK ...................................................... 34
APPENDIX B: CALIBRATION CURVES FOR PRESSURE MEASUREMENT ........ 35
REFERENCES ................................................................................................................. 37

v
LIST OF FIGURES
Fig. 1.1 Dry Cooling Systems ......................................................................................................................... 2 Fig. 1.2 Cost-per-unit as a Function of Both the Style of Heat Removal System and the Thermal Resistance
......................................................................................................................................................................... 3 Fig. 1.3 Vortices Generated by the Wing ........................................................................................................ 4 Fig. 1.4 Vortices Damping in the Channel ...................................................................................................... 5 Fig. 2.1 Overview of the Experimental Setup ................................................................................................. 6 Fig. 2.2 An Agitator Set on the Baseplate ....................................................................................................... 8 Fig. 2.3 Agitators Installed in the Heat Sink ................................................................................................... 8 Fig. 2.4 Data Acquisition Modules ................................................................................................................. 9 Fig. 3.1 Top View of the Test Duct ............................................................................................................... 11 Fig. 3.2 Side View of the Test Duct .............................................................................................................. 12 Fig. 3.3 Rejected Heat per Unit Area and Pressure Drop at Different Flow Velocities for Clean Heat Sinks
....................................................................................................................................................................... 13 Fig. 3.4 Rejected Heat per Unit Area as a Function of Pumping Power per Unit Area for Clean Heat Sinks
....................................................................................................................................................................... 14 Fig. 4.1 The Schematic of an Agitator .......................................................................................................... 15 Fig. 4.2 Rectangular Wing of the Agitator .................................................................................................... 16 Fig. 4.3 The Bushing of the Agitator ............................................................................................................. 17 Fig. 4.4 The Shaft of the Agitator ................................................................................................................. 17 Fig. 4.5 The Beam of the Agitator................................................................................................................. 19 Fig. 4.6 The Strut of the Agitator .................................................................................................................. 19 Fig. 4.7 Motion of an Agitator Fluttering at (a) Laminar Flow (b) Turbulent Flow ..................................... 21 Fig. 4.8 Single- rectangular-wing Agitator .................................................................................................... 22 Fig. 4.9 Rejected Heat per Unit Area and Pressure Drop at Different Flow Velocities for Single-rectangular-
wing Agitator................................................................................................................................................. 22 Fig. 4.10 Rejected Heat per Unit Area as a Function of Pumping Power per Unit Area for Single-rectangular-
wing Agitator................................................................................................................................................. 23 Fig. 4.11 Double-rectangular-wing Agitator ................................................................................................. 24 Fig. 4.12 Rejected Heat Per Unit Area and Pressure Drop at Different Flow Velocities for Double-
rectangular-wing Agitator ............................................................................................................................. 24 Fig. 4.13 Rejected Heat per Unit Area as a Function of Pumping Power per Unit Area for Double-rectangular-
wing Agitator................................................................................................................................................. 25 Fig. 4.14 Fishtails and the Corresponding Wing Design ............................................................................... 26 Fig. 4.15 Two Types of Double-fishtail-wing Agitators ............................................................................... 26 Fig. 4.16 Rejected Heat per Unit Area and Pressure Drop at Different Flow Velocities for Two Types of
Double-fishtail-wing Agitator ....................................................................................................................... 27 Fig. 4.17 Rejected Heat per Unit Area as a Function of Pumping Power per Unit Area for Two Types of
Double-fishtail-wing Agitator ....................................................................................................................... 28 Fig. 4.18 Rejected Heat per Unit Area and Pressure Drop at Different Flow Velocities for Different Sizes of
Double-fishtail#1-wing Agitator ................................................................................................................... 28 Fig. 4.19 Rejected Heat per Unit Area as a Function of Pumping Power per Unit Area for Different Sizes of
Double-fishtail#1-wing Agitator ................................................................................................................... 29 Fig. 5.1 Rejected Heat Per Unit Area and Pressure Drop at Different Flow Velocities in Each Configuration
....................................................................................................................................................................... 30 Fig. 5.2 Rejected Heat per Unit Area as a Function of Pumping Power per Unit Area in Each Configuration
....................................................................................................................................................................... 31
vi
ABSTRACT
Due to the low heat rejection capacity or huge water consumption of traditional cooling
methods, many power plants are looking for a way that is eco-friendly and high efficient
but low-cost to retrofit their current cooling system. This study aims to explore innovative
solutions to enhance heat transfer efficiency based on current dry cooling systems. Several
metamaterial-based agitators were assembled with a commercial extruded heat sink where
experimental testing was conducted to investigate the validity of the modified
configuration. Vortex-induced vibrations (VIV) of structures have attracted much attention
these years due to its application in many engineering disciplines. Taking advantage of this
phenomena, these agitators are expected to mimic the motion of fish swimming and agitate
the flow in channels of the heat sink, which will mix the cool air and hot air. Instead of the
cylinder widely used in VIV study, the wing of the agitator has a streamlined cross-section
to reduce air drag while shedding vortices. The heat transfer efficiency is expected to
increase with a low-pressure penalty utilizing this method. This study compared the heat
rejection and the incurred pressure loss of agitators with different shapes, sizes, and
numbers of wings. The study presented several types of heat sink/agitator configuration
that exhibit a significant increase in heat transfer performance compared to the unmodified
commercial heat sink. Hence, the metamaterial-based agitator proves to be an effective
solution for increasing heat rejection capability of a heat sink.

1
CHAPTER 1. INTRODUCTION
For most pulverized coal-fired power plants, over 90% of water demand is drawn for
cooling. Power plant cooling technologies generally include three different types: once-
through systems, wet-recirculating systems, and dry cooling systems. Once-through
systems withdraw water from nearby natural water sources (such as a lake, river, ocean, or
manmade reservoir). The water is pumped through the tubes of a steam condenser where
it is warmed about 10–30°F (8–17°C), after which it is returned to the original source. New
power plants are trying to avoid using once-through cooling since the disruptions such
systems cause to local ecosystems from the significant water withdrawals involved. Wet-
recirculating cooling is similar to once-through systems in that cold water flows through
the tubes of a steam condenser and the steam condenses on the outside of the tubes.
However, instead of being returned to the source, the heated water leaving the condenser
is pumped to a cooling tower where it is cooled by evaporation of a small portion of the
water. The cooled water is then recirculated back to the condenser tube inlets. Despite
having much lower water withdrawals due to the cooling water reusing in the second cycle,
wet-recirculating systems still tend to have appreciably high water consumption. Of all
three types of cooling systems, dry cooling systems consume the least water, using air
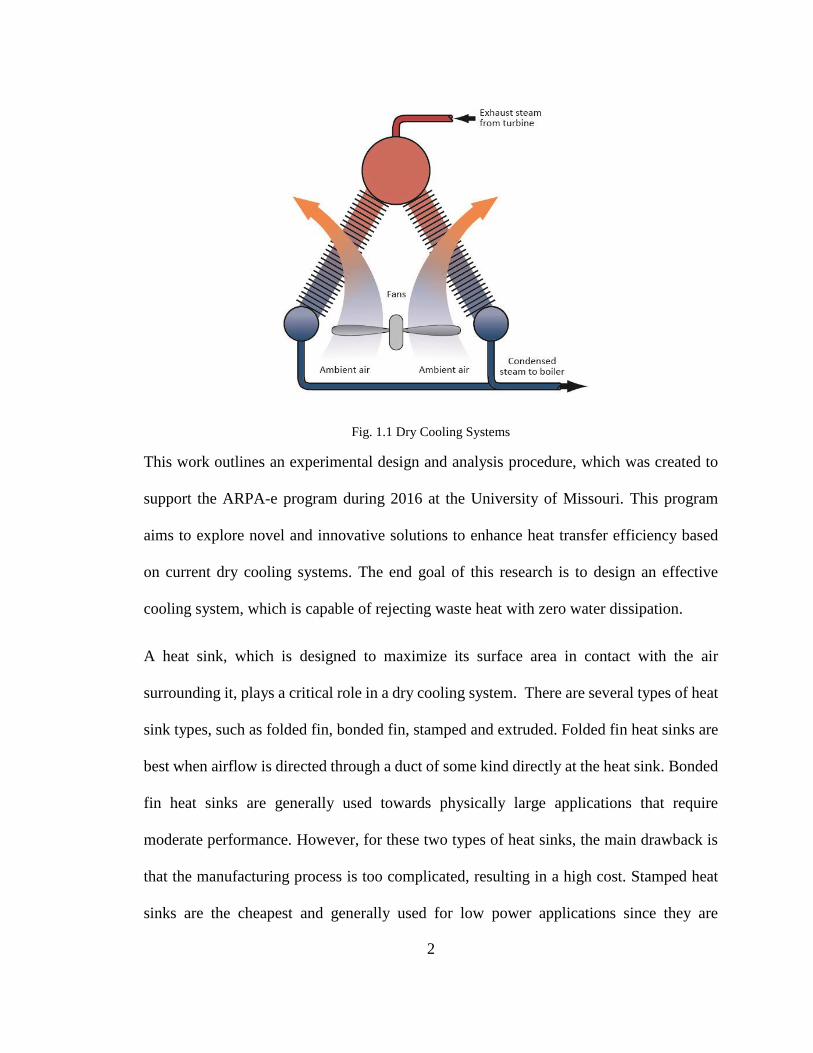
instead of water to cool the steam. The schematic of the dry cooling systems is shown in
Figure 1.1[1]. However, the tradeoffs to these water savings are much higher costs and lower
efficiencies. For these reasons, finding a way to increase heat rejection capability of dry
cooling systems could be a good option for power plants to solve the environmental impact
issues.
2
Fig. 1.1 Dry Cooling Systems
This work outlines an experimental design and analysis procedure, which was created to
support the ARPA-e program during 2016 at the University of Missouri. This program
aims to explore novel and innovative solutions to enhance heat transfer efficiency based
on current dry cooling systems. The end goal of this research is to design an effective
cooling system, which is capable of rejecting waste heat with zero water dissipation.
A heat sink, which is designed to maximize its surface area in contact with the air
surrounding it, plays a critical role in a dry cooling system. There are several types of heat
sink types, such as folded fin, bonded fin, stamped and extruded. Folded fin heat sinks are
best when airflow is directed through a duct of some kind directly at the heat sink. Bonded
fin heat sinks are generally used towards physically large applications that require
moderate performance. However, for these two types of heat sinks, the main drawback is
that the manufacturing process is too complicated, resulting in a high cost. Stamped heat
sinks are the cheapest and generally used for low power applications since they are
3
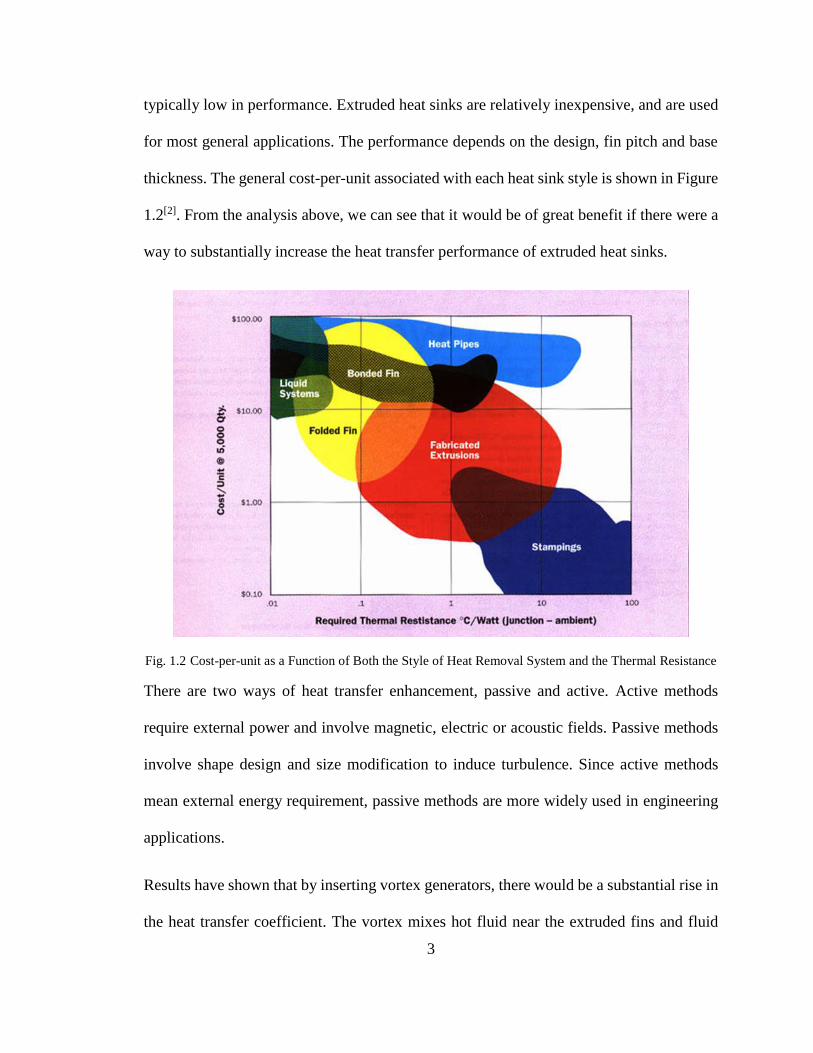
typically low in performance. Extruded heat sinks are relatively inexpensive, and are used
for most general applications. The performance depends on the design, fin pitch and base
thickness. The general cost-per-unit associated with each heat sink style is shown in Figure
1.2[2]. From the analysis above, we can see that it would be of great benefit if there were a
way to substantially increase the heat transfer performance of extruded heat sinks.
Fig. 1.2 Cost-per-unit as a Function of Both the Style of Heat Removal System and the Thermal Resistance
There are two ways of heat transfer enhancement, passive and active. Active methods
require external power and involve magnetic, electric or acoustic fields. Passive methods
involve shape design and size modification to induce turbulence. Since active methods
mean external energy requirement, passive methods are more widely used in engineering
applications.
Results have shown that by inserting vortex generators, there would be a substantial rise in
the heat transfer coefficient. The vortex mixes hot fluid near the extruded fins and fluid
4
further away, which can enhance the convective heat transfer significantly. However, this
will increase the pressure drop across the heat sink, which leads to higher pumping power
requirements. Therefore, it would be of great benefit if there were a way to decrease the
pressure loss while increasing the heat transfer efficiency.
Vortex-induced vibrations (VIV) of structures have attracted much attention these years
due to its application in several engineering disciplines such as the design of bridges,
aircraft control surfaces, and pipelines. Vortex-induced vibrations (VIV) are motions
induced on bodies facing an external flow by periodical irregularities on this flow. When a
fluid flow past a bluff body, such as a circular cylinder, there will be a periodic shedding
of vortices into the body’s wake for all but the lowest flow speeds. This will give rise to
oscillatory lift and drag forces, which result in Vortex-Induced Vibrations (VIV).
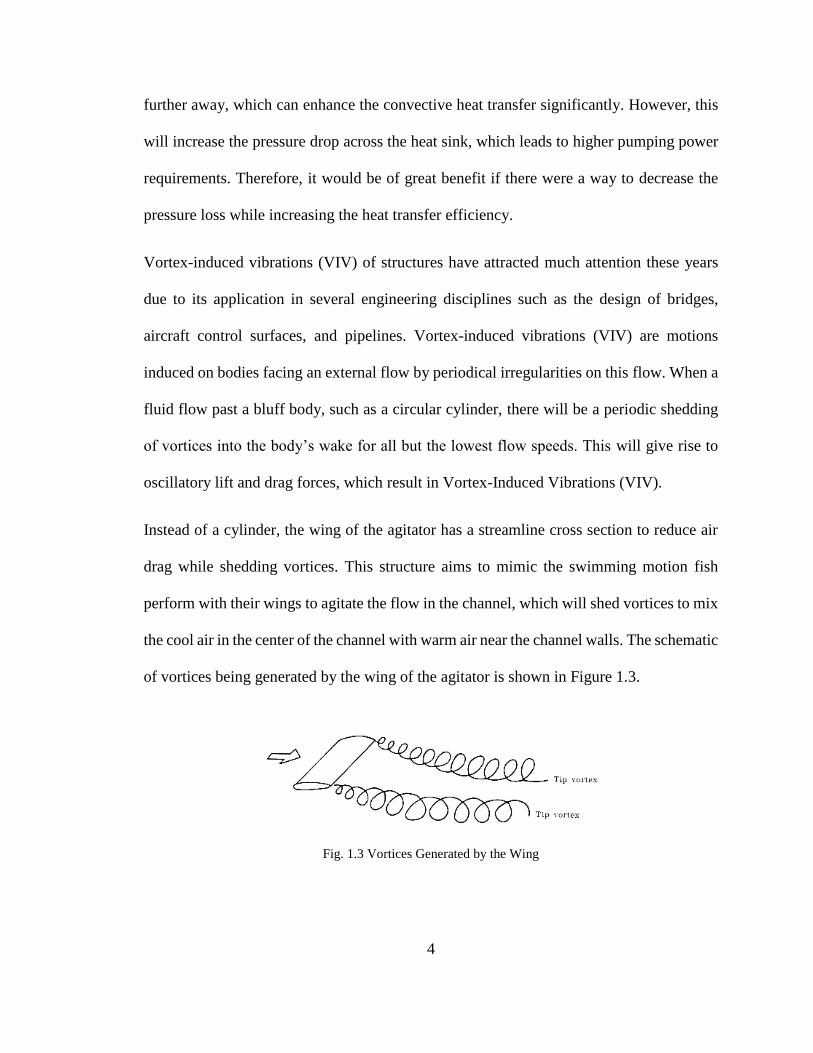
Instead of a cylinder, the wing of the agitator has a streamline cross section to reduce air
drag while shedding vortices. This structure aims to mimic the swimming motion fish
perform with their wings to agitate the flow in the channel, which will shed vortices to mix
the cool air in the center of the channel with warm air near the channel walls. The schematic
of vortices being generated by the wing of the agitator is shown in Figure 1.3.
Fig. 1.3 Vortices Generated by the Wing

5
It provides a possible way to enhance heat transfer efficiency with a low-pressure loss
penalty. This method has been proved effective numerically. The top view of vortices in
the channel in the simulation is shown in Figure 1.4. This study utilizes an experimental
testbed to characterize the behavior of the heat sink with several different types of agitators
installed, trying to find the best configuration based on heat transfer performance, service
lifetime, manufacturing process and cost.
Fig. 1.4 Vortices Damping in the Channel
6
CHAPTER 2. EXPERIMENTAL SETUP
An experimental test bed was constructed to simulate a heat-exchanging environment. A
data acquisition (DAQ) system was developed to collect all the readings. Various heat
sink/agitator configurations could be tested accurately and consistently with this
experimental setup.
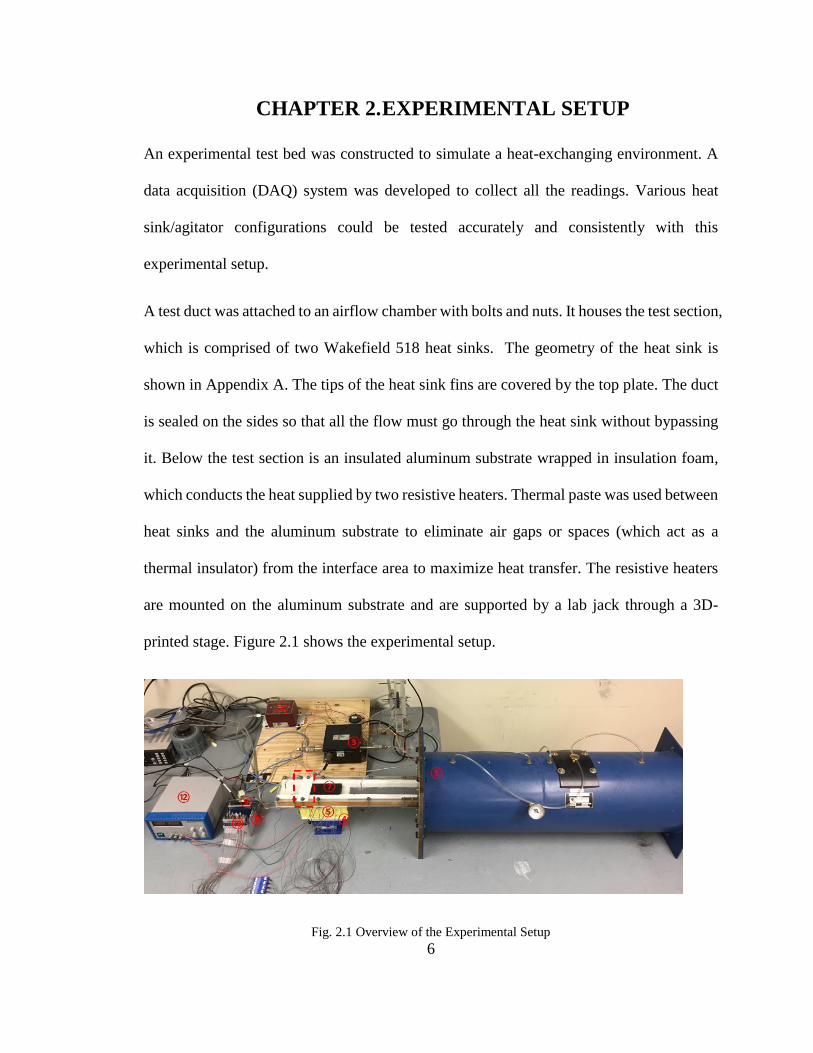
A test duct was attached to an airflow chamber with bolts and nuts. It houses the test section,
which is comprised of two Wakefield 518 heat sinks. The geometry of the heat sink is
shown in Appendix A. The tips of the heat sink fins are covered by the top plate. The duct
is sealed on the sides so that all the flow must go through the heat sink without bypassing
it. Below the test section is an insulated aluminum substrate wrapped in insulation foam,
which conducts the heat supplied by two resistive heaters. Thermal paste was used between
heat sinks and the aluminum substrate to eliminate air gaps or spaces (which act as a
thermal insulator) from the interface area to maximize heat transfer. The resistive heaters
are mounted on the aluminum substrate and are supported by a lab jack through a 3D-
printed stage. Figure 2.1 shows the experimental setup.
Fig. 2.1 Overview of the Experimental Setup

7
The hardware components used in the experiment are listed below (the corresponding
number is marked in Figure 2.1):
1. A 150 CFM airflow chamber (AMCA 210 – 99, Airflow Measurement Systems).
2. An MKS Baratron 698A-T11 differential pressure transducer (MKS Instruments).
3. An MKS 220DD – 00020 Baratron differential pressure transducer (MKS
Instruments).
4. Two resistive heaters (LPS 300, Vishay Americas).
5. An aluminum Substrate (2024 Al, McMaster – Carr).
6. Sixteen T-Type thermocouples (5TC-GG-T-30-36, Omega Engineering).
7. Two Wakefield 518-95AB heat sinks (Wakefield-Vette).
8. A 4-slot Ethernet chassis (NI cDAQ-9184, National Instruments).
9. A 16 channel, 16 bit analog voltage input module (NI 9205, National Instruments).
10. A 16 channel thermocouple input module (NI 9213, National Instruments).
11. A 300 V, 13 A AC power supply for the flow bench (Agilent 6813B, Keysight
Technologies).
12. A 20 V, 10 A DC power supply for the resistive heaters (B&K Precision 1667,
B&K Precision).
13. A High-Speed Camera (Phantom Miro M310, Vision Research)

8
The white plate marked in the red box in Figure 2.1 is the baseplate for agitators. It
guaranteed that each agitator stays at the center of the channel. A close look at an agitator
set on the baseplate is shown in Figure 2.2. Since there are seven channels in a heat sink,
the same number of agitators were embedded on the baseplate. The geometry of the agitator
will be illustrated in chapter 4.
Fig. 2.2 An Agitator Set on the Baseplate
Figure 2.3 shows the position relationship between the agitator set and the heat sink.
Fig. 2.3 Agitators Installed in the Heat Sink
9
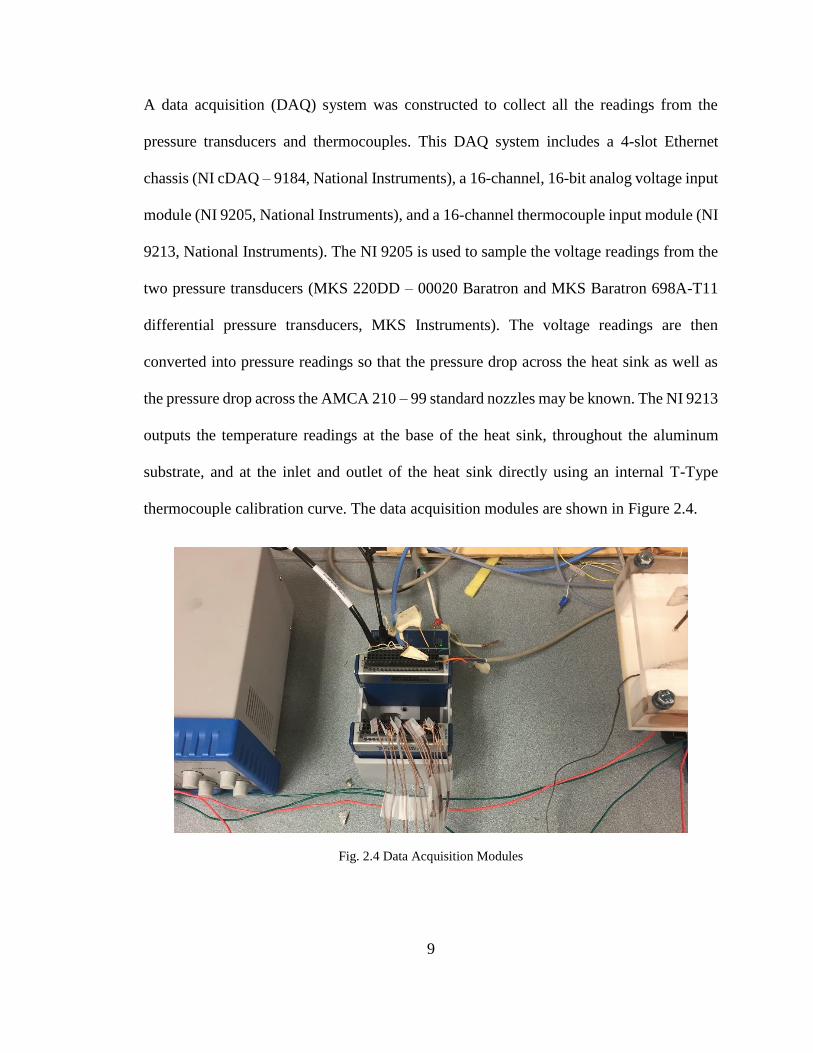
A data acquisition (DAQ) system was constructed to collect all the readings from the
pressure transducers and thermocouples. This DAQ system includes a 4-slot Ethernet
chassis (NI cDAQ – 9184, National Instruments), a 16-channel, 16-bit analog voltage input
module (NI 9205, National Instruments), and a 16-channel thermocouple input module (NI
9213, National Instruments). The NI 9205 is used to sample the voltage readings from the
two pressure transducers (MKS 220DD – 00020 Baratron and MKS Baratron 698A-T11
differential pressure transducers, MKS Instruments). The voltage readings are then
converted into pressure readings so that the pressure drop across the heat sink as well as
the pressure drop across the AMCA 210 – 99 standard nozzles may be known. The NI 9213
outputs the temperature readings at the base of the heat sink, throughout the aluminum
substrate, and at the inlet and outlet of the heat sink directly using an internal T-Type
thermocouple calibration curve. The data acquisition modules are shown in Figure 2.4.
Fig. 2.4 Data Acquisition Modules

10
CHAPTER 3. DATA MEASUREMENT AND
PROCESSING METHOD
For each experiment, the power being supplied to the resistive heaters was tuned
accordingly so that the steady state temperature difference between the inlet and the heat
sink was maintained at 10 ℃. Once this condition was met, the data was collected for at
least a minute. All temperatures and pressures used in the calculations are averaged values
from this dataset. Numerous variables, including pressure drop, flow velocity, the
temperature of the heat sink, and heat supplied to the heat sink were measured using a
number of instruments. The processes and hardware used to determine each of these
variables are outlined in the following sections.
3.1 Measuring Flow Rate through the Heat Sinks
The flow rate through the heat sinks is measured by a differential pressure transducer
connected with the flow bench. The flow bench used is a 150 CFM airflow test chamber
designed to AMCA 210 – 99 standards [3]. The differential pressure transducer is an MKS
Baratron 220DD, with a sensing range of 0 – 30 torr (or approximately 0 – 3999 Pa) [4].
Instead of converting the raw readings into pressure in Pascals directly, the DAQ VI
outputs the pressure in inches of water first for this pressure transducer. This is because a
flow rate conversion sheet provided by FHA, Inc. is used, which requires a pressure
differential across the flow bench nozzle in inches of water. Then the conversion sheet
outputs the flow rate in CFM. Since the volumetric flow rate is constant anywhere in the
duct, the flow rate can be converted into a mean flow velocity through the channels of the
heat sinks. The calibration curve used for this pressure transducer is shown in Appendix B.

11
3.2 Measuring Pressure Drop across the Heat Sinks
The pressure drop across the heat sink is measured by a differential pressure transducer,
which quantifies the penalty of different modifications. There are two pressure taps along
the upper surface of the duct; one is 5 cm upstream of the heat sinks, while the other is 7.5
cm downstream. The differential pressure transducer is an MKS Baratron 698A-T11, with
a sensing range of 0 – 10 torr (or approximately 0 – 1333 Pa) [5]. The DAQ VI collects raw
voltage readings from the pressure transducer and converts them into pressure readings in
Pascals. A calibration curve for the pressure transducer is illustrated in Appendix B. The
two pressure taps are marked in red boxes in Figure 3.1.
Fig. 3.1 Top View of the Test Duct
3.3 Measuring Temperatures across the Heat Sinks
The temperature across the heat sink is measured by eight thermocouples located along the
flow path. One inlet (𝑇𝑖𝑛) and one outlet (𝑇𝑜𝑢𝑡) thermocouple were installed to get the inlet
and outlet temperatures. The positions of two thermocouples are shown in Figure 3.1. For
12
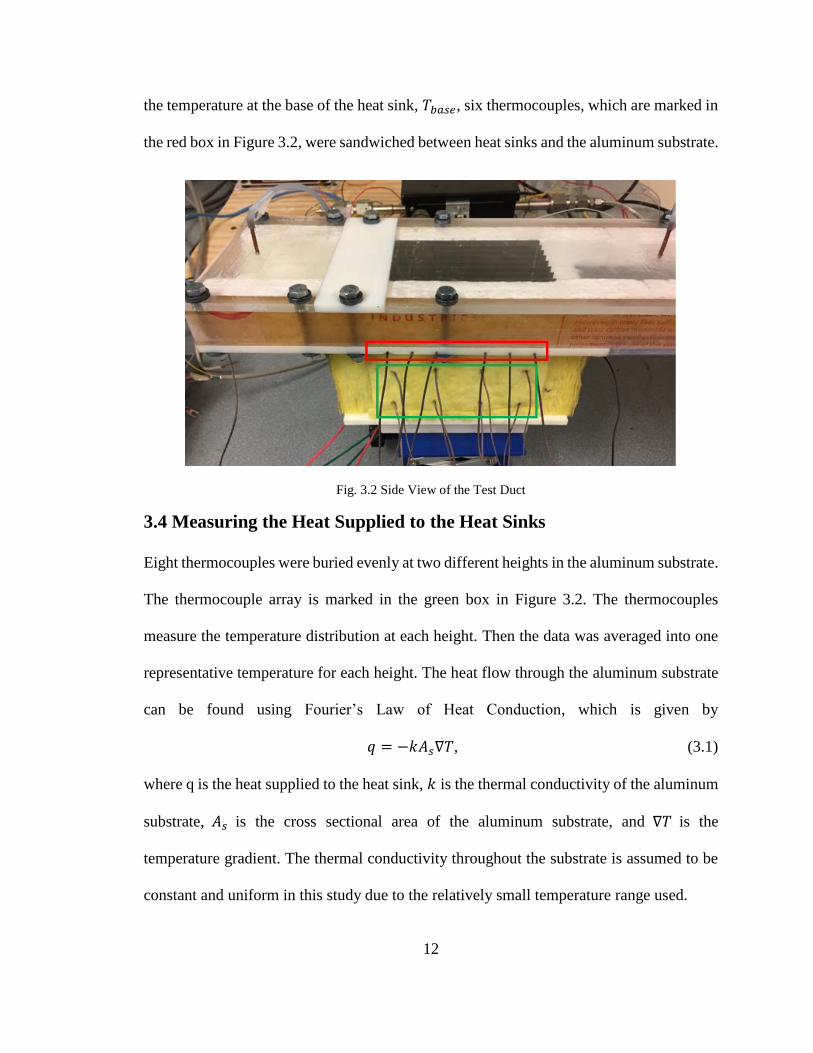
the temperature at the base of the heat sink, 𝑇𝑏𝑎𝑠𝑒, six thermocouples, which are marked in
the red box in Figure 3.2, were sandwiched between heat sinks and the aluminum substrate.
Fig. 3.2 Side View of the Test Duct
3.4 Measuring the Heat Supplied to the Heat Sinks
Eight thermocouples were buried evenly at two different heights in the aluminum substrate.
The thermocouple array is marked in the green box in Figure 3.2. The thermocouples
measure the temperature distribution at each height. Then the data was averaged into one
representative temperature for each height. The heat flow through the aluminum substrate
can be found using Fourier’s Law of Heat Conduction, which is given by
𝑞 = −𝑘𝐴𝑠∇𝑇, (3.1)
where q is the heat supplied to the heat sink, 𝑘 is the thermal conductivity of the aluminum
substrate, 𝐴𝑠 is the cross sectional area of the aluminum substrate, and ∇𝑇 is the
temperature gradient. The thermal conductivity throughout the substrate is assumed to be
constant and uniform in this study due to the relatively small temperature range used.
13
3.5 Data Processing Method
As mentioned before, while agitators can help reject more waste heat, they will also
increase the pressure loss across the heat sinks, which requires more pumping power. With
all the data above, rejected heat, pressure drop, and pumping power can be calculated.
To determine the performance of different heat sink/agitator configurations. It’s very
important to get a stable performance of the “clean” (unmodified) heat sinks. So that the
data of clean heat sinks could be used as a comparative baseline. A large set of tests were
run using the clean heat sinks to make sure the data is reliable.
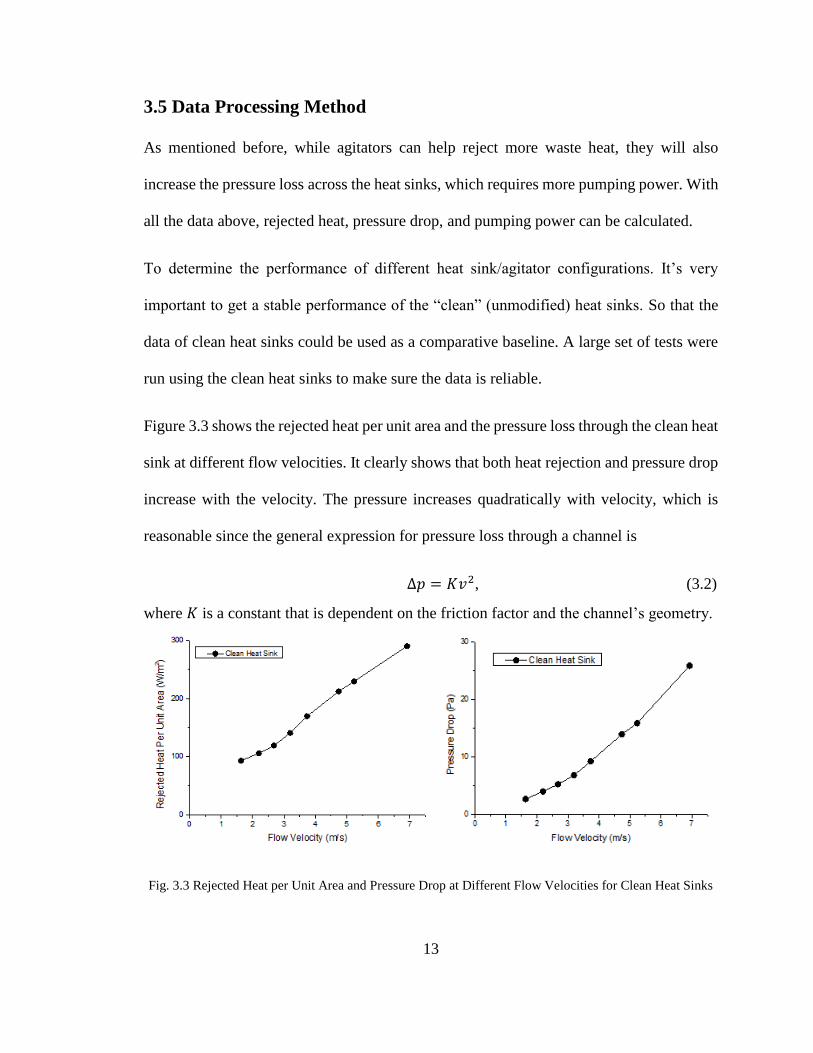
Figure 3.3 shows the rejected heat per unit area and the pressure loss through the clean heat
sink at different flow velocities. It clearly shows that both heat rejection and pressure drop
increase with the velocity. The pressure increases quadratically with velocity, which is
reasonable since the general expression for pressure loss through a channel is
Δ𝑝 = 𝐾𝑣2, (3.2)
where 𝐾 is a constant that is dependent on the friction factor and the channel’s geometry.
Fig. 3.3 Rejected Heat per Unit Area and Pressure Drop at Different Flow Velocities for Clean Heat Sinks
14
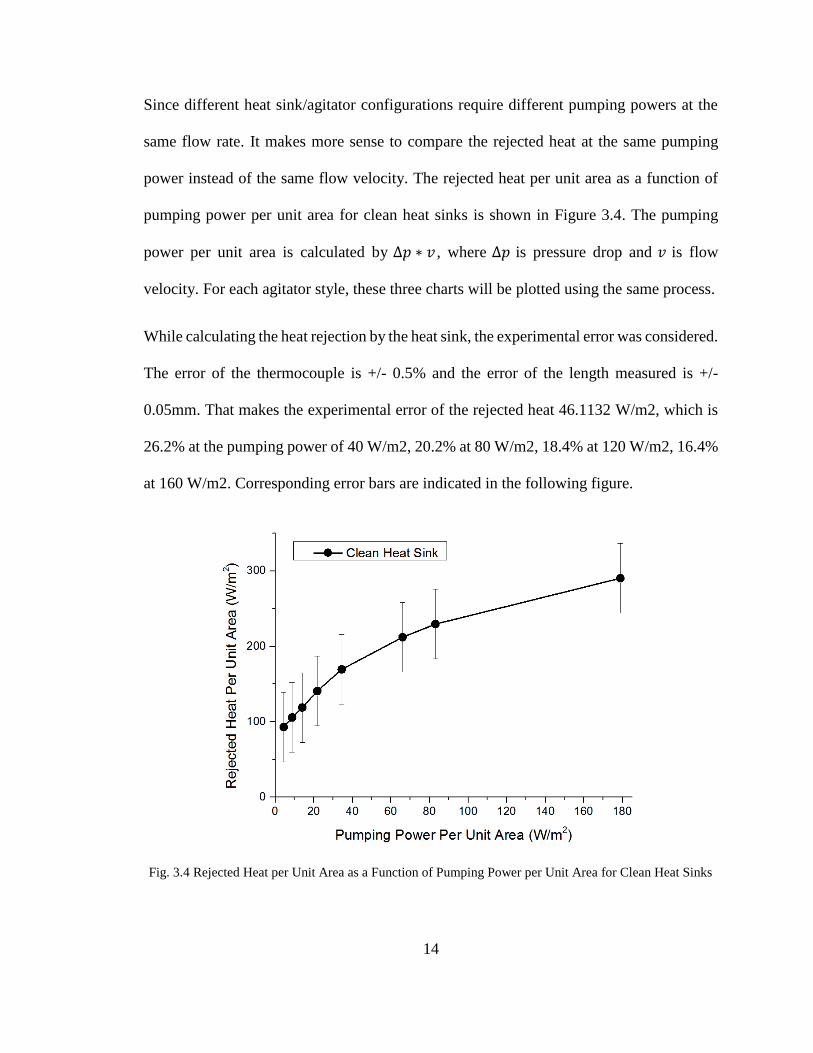
Since different heat sink/agitator configurations require different pumping powers at the
same flow rate. It makes more sense to compare the rejected heat at the same pumping
power instead of the same flow velocity. The rejected heat per unit area as a function of
pumping power per unit area for clean heat sinks is shown in Figure 3.4. The pumping
power per unit area is calculated by Δ𝑝 ∗ 𝑣 , where Δ𝑝 is pressure drop and 𝑣 is flow
velocity. For each agitator style, these three charts will be plotted using the same process.
While calculating the heat rejection by the heat sink, the experimental error was considered.
The error of the thermocouple is +/- 0.5% and the error of the length measured is +/-
0.05mm. That makes the experimental error of the rejected heat 46.1132 W/m2, which is
26.2% at the pumping power of 40 W/m2, 20.2% at 80 W/m2, 18.4% at 120 W/m2, 16.4%
at 160 W/m2. Corresponding error bars are indicated in the following figure.
Fig. 3.4 Rejected Heat per Unit Area as a Function of Pumping Power per Unit Area for Clean Heat Sinks
15
CHAPTER 4. STRUCTURE MODIFICATION AND DATA
ANALYSIS
With the baseline determined, the heat transfer enhancement by different types of agitators
could be determined. This chapter will talk about the modification of different types of
agitators and the corresponding heat transfer performance.
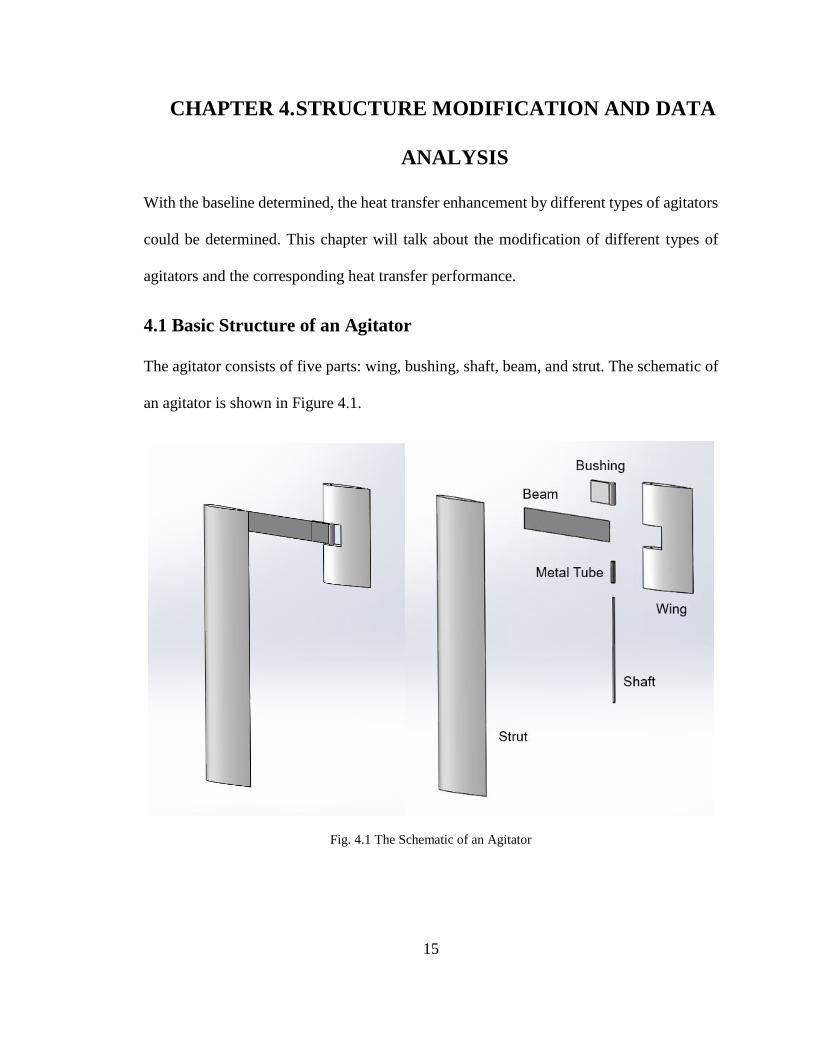
4.1 Basic Structure of an Agitator
The agitator consists of five parts: wing, bushing, shaft, beam, and strut. The schematic of
an agitator is shown in Figure 4.1.
Fig. 4.1 The Schematic of an Agitator

16
Wing
All wings in this study are 3D printed with a streamlined cross-section, which is designed
to shed vortices with low air drag penalty. A span study will be talked in details later. If
the span is too small, the accuracy of manufacture would be hard to control. If the span is
too big, the beam would twist drastically while the agitator fluttering. Therefore, the span
of the wing was first set to be 9mm after taking these factors into account. A notch with
the width of 2.2mm is at the center of one side of the wing. The notch is designed for the
bushing to be assembled with the wing. One type of the wing is shown in Figure 4.2 along
with the schematic.
Fig. 4.2 Rectangular Wing of the Agitator
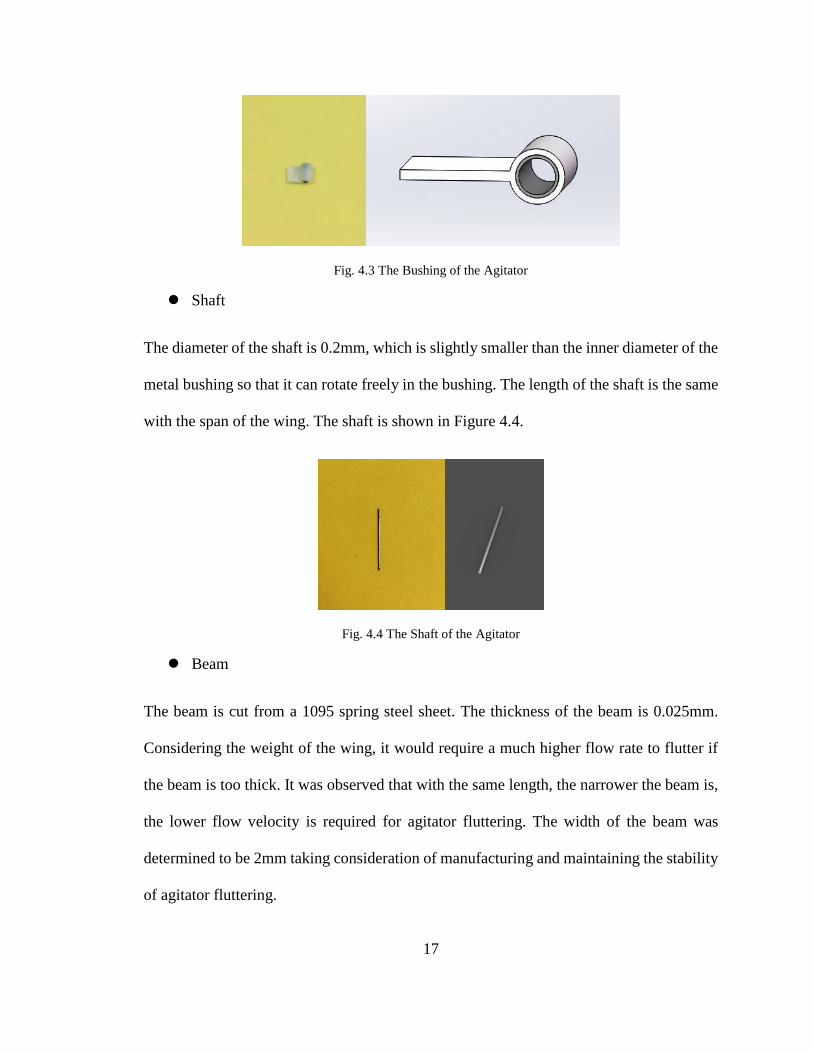
Bushing
Considering the appreciable abrasion between the bushing and the shaft, a metal tubing
with the inner diameter of 0.3mm is inserted into a 3D-printed bushing, which can be easily
glued with the metal beam. At the same time, the fraction between all the shafts and the
bushings will be consistent. Since the frequency of oscillation is from 45 to 65 Hz, the
service lifetime of this joint will be much longer as well. The bushing is shown in Figure
4.3 along with the schematic.
17
Fig. 4.3 The Bushing of the Agitator
Shaft
The diameter of the shaft is 0.2mm, which is slightly smaller than the inner diameter of the
metal bushing so that it can rotate freely in the bushing. The length of the shaft is the same
with the span of the wing. The shaft is shown in Figure 4.4.
Fig. 4.4 The Shaft of the Agitator
Beam
The beam is cut from a 1095 spring steel sheet. The thickness of the beam is 0.025mm.
Considering the weight of the wing, it would require a much higher flow rate to flutter if
the beam is too thick. It was observed that with the same length, the narrower the beam is,
the lower flow velocity is required for agitator fluttering. The width of the beam was
determined to be 2mm taking consideration of manufacturing and maintaining the stability
of agitator fluttering.
18
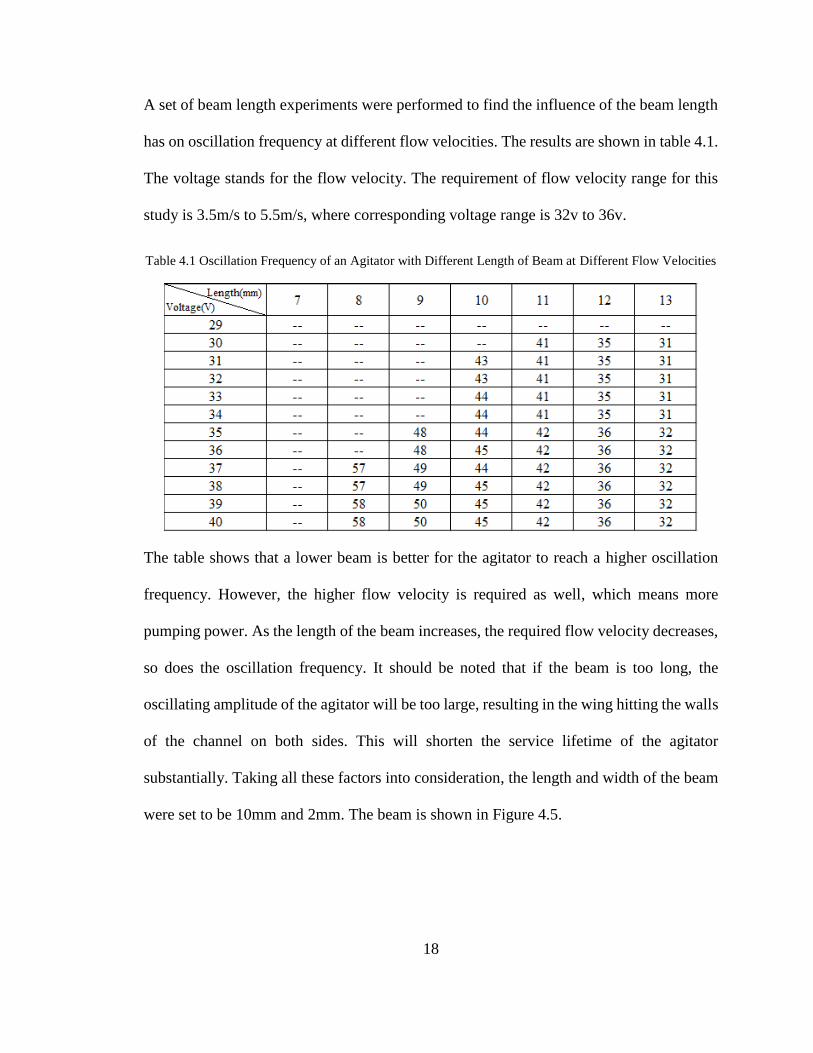
A set of beam length experiments were performed to find the influence of the beam length
has on oscillation frequency at different flow velocities. The results are shown in table 4.1.
The voltage stands for the flow velocity. The requirement of flow velocity range for this
study is 3.5m/s to 5.5m/s, where corresponding voltage range is 32v to 36v.
Table 4.1 Oscillation Frequency of an Agitator with Different Length of Beam at Different Flow Velocities
The table shows that a lower beam is better for the agitator to reach a higher oscillation
frequency. However, the higher flow velocity is required as well, which means more
pumping power. As the length of the beam increases, the required flow velocity decreases,
so does the oscillation frequency. It should be noted that if the beam is too long, the
oscillating amplitude of the agitator will be too large, resulting in the wing hitting the walls
of the channel on both sides. This will shorten the service lifetime of the agitator
substantially. Taking all these factors into consideration, the length and width of the beam
were set to be 10mm and 2mm. The beam is shown in Figure 4.5.
19
Fig. 4.5 The Beam of the Agitator
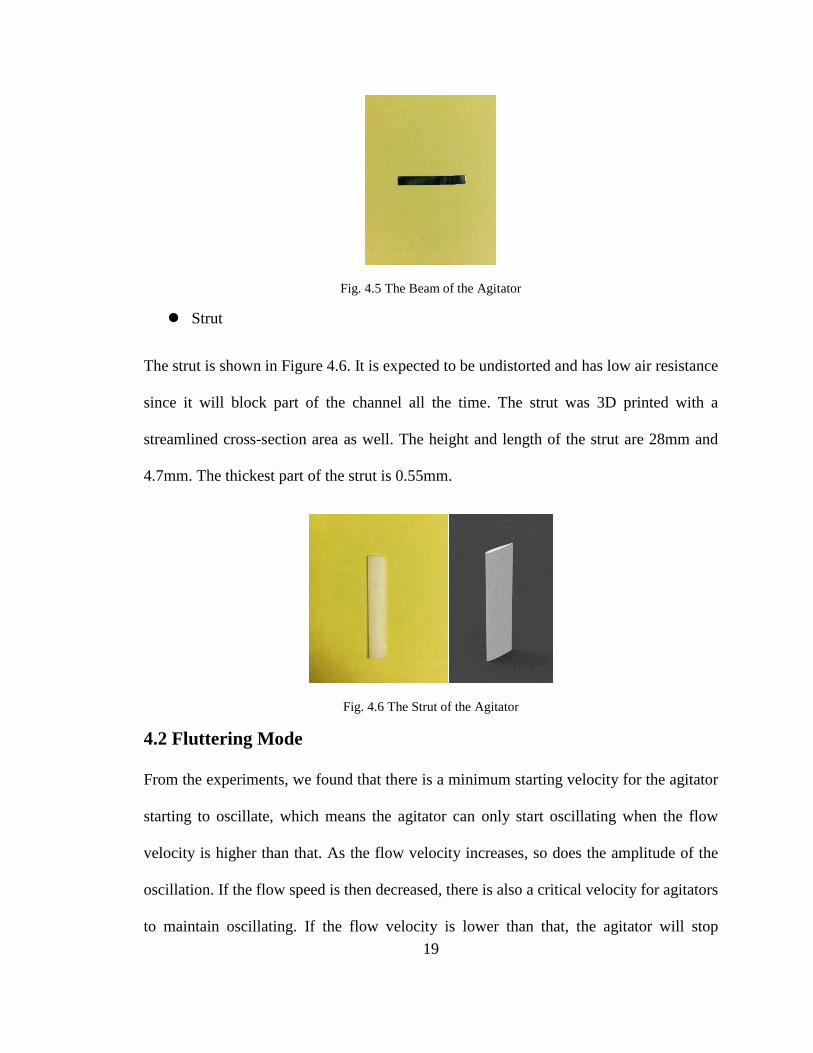
Strut
The strut is shown in Figure 4.6. It is expected to be undistorted and has low air resistance
since it will block part of the channel all the time. The strut was 3D printed with a
streamlined cross-section area as well. The height and length of the strut are 28mm and
4.7mm. The thickest part of the strut is 0.55mm.
Fig. 4.6 The Strut of the Agitator
4.2 Fluttering Mode
From the experiments, we found that there is a minimum starting velocity for the agitator
starting to oscillate, which means the agitator can only start oscillating when the flow
velocity is higher than that. As the flow velocity increases, so does the amplitude of the
oscillation. If the flow speed is then decreased, there is also a critical velocity for agitators
to maintain oscillating. If the flow velocity is lower than that, the agitator will stop
20
oscillating. It is interesting to notice that the critical velocity is much lower than the starting
velocity. Hence, all experiments were set to find the critical velocity of each type of agitator
first, and slow down the flow velocity from a relatively high speed to this critical speed
while agitators oscillating. Then the flow velocity will be increased again and the data will
start being collected. All data plots in the figures shown below start from the corresponding
critical velocity for each design.
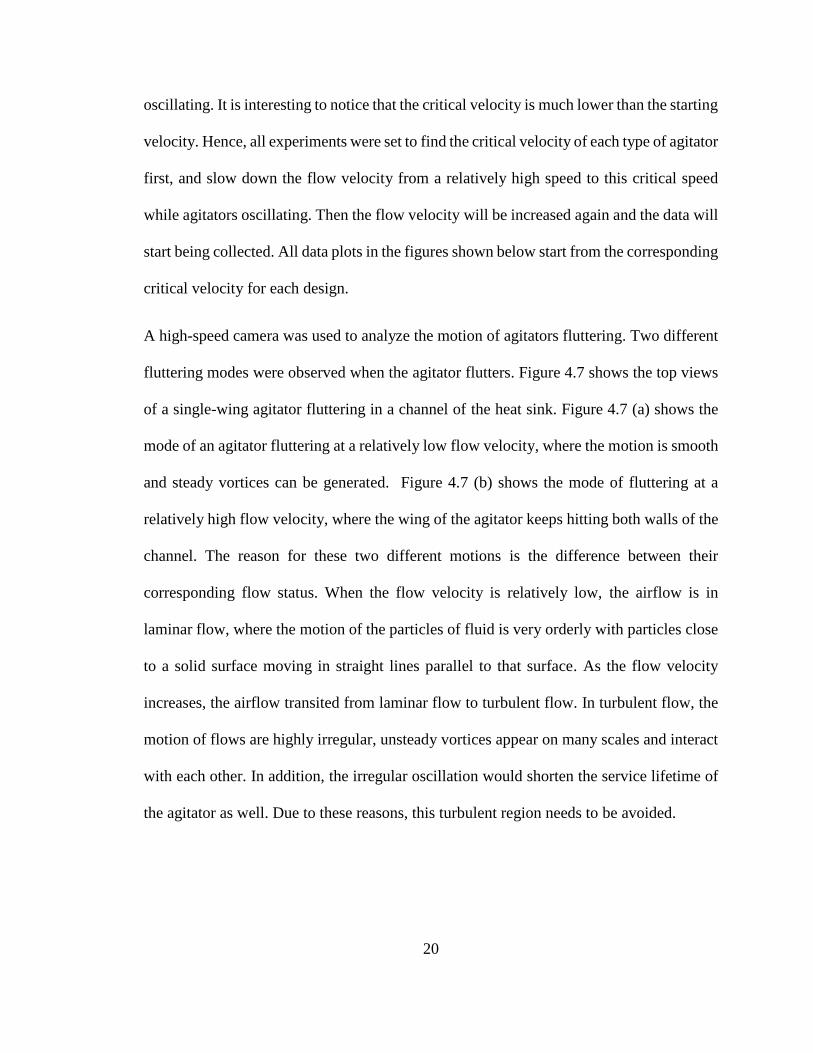
A high-speed camera was used to analyze the motion of agitators fluttering. Two different
fluttering modes were observed when the agitator flutters. Figure 4.7 shows the top views
of a single-wing agitator fluttering in a channel of the heat sink. Figure 4.7 (a) shows the
mode of an agitator fluttering at a relatively low flow velocity, where the motion is smooth
and steady vortices can be generated. Figure 4.7 (b) shows the mode of fluttering at a
relatively high flow velocity, where the wing of the agitator keeps hitting both walls of the
channel. The reason for these two different motions is the difference between their
corresponding flow status. When the flow velocity is relatively low, the airflow is in
laminar flow, where the motion of the particles of fluid is very orderly with particles close
to a solid surface moving in straight lines parallel to that surface. As the flow velocity
increases, the airflow transited from laminar flow to turbulent flow. In turbulent flow, the
motion of flows are highly irregular, unsteady vortices appear on many scales and interact
with each other. In addition, the irregular oscillation would shorten the service lifetime of
the agitator as well. Due to these reasons, this turbulent region needs to be avoided.

21
(a)
(b)
Fig. 4.7 Motion of an Agitator Fluttering at (a) Laminar Flow (b) Turbulent Flow
4.3 Rectangular-wing Agitator
4.3.1 Single-rectangular-wing Agitator
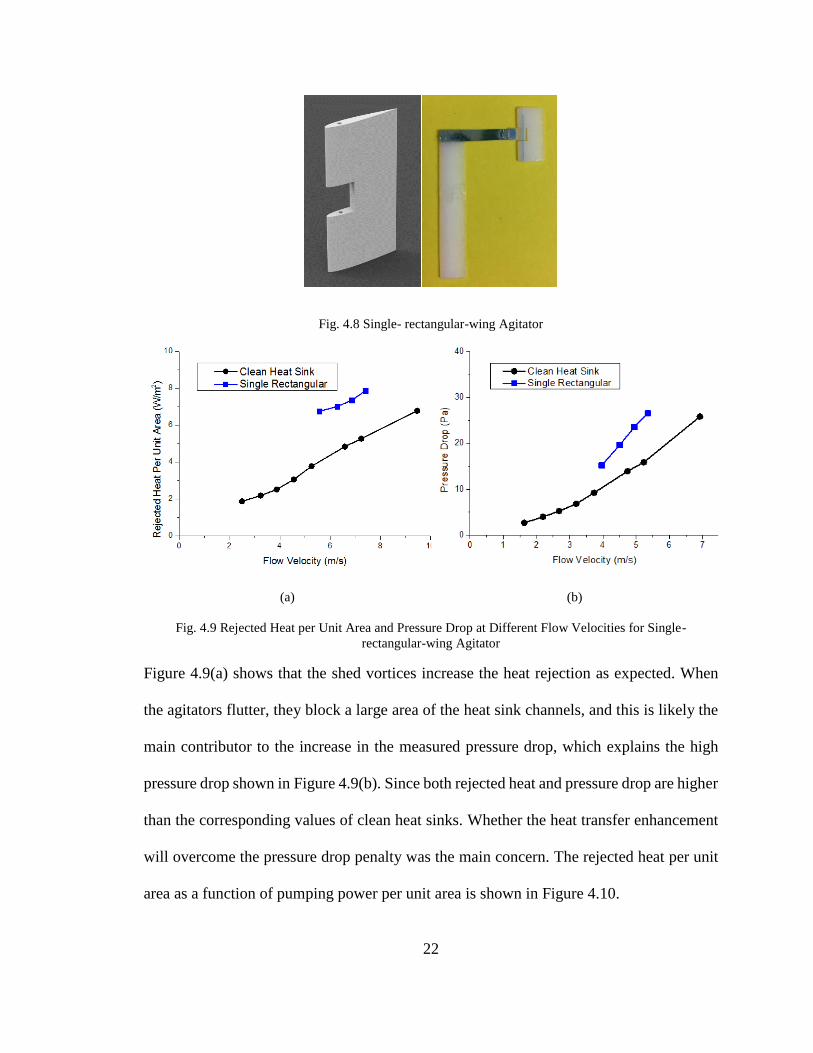
The first generation of the agitator is shown in Figure 4.8 The height of the wing is 9mm
and the width of the wing is 4.8mm. The wing was placed at the center of the channel. The
rejected heat and pressure drop at different flow velocities are shown in Figure 4.9.
22
Fig. 4.8 Single- rectangular-wing Agitator
(a) (b)
Fig. 4.9 Rejected Heat per Unit Area and Pressure Drop at Different Flow Velocities for Single-
rectangular-wing Agitator
Figure 4.9(a) shows that the shed vortices increase the heat rejection as expected. When
the agitators flutter, they block a large area of the heat sink channels, and this is likely the
main contributor to the increase in the measured pressure drop, which explains the high
pressure drop shown in Figure 4.9(b). Since both rejected heat and pressure drop are higher
than the corresponding values of clean heat sinks. Whether the heat transfer enhancement
will overcome the pressure drop penalty was the main concern. The rejected heat per unit
area as a function of pumping power per unit area is shown in Figure 4.10.

23
Fig. 4.10 Rejected Heat per Unit Area as a Function of Pumping Power per Unit Area for Single-
rectangular-wing Agitator
It clearly shows that by using the agitators in channels, the heat transfer performance was
increased by about 70 W/m2 compared with clean heat sinks under the same pumping
power.
4.3.2 Double-rectangular-wing Agitator
Since the single wing agitator had given a good result. It could be interesting to see what
would happen if there were two wings on an agitator. Although the pressure drop would
increase due to the larger blocking area, the heat transfer capability would be increased as
well since one more wing would be there to generate vortices. Figure 4.11 shows the design
of a double-rectangular-wing agitator.

24
Fig. 4.11 Double-rectangular-wing Agitator
The rejected heat and pressure loss at different flow velocities are shown in Figure 4.12. It
can be seen that the critical velocity of the double-wing agitator is higher than that of the
single-wing agitator. However, the rejected heat did show some increase. It should be noted
that double-wing agitators did not result in larger pressure drop than that of single-wing
agitators at the same flow velocity. When the air flow is slower than 5.1m/s, the pressure
drop caused by double-wing agitators is even lower. From the video caught by a high-speed
camera, it turns out that when the flow is slower than 5.1m/s, the oscillation amplitude of
the double-wing agitator is smaller than that of the single-wing agitator. This could explain
the lower pressure drop caused by a double-wing agitator in that velocity region.
Fig. 4.12 Rejected Heat Per Unit Area and Pressure Drop at Different Flow Velocities for Double-
rectangular-wing Agitator

25
The rejected heat per unit area as a function of pumping power per unit area is shown in
Figure 4.13. The double-wing agitator gave a better heat transfer performance than the
single -wing agitator. It showed an 110 to 140 W/m2 increase in rejected heat per unit area
compared with clean heat sinks.
Fig. 4.13 Rejected Heat per Unit Area as a Function of Pumping Power per Unit Area for Double-
rectangular-wing Agitator
4.4 Fishtail-wing Agitator
We noticed the big pressure drop caused by rectangular-wing agitators due to its large
planform area. Inspired by the motion of fish swimming, the second generation of agitators
was developed based on the shapes of fishtails.
4.4.1 Types of Fishtails
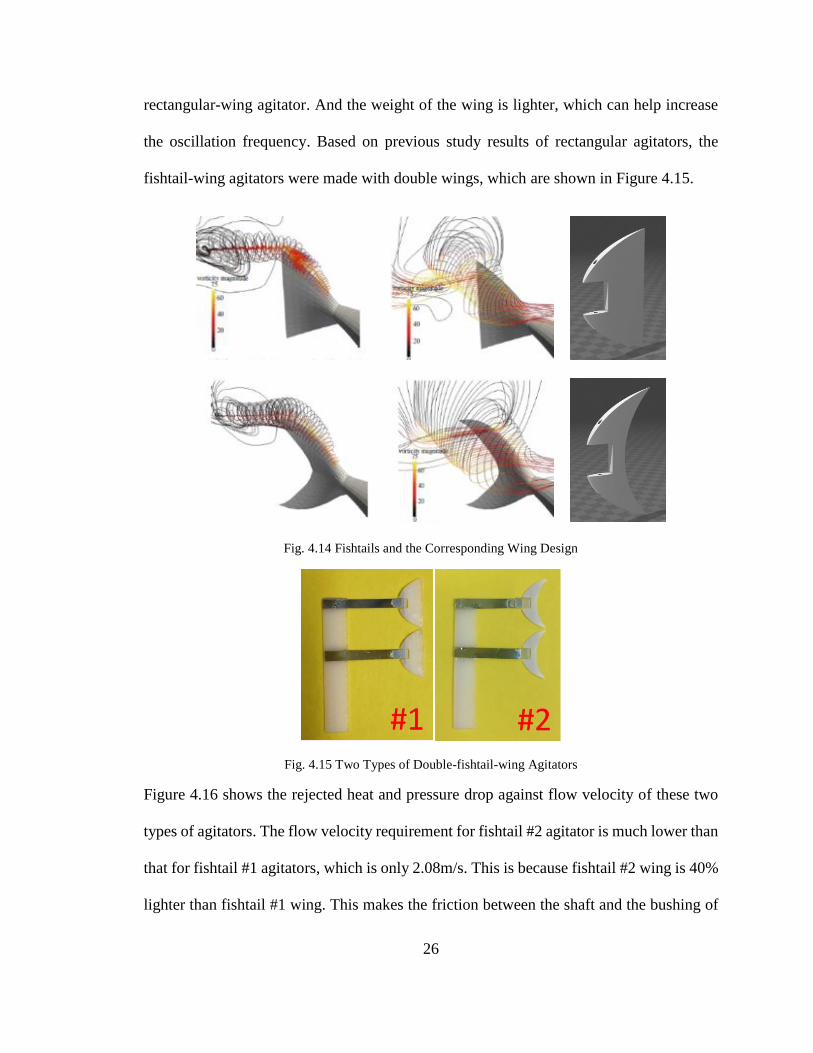
Of fishes swimming at low to moderate speeds, two types of fishtails were selected. Figure
4.14 shows the fishtails and the corresponding wing designs [6]. The fishtail-wing agitator
blocks less portion of the channel at its largest pitch displacements compared with the
26
rectangular-wing agitator. And the weight of the wing is lighter, which can help increase
the oscillation frequency. Based on previous study results of rectangular agitators, the
fishtail-wing agitators were made with double wings, which are shown in Figure 4.15.
Fig. 4.14 Fishtails and the Corresponding Wing Design
Fig. 4.15 Two Types of Double-fishtail-wing Agitators
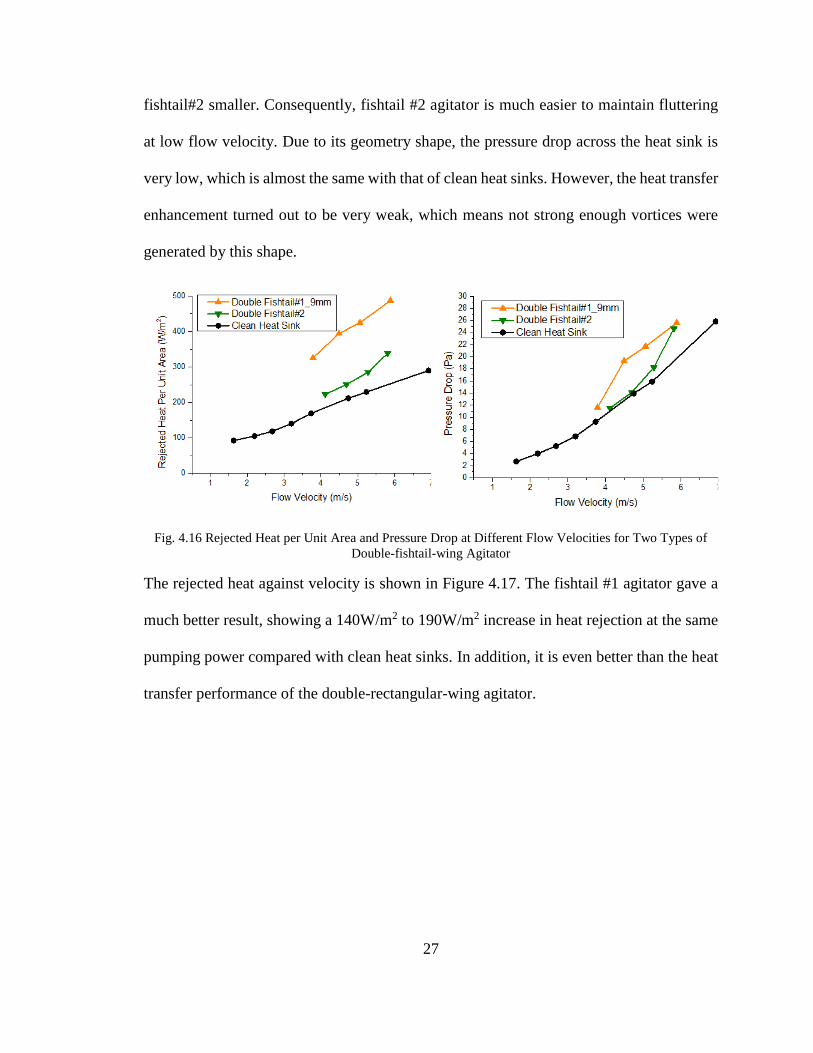
Figure 4.16 shows the rejected heat and pressure drop against flow velocity of these two
types of agitators. The flow velocity requirement for fishtail #2 agitator is much lower than
that for fishtail #1 agitators, which is only 2.08m/s. This is because fishtail #2 wing is 40%
lighter than fishtail #1 wing. This makes the friction between the shaft and the bushing of
27
fishtail#2 smaller. Consequently, fishtail #2 agitator is much easier to maintain fluttering
at low flow velocity. Due to its geometry shape, the pressure drop across the heat sink is
very low, which is almost the same with that of clean heat sinks. However, the heat transfer
enhancement turned out to be very weak, which means not strong enough vortices were
generated by this shape.
Fig. 4.16 Rejected Heat per Unit Area and Pressure Drop at Different Flow Velocities for Two Types of
Double-fishtail-wing Agitator
The rejected heat against velocity is shown in Figure 4.17. The fishtail #1 agitator gave a
much better result, showing a 140W/m2 to 190W/m2 increase in heat rejection at the same
pumping power compared with clean heat sinks. In addition, it is even better than the heat
transfer performance of the double-rectangular-wing agitator.

28
Fig. 4.17 Rejected Heat per Unit Area as a Function of Pumping Power per Unit Area for Two Types of
Double-fishtail-wing Agitator
4.4.2 Size Effect
Since smaller wing has higher oscillation frequency, more vortices can be generated in the
same time. The span of each wing was set to be 9mm, 7mm, and 5mm. The pressure drop
and rejected heat are shown in Figure 4.18.
Fig. 4.18 Rejected Heat per Unit Area and Pressure Drop at Different Flow Velocities for Different Sizes of
Double-fishtail#1-wing Agitator

29
It is interesting to notice that the pressure drop incurred by different spans of wings don’t
show much difference. On the other hand, while the 9mm span fishtail#1 increased the heat
rejection by about 200 W/m2, the 5mm span fishtail#1 agitator only showed 30 W/m2
increase compared to the clean heat sink.
The final heat transfer performance is shown in Figure 4.19. The fishtail #1 agitator with
9mm span gave the best heat transfer performance, increasing the heat rejection 80.5%
compared to that of the clean heat sink at 43.8W/m2. In contrast, the fishtail #1 agitator
with 5mm span almost had the same heat transfer performance with the clean heat sink. It
has the smallest wing of these three agitators. With the highest oscillating frequency, the
pressure drop incurred is large as well. However, the heat rejection is the lowest, which
makes the heat transfer performance the worst.
Fig. 4.19 Rejected Heat per Unit Area as a Function of Pumping Power per Unit Area for Different Sizes of
Double-fishtail#1-wing Agitator
30
CHAPTER 5. RESULTS
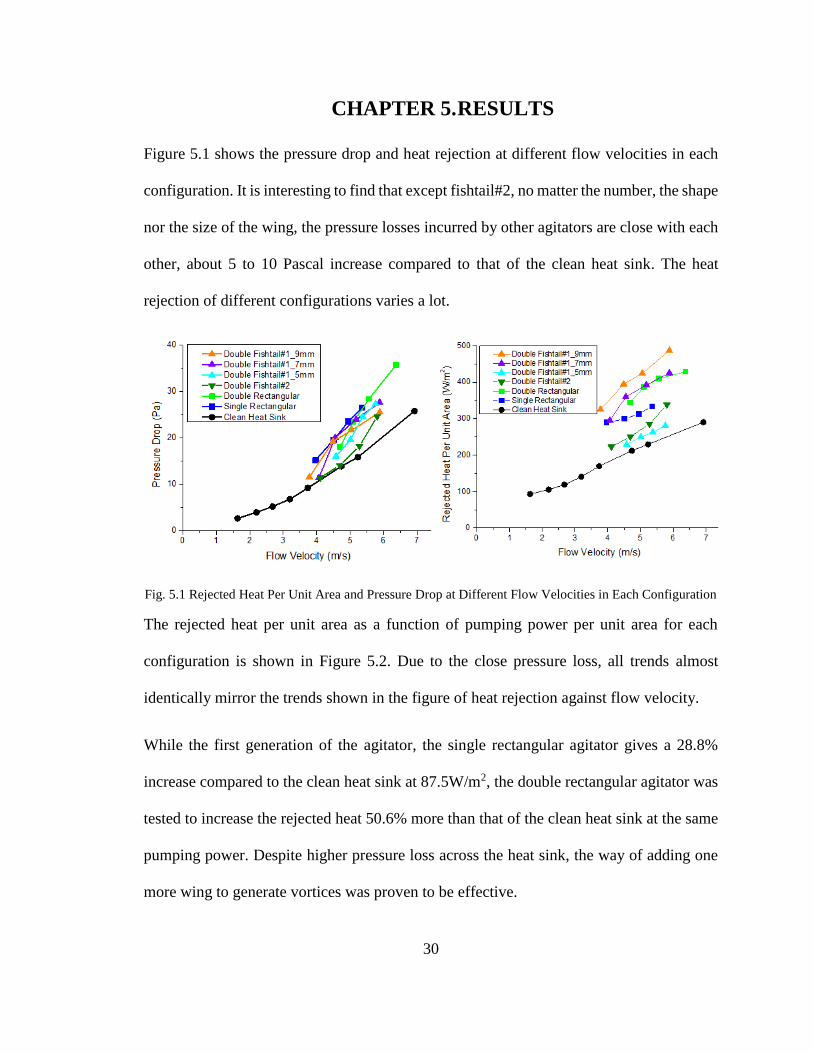
Figure 5.1 shows the pressure drop and heat rejection at different flow velocities in each
configuration. It is interesting to find that except fishtail#2, no matter the number, the shape
nor the size of the wing, the pressure losses incurred by other agitators are close with each
other, about 5 to 10 Pascal increase compared to that of the clean heat sink. The heat
rejection of different configurations varies a lot.
Fig. 5.1 Rejected Heat Per Unit Area and Pressure Drop at Different Flow Velocities in Each Configuration
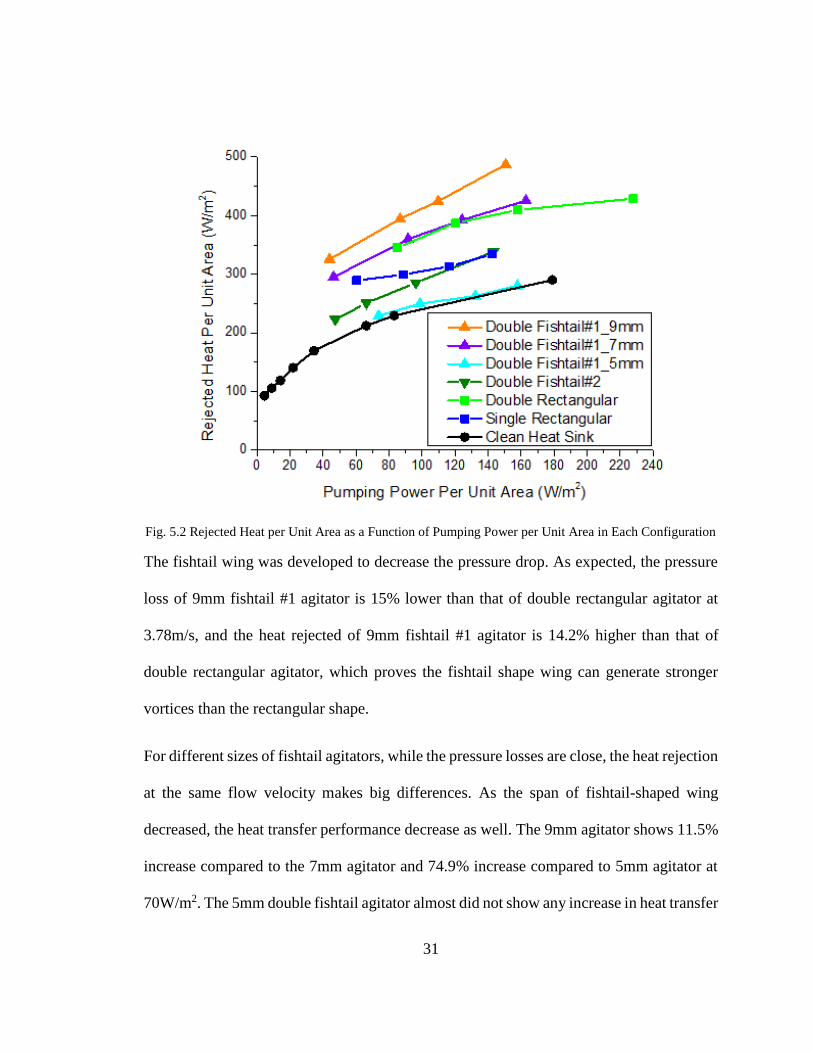
The rejected heat per unit area as a function of pumping power per unit area for each
configuration is shown in Figure 5.2. Due to the close pressure loss, all trends almost
identically mirror the trends shown in the figure of heat rejection against flow velocity.
While the first generation of the agitator, the single rectangular agitator gives a 28.8%
increase compared to the clean heat sink at 87.5W/m2, the double rectangular agitator was
tested to increase the rejected heat 50.6% more than that of the clean heat sink at the same
pumping power. Despite higher pressure loss across the heat sink, the way of adding one
more wing to generate vortices was proven to be effective.
31
Fig. 5.2 Rejected Heat per Unit Area as a Function of Pumping Power per Unit Area in Each Configuration
The fishtail wing was developed to decrease the pressure drop. As expected, the pressure
loss of 9mm fishtail #1 agitator is 15% lower than that of double rectangular agitator at
3.78m/s, and the heat rejected of 9mm fishtail #1 agitator is 14.2% higher than that of
double rectangular agitator, which proves the fishtail shape wing can generate stronger
vortices than the rectangular shape.
For different sizes of fishtail agitators, while the pressure losses are close, the heat rejection
at the same flow velocity makes big differences. As the span of fishtail-shaped wing
decreased, the heat transfer performance decrease as well. The 9mm agitator shows 11.5%
increase compared to the 7mm agitator and 74.9% increase compared to 5mm agitator at
70W/m2. The 5mm double fishtail agitator almost did not show any increase in heat transfer
32
compared to the clean heat sink. While the pressure drop caused by 5mm fishtail agitator
is relatively low, the vortices generated seemed to be too poor to make any enhancement
but just counteract the pressure loss penalty. This may because its total blocking percentage
in the height direction is too low, which leads to fewer vortices generated.
Benefited from its special geometry shape, the double fishtail #2 agitator yielded the
smallest pressure loss increase, 6.5% higher than that of the clean heat sink. However, it
only increased the heat rejection by18.7% at the pumping power of 50W/m2 compared to
the clean heat sink. Along with the poor performance given by the 5mm fishtail #1 agitator,
the too small surface area of the wing may be averse to increasing the heat transfer
capability.
Of all the agitators tested, the double fishtail#1 agitator with 9mm span showed the most
increase in heat rejection compared to the clean heat sink at the same pumping power,
yielding a 92.7% increase in heat rejected at the flow velocity of 3.78m/s. The
corresponding pressure loss at this speed is only 20% higher than that of the clean heat sink.
This makes the heat rejection increased by 80.5% compared to the clean heat sink at the
same pumping power.
In summary, the 9mm double fishtail#1 agitator performed the best in heat transfer,
followed by the 7mm double fishtail #1 agitator and the double rectangular agitator, then
the single rectangular agitator and double fishtail #2. The 5mm double fishtail #1 agitator
performs the worst, which is almost the same with that of the clean heat sink. All agitators
prove to increase the heat transfer of the heat sink more or less.

33
CHAPTER 6. CONCLUSION
The results show that the agitators can substantially increase the heat rejection capability
of the heat sink. In most of the cases, the gain in terms of heat rejection overcomes the loss
associated with the large pressure loss penalty caused by the motion of the agitators.
In summary, a series of experiments has analyzed 7 heat sink/agitator configurations: a
clean, unmodified heat sink, the same heat sink with single rectangular agitators, double
rectangular agitators, and 4 different sizes or shapes double of fishtail agitators. The
configurations were analyzed in terms of pressure drop against flow velocity, heat rejection
against flow velocity, and heat rejection against required pumping power.
The study reveals that the shape of 9mm span fishtail #1 wing is the best option for the
agitator so far. It beats the shape of rectangular in both heat rejection and pressure loss. A
relatively larger wing proves to give better performance than a smaller wing. Double-wing
agitators reject more heat than single-wing agitators do.
For now, the single-wing agitators were set to flutter at the center of each channel in height
direction. In the next step, we plan to study the effect of the location of the wing has to the
heat transfer performance. Since theoretically if the wing is closer to the bottom of the heat
sink, which is an important heat transfer surface, the heat transfer efficiency could be better.
We are also going to keep modifying the shape and size of the wing and the beam at the
same time to find the best combination. Different types of materials will be tried to reduce
the mass of the agitator in order to get a higher oscillation frequency.

34
APPENDIX A: GEOMETRY OF THE HEAT SINK
Schematic of the Wakefield heat sink used are shown below in Fig. B.1 [7].
Fig. B.1 Schematic View of the Heat Sink
Dimensions of the heat sink are outlined in Table B.1.
Table B.1. Dimensions of the Heat Sink
Dimension Property
Height (H) 24.13 mm
Length (L) 122 mm
Width (W) 58.42 mm
Fin Height (Hf) 21.84 mm
Gap Thickness (g) 6.6 mm
Fin Thickness (tf) 1.52 mm

35
APPENDIX B: CALIBRATION CURVES FOR PRESSURE
MEASUREMENT
That electrical signal is only useful if it accurately represents the pressure applied to the
sensor. Calibration is the process by which the sensor electrical signal is adjusted so that it
has a known relationship to the applied pressure. After calibration, the electrical signal can
be used to calculate the pressure at the sensor.
The calibration charts shown below in Figures B.1 shows the linear calibration used for the
220DD MKS pressure transducers. Since all tests were run using the same equipment and
under the impression that they would be used in comparison to each other only, the linear
calibration curve is considered accurate enough for this work. The calibration converts the
sensor’s raw voltage output into inches of water, which is required for the volumetric flow
rate and velocity calculation. The linear calibration spans from 0 – 10 V and 0 – 20 torr.
Since 1 torr is 0.535775 inch of water, this means that one volt output from the sensor
yields 1.0716 inches of water.
Fig. B.1 Calibration curve for the 220DD MKS Baratron differential pressure transducer
y = 1.0716xR² = 1
0
2
4
6
8
10
12
0 2 4 6 8 10
Pre
ssu
re D
iffe
ren
tial
(in
. wat
er)
Voltage output (V)
36
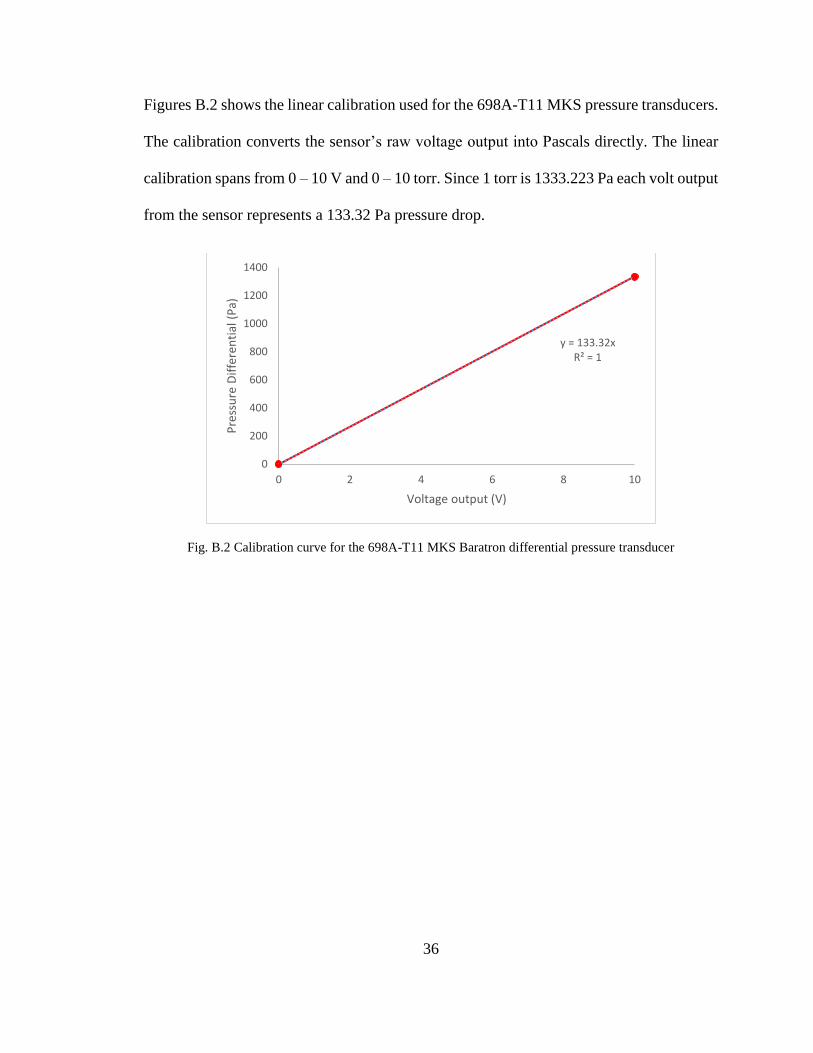
Figures B.2 shows the linear calibration used for the 698A-T11 MKS pressure transducers.
The calibration converts the sensor’s raw voltage output into Pascals directly. The linear
calibration spans from 0 – 10 V and 0 – 10 torr. Since 1 torr is 1333.223 Pa each volt output
from the sensor represents a 133.32 Pa pressure drop.
Fig. B.2 Calibration curve for the 698A-T11 MKS Baratron differential pressure transducer
y = 133.32xR² = 1
0
200
400
600
800
1000
1200
1400
0 2 4 6 8 10
Pre
ssu
re D
iffe
ren
tial
(P
a)
Voltage output (V)
37
REFERENCES
[1]. Sean Bushart, 2014. Advanced Cooling Technologies for Water Savings at Coal-
Fired Power Plants. Cornerstone.
[2]. Lee, S., 1995. How to select a heat sink. electronics cooling, 1(1), pp.10-14.
[3]. AMCA, 210-Laboratory Methods of Testing Fans for Aerodynamic Performance
Rating. Air Movement and Control Association International, Inc, 2007.
[4]. MKS Instruments, BARATRON® GENERAL PURPOSE DIFFERENTIAL
CAPACITANCE MANOMETER. 2003.
[5]. MKS Instruments, PRODUCT SELECTION GUIDE TYPES 690A, 698A, 590A,
615A, AND 616A SENSORS. 2009.
[6]. Borazjani, I. and Daghooghi, M., 2013. The fish tail motion forms an attached
leading edge vortex. Proceedings of the Royal Society of London B: Biological
Sciences, 280(1756), p.20122071.
[7]. Wakefield Engineering, Extruded Heat Sinks, p. 55.
[8]. Lee, S., 1995. How to select a heat sink. electronics cooling, 1(1), pp.10-14.
[9]. Shi, J., Hu, J., Schafer, S.R. and Chen, C.L.C., 2014, August. Heat transfer
enhancement of channel flow via vortex-induced vibration of flexible cylinder. In
ASME 2014 4th Joint US-European Fluids Engineering Division Summer Meeting
collocated with the ASME 2014 12th International Conference on Nanochannels,
Microchannels, and Minichannels (pp. V01BT12A009-V01BT12A009). American
Society of Mechanical Engineers.
[10]. AMCA, B., 2007. 210-Laboratory Methods of Testing Fans for Aerodynamic
Performance Rating. Air Movement and Control Association International, Inc.
38
[11]. Bergman, T.L., Incropera, F.P., DeWitt, D.P. and Lavine, A.S., 2011. Fundamentals
of heat and mass transfer. John Wiley & Sons.
[12]. Lee, B.H.K., Price, S.J. and Wong, Y.S., 1999. Nonlinear aeroelastic analysis of
airfoils: bifurcation and chaos. Progress in aerospace sciences, 35(3), pp.205-334.
[13]. Zhao, Y.H. and Hu, H.Y., 2004. Aeroelastic analysis of a non-linear airfoil based on
unsteady vortex lattice model. Journal of Sound and Vibration, 276(3), pp.491-510.
[14]. Kwon, S.D., 2010. A T-shaped piezoelectric cantilever for fluid energy
harvesting. Applied Physics Letters, 97(16), p.164102.
[15]. Bryant, M. and Garcia, E., 2011. Modeling and testing of a novel aeroelastic flutter
energy harvester. Journal of vibration and acoustics, 133(1), p.011010.
[16]. Dietl, J.M. and Garcia, E., 2010. Beam shape optimization for power
harvesting. Journal of Intelligent Material Systems and Structures.