design and implementation of booth … 1st feb... · 2pg student / vlsi design, sns college of...
TRANSCRIPT

International conference on Science, Technology and Management ICSTM-2015
YMCA, New Delhi (India), 1 Feb 2015 www.conferenceworld.in
1329 | P a g e
DESIGN AND IMPLEMENTATION OF BOOTH
MULTIPLIER IN COMPARISON WITH OTHER
MULTIPLIERS
Shanmuga Priya.K1, Ruth Anita Shirley.D
2,Prabu Venkateswaran.S
3
1PG students / ECE, SNS College of Technology, Coimbatore, (India)
2PG student / VLSI Design, SNS College of Technology, Coimbatore, (India)
3Assistant Professor, Dept. of ECE, SNS College of Technology, Coimbatore,( India)
ABSTRACT
The multi-modulus design capable of performing the desired modulo operation for more than one modulus in
Residue Number System. The Residue Number System and has been used for efficient carry free operation. It
explores the efficient use of hardware resources by the use of Booth algorithm. This algorithm helps to reduce the
partial products to half. Radix-4 and Radix-8 booth encoding algorithm has been employed. The Booth multiplier of
both signed and unsigned numbers. The use of booth encoding optimizes area overhead and also increases the
performance of multiplication process. This module has been implemented using Xilinx. The module has been
programmed using Verilog.
Keywords: Booth Multiplier, RNS, Radix.
I INTRODUCTION
Residue Number Systems (RNS) allow the distribution of large dynamic range computations over small modular
rings, which allows the speed up of computations. This feature is well known, and already used in both DSP and
cryptography. Most of implementations use RNS bases of three elements to reduce the complexity of conversions,
but if can increase the number of RNS modular computational channels, then we are able to compute over smaller
rings and thus further increase the speed of computation.Residue Number System relay on Chinese Remainder
Theorem. We consider a n-tuple of co-prime numbers (m1,m2, . . . ,mn) . We note , If we consider the n-
tuple (x1, x2, . . . , xn) of integer such that xi< mi. Then there exits an unique X which verifies:
and
The n-tuple (m1,m2, . . . ,mn) of co-primes is generally called RNS basis.
The main interest of the Residue Number Systems is to distribute integer operations on evaluations with the residues
values. Thus an operation with large integers is made on the residues which are small numbers and where

International conference on Science, Technology and Management ICSTM-2015
YMCA, New Delhi (India), 1 Feb 2015 www.conferenceworld.in
1330 | P a g e
computations can be executed independently for each modulo allowing a complete parallelization of the
calculus.The multiplication operation is present in many parts of a digital system or digital computer, most notably
in signal processing, graphics and scientific computation.
With the recent advances in technology, many researchers have worked on the design of increasingly more efficient
multipliers. The common multiplication method is add and shift algorithm. Multiplication can be considered as a
series of repeated additions. The number to be added is the multiplicand, the number of times that it is added is the
multiplier, and the result is the product. Each step of addition generates a partial product. In most computers, the
operand usually contains the same number of bits. When the operands are interpreted as integers, the product is
generally twice the length of operands in order to preserve the information content.This repeated addition method
that is suggested by the arithmetic definition is slow that it is almost always replaced by an algorithm that makes use
of positional representation. It is possible to decompose multipliers into two parts.
The first part is dedicated to the generation of partial products, and the second one collects and adds them. The basic
multiplication principle is twofold i.e. evaluation of partial products and accumulation of the shifted partial products.
It is performed by the successive additions of the columns of the shifted partial product matrix. The „multiplier‟ is
successfully shifted and gates the appropriate bit of the „multiplicand‟. They are then added to form the product bit
for the particular form. Multiplication is therefore a multi operand operation. To extend the multiplication to both
signed and unsigned numbers, a convenient number system would be the representation of numbers in two‟s
complement format. Booth‟s algorithms are meant for this.
II. COMPARISON OF MULTIPLIERS
An efficient multiplier should have following characteristics:-
Accuracy:- A good multiplier should give correct result.
Speed:- Multiplier should perform operation at high speed.
Area:- A multiplier should occupies less number of slices and LUTs.
Power:- Multiplier should consume less power.
Multiplication process has three main steps
1.Partial product generation.
2. Partial product reduction.
3. Final addition.
For the multiplication of an n-bit multiplicand with an m bit multiplier, m partial products are generated and product
formed is n + m bits long.
Here we discuss about three different types of multipliers which are
1.
2.
3.

International conference on Science, Technology and Management ICSTM-2015
YMCA, New Delhi (India), 1 Feb 2015 www.conferenceworld.in
1331 | P a g e
2.1 Array Multiplier
Array multiplier is well known due to its regular structure. Multiplier circuit is based on repeated addition and
shifting procedure. Each partial product is generated by the multiplication of the multiplicand with one multiplier
digit. The partial product are shifted according to their bit sequences and then added. The summation can be
performed with normal carry propagation adder. N-1 adders are required where N is the no. of multiplier bits.
The Multiplication of two binary number can be obtained with one micro-operation by using a combinational circuit
that forms the product bit all at once thus making it a fast way of multiplying two numbers since only delay is the
time for the signals to propagate through the gates that forms the multiplication array. In array multiplier, consider
two binary numbers A and B, of m and n bits. There are mn summands that are produced in parallel by a set of mn
AND gates. n x n multiplier requires n(n-2) full adders, n half-adders and n2 AND gates. Also, in array multiplier
worst case delaywould be (2n+1) td.
2.1.1 Disadvantage
It requires larger number of gates because of which area is also increased.
Delay for this multiplier is larger.
Fig2.1 Array Multiplier
2.2 Wallace Tree Multiplier
Fig2.2 Wallace Tree Multiplier

International conference on Science, Technology and Management ICSTM-2015
YMCA, New Delhi (India), 1 Feb 2015 www.conferenceworld.in
1332 | P a g e
A Wallace tree multiplier is an efficient hardware implementation of a digital circuit that multiplies two integers
devised by an Australian computer scientist Chris Wallace in 1964. Wallace tree reduces the no. of partial products
and use carry select adder for the addition of partial products.
Wallace tree has three steps:-
1. Multiply each bit of multiplier with same bit position of multiplicand. Depending on the position of the multiplier
bits generated partial products have different weights.
2. Reduce the number of partial products to two by using layers of full and half adders.
3. After second step we get two rows of sum and carry, add these rows with conventional adders.
Three bit signals are passed to a one bit full adder (“3W”) which is called a three input Wallacetree circuit, and the
output signal (sum signal) is supplied to the next stage full adder of thesame bit, and the carry output signal thereof
is passed to the next stage full adder of the same noof bit, and the carry output signal thereof is supplied to the next
stage of the full adder located ata one bit higher position.Wallace tree is a tree of carry-save adders arranged as
shown in figure 2.2. A carry save adderconsists of full adders like the more familiar ripple adders, but the carry
output from each bit isbrought out to form second result vector rather being than wired to the next most significant
bit. The carry vector is 'saved' to be combined with the sum later. In the Wallace tree method,the circuit layout is not
easy although the speed of the operation is high since the circuit is quiteirregular.
2.3 Booth Multiplier
Booth multiplication algorithm gives a procedure for multiplying binary integers in signed -2‟s complement
representation. Following steps are used for implementing the booth algorithm:-Let X and Y are two binary numbers
andhaving m and n numbers of bits(m and n are equal) respectively.
Step 1-Making booth table:
In booth table we will take four columns one column for multiplier second for previous first LSB of multiplier and
other two (U and V) for partial product accumulator (P).
1. From two numbers, choose multiplier (X) and multiplicand (Y).
2. Take 2‟s complement of multiplicand (Y).
3. Load X value in the table.
4. Load 0 for X-1 value.
5. Load 0 in U and V which will have product of X & Y at the end of the operation.
6. Make n rows for each cycle because we are multiplying m and n bits numbers.
Step2-Booth algorithm:
Booth algorithm requires examination of the multiplier bits, and shifting of the partial product(P). Prior to the
shifting, the multiplicand may be added to P, subtracted from the P, or left unchanged according to the following
rules:
1. Xi Xi-1 operation
0 0 Shift only

International conference on Science, Technology and Management ICSTM-2015
YMCA, New Delhi (India), 1 Feb 2015 www.conferenceworld.in
1333 | P a g e
1 1 Shift only
0 1 Add Y to U and shift
1 0 Minus Y from U and shift
2. Take U & V together and shift arithmetic right shiftwhich preserves the sign bit of 2‟s complement number.So,
positive numbers and negative numbers remainspositive and negative respectively.
3. Circularly right shift X because this will prevent usfrom using two registers for the X value.
Repeat the same steps until n no. of cycles are completed.In the end we get the product of X and Y.
The Booth recording multiplier is one such multiplier; it scans the three bits at a time to reducethe number of partial
products. These three bits are: the two bit from the present pair; and athird bit from the high order bit of an adjacent
lower order pair.
After examining each triplet ofbits, the triplets are converted by Booth logic into a set of five control signals used by
the addercells in the array to control the operations performed by the adder cells.To speed up the multiplication
Booth encoding performs several steps of multiplicationat once. Booth‟s algorithm takes advantage of the fact that
an adder subtractor is nearly as fastand small as a simple adder.From the basics of Booth Multiplication it can be
proved that the addition/subtractionoperation can be skipped if the successive bits in the multiplicand are same. If 3
consecutive bitsare same then addition/subtraction operation can be skipped. Thus in most of the cases the
delayassociated with Booth Multiplication are smaller than that with Array Multiplier. However theperformance of
Booth Multiplier for delay is input data dependent. In the worst case the delaywith booth multiplier is on per with
Array Multiplier.The method of Booth recording reduces the numbers of adders and hence the delayrequired to
produce the partial sums by examining three bits at a time. The high performance ofbooth multiplier comes with the
drawback of power consumption. The reason is large number ofadder cells required that consumes large power
2.3.1 Booth Multiplication Algorithm for radix 2
Booth algorithm gives a procedure for multiplying binary integers in signed –2‟s complementrepresentation.
I will illustrate the booth algorithm with the following example:
Example, (2)10* (-4)10
(0010)2* (1100)2
Step 1-Making the Booth table
I. From the two numbers, pick the number with the smallest difference between a series of consecutive numbers, and
make it a multiplier.
i.e., 0010 -- From 0 to 0 no change, 0 to 1 one change, 1 to 0 another change ,so there are two changes on this one
1100 -- From 1 to 1 no change, 1 to 0 one change, 0 to 0 no change, so there is only one change on this one.
Therefore, multiplication of 2 x (– 4), where (2)10i.e (0010)2 is the multiplicand and (-4)10i.e (1100)2is the
multiplier.
II. Let X = 1100 (multiplier)
Let Y = 0010 (multiplicand)

International conference on Science, Technology and Management ICSTM-2015
YMCA, New Delhi (India), 1 Feb 2015 www.conferenceworld.in
1334 | P a g e
Take the 2‟s complement of Y and call it –Y–Y = 1110
III. Load the X value in the table.
IV. Load 0 for X-1 value it should be the previous first least significant bit of X
V. Load 0 in U and V rows which will have the product of X and Y at the end of operation.
VI. Make four rows for each cycle; this is because we are multiplying four bits numbers.
Step 2-Booth Algorithm
Booth algorithm requires examination of the multiplier bits, and shifting of the partial product. Prior to the shifting,
the multiplicand may be added to partial product, subtractedfrom the partial product, or left unchanged according to
the following rules:
Look at the first least significant bits of the multiplier “X”, and the previous leastsignificant bits of the
multiplier “X - 1”.
Take U & V together and shift arithmetic right shift which preserves the sign bit of 2‟s complement
number. Thus a positive number remains positive, and a negative number remains negative.
Shift X circular right shift because this will prevent us from using two registers for the X value.
Table 2.1 Radix4 Modified Booth algorithm scheme for odd values of i .
X(i) X(i-1) X(i-2) Y
0 0 0 +0
0 0 1 +y
0 1 0 +y
0 1 1 +2y
1 0 0 -2y
1 0 1 -y
1 1 0 -y
1 1 1 +0
2.3.2 Booth multiplication algorithm for radix 4
One of the solutions of realizing high speed multipliers is to enhance parallelism which helps to decrease the number
of subsequent calculation stages. The original version of the Booth algorithm (Radix-2) had two drawbacks. They
are:
(i) The number of add/subtract operations and the number of shift operations becomes variable and becomes
inconvenient in designing parallel multipliers.
(ii) The algorithm becomes inefficient when there are isolated 1‟s. These problems are overcome by using modified
Radix4 Booth algorithm which scan strings of three bits with the algorithm given above:
1) Extend the sign bit 1 position if necessary to ensure that n is even.
2) Append a 0 to the right of the LSB of the multiplier.
3) According to the value of each vector, each Partial Product will he 0, +y ,-y, +2y or -2y.

International conference on Science, Technology and Management ICSTM-2015
YMCA, New Delhi (India), 1 Feb 2015 www.conferenceworld.in
1335 | P a g e
The negative values of y are made by taking the 2‟s complement and in this paper Carry-look-ahead (CLA) fast
adders are used. The multiplication of y is done by shifting y by one bit to the left. Thus, in any case, in designing a
n-bit parallel multipliers, only n/2 partial products are generated.
III. SIMULATION RESULT AND ANALYSIS
3.1 Simulated Output of Array Multiplier
Fig 3.1 Simulated Input Output of Array Multiplier
3.2 Simulated Output of Wallace Tree Multiplier
Fig 3.2Simulated Input Output of Wallace Tree Multiplier
3.3 Schematic Diagram of Booth Encoder
Fig 3.3 Schematic Diagram of Booth Encoder

International conference on Science, Technology and Management ICSTM-2015
YMCA, New Delhi (India), 1 Feb 2015 www.conferenceworld.in
1336 | P a g e
3.4 Simulated Output of Booth Encoder
Fig 3.4 Simulated Input Output of Booth Encoder
3.5 Simulated Output of Booth Multiplier
Fig 3.5 Simulated Input Output of Booth Multiplier
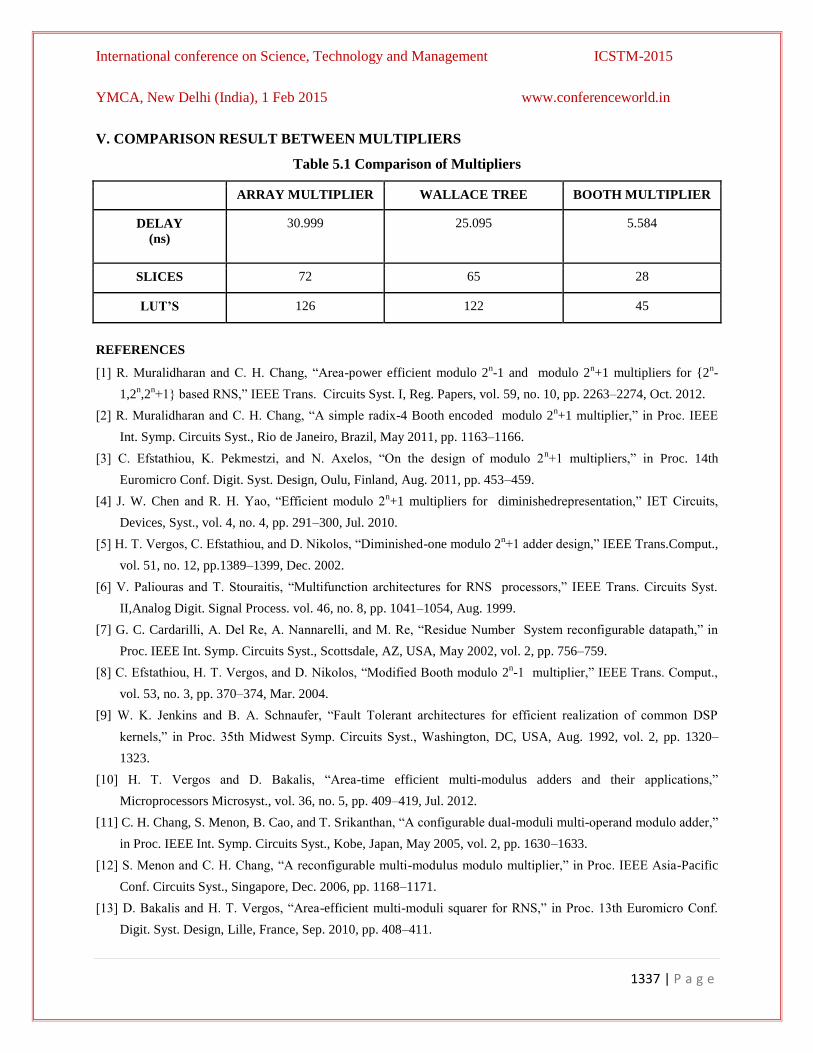
IV. CONCLUSION
Different types of 8-bit multiplier have been compared. As a result of comparison in terms of delay, Booth
multiplier has been chosen to proceed the multiplication of both signed and unsigned numbers. It also becomes
efficient for radix-4 and radix-8 modulo multiplication. It also reduces the number of partial products. Booth
encoder saves nearly 40% of area. RNS, an integer system has been chosen since all the positions derive the same
weight (base).
International conference on Science, Technology and Management ICSTM-2015
YMCA, New Delhi (India), 1 Feb 2015 www.conferenceworld.in
1337 | P a g e
V. COMPARISON RESULT BETWEEN MULTIPLIERS
Table 5.1 Comparison of Multipliers
ARRAY MULTIPLIER WALLACE TREE
MULTIPLIER
BOOTH MULTIPLIER
DELAY
(ns)
30.999 25.095 5.584
SLICES 72 65 28
LUT’S 126 122 45
REFERENCES
[1] R. Muralidharan and C. H. Chang, “Area-power efficient modulo 2n-1 and modulo 2
n+1 multipliers for {2
n-
1,2n,2
n+1} based RNS,” IEEE Trans. Circuits Syst. I, Reg. Papers, vol. 59, no. 10, pp. 2263–2274, Oct. 2012.
[2] R. Muralidharan and C. H. Chang, “A simple radix-4 Booth encoded modulo 2n+1 multiplier,” in Proc. IEEE
Int. Symp. Circuits Syst., Rio de Janeiro, Brazil, May 2011, pp. 1163–1166.
[3] C. Efstathiou, K. Pekmestzi, and N. Axelos, “On the design of modulo 2n+1 multipliers,” in Proc. 14th
Euromicro Conf. Digit. Syst. Design, Oulu, Finland, Aug. 2011, pp. 453–459.
[4] J. W. Chen and R. H. Yao, “Efficient modulo 2n+1 multipliers for diminishedrepresentation,” IET Circuits,
Devices, Syst., vol. 4, no. 4, pp. 291–300, Jul. 2010.
[5] H. T. Vergos, C. Efstathiou, and D. Nikolos, “Diminished-one modulo 2n+1 adder design,” IEEE Trans.Comput.,
vol. 51, no. 12, pp.1389–1399, Dec. 2002.
[6] V. Paliouras and T. Stouraitis, “Multifunction architectures for RNS processors,” IEEE Trans. Circuits Syst.
II,Analog Digit. Signal Process. vol. 46, no. 8, pp. 1041–1054, Aug. 1999.
[7] G. C. Cardarilli, A. Del Re, A. Nannarelli, and M. Re, “Residue Number System reconfigurable datapath,” in
Proc. IEEE Int. Symp. Circuits Syst., Scottsdale, AZ, USA, May 2002, vol. 2, pp. 756–759.
[8] C. Efstathiou, H. T. Vergos, and D. Nikolos, “Modified Booth modulo 2n-1 multiplier,” IEEE Trans. Comput.,
vol. 53, no. 3, pp. 370–374, Mar. 2004.
[9] W. K. Jenkins and B. A. Schnaufer, “Fault Tolerant architectures for efficient realization of common DSP
kernels,” in Proc. 35th Midwest Symp. Circuits Syst., Washington, DC, USA, Aug. 1992, vol. 2, pp. 1320–
1323.
[10] H. T. Vergos and D. Bakalis, “Area-time efficient multi-modulus adders and their applications,”
Microprocessors Microsyst., vol. 36, no. 5, pp. 409–419, Jul. 2012.
[11] C. H. Chang, S. Menon, B. Cao, and T. Srikanthan, “A configurable dual-moduli multi-operand modulo adder,”
in Proc. IEEE Int. Symp. Circuits Syst., Kobe, Japan, May 2005, vol. 2, pp. 1630–1633.
[12] S. Menon and C. H. Chang, “A reconfigurable multi-modulus modulo multiplier,” in Proc. IEEE Asia-Pacific
Conf. Circuits Syst., Singapore, Dec. 2006, pp. 1168–1171.
[13] D. Bakalis and H. T. Vergos, “Area-efficient multi-moduli squarer for RNS,” in Proc. 13th Euromicro Conf.
Digit. Syst. Design, Lille, France, Sep. 2010, pp. 408–411.

International conference on Science, Technology and Management ICSTM-2015
YMCA, New Delhi (India), 1 Feb 2015 www.conferenceworld.in
1338 | P a g e
A SURVEY OF SIMULATION TOOLS FOR
PERVASIVE APPLICATIONS
R. Vivadha1, J. Uma Maheswari
2,
1, 2 Assistant Professor, Department Of CSE, Rajiv Gandhi College of Engg & Tech., (India)
ABSTRACT
Pervasive computing needs a poise of computing, design, and business constraints to be considered all through
the design process. Realizing this creation involves a level of design in mixture of different fields that is not
present in current pervasive design tools. Besides the progress of the key technologies for pervasive computing,
the design of application itself has materialized as a remarkable research area. In spite of much growth,
developing a pervasive computing application ruins a challenge because of in need of conceptual frameworks
and supporting tools. In this paper, a survey has been conducted with different tools that support the integration
of analysis and the design process which helps to identify design considerations. The investigation is done as of
which tool involve both designers and engineers to take part in the design process. Evaluation is also performed
for each tool with the conventional metrics of pervasive design tools. These evaluations afford imminent to key
metrics and allow tool designers to recognize the requirements of their intentional spectators.
Keywords: Pervasive System, Context-Reorganization, Citycompiler, Diasuite, Sketchify.
I. INTRODUCTION
Pervasive Computing also known as ambient, physical, embedded, environmental or ubiquitous computing was
first introduced by technology prophet Mark Weiser in the year 1991. He visualized a world of entirely coupled
devices with economical wireless networks where information is available everywhere. A world in which
computers and information technologies become invisible, and impossible to differentiate from everyday life:
„anytime, anywhere and always on‟ concept has been came into use. Today, a family is encircled by hundreds of
„invisible‟ devices in the machines around them. Likewise, in a pervasive computing environment, computers
and information processing turn out to be normal, and pierce into every object in our day by day lives. Until
lately the „ubiquity‟ was rarely heard, but nowadays, it has promptly come to mean just about anything having
to do with global connectivity. Consequently, information technology perspectives are no longer appreciated so
much for the immersiveness they propose as for how tangential they emerge to be, and in this way dropping
information overload. In 2004, McCullough renowned that architecture has obtained a digital layer, which
occupies the design of organizations, services and communications and it looks as if that both architecture and
interaction design mutually can help to compile the required structure for a improved assimilation. [5]
The same
as Edwards et al. depicted, the focus should be more on the „value for end-users‟ than on the „core technical
workability‟. This target conveys new challenges to the design and evaluation of pervasive applications
International conference on Science, Technology and Management ICSTM-2015
YMCA, New Delhi (India), 1 Feb 2015 www.conferenceworld.in
1339 | P a g e
As a design needs to determine both the technical and users‟ prompt features to maintain the acceptable user
skills, the developers have to build the overall scenarios, so as to recognize the day by day practices of their
users. Conversely, the day by day conditions are constantly varying, owing to the diverse perspective of use and
the settings for communication, which causes the challenging prophecy in producing a set-up. For example it is
extremely tricky to envisage how users will respond when designing an interactive service. Presently, the
technical features for constructing pervasive applications are noticeable, due to the existing sensing, data
processing and context-recognizing technologies. However for researchers, there is still in need for the criteria
to design and estimate the features of the application itself. The purpose of features in a design today mainly
depends upon the designers‟ practices and perceptions or on the particular styles supported by the particular
infrastructure systems. It can also be evaluated that a good quality design of pervasive applications can quickly
fix on to which elements should be limited within a given application and assess how well those features will
put in value for users to tackle their requirements. It aids the designers in speeding up an iterative development
process and in accepting the full intricacy of applications by setting the exact reasons in each design phase. In
such cases, constructing a prototype is a core means, which permits the designers to reveal, assess or test a
developing design with the negligible effort. [8]
To appropriately implement pervasive systems, the designers must design them to tackle human desires and
concerns. Design needs a considerate and harmonizing of appropriate constraints to find a suitable solution.
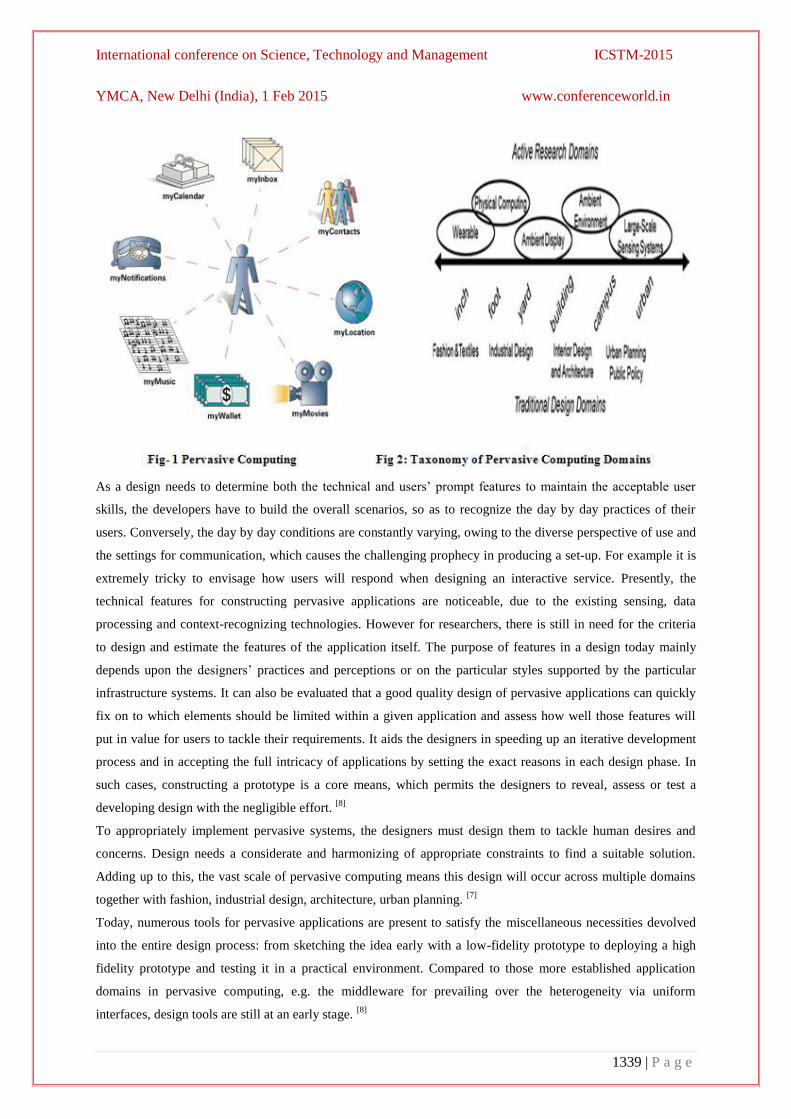
Adding up to this, the vast scale of pervasive computing means this design will occur across multiple domains
together with fashion, industrial design, architecture, urban planning. [7]
Today, numerous tools for pervasive applications are present to satisfy the miscellaneous necessities devolved
into the entire design process: from sketching the idea early with a low-fidelity prototype to deploying a high
fidelity prototype and testing it in a practical environment. Compared to those more established application
domains in pervasive computing, e.g. the middleware for prevailing over the heterogeneity via uniform
interfaces, design tools are still at an early stage. [8]

International conference on Science, Technology and Management ICSTM-2015
YMCA, New Delhi (India), 1 Feb 2015 www.conferenceworld.in
1340 | P a g e
II. KEY REQUIREMENTS FOR PERVASIVE COMPUTING APPLICATIONS
Moreover to involve proficiency on underlying technologies, mounting a pervasive computing application also
entails domain-specific architectural knowledge to gather information pertinent for the application, develop it,
and execute actions. Some of the key requirements for developing pervasive computing applications are
reviewed below: [3]
2.1 Abstracting Over Heterogeneity
Pervasive computing applications interrelate with entities whose heterogeneity has a tendency to penetrate in the
application code, messing it with low-level details. [3]
This condition need to raise the level of abstraction at
which entities are raised, to factor entity variations out of the application code, and to protect it from distributed
systems dependencies and communication protocol details.
2.2 Architecturing an Application
Theoretically, pervasive computing applications gather context information, process it, and carry out actions.
Software development methodologies such as model driven engineering are also useful to design pervasive
computing applications. [3]
A prominent example is PervML which relies on the general-purpose modeling
notations of UML to produce particular programming support. However, such approaches do not afford a
conceptual framework to direct the design.
2.3 Leveraging Area-Specific Knowledge
Since the pervasive computing domain comprises an increasing number of areas, information about each area
wants to be shared and made reusable to make easy the growth of applications. Reusability is required at two
levels. [3]
First, it is looked-for the entity level because applications in a given area frequently share the same
classes of entities. Second, reusability is looked-for the application level to facilitate the developer to act in
response to new requirements by using obtainable context computations.
2.4 Covering the Application Development Life-Cycle
Existing general-purpose design frameworks are standard and do not wholly sustain the development life-cycle
of pervasive computing applications. To cover this life-cycle, a design framework explicit to the pervasive
computing domain is required. This domain-specific design framework would get better yield and assist
progress. [3]
To make this design framework effectual, the conformance between the requirement and the
implementation must be definite. After the application is implemented, tools should aid for all characteristic of
its consumption. Maintenance and evolution are important matter for any software system. They are even more
significant in the pervasive computing domain where new entities may be organized or detached at any time and
where users may have varying needs. These maintenance and evolution phases should be supported by
pervasive tools.
2.5 Simulation of the Environment
The use of a pervasive computing application involves abundant equipments to be obtained, tested, configured,
and installed. In addition, some scenarios are hard to test because of the situations involved. [3]
To overcome this

International conference on Science, Technology and Management ICSTM-2015
YMCA, New Delhi (India), 1 Feb 2015 www.conferenceworld.in
1341 | P a g e
operation barrier, tools should be made available to the developer to test pervasive computing applications in a
computer-generated environment.
III. PROPERTIES OF PERVASIVE TOOLS
An overview is made by categorizing the pervasive design tools by its properties which are discussed below: [7]
3.1 Multiple Representations
A key obscurity in design is the language or representation used to articulate a design. [3]
Often interactive
products are produced using a textual programming language, which is well-known to the engineers, but
unknown to the designers. Having multiple, and probably concurrent, representations of a design defeats this
problems by letting all members of a design team to take part in the design of an application and have a view
that is appropriate for them.
3.2 User Defined Events
Pervasive applications depend greatly on sensor data collected from the physical world. These physical events
can be as easy as the state of a switch, or they can be more difficult events such as the classification of an
activity. [7]
Apart from the event in difficulty, blending sensor data into significant information is a tricky task.
For easy events, thresholds can be set on sensor data, but more difficult events must be examined with a
machine learning algorithms. Several tools have developed methods to assist in fusing events from complex
sensor data.
3.3 Knowledge Support
Including sensing and computing brings in a new material into the design process that is unknown to non-
computing authority.[7]
Dow et al. prompts this category by conversing how specialized designers necessitate
information about current and imminent technologies to notify their design. Furthermore, when performing
collaborative design, all parties must recognize how the basic technology behaves.
3.3 Testing and Device Support
Depending on the size of a pervasive system it may not be probable to have all devices or services there during
design. [7]
As well, the system will have to be tested using real or generated actions.
3.4 Integration with Current Practice
At last, tools are examined that challenge to integrate current design practice into the design of pervasive
applications.[7]
This guideline articulates to the heart of design and tries to use existing design practices to
produce interactive computing elements. This approach continues designers within the normal dominion of
design, permitting comfort and quick iteration.
IV. SURVEY OF DESIGN TOOLS
In this section we present a survey of design tools for pervasive computing. [7]
In Section III we summarized the
properties by which to evaluate the design tools.
International conference on Science, Technology and Management ICSTM-2015
YMCA, New Delhi (India), 1 Feb 2015 www.conferenceworld.in
1342 | P a g e
4.1 Diasuite
DiaSuite is a tool suite which covers the development life cycle of a pervasive computing system. This tool suite
consists of a domain-specific design language, a compiler for the language that generates a Java programming
framework, an editor to identify simulation scenarios, and a 2D-renderer to imitate pervasive computing
applications. This tool uses a software design approach to make the development process. DiaSuite presents a
language, DiaSpec, devoted to architecturing pervasive computing systems. [1]
DiaSpec lets an area authority to
define categorization by asserting the necessary entities of the system. DiaSpec also offers to declare the
architecture of the system in the form of context and controller components. A simulation editor and 2D-
renderer are also part of DiaSuite to imitate the resulting pervasive computing application.
4.2 Sketchify
Sketchify is a tool for sketching user interfaces. It gives designers the liberty to operate interactive materials by
uniting elements of traditional freehand sketching with functional extension and end-user programming tools,
such as spreadsheets and scripting. [6]
This tool has a number of features potentially helpful for sketching of
interactive systems, as well as support for looking at complex technologies in an easy way, multiplicity and
reuse of existing environments. Some of the benefits of using Sketchify tools are investigate the possibilities and
limitations of technologies, mixture of components, extensibility and domain independence, reuse of existing
environments, diversity of development styles and avoiding proprietary lock-in, promoting more efficient
collaboration between designers and engineers.
4.3 Modkit
Modkit is a tool that makes it possible for learners and knowledgeable programmers /designers to fetch tangibles
to life by contributing graphical command blocks stimulated by the Scratch programming environment. Modkit
as a means for designing systems that entails sensing, actuation, programming, embedded design, and crafting.
Participants will look for Modkit programming by using Crimp Cards easy-to-assemble kits of hardware
components. [3]
It has as a feature found and manufactured materials into interactive projects by combining them
in unpredicted ways. It interprets opinion from different types of sensors into light, motion, or sound. It expands
Modkit activities for future designers from all backgrounds. It expands Modkit to improved support certain
applications or user groups.
4.4 Inspirational Bits
Inspirational bits as a way to turn out to be more well-known with the design material in HCI, the digital
material. The inspirational bits are described as rapid and filthy but fully working systems in both hardware and
software constructed with the aim of revealing one or several of the dynamic properties of a digital material. It
can also be used as one of the preliminary steps in a design process, making them alike to a technology-driven
design process. [10]
These inspirational bits should be rapid to build. Whereas building the first bit in a material
may take longer time, nearly all of the digital materials are very flexible and from our experience the second and
third bit will take much fewer times to build. By this, we also believe the overall amount of time it takes to build
interactive systems in fact will be shorter, in that we will keep away from fighting our material and instead
functioning with it functioning out the design concept.

International conference on Science, Technology and Management ICSTM-2015
YMCA, New Delhi (India), 1 Feb 2015 www.conferenceworld.in
1343 | P a g e
4.5 City Com Piler
CityCompiler is an integrated environment for the iteration-based development of spatial interactive systems. [9]
It envisages interactive systems in a virtual 3D space by combining the Processing source code and the 3D
model of the real space, designed with Google SketchUp. Hybrid prototyping would be useful not only for
organize a system into the real world but also for designing a system with a new concept.
Tool
name
Multiple
Representations
User defined
events
Knowle
dge
support
Testing
and device
support
Integration with current
practice
Visual
and
textual
repres
entatio
ns
States
and
code
Tangi
ble
Demo
nstrati
on
Infrastruct
ure/API
Emulation
and
simulation
Sketching
interactio
n
Field
observations
and
storyboard
Diasuite
Sketchify
Modkit
Inspiratio
nal bits
CityCom
piler
d.note
I*Catch
ESPranto
SDK
Xtel
Makeit
Table 1: Comparison of Different Simulation Tools
4.6 d.note
d.note is a revision tool for user interfaces articulated as control flow diagrams. d.note initiates a command set
for altering and interpreting both look and performance of user interfaces; it also describes execution semantics
so proposed changes can be tested instantly. With d.note, users can set up alternatives for manifestation and
application logic. [2]
d.note signifies the alternatives by duplicating the original state and visually summarizing
both original and alternative. d.note was implemented as an extension to d.tools.
4.7 i*CATch
i*CATch wearable computing framework, was developed particularly for children and beginners to the field.[6]
The i*CATch framework is based upon a bus-based architecture, and is further scalable than the existing

International conference on Science, Technology and Management ICSTM-2015
YMCA, New Delhi (India), 1 Feb 2015 www.conferenceworld.in
1344 | P a g e
alternatives. It comprises of a set of plug-and-play components, a construction platform with a homogeneous
interface, and an easy-to-use hybrid text-graphical integrated development environment. The i*CATch
construction kit was intended for the two reasons of sustaining creativity and make possible standardization in
wearable computing.
4.8 ESPranto SDK
The ESPranto SDK is a part of the Edutainment Sensor Platform (ESP) which supports the growth of
sensor/actuator based applications, most particularly in the domains of educational toys, games and lighting.[11]
ESPranto SDK is a toolkit that provides beginner programmers to build up simple applications, non-technical
domain experts to build up professional content, and technical experts to extend complex building blocks for the
other users to include in their applications. The SDK supports the end user's progression from trainee to expert
programmer. The preclusion of runtime errors is a patent benefit of the SDK. To trim down development time
and costs, the SDK must allow all users to develop applications with no or slight help from a software engineer.
The SDK must permit users to switch effortlessly to a higher level of programming, i.e. without having to adjust
their attitude. The SDK must be adaptable, in that it is not essential to produce a new tool for each hardware
grouping.
4.9 XTel
XTel encompasses three tools: Moxa, Talktic and Entity Collaborator. The „moxa‟ Micro Control Unit (MCU)
board connects to sensors and actuators and is competent of short-distance wireless communications; the
„Talktic‟ programming/runtime environment for the MCU board that holds a JavaScript parser, compiler, VM
and library; and the „Entity Collaborator‟ P2P network library that is capable of managing continuous
information such as video and audio in addition to the discrete information from sensors.[12]
The utilization of
these tools allows both developers and designers to rapidly and effortlessly generate ubiquitous contents. „XTel‟
is a progress support environment that facilitates the proficient making of these ubiquitous contents. The main
drawback is that the consumers who are not familiar with programming cannot use it, because it is not easy to
build up visual expression such as Processing.
4.10 MAKEIT
The MAKEIT framework an acronym for „Mobile Applications Kit Embedding Interaction Times‟ is used to
make functional, hi-fi prototypes for mobile devices following sophisticated interaction techniques. It simply
produce and modify applications while at the same time provides support in keeping proposed end user
interaction times low. [9]
An integrated development environment is used for hi-fi prototyping of mobile phone
applications for producing a code framework for the ultimate implementation. A primary model based on state
graphs confirms parts of the application logic and perceives faults in the navigational structure and propose
alternatives. An integrated model is estimated for task completion times early on the design without calling for
organizing a prototype on the actual target hardware platform.

International conference on Science, Technology and Management ICSTM-2015
YMCA, New Delhi (India), 1 Feb 2015 www.conferenceworld.in
1345 | P a g e
V. RELATED WORK
The design of tools for pervasive computing mainly focuses on the ability and forms. Another consideration for
the design of tools is based on how these tools are active in the design process life cycle. The design process life
cycle is structured, linear cyclic and iterative. The key property of design tool is its flexibility. This paper mainly
focuses on the properties needed for a tool that have various perspectives such as multiple representations,
knowledge support etc., Tools that are used for designing must have the attribute of knowledge support so that
the user can understand sensing technologies without implementation. The tools must allow for the expression
of different ideas and also must support for different domains.
ESPranto SDK attempts to introduce beginners to program. However, domain specific tools such as iCATCH
deals with wearable‟s and location based applications. When using multiple representations, the issues are the
amount of linkage or coupling between the two representations. Tools such as DiaSuite, Sketchify, ESPranto
SDK, Modkit supports visual and textual representations, state and code, Tangibles. These tools provides
graphical user interface and make the user to generate the code efficiently. DiaSuite and Modkit are used as
simulating tools. Simulation allows for a richer design experience that can test features such as user interaction
and network performance estimation.
VI. CHALLENGES
6.1 Design Representation
While one of the attributes in the multiple representation of a single design, the issues in the determination of
which representation is to use. The two parts in the multiple representations are visual and textual
representation. Comparing these two representations, textual programming provides explicit control and
conditional events which are more difficult to describe in a visual language where as visual representation is
easier for beginner programmers and can more easily express continuous behaviors.
6.2 Simulation Environment:
A simulator for pervasive environment needs to serve three roles in the design process. They are as follows: (1)
simulating the input space of an application, including the explicit (e.g., mouse or keyboard events) and implicit
input (e.g., location sensed input when user moves); (2) simulating the logical control flow that jumps between
sensors, servers, handhelds (such as PDA) and any other kinds of networking appliances; and (3) simulating the
output space of an application, which means to visualize the environment effects caused by the application
behaviors.
6.3 Understanding Context Awareness
Designers who are already familiar with the language can now build context-aware applications. However, the
drawback is that the delivered context is not the desired information or is not suited for a particular application.
In such case, the context recognition algorithms will need to be re-evaluated, which may cause major difficulty.
Recent work has been conducted to provide end-users intelligibility in context aware systems (Lim and Dey,
2010) such that they can realize why certain actions were and were not taken. A similar intelligibility approach

International conference on Science, Technology and Management ICSTM-2015
YMCA, New Delhi (India), 1 Feb 2015 www.conferenceworld.in
1346 | P a g e
is required to allow design teams to understand the behavior of recognition algorithms, and allow the parameters
of the algorithm to be exposed and modified.
VII. CONCLUSION
In this paper, we have done a survey of the current studies in designing and evaluating pervasive applications.
We have listed some of the key requirements to design a pervasive computing application and also some
properties of pervasive tools. We have also summarized the need for design of pervasive computing systems and
performed a survey of some tools.
REFERENCE
[1] Benjamin Bertrana, Julien Bruneaua, Damien Cassoua, Nicolas Loriantb, Emilie Ballanda, Charles
Consela, “DiaSuite: a Tool Suite To Develop Sense/Compute/Control Applications”, May 2012.
[2] Björn Hartmann, Sean Follmer, Antonio Ricciardi, Timothy Cardenas, Scott R. Klemmer, “d.note:
Revising User Interfaces Through Change Tracking, Annotations, and Alternatives”, ACM Transactions,
April 2010.
[3] Damien Cassou, Julien Bruneau, Charles Consel, Emilie Balland, “Towards A Tool-based Development
Methodology for Pervasive Computing Applications”, March 2012.
[4] Edward Baafi, Amon Millner, “A Toolkit for Tinkering with Tangibles & Connecting Communities”,
ACM Transactions, Jan 2011.
[5] A. Fatah gen. Schieck, A. Penn, V. Kostakos, E. O‟Neill1, T. Kindberg, D. Stanton Fraser, T. Jones,
“Design Tools for Pervasive Computing in Urban Environments”, DDSS 2006.
[6] Grace Ngai, Stephen C.F. Chan, Vincent T.Y. Ng, Joey C.Y. Cheung, Sam S.S. Choy, Winnie W.Y. Lau
and Jason T.P. Tse, “i*CATch: A Scalable, Plug-n-Play Wearable Computing Framework for Novices and
Children”, ACM Transactions, April 2010.
[7] Jason B. Forsyth, Thomas L. Martin, “Tools for interdisciplinary design of pervasive computing”,
International Journal of Pervasive Computing and Communications, Vol. 8 Iss: 2 pp. 112 – 132.
[8] Lei Tang, Zhiwen Yu, Xingshe Zhou, Hanbo Wang, Christian Becker, “Supporting rapid design and
evaluation of pervasive applications: challenges and solutions”, Springer 2011.
[9] Paul Holleis and Albrecht Schmidt, “MAKEIT: Integrate User Interaction Times in the Design Process of
Mobile Applications”, Springer 2008, LNCS 5013, pp. 56–74.
[10] Petra Sundström, Alex S. Taylor, Katja Grufberg, Niklas Wirström, Jordi Solsona Belenguer, Marcus
Lundén, “Inspirational Bits Towards a Shared Understanding of the Digital Material”, ACM Transactions,
May 2011.
[11] Robert van Herk and Janneke Verhaegh, Willem Fontijn, “ESPranto SDK: an Adaptive Programming
Environment for Tangible Applications”, ACM Transactions, April 2009.
[12] Satoru Tokuhisa, Takaaki Ishizawa, Yoshimasa Niwa, Kenji Kasuya, Atsuro Ueki, Sho Hashimoto,
Kazuhiko Koriyama and Masa Inakage, “xtel: A Development Environment to Support Rapid Prototyping
of “Ubiquitous Content””, 2009.
[13] Yasuto Nakanishi, Koji Sekiguchi, Takuro Ohmori, Soh kitahara, and Daisuke Akatsuka, “Hybrid
prototyping by using virtual and miniature simulation for designing spatial interactive information
systems”, 2011.
[14] Zeljko Obrenovic and Jean-Bernard Martens, “Sketching Interactive Systems with Sketchify”, ACM
Transactions on Computer-Human Interaction, Vol. 18, No. 1, Article 4, Publication date: April 2011.

International conference on Science, Technology and Management ICSTM-2015
YMCA, New Delhi (India), 1 Feb 2015 www.conferenceworld.in
1347 | P a g e
A STUDY PAPER BASED ON COMPENSATION OF
VOLTAGE DISTORTION AND MINIMIZATION OF
HARMONIC USING UPQC
Vinod Kumar1, Dr. Ravindra Pratap Singh
2
1Ph.D Research Scholar, Department of Electrical Engineering, JJT University, Rajasthan, (India)
2Research Guide, Department of Electrical Engineering, J.B. Knowledge Park, Haryana, (India)
ABSTRACT
This paper presents the comprehensive reviews for compensation of voltage distortion and minimization of
harmonics in the power supply which is caused by the non-linear characteristic based loads. This paper present
a broad overview on different possible topology of UPQC for single-phase and three-phase networks and recent
development in the fields. It is observed that many researchers have used different names for the UPQC based
on the application and topology. Hence keeping in view of the above concern, research has been carried out to
compensation of voltage distortion and minimization of harmonics. The authors strongly believe that the
literature survey will be very much useful to the researchers for finding out the relevant references in the field of
power quality problems mitigated by UPQC.
Keywords: Distribution Static Compensation (D-STATCOM), Harmonic Compensation, Hybrid
Filters, Unified Power Quality Conditioner (UPQC), Voltage Distortion Compensation
I. INTRODUCTION
Power quality issue are of great concern in transmission and distribution system nowadays due to the sensitive
nature of load. In power system poor power quality due to different factors, such as voltage sag, voltage swell,
poor power factor, and unaccepted level of harmonics in voltage and current waveforms. In distribution system
at the load end are facing poor power quality. The reason behind this is the increase of electronics devices which
are used by the residences as well as industry. For working properly these devices need high quality energy. The
harmonics presence in the system results in several effects such as increased heating losses in motors,
transformers and lines. In this scenario, provide quality power to the consumers is difficult for power utility
companies. To compensate these identify power quality problems efforts are going on in the name of passive
filters, active filters and hybrid filters. Passive filters has the limitations such as, fixed compensation, resonance
with the source impedance of filter parameters have forced the use of active and hybrid filters. For enhancing
the quality of the power supply and reliability a new technology custom power devices are emerged. Custom
power devices include DVR, STATECOM and UCPC/UPQC. The UPQC Unified Power Quality Conditioner is
one of the custom power device, which can compensate both voltage and current related problems. The UPQC is
one of the APF family members where series and shunt functionalities are integrated together to achieve the
control of voltage and current related problems. The shunt APF is usually connected across the loads to

International conference on Science, Technology and Management ICSTM-2015
YMCA, New Delhi (India), 1 Feb 2015 www.conferenceworld.in
1348 | P a g e
compensate for all current related problems, whereas the series APF is connected in a series with the line
through series transformer to compensate all voltage related problems.
Fig. 1 Unified Power Flow Controller Configuration
II. LITERATURE REVIEWS
In 2009 Khadkikar Stated that due to numerous advantages offered by power electronics based equipments are a
Major key component of today‟s modern power processing, at the transmission as well as the distribution level.
Some devices, equipments, nonlinear load including saturated transformers, arc furnaces and semiconductor
switches draw non-sinusoidal currents from the utility. Therefore a typical power distribution system has to deal
with harmonics and reactive power support.
In 1998 Fujtha Stated that for low impedance path for current harmonics we used passive filters, so that they not
flow in the supply and flow in the filter. These filters are applicable only to particular harmonics, for triple-N
harmonics isolating transformer is useful and passive filters only for their designed harmonic frequency. The
harmonics current is less predictable in some installations.
In 1999 Singh Stated that Improving the power factor and eliminating harmonic distortion we used power factor
correction techniques that include both passive and active filters. To reduce phase shift and harmonics uses
inductors, transformers, capacitors and other passive component in passive approach. The passive approach is
heavier and less compact than the active approach, which is finding greater favour due to new technical
developments in circuitry, superior performance and reduced components costs. Power factor correction
techniques must be applied to each load or power supply in the system.
In 2000 Joao Afonso stated that for controlling current harmonics in supply networks at low to medium voltage
distribution level or for reactive power and/or voltage control at high level, active Power Filters have become a
solution,

International conference on Science, Technology and Management ICSTM-2015
YMCA, New Delhi (India), 1 Feb 2015 www.conferenceworld.in
1349 | P a g e
In 2004 Das stated that, Frequency domain approaches are suitable for both single and three-phase systems. The
Frequency domain algorithms are sine multiplication techniques, conventional Fourier and fast Fourier
Transform (FFT) algorithms and modified Fourier series techniques.
In 2004 Chen stated that, APF‟s controls methods in the time domain are based on instantaneous derivation of
compensating commands in the form of either voltage or current signals from distorted and harmonic polluted
voltage or current signal.
In 2002 Ghosh stated that for Power (<100 KVA), medium Power (100KVA- 10MVA), and High Power (>10
MVA) application, APFs are used. In Single phase and three Phase systems APFs can be applied for low power
applications. For Single Phase systems, APFs generally mitigate the current harmonics. For three- Phase
systems, APFs generally provide acceptable solutions for unbalanced load current and mitigate the current
harmonics. For medium and high power applications, the main aim is to eliminate or reduce the current
harmonics.
In 2003 Karimi stated that reactive power compensation using active filters at the high voltage distribution level
is not generally regarded as viable because of economic consideration. For high power applications, the
harmonic pollution in high power ranges is not such a major problem as in lower power systems. Active filters
applications in high power systems are the installation of parallel combination of several active filters because
the control and co-ordination requirements of these filters are complicated.
In 2005 Jindal stated that for some applications the combinations of several types of filter can achieve greater
benefits. The examined combinations are combination of both parallel and series active filters, combination of
series active and parallel passive filters, combination of parallel active and passive filters and active filter in
series with parallel filters. Seven-level APF configuration is also examined in this paper.
In 1995 Gunther stated that in medium and large capacity applications multilevel three-leg center-split VSIs are
more preferable due to lower initial cost and fewer switching devices that need to be controlled. The multilevel
series stacked converter topology, which allows standard three phase inverters to be connected with their DC
busses in series.
In 2009 Jayanthi stated that the APF power circuit generally consists of DC energy storage unit, DC/AC
converter and passive filter. Two main purposes serves by the DC capacitor (1) it maintains a DC voltage with a
small ripple in steady state and (2) it serves as an energy storage elements to supply the real power difference
between load and supply during the transient period.
In 2007 Kolhatkar stated that UPQC has the main advantage that it does not require any energy storage. UPQC
can be designed to mitigate any sag above a certain magnitude , independent of its duration. This could result in
a device that is able to compete with the uninterruptible power supply (UPS) typically used for the protection of
low power and low voltage equipment. Separately configured DSTATECOM is less flexible than UPQC
In 1998 Aredes stated that universal active power line conditioner, universal active filter and universal power
quality conditioning system are the different names of UPQC. It is a combination of a shunt (Active Power
Filter) and a series compensator (Dynamic Voltage Restorer) connected together via a common DC link
capacitor, which facilitates the sharing of the active power.
In 2012 Khadkikar stated that different topologies of UPQC are multilevel topology, single phase UPQC with
two half-bridge converters, single phase UPQC with three legs, H bridge topology and UPQC is connected
between two independent feeders to regulate the bus voltage of one of the feeders while regulating the voltage

International conference on Science, Technology and Management ICSTM-2015
YMCA, New Delhi (India), 1 Feb 2015 www.conferenceworld.in
1350 | P a g e
across a sensitive load in the other. For simultaneous compensation of voltage and current in adjacent feeders a
new configuration used named multi converter unified power quality conditioner.
In 2002 Basu stated that Series converter of UPQC is most of time in standby mode and conduction losses will
account for the bulk of converter losses during the operation. In this mode, the series injection transformer
works like a secondary shorted current transformer using bypass switches delivering utility power directly to the
load. UPQC without injection transformer has been designed.
In 2011 Khadkikar stated that UPQC is a Custom Power device and consists of combined series active power
filter that compensates voltage harmonics, voltage unbalance, voltage flicker, voltage sag/swell and shunt active
power filter that compensates current harmonics, current unbalance and reactive current.
In 2004 Ghose stated that the generated reference signal is used to produce gate switching signals of the
inverter. The main modulation techniques used in DVR are space vector PWM modulation, dead beat control,
PWM control and hysteresis control. The hysteresis control has the advantages of quick controllability, easy
implementation and variable switching frequency capability. PWM method is widely used for gate signal
generation in custom power application.
In 2008 Khadkikar stated that the shunt APF is usually connected across the loads to compensate for all current
related problems such as the reactive power compensation, power factor improvement, current harmonic
compensation and load unbalance compensation, whereas the series active power filter is connected in a series
with a line through series transformer. It acts as controlled voltage supply and can compensate all voltage
related problems, such as voltage harmonics, voltage sag, voltage swell, flicker etc.
In 2010 Zhilli stated that this converter has both regenerated energy generation and active power filtering
capabilities. An inductance for output filtering of VSI is used to eliminate the harmonic at different frequencies.
The different combinations of L & C filters to attenuate the switching ripple currents.
In 2014 Rojin R.K stated that the compensation performance of shunt and series active filter depends on the
turning on and turning off of semiconductor switches used in shunt and series active filter. To generate the gate
pulses for VSI switches the hysteresis current controller scheme is used. The fuzzy logic controller eliminates
the drawback of PI controller. This system can compensate for voltage sag/swell, harmonics in voltage and
current waveforms and reactive power, for making the load voltage balanced and sinusoidal.
In 2010 Metin Kesler stated that the UPQC system mainly compensate reactive power, voltage and current
harmonics in the load under non-ideal mains voltage and unbalanced load current conditions. In the condition of
unbalanced and nonlinear load current or unbalanced and distorted mains voltage conditions the APF control
algorithms eliminates the impact of distortion and unbalance of load current on the power line, making the
power factor unity. The series APF isolates the load voltages and source voltage and the shunt APF provides
three phase balanced and rated currents for the loads.
In 2008 Fatiha Mekri stated that the UPQC has the ability to compensate sag, unbalanced voltages and current
or voltage harmonics. The function of PAPF is to compensate current harmonics, to maintain the dc link voltage
at
constant level and provide the variable required by the load. The function of SAPF is to mitigate the mains
voltage perturbations. The current and voltage bands can be easily implemented with fuzzy logic to maintain the
modulation frequency nearly constant for each control.

International conference on Science, Technology and Management ICSTM-2015
YMCA, New Delhi (India), 1 Feb 2015 www.conferenceworld.in
1351 | P a g e
In 2011 Ahmet Take stated that control techniques play a vital role in the overall performance of the power
conditioner. The rapid detection of the disturbance signal with high accuracy, fast processing of the reference
signal, and high dynamic response of the controller are the prime requirements for desired compensation. A
fuzzy logic controller has the rapid and effective compensation capability. The computational method is simpler
than other control algorithms of reference extraction.
In 2008 Hind Djeghloud stated that the UPQC topology made up of a hybrid active power filter combination
based on a common DC voltage for series and parallel APF. For both series and parallel APFs, we utilized the
carrier based pulse width modulation PWM. The series APF controller forces load voltage to be sinusoidal,
whereas parallel APF counter harmonic content from supply current.
In 2011 A. Mokhtatour stated that the UPQC has the capability of power flow control as well as power quality
compensation. The controlling of UPQC was done by proper compositions of dqo and Fourier transform
theories in sag, swell, interruption, unbalance and harmonic condition. In control of parallel active filter, active
first order component of load current was determined as reference current for the reactive power compensation
as well as current harmonics. In the reactive power compensation conditions, a PI controller was used for the
control of load voltage phase in equal by source voltage source.
In 2010 Claudio A. Molina stated that under nonlinear and asymmetrical loads an UPQC with a Four-Leg Full-
Bridge inverter (FLFB) used as a shunt active filter is used for improving the power quality. For the generation
of the reference currents for the (FLFB) the instantaneous power theory in the dqz reference frame is used. The
circulation of the active current in the PCC (point common coupling) side results in an optimal active power
flow between the source and the load, but when the load has current harmonics it can produce distortion in the
source current that can be undesirable.
In 2004 V. Khadkikar stated that in future, utility service provides will enforce more strict power factor and
harmonic standards. One of the solutions towards this end is to employ a control technique based on unit vector
templates generation has been proposed for UPQC. With the help of these techniques we can compensate input
voltage harmonics and the current harmonics caused by the non-linear load.
III. CONCLUSION
A comprehensive review on the UPQC for compensation of voltage distortion and minimization of harmonics in
the power supply at distribution level has been studied. UPQC in this context could be useful to compensate
both voltage and current related problems simultaneously. Up to date development in the area of research and
different aspects of UPQC have been briefly addressed. With the help of literature survey clearly identify
particular application, utilization, configuration, and characteristic of the UPQC. It is desirable that the review
on UPQC will serve as a useful reference guide to the researchers working in the area of power quality
enhancement utilizing APFs. The control scheme of UPQC has the advantage of flexibility of selection of the
power quality indices for which reference may be computed. The result of this study may be useful for selective
compensation of different power quality problems and their combinations.

International conference on Science, Technology and Management ICSTM-2015
YMCA, New Delhi (India), 1 Feb 2015 www.conferenceworld.in
1352 | P a g e
REFERENCES
[1] Afonso J, Aredes M, Watanabe E, Martins J, „Shunt Active Filter for Power Quality Improvement”
International Conference UIE 2000,Portugal,1-4 Nov. 2000,pp. 683-691.
[2] Aredes M, Heumann K, and Walandble E H, „An universal active power line conditioner.” IEEE Trans.
Power Del., vol. 13, no. 2, pp. 545-551, Apr. 1998.
[3] Basu M., Das S.P., Dubey G.K., “Experimental investigation of performance of a single phase UPQC for
voltage sensitive and non-linear loads”, Proceedings, Power Electronics and Derive Systems, vol. 1, Oct.
2001
[4] Chen Y, Zha X, Wang J, Liu H, Sun J, and Tang H, „Unified power quality conditioner (UPQC): The
theory, modeling and application,” in Proc. Int. Conf. Power Syst. Technol., 2000.
[5] Chenand Y, Philippe L, “Advanced control methods for the 3-phase unified power quality conditioner,” in
Proc. Power Electron. Spec. Conf., Jun. 20-25, 2004, pp. 4263-4267
[6] Das C, „Passive filters- potentialities and limitations,” IEEE Trans. Ind. Applicat., vol. 40, pp. 232-241,
Feb. 2004.
[7] Djeghloud H, Benalla H, and Bentounsi A, „Supply current and load voltage distortions suppression using
the unified power quality conditioner,” in Proc. Syst., Signals Device, Jul. 20-22, 2008
[8] Forghani M and Afsharnia S, „Online wavelet transform-based control strategy for UPQC control
system,” IEEE Trans. Power Del., vol. 22, no. 1, pp. 481-491, Jan. 2007
[9] Fujita H and Akagi H, „The unified power quality conditioner: the integration of series and shunt-active
filters,” IEEE Trans. Power Electron., vol. 13, no. 2,pp. 315-322, Mar. 1998.
[10] Ghose A and Ledwich G, Power Quality Enhancement Using Custom Power Devices. Boston, MA:
Kluwer,2002.
[11] Ghose A, Jindal A K and Joshi A, “A unified power quality conditioner for voltage regulation of critical
load bus,” in Procc. Power Eng.Soc. Gen. Meet., Jan, 6-10, 2004, pp. 471-476.
[12] Gunther E W and Mehta H, „A survey of distribution system power quality”, IEEE Trans. On Power
Delivery, vol. 10, No.1, pp. 322-329, Jan. 1995.
[13] Han B, Bae B, Kim H, and Baek S, ”Combined operation of unified power quality conditioner with
distributed generation,” IEEE Trans. Power Del., vol. 21, no. 1 pp. 330-338, Jan. 2006.
[14] Jindal A K, Ghose A, and Joshi A, “The protection of sensitive loads from inters harmonic currents using
shunt series active filters,” Elect. Power Syst. Res., vol. 73, pp. 187-196, 2005.
[15] Karimi H, Karimi-Ghartemani M, Iravani M R, and Bakhshai A R, „An adaptive filter for synchronous
extraction on harmonics and distortions,” IEEE Trans. Power Del., vol. 18, no. 4, pp. 1350-1356, Oct.
2003.
International conference on Science, Technology and Management ICSTM-2015
YMCA, New Delhi (India), 1 Feb 2015 www.conferenceworld.in
1353 | P a g e
SECURED OBJECT BASED STORAGE (OBS)
TECHNIQUE IN CLOUD COMPUTING
Suresh Kumar RG1, Dr.K.Seetharamanan
2, Saravanan S
3
1Research Scholar, Vels Universtiy, Pallavaram, Chennai, (India)
2Associate Professor, DDE, Annmalai University, Annamalai Nagar, (India)
3Assistant Professor, Rajiv Gandhi College of Engineering and Technology, Puducherry, (India)
ABSTRACT
Cloud services are becoming more and more portent for people’s life. More or less people’s are requested to
submit or post some personal private information to the cloud by the Internet. When data is being processed,
transformed and stored by the computer system must cache, copy or archive it. People have no knowledge about
these copies and cannot manage them, so these copies may leak their privacy. The privacy can also be leaked
via Service Providers negligence, hackers’ intrusion or some legal actions. The existing system supported three
types of assured delete; expiration time known at on-demand deletion of individual files, file creation and
custom keys for classes of data. It ensures that all copies of the data become unreadable after a specific time,
without any exact action on the part of a user. It also focuses on protecting deleted data with policy-based file
assured deletion. Multiple copies of secret key are stored in various locations which could be hacked by the
attackers. The proposed system contains TTL , time gets elapsed thereby printing the content, deleting original
file, deleting the key. We create an ASO for every key shares which could be stored easily and retrieved for
future purposes .By increasing the length of the key shares we can overcome attacks and overwriting of disks
also takes place.
Keywords: -Cloud, TTL, ASO, Attacks.
I. INTRODUCTION
The US National Institute of Standards and Technology (NIST) define cloud computing as "a model for user
convenience, on demand network access contribute the computing resources (e.g. networks, storage,
applications, servers, and services) that can be rapidly implemented with minimal management effort or service
provider interference" Cloud computing can also be defined as it is a new service, which are the collection of
technologies and a means of supporting the use of large scale Internet services for the remote applications with
good quality of service (QoS) levels [4]. Cloud computing is has many technologies such as Saas i.e. "Software
as a Service", Paas i.e. "Platform as a Service", IaaS i.e. Infrastructure as a Service". Cloud Computing is a
paradigm that focuses on sharing data and computations over a scalable network of nodes. Examples of such
nodes include end user computers, data centers, and Cloud Services. We term such a network of nodes as a
Cloud. Cloud service delivery is divided among three archetypal models and various derivative combinations.

International conference on Science, Technology and Management ICSTM-2015
YMCA, New Delhi (India), 1 Feb 2015 www.conferenceworld.in
1354 | P a g e
The infrastructure (as a Service), respectively defined.
Fig1 -Cloud Service Model
1.1 Cloud Service Models
1.1.2 Cloud Software as a Service (SaaS)
The capability provided to the consumer is to use the provider's applications running on a cloud infrastructure.
The applications are accessible from various client devices through a thin client interface such as a web browser
(e.g., web-based email)
1.1.3 Cloud Platform as a Service (PaaS)
The capability provided to the consumer is to deploy onto the cloud infrastructure consumer-created or acquired
applications created using programming languages and tools supported by the provider(e.g., configurations)
1.1.4 Cloud Infrastructure as a Service (IaaS)
The capability provided to the consumer is to provision processing, storage, networks, and other fundamental
computing resources where the consumer is able to deploy and run arbitrary software, which can include
operating systems and applications.(e.g., host fire walls) [4]
1.2 Cloud Deployment Models
Regardless of the service model utilized (SaaS, PaaS, or IaaS) there are four deployment models for cloud
services, with derivative variations that address specific requirements are depicted [4]
1.2.1 Public Cloud
The cloud infrastructure is made available to the general public or a large industry group and is owned by an
organization selling cloud services.
1.2.2 Private Cloud
The cloud infrastructure is operated solely for a single organization. It may be managed by the organization or a
third party, and may exist on-premises or off premises.
1.2.3 Community Cloud
The cloud infrastructure is shared by concerns (e.g., mission, security several organizations and supports a
specific community requirements, policy, or compliance considerations). It may be managed by the
organizations or a third party and may present on-premises or off-premises.

International conference on Science, Technology and Management ICSTM-2015
YMCA, New Delhi (India), 1 Feb 2015 www.conferenceworld.in
1355 | P a g e
1.2.4 Hybrid Cloud
The cloud infrastructure is a composition of two or more clouds (private, community, or public) that remain
unique entities but are bound together by standardized or proprietary technology that enables data and
application portability.
II. CLOUD SECURITY
Cloud computing and web services run on a network structure so they are open to network type attacks. One of
these attacks is the distributed denial of service attacks. If a user could hijack a server then the hacker could stop
the web services from functioning and demand a ransom to put the services back online. To stop these attacks
the use of syn cookies and limiting users connected to a server all help stop a DDOS attack. Another such attack
is the man in the middle attack. If the secure sockets layer (SSL) is incorrectly configured then client and server
authentication may not behave as expected therefore leading to man in the middle attacks. It is clear that the
security issue has played the most important role in hindering Cloud computing. Without doubt, putting your
data, running your software at someone else's hard disk using someone else's CPU appears daunting to many.
Well-known security issues such as data loss, phishing, and botnet (running remotely on a collection of
machines) pose serious threats to organization's data and software. Moreover, the multi-tenancy model and the
pooled computing resources in cloud computing has introduced new security challenges that require novel
techniques to tackle with. [5]
2.1 Service Provider Security Issues
The public cloud computing surroundings offered by the cloud supplier and make sure that a cloud computing
resolution satisfies organizational security and privacy needs. The cloud supplier to provision the safety controls
necessary to safeguard the these organization's controls information and applications, information and
additionally the proof provided regarding the effectiveness of migrating organizational functions into the cloud.
2.1.1 Identity and Access Management (lAM)
(IAM) features are Authorization, Authentication, and Auditing (AAA) of users accessing cloud services. In any
organization "trust boundary "is mostly static and is monitored and controlled for applications which are
deployed within the organization's perimeter. In a private data center, it managed the trust boundary
encompasses the network, systems, and applications. And it is secured via network security controls including
intrusion prevention systems (IPSs), intrusion detection systems (IDSs), virtual private networks (VPNs), and
multifactor authentication.
2.1.2 Privacy
Privacy is the one of the Security issue in cloud computing. Personal information regulations vary across the
world and number of restrictions placed by number of countries whether it stored outside of the country. For a
cloud service provider, in every jurisdiction a single level of service that is acceptable. Based on contractual
commitments data can store within specific countries for privacy regulations, but this is difficult to verify. In
case of Private and confidential customer's data rising for the consequences and potential costs of mistakes for
companies that handle. But professionals develop the security services and the cloud service privacy practices.

International conference on Science, Technology and Management ICSTM-2015
YMCA, New Delhi (India), 1 Feb 2015 www.conferenceworld.in
1356 | P a g e
An effective assessment strategy must cover data protection, compliance, privacy, identity management, secure
operations, and other related security and legal Issues.
2.1.3 Securing Data in Transmission
Encryption techniques are used for data in transmission to provide the protection for data only goes where the
customer wants it to go by using authentication and integrity and is not modified in transmission. SSL/TLS
protocols are used here. In Cloud environment most of the data is not encrypted in the processing time, but to
process data, for any application that data must be unencrypted. In a fully homomorphism encryption scheme
advance in cryptography, which allows data to be processed without being decrypted. To provide the
confidentiality and integrity of data-in-transmission to and from cloud provider by using access controls like
authorization, authentication, auditing for using resources, and ensure the availability of the Internet-facing
resources at cloud provider.
2.1.4 User Identity
In Organizations, only authorized users across their enterprise and access to the data and tools that they require,
when they require them, and all unauthorized users are blocked for access. In Cloud environments support a
large enterprise and various communities of users, so these controls are more critical. Clouds begin a new level
of privileged users working for the cloud provider is administrators. And an important requirement is privileged
user monitoring, including logging activities. This monitoring should include background checking and physical
monitoring.
2.1.5 Audit and Compliance
An organization implements the Audit and compliance to the internal and external processes that may fallow the
requirements Classification with which it must stand and the requirements are customer contracts, laws and
regulations, driven by business objectives, internal corporate policies and check or monitor all such policies,
procedures, and processes are without fail. In traditional out sourcing relationships plays an important role for
audit and compliance. In Cloud dynamic nature, increase the importance of these functions in platform as-a
service (PaaS), infrastructure-as-a-service (laaS), and software-as -a-service (SaaS) environments. [2]
2.2 Infrastructure Security Issues
Cloud suppliers provide security-related services to a good vary of client types; the security equipped to the
foremost demanding clients is additionally created on the market to those with the smallest amount stringent
necessities. Whereas Infrastructure Security Solutions and product are often simply deployed, they need to a part
of an entire and secure design to be effective. [1]
2.2.1 Securing Data-Storage
In Cloud computing environment data protection as the most important security issue. In this issue, it concerns
include the way in which data is accessed and stored, audit requirements, compliance notification requirements ,
issues involving the cost of data breaches, and damage to brand value. In the cloud storage infrastructure,
regulated and sensitive data needs to be properly segregated. In the service provider's datacenter, protecting data
privacy and managing compliance are critical by using encrypting and managing encryption keys of data in
transfer to the cloud. At the cloud provider, the best practice for securing data at rest is cryptographic encryption

International conference on Science, Technology and Management ICSTM-2015
YMCA, New Delhi (India), 1 Feb 2015 www.conferenceworld.in
1357 | P a g e
and shipping self encrypting is used by hard drive manufacturers. Self-encrypting provides automated
encryption with performance or minimal cost impact. Software encryption is less secure and slower because the
encryption key can be copied off the machine without detection.
2.2.2 Network and Server
Server-Side Protection: Virtual servers and applications, very like their non-virtual counterparts, have to be
compelled to be secured in IaaS clouds, each physically and logically. Example, virtual firewalls are often used
to isolate teams of virtual machines from different hosted teams, like production systems from development
systems or development systems from different cloud-resident systems. Rigorously managing virtual machine
pictures is additionally vital to avoid accidentally deploying pictures underneath development or containing
vulnerabilities. Preventing holes or leaks between the composed infrastructures could be a major concern with
hybrid clouds, as a result of will increase in complexity and diffusion of responsibilities. The supply of the
hybrid cloud, computed because the product of the supply levels for the part clouds, also can be a concern; if
the % availability of anyone part drops, the availability suffers proportionately. In cloud environment,
purchasers want to form certain that every one tenant domains are properly isolated that no probability exists for
data or transactions to leak from one tenant domain into successive.
2.3 End User Security Issues
End Users need to access resources within the cloud and may bear in mind of access agreements like acceptable
use or conflict of interest. The client organization have some mechanism to find vulnerable code or protocols at
entry points like servers, firewalls, or mobile devices and upload patches on the native systems as soon as they
are found.[1]
2.3.1 Security-as-a- service
In Cloud environment the security provided by customers using cloud services and the cloud service providers
(CSPs).Security-as-a-service is a security provided as cloud services and it can provide in two methods: In first
method anyone can changing their delivery methods to include cloud services comprises established information
security vendors. The second method Cloud Service Providers are providing security only as a cloud service
with information security companies.
Fig- 2 Various Point of View of Cloud Security

International conference on Science, Technology and Management ICSTM-2015
YMCA, New Delhi (India), 1 Feb 2015 www.conferenceworld.in
1358 | P a g e
2.3.2 Browser Security
In a Cloud environment, remote servers are used for computation. The client nodes are used for input/output
operations only, and for authorization and authentication of information to the Cloud. A standard Web browser
is platform in-dependent client software useful for all users throughout the world. This can be categorized into
different types: Software as- a-Service (SaaS), Web applications, or Web 2.0. TLS is used for data encryption
and host authentication. [7]
2.4 Authentication
In the cloud environment, the primary basis for access control is user authentication and access control are more
important than ever since the cloud and all of its data are accessible to all over the Internet. Trusted Platform
Module (TPM) is a widely available and stronger authentication than username and passwords. Trusted
Computing Groups (TCG's) is IF-MAP standard about authorized users and other security issue in real-time
communication between the cloud provider and the customer. Other such risks which are marked as high risk in
cloud security are
2.4.1 Loss of Governance
In using cloud infrastructures, the client necessarily cedes control to the Cloud Provider (CP) on a number of
issues which may affect security. At the same time, SLAs may not offer a commitment to provide such services
on the part of the cloud provider, thus leaving a gap in security defenses. [8]
2.4.2 Lock-In
There is currently little on offer in the way of tools, procedures or standard data formats or services interfaces
that could guarantee data, application and service portability. This can make it difficult for the customer to
migrate from one provider to another or migrate data and services back to an in-house IT environment. This
introduces a dependency on a particular CP for service provision, especially if data portability, as the most
fundamental aspect, is not enabled.
2.4.3 Data Protection
Cloud computing poses several data protection risks for cloud customers and providers. In some cases, it may be
difficult for the cloud customer (in its role as data controller) to effectively check the data handling practices of
the cloud provider and thus to be sure that the data is handled in a lawful way. This problem is exacerbated in
cases of multiple transfers of data, e.g. between federated clouds. On the other hand, some cloud providers do
provide information on their data handling practices. Some also offer certification summaries on their data
processing and data security activities and the data controls they have in place, e.g.,SAS70 certification. Data
flowing from the Internet is filled with mal ware and packets intended to lure users into unknowing participation
in criminal activities. [7]
III. LIMITATIONS OF CLOUD COMPUTING
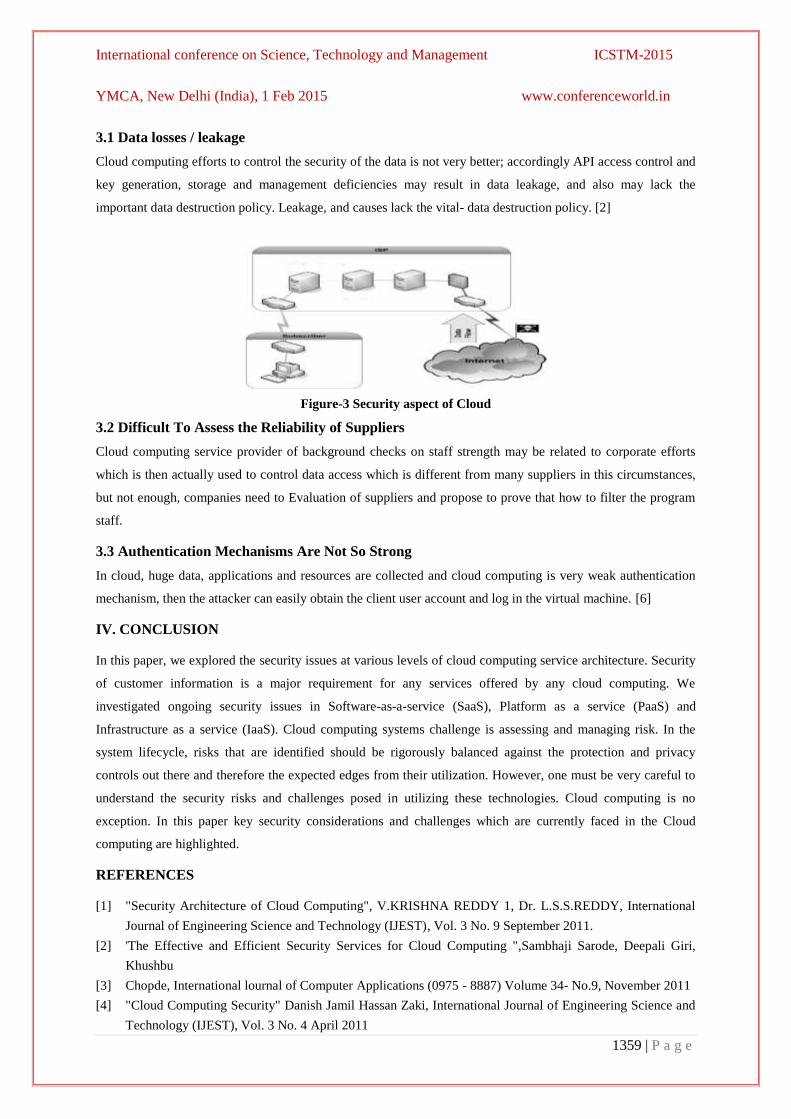
International conference on Science, Technology and Management ICSTM-2015
YMCA, New Delhi (India), 1 Feb 2015 www.conferenceworld.in
1359 | P a g e
3.1 Data losses / leakage
Cloud computing efforts to control the security of the data is not very better; accordingly API access control and
key generation, storage and management deficiencies may result in data leakage, and also may lack the
important data destruction policy. Leakage, and causes lack the vital- data destruction policy. [2]
Figure-3 Security aspect of Cloud
3.2 Difficult To Assess the Reliability of Suppliers
Cloud computing service provider of background checks on staff strength may be related to corporate efforts
which is then actually used to control data access which is different from many suppliers in this circumstances,
but not enough, companies need to Evaluation of suppliers and propose to prove that how to filter the program
staff.
3.3 Authentication Mechanisms Are Not So Strong
In cloud, huge data, applications and resources are collected and cloud computing is very weak authentication
mechanism, then the attacker can easily obtain the client user account and log in the virtual machine. [6]
IV. CONCLUSION
In this paper, we explored the security issues at various levels of cloud computing service architecture. Security
of customer information is a major requirement for any services offered by any cloud computing. We
investigated ongoing security issues in Software-as-a-service (SaaS), Platform as a service (PaaS) and
Infrastructure as a service (IaaS). Cloud computing systems challenge is assessing and managing risk. In the
system lifecycle, risks that are identified should be rigorously balanced against the protection and privacy
controls out there and therefore the expected edges from their utilization. However, one must be very careful to
understand the security risks and challenges posed in utilizing these technologies. Cloud computing is no
exception. In this paper key security considerations and challenges which are currently faced in the Cloud
computing are highlighted.
REFERENCES
[1] "Security Architecture of Cloud Computing", V.KRISHNA REDDY 1, Dr. L.S.S.REDDY, International
Journal of Engineering Science and Technology (IJEST), Vol. 3 No. 9 September 2011.
[2] 'The Effective and Efficient Security Services for Cloud Computing ",Sambhaji Sarode, Deepali Giri,
Khushbu
[3] Chopde, International lournal of Computer Applications (0975 - 8887) Volume 34- No.9, November 2011
[4] "Cloud Computing Security" Danish Jamil Hassan Zaki, International Journal of Engineering Science and
Technology (IJEST), Vol. 3 No. 4 April 2011

International conference on Science, Technology and Management ICSTM-2015
YMCA, New Delhi (India), 1 Feb 2015 www.conferenceworld.in
1360 | P a g e
[5] Peter Mell, and Tim Grance, "Draft NIST Working Definition of Cloud Computing," 2009
[6] http://csrc.nist.gov/ groups/SNS/cloud-computing
[7] "Cloud Computing Security Issues and Challenges", Kuyoro S. 0.Ibikunle F., Awodele O.
[8] Catteddu D. 2010 Cloud Computing. [Online] Available from: http://w.enisa.europa. eu/
act/rm/files/deliverables
[9] /c1oud-computing risk- assessment [Accessed 26th April 2010]
[10] http://www.maintec.comlblog/find-your-way-to-securecloud-part-2

International conference on Science, Technology and Management ICSTM-2015
YMCA, New Delhi (India), 1 Feb 2015 www.conferenceworld.in
1361 | P a g e
REDUCING POWER DISSIPATION IN NETWORK–ON-
CHIP
J.Sowmya1, B.Sivasankari
2, P.Poongodi
3
1,2 Department of ECE, SNS College of Technology, Coimbatore, (India).
3Department of ECE,VSB Engineering College, Coimbatore, (India).
ABSTRACT
As technology get smaller, the power dissipated by the links of a network-on-chip (NoC) starts to compete with the
power dissipated by the other elements of the communication subsystem, namely, the routers and the network
interfaces (NIs). The proposed encoding technique whose goal is to reduce the power dissipated by point-to-point
inter-router links of a NoC. The proposed schemes are general and transparent with respect to the underlying NoC
fabric it does not require any modification of the routers and link architecture. Experiments carried out on both
synthetic and real traffic scenarios show the effectiveness of the proposed schemes.The main advantage is to reduce
power dissipation and energy consumption without any significant performance degradation and with less area
overhead in the NI.
Keywords—Coupling Switching Activity, Data Encoding, Interconnection On Chip, Low Power,
Network-On-Chip (Noc), Power Analysis.
I INTRODUCTION
As the number of IPs used to implement the functionalities demanded by the current systems-on-a-chip
(SoCs) increases, the role played by the on-chip interconnection system becomes more and more important. The
International Technology Roadmap for Semiconductors depicts the on-chip communication issues as the
limiting factor, for performance and power consumption in current and next generation SoCs. Network-on-Chip
(NoC) is generally viewed as the ultimate solution for the design of modular and scalable communication
architectures. Nowadays, the on-chip communication issues are as relevant as, and in some cases more relevant
than, the computation related issues. In fact, the communication subsystem increasingly impacts the traditional
design objectives, including cost, performance, power dissipation, energy consumption, reliability, etc.
A NoC-based communication infrastructure promises flexibility in network topology, the support of
advanced routing algorithms, flow-control and switching techniques, and the possibility of guarantying
quality-of-service requirements. The basic elements which forms a NoC based interconnect are network interfaces
(NIs), routers, and links. As technology shrinks, the power dissipated by the links is as relevant as (or more relevant
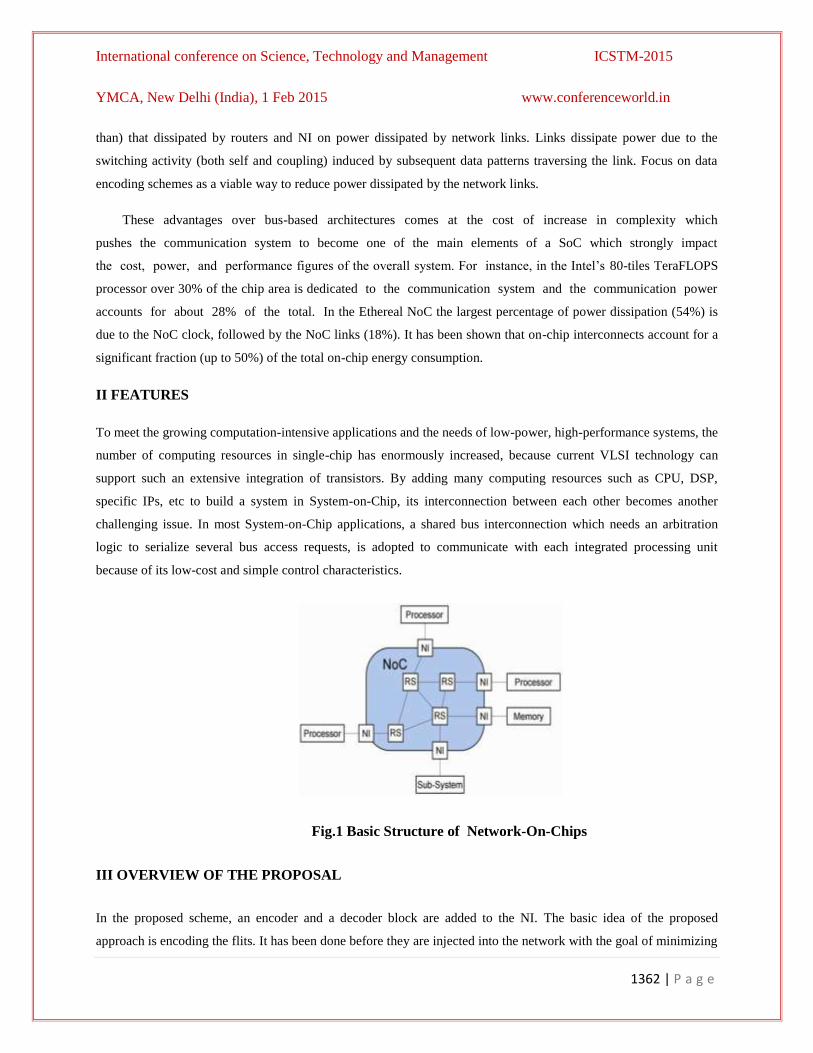
International conference on Science, Technology and Management ICSTM-2015
YMCA, New Delhi (India), 1 Feb 2015 www.conferenceworld.in
1362 | P a g e
than) that dissipated by routers and NI on power dissipated by network links. Links dissipate power due to the
switching activity (both self and coupling) induced by subsequent data patterns traversing the link. Focus on data
encoding schemes as a viable way to reduce power dissipated by the network links.
These advantages over bus-based architectures comes at the cost of increase in complexity which
pushes the communication system to become one of the main elements of a SoC which strongly impact
the cost, power, and performance figures of the overall system. For instance, in the Intel‟s 80-tiles TeraFLOPS
processor over 30% of the chip area is dedicated to the communication system and the communication power
accounts for about 28% of the total. In the Ethereal NoC the largest percentage of power dissipation (54%) is
due to the NoC clock, followed by the NoC links (18%). It has been shown that on-chip interconnects account for a
significant fraction (up to 50%) of the total on-chip energy consumption.
II FEATURES
To meet the growing computation-intensive applications and the needs of low-power, high-performance systems, the
number of computing resources in single-chip has enormously increased, because current VLSI technology can
support such an extensive integration of transistors. By adding many computing resources such as CPU, DSP,
specific IPs, etc to build a system in System-on-Chip, its interconnection between each other becomes another
challenging issue. In most System-on-Chip applications, a shared bus interconnection which needs an arbitration
logic to serialize several bus access requests, is adopted to communicate with each integrated processing unit
because of its low-cost and simple control characteristics.
Fig.1 Basic Structure of Network-On-Chips
III OVERVIEW OF THE PROPOSAL
In the proposed scheme, an encoder and a decoder block are added to the NI. The basic idea of the proposed
approach is encoding the flits. It has been done before they are injected into the network with the goal of minimizing

International conference on Science, Technology and Management ICSTM-2015
YMCA, New Delhi (India), 1 Feb 2015 www.conferenceworld.in
1363 | P a g e
the self-switching activity and the coupling switching activity in the links traverse by the flits. The encoder encodes
the outgoing flits of the packet such that the power dissipated by the inter-router point-to-point link is minimized,
except for the header flit. In fact, self-switching activity and coupling switching activity are responsible for link
power dissipation. This end-to-end encoding technique takes advantage of the pipeline nature of the wormhole
switching technique. Since the same sequence of flits passes through all the links of the routing path, the encoding
decision taken at the NI may provide the same power saving for all the links.
IV PROPOSED ENCODING SCHEME
In this section present the proposed encoding technique whose goal is to reduce the power dissipated by point-to-
point inter-router links of a NoC. Before start to discuss the proposed technique, briefly analyze the different
contributions which determine the power dissipated by a link.
Table 1. How Transition Mutate if Data is Inverted
For each partition, the first line represents the values at time t−1, whereas the second line the values at time t. For
instance, looking at the first partition which reports Type I transitions, the first column 00 → 01 indicates that, on
time slot t, lines I and i+ 1 of a link were 0 and 0, respectively, and in the next time slot t they switch to 0 and 1,
respectively.
As can be observed from Table 1, Type I transitions still remain Type I transitions if the flit is inverted. Type II and
Type III transitions will mutate in Type IV transitions if the flit is inverted. Type IV transitions mutate either in
Time Normal Inverted
t-1
t
Type I
00 00 11 11
01 10 01 10
Type I
00 00 11 11
10 01 10 01
t-1
t
Type II
01 10
10 01
Type II
01 10
01 10
t-1
t
Type III
00 01
11 00
Type III
00 11
00 11
t-1
t
Type IV
00 11 01 10
00 11 01 10
T4* | T4
**
Type IV
00 11 01 10
11 00 10 01
T3 | T2

International conference on Science, Technology and Management ICSTM-2015
YMCA, New Delhi (India), 1 Feb 2015 www.conferenceworld.in
1364 | P a g e
Type II or Type III transitions. In particular, transitions indicated as T∗4 in the table mutate in Type III transitions
whereas that indicated with T∗∗4 mutate in Type II transitions. Similarly, it is simple to find that T‟0→1 = T0→0.
4.1 Scheme I-Encoder
In scheme I, we focus on reducing the numbers of Type I transitions (by converting them to Types III and IV
transitions) and Type II transitions (by converting them to Type I transition). The scheme compares the current data
with the previous one to decide whether odd inversion or no inversion of the current data can lead to the link power
reduction.
4.1.1 Power Model
The dynamic power consumed by the interconnectors and drivers is given by:
P = [T0→1 (Cs +Cl) +TcCc] V2ddFck (1)
Where, Vdd is the supply voltage, Fck is the clock frequency, Cs is the self-capacitance (which includes the parallel-
plate capacitance and the fringe capacitance), Cl is the load capacitance and Cc is the coupling capacitance. T0→1 and
Tc are the average number of effective transitions per cycle for Cs and Cc respectively. They are computed as follows.
T0→1 counts the number of 0 → 1 transitions in the bus in two consecutive transmissions. Tc counts the correlated
switching between physically adjacent lines. Precisely, it can enumerate four types of coupling transitions as follows.
A Type I transition occurs when one of the lines switches while the other stays unchanged. In a Type II transition on
line switches from low to high and the other from high to low. A Type III transition occurs when both lines switch
simultaneously. Finally, in a Type IV transition both lines do not switch. The effective switched capacitance varies
from type to type.
Thus, the coupling transition activity Tc is a weighted sum of the different type of coupling transition contributions.
Tc = k1T1 +k2T2 +k3T3 +k4T4 (2)
Where the Ti, i = 1,2,3,4, are the average number of transition type i and ki are weights. Assume k1 = 1, k2 = 2 and k3
= k4 = 0. That is, k1 is assumed as reference for other types of transition. The effective capacitance in Type II
transition is usually twice that of a Type I transition. In Type III transition, as both signal switch simultaneously, Cc is
not charged (here assume that there are no misalignment between the two transitions). Finally, in Type IV transition
there is no dynamic charge distribution over Cc. Based on this, Equation (1) can be expressed as follows:
P = [T0→1 (Cs +Cl) + (T1 +2T2) Cc] V2ddFck (3)
The proposed encoded technique primary goal is to minimize T1 and T2, and to minimize T0→1 as secondary goal.
Looking at equation (1) and (2) have following expression

International conference on Science, Technology and Management ICSTM-2015
YMCA, New Delhi (India), 1 Feb 2015 www.conferenceworld.in
1365 | P a g e
P ∝T0→1Cs+ (k1T1 + k2T2 + k3T3 + k4T4) Cc (4)
If the data (from now on, the flit) is inverted, the link power consumption will be
P‟∝T‟0→1Cs+ (k1T‟1 + k2T‟2 + k3T‟3 + k4T‟4) Cc (5)
Thus, equation (5) can be expressed in function of T1, T2, T3, T∗4 and T∗∗
4 as
P‟∝T0→0Cs + [k1T1 + k2T∗∗4 + k3T∗4 + k4(T2T3)]Cc. (6)
It is convenient to invert the flit before transmission if P >P‟. Taking equation (4) k1 = 1, k2 = 2, k3 = k4 = 0 and
Cc/Cs = 4, we obtain the following invert condition:
T0→1 + 8T2 > T0→0 + 8T∗∗4 (7)
In conclusion, the proposed encoding scheme simply inverts the flit before its transmission if and only if the invert
condition equation (7) is satisfied. In the next subsection, we assess the hardware implications of implementing this
encoding scheme into the network interface in a NoC based system. Looking again at the invert condition equation
(7) and considering a link width less than or equal to 8 bit, if T2 is greater than T∗∗4 then the invert condition is
satisfied. Use this algorithm as the base for the implementation of the encoding logic.
The proposed encoding architecture, which is based on the odd invert condition defined is shown in Fig.2. Consider
a link width of w bits. If no encoding is used, the body flits are grouped in w bits by the NI and are transmitted via
the link.
In our approach, one bit of the link is used for the inversion bit, which indicates if the flit traversing the link has
been inverted or not. More specifically, the NI packs the body flits in w − 1 bits [Fig.2]. The encoding logic E,
which is integrated into the NI, is responsible for deciding if the inversion should take place and performing the
inversion if needed.
Fig.2 Encoder Architecture Scheme I
The generic block diagram shown in Fig.2 is the same for all three encoding schemes proposed and only the block E
is different for the schemes.To make the decision, the previously encoded flit is compared with the current flit being
transmitted. This latter, whose w bits are the concatenation of w − 1 payload bits and a “0” bit, represents the first

International conference on Science, Technology and Management ICSTM-2015
YMCA, New Delhi (India), 1 Feb 2015 www.conferenceworld.in
1366 | P a g e
input of the encoder, while the previous encoded flit represents the second input of the encoder [Fig.3].The w −1 bits
of the incoming (previous encoded) body flit are indicated by Xi (Yi), i = 0, 1, . . . , w − 2.
Fig.3 Internal View of the Encoder Block
The wth
bit of the previously encoded body flit is indicated by inv which shows if it was inverted (inv = 1) or left as
it was (inv = 0). In the encoding logic, each Ty block takes the two adjacent bits of the input flits (e.g., X1X2Y1Y2,
X2X3Y2Y3, X3X4Y3Y4, etc.) and sets its output to “1” if any of the transition types of Ty is detected
V RESULTS AND DISSCUSSION
Fig.4 shows the area, delay, and power overhead due to the encoding/decoding logic. The decoder is the same for
all the techniques. It simply inverts the input data if the inv bit is asserted. Since its complexity is negligible as
compared with that of the encoders, omit it from this analysis. Assume 12-bit link and for each encoder type E
consider three different versions named E4, E8 and E12.
Fig.4 RTL View of Proposing System

International conference on Science, Technology and Management ICSTM-2015
YMCA, New Delhi (India), 1 Feb 2015 www.conferenceworld.in
1367 | P a g e
Fig.5 shows the output waveform of Scheme-I Encoder .In this 10 bit X0 – X9 is given as input. This input is given
to Ty block in which D latch and XOR operation is performed. The output of Ty is given as input to majority voter.
In this majority voter majority number of bit is determined (may be „0‟ or „1‟). Finally XOR operation is performed
and the output obtained is denoted as Z0 – Z9.
Fig.5 Output Waveform of Scheme-I Encoder
VI CONCLUSION AND FUTURE WORK
In this project a new data encoding technique which allows reducing the power dissipated by the links of a NoC and
contributed by both the self-switching activity and the coupling switching activity. The proposed data encoding
technique (SCS) exploits the wormhole switching and operates end-to-end. when data encoding is used as compared
to the case in which no data encoding is used. Of course, the analysis takes into consideration the overhead both in
area and power and the delay due to the insertion of the encoding and decoding logic into the network interface.
compared SCS against the bus-invert coding (BI) and the coupling driven bus invert coding (CDBI) as they have
sthe highest potential for power saving while still represent a feasible implementation for on-chip communication
found that SCS outperforms BI and CDBI both in terms of power dissipation and energy consumption. Precisely, for
a set of representative data stream, obtained up to 26% power reduction and up to 9% energy reduction
REFERENCES
[1] W. Wolf, A. Jerraya, and G. Martin, “Multiprocessor system-on-chip MPSoC technology,” IEEE Trans.
Comput.-Aided Design Integr. Circuits Syst., vol. 27, no. 10, pp. 1701–1713, Oct. 2008.
[2] L. Benini and G. De Micheli, “Networks on chips: A new SoC paradigm,” Computer, vol. 35, no. 1, pp. 70–78,
Jan. 2002.

International conference on Science, Technology and Management ICSTM-2015
YMCA, New Delhi (India), 1 Feb 2015 www.conferenceworld.in
1368 | P a g e
[3] C. P. Fan and C. H. Fang, “Efficient RC low-power bus encoding methods for crosstalk reduction,” Integr.
VLSI J., vol. 44, no. 1, pp. 75–86, Jan. 2011.
[4] S. R. Vangal, J. Howard, G. C. Roberts and S. Y. Borkar, “TeraFLOPS processor in 65-nm CMOS,” IEEE J.
Solid-State Circuits, vol. 43, no. 1, pp. 29–41, Jan. 2008.
[5] S. Murali, C. Seiculescu, L. Benini, and G. De Micheli, “Synthesis of networks on chips for 3D systems on
chips,” Jan. 2009, pp. 242–247.
[6] C. Seiculescu, S. Murali, L. Benini, and G. De Micheli, “A tool for networks on chip topology synthesis for 3-D
systems on chips,” in Proc. IEEE vol. 29, no. 12, pp. 1987–2000, Dec. 2010.
[7] M. R. Stan and W. P. Burleson, “Bus-invert coding for low-power I/O,” IEEE Trans.(VLSI) Syst., vol. 3, no. 1,
pp. 49–58, Mar. 1995.
[8] S. Ramprasad, N. R. Shanbhag, and I. N. Hajj, “A coding framework for low-power address and data busses,”
IEEE Trans. Very Large Scale Integr. (VLSI) Syst., Jun. 1999.

International conference on Science, Technology and Management ICSTM-2015
YMCA, New Delhi (India), 1 Feb 2015 www.conferenceworld.in
1369 | P a g e
DOES BRAND PERSONALITY HAVE AN INFLUENCE
ON CUSTOMER ENGAGEMENT USING FACEBOOK?
S. Sharma1, E. Nagpal
2
1,2 University Business School, Panjab University, (India)
ABSTRACT
Marketers have long been debating over the significant role played by Brand Personality in engaging
customers, especially since the advent of Web 2.0. Brands have distinguishing human like characteristics which
form their personality that in turn helps connect with the customer. However, not many studies have been found
on the subject, particularly in India. The aim of this study was to investigate the relationship between Brand
Personality and Customer Engagement in the Restaurant Industry using the Social Media platform of Facebook.
The research was also extended to study the impact of Non-Personality attributes on Customer Engagement. An
empirical analysis was conducted after collecting data from 100 respondents from the tricity- Chandigarh,
Panchkula, Mohali. The findings suggested that both Personality and Non-Personality attributes have a
significant impact on Customer Engagement. However, the Non-Personality Attributes were found to have a
stronger impact as compared to Brand Personality. In the end, the paper discusses key managerial implications
of the study conducted.
Keywords: Brand Personality, Customer Engagement, Social Media, Restaurant Industry
I INTRODUCTION
In traditional marketing, brands used to communicate with customers by conventional advertising ways such as
a print ad or a corporate website. With the dawn of the era of Web 2.0, this has radically changed to a two-way
interaction between the customers and the brands and amongst customers themselves. This is a double edged
sword for brands, if positive word travels through happy customers, it can make the brand a hero, on the other
hand, if negative feedback is given by one disgruntled customer, it can reach out to millions overnight and
completely ruin the brand. The emergence of new media provides businesses with an opportunity to start a two-
way digital conversation with the audiences and makes it almost effortless for an individual customer to talk
back and also talk to each other [1]. “Engage or die” is the new marketing catchphrase, which emerged as a
result of the rise of social media in the past few years [2]. New Media like Facebook, Twitter, YouTube,
MySpace, etc comprise Web2.0 that assists the two-way interaction. Thus, a dire need of understanding the
various opportunities presented by this new media was felt amongst academicians and practitioners.

International conference on Science, Technology and Management ICSTM-2015
YMCA, New Delhi (India), 1 Feb 2015 www.conferenceworld.in
1370 | P a g e
The Restaurant Industry in India is chiefly driven by the young population aged 15-44 years. It has grown at a
CAGR of 6.6% from FY‟2008 to FY‟2013 [3]. Many international chains like KFC, McDonald‟s, Dominos,
Pizza Hut have dominated the organized restaurant market in the country for a long time now. Restaurant Social
Media Index (RSMI) was created and developed by DigitalCoCo, an agency that builds restaurant brands
through social media, apps, and other digital initiatives aimed at creating a trusted source for return on
investment for social media in restaurant and hospitality [4]. On analyzing the social footprints of restaurants,
the engagement of customers is calculated and consumer behaviour is predicted. According to this Index, top
250 restaurants brands were enlisted in Quarter 2 of 2014. It consisted of brands that are rocking their overall
social footprint via excellent engagement levels with their customers through social media. Starbucks, Subway,
McDonald‟s were amongst the top performers.
Branding is an imperative measure to succeed in today‟s world of business. It does not just mean giving a brand
name or indicating that such a product or service has been stamped with the mark of an organization, but
expands to being a strategy which organizes the market driven by an idea. Marketing academicians and
practitioners attempt to differentiate their brands from others and to make their brands desirable for consumers
based on functional (e.g. price, quality and warranty) and emotional approaches (e.g. brand personality
perceptions) [5]. Brand Personality is used as one of such tools to convey consumers‟ emotional responses to a
brand. It also helps in distinguishing it from others beyond attractive functional characteristics. With the
explosion of brands in different industries of the Indian market, brands of distinguishing features are available
based on our choice, taste and culture. From the car we drive to the food we take, we demand varying attributes
in every brand. These personalities that the brands hold make them appear in a different way in different
situations. A successful brand is the one which creates a long term bonding with the consumers by evoking a
sense of interest with its personality. Competition is increasing swiftly; changes do challenge the status quo and
branding needs to be regularly adapted to stay efficient and effective [6]. The companies should diligently work
towards sustaining the bonding created by the brand‟s personality and image with the customers as the long term
vision of a company is not just to generate a single sale contract but to be on the top of the customer‟s recall list.
The concept of brand personality plays an important role in the successful management of brands. A company
establishes better relationships with its customers by using personality directed brand management. Hence, it
becomes crucial to examine the significance of brand personality in customer engagement and eventually in the
decision making of the marketers as an essential variable for branding success.
II REVIEW OF LITERATURE
2.1 Brand Personality
The American Marketing Association (AMA) defines brand as “a name, term, sign, symbol, or design, or a
combination of them, intended to identify the goods and services of one seller or group of sellers and to
differentiate them from those of competitors”. According to De Chernatony and MacDonald [7], a brand goes
beyond physical constituents and what it stands for, it has some additional attributes which although maybe
intangible but are still important to consumers consideration. “The set of human characteristics associated with a

International conference on Science, Technology and Management ICSTM-2015
YMCA, New Delhi (India), 1 Feb 2015 www.conferenceworld.in
1371 | P a g e
brand, which makes it unique, compared to other brands” [8]. “A brand‟s personality embodies all of the
qualities it has to offer over and above its primary characteristics and its functional purpose” [9]. The notions
that brands have personality and that the relationship between consumers and brand personality is very
significant for success are regarded as the most important concepts in the fields of marketing and advertising
[10]. There are various scales used to measure Brand Personality like Aaker‟s five dimensions sincerity,
excitement, competence, sophistication and ruggedness [11] based on the "Big Five" human personality
dimensions, [12], [13] 12 item scale to operationalize personality dimensions etc. Companies Nowadays direct
all the marketing activities at making consumers believe and recognize a brand personality, and reinforcing the
relationship between the brand and the consumer [14]. Thus, we can say that brand personality is something
which helps the consumers in relating to a particular brand. Besides all the functional benefits derived from the
product, the brand personality adds value to the brand in a way that improves its overall image. It is a way a
brand would speak or behave. A strong and positive personality of a brand can thus, help in enhancing the image
of the brand in the eyes of the customers and make them more loyal towards a specific brand. All these features
make brand personality a very useful tool for the marketers in today‟s competitive world of business.
2.2 Customer Engagement
Bowden [15] presents customer engagement as a sequential psychological process that customers move through
to become loyal towards a brand. This process is suggested to model the mechanisms by which loyalty may be
developed and maintained for two different types of customers – new and existing. The final goal is an intense,
active relationship between the brand and the customer, part of which is engagement with the brand expressed
as customer eagerness to talk about the brand, learn about it, and exhibit its use [16]. The concept of
engagement is multidimensional and comprises the expressions of emotional, behavioural and cognitive
engagement specific to this particular context [17]. Cheung et al. [18] have initiated a study exploring customer
engagement in online social platforms. They have defined it as “the level of a customer‟s physical, cognitive,
and emotional presence in connections with a particular online social platform”. Thus, Customer Engagement is
a two-way interaction between customers with one another and with a brand. The initiative for engagement can
either be taken by the consumer or by the company via an online or an offline media. Online Customer
Engagement is different from offline Customer Engagement. It helps in customer awareness, customer
acquisition, customer satisfaction, brand loyalty and electronic word-of-mouth. Kevin Ertell [19] elaborated on
the concept of „Customer Engagement Cycle‟ in 2010. He said that this cycle comprised of Customer
Awareness, Customer Acquisition, Customer Satisfaction, Customer Conversion, Customer Retention and
finally, Customer Referral. All these components combine to form the complete Customer Engagement Cycle.
Each of these components, when aimed at individually, result in successfully engaging the customer. The
Economist Intelligence Unit [20] establishes the importance of customer engagement in the following statement.
“Companies are now realizing that engagement is also a more strategic way of looking at customer and
stakeholder relationships. In this emerging approach, engagement refers to the creation of a deeper, more
meaningful connection between the company and the customer, and one that endures over time. Engagement is
also seen as a way to create customer interaction and participation.”

International conference on Science, Technology and Management ICSTM-2015
YMCA, New Delhi (India), 1 Feb 2015 www.conferenceworld.in
1372 | P a g e
III RESEARCH OBJECTIVE
To provide valuable insight into the relationship between Brand Personality and Customer Engagement in the
Restaurant Industry using the Social Media platform of Facebook and offer a foundation for future research on
the aforementioned subject. This study empirically tests the association and impact between the three variables,
viz-a-viz Brand Personality, Non-Personality Attributes and Customer Engagement. Consequently, it throws
light on whether Brand Personality or Non-Personality Attributes or both affect customers‟ engagement on
social media.
IV RESEARCH METHODOLOGY
The research is descriptive in nature. It aims at investigating the relationship and impact of brand personality
and non-personality attributes on customer engagement with restaurant brands on social media.
4.1 Hypotheses
H1: There is a significant relationship of Brand Personality with Customer Brand Engagement through
Facebook Fan Page.
H2: There is a significant impact of Brand Personality on Customer Brand Engagement through Facebook Fan
Page.
H3: There is a significant relationship of Non-Personality Brand Attributes with Customer Brand Engagement
through Facebook Fan Page.
H4: There is a significant impact of Non-Personality Brand Attributes on Customer Brand Engagement through
Facebook Fan Page.
4.2 Sample Design And Sample Size
A total of 100 respondents were contacted for carrying out the research out of which those that were completely
filled and usable were 86. Purposive sampling was used for collecting primary data in order to arrive at the
findings of the research. The duration of data collection spanned over about 40 days during September- October
2014. To collect data, prospective customers were approached at various restaurant outlets in and around the
tricity: Chandigarh, Panchkula, Mohali.
4.3 Research Instrument
A self-administered questionnaire was developed for the purpose of collecting primary data to arrive at
empirically tested results. The questionnaire contained four sections as under:
i. Demographics
ii. Brand Personality

International conference on Science, Technology and Management ICSTM-2015
YMCA, New Delhi (India), 1 Feb 2015 www.conferenceworld.in
1373 | P a g e
iii. Non Personality Attributes
iv. Customer Engagement
The questionnaire contained 35 items to record responses in order to study the relationship and impact of brand
personality and non personality attributes on customer engagement. Therefore, brand personality and non
personality attributes are the independent variables, whereas, customer engagement is the dependent variable in
this research.
4.4 Research Tools
SPSS 22 Software is used to conduct analysis on the data collected. Statistical tools: Correlation and Regression
Analysis are used to analyze data and derive useful findings so as to arrive at conclusions which will have
practical managerial implications.
4.5 Analysis of Data
H1: There is a significant relationship of Brand Personality with Customer Brand Engagement through
Facebook Fan Page.
Variables N Sig. (2-tailed) Pearson Correlation
(r)
Brand Personality 86
.000 .601
Customer Engagement 86
From the table above, we can see that there is a positive correlation between Brand Personality and Customer
Engagement with r=0.601. Hence, H1 is accepted.
H3: There is a significant relationship of Non-Personality Brand Attributes with Customer Brand Engagement
through Facebook Fan Page.
Variables N Sig. (2-tailed) Pearson Correlation
(r)
Non Personality Attributes 86
.000 .694
Customer Engagement 86
From the table above, we can see that there is a positive correlation between Non Personality Attributes and
Customer Engagement with r=0.694. Hence, H3 is accepted.

International conference on Science, Technology and Management ICSTM-2015
YMCA, New Delhi (India), 1 Feb 2015 www.conferenceworld.in
1374 | P a g e
H2: There is a significant impact of Brand Personality on Customer Brand Engagement through Facebook Fan
Page.
H4: There is a significant impact of Non-Personality Brand Attributes on Customer Brand Engagement through
Facebook Fan Page.
Regressio
n Model
Variables R R Square Adjusted R
Square
F Sig.
1 Brand Personality and
Customer Engagement
.601 .362 .354 47.602 .000
1 Non Personality
Attributes and Customer
Engagement
.694 .482 .476 78.214 .000
The results of the regression analysis show that both, Brand Personality and Non Personality Attributes have a
significant impact on Customer Engagement. However, the impact of Non Personality Attributes is more as
compared to the Brand‟s Personality. The values of adjusted R2 have come out to be 0.354 and 0.476
respectively. Thus we can say that 35.4% change in Customer Engagement can be explained by the Brand‟s
Personality whereas, 47.6% change Customer Engagement can be explained by the Non Personality Attributes
of the brand.
V CONCLUSION
The study conducted was aimed at exploring the relationship between Brand Personality and Customer
Engagement in the Restaurant Industry using Facebook Fan Page. An effort was made to make the research
more comprehensive by studying the impact of Non-Personality Attributes also. The results of the empirical
analysis indicate that in fact, Non Personality Attributes impact Customer Engagement more than the Brand‟s
Personality. However, both were found to have a positive impact on Customer Engagement. This explains the
importance of creating a brand image in order to engage customers aggressively on social media, which in turn
will help bring in more and more customers to the restaurants due to the connect they feel with the brand. As
almost every restaurant seeks to provide similar quality standards, the marketers need to focus on the brand
image to make the restaurant unique and attractive. Consumers seem to prefer brands with distinctive
personalities, with which they can identify themselves.
VI MANAGERIAL IMPLICATIONS
The results of the study substantially prove that both Brand Personality and Non Personality Attributes affect
Customer Engagement. They help in giving insights on how restaurateurs can take advantage of social media in
order to establish, develop and maintain customer relationship by. The results contribute to the existing literature
and make valuable suggestions for future research. For Marketing Managers, the results carry specific
significance as they help in differentiating the personality profile of each brand. The findings can be used to
promote brands according to their Brand Personality by relating it to the target audience.
Social media is growing exponentially in India, and young people are connecting with it on a very regular basis.
This is proving to be a great platform for a two-way communication between the brand and the customers. Thus,
the opportunities presented by this new media in terms of engaging the socially present and aware customer are

International conference on Science, Technology and Management ICSTM-2015
YMCA, New Delhi (India), 1 Feb 2015 www.conferenceworld.in
1375 | P a g e
tremendous. However, the highly dynamic nature of the industry makes further research into the subject very
recommendable to identify new customer engagement patterns.
REFERENCES
[1] Deighton, J., & Kornfeld, L, Interactivity's unanticipated consequences for marketers and marketing, Journal
of Interactive Marketing, 23(1), 4-10, 2009.
[2] Nelson-Field, K., & Taylor, J., Facebook fans: A fan for life? Admap, 25-27, 2012.
[3] India Restaurant Market Outlook to 2018 Report, Ken Research Private Limited, 2013.
[4] RSMI, http://rsmindex.com/about-us/.
[5] Keller, Kevin Lane, “Conceptualizing, Measuring, and Managing Customer-Based Brand Equity,” Journal of
Marketing, 57, 1-22, 1993.
[6] Randall, G., Branding – A Practical Guide to Planning, Organising and Strategy. London, UK: Kogan Page
Limited, 1997.
[7] De Chernatony, L. and McDonald, M. Creating Powerful Brands in Consumer, Service and Industrial
Markets, 3rd ed, Oxford, Butterworth-Heinemann, 2003.
[8] Aaker David A., Building Strong Brands, New York: Free Press, 1996.
[9] Patterson, Maurice, “Re-Appraising the Concept of Brand Image,” Journal of Brand Management, 6 (6),
409-26, 1999.
[10] Freling, Traci H. and Lukas P. Forbes, “An Empirical Analysis of the Brand Personality Effect,” Journal Of
Product & Brand Management, 14, 404-413, 2005.
[11] Aaker, Jennifer L., “Dimension Of Brand Personality,” Journal of Marketing Research, 34, 347-356, 1997.
[12] Briggs, Steven, "Assessing the Five-Factor Model of Personality Description,” Journal of Personality,
60 (2), 253-93, 1992.
[13] Geuens, M, Weijters, B., & De Wulf, K. A New Measure of Brand Personality. International Journal of
Research in Marketing, 26, (2), 97-107, 2009.
[14] Govers, P.C.M. and Schoormans, J.P.L., “Product personality and its influence on consumer preference”,
Journal of Consumer Marketing, Vol. 22 No. 4, pp. 189-97, 2005.
[15] Bowden, J. L.-H., The Process of Customer Engagement: a Conceptual Framework, Journal of Marketing
Theory & Practice, 17(1), 63-74, doi: 10.2753/mtp1069-6679170105, 2009.
[16] Goldsmith, R.E., Brand Engagement and Brand Loyalty, In Avinash Kapoor & Chinmaya Kulshrestha
(Eds.), Branding and Sustainable Competitive Advantage: Building Virtual Presence (pp. 121-135),
Hershey, PA: IGI Global, 2011.
[17] Malciute, J., Customer Brand Engagement on Online Social Media Platforms: A conceptual model and
empirical analysis, August 2012.
[18] Cheung, C., Lee, M., & Jin, X., Customer Engagement in an Online Social Platform: A Conceptual Model
and Scale Development, ICIS 2011 Proceedings. , Paper 8, 2011.
[19] Ertell, K., Retail: Shaken Not Stirred, http://www.retailshakennotstirred.com/retail- shaken-not
stirred/2010/01/the-missing-link-in-the-customer-engagement-cycle.html), 2010,Retrieved on May 4,
2014.
[20] Kekic, L., The Economist Intelligence Unit, 2007.

International conference on Science, Technology and Management ICSTM-2015
YMCA, New Delhi (India), 1 Feb 2015 www.conferenceworld.in
1376 | P a g e
PLATINUM (II) AND PALLADIUM (II) DERIVATIVES
OF HETEROCYCLIC SULPHONAMIDE IMINES:
SYNTHESIS, CHARACTERIZATION AND THEIR
BIOLOGICAL ASPECTS
Bhavana Gupta
1, Renu Khedar
2 and Nighat Fahmi
3
1,2,3 Department of Chemistry, University of Rajasthan, Jaipur 302004, (India)
ABSTRACT
The present article describes the synthesis and characterization of a new series of Pt (II) and Pd(II) complexes
with two N∩O donor ligands, salicylaldehyde sulphathiazole and salicylaldehyde sulphaguanidine. The 1:2
reactions of metal chlorides (PtCl2 and PdCl2) with monobasic bidentate ligands resulted in the formation of
coloured solids. All the synthesized compounds were characterized by melting point determinations, elemental
analyses and a combination of IR, and 1
H NMR spectroscopic techniques for structural elucidation. Probable
square planar structures for the resulting derivatives have been proposed on the basis of above
characterization. The ligands, and their complexes, have also been screened in vitro for their antimicrobial
activity against a number of pathogenic fungal and bacterial strains. Besides, the DNA cleavage activity of the
complexes has also been studied. The studies indicate that the metal chelates are more potent than the
respective ligands.
Keyword: Palladium (II) And Platinum (II) Complexes, Elemental Analyses, Antimicrobial Activity
and DNA Cleavage Activity.
I INTRODUCTION
Schiff bases and their metal complexes exhibit a number of biological activities such as antibacterial, antiviral,
and antitumor, because of their specific structures. Schiff base complexes have found applications as magnetic
materials, catalysts and in the biological engineering field [1-2]. Schiff bases obtained by condensation reaction
usually act as bi-, tri- or poly-dentate ligands and form stable complexes with transition metals. Schiff bases
show their versatile use in the synthesis of various inorganic compounds, in identification and determination of
carbonyl compounds, use in the preparation of various dyes and in pharmaceutical industry.
Sulpha drugs are a group of compounds used for eliminating wide range of infections in human and other
animal systems. Many chemotherapeutically important sulpha drugs, like sulphadiazine, sulphathiazole possess
SO2NH moiety which exhibit an important toxophoric function[3].

International conference on Science, Technology and Management ICSTM-2015
YMCA, New Delhi (India), 1 Feb 2015 www.conferenceworld.in
1377 | P a g e
The coordination chemistry, biological effects and toxicology of platinum and palladium complexes, such as
their requirements in pharmacological activities, are areas of increasing research interest [4]. It has been well
established that certain platinum and palladium complexes are of biological importance due to their anticancer
[5], antitumor [6], antiamoebic [7] and catalytic activity [8].
It has been reported that the activity of sulphur-containing ligand increases on complexation [9-11]. In view of
the diversified chelating behaviour of sulphonamide imines as well as biological importance of palladium and
platinum complexes, it has been considered worthwhile to synthesize, characterize some new palladium(II) and
platinum(II) derivatives of sulphonamide imines and to investigate their physico-chemical and structural
features as well as the biological activity.
II EXPERIMENTAL
2.1 Analytical Methods and Physical Measurements
The metal salt, PtCl2 and PtCl2 was commercial product and was used as received. All the reagents used were of
AR grade and the solvents used were dried, distilled and purified by the standard methods. Nitrogen was
estimated by the Kjeldahl’s method [12] and sulfur was estimated by Messenger’s method [13]. Palladium was
estimated gravimetrically and chlorine was estimated volumetrically by Volhard’s method [14]. The Rast
Camphor Method was used to carry out the molecular weight determinations. Infrared spectra of the ligands and
their complexes were recorded with help of Nicolet Magna FTIR-550 spectrometer on KBr pellets. 1H NMR
spectra were recorded in DMSO –d6 using TMS as the internal standard.
2.2 Preparation of the Ligands
The ligands, i.e. salicylaldehyde sulphathiazole and salicylaldehyde sulphaguanidine, L1H and L
2H respectively,
used during these investigations were prepared by the condensation of salicylaldehyde with the sulpha drugs. An
ethanolic solution of salicylaldehyde (0.1mol) was added slowly to an ethanolic solution containing sulpha
drugs (0.1 mol) in 1:1 molar ratio under stirring for 15 min, and then refluxed on a water bath for five-six hours.
On cooling overnight in a refrigerator, crystals separated out which were further purified by washing with
ethanol and finally recrystallized with acetone.The analytical results came in good consistence with the
proposed formulas as in Table 1 (Fig. 1).
2.3 Synthesis of the Metal Complexes
2.3.1 Platinum complexes
The 1:1 water–ethanol solution of PtCl2 was mixed with an ethanolic solution of the ligands in 1:2 molar ratio.
To obtain the Pt (Ln)2 (where n= 1&2 ) type of complexes aqueous ammonia was added dropwise to the reaction
mixture until it was weakly alkaline (pH ca. 8.0). The reaction mixture was then heated under refluxed for about
1 h. On cooling, the complexes were separated out which were filtered and washed with ethanol and dried in
vacuum. On the other hand, [Pt(Ln)2]Cl2 type of complexes have been synthesized by stirring the above reaction
mixture (solution of PtCl2 + LnH in 1:2 molar ratio) on a magnetic stirrer for about 2–3 h in the presence of few

International conference on Science, Technology and Management ICSTM-2015
YMCA, New Delhi (India), 1 Feb 2015 www.conferenceworld.in
1378 | P a g e
drops of concentrated HCl. The resulting product was recovered by filtration, washed with ethanol and dried in
vacuum.
2.3.2 Palladium complexes
The methanolic solution of PdCl2 was mixed with methanolic solution of the ligands in 1:2 molar ratio. Aqueous
ammonia was added dropwise to the reaction mixture, until it was weakly alkaline (pH ca. 8.0) and this reaction
mixture was then heated under reflux for about 1 h to synthesize Pd(Ln)2 type of complexes. To obtain the
[Pd(Ln)2]Cl2 type of complexes the methanolic solution of PdCl2 and L
nH in 1:2 molar ratio was stirred on a
magnetic stirrer for 2–3 h in presence of few drops of concentrated HCl. The resulting products were recovered
by filtration, washed with methanol and dried in vacuum.
III BIOLOGICAL STUDIES
3.1 Anti-microbial studies
3.1.1 In- vitro Antifungal Activity
The newly prepared complexes were also screened for their antifungal activity against Altenaria alternata,
Aspergillus niger, Fusarium oxysporum and Macrophomina phaseolina in DMSO by agar diffusion method.
Agar media was prepared by dissolving peptone (10 g), D-glucose (40g) and agar (20 g) in distilled water (1000
mL) and adjusting pH to 5.7. Normal saline water was used to make suspension spore of fungal strain lawning.
A loopful of particular fungal strain was transferred to 3 mL saline to get suspension of corresponding species.
Twenty millilitres of agar media were poured into each petri dish. Excess of suspension was decanted and plates
were dried by placing in an incubator at 37°C for 1 h using an agar punch, wells were made and each well was
labelled. A control was also prepared in triplicate and maintained at 37° C for 96 h. The fungal activity of each
compound was compared with Bavistin as standard drug. The medium with DMSO as solvent was used as a
negative control whereas media with Bavistin (standard antifungal) were used as positive control. The
experiments were performed in triplicates. The cultures were incubated for 96 h at 35°C and the growth was
monitored and the percentage of inhibition was calculated by equation:
% inhibition = 100(C-T)/C
Where, C and T are the diameters of the fungal colony in the control and the test plates, respectively.
3.1.2 In- vitro Antibacterial Activity
The newly prepared compounds were screened for their antibacterial activity against Staphylococcus aureus,
Klebsiella aerogenous, Escherichia. coli and Pseudomonas cepacicola by paper disc plate method. Each
compound was dissolved in DMSO and solutions of the concentrations (500 and 1000 ppm) were prepared
separately. Paper discs of Whatman filter paper (No. 42) of uniform diameter (5 mm) were cut and sterilized in
an autoclave. The paper discs soaked in the desired concentration of the complex solutions were placed
aseptically in the petri dishes containing nutrient agar media (agar 20 g + beef extract 3 g + peptone 5 g) seeded
with bacteria strains separately. The petri dishes were incubated at 37◦C and the inhibition zones were recorded
after 24 h of incubation. The antibacterial activity of common standard antibiotic Tetracyclin was also recorded

International conference on Science, Technology and Management ICSTM-2015
YMCA, New Delhi (India), 1 Feb 2015 www.conferenceworld.in
1379 | P a g e
using the same procedure as above at the same concentrations and solvent. The medium with DMSO as solvent
was used as a negative control whereas media with Tetracyclin (standard antibiotics) were used as positive
control. The experiments were performed in triplicates.
3.2 DNA cleavage activity
3.2.1. Preparation of culture media
Nutrient broth (peptone, 10; yeast extract, 5; NaCl, 10 in g/L) was used for culturing of E. coli . The 50-mL
medium was prepared and autoclaved for 15 min at 121 ° C under 15 lb pressures. The autoclaved media was
inoculated with the seed culture and E. coli was incubated for 24 h.
3.2.2. Isolation of DNA
The fresh bacterial culture (1.5 mL) was centrifuged to obtain the pellet, which was then dissolved in 0.5 mL of
lysis buffer (100 m m Tris pH 8.0, 50 m m EDTA, 10 % SDS). To this 0.5 mL of saturated phenol was added
and incubated at 55 ° C for 10 min. Then, it was centrifuged at 10,000 rpm for 10 min and equal volume of
chloroform:isoamyl alcohol (24:1) and 1/20 volume of 3m sodium acetate (pH 4.8) was added to this
supernatant and centrifuged at 10,000 rpm for 10 min. To this supernatant three volumes of chilled absolute
alcohol was added. The precipitated DNA was separated by centrifugation. The pellet was dried and dissolved
in TE buffer (10 m m Tris pH 8.0, 1 m m EDTA) and stored in cold conditions.
3.2.3 DNA cleavage analysis
Agarose gel electrophoresis cleavage products were analyzed by the agarose gel electrophoresis method. Test
samples (1 mg/mL) were prepared in DMF. The samples (25 μ g) were added to the isolated DNA of E. coli .
The samples were incubated for 2 h at 37 ° C and then 20 μ l of DNA sample (mixed with bromophenol blue
dye at 1:1 ratio) was loaded carefully into the electrophoresis chamber wells along with standard DNA marker
containing TAE buffer (4.84 g Tris base, pH 8.0, 0.5 m EDTA/l) and finally loaded on agarose gel and passed
the constant 50 V of electricity for around 30 min. The gel was removed and stained with 10.0 g/mL ethidium
bromide for 10 – 15 min, and the bands were observed under a UV transilluminator and photographed to
determine the extent of DNA cleavage, and the results were compared with standard DNA marker.
IV RESULTS AND DISCUSSION
The metal chloride interacts with the ligands in 1:2 molar ratios in the presence of few drops of concentrated
HCl to form [M(LH)2]Cl2 type of complexes as follows:
MCl2 + 2LH → [M(LH)2]Cl2
However, complexes of the type [(Pd(L)2)] were obtained when reactions were carried out in the presence of
aqueous NH4OH. The reactions may be written as:
MCl2 + 2LH + 2NH4OH → [M(L)2] + 2NH4Cl +2H2O
where M= Pd(II) and Pt(II) and LH is the ligand molecule.
The reactions proceed easily and all the complexes are coloured solids. All the complexes are soluble in DMSO,
DMF and CHCl3 and insoluble in common organic solvents.

International conference on Science, Technology and Management ICSTM-2015
YMCA, New Delhi (India), 1 Feb 2015 www.conferenceworld.in
1380 | P a g e
4.1 Spectroscopic Characterization
4.1.1. IR Spectra
The significant IR bands of the ligands and platinum (II) and palladium(II) complexes were observed that are
useful for the establishment of the mode of the coordination of the ligands to the metal ion. Several significant
changes with respect to the ligands bands on complexation suggest coordination through the azomethine
nitrogen and oxygen of the salicylaldehyde. A comparison of the IR spectra of the complexes and the ligands
L1H and L
2H show that the stretching vibration bands of v(-OH) of the ligands at 3255cm
-1 is absent in the
spectra of the substitution complex. This disappeareance of –OH signals confirms the deprotonation of
salicylaldehyde -OH group and its involvement in coordination. The v(C=N) bands in complexes appear at
1600-1598 cm-1
; significantly lower than the free ligands values indicating coordination by the azomethine
nitrogen atoms of the Schiff bases. However, no v(M-Cl) bands in the region 295-345cm-1
is observed in the
spectra of [M (LH)2]Cl2 type of complexes, suggesting the chloride is ionic in these complexes. Non-ligand
bands at 415–428, 352–360, 442-448 and 410-415 cm-1
have been assigned to v(Pt–N,) v(Pd–N), v(Pt-O) and
v(Pd-O) respectively. The overall IR spectral evidence suggests that both ligands are bidentate, coordinating
through oxygen and azomethine-nitrogen forming a six-membered chelate ring.
4.1.2. 1H NMR Spectra
4.1.2.1. 1H NMR spectra of the ligands
The 1H NMR spectral data of the ligands were recorded in DMSO-d6 taking TMS as an internal standard. The
free ligands exhibit OH proton resonance signals at δ12.10-12.20 ppm. The free ligands show a complex
multiplet at δ6.50–8.85 for the aromatic protons. A singlet at δ10.15ppm due to the −NH proton appear in the
spectra of the ligands.
4.1.2.2. 1H NMR spectra of the complexes
The 1H NMR spectra of the complexes further support the bonding pattern as discussed above. The free ligands
exhibit OH proton resonance signals at δ12.10-12.20 ppm, which completely disappear in the spectra of metal
complexes. This indicates the deprotonation of OH group as a result of bonding through phenolic oxygen to the
metal atom in the substitution complex. Further, in the spectra of the complexes, a downfield shift in the
position of the aromatic protons also indicates the coordination of the azomethine nitrogen to the metal atom.
The signal due to –NH remains unaltered in the complexes indicating that the –NH group is not taking part in
the complexation.
On the basis of above discussion the following structures as shown in the Fig. 1 and 2 have been proposed for
the ligands and the metal complexes.

International conference on Science, Technology and Management ICSTM-2015
YMCA, New Delhi (India), 1 Feb 2015 www.conferenceworld.in
1381 | P a g e
OH
SO2
HN CN
salicylaldehyde sulphaguanidine(L2H)
C6H4C
NH2
NH
OH
SO2 NHN
SN
salicylaldehyde sulphathiazole(L1H)
C6H4C
H H
Fig.1 Structure of the Ligands
CHN
R
OH
M
CH N
HO
R
Cl2
Addition Complex
CHN
R
O
M
CH N
O
R
Substitution Complex
SO2
HN
N
SC6H4Where, M = Pt and Pd and R = and SO2
HN CC6H4
NH2
NH
Fig.2 Structure of the synthesized Complexes
4.2 Biological studies
4.2.1 In vitro antifungal and antibacterial studies
All the compounds tested against the fungi, Alternaria alternata, Aspergillus niger, Fusarium oxysporum, and
Macrophomina phaseolina and the bacteria Staphylococcus aureus, Klebsiella aerogenous, Escherichia Coli,
and Pseudomonas cepacicola and were found to be active. The results have been summarized in Tables 2 and 3
The biological activity of metal complexes exhibited markedly much promising results than the ligands against
all the test bacterial/fungal strains. It was evident that overall potency of the ligands was enhanced on

International conference on Science, Technology and Management ICSTM-2015
YMCA, New Delhi (India), 1 Feb 2015 www.conferenceworld.in
1382 | P a g e
coordination with metal ions. It has been suggested that the ligands with nitrogen and oxygen/sulfur donor
systems inhibit enzyme activity, since the enzymes which require these groups for their activity appear to be
especially more susceptible to deactivation by metal ions on coordination. Moreover, coordination reduces the
polarity of the metal ion mainly because of the partial sharing of its positive charge with the donor groups [15]
within the chelate ring system formed during coordination. This process, in turn, increases the lipophilic nature
of the central metal atom, which favours its permeation more efficiently through the lipid layer of micro-
organism [16], thus destroying them more aggressively.
DNA cleavage activity
The representative ligands and their complexes are studied for their DNA cleavage activity by the agarose gel
electrophoresis method against DNA of E. coli in the presence of H2O2. From the gel picture it is clear that
Lanes 1, 2, 3, 4, 5, 6, 7& 8 have shown cleavage activity, which was confirmed by observing the tail in the DNA
band. The tail was missing in L3 & L4 indicating the non-cleavage activity. This shows that the Schiff base
alone does not show any apparent cleavage, whereas its complexes do show. The results indicated the important
role of metal in these isolated DNA cleavage reactions. The cleavage efficiency of the complexes compared
with that of the control is due to their efficient DNA-binding ability. The metal complexes were able to convert
super coiled DNA into open circular DNA. The general oxidative mechanisms proposed account for DNA
cleavage by hydroxyl radicals via abstraction of a hydrogen atom from sugar units and predict the release of
specific residues arising from transformed sugars, depending on the position from which the hydrogen atom is
removed. The cleavage is inhibited by the free radical scavengers implying that hydroxyl radical or peroxy
derivatives mediate the cleavage reaction.
Fig.4 DNA cleavage gel diagram of ligands and synthesized compounds. , Lane 1 : (C E. Coli), Lane 2:
(standard molecular weight marker), Lane 3&4: (E. Coli DNA cleavage of L1H & L
2H), Lanes 5 – 8, (E. coli
DNA treated with the complexes): [Pt(L1H)2]Cl2 [Pt(L
2H)2]Cl2 [Pd(L
1H)2]Cl2 & [Pd(L
2H)2]Cl2,
respectively.

International conference on Science, Technology and Management ICSTM-2015
YMCA, New Delhi (India), 1 Feb 2015 www.conferenceworld.in
1383 | P a g e
V CONCLUSIONS
We have synthesized biologically relevant ligands and their Pt(II) and Pd(II) complexes. Thus, on the basis of
the above spectral features, as well as the analytical data, square planar geometries shown in Fig. 3 have been
suggested for the both the Pt(II) and Pd(II) complexes. The antimicrobial results indicated that the complexes
showed promising antibacterial and antifungal activities. Both the ligand and their respective metal complexes
were found to be sensitive against all the fungal and bacterial strains and the metal complexes are more potent
antimicrobial agents than the free ligand. The results indicated that the palladium and platinum complexes
exhibited almost similar antimicrobial activity. Furthermore, DNA cleavage studies revealed that metal
complexes cleave DNA more efficiently in comparison to the ligands.
O
RN O
NR
M
HO
RN OH
NR
M Cl2
Substitution Product Addition Product
Fig.3
REFERENCES
[1] H-Y.Zhang, J.Lei, Y-Y.Chen, Q-A.Wu, Y-S.Zhang, L-H.Gao, Synthesis and Reactivity in Inorganic and
Metal-OrganicChemistry, 31,2001 973.
[2] E.Abele, Activation of silicon bonds by fluoride ion in the organic synthesis in the new millenium: A
Review. Main Group Metal Chemistry, 28,2005, 45.
[3] H. Singh, V. K. Srivastava, S.N. Shukla, M. K. Srivastava, M. K. Upadhyay, Indian Journal of Chemistry,
33A, 1994, 350.
[4] M. Navarro, A. Betancourt, C. Hernández, E. Marchan, Braz. Chem. Soc. 19, 2008,1355.
[5] C.F. Caires, Antonio, Anti-Cancer Agents, 7,2007, 484.
[6] G. Garcia-Friaza, A. Fernandez-Botello, J.M. Perez, M.J. Prieto, V. Moreno, J. Inorg. Biochem.100, 2006
1368.
[7 ] N. Bharti, Shailendra, S. Sharma, F. Naqvi, A. Azam, Bioorg. Med. Chem. 11,2003,2923.
[8] W. Nazihah, W. Ibrahim, M. Shamsuddin, B.M. Yamin, Malaysian J. Anal. Sci. 11,2007, 98.
[9] M. Jain, R.V. Singh, International Journal for Chemical Science,1(1),2003,17.
[10] M. Jain, S. Gaur, S. C. Diwedi, S.C. Joshi, A.Bansal, R.V.Singh, Phosphorus, Sulfur, and Silicon,179,
2004,1517.
[11] M. Jain, S.Gaur, V.P. Singh, R.V. Singh, Applied OrganometallicChemistry. 18(2),2004, 73.
[12] J.T. Makode, A.S. Aswar. Indian J. Chem., 43A, 2004,2120.
[13] A.I. Vogel. ‘’A Textbook of Organic Quantitative Analysis’’, 5th
Ed., ( PEL, London ) 2004, 243.

International conference on Science, Technology and Management ICSTM-2015
YMCA, New Delhi (India), 1 Feb 2015 www.conferenceworld.in
1384 | P a g e
[14] A.I. Vogal “A Text Book of Quantitative Inorganic Analysis”, (Longmans Green ELBS, London), 1962.
[15] B.N. Meyer, N.R. Ferrigni, J.E. Putnam, L.B. Jacobsen, D.E. Nichols, J.L. Mc Laughlin, Planta Med.
45,1982,31–34.
[16] Z.H. Chohan, Synth. React. Inorg. Met-Org. Chem. 34, 2004, 833–846.
Table 2: Fungicidal screening data of the ligands and their respective metal complexes.
(Average percentage inhibition after 96 hours; conc. in mg/well (w/v)
Compound Alternaria
alternata
Aspergillus niger Fusarium
oxysporum
Macrophomina
phaseolina
0.5 1.0 2.0 0.5 1.0 2.0 0.5 1.0 2.0 0.5 1.0 2.0
L1H 36 38 40 30 33 34 28 30 35 27 31 34
[Pt(L1H)2]Cl2 45 48 50 38 39 41 30 33 39 29 33 38
[Pt(L1)2] 47 52 53 41 40 42 33 36 40 31 33 40
[Pd(L1H)2]Cl2 42 45 48 33 36 40 27 30 35 26 30 36
[Pd(L1)2] 44 48 50 35 36 42 30 33 35 28 33 39
L2H 35 37 40 27 30 31 25 29 35 22 25 33
[Pt(L2H)2]Cl2 41 45 48 33 34 38 28 30 35 26 35 37
[Pt(L2)2] 43 45 51 35 39 40 31 35 39 30 36 41
[Pd(L2H)2]Cl2 39 41 42 29 31 33 25 27 31 22 26 33
[Pd(L2)2] 42 43 45 30 33 34 25 31 34 29 31 35
Bavistin 85 100 100 84 100 100 84 100 100 82 100 100

International conference on Science, Technology and Management ICSTM-2015
YMCA, New Delhi (India), 1 Feb 2015 www.conferenceworld.in
1385 | P a g e
Table 3 : Bactericidal screening of the ligands and their respective metal complexes : Inhibition
after 24 hours (conc. in mg/well (w/v)
Compound
Diameter of inhibition zone (mm)
Staphylococcus aureus Klebsiella
aerogenous
Escherichia coli Pseudomonas
cepacicola 1.0 2.0 1.0 2.0 1.0 2.0 1.0 2.0
L1H 8 10 5 8 6 8 4 5
[Pt(L1H)2]Cl2 12 14 8 10 11 10 6 9
[Pt(L1)2] 12 16 10 11 13 10 8 11
[Pd(L1H)2]Cl2 9 12 8 9 10 11 6 8
[Pd(L1)2] 10 13 10 11 7 8 7 10
L2H 7 9 6 7 5 8 4 9
[Pt(L2H)2]Cl2 15 16 7 8 9 13 6 7
[Pt(L2)2] 15 18 8 9 10 12 7 9
[Pd(L2H)2]Cl2 13 15 4 5 7 9 4 5
[Pd(L2)2] 14 16 4 6 9 11 5 8
Tetracyclin 15 18 6 11 17 18 6 10
Table 1. Analytical data and physical properties of the ligands and their complexes.
Compound
Color
M.P.
(°C)
Analysis (%) Found (Calcd.)
Mol.Wt.
Found
(Calcd.)
C
H
N
S
Cl
M
L1H Crystalli
ne white
120 53.12
(53.33)
3.45
(3.88)
11.42
(11.66)
17.22
(17.77)
- - 360
[Pt(L1H)2]Cl2 Light
yellow
140-
144
38.54
(38.94)
2.45
(2.83)
8.14
(8.51)
12.46
(12.98)
7.06
(7.20)
19.25
(19.78)
986.07
[Pt(L1)2] Light
yellow
146-
149
41.89
(42.05)
2.16
(2.84)
9.09
(9.19)
13.92
(14.01)
- 21.05
(21.36)
913.07
[Pd(L1H)2]Cl2 Brick
red
152-
154
42.56
(42.78)
3.05
(3.12)
9.11
(9.36)
14.08
(14.26)
7.56
(7.91)
11.42
(11.85)
897.42
[Pd(L1)2] Dark
brown
158-
160
46.15
(46.57)
3.10
(3.15)
10.01
(10.18)
15.03
(15.32)
- 12.46
(12.90)
824.42

International conference on Science, Technology and Management ICSTM-2015
YMCA, New Delhi (India), 1 Feb 2015 www.conferenceworld.in
1386 | P a g e
L2H Creme 114 52.45
(52.99)
4.02
(4.10)
17.14
(17.66)
9.65
(10.09)
- - 374
[Pt(L2H)2]Cl2 Light
Yellow
144-
146
37.01
(37.33)
2.45
(2.88)
12.08
(12.44)
7.01
(7.11)
7.49
(7.88)
20.95
(21.6)
900.07
[Pt(L2)2] yellow 146-
148
40.10
(40.62)
2.45
(2.90)
12.94
(13.54)
7.65
(7.73)
- 23.06
(23.58)
827.07
[Pd(L2H)2]Cl2 Brown 162-
164
41.02
(41.40)
3.12
(3.20)
13.49
(13.80)
7.45
(7.88)
8.45
(8.75)
12.78
(13.11)
811.42
[Pd(L2)2] Dark
brown
165-
168
45.26
(45.87)
3.11
(3.25)
15.11
(15.16)
8.26
(8.66)
- 14.07
(14.52)
732.42

International conference on Science, Technology and Management ICSTM-2015
YMCA, New Delhi (India), 1 Feb 2015 www.conferenceworld.in
1387 | P a g e
ATTACKS AT DATA LINK LAYER OF OSI MODEL: AN
OVERVIEW
Raminderpal Singh1, Amanjeet Kaur
2, Sania Sethi
3
1 Associate Professor,
2,3 Assistant Professor,
Department of Computer Applications &Management, SBSSTC, Ferozepur (India)
ABSTRACT
Security is at the forefront of most networks and many companies implement a comprehensive security policy
encompassing many of the OSI layers, from application layer all the way down to IP security. OSI Was Built to
Allow Different Layers to Work without the Knowledge of Each Other Unfortunately this means if one layer is
hacked, communications are compromised without the other layers being aware of the problem Security is only as
strong as the weakest link when it comes to networking, layer 2 can be a very weak link
However, one area that is often left untouched is hardening layer 2 and this can open the network to a variety of
attacks and compromises. This document has a focus on the security issues surrounding and understanding and
preventing Layer 2.With a significant percentage of network attacks originating inside the corporate firewall,
exploring this soft underbelly of data networking is critical for any secure network design. Security issues addressed
in this session include ARP spoofing, MAC flooding, VLAN hopping, DHCP attacks, and Spanning Tree Protocol
concerns. Denial-of-Service (DoS) attacks are also a major concern as they can come from both internal and
external sources. The focal point of this paper is to understand how Attacksworks and what techniques can be used
to mitigate this type of attacks from security perspective.
I INTRODUCTION
Network security has become a concern with the rapid growth of the internet .There are several ways to provide
security in the application ,transport ,or network layer of a network .However ,the network security is only as strong
as the weakest section. Since the Data Link Layer security has not been adequately addressed yet, the weakest
section may be the Data Link Layer (Layer 2) [1]. Layer 2 enables interoperability and interconnectivity in
networks. However, a compromise in Layer 2, which enables internal attacks, may not be detected by the upper
layers.In this paper, we focus on the security problems of the Layer 2, when those are ignored, it can increase the
vulnerability of the critical infrastructure, including the information systems and the national security systems.
Because the Layer 2 attacks are relatively more difficult to accomplish from outside, from the Internet, they are only
concentrate on the other layer of OSI 3, they think that the LAN4 and the backbone network provided by the internet

International conference on Science, Technology and Management ICSTM-2015
YMCA, New Delhi (India), 1 Feb 2015 www.conferenceworld.in
1388 | P a g e
service provider is safe, but it isn’t. There are some well-known technics which allows reaching the elements of the
LAN network in short time from outside
II UNDERSTANDING OF LAYER 2
Before explaining the vulnerabilities of the Layer 2, need to understand a few words about what is this – for those
who are less experienced in this field. The Layer 2 is one part of the OSI – seven-layer hierarchical – model. The
ISO (International Organization for Standardization) developed the OSI model, so that they can determine the
requirements of mutual cooperation the communication devices – including computers – between each other with
individual layers. In fact, the same communication functions are grouped into logical layers. A layer serves the layer
above it and is served by the layer below it. Main concern was that the different manufacturer’s products (hardware,
software) work together at the border of different layer[2]. Find below the list of levels with short explanation:
(Figure 1.)
Figure 1.OSI Reference Model
The datalink layer provides the functional and procedural means to transfer data between network entities and to
detect and possibly correct errors thatmay occur in the physical layer. Following are the functions of data link layer:
Framing
Physical Addressing
Flow Control
Error Control
Access Control
Media Access Control (MAC)
III TYPES OF ATTACKS ON LAYER 2
There are three main classes of attacks:
Spanning Tree Protocol.

International conference on Science, Technology and Management ICSTM-2015
YMCA, New Delhi (India), 1 Feb 2015 www.conferenceworld.in
1389 | P a g e
Cisco VLAN9/Trucking Protocols.
Otherattacks.
3.1 Spanning Tree Protocol
Spanning-Tree Protocol (STP) prevents loops from being formed when switches or bridges are interconnected via
multiple paths. Spanning-Tree Protocol implements the 802.1D IEEE algorithm by exchanging BPDU messages
with other switches to detect loops, and then removes the loop by shutting down selected bridge interfaces[3]. This
algorithm guarantees that there is only one active path between two network devices. Within this framework the
bridges negotiate between them, who will be the „root” bridge in the network, determine the least cost paths and
disable all other paths. The attack technique of this protocol, the Spanning Tree Protocol manipulation attack, within
this framework the attacker sends BPDUs to become „root” bridge (or switch) in the network. Therefore the attacker
can influence the flow of data. Requires attacker is dual homed to two different bridges (or switches) or one of the
two connections is WLAN access point which is not connected to the same bridge (or switch)[4].
Attacker can eavesdrop all messages of victims; he can inject new ones in MITM position. (Figure 2.)
Figure 2. Spanning Tree Protocol manipulation
3.2 Cisco VLAN/Trunking Protocols
VLAN's allow a network manager to logically segment a LAN into different network ofdepartments such as
marketing, sales, accounting, and research. There are lots of VLANs overthe backbone switches of Internet
connecting different site of company. The attacker has twomethod of VLAN hopping attack in order to be a member
of other VLANs:
1. Basic VLAN hopping attack: The switches connected to a trunk15 link, which has access to all VLANs by
default. The attacker station can spoof as a switch with DTP signaling, and the station will be a rogue

International conference on Science, Technology and Management ICSTM-2015
YMCA, New Delhi (India), 1 Feb 2015 www.conferenceworld.in
1390 | P a g e
switch – member of all VLANs and all traffic can be monitored. The „Yersinia” software is very useful for
this task. (Figure 3.)
Figure 3. Basic VLAN hopping attack
2. Double tagging VLAN hopping attack: A widely used VLAN networks operate with an additional 802.1q
header, or VLAN tag to distinguish the VLANs. VLAN tag changes the information frame. The service-
provider infrastructures are doubletagged,with the outer tag containing the customer's access VLAN ID,
and the innerVLAN ID being the VLAN of the incoming traffic. When the double-tagged packetenters
another trunk port in a service-provider core switch, the outer tag is stripped asthe packet is processed
inside the switch. The attacker sends „Double tagging “frame. The first belongs to the own VLAN and the
second one belongs to the targetVLAN. The switch performs only one level DE capsulation (strip off first
tag) and the
Attacker can use unidirectional traffic to the Victim. This method works if trunk hasthe same VLAN as the
attacker and the trunk operates with 802.1q. (Figure 4.)
Figure 4. Double tagging VLAN hopping attack

International conference on Science, Technology and Management ICSTM-2015
YMCA, New Delhi (India), 1 Feb 2015 www.conferenceworld.in
1391 | P a g e
3.3 Other attacks
In this section, only those relevant attack techniques will be explained - in addition to the previous ones - which are
widely known and worth considering at the developing of the system-wide security policy and at work out of the
basic safety procedures.
3.3.1 Cisco Discovery Protocol (CDP) attack
The Cisco Discovery Protocol (CDP) is a proprietary protocol that all Cisco devices can be configured to use. CDP
discovers other Cisco devices that are directly connected, which allows the devices to auto-configure their
connection in some cases. CDP messages are not encrypted. Most Cisco routers and switches have CDP enabled in
the default configuration. Can be used to learn sensible information about the CDP sender (IP address, Cisco IOS
software version, router model, capabilities...).
Besides the information gathering benefit CDP offers an attacker, there was vulnerability in CDP that allowed
Cisco devices to run out of memory and potentially crash if you sent it tons of bogus CDP packets.
CDP is unauthenticated: an attacker could craft bogus CDP packets and have them received by the attacker's directly
connected Cisco device. (Figure 5.) If the attacker can getaccess to the router via Telnet, he can use the CDP
information to discover the entire topologyof your network at Layer 2 and 3, and he could launch a very effective
attack against your network.[6]
Figure 5. CDP Attack
3.3.2 CAM table overflow attack
The CAM table, which stores information such as MAC addresses available on physical ports. CAM tables
(sometimes called MAC address table) have a fixed size (19KB...128KB, it can store about 100…100000 MAC
entries).

International conference on Science, Technology and Management ICSTM-2015
YMCA, New Delhi (India), 1 Feb 2015 www.conferenceworld.in
1392 | P a g e
When frames arrive on physical ports, the source MAC addresses are learned from Layer 2 Packet header and
recorded in the CAM table. All entries have a default aging timer which is300 seconds. If a host does not send
frames toward the port, the entries will be removed after 5 minutes.[7]
The switch forwards the frame to the MAC address port designated in the CAM table. If the MAC address does not
exist, the switch acts like a huband forwards the frame out every other port on the switch.
There is a common tool that performs CAM overflow. This tool can generate 155000 MAC entries on a switch per
minute. A CAM overflow attack turns a switch into a hub, which enables the attacker to reach every host on the
network, to eavesdrop on a communication and perform MITM attacks. This method is applicable to attack the
neighbor switches. (Figure 6.)
Figure 6. CAM table overflow attack
3.3.3 MAC Spoofing (ARP poisoning)
MAC spoofing attacks are launched by attacker on a Layer 2 network. The attacker can send out a gratuitous ARP
(GARP) to the network. GARP is used by hosts (computers) to “announce” their IP address to the local network and
avoid duplicate IP addresses on the network. Computers, routers and other network hardware may use cache
information gained from gratuitous ARPs. Because ARP has no methods for authenticating ARP replies on a
network, ARP replies can come from other system which is expected. In one common attack the attacker says „my
PC is the default gateway” so that users send their traffic through the attacker rather than the default gateway. The

International conference on Science, Technology and Management ICSTM-2015
YMCA, New Delhi (India), 1 Feb 2015 www.conferenceworld.in
1393 | P a g e
attacker then forwards user traffic to the real default gateway so that victims do not notice any change in their
network access. [8]An attacker on a fast enough host can capture the traffic and can modify them. Figure 7.
Figure 7. MAC Spoofing
3.3.4 DHCP starvation attack
The DHCP server is used to configure network devices so that they can communicate on computer network. The
clients and a server are operating in a client-server model. DHCP client sends a query requesting necessary
information (IP address, default gateway25, and so on) to a DHCP server. On receiving a valid request, the server
assigns the computer an IP address, and other IP configuration parameters.
This is special kind of attack where attacker sends tons of requests to the DHCP server with a false MAC address. If
enough requests flooded onto the network, the attacker can completely exhaust all of the available DHCP addresses.
Clients of the victim network are then starved of the DHCP resource.
The network attacker can then set up a Rogue DHCP Server on the network and reply modified IP configurations to
the victims. (Figure 8.) These parameters ensure the MITM possibilities to the attacker.
Figure 8 DHCP starvation attack

International conference on Science, Technology and Management ICSTM-2015
YMCA, New Delhi (India), 1 Feb 2015 www.conferenceworld.in
1394 | P a g e
3.3.5 Wireless 802.11 (Wi-Fi) attacks
Wi-Fi can be less secure than wired (Ethernet) connections because an attacker does not need a physical connection,
since only need one antenna and a laptop to compromise one.
In this type of attack, the attacker can execute:
To insert himself in the MITM position (client’s data can be modified,
To deny the service,
To capture all traffic.
In order to insert oneself in the middle of the communication, one has two ways:
Send DE authentication packets to one or more clients which are currently associated with an AP and set
up a rouge AP with the same credentials as the original for purposes of allowing the client to connect to it.
Set up a rouge AP with a big signal (bigger than the original) and same credentials as the original for
purposes of allowing the new client to connect to it.
IV CONCLUSIONS
This paper is an overview of the most recognized attack techniques on Layer 2 and draw attention to the
vulnerabilities of this level emphasizing that the other layers being aware of the problem. A lot of attention is paid to
securing the higher layers of the OSI reference model with network-level devices such as firewalls, intrusion
protection systems (IPS), and applications such as antivirus and host-based intrusion protection (HIPS).
The attacker can
Eavesdrop traffic,
Manipulate data,
Deny the information flow, and
Use combination of the above mentioned.
Apply any of these options pose a serious threat to critical infrastructure, state institutions or governmental systems,
even if no attacking intent is used. Certain critical infrastructure is controlled via the Internet which is maintained by
wired and mobile telecommunication carriers.
REFERENCES
[1] GReAT, Kaspersky Lab Expert: The "Red October" Campaign - An Advanced Cyber Espionage Network
Targeting Diplomatic and Government Agencies
https://www.securelist.com/en/blog/785/The_Red_October_Campaign_An_Advanced_
Cyber_Espionage_Network_Targeting_Diplomatic_and_Government_Agencies
[2] OSI model, http://en.wikipedia.org/wiki/OSI_model
[3] Spanning Tree Protocol
http://www.cisco.com/en/US/tech/tk389/tk621/tsd_technology_support_protocol_home.

International conference on Science, Technology and Management ICSTM-2015
YMCA, New Delhi (India), 1 Feb 2015 www.conferenceworld.in
1395 | P a g e
[4] http://seclab.cs.ucdavis.edu/papers/Marro_masters_thesis.pdf
[5] SANS Institute: Understanding Wireless Attacks and Detection:
http://www.sans.org/reading_room/whitepapers/detection/understanding-wirelessattacks
[6] http://www.iaeng.org/publication/IMECS2008/IMECS2008_pp1143-1148.pdf
[7] https://www.cisco.com/web/ME/exposaudi2009/assets/docs/layer2_attacks_and_mitigation_t.pdf
[8] http://www.sans.org/reading-room/whitepapers/intrusion/detecting-responding-data-link-layer-attacks-33513

International conference on Science, Technology and Management ICSTM-2015
YMCA, New Delhi (India), 1 Feb 2015 www.conferenceworld.in
1396 | P a g e
EXPERIMENTAL INVESTIGATION OF PV PANEL
WITH FIN COOLING UNDER NATURAL
CONVECTION
J.A.Gotmare
1, D.S.Borkar
2, P.R.Hatwar
3
1,2,3 Department of Mechanical Engineering,
Dr.BabasahebAmbedkar College of Engineering & Research, Nagpur, (India)
ABSTRACT
Photovoltaic solar cell generates electricity by receiving solar irradiance in the forms of photons. Photons with
wavelengths above the threshold are converted into heat in the PV cells. This waste heat must be dissipated
efficiently in order to avoid excessive high temperatures, which have an adverse effect on the electrical performance
of the cell. Therefore, in this paper, performance enhancement of PV panels was experimented utilizing passive fin
cooling under natural convection. To properly cool the PV panel, different cross sectional fins with perforation was
attached at the backside of the panel. Comparative experimental study on PV panels with and without fin cooling
was carried out to investigate the effect of operating temperature on the voltage, current & power output developed
by the panel. The results showed that due to fin cooling temperature of the PV panel dropped significantly & the
power output was improved by 5.5% under natural convection.
Keywords: Aluminium Fins, K-Thermocouple, Passive Cooling, PV Panel, RTD Meter
I INTRODUCTION
The concern for environment due to ever increasing use of fossil fuels & rapid depletion of these resources have led
to the development of alternative sources of energy, which are renewable & environment friendly. Solar energy can
be a major source of power & can be utilized by using thermal and photovoltaic conversion systems. India, receives
solar energy equivalent to more than 5,000 trillion KWh per year, which is far more than its total annual
consumption. The daily global radiation is around 5 kWh per sq. m per day with sun shine ranging between 2,300
and 3,200 hours per year in most part of India. Though the energy density is low and the availability is not
continuous, it has now become possible to harness this abundantly available energy very reliably for many purposes

International conference on Science, Technology and Management ICSTM-2015
YMCA, New Delhi (India), 1 Feb 2015 www.conferenceworld.in
1397 | P a g e
by converting it to usable heat or through direct generation of electricity.[1] Photovoltaic cell / Solar cell has a
potential to convert the solar energy into electricity.
The solar cell works in several steps:
Photons in sunlight hit the solar panel and are absorbed by semiconducting materials, such as silicon.
Electrons are excited from their current molecular/atomic orbital. Once excited an electron can either
dissipate the energy as heat and return to its orbital or travel through the cell until it reaches an electrode.
Current flows through the material to cancel the potential and this electricity is captured.
An array of solar cells converts solar energy into a usable amount of direct current (DC) electricity.
The solar energy technology or synonym as photovoltaic andsolar thermal technology has many advantages and
disadvantages comparing to others energy.
The potential advantages such as:
It works on noiseless environment; do not produce any unwanted waste such as radioactive materials;
High performance and reliable system;
Clean technology – does not produce any toxic waste orradioactive material;
Highly credible system with life span expectation is between 20and 30 years;
Low maintenance system.
The disadvantages:
Non-uniform cooling – need innovative absorber design;
Payback – less efficiency, longer payback period;
Production and installation cost–expensive and high cost;
Not suitable for integration with present roof system;
Need larger space for separate systems (hot water and electricityproduction). [2]
The performance of the PV system is affected by several parameters including temperature. The part of absorbed
solar radiation that is not converted into the electricity converts into heat energy and causes a decrease in electrical
efficiency. This undesirable effect which leads to an increase in the PV cell’s working temperature and consequently
causing a drop of conversion efficiency can be partially avoided by a proper method of heat extraction [3].
Many researchers have investigated & proposed different methods to optimize the performance of Photovoltaic
panel& to reduce the installation costs. Hosseini et al. [3] experimentally studied the performance of a PV system
combined with a cooling system consisting of a thin film of water running on the top surface of the panel & an
additional fabricated system to use the hot water produced by the system. The results showed that the power output
and electrical efficiency of combined system were higher and lower module temperature and reflection losses
compared to conventional PV system. Furushima&Nawata [4] developed a photovoltaic system with cooling device
utilizing siphonage& evaluated the performance of photovoltaic panel for the summer condition. The study showed

International conference on Science, Technology and Management ICSTM-2015
YMCA, New Delhi (India), 1 Feb 2015 www.conferenceworld.in
1398 | P a g e
that the cooling of the PV module increased the electrical power output & the hot water produced could be used for
heating purposes. In order to reduce the cell reflection & improve the PV performanceAbdolzadeh&Ameri [5]
evaluated the performance of the photovoltaic water pumping system by spraying water over the front of the
photovoltaic cell & concluded that the PV cell efficiency, subsystem efficiency & total efficiency were increased by
3.26%, 1.40% & 1.35 % respectively at 16 m head due to spraying water over the cell.Teo et al. [6] developed
ahybrid photovoltaic / thermal system consisting of a parallel array of ducts with an inlet/outlet manifold designed
for uniform airflow distribution attached to the back of the PV panel. The experimental study showed that with an
air cooling, the temperature of the panel dropped significantly & solar efficiency increased between 12% to 14%.
Bahaidarah et al. [7] experimentally investigated the performance of photovoltaic module by incorporating a heat
exchanger (cooling panel) at its rear surface. The water circulated through the heat exchanger absorbed the heat
from the panel & the hot water produced could be utilized for the domestic applications. The result showed that with
an active cooling, the module temperature dropped significantly to about 20% & the panel efficiency increased by
9%. Gang et al. [8] experimentally studied the performance of a novel heat pipe photovoltaic/thermal system and
validated the model output with measured data. The experimental results showed an improvement in the system
efficiency with cooling with water circulation. Krauter[9] used a method of reducing the reflection by flowing water
over the top surface of the panel. The result showed that cell temperature dropped to 22°C & improved electrical
yield 10.3% over the day. Many researchers employed air or water for active cooling of PV to achieve higher
electrical efficiency, but additional energy consumption for air or water circulation may reduce the net power output.
Therefore, Hongbing Chen et al. [10] conducted an experimental study to compare the performance of photovoltaic
panel with & without fin cooling to investigate the effect of PV panel inclination, ambient temperature, and solar
radiation & wind velocity on the electrical efficiency & power output. The study showed that the average power
output of the PV panel with fin increased by 1.8% - 11.8% than without fin.
The objective of this study is to investigate the possibility of improving the performance of PV panel with fin
cooling under natural convection.
II EXPERIMENTAL SETUP
The experimental setup was designed to investigate the effect of fin cooling on the performance of the photovoltaic
panel. Figure2.1 shows the experimental setup consists of two 37W PV panel having area of 0.351m2. The
maximum output voltage and current developed by the panel are 17.7V, 2.09A respectively at irradiance of 1000
w/m2
andambient temperature of 25°C.For the passive cooling, fins made up of aluminium sheet of 0.8 mm
thickness are used & glued evenly to the backside of the panel with thermal grease. Total 9 fins with different cross-
sections are attached alternately with a constant spacing of 50 mm to restrict the flow of air in order to improve the
heat transfer rate from the PV panel.Perforation has been done on the fins at an equal distance by a 10 mm drill bit.
The panels tilt angle are set to 21 deg with respect to the horizontal, which is the local latitude of Nagpur (Latitude
21.1500° N, Longitude 79.0900° E), India, so as to face in the south direction. The temperatures of the panels are

International conference on Science, Technology and Management ICSTM-2015
YMCA, New Delhi (India), 1 Feb 2015 www.conferenceworld.in
1399 | P a g e
measured by K-thermocouples which can sense the temperature from 0°C - 300°C & the readings will be shown on
the RTD meter.Total 4 thermocouples are used to measure the temperatures at different locations. Two
thermocouples are installed at the top & two at the backside of both the panels. Also the current & voltage are
measured by the Omega type multimeter. The experiment was conducted from 9.00am to 3.00pm for 10 days &
recorded the data for every 5 min.
Figure 2.1 Experimental setup (PV panels with & without Fins)
Table: 1Details of fin dimension & no of perforation shown in figure 2.2
Case Size of fin No. of perforation Distance of perforation from bottom
1 600mm×100mm 09 50mm
2 600mm×60mm 09 30mm
Figure 2.2 Backside of the PV panel with Fins
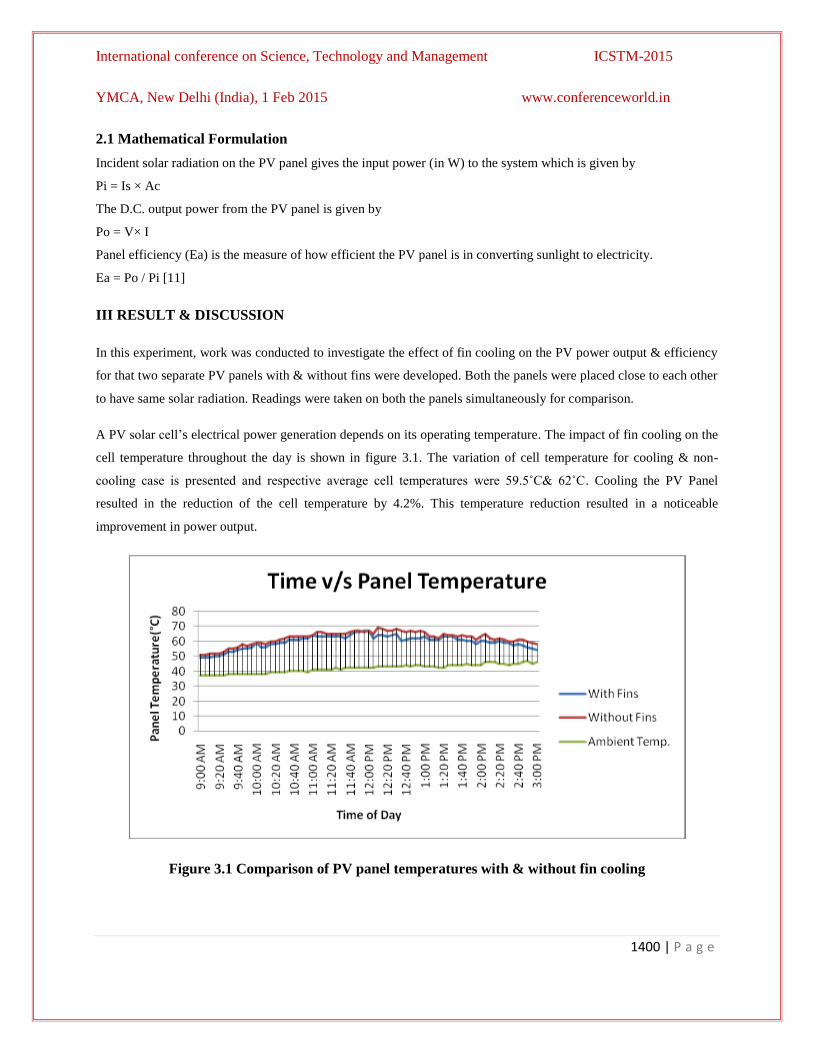
International conference on Science, Technology and Management ICSTM-2015
YMCA, New Delhi (India), 1 Feb 2015 www.conferenceworld.in
1400 | P a g e
2.1 Mathematical Formulation
Incident solar radiation on the PV panel gives the input power (in W) to the system which is given by
Pi = Is × Ac
The D.C. output power from the PV panel is given by
Po = V× I
Panel efficiency (Ea) is the measure of how efficient the PV panel is in converting sunlight to electricity.
Ea = Po / Pi [11]
III RESULT & DISCUSSION
In this experiment, work was conducted to investigate the effect of fin cooling on the PV power output & efficiency
for that two separate PV panels with & without fins were developed. Both the panels were placed close to each other
to have same solar radiation. Readings were taken on both the panels simultaneously for comparison.
A PV solar cell’s electrical power generation depends on its operating temperature. The impact of fin cooling on the
cell temperature throughout the day is shown in figure 3.1. The variation of cell temperature for cooling & non-
cooling case is presented and respective average cell temperatures were 59.5˚C& 62˚C. Cooling the PV Panel
resulted in the reduction of the cell temperature by 4.2%. This temperature reduction resulted in a noticeable
improvement in power output.
Figure 3.1 Comparison of PV panel temperatures with & without fin cooling

International conference on Science, Technology and Management ICSTM-2015
YMCA, New Delhi (India), 1 Feb 2015 www.conferenceworld.in
1401 | P a g e
The maximum power output from the panel varies with the intensity of the solar irradiance and the temperature of
the cell. It can be seen in the figure 3.2 that themaximum power developed by the module without fins was 53.24W
at 11.55am whereas maximum power with fins was 58.5 W. An average increase of 5.5% in the power output of the
module was observed in the case of fin cooling.
Figure 3.2 Comparison of output power with & without fin cooling
Figure 3.3 Comparison of PV Panel voltages with & without fin cooling

International conference on Science, Technology and Management ICSTM-2015
YMCA, New Delhi (India), 1 Feb 2015 www.conferenceworld.in
1402 | P a g e
The short circuit current (Isc) increases slightly with increasing temperature & the open circuit voltage (Voc)
decreases significantly with increasing temperature. This results in a reduction of electrical power output. Since
efficiency and electrical yield decrease with increased operating temperatures, it is preferable to keep cells
temperature as low as possible. In the present study, fins are used to cool the PV panel.Cooling of the PV panel with
fins affects the variation of voltage & current as shown in the figure 3.3 & 3.4. It is clear from both the figures that
due to the use of fins, temperature of panel decreases which slightly drops the current but increases the voltage. This
ultimately increases the power output from the PV panel.
Figure 3.4 Comparison of PV panel current with & without fin cooling
IV CONCLUSION
Solar cells generates more electricity when receive more solar radiation but the efficiency drops when temperature
of solar cell increases. Loss of efficiency due to raised temperature of PV panel can be reduced by the heat removal
from the back surface of the panel with the help of fins which absorbs the heat generated by the cells during the day.
This study examines the performance of the 37W PV panel with the fins. It is shown that with passive cooling
technique, the operating temperature of the PV panel dropped significantly to about 4.2% and an increase of 5.5% in
power output was observed. This increased power output increases the electrical efficiency of the panel.
NOMENCLATURE
Pi = Input Power in W
Is = Solar radiation in W/m2

International conference on Science, Technology and Management ICSTM-2015
YMCA, New Delhi (India), 1 Feb 2015 www.conferenceworld.in
1403 | P a g e
Ac = Effective module cell area in m2
Po = Photovoltaic array output power in W
V = D.C. output voltage in Voltage (V)
I = D.C. output operating current in A
Ea= Panel efficiency
REFERENCES
Books:
[1]B.H.Khan,Non Conventional Energy Resources (Tata McGraw Hill Pulication, 2006), 5-21.
Journals:
[2]Adnan Ibrahim, MohdYusof Othman, MohdHafidzRuslan, Sohif Mat, KamaruzzamanSopian, Recent advances in
flat plate photovoltaic/thermal (PV/T) solar collectors, Renewable and Sustainable Energy
Reviews, 15, 2011, 352-365.
[3]R. Hosseini, N. Hosseini, H. Khorasanizadeh, An experimental study of combining a photovoltaic system with a
heating system, World Renewable Energy Congress 2011 Sweden, 8-13th may 2011.
[4]K. Furushima, Y. Nawata, Performance evaluation of photovoltaic power generation system equipped with a
cooling device utilizing siphonage, Journal Solar Energy Engineering ASME, 128(2), 2006, 146-151.
[5]M. Abdolzadeh, M. Ameri, Improving the effectiveness of a PV water pumping system by spraying water over
the front of photovoltaic cells, Renewable Energy,34, 2009, 91-96.
[6] H.G. Teo, P.S. Lee, M.N.A. Hawlader, An active cooling system for photovoltaic modules, Applied Energy, 90,
2012, 309-315.
[7]H. Bahaidarah, Abdul Subhan, P. Gandhidasan, S. Rehman, Performance evaluation of a PV (photovoltaic)
module by back surface water cooling for hot climatic conditions, Energy, 59, 2013, 445-453.
[8]P. Gang, Fu Huide, Z. Huijuan, JiJie, Performance study and parametric analysis of a novel heat pipe PV/T
system, Energy, 37(1), 2012, 384-395.
[9]S. Krauter, Increased electrical yield via water flow over the front of photovoltaic panels, Solar Energy
Materials & Solar Cells, 82, 2004, 131-137.
[10]Hongbing Chen, Xilin Chen, Sizhuo Li, Hanwan Ding, Comparative study on the performance improvement of
photovoltaic panel with passive cooling under natural ventilation, International Journal of Smart Grid and
Clean Energy, 3(4), 2014, 374-379.
[11]Shiv Lal, Pawan Kumar, Rajeev Rajora, Performance analysis of photovoltaic based submersible water
pump, International Journal of Engineering and Technology, 5(2), 2013, 552‐560.

International conference on Science, Technology and Management ICSTM-2015
YMCA, New Delhi (India), 1 Feb 2015 www.conferenceworld.in
1404 | P a g e
ROLE OF INFRASTRUCTURE AVAILABILITY
IN INDUSTRIAL DEVELOPMENT OF RESOURCE
RICH STATES OF INDIA WITH RESPECT TO
JHARKHAND
Bimal Chandra Roy
Assistant Professor, Department of Architecture, Birla Institute of Technology, Mesra, Ranchi (India)
ABSTRACT
Growth and diversification of industrial activities in any country or region can take place if there is adequate
availability of resources along with financial and social infrastructure in the economy. Furthermore, the lack of
integration among physical, financial and social development is also very instrumental in unpleasant economic
growth. Interestingly, in the Indian states, the situation is more robust. This study tries to find out the state level
disparities in terms of various parameters considered for facilitating the industrialisation process for the
selected states. Further, using OLS Regression the study finds out the impact of various infrastructures on the
industrial development of the selected mineral rich states formulating different models.
Keywords: Disparity, Economic Growth, Industrial Development, , Infrastructure, Regression,
Resource Rich
I INTRODUCTION
It is widely recognized that industrialization, intended as the shift from agriculture to manufacturing, is key to
development: hardly any countries have developed without industrializing. This phenomenon has been so
striking to induce some economists to hypothesize that the manufacturing sector is the engine of economic
growth, the so-called “engine of growth argument” (Kaldor, 1967; Cornwall, 1977). Infrastructure plays a
leading role in industrial development. .The causal study by many researchers has established that in long run
infrastructure is the leader and the industrial development is the follower.
In Indian context the main characteristic of development has been the wide regional disparity in development
levels. Since India is a vast country, the geographical diversity does create some imbalance in resource base. A
country with more than 65 years of planned development should have exploited the available resources of the
different regions to stimulate some sort of development in every region. No doubt, the efforts have been made in
this direction, but wide regional disparity is still a ground reality in India (Gulati, S.C. ,1977; Ghosh, B. and P.
De,1998; Dadibhavi, R.V. ,1991).

International conference on Science, Technology and Management ICSTM-2015
YMCA, New Delhi (India), 1 Feb 2015 www.conferenceworld.in
1405 | P a g e
However, this study focuses on Jharkhand, which is one of the most mineral rich states of India. The study
initially reviews the level of industrial development and the availability of the infrastructure facilities of
Jharkhand with respect to the other mineral rich states of Maharashtra, Orissa, Tamilnadu and West Bengal.
Formulating composite indices for different components of infrastructure, the extent of disparities among the
districts is found. Further using the econometric models it is seen as to how far the mineral production,
infrastructural availability and the institutional quality for the selected mineral rich states, is influencing their
industrial development.
Further investigation reveals that „Infrastructure‟ is contributing maximum (out of the components considered -
mineral production, infrastructure and institutional quality) as suggested by the highest coefficient values under
infrastructure head for all the models. The next contributing component is the institutional quality of the states.
However in all the three models considered, value of mineral production per capita is not found to be
contributing significantly if the other infrastructural availability with proper institutional quality is not
significant. The paper further tries to find out the contribution/impact (numeral values) of different components
of the industrial development models which may find its implication in formulation of the useful policy tools for
the urban planners
II IDENTIFICATION OF VARIOUS PARAMETERS CONTRIBUTING TO INDUSTRIAL
DEVELOPMENT
Every parameter, on which development index of a region depends, has a correlation amongst each other. The
parameter may be positively or negatively correlated i.e. increase in the level of one parameter may increase or
decrease the level of other in question, but all the most they have some level of relation.
The correlation obtained from state level data obtained and generated for each state of Jharkhand as well as
developed states of Maharashtra, Orissa, Tamilnadu and West Bengal gives vital directions into dependency of
one parameter on other, both for Jharkhand as well as developed states. The parameters with which the
correlations of level of industrialisation have been derived may be listed below as:
Resource parameters: Mineral Reserves; Per Capita Value of minerals production;
Physical infrastructural parameters: Road length in states per 100 Sq.Km; Railway route length in states per
100 Sq.Km; Electricity availability per 1000 population [total]
Banking Infrastructure parameters: Number of banks; Per capita bank deposits; Per capita bank credits to
industry;
Social Infrastructure parameters: Literacy rate; Infant Mortality Rate
Institutional Quality parameters: Case Disposal Ratio per court; C-D Ratio of Banks; Ratio of Surfaced roads to
total roads; Number of times President‟s rule imposed; Number of times CM headed a coalition government

International conference on Science, Technology and Management ICSTM-2015
YMCA, New Delhi (India), 1 Feb 2015 www.conferenceworld.in
1406 | P a g e
III INTERSTATE DIFFERENCES WITH RESPECT TO VARIOUS PARAMETERS
The parameters for analysing the interstate differences for the considered resource rich states are taken from
various development aspects like per capita income which is generally used as a routine economic indicator,
percentage of urban population as a demographic parameter, annual average growth rate of the industry sector as
an industrial development parameter, road length, railway route length, percent of villages electrified as
parameters for physical infrastructure, number of commercial banks and credit deposit ratio as parameters of
banking infrastructure and literacy rate and infant mortality rate as parameters of social infrastructure.
Table 1.0: Interstate Differences with respect to various parameters
Infrastructure Measures Jharkhand Maharashtra Odisha Tamilnadu West
Bengal
India
Per capita income(Rs.) 21734 66729 25708 51117 31673 35993
% of urban population 22.25 42.4 33 43.86 28.03 27.8
Annual average growth rate in
industry sector (%) 5.30 9.16 8.04 8.79 5.44 6.87
No. of scheduled commercial
banks offices 2118 9053 3196 7253 5796 96059
Road length per 100 Sq.Km 29.99 133.41 166.23 147.89 337.13 115.30
Railway route length per 1000
Sq.Km 24.89 18.20 15.81 31.23 44.36 19.61
% of villages electrified 31.1 88.3 62.6 100 97.3 83.7
Credit deposit (C-D) ratio (%) 33.62 87.08 46.92 116.16 62.87 78.09
Literacy rate (%) 56.21 75.48 64.36 73.86 71.16 65.46
Infant mortality rate (%) 28 17 40 19 26 29
Total major mineral reserves
(million tonnes)
82982.98 10799.01 73920.00 33373.92 29956.71 --
Source: Census 2011, Various Data Tables of Planning Commission of India for 2011, GSI & CMPDI 2010
For most of the infrastructure measures shown in Table 1.0,covering the different aspects of socio-economic
development, Jharkhand is found to be lagging behind, among the states considered as well as at the national
average perspective. A paradox (reflecting a mineral resource conflict) may be noticed that-in the total mineral
reserves, Jharkhand is the leading state having maximum value but for all the other developmental parameters
considered, Jharkhand is found to be an underperformer among the states considered and it is far below the
national average except only one parameter i.e. the railway route length.
IV DATA AND METHODOLOGY
The study is mainly based on the secondary data for the selected mineral rich states of Jharkhand, Maharashtra,
Orissa, Tamilnadu and West Bengal, which measures the level of industrialisation and the infrastructural

International conference on Science, Technology and Management ICSTM-2015
YMCA, New Delhi (India), 1 Feb 2015 www.conferenceworld.in
1407 | P a g e
availability for the period 2001-2011. The data of, value of mineral production are referred from various issues
of annual reports of Indian Bureau of Mines (IBM) and infrastructure facilities are referred from the statistical
abstract from Directorate of Economics and Statistics of the respective states, Planning Commission annual
reports, , whereas demographic statistics of individual states are taken from Statistical Abstract, State Census
data , are considered for the analysis.
4.1 Research Method
Common problems with such type of analysis are multicollinearity and dimensionality. Principal component
analysis (PCA) is used as a statistical tool to remove these problems. Dimension reduction technique of Factor
analysis which uses PCA is applied to those variables/proxies which are highly correlated amongst each other
Since the units of measurement of correlated variables are different, the rotated component matrix using PCA is
used in order to obtain the corresponding weights. Since a variable should not have an artificially higher weight
due to its higher variance, the data are standardized with variance one (1) and mean zero (0) before applying
PCA. Principal components having Eigen values greater than one (1) are selected. After standardizing the data,
it is multiplied with the weight as suggested by PCA to arrive at the corresponding indices or. The obtained
weights are multiplied by the corresponding standardized values of the variables to arrive at the composite
indices.
V MODELS
For better understanding the impact of various components like Value of Mineral Production Per Capita
[VMPC], Infrastructure which covers mainly the Physical Infrastructure [PI], Banking infrastructure [BI] and
Social Infrastructure [SI] parameters along with the various parameters of Institutional Quality [IQ], on the
industrial development, the following model is formulated -
Y i = αi+i (VMPC) i + λi (Infrastructure) i + θi (IQ) i + εi
Where Y i represents the level of industrial development of the ith
state, VMPC is the value of mineral
production per capita, Infrastructure is composite contribution of PI,BI and SI, IQ is the composite contribution
of the parameters considered under Institutional Quality. Composite contribution can be assessed by formulating
the corresponding composite indices. α is the intercept, , λ and θ are the corresponding co-efficient of the
different parameters of industrial development and ε is the error term.
The level of industrial development may be analysed using- share of industry sector in SGDP, share of
manufacturing sector in SGDP and the per capita income of the selected states.
The subsequent models can be rewritten as-
YSISi = αi+i (VMPC) i + λi (Infrastructure) i + θi (IQ) i + εi (I)
YSMSi = αi+i (VMPC) i + λi (Infrastructure) i + θi (IQ) i + εi (II)
YPCIi = αi+i (VMPC) i + λi (Infrastructure) i + θi (IQ) i + εi (III)

International conference on Science, Technology and Management ICSTM-2015
YMCA, New Delhi (India), 1 Feb 2015 www.conferenceworld.in
1408 | P a g e
Where YSISi represents the level of industrial development in terms of share of industry sector in SGDP for the
ith
state, YSMSi is the level of industrial development in terms of share of manufacturing sector in SGDP for the
ith
state, and YPCIi is the per capita income for the ith
state, of the selected states.
VI RESULTS AND DISCUSSIONS
The results are analysed using the different composite indices formulated, which is used in studying the
interstate disparities, as well as the solutions to the different models. The three alternative equations have been
solved for all selected states as a group and for parallely for the individual states. As the result of Model I did not
give significant results, in the second section, the study discusses the results of the Model II and Model III only.
6.1 Results of OLS regression between level of industrial development, VMPC, Infrastructure
and IQ [For all the states as a group]
Values of Table 2.0 suggest that Model-I is not explaining the variances in the data, but the rest models i.e.
Model-II and Model-III are contributing to the level of industrial development of the resource rich states, which
are shown by the highly significant values of F-Statistics.
Further investigation reveals that „Infrastructure‟ is contributing maximum (out of the components considered -
mineral production, infrastructure and institutional quality) as suggested by the highest coefficient values under
infrastructure head for all the models. The next contributing component is the institutional quality of the states.
However in all the three models considered, value of mineral production per capita is not found to be
contributing significantly which may be an indication that mineral production without any value addition is not
contributing in its maximum extent.
Table 2.0: Regression values for the resource rich states under consideration for Model-I, Model II and
Model III [Contribution of different components to industrial development]
Intercept VMPC Infrastructure IQ
Model I 3.614 0.0104
(1.0335)
0.0769
(1.627)
0.0212
(0.4268) AR2 0.8046
F-Statistics 1.682
Model II 4.135 -0.0167
(-0.672)
2.461***
(3.897)
0.072**
(2.725) AR2 0.594
F-Statistics 22.502***
Model III 6.589 -6.535
(-0.6028)
2.589***
(7.195)
0.340***
(5.234) AR2 0.854
F-Statistics 140.322***
Abbreviations: VMPC-Value of mineral production per capita, IQ- Institutional Quality.

International conference on Science, Technology and Management ICSTM-2015
YMCA, New Delhi (India), 1 Feb 2015 www.conferenceworld.in
1409 | P a g e
*** Significant at 1% significance level ** Significant at 5% significance level
Further it would be better if Model-II and Model-III are further analysed at individual state level. The next
section takes a look into the interstate differences for the various components contributing to the industrial
development, at individual state level.
6.2 Results of OLS regression between level of industrial development, VMPC, Infrastructure
and IQ [For individual state]
It is clear from the value of Table 2.0 that only Model-II and Model-III are contributing models, hence for these
models, the level of industrial development is analysed, for the individual state under consideration.
Table 3.0: Regression values for the resource rich states under consideration for Model- II and Model-III
*** Significant at 1% significance level
** Significant at 5% significance level
Table 3.0 shows that, Model-III which measures the industrial development with respect to per capita income is
found to be highly significant for all the states. Model -II, which measures the industrial development with
respect to share of manufacturing sector, is significant only for Maharashtra, Tamilnadu and West Bengal. This
may be explained as these states are the better performing states in terms of industrial development, while the
states of Jharkhand and Orissa, are not contributing, reflecting the low level of industrial development in these
states.
Further, the comparative analysis of the states, suggests the lowest value of Adjusted R2 in Model-II is 0.491
which corresponds to Jharkhand. Similarly in Model-III, Jharkhand has the lowest Adjusted R2 value of 0.6032.
The lowest Adjusted R2 values suggest that (for both the models), Jharkhand is not performing satisfactorily and
is lagging behind amongst the other resource rich states.
States Model-II Model-III
Intercept AR2 t-Stat. F-Stat. Intercept AR
2 t-Stat. F-Stat.
Jharkhand -21.06 0.491 0.4573 0.2092 60.94 .6032 6.1436***
37.74***
Maharashtra 37.34 0.753 3.041**
5.166**
-244.29 0.8293 6.6880***
44.72***
Orissa 33.02 0.584 1.701 2.894 -756.6 0.617 3.9388***
15.51***
Tamilnadu -21.77 0.723 2.317**
10.638***
372.82 0.845 14.923***
32.70***
West Bengal 37.20 0.595 2.89**
8.375**
734.91 0.767 5.533***
30.68***

International conference on Science, Technology and Management ICSTM-2015
YMCA, New Delhi (India), 1 Feb 2015 www.conferenceworld.in
1410 | P a g e
VII CONCLUSION
The above study thus leads us to believe that the Industrial Development level of a region is substantially
determined by the level of Infrastructure available therein. Different types of infrastructure affect different facets
of development and the interactions between them are such that infrastructure is the leader and development is
the follower in most cases. Moreover, specific developmental stage of a region is also a crucial factor that
determines the nature and magnitude of the association between different components of infrastructure and
development level. The outcome of the study seems to highlight the immediate need for infrastructural
expansion and development in Jharkhand.
REFERENCES
[1] Kaldor, N., Strategic Factors in Economic Development, Cornell University Press, Ithaca, New York, USA,
1967.
[2] Cornwall, J., Modern Capitalism: Its Growth and Transformation, London, Martin Robertson, 1977.
[3] Gulati, S.C. , Dimensions of Inter-District Disparities, Indian Journal of Regional Science, 9(2), 1977.
[4] Ghosh, B. and P. De , Role of Infrastructure in Regional Development - A Study over the Plan Period,
Economic and Political Weekly, 33(47), 1998.
[5] Dadibhavi, R.V. , Disparities in Social Infrastructural Development in India: 1970-71 to 1984-85, Asian
Economic Review, 33(1), 1991.