design and manufacturing rules for maximizing the...
TRANSCRIPT

Design and manufacturing rules formaximizing the performance ofpolycrystalline piezoelectric bendingactuators
Noah T Jafferis, Michael J Smith and Robert J Wood
School of Engineering and Applied Sciences, Harvard University, Cambridge, MA, USAWyss Institute for Biologically Inspired Engineering, Harvard University, Boston, MA, USA
E-mail: [email protected]
Received 1 December 2014, revised 16 February 2015Accepted for publication 25 March 2015Published 11 May 2015
AbstractIncreasing the energy and power density of piezoelectric actuators is very important for anyweight-sensitive application, and is especially crucial for enabling autonomy in micro/milli-scalerobots and devices utilizing this technology. This is achieved by maximizing the mechanicalflexural strength and electrical dielectric strength through the use of laser-induced melting orpolishing, insulating edge coating, and crack-arresting features, combined with features for rigidground attachments to maximize force output. Manufacturing techniques have also beendeveloped to enable mass customization, in which sheets of material are pre-stacked to form alaminate from which nearly arbitrary planar actuator designs can be fabricated using only lasercutting. These techniques have led to a 70% increase in energy density and an increase in meanlifetime of at least 15× compared to prior manufacturing methods. In addition, measurementshave revealed a doubling of the piezoelectric coefficient when operating at the high fieldsnecessary to achieve maximal energy densities, along with an increase in the Young’s modulusat the high compressive strains encountered—these two effects help to explain the higherperformance of our actuators as compared to that predicted by linear models.
S Online supplementary data available from stacks.iop.org/sms/24/065023/mmedia
Keywords: piezoelectric, actuators, fracture strength, high field/high strain effects, energydensity optimization
(Some figures may appear in colour only in the online journal)
1. Introduction
1.1. Importance of improving energy density, lifetime, andmanufacturability
We report on efforts related to material processing, optimi-zation, and testing of PZT-5H used to manufacture actuatorsfor microrobots, with the goal of improved robustness andtransducer efficiency. Maximizing power density and fracturestrength is especially crucial for small robots [1–5] and otherdevices (such as mechanical grippers [6], micro-valves [7],
adaptive optics [8], knitting machines [9], braille displays[10], and many more) that rely on oscillating power delivery,as weight can be a limiting factor. Besides being readilyavailable, PZT-5H is chosen for its combination of highpiezoelectric coefficients and modulus, while maintainingrelatively high fracture strength (compared with single-crystalPZT, for example). Additionally, the processing considera-tions described in this work are likely to be applicable forincreasing fracture strength in other polycrystalline ceramicsas well. While bulk PZT can produce very high forces, itsdisplacement is typically too low (sub-micron) for powering
Smart Materials and Structures
Smart Mater. Struct. 24 (2015) 065023 (18pp) doi:10.1088/0964-1726/24/6/065023
0964-1726/15/065023+18$33.00 © 2015 IOP Publishing Ltd Printed in the UK1

micrometer to centimeter scale mechanisms, even with the useof mechanical transmissions. Hence, the standard bimorphactuator configuration is utilized as a strain amplificationmechanism, in which two plates of PZT are bonded together sothat the actuator bends as the voltages on each plate are varied.This bending results in relatively high tensile surface strain onthe PZT, which can induce fractures leading to actuator failure.Typically, when a brittle material is cyclically strained, thecloser it gets to the instantaneous failure strain during thiscycling, the fewer cycles it can withstand. Hence, increasingthe failure strain not only allows greater instantaneous bendingbefore fracture, it is also expected to increase lifetime whenoperated at the same strain levels.
Before moving on to our approach for improving theseaspects of actuator performance, we look briefly at the currentstate-of-the-art for manufacturing PZT bimorph actuators:
1.2. Current state-of-the-art
A variety of methods for machining PZT (since we arefocusing on bulk polycrystalline materials, rather than sol-geldeposition, for example, the PZT plates must be cut in orderto produce the desired shape) have been explored, includingdiamond saws [11], powder blasting [12], water jet [13], andlasers [14, 15] (also, see [12] for an overview of some of thesemethods). Table 1 compares failure strengths/roughnessesresulting from some of these methods, as well as from theprocess described in this work. Compared to the otheravailable methods, several advantages of laser-cutting aresmall feature size and cut width, the ability to cut complexpatterns, and relatively clean cuts, but heating can be pro-blematic if not properly controlled. In addition to machiningthe bulk PZT, it must also be bonded together and assembledto produce bimorph actuators. One approach is to use aninactive central layer, such as carbon fiber composite (CF),that bonds the PZT together and provides electrical contact, asin [16]. Other methods include interdigitated electrodes on asingle PZT plate [17], which can harness the typically higherd33 coefficient but the electric field doesn’t penetrate throughthe entire material thickness.
2. Maximizing energy density and lifetime
In order to maximize the energy density and lifetime of piezo-electric actuators, we proceed along two routes: increasing the
fracture strength of the bulk PZT plates (covered in this section)and improved manufacturing techniques that both increase theavailable force output and distribute strain more uniformly alongthe length of the actuator (covered in section 3).
2.1. Flexural strength (mechanical)—bulk PZT
2.1.1. Edge treatment—laser or polishing reduces localsurface roughness. To develop a method for improvingthe flexural strength of PZT we hypothesize that crackformation initiates at grain boundaries on the cut edges of thesamples (i.e. intergranular fracture—this is the more commonmode of fracture for soft PZT materials like PZT-5H [18]). Ifthis is the case, then reducing the edges’ surface roughness atthe scale of the grain size should increase flexural strength.We test this through two methods for surface roughnessreduction—mechanical polishing and laser-induced melting.
We use a diode-pulsed solid-state laser (PhotonicsIndustries DC150H-355, a Nd:YVO4 laser with 355 nmwavelength) to cut sheets of material through ablation—apulsed laser is used to achieve higher instantaneous powerdensity and the shorter time of exposure means that lessheating of the surrounding material occurs, resulting in a ‘cold’ablation process. However, as we shall see shortly, theevidence indicates that localized melting does occur, at leastfor the PZT. The laser has a maximum average power output of0.63 W (measured at the workpiece) when operated at 20 kHz.At this frequency, the pulse duration is 16 ns, resulting in aninstantaneous power of 2 kW during each 32 μJ pulse. Thebeam is also highly focused—its spot size of about 10 μm indiameter leads to maximum average power densities of8 GWm−2 and maximum instantaneous power densities of25 TWm−2. As a comparison, our energy density per pulse is40 J cm−2 (and down to 15 J cm−2 for lower power cuts), while[14] used 13–38 J cm−2, and [15] went up to 70 J cm−2.Throughout this paper, we will refer to the average power usedfor various laser treatments, but keep in mind that it is thepower density that is crucial for achieving the desired effects.
To test the effect of mechanical polishing, PZT samplesare first laser scored and cleaved (i.e. the material is placedbetween two glass slides, with the laser-score lined up withthe edge of slides, and then pressed carefully until it cleaves atthe score line)—this provides a much straighter edge thensamples that are only cleaved. The PZT is then placed into afixture and the sample sides parallel to the longitudinal axesare polished using 1200/inch grit polishing paper until asmooth curved edge is achieved. This reduces surfaceirregularities and produces a full radius in place of the sharpedges (which is expected to be an additional benefit forfracture strength) per ASTM Testing Standard C1161-02C (2008).
To measure the effect of the laser or polishing on edgeroughness, we prepared samples cut at various laser powerspart of the way through the sample, followed by cleaving.This allows a comparison to be made between the portion ofeach sample that is cleaved and the portion that is laser-treated. Using a confocal laser microscope, we take images ofthe exposed edges of the PZT and measure the roughness for
Table 1. Comparison of roughnesses and failure strengths for severalPZT machining methods.
Antonet al [11]
Misriet al [12]
Annoniet al [13] Our results
σmax 115 MPa 145–160 MPaϵmax 0.26% 0.29–0.32%R 8 μma <1 μmb 3.5 μmb 0.1–0.7 μmc
a
Flaw size.b
Ra.c
Rq.
2
Smart Mater. Struct. 24 (2015) 065023 N T Jafferis et al

each sample. The resulting images are shown in figure 1, withthe following sample treatments: (a)–(d) are scored with thelaser to about half-way through the material (30–70%), atpowers of 0.63, 0.58, 0.40, and 0.23 W, respectively, and (e)is cleaved and then polished. At a large scale (10 s ofmicrons), parallel ridges and troughs can be seen in the laser-cut samples—this is a result of the pulsed nature of the laserbeam (combined with the lateral speed of travel). However,on the scale of the grain size (a few microns), the roughness isseen to decrease by a factor of 2–3 with increasing laserpower—a plot of this roughness versus laser power is shownin figure 2; the roughnesses for the cleaved and polishedsamples are also indicated, showing that mechanical polishingalso reduces the roughness substantially (to slightly lowerroughness than that achieved with the full-power laser
treatment). Interestingly, the laser power that is required tocause a significant reduction in roughness increases as thesize-scale over which the roughness is measured increases—from 0.4–0.6W at the 30 μm scale, to 0.2–0.4W at 8 μm, to0–0.2 W at 3 μm. We postulate that this is due to thefollowing phenomenon: as the size-scale over which theroughness is measured increases, the measurement effectivelyprobes greater depths away from the idealized location of thecut (i.e. into the page for the images shown in figure 1). Sincethe depth to which the material is melted is expected toincrease with increasing laser power, this would result in theobserved behavior. This effect is useful, because it allows usto estimate the relevant size-scale for the material propertiesthat we are trying to improve (e.g. flexural strength)—that is,after determining the power that is needed to significantly
Figure 1. (a) Cut about 30% through using 0.63 W laser power; the remainder is cleaved. (b) Cut about 60% through using 0.58 W laserpower; the remainder is cleaved. (c) Cut about 70% through using 0.40 W laser power; the remainder is cleaved. (d) Cut 50–80% throughusing 0.23 W laser power; the remainder is cleaved. (e) Sample laser scored and cleaved, followed by polishing (the boxes labeled 1–5 areregions from which roughness measurements were taken). All images are intensity maps taken with a confocal microscope using the samelighting (for (a)–(d)).
3
Smart Mater. Struct. 24 (2015) 065023 N T Jafferis et al

effect the property in question, figure 2 can identify the size-scale which results in significant roughness reduction/surfacemelting at that power. Further, we note that after such meltingand resolidifying, the affected material is no longer expected tobe stoichiometric PZT due to incongruent melting [19]. Toconfirm this, we take several EDS measurements to comparecleaved and laser-treated areas. The results, shown in figure 3,indicate that the new material has an enhanced percentage of Zrand Ti, which is likely due to preferential vaporization of PbO[19]. A trace of Ni is also detected, but in both the cleaved andlaser-treated areas—this is thus likely due to contaminationfrom the Ni coating on the electrodes of the initial PZT samples.The EDS measurements probe to a depth of a few microns,which may be similar to the thickness of the melted layer.Hence, while these measurements clearly show a significantcomposition change, they may not provide exact values.
Now that we have methods for reducing the edgeroughness of the PZT at the scale expected to be relevant, wedetermine the effect of this roughness reduction on flexuralstrength through the use of four-point bend tests (see adiagram of this setup in figure 4). An Instron material testingmachine is used to bend beams of PZT 25 mm long, 2 mmwide (b), and 140 μm thick (d)—the width is chosen to beequal to the average width of our standard actuators, while thelength is made just long enough to be easily mounted in theInstron. The maximum strain (ϵ) and stress (σ) at the beam’ssurface are calculated from the applied deflection (δ) andmeasured force (F) using the standard equations:
ϵ δ= × − −( )( )d
L L L L6
2(1)
o i o i
σ = × −F
L L
bd1.5 (2)o i
2
where Lo and Li are support span and load span, respectively(as defined in figure 4). In these bending tests, only one sideof the beam experiences tension (which is expected to triggerfracturing), while the other side experiences compression.Similarly, in the bimorph actuators that are the intendedapplication of these methods, the outer surface experiencesmuch greater tension then the inner surface (which is close tothe neutral axis). Hence, we hypothesize that the fracturestrength may only need improvement on the side of thesample which experiences tension. To test this effect, PZTbeams are fabricated by first scoring to various depths withthe laser (at 0.63 W power), followed by cleaving to completethe cut. The flexural strength is then measured both forsamples with the laser-cut side in tension, and for sampleswith the cleaved side in tension. As can be seen in figure 5(a),the failure strength is 10–25% greater when the laser-cut sideis in tension (up to 145–160MPa and 0.29–0.31% strain, ascompared to 115–130MPa and 0.24–0.25% strain when thecleaved side is in tension), with the improvement increasingwith increasing cut depth up to 65–80% cut depth. Once thelaser has completely cut through the sample, the flexuralstrength is nearly identical regardless of which side is intension. In addition, a comparison with others’ reportedflexural strength data [11] shows that our results with thelaser-cut side in tension are 25–40% higher in failure stress(145–160MPa versus 116MPa) and 10–20% higher infailure strain (0.29–0.31% versus 0.26%) (see figure 5(a)).In figure 5(b), we show the dependence of flexural strength onlaser power—0.23W of power has essentially no effect on theflexural strength, but by 0.4 W, a significant increase hasoccurred. Further increase of laser power up to 0.63Wprovides only slight improvement. Comparing this transitionpower of about 0.3W to the roughness measurements, we seethat this corresponds to a size scale of 3–8 μm—since thematerial grain size is about 4 μm, this supports the notion thatthe improvement in flexural strength is a result of the removalof grain boundaries through surface melting. From thesemeasurements, cutting 65–100% of the way through the PZTusing 0.63 W power gives the best results in terms of flexuralstrength, but we will see in section 2.2 that dielectric strengthmust be taken into account to achieve fully optimizedperformance. Additionally, the flexural strength was mea-sured for polished samples, and found be about 10% greaterthan unpolished ones (figure 5(c)).
2.1.2. Crack-arresting features. While the previous sectionshowed that reducing edge roughness increases the maximumstrain that the PZT can withstand before cracking, we nowpresent a method to slow crack propagation once it has begun,resulting in further increases in ultimate flexural strength: slotsare laser-cut on the broad face of rectangular PZT test samples,parallel to the material longitudinal axis (figure 6(a)), toinvestigate crack-arresting properties. Due to random variationin stress riser location, crack propagation doesn’t proceeddirectly across the sample when the slots are scored at least 80%of the way through the material. Rather, the crack is displacedlaterally as it crosses each slot, by as much as several mm
Figure 2. (a) Roughness versus laser power for several size-scales.The vertical lines indicate ‘transitions’ in the roughness—i.e. wherethe roughness has dropped about half-way from its ‘low-power’ to‘high-power’ value. (b) Roughness after polishing. Measurementswere taken in 4–6 randomly chosen regions from each of the laser-scored/cleaved and polished samples shown in figure 1.
4
Smart Mater. Struct. 24 (2015) 065023 N T Jafferis et al

(figure 6(a)). The idea here is that separating the beam into anumber of parallel narrower beams can effectively change themode of failure from a single abrupt catastrophic failure to aseries of smaller failures. As seen in figure 6(b), the initial failure(cracking to the first slot) strain increases by 8%. The stress atinitial failure decreases by 4% (after adjusting for the smallerwidth of the slotted samples—each of the 3 slots is 20–30 μmwide, leading to a width reduction of 3–5%). The strain whenthe crack has propagated to the third slot is 14% greater than no-slot samples, while the adjusted stress (i.e. once some regions ofthe sample have cracked, its width is reduced) is approximatelyunchanged. This increase in failure strain could be useful foractuators because in practice the PZT layers are adhered to acentral carbon fiber layer, and the metal coating on the PZTconducts around the crack. If the slots are scored less than 65%of the way through, no significant effect is observed, indicatingthat crack propagation is not confined to the surface.
2.2. Dielectric strength (electrical)—bulk PZT
2.2.1. Effect of laser treatment and polishing on dielectricstrength. Based on the results of section 2.1.1, cuttingcompletely through the PZT is an attractive option—thiswould also allow for faster manufacturing (i.e. laminating
Figure 3. (a) EDS measurements (taken from two laser-scored and cleaved PZT samples) comparing the relative percentages of each elementin laser-treated PZT (four measurements) to those in cleaved PZT (four measurements). The error bars show one standard deviation. (b) AnSEM image showing representative cleaved and laser-treated areas.
Figure 4. Four-point bend tests on PZT beams.
Figure 5. (a) Effect of laser-score orientation and score depth (four-point bend test). All cuts were performed using max laser power(0.63 W). The failure stress (triangle markers) and failure strain(circle markers) are shown for various laser-cut depths, and bothwith the laser-cut side in tension and with the cleaved side in tension.Four samples were tested for each condition. Also shown are dashedlines representing the values obtained by Anton et al in [11]. (b)Effect of laser power on failure strength. All samples are cutcompletely through with the laser. The data at ‘zero laser power’ isfrom a laser-cut and cleaved sample with the cleaved side in tension.Also shown are the results from the ‘multi-cut’ process (a low-powerthrough-cut followed by a high-power edge treatment) described insection 2.3. (c) Effect of polishing on failure strength. Measurementswere taken for 3–5 samples in each testing condition for plots (a)–(c); all results are plotted.
5
Smart Mater. Struct. 24 (2015) 065023 N T Jafferis et al

sheets of PZT and CF first, and then cutting out completedactuators—see section 3) and could reduce variability byproviding a more automated/less manual process. However,high-voltage tests reveal that cutting at maximum laser power(0.63 W) reduces the dielectric breakdown strength to only1 V μm−1. These tests are performed after coating the sampleswith cyanoacrylate (CA) glue or parylene to enable testing atfields higher than the dielectric strength of air. In figure 7, itcan be seen that the PZT’s dielectric strength drops rapidlywith increasing laser power—even at only 0.4 W, it is alreadydown to 2.7–3 V μm−1. This is much less than the >6.4 V μm−1 achieved for cleaved PZT (this was the limit ofthe test setup, and is thus a lower bound on the dielectricstrength), and too close to the 2.2 V μm−1 that our PZTactuators have previously been driven to. Laser-scored (about50% through) and cleaved samples achieved 5 V μm−1.Hence, if we are to completely cut through the PZT with alaser, it must be done at powers below about 0.3W. Thispower is sufficiently low that the flexural strength would nolonger be expected to improve much (see section 2.1)—essentially, it appears likely that the same physical process(i.e. surface melting) is the cause of both the increasedflexural strength (i.e. due to the elimination of grainboundaries) and the decreased dielectric strength (likely dueto the change in chemical composition—see section 2.1.1),leading to an intrinsic trade-off between these two properties.However, because the failure strain only needs to be
improved near the surface experiencing the most strain,rather than through the entire material thickness, this trade-offcan be at least partially avoided. Thus, laser-scoring andcleaving is still an option, but for the reasons discussed at thebeginning of this section, we would like a way to use only thelaser. A method to achieve this by combining low-power andhigh-power cuts is presented in section 2.3. In addition, un-coated polished samples were also tested to determinewhether polishing effects dielectric strength in the sameway as laser-induced melting does. Note that polishingremoves some of the metal coating on the PZT, resulting in anincreased distance (about 1.5 times farther for a full radius)between the electrodes—taking this into account, thebreakdown fields achieved for these samples were 3 V μm−1
(which is less than the air-breakdown of around 4 V μm−1
measured for uncoated cleaved-only samples as noted insection 2.2.2 below). This suggests that polishing does notreduce the breakdown field by as much as the full-power laser(which resulted in 1 V μm−1); but is perhaps similar to usingthe laser at 0.4 W.
2.2.2. Coatings to prevent electrical breakdown. To take fulladvantage of the increased flexural strength, the dielectricbreakdown strength needs to be increased beyond that of air.To achieve this, the edges of some PZT samples (where shortsbetween the top and bottom electrodes would occur) arecoated with CA glue, while others are coated with parylene(3–4 μm)—as can be seen in figure 8(a), this allows meanfields of 5.2 V μm−1 for the CA glue case, and at least6.4 V μm−1 (the test limit) for the parylene case, to be appliedbefore breakdown. In comparison, uncoated samples typicallyshorted at ∼3.9 V μm−1. These samples were all cleaved
(a)
(b)
Slots cut along length of sample:
1 mm140
120
100
80
60
40
20
0
Stre
ss (M
Pa)
0.56
0.4
0.32
0.24
0.16
0.08
0
Stra
in (%
)
No Slots
-4%
3 Slots,Initial Failure 3 Slots,‟Final” Failure
1%
8% 14%
0.48
Figure 6. (a) Photos showing slots cut along the length of the PZTsample, and cracks (after four-point bend testing) whose propagationhas been stopped or shifted by the presence of the slots. (b) Failurestrength (triangles = stress; circles = strain) for samples with slotscompared to those without slots. For all samples, the laser-cut side isin tension, the outside is cut about 65% through, and the slots are cut100% through. *The stress is adjusted to account for reduction insample width due to the slots. **The stress is adjusted to account forthe actual sample width before the ‘final’ crack (i.e. once one or moreof the regions between slots have cracked, the sample is narrower).Note: for several of these samples, the test stopped even though onequarter-width of the sample was still intact. Measurements were takenfor 5–6 samples in each testing condition; all results are plotted.
Figure 7. Dielectric breakdown strength of 2 mm by ∼10 mm PZTsamples cut completely through using various laser powers. Alsoshown is data for samples scored about 50% deep with 0.63 W laserpower, followed by cleaving, as well as for samples cut using the‘multi-cut’ process described in section 2.3. The solid lines representthe mean values of the various data. The arrow at zero laser powerindicates that the dielectric strength shown is a lower bound—allthree samples reached the limit of the test setup. Measurements weretaken for three samples in each testing condition; all results areplotted.
6
Smart Mater. Struct. 24 (2015) 065023 N T Jafferis et al

manually in order to test only the intrinsic PZT and/or coatingdielectric strength.
In order for edge coating to be a useful means ofimproving dielectric strength, it must have minimal effect onthe material stiffness—in figure 8(b), we show a comparisonof modulus values (calculated from four-point bend tests) foruncoated, CA glue coated, and parylene coated samples. Theresults show that the CA glue increases the modulus by 2%,whereas the parylene increases it by 1%. Both of thesemeasurements are within sample variation, but in any case,the parylene does better at increasing dielectric strength, andmay improve the failure strain slightly (about 5%), so we willuse only parylene for the remainder of the experimentsinvolving coatings described in this paper.
2.3. Optimal sample preparation
We now present a solution to the dilemma of high laser powerincreasing flexural strength but decreasing dielectric strength.Since we have already demonstrated that most of the flexuralstrength improvement is achieved with cuts 65–100% of theway through the sample (since only one side of the PZTexperiences tension, both in these material tests, and in thefinal actuator), we propose the following: first cutting all ofthe way through the PZT at sufficiently low power to avoiddielectric breakdown, then using a high-power laser to meltjust the top part of the cut surface (see diagram and micro-scope image in figure 9). This allows us to take maximaladvantage of the laser-induced melting by restricting it to onlythose regions where it is most beneficial for fracture strength.To do this requires very precise alignment with the existingcut edges, otherwise the depth to which the high-power lasereffects the PZT will be variable and could cause localshorting. If the side-wall from the low-power cut is close tovertical (which is the case for our samples, as seen infigure 9), the required precision can be approximated by the
lateral shift that would result in some specified change in thebeam intensity at the edge of initial through-cut. For example,based on the plot of dielectric breakdown versus laser power(figure 7), even a change of 0.05W would reduce thedielectric strength by about 0.5 V μm−1 (note: the desiredbeam position is such that it is as close as possible to theexisting cut edge in order to produce a sloping edge from thehigh-power cut, rather than a step; but not so close as toexpose the entire low-power side-wall to the high-powerlaser). Assuming a Gaussian beam intensity profile, andnoting that our high-power cut is at 0.63 W, while the max-imum acceptable level for the low-power cut is 0.23 W, weobtain a desired precision of about 10% of the spot size(which gives 1 μm for our case). The optimal offset of thehigh-power cut also depends on the width and steepness ofthe initial cut, so any changes in these would necessitate achange in the offset. For our cuts, offsetting the high-poweredge treatment cut by 10 μm from the low-power through-cutwas found to melt the PZT’s exposed edge about 50% of theway down from the surface (figure 9). Figures 5(b) and 7show the performance results of samples prepared in theabove manner, using 0.23 W for the low-power through-cutand 0.63 W for the high-power edge treatment—the meandielectric strength (figure 7) is 3.7 V μm−1, and the meanfailure strain (figure 5(b)) is 0.32% (slightly higher than the0.3% measured for laser-scored and cleaved samples). Whilethe dielectric strength is lower than that achieved by laser-scoring and cleaving (since even the 0.23W cut reduces thedielectric strength), it is still higher than the voltages at whichwe typically operate, and the increase in failure strain makesthis a desirable compromise for our applications.
2.4. Other considerations
Before we move on to actuator fabrication, there are a fewother considerations to keep in mind. The first is that all of theflexural strength tests described so far were performed withno electric field applied (i.e. open-circuit). Since the actuatorsthat will be made from this material require high fields tooperate, it is important to check whether this has any effect onthe flexural strength. Figure 10(a) shows that it does havequite a strong effect—the mean failure strain decreasesrapidly from 0.30% at 0 V μm−1 to 0.21% at 1.5 V μm−1,
Figure 8. (a) Effect of coatings on electric breakdown. The arrow forthe parylene-coated samples indicates that the dielectric strengthshown is a lower bound—all three samples reached the limit of thetest setup. (b) Effect of coatings on material stiffness. Measurementswere taken for 3–5 samples in each testing condition; all results areplotted.
Figure 9. Cross-section diagram and photo depicting the multi-cutprocess—a low-power through-cut followed by offset high-powercuts to induce melting only near one side of the PZT.
7
Smart Mater. Struct. 24 (2015) 065023 N T Jafferis et al

then a slower decrease to 0.18% at 3 V μm−1 (400 V for our135–140 μm thick samples). Note that the failure stressappears to be mostly independent of field (figure 10(a))—thisis due to an increase in the modulus (figure 10(b)). It should
be pointed out here that in these experiments, the beam is freeto contract when the electric field is turned on (before thefour-point bend test begins)—that means that this experimentdoes not distinguish between electric field and compressive
Figure 10. (a) PZT failure strength (triangles = stress; circles = strain) and (b) Young’s modulus, plotted as a function of electric field.Measurements were taken for 2–3 samples in each testing condition in parts (a) and (b); all results are plotted. (c) Modulus measurements usingpulling setup. The inset shows the tangent modulus resulting from the model fit to the stress–strain data. (d) Directly measured d31 as a functionof applied electric field. (e) f31 for two scenarios—free contraction (using d31 and stress–stain measurements), and blocked force (from stress–strain measurements at zero strain). A single model that incorporates the variation of f31 with field and strain is plotted for the two scenarios.
8
Smart Mater. Struct. 24 (2015) 065023 N T Jafferis et al

strain as the physical cause of the decrease in failure strainand increase in modulus. In fact, we will show shortly that themodulus effect, at least, is actually due to the compressivestrain rather than the electric field.
In order to determine whether the modulus is actuallydependent on electric field, strain, or some combination, weneed to be able to measure the stress–strain relation for var-ious applied electric fields. Toward this end, we fabricate a4 cm long beam of PZT and affix a reflective marker neareach end so that the PZT’s contraction can be detected usingfiber optic sensors (Philtec D21). Then, one end is glued to afixed stand while the other end is glued to a force sensor(Nano17) mounted on a calibrated translation stage. Adjust-ing the micrometer stretches the PZT beam, but the fiber opticsensors are still needed to accurately and precisely measurethe strain in the beam as the glue used to affix each end of thebeam stretches slightly as well. This stretching of the bond isactually beneficially for this measurement, as it allows us toprobe negative (i.e. compressive) strains as well as extensiveones. Finally, electrical contact is made to each side of thePZT so that an electric field can be applied during the tests.For each voltage applied, the beam is stretched and returnedto its starting length, resulting in a stress–strain plot thatprobes different but overlapping strains for each voltage. Themeasured stress during each test is the sum of the stressinduced by the applied electric field and the stress producedby the external force—since it is this latter stress that we areinterested in, we would like to subtract the contribution fromthe applied field. This contribution is simply the stress forwhich the strain is zero—for electric fields of 1.11 V μm−1
and below, the sample was pulled sufficiently to pass throughthe zero-strain point, so this value is clear. For each stress–strain measurement obtained at electric fields higher than1.11 V μm−1, we proceed as follows: first, find the strainclosest to zero for that field. Second, shift the data so that thestress at that strain matches the stress for all of the lower fieldsthat probed that strain. The resulting plot is shown infigure 10(c). As can be seen, the plots produced for eachapplied field overlap nearly perfectly for strains that werepresent for multiple applied fields. This is the case even forthe higher fields that do not pass through zero strain—eventhough those curves were lined up manually at one strain,their slopes (i.e. the tangent modulus) match well with thoseof other fields. This demonstrates that the primary contributorto the variation in modulus is actually the strain, and not theelectric field. We also plot in figure 10(c) a simple fit to thedata in which the modulus changes from one constant value athigh extensive strain to a different constant value at highcompressive strain (the inset shows this tangent modulus as afunction of strain). The expression used for this fit is:
σ ϵ= − − +
− +
ϵ ϵ
ϵ
−( ( ))( )
EE E
a· ln 1 e
ln 1 e , (3)
a
a
minmax min ( )
·
0
0
σϵ= ∂
∂ = + −+
ϵ ϵ
ϵ ϵ
−
−( )E E E Ee
1 e, (4)
a
amin max min
( )
( )
0
0
where Emin = 38.5 GPa, Emax = 81 GPa, ϵ0 = −0.00047 (strainat which the transition occurs), and a = 8000 (steepness of thetransition). Note that the range of strains over which themeasurements actually take place is about −0.06% to 0.04% ,so the model extrapolation outside of that range may not beaccurate (for example, based on this data, the value of Emax isnot clear, so the four-point bend test data is used as a guide—i.e., the highest modulus observed in that data was 81 GPa).Note that the four-point bending data is actually providing anaveraged modulus over the beam thickness, which isexperiencing a range of positive and negative strains, whichmakes it non-trivial to compare those results with the onefrom the direct modulus measurements. Hence, in this paperwe will merely note that the two sets of results are consistent.
Next, given that we have seen such a large (about 2×)variation in the modulus as a function of strain, the questionarises as to whether other material parameters, like the pie-zoelectric coefficients, also vary with strain and/or field. Forexample, other work has reported large increases in d31 athigh fields for other PZT materials, such as PZT-5A and PZT-5K [20]. Before we describe the measurement setup, we mustchoose which parameters to measure. Although the Young’smodulus (E) and the d31 piezoelectric coefficient are theparameters typically used to describe the behavior of a pie-zoelectric bimorph in actuation mode, d31 is not actually anintrinsic material property like the modulus is. That is, whenan electric field is applied to a piezoelectric, it is an internalforce, or stress, that is produced—the strain that resultsdepends not only on the material properties, but also on theexternal environment. Hence, in this paper we will refer pri-marily to a parameter we will call f31, defined as the internalstress produced per unit electric field (i.e.
σ1,int
3—this is closely
related to the e31 piezoelectric coefficient, which is defined as
− σ∂∂
1
3at fixed strain; see the IEEE Standard on Piezoelectricity
[21]). This is a more useful parameter in our case, since weare looking at high-field and high-strain effects in which thesematerial properties are not constant, and we would also like tobe able to easily apply the results from bulk material mea-surements to bimorph actuators (described in section 2.5)which experience varying external forces.
The setup described above provides us with two meansof measuring f31: the unconstrained contraction of the PZTwhen electric fields are applied (i.e. with the force sensordisconnected) and the measured forces when the force sensoris connected. The first of these gives d31 directly from the rawdata (i.e. measured strain divided by applied electric field),but the (compressive) strain increases along with the appliedelectric field, so these two effects are not separated.Figure 10(d) shows that d31 increases rapidly as the field/strain is increased, but then decreases again more gradually.Since we have already determined that E is primarilydependent on the strain, it makes sense to look at the intrinsicmaterial property f31 instead, to determine whether any of thevariation in d31 can be attributed to this source. To this end,for each free contraction measurement made we usefigure 10(c) (and/or equation (3)) to find the stress that mustbe present given the measured strain—this results in the plot
9
Smart Mater. Struct. 24 (2015) 065023 N T Jafferis et al

shown in figure 10(e). As can be seen, f31 does not decrease athigh fields/strains like d31 does, but rather remains approxi-mately constant after its initial increase. Now that we haveremoved the effect of the modulus increasing with increasingcompressive strain, we can use our measurements from thesetup with the force sensor connected to help determinewhether the f31 variation is due to the field or the strain. First,we can find the stress at zero strain for each applied field (i.e.the blocked force) from the shift in stress that was required toline up the stress–strain plots shown in figure 10(c) (recall thatthis shift was exactly the stress at zero strain for fields of1.11 V μm−1 and below, since that condition was encounteredfor those fields, and this is assumed to be approximately validfor higher fields as well). Dividing by the electric field thengives f31 at zero strain, which is also plotted in figure 10(e).As can be seen, the plots of f31 at zero strain and at varyingstrain are not exactly the same, deferring by up to 30%. Thisindicates that f31 does depend on strain as well as field. Notethat the value of f31 expected from the PZT’s data sheet(which is likely based on low field measurements) is320 pm V−1 × 62 GPa ≈ 20 Pa mV−1—our free deflection d31measurements come close to the reported value at low fieldsand strains (370 pmV−1 at 0.22 V μm−1), but our low-strainmodulus measurements are a bit lower than the reportedvalue. In addition, our blocked force measurements do notextend to sufficiently low fields to verify that they match withthe low-field free deflection measurements, but we assumethat f31 must approach the same value for both cases at lowfields and strains. With this in mind, we have the followingpicture: f31 increases substantially (70–90%) as the electricfield is increased from about 0.3–0.6 V μm−1, and is slightlyhigher at higher compressive strains. Since we know thestrains encountered during the free deflection test, we proposethe following simple model—a weak linear dependence of f31on strain combined with a sigmoid function that decreasesslightly at higher fields for the field dependence:
ϵ= +
× + − −+
−
−( )( )
( )
f b
f f d f
(1 · )
(1 · )e
1 e, (5)
c
c
31
31,min 31,max 31,min
0
0
⎛⎝⎜⎜
⎞⎠⎟⎟
where f31,min = 14 Pa mV−1, f31,max = 29 Pa m V−1,
= × −d 69 10 9 mV−1, 0 = 0.4 V μm−1, = −c 10 5, andb = −230 (recall that we have defined compressive strain tobe negative). There remains a slight discrepancy between thetwo sets of data and this model at fields below 0.5 V μm−1,but our operation is almost always well beyond this, and the
measurement precision is also less for smaller deflections, sowe will ignore this for the purposes of this paper. Also, notethat this model, as well as the model for the modulusvariation, is not based on specific physical principles (whichis beyond the scope of this paper), but rather meant as asimple fit to the bulk property data that will be used later(section 2.5) to predict actuator behavior. That said, thedetermination of the physical source of the variations (i.e.strain and/or field) is crucial for predicting actuator behavior,as different strains can be encountered for same field indifferent situations (e.g. blocked force versus free deflectionversus free beam contraction).
2.5. Complete actuator
Now that we have at hand several methods for improving theperformance of bulk PZT, we proceed to apply these lessonsto bimorph actuator manufacturing to determine their effecton actuator performance. The actuators are fabricated as fol-lows (these steps are illustrated in figure 11): first, individualpieces of PZT (figure 11(a)) and alumina (figure 11(b)) (twoof each per actuator) are cut out using the laser (scored andcleaved for the PZT). The alumina is used as a rigid extensionaffixed to the tip of the actuator—it serves both to amplify theactuator deflection and, along with a trapezoidal shape for thePZT, to distribute stress more uniformly along the length ofthe actuator when an external load is applied at the actuator’stip [16]. Copper-clad FR-4 serves as the base material—thecopper allows traces to be patterned for electrical contacts,and the FR-4 material is amenable to use in the pin-alignmentprocess (PZT and alumina can not be used easily in pin-alignment, due to their brittle nature). Thus, a jig of copper-clad FR-4 is cut with the laser, and a photoresist mask is usedto etch traces in the copper (figure 11(c)). The individual PZTand alumina pieces are then placed carefully into this jig(note: the PZT, alumina, and FR-4 are all cleaned with IPA topromote adhesion), using a slightly tacky layer (gelpak 8) tohold the pieces in place. Two copies are made, and a layer ofcarbon fiber composite (CF) is sandwiched in between, usingpins to align all of the layers. The CF is patterned to match theactuator outlines prescribed by the alignment jig. The CF isused both to adhere the two layers of the bimorph together,and to provide electrical contact to the inner surfaces of thePZT (see diagrams in figures 12(a) and (c)). This sandwich isthen placed into a heat press, which serves to cure the resin inthe CF—a temperature of 180 °C and pressure of about 10 psifor two hours are used to form a good bond to the PZT,alumina, and FR-4 (figure 11(d)). After this, the laser is then
Figure 11. Process steps for ‘standard’ actuator manufacturing. (a) Laser-scored and cleaved PZT. (b) Laser-cut alumina tips. (c) Laser-cutcopper-clad FR4; photoresist mask used to wet-etch copper. (d) PZT and alumina manually placed into FR4 jig and bonded to CF using aheat press. (e) Final actuators after release cut with laser, and conductive epoxy applied. Each scale bar is 1 cm long.
10
Smart Mater. Struct. 24 (2015) 065023 N T Jafferis et al

used to cut the individual actuators out of the alignment jig.The final steps are to electrically connect the PZT to thecopper traces—this is done using conductive epoxy for eachof the three connections (one on each outer PZT surface, andone through a via hole in the FR-4 to the central CF)—and toattach ‘bridges’ at the interface between the PZT and aluminaextension. The ‘bridges’ prevent bending at this interface, andare affixed manually with CA glue. An example of a com-pleted actuator is shown in figure 11(e).
2.5.1. Energy density. To measure the effect of laser-inducedmelting on actuator performance, we fabricate actuators inwhich the PZT pieces are laser-scored about 50% of the waythrough the material thickness and then cleaved. One set ofactuators is assembled so that the laser-scored edges are onthe inner side, while the other set has the laser-scored edgeson the outside (figures 12(a) and (b)). These actuators are
characterized through three tests—free deflection and blockedforce as a function of applied electric field, and lifetime(covered in section 2.5.2) under loaded conditions close tohalf of the free deflection, half blocked force operating point(which provides maximum power output for a spring load).
Free deflection is measured optically, viewing theactuator from the side (figure 12(d)), while blocked force ismeasured by positioning a force sensor (Nano17) so that itjust touches the tip of the actuator when the actuator is off(figure 12(d)). In addition, side-view video is also recordedduring the force measurements, which is crucial for diagnosticpurposes, as we shall see later. Finally, endurance measure-ments are performed by affixing a spring load to the actuator,positioned so that the deflection under load is close to half ofthe free deflection—the other end of the spring is affixed tothe force sensor, so both force and deflection (from video) areobtained. Figure 13(a) shows the results of the free-deflection
Figure 12. (a) Side-view diagram of the ‘laser-in’ PZT bimorph actuators. (b) Same as (a), but for the ‘laser-out’ actuators. (c) Top-viewdiagram of the actuators. (d) Side-view photo of one of the actuators positioned for blocked-force measurements.
Figure 13. A comparison of ‘laser-in’ and ‘laser-out’ actuators, along with the standard linear model and the new model presented insection 2.5.1. Also shown are results for the ‘pre-stacked’ actuators discussed in section 2.3. (a) Free deflection (peak-to-peak) and maximumsurface strain. (b) Blocked force (one-way).
11
Smart Mater. Struct. 24 (2015) 065023 N T Jafferis et al

measurements, with the surface strain also indicated, whilefigure 13(b) shows the blocked forces. The strain is calculatedas ϵ = δD
L
·2 , where D is the total actuator thickness, δ is the
deflection (one-way) of the tip of the PZT, and L is the lengthof the PZT (recall that there is a rigid extension affixed to theend of the PZT, and the peak-to-peak deflection values are forthe end of this extension).
Most of the actuators were characterized only up to 300 V,but several were tested by increasing the voltage until failure—most of these failures occurred during blocked force measure-ments, and shorting was one of the main culprits. Note thatonly at very high fields (4.3–4.4 V μm−1, or 600 V for our case)does the strain on the actuators’ surfaces approach theinstantaneous failure strain measured for high fields (figure 10),so we do not necessarily expect to see a clear differencebetween the ‘laser-in’ and ‘laser-out’ samples in these tests. Inparticular, figure 10 showed that the failure strain drops toabout 0.18% by 3 V μm−1, and is not changing much at thosefields (e.g. about 0.19% at 2.2 V μm−1), while the actuatorsonly reach 0.17% strain if they are brought to 4.4 V μm−1
(figure 13(a)), which is the highest we could reach in this setup.The blocked force measurements (figure 13(b)) show a
considerable variation in performance sample-to-sample—for
example, at 300 V the mean force was 107 mN, but with astandard deviation of ±13%. Careful inspection of the videosrecorded during the blocked force tests reveals that bending isoccurring at the interface between the PZT and the base FR4,and the actuators that show a smaller amount of such bendinghave a higher force output. This indicates that a more rigidattachment mechanism is need at this interface, just as‘bridges’ are used at the interface with the extension. In fact,by comparing the curvature of the PZT in free deflection (κ f )to that in blocked force (κb; which would ideally be zero), wecan obtain an estimate of the expected blocked force:
= ≈κ κ−FbF
,exp 1b
b f
,meas 150–170 mN for these actuators. An
example of this is shown in figure 14—as can be seen, thecurvature in ‘blocked force’ is a substantial fraction (about75% in this case) of the curvature in free deflection).
As expected, little difference is seen between the ‘laser-in’ and ‘laser-out’ samples, in terms of their energy density ata given electric field, but we will take a moment here toconsider what deflections and forces we should expect giventhe bulk material properties of the PZT.
The standard piezoelectric bimorph equations, includingadjustment factors to account for the effect of the rigidextension and trapezoidal shape of the actuator [16] are asfollows:
δ
=+ +
+ + +
−
( )
( )d E t t t LL
L
E t t t t tE t
0.5
( ) 1 2 ,
13
1.5 3 212
(6)
p p
P P P
P P P P
31 CF act2 ext
act
CF2
CF2 CF CF
3
⎛⎝⎜
⎞⎠⎟
=
+( )F
d E W t t t
L0.75
( )GF, (7)b
P P P31 nom CF
act
where
where δ −p p is the peak-to-peak deflection at the actuator tip,d31 is the piezo coefficient, EP is the modulus of the PZT, ECF
is the modulus of the carbon fiber, tp is the thickness of thePZT, tCF is the thickness the carbon fiber, Lact is the length ofthe PZT, is the applied electric field, Lext is the length of thealumina extension, Fb is the blocked force (one-way), wnom isthe average width of the PZT, wr is the width ratio (the widthof the PZT’s base divided by wnom), and lr is the length ratio
( )L
Lext
act. Using the values for d31 and EP reported in the PZT’s
data sheet (320 pm V and 62 GPa), these equations are plottedin figure 13 along with the measured data. As can be seen,this model predicts deflections only about half of what our
Figure 14. Example of an actuator with a weak base attachment. (a) The actuator in free upward deflection. (b) The same actuator in ‘blockedforce’ (note: with no applied field, the actuator’s neutral position is just touching the force sensor).
=− +
− − − + − + + − + − + −
wL
L
w l w w l w ww
w
GF
8(1 ) 1 2
6( 1)( 3 4 ( 1) 2 ) 3( 2 2 ( 1) ) ln2
, (8)r
r r r r r r rr
r
3 ext
act
2
⎛⎝⎜
⎞⎠⎟
⎛⎝⎜
⎞⎠⎟
12
Smart Mater. Struct. 24 (2015) 065023 N T Jafferis et al

measurements indicate, and the force prediction is 32%higher then the mean of our measurements. Recall that ourmeasurements in section 2.4 showed that f31 and Ep
actually vary with applied field and strain, providing apossible explanation for the discrepancy we see in ouractuator performance. To confirm, we must adjustequations (6) and (7) to account for the actual dependen-cies of the material properties. Blocked force is simpler—since the strain is ideally very small in this thisconfiguration, we approximate the result by plugging inthe field dependency of f31 (i.e. ×d E31 ) at zero strain(from equation (5)). That is
≈
×+ − −
++
−
−( )F
f f d fe
eW t t t
L
0.75
(1 · )1
( )
GF.
(9)
b
c
c P P CF
,new
31,min 31,max 31,min
( )
( ) nom
act
0
0
⎛⎝⎜
⎞⎠⎟
For free deflection, we need to account for both the strain andfield dependencies of f31 and Ep. Since the strain in the PZT isactually varying through its thickness when the actuator isbent, this would require a relatively complex calculation inwhich the neutral axis of the actuator actually shifts positiondepending on how much the actuator is bent (a roughestimate gives a shift of about 10 μm when the surface strainis 0.12%). This affects both the stiffness of the beam and themoment arm over which the contraction force in the PZTplate acts, but these two effects partially cancel. Hence, tosimplify matters, we will instead use the followingapproximations: (1) the internal contraction force isapproximated as being constant through the thickness ofthe PZT, with its value determined by the strain at the centerof the PZT (and the applied field). That is, we include thedependencies of f31 by replacing the ×E dp 31 term in thenumerator of equation (7) with equation (5)ʼs f31 expression,using the strain in the center of the PZT (which of coursedepends on the deflection, but this still yields a uniquesolution). (2) We obtain an effective average modulus of thePZT by finding the modulus at the center of each PZT plateand taking the average. Note that the way these equationsare written, we want the secant modulus (i.e. σ
ϵ) rather than
the local modulus ( σϵ
∂∂), so we use equation (3) divided by
the strain. (3) Since the strain in the inactive PZT plate (i.e.no field applied) is always positive (i.e. extensive), and themodulus is close to constant in that regime (at least out to0.04% strain; see figure 10(c)), we can approximate themodulus of the inactive plate as Emin independent of strain.Putting all of this together yields the following expressionfor the free deflection:
where: ≈E EP,1 min (this is the PZT plate which is inactiveand in tension),
ϵ≈ − − +
− +
ϵ ϵ
ϵ
−( ( ))( )
E EE E
a ·ln 1 e
ln 1 e , (11)
Pa
a
,2 minmax min ( )
·
0
0
ϵ δ= − ++
− ( )t t
L2 1 2. (12)p p
P
L
L
CF
act2ext
act
Plots generated from these equations are also shown infigure 13—looking first at free deflection, we see that theprediction is now much closer to the data, although theprediction is still up to 15% too low at higher fields. Besidesthe approximations made above, this may be due to themodulus only having been measured directly between−0.06% and 0.04% strain (figure 10), and extrapolated toinclude the range of strains encountered (up to ±0.12%surface strain for our typical operation up to 300 V) in theactuator deflection. For blocked force, on the other hand, ourprediction is now substantially (63%) higher than the meanobserved values, but given the variation in these measure-ments due to insufficiently rigid base attachments, the modelmay be indicating what could be achieved in the ideal case. Infact, we will see in section 3 that we can indeed get muchcloser (within about 5%) to the model’s predictions forblocked force.
2.5.2. Endurance. We now move on to endurance tests tosee whether the increase in bulk-material failure strain leadsto an increase in lifetime when operated with the samedeflection at the actuator tip (Note: due to the variation inavailable force, the position of the load spring is variedslightly to bring the deflections under load close to the samevalue). Figure 15 shows that the mean lifetime of the ‘laser-out’ actuators is 5 h ( ×2 106 cycles), which is 5 times greaterthan that of the ‘laser-in’ actuators. This confirms that theincreased failure strain does indeed translate to largeimprovements in actuator lifetime. Such a large increase inlifetime (5×) resulting from a relatively small change infailure strength (about 20%) is not unexpected for a brittlematerial. For example, from [22] the rate of crack propagation
is proportional to σσ( )n
max, with n of order 1 for ductile
materials, but of order 10 for brittle materials. Since ≈1.2 610 ,this is consistent with our observations.
2.5.3. Other considerations. Another possible effect thatcould result in a difference between the experimental actuator
δ
ϵ≈
+ + − −+
+
+ + + ++−
−
−
( )
b f f d fe
et t t L
E Et t t t t
E t
L
L0.5
(1 · ) (1 · )1
( )
13 2
1.5 3 212
1 2 , (10)
( )
( )
p p
c
c P P CF
P PP CF CF P P
CF CF,new
31,min 31,max 31,min act2
,1 ,2 2 23
ext
act
0
0
⎛⎝⎜⎜
⎛⎝⎜⎜
⎞⎠⎟⎟
⎞⎠⎟⎟ ⎛
⎝⎜⎞⎠⎟
13
Smart Mater. Struct. 24 (2015) 065023 N T Jafferis et al

behavior and the model is aspect ratio (i.e. w
Lnom
act). For example,
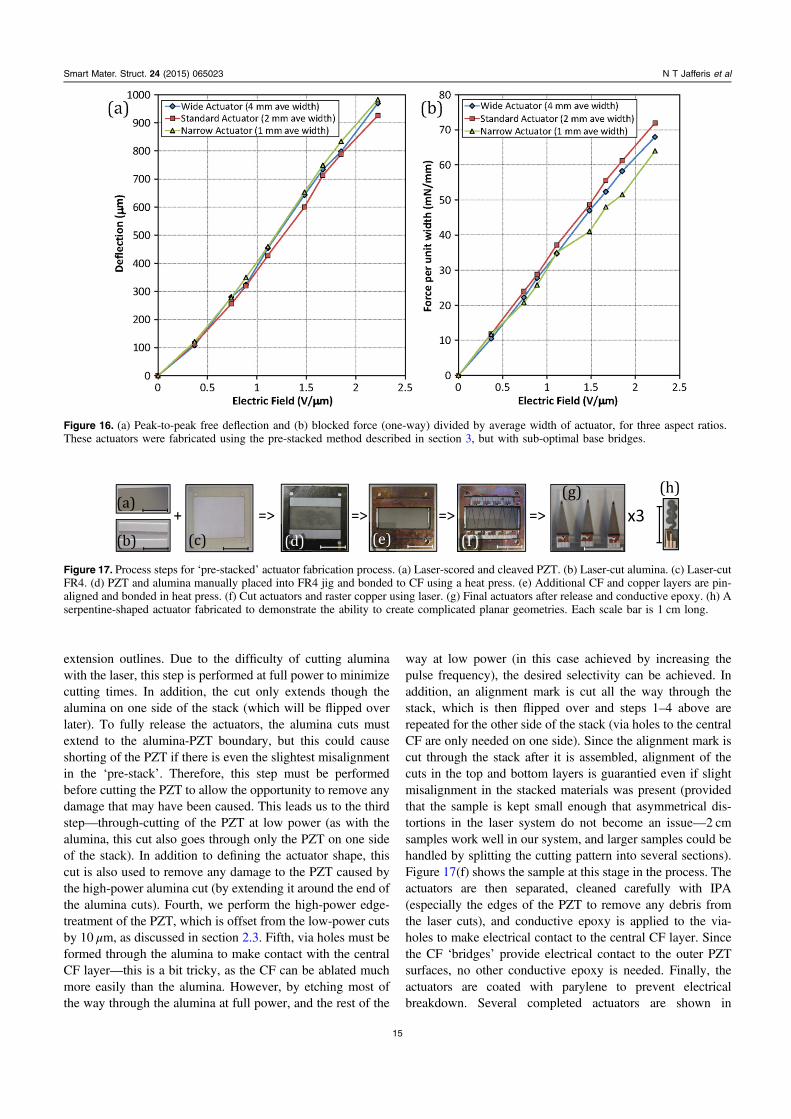
too large an aspect ratio could lead to bending along the widthas well as the length of the actuator, and too small an aspectratio could result in changed performance if the laser affectsd31 in some region around the laser cuts. To verify that we notin a regime where these effects are significant, we fabricateactuators with aspect ratio twice that used as our standard inthis paper (2/9), as well as some with half the aspect ratio, andcompare their results. Figure 16(a) shows that the freedeflection of these three aspect ratios is nearly identical, andfigure 16(b) shows that the blocked forces per unit width ofthe actuator are also very close (note that for the smalleraspect ratio actuators, the tip width is only 250 μm, which ledto partial failure of the tip bridges, and is likely the cause ofthe reduced forces (about 10% lower) at higher fields).Therefore, we may safely conclude that neither of theproposed aspect ratio effects is significant for the actuatorstested in this paper.
3. Maximizing ease of fabrication—eliminating theneed for manual assembly
In this section, we describe a ‘pre-stacked’ method of actuatormanufacturing that removes many of the manual steps in theprevious process (as well as rendering those that remain lessimportant), improves energy density by 70% and reducesforce output variability through the use of rigid attachments,and further increases mean lifetime by a factor of >6, for a
total increase of >30× as compared to the original actuators.In this approach, strips of material are first bonded togetherinto a ‘stack’, followed by laser rastering of via holes andcopper traces and laser cutting on both sides of the stack toseparate the actuators. In this way, the only manual steps arethe alignment of the initial strips of material (which is lesscrucial, as the release cuts form a precisely defined shaperegardless of this alignment) and application of conductiveepoxy to the central CF layer.
3.1. Fabrication
In more detail, the first step is to cut rectangles of PZT,alumina, and CF (figures 17(a), (b))—the length of the PZTrectangle fixes the length of the PZT in each actuator, but thewidth of each actuator can be chosen later as desired. Thelength of the alumina sets an upper bound for the extensionlength in the final actuators. Simple FR-4 jigs (figure 17(c))are used to align the two sets of PZT and alumina rectangles(note: the PZT, alumina, and FR-4 are all cleaned with IPA topromote adhesion), which are then bonded with a central CFlayer in a heat press to form the initial ‘pre-stack’(figure 17(d)). An additional set of CF layers is then cut whichwill ‘bridge’ the PZT-alumina interface, along with a similarcopper layer. The CF provides a strong mechanical attach-ment between the PZT and both the extension and the basealumina, as well as electrical contact to the outer PZT sur-faces. The copper allows for easy soldering to the electricalcontacts. These CF and copper layers are then pin-alignedwith the existing ‘pre-stack’ and cured again in the heat press(recall that the CF contains epoxy resin which forms a strongbond on curing) (figure 17(e)). The resulting ‘pre-stack’ cannow be treated as an individual sheet of composite materialfrom which nearly arbitrary planar actuators can be cut(restricted only by the length of the PZT part of the actuator).This is enabled by the use of finely tuned laser cutting andetching parameters that allow selective patterning of differentlayers. These steps must also be performed in a particularorder—primarily to ensure that PZT is exposed only to thedesired laser powers. The first step is to raster the outer copperand CF layers to form the electrical contact traces. There are afew considerations to keep in mind for this step: (1) we wouldlike to avoid rastering too far into the alumina. (2) The mainreason for performing this step first is to avoid having to cutthrough the copper when cutting the alumina (as this couldleave residual copper traces on the edges of the actuator,leading to possible shorting issues); therefore we must takecare to raster the copper wherever we plan to cut the alumina.(3) The rastering must avoid the PZT as it is done at highpower and could result in shorting of the PZT. Consideration(1) is achieved by tuning the cut settings to the minimumneeded to remove the copper and CF (and the alumina is moreresistant to cutting than the copper and CF); also in this casesome etching into the alumina is not detrimental. Con-siderations (2) and (3) are achieved by having the copper notextend over the PZT during the ‘pre-stack’ fabrication (the CFprovides the electrical connection to the PZT). The secondstep is to cut through the alumina to define the base and
Figure 15. Endurance comparison for ‘laser-in’ actuators versus‘laser-out’ actuators. Also shown are results for the ‘pre-stacked’actuators discussed in section 3. All tests are performed at 100 Hz.
14
Smart Mater. Struct. 24 (2015) 065023 N T Jafferis et al
extension outlines. Due to the difficulty of cutting aluminawith the laser, this step is performed at full power to minimizecutting times. In addition, the cut only extends though thealumina on one side of the stack (which will be flipped overlater). To fully release the actuators, the alumina cuts mustextend to the alumina-PZT boundary, but this could causeshorting of the PZT if there is even the slightest misalignmentin the ‘pre-stack’. Therefore, this step must be performedbefore cutting the PZT to allow the opportunity to remove anydamage that may have been caused. This leads us to the thirdstep—through-cutting of the PZT at low power (as with thealumina, this cut also goes through only the PZT on one sideof the stack). In addition to defining the actuator shape, thiscut is also used to remove any damage to the PZT caused bythe high-power alumina cut (by extending it around the end ofthe alumina cuts). Fourth, we perform the high-power edge-treatment of the PZT, which is offset from the low-power cutsby 10 μm, as discussed in section 2.3. Fifth, via holes must beformed through the alumina to make contact with the centralCF layer—this is a bit tricky, as the CF can be ablated muchmore easily than the alumina. However, by etching most ofthe way through the alumina at full power, and the rest of the
way at low power (in this case achieved by increasing thepulse frequency), the desired selectivity can be achieved. Inaddition, an alignment mark is cut all the way through thestack, which is then flipped over and steps 1–4 above arerepeated for the other side of the stack (via holes to the centralCF are only needed on one side). Since the alignment mark iscut through the stack after it is assembled, alignment of thecuts in the top and bottom layers is guarantied even if slightmisalignment in the stacked materials was present (providedthat the sample is kept small enough that asymmetrical dis-tortions in the laser system do not become an issue—2 cmsamples work well in our system, and larger samples could behandled by splitting the cutting pattern into several sections).Figure 17(f) shows the sample at this stage in the process. Theactuators are then separated, cleaned carefully with IPA(especially the edges of the PZT to remove any debris fromthe laser cuts), and conductive epoxy is applied to the via-holes to make electrical contact to the central CF layer. Sincethe CF ‘bridges’ provide electrical contact to the outer PZTsurfaces, no other conductive epoxy is needed. Finally, theactuators are coated with parylene to prevent electricalbreakdown. Several completed actuators are shown in
Figure 16. (a) Peak-to-peak free deflection and (b) blocked force (one-way) divided by average width of actuator, for three aspect ratios.These actuators were fabricated using the pre-stacked method described in section 3, but with sub-optimal base bridges.
Figure 17. Process steps for ‘pre-stacked’ actuator fabrication process. (a) Laser-scored and cleaved PZT. (b) Laser-cut alumina. (c) Laser-cutFR4. (d) PZT and alumina manually placed into FR4 jig and bonded to CF using a heat press. (e) Additional CF and copper layers are pin-aligned and bonded in heat press. (f) Cut actuators and raster copper using laser. (g) Final actuators after release and conductive epoxy. (h) Aserpentine-shaped actuator fabricated to demonstrate the ability to create complicated planar geometries. Each scale bar is 1 cm long.
15
Smart Mater. Struct. 24 (2015) 065023 N T Jafferis et al

figure 17(g). To illustrate the flexibility of this process foractuator design, figure 17(h) shows a ‘serpentine’ shapedactuator that was produced by the same method; only achange in the PZT cut pattern was required. Although thisprocess has more steps than the standard process, nearly all ofthem require simply inputting the appropriate settings into thelaser system—even the generation of the cut patterns toachieve the required offsets, etc, has been mostly automatedso that only the dimensions of an individual actuator and thenumber of actuators is needed.
3.2. Results
We now characterize the actuators fabricated using the ‘pre-stacked’ method described in section 3.1 and compare theresults to those obtained for the ‘laser-in’ and ‘laser-out’actuators described in section 2.5. Figure 13 shows the free-deflection (figure 13(a)) and blocked-force (figure 13(b))measurements. A slight increase (about 10%) is seen in thefree deflection, but the major improvement is in the blockedforce—we measure a 58% increase above the mean of the‘laser-in’ and ‘laser-out’ actuators, as well as a greatlyreduced variance. Along with the deflection increase, thisresults in a 70% increase in energy density at the sameelectric field. These improvements can be attributed primarilyto the addition of the rigid ‘bridges’ at the base of theactuators. In addition, the blocked force performance of theseactuators now lines up very closely (within ∼5%) with thepredictions of the model presented in section 2.5.1(equation (9)). To demonstrate visually this improvement, oneof the ‘pre-stacked’ actuators and one of the standard actua-tors are positioned such that their tips press against each otherwhen powered. As can be seen from the images in figure 18(and video in supplemental info), the ‘pre-stacked’ actuatoreasily wins—in this example, when the standard actuator ispowered, it deflects the ‘pre-stacked’ one by 120 μm(figure 18(b)) as compared to the neutral position(figure 18(a)); on the other hand, when the ‘pre-stacked’actuator is powered, the deflection is 200 μm (figure 18(c)),which is about 70% greater. Finally, we measure the
endurance of the ‘pre-stacked’ actuators—figure 15 shows acomparison of these results to those obtained for the ‘laser-in’and ‘laser-out’ actuators (on a log scale for ease of viewing).The results show that the mean lifetime has increased by6–8× as compared with the ‘laser-out’ actuators and is30–40× greater than the original ‘laser-in’ actuators (‘laser-in’mean: 1 h, ‘laser-out’ mean: 5 h, ‘pre-stacked’ mean:30–40 h). Note that one of the ‘pre-stacked’ actuators has yetto fail at the time of submission of this work, and is currentlyat 110 h ( ×40 106 cycles) of operation. While the failurestrain results (section 2.3) for the low-power/high-powercombined cut (which is what is used in the ‘pre-stacked’process) were slightly higher than those of the ‘laser-out’samples, the main contributor to the increase in lifetime forthe ‘pre-stacked’ actuators is likely the base bridges. This isbecause the base bridges actually substantially reduce thestrain experienced (by around 35%) by the PZT for a given tipdeflection, and the lower strain translates to a longer lifetime.This can be seen by noting that when there are no basebridges, bending can occur at the base-PZT interface, so if theactuator is trying to push downward, for example, it willactually bend up at the base interface, leading to a greatercurvature in the PZT (as in figure 14). It is also worth notingthat although the variance in lifetime results is a bit high, theimprovements made still show up clearly despite the smallsample size. Further, visual inspection of images of the ‘pre-stacked’ actuators indicates a possible explanation for someof the samples failing sooner—for those that failed sooner, thehigh-power laser treatment zone was narrower in someregions, and it was in these locations that the failures occur-red. The extremely long-lasting actuator, on the other hand,had a nearly uniform high-power melt zone. While too fewsamples were tested to verify this conclusively, it is sugges-tive of the possibility that all of the actuators could be made tolast even longer if the high-power laser treatment can be mademore uniform (one possible cause for the non-uniformity ismotion of the sample during the cutting process, but furtherwork is required to determine this).
Figure 18. A ‘pre-stacked’ actuator (left) versus a standard actuator (right). (a) Both actuators unpowered. (b) The ‘pre-stacked’ actuator isoff, while the standard actuator is commanded to bend downward. (c) The ‘pre-stacked’ actuator is commanded to bend upward, while thestandard actuator is off.
16
Smart Mater. Struct. 24 (2015) 065023 N T Jafferis et al

4. Conclusions
This work describes several methods for increasing the energydensity and lifetime of piezoelectric bimorph actuators, aswell as providing an explanation for the much higher per-formance of these actuators as compared with the predictionsof standard linear models. The take-away lessons are as fol-lows: (1) reducing the roughness of the exposed edges of PZTbimorph actuators results in higher fracture strength, providedthat the roughness reduction occurs at the relevant size-scalefor crack formation (e.g. the grain size for inter-granularfracture). This can be achieved through multiple methods,such as mechanical polishing and laser-induced melting.Laser-induced melting has the advantage of being moreautomated, but it reduces the dielectric strength of PZT alongwith increasing its fracture strength. This effect can be miti-gated through carefully combined low power and high powercuts which result in melting only in the regions where it ismost needed. The resulting 20% fracture strength improve-ment led to a 5× increase in mean device lifetime for the sametip deflection. (2) Rigid attachments are crucial, not onlybetween the piezoelectric material and the actuator extension,but also with the actuator base. This prevents bending at thisinterface, and resulted in a >55% increase in mean blockedforce, as well as a much reduced variance (<±2% as com-pared to ±13% for the standard actuators). This has theadditional benefit of reducing the strain in the actuator (for thesame tip deflection), resulting in a further increase of > ×6 inmean lifetime. (3) A new ‘pre-stacked’ fabrication process forpiezoelectric actuators was presented as a means to eliminatemost manual steps, simplify integration of mechanical bridgesand electrical connections, and allow for nearly arbitraryplanar actuator designs to be fabricated from the same lami-nate. (4) The modulus and piezoelectric coefficients of PZTvary substantially with strain and electric field, and theseeffects must be taken into account to predict actuator behaviorabove about 0.3 V μm−1. In particular, measurements of theseparameters for bulk PZT beams were used to create a modelof the PZT behavior; when applied to the conditions presentin bimorph actuators, the results were within 5% for blockedforce, and 20% for free deflection (even outside the range ofstrains under which the material properties were measured).
In conclusion, the optimized PZT actuators described inthis work output a peak-to-peak free displacement of 1100 μmand a peak-to-peak blocked force of 340 mN (when operatingat fields of 0–2.2 V μm−1 and a frequency of 1 Hz), and weigh42 mg, resulting in an energy density of 4.5 J kg−1 (defined as
δ×− −F0.5 b p p f p p, , for performance comparison purposes, asin [16]). For operation at the same fields, this is an increase ofabout 70% as compared with the mean performance of thestandard actuators (and those described in [16]). It is also 2.4times higher than what the standard linear models wouldpredict. Commercially available bimorphs typically haveenergy densities around 30 times lower than our results (forexample, PiezoSystems’ actuators [23] have a maximumenergy density of 0.15 J kg−1)—this is primarily due to thehigher maximum fields that we can use (0–2.2 V μm−1 as
opposed to ±0.3 V μm−1). Due to the different drive technique(as in [16], the actuators are wired such that each plate alwaysexperiences a positive field), we do not have a direct com-parison at the same field, but our data and models indicate thatwe would expect about 30% higher performance for ouractuators at equivalent fields. Further, the mean lifetime of ouractuators (at conditions close to half free deflection and halfblocked force) have been increased by more than 30 times,from 1 h ( ×3.6 105 cycles) to >30 h (>107 cycles).
Acknowledgments
The authors gratefully acknowledge support from the NationalScience Foundation (award # CCF 0926148) and the WyssInstitute for Biologically Inspired Engineering at Harvard.Any opinions, findings, and conclusions or recommendationsexpressed in this material are those of the authors and do notnecessarily reflect the views of the National Science Founda-tion. In addition, we would like to thank James Weaver foranalyzing the chemical composition of our samples.
References
[1] Ma K Y, Chirarattananon P, Fuller S B and Wood R J 2013Controlled flight of a biologically inspired, insect-scale robotScience 340 603–7
[2] Hoffman K L and Wood R J 2010 Towards a multi-segmentambulatory microrobot IEEE Int. Conf. on Robotics andAutomation pp 1196–1202
[3] Baisch A T and Wood R J 2009 Design and fabrication of theHarvard ambulatory micro-robot 14th Int. Symp. on RoboticsResearch pp 715–30
[4] Song Y S and Sitti M 2007 Surface-tension-driven biologicallyinspired water strider robots: theory and experiments IEEETrans. Robot. 23 578–89
[5] Sun L, Zhang Y, Sun P and Gong Z 2001 Study on robots withPZT actuator for small pipe Int. Symp. onMicromechatronics and Human Science pp 149–54
[6] Tuncdemir S, Ural S O and Uchino K 2009 Meso-scalepiezoelectric gripper with high dexterity Japan. J. Appl.Phys. 48 044501-1–044501-8
[7] Roberts D C, Li H, Steyn J L, Yaglioglu O, Spearing S M,Schmidt M A and Hagood N W 2003 A piezoelectricmicrovalve for compact high-frequency, high-differentialpressure hydraulic micropumping systemsJ. Microelectromech. Syst. 12 81–92
[8] Rodrigues G, Bastaits R, Roose S, Stockman Y,Gebhardt S, Schoenecker A, Villon P and Preumont A2009 Modular bimorph mirrors for adaptive optics Opt.Eng. 48 034001
[9] Mista K 1995 Warp knitting machine with piezoelectricallycontrolled jacquard patterning Patent US5390512 A
[10] Smithmaitrie P 2009 Analysis and Design of PiezoelectricBraille Display Rehabilitation Engineering ed T Y Kheng(Rijeka: InTech) (www.intechopen.com/books/rehabilitation-engineering/analysis-and-design-of-piezoelectric-braille-display)
[11] Anton S R, Erturk A and Inman D 2012 Bending strength ofpiezoelectric ceramics and single crystals for multifunctionalload-bearing applications IEEE Trans. Ultrason.Ferroelectr. Frequation Control 59 1085–92
[12] Misri I, Hareesh P, Yang S and DeVoe D L 2012Microfabrication of bulk PZT transducers by dry film
17
Smart Mater. Struct. 24 (2015) 065023 N T Jafferis et al

photolithography and micro powder blasting J. Micromech.Microeng. 22 085017
[13] Annoni M, Arleo F, Trolli A, Suarez A and Alberdi A 2012Fine abrasive water jet machining of piezoelectric ceramics:cutting parameters optimization 21st Int. Conf. Water Jetting
[14] Zeng DW, Li K, Yung K C, Chan H LW, Choy C L and Xie C S2004 UV laser micromachining of piezoelectric ceramic using apulsed Nd:YAG laser Appl. Phys. A 78 415–21
[15] Desbiens J-P and Masson P 2007 ArF excimer lasermicromachining of Pyrex, SiC and PZT for rapid prototypingof MEMS components Sensors Actuators A 136 554–63
[16] Wood R J, Steltz E and Fearing R S 2005 Optimal energydensity piezoelectric bending actuators Sensors Actuators A119 476–88
[17] Hareesh P, Misri I, Yang S and DeVoe D L 2012 Transverseinterdigitated electrode actuation of homogeneous bulk PZTJ. Microelectromech. Syst. 21 1513–8
[18] Guillon O, Thiebaud F, Perreux D, Courtois C,Champagne P and Crampon J 2005 New considerationsabout the fracture mode of PZT ceramics J. Eur. Ceram.Soc. 25 2421–4
[19] Fushimi S and Ikeda T 1967 Phase equilibrium in the systemPbO-TiO2-ZrO2 J. Am. Ceram. Soc. 50 129–32
[20] Morgan Technical Ceramics Piezoelectric Ceramics Propertiesand Applications chapter 5 (www.morganelectroceramics.com/resources/guide-to-piezoelectric-dielectric-ceramic)
[21] IEEE Standard on Piezoelectricity ANSI/IEEE Std 176-1987(1988) (New York: Institute of Electrical and ElectronicsEngineers)
[22] Ritchie R O 1999 Mechanisms of Fatigue-Crack propagation inductile and brittle solids Int. J. Fract. 100 55–83
[23] Piezo Systems, Inc. 2014 Piezo Systems: High PerformancePiezoelectric Bending Transducers and Actuators (http://piezo.com/prodbm2highperf.html)
18
Smart Mater. Struct. 24 (2015) 065023 N T Jafferis et al