design and optimization of a zero energy buildingdesign and optimization of a zero energy building...
TRANSCRIPT

Design and Optimization of a Zero Energy Building
By
Gamze GEDİZ
A Dissertation Submitted to the Graduate School in Partial Fulfillment of the
Requirements for the degree of
MASTER OF SCIENCE
Department: Mechanical Engineering Major: Mechanical Engineering
İzmir Institute of Technology İzmir, Turkey
July, 2004

We approve the thesis of Gamze GEDİZ
Date of Signature
................................................................... 26.07.2004
Prof. Dr. Zafer İLKEN
Supervisor
Izmir Institute of Technology, Department of Mechanical Engineering
................................................................... 26.07.2004
Assoc. Prof. Dr. Barış ÖZERDEM
Izmir Institute of Technology, Department of Mechanical Engineering
................................................................... 26.07.2004
Assist. Prof. Dr. Tahsin BAŞARAN
Izmir Dokuz Eylul University, Department of Mechanical Engineering
................................................................... 26.07.2004
Assoc. Prof. Dr. Barış ÖZERDEM
Izmir Institute of Technology, Head of Mechanical Engineering

ii
ACKNOWLEDGMENTS
I would like to give my grateful thanks to my advisor, Prof. Dr. Zafer İlken, for
sharing his knowledge and his encouragement and helps about preparing this study. He
lights my way in every phase of this study.
I am grateful to all professors in Mechanical Engineering and Architecture
Department in Izmir Institute of Technology for sharing their knowledge and experience
with me. I extend special thanks to Architect Murat Dalgıç, who design the main body
of the project GUZEB, and Architect İmran Ayazoğlu, for sharing his experience and
time to modify the project.
My special thanks to all my friends, never let me alone during this study period.
Deepest and final thanks to my family, for their emotional support, best wishes
and finite patience during my studies. This study is dedicated to them.
iii
ABSTRACT
Izmir Institute of Technology (IZTECH), founded in 1992, is the third state
university of Izmir. The campus area has the renewable energy sources of several kinds.
The aim of this thesis is to design and optimize a building, which produce its own
energy by using these sources.
Gülbahçe Zero Energy Building (GUZEB) is designed as a library and a gallery,
and to be used for symposiums and special day meetings. 32oC geothermal water that is
from the ancient cave, which is located in campus area and close to the location of the
building, will be used for heating and to meet the hot water requirement of the building.
Floor heating system considered being the best heating option with 32oC water
source. Necessary pipe length for floor heating system is found by using the software
FLUENT.
Necessary cooling load is calculated in two different ways by with and without
hourly load distribution. With hourly load distribution cooling load calculation is made
by using Alarko-Carrier ‘s HVAC Design Hourly Analysis Program.
Additionally, energy storage method is recommended for the cooling plant,
which will meet the cooling load. With this method, smaller cooling plant can be chosen
instead of choosing cooling plant, which meets the load of symposium days or special
day meetings that both are rare. Because of this, electrical load of the cooling plant
considered to be lower.
Silica-aerogel and many different isolation materials are used in the design of
the building’s isolation. Fiber lighting is recommended to decrease the lighting load of
the building and with automatic controlled curtains and panels; daylight can be
controlled during the summer days. So, electric consumption of the building can be tried
to be decrease.
The wind speed of the location is 5-7 m/s. Electric demand can be met with the
photovoltaic panels and wind turbine that will be located in suitable position.

iv
ÖZ
1992 yılında kurulan İzmir Yüksek Teknoloji Enstitüsü, İzmir’in üçüncü devlet
üniversitesidir. Kampus alanı yenilenebilir enerji kaynakları bakımından oldukça
zengindir. Tezin ana amacı, bu kaynakları kullanarak, kendi enerjisini tamamiyle
kendisi üretebilen, sıfır enerjili bina olarak tanımlanan bir binanın tasarımının ve,
optimizasyonunun yapılmasıdır.
Gülbahçe Sıfır Enerjili Evi (GUZEB), bir kütüphane ve galeri olarak
kullanılmak üzere tasarlanmıştır. Sempozyum ve toplantı gibi faaliyetlerde de
kullanılabilecektir.
Kampüs alanında ve bina yerleşimi yakınında bulunan antik bir hamamdan,
yaklaşık 32oC de çıkan jeotermal su, binanın ısıtma sisteminde ve sıcak su
karşılamasında kullanılacaktır. Bina ısıtmasında, bu sıcaklıktaki su için yerden ısıtma
yöntemi en uygun ısıtma sistemi olarak belirlenmiştir. Bina ısıtması için gerekli boru
uzunluğu FLUENT programında modellenerek bulunmuştur.
Bina için gerekli soğutma yükü saatlik yük dağılımı hesaba alınarak ve
alınmayarak iki şekilde hesaplanmıştır. Saatlik yük dağılımı soğutma yükü hesabı,
Alarko-Carrier’in HVAC Dizaynı Saatlik Analiz Programı kullanılarak yapılmıştır.
Ayrıca, soğutma yükünü karşılayacak soğutma grubu için, enerji depolama
yöntemi önerilmiştir. Bu yöntemle, sempozyum, toplantı gibi ender günlerin soğutma
yükü değerine göre soğutma grubu seçmek yerine, enerji depolayarak daha küçük bir
soğutma grubu seçilmesi önerilmiştir. Bu sayede, soğutma grubunun elektrik yükünün
düşürülmesi düşünülmüştür.
Bina tasarımında kullanılan silica-aerogel bazlı malzemeler ve çeşitli izolasyon
malzemeleriyle, bina yalıtımı desteklenmiş, fiber aydınlatma önerisiyle, aydınlatma
yükü azaltılmaya çalışılmış, otomatik kontrollü perde ve panellerle yaz aylarında güneş
ışınının bina içerisine girişi kontrol altına alınmaya çalışılmıştır. Böylelikle, bina için
gerekli elektrik ihtiyacı düşürülmeye çalışılmıştır.
Bölgenin rüzgar hızı 5-7 m/s arasındadır. Buna göre seçilecek rüzgar türbini ve
uygun pozisyonda yerleştirilecek güneş panelleriyle tüm elektrik ihtiyacının
karşılanabileceği düşünülmektedir.
v
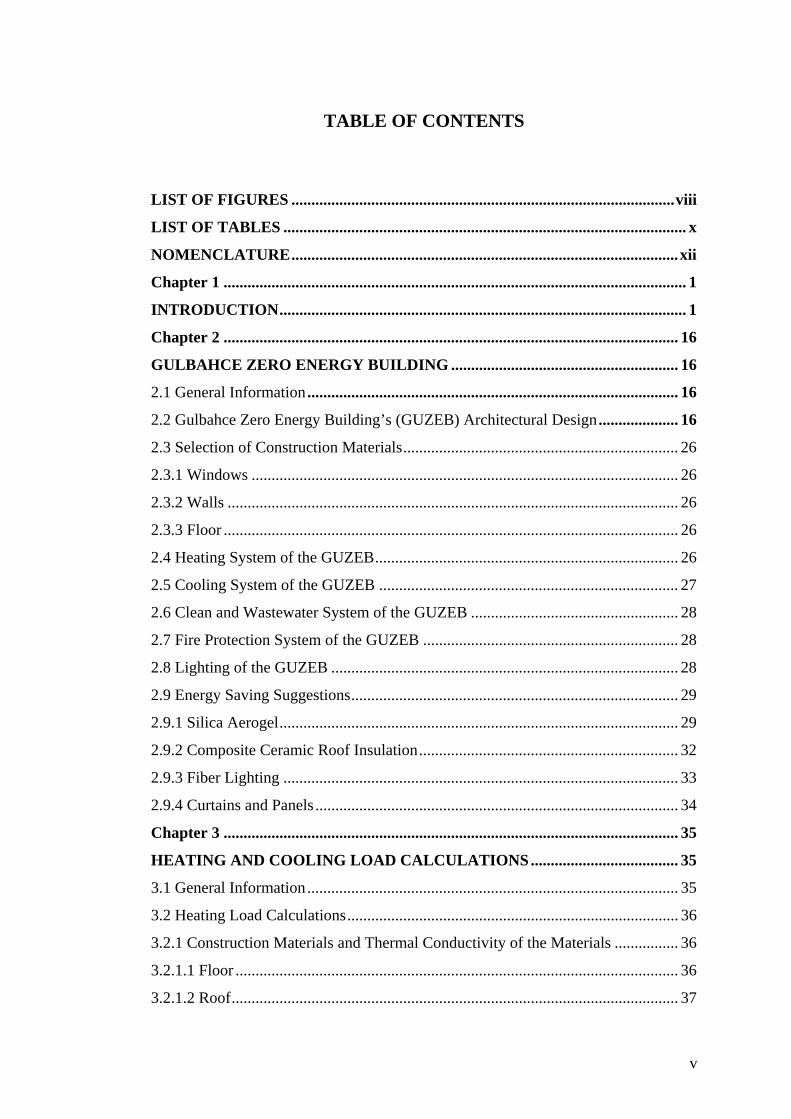
TABLE OF CONTENTS
LIST OF FIGURES ................................................................................................ viii
LIST OF TABLES ..................................................................................................... x
NOMENCLATURE ................................................................................................. xii
Chapter 1 .................................................................................................................... 1
INTRODUCTION ...................................................................................................... 1
Chapter 2 .................................................................................................................. 16
GULBAHCE ZERO ENERGY BUILDING ......................................................... 16
2.1 General Information ............................................................................................. 16
2.2 Gulbahce Zero Energy Building’s (GUZEB) Architectural Design .................... 16
2.3 Selection of Construction Materials ..................................................................... 26
2.3.1 Windows ........................................................................................................... 26
2.3.2 Walls ................................................................................................................. 26
2.3.3 Floor .................................................................................................................. 26
2.4 Heating System of the GUZEB ............................................................................ 26
2.5 Cooling System of the GUZEB ........................................................................... 27
2.6 Clean and Wastewater System of the GUZEB .................................................... 28
2.7 Fire Protection System of the GUZEB ................................................................ 28
2.8 Lighting of the GUZEB ....................................................................................... 28
2.9 Energy Saving Suggestions .................................................................................. 29
2.9.1 Silica Aerogel .................................................................................................... 29
2.9.2 Composite Ceramic Roof Insulation ................................................................. 32
2.9.3 Fiber Lighting ................................................................................................... 33
2.9.4 Curtains and Panels ........................................................................................... 34
Chapter 3 .................................................................................................................. 35
HEATING AND COOLING LOAD CALCULATIONS ..................................... 35
3.1 General Information ............................................................................................. 35
3.2 Heating Load Calculations ................................................................................... 36
3.2.1 Construction Materials and Thermal Conductivity of the Materials ................ 36
3.2.1.1 Floor ............................................................................................................... 36
3.2.1.2 Roof ................................................................................................................ 37
vi
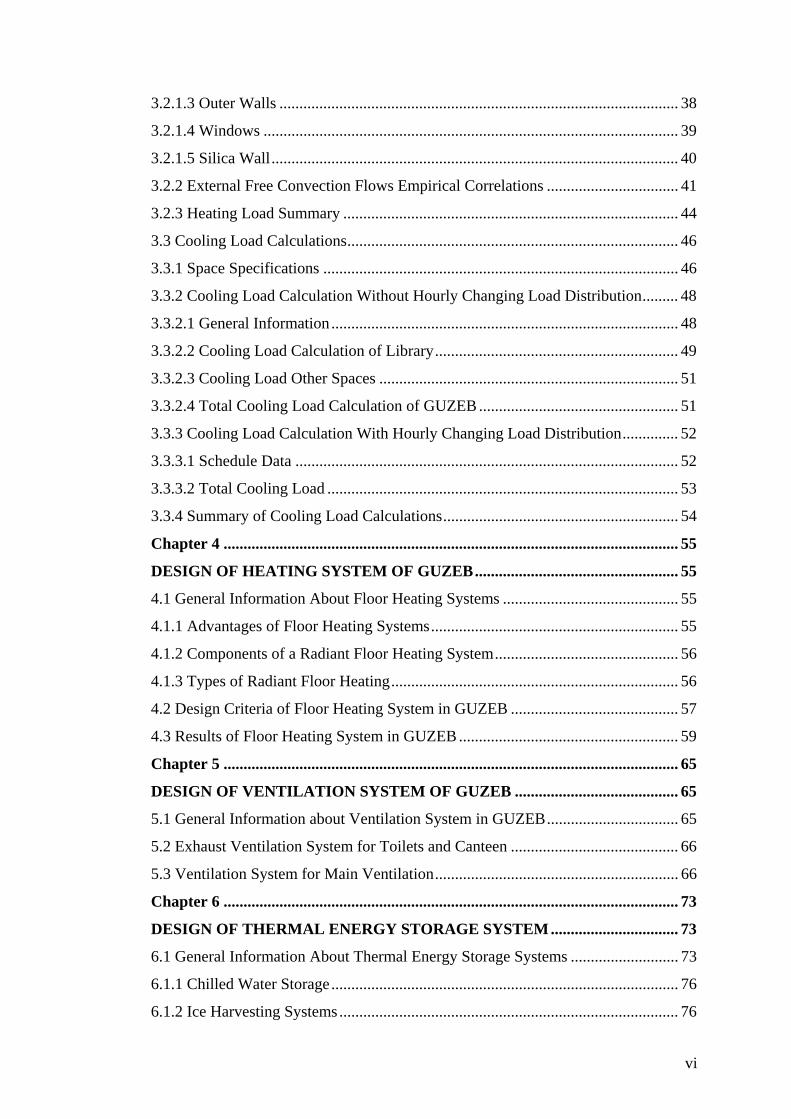
3.2.1.3 Outer Walls .................................................................................................... 38
3.2.1.4 Windows ........................................................................................................ 39
3.2.1.5 Silica Wall ...................................................................................................... 40
3.2.2 External Free Convection Flows Empirical Correlations ................................. 41
3.2.3 Heating Load Summary .................................................................................... 44
3.3 Cooling Load Calculations ................................................................................... 46
3.3.1 Space Specifications ......................................................................................... 46
3.3.2 Cooling Load Calculation Without Hourly Changing Load Distribution ......... 48
3.3.2.1 General Information ....................................................................................... 48
3.3.2.2 Cooling Load Calculation of Library ............................................................. 49
3.3.2.3 Cooling Load Other Spaces ........................................................................... 51
3.3.2.4 Total Cooling Load Calculation of GUZEB .................................................. 51
3.3.3 Cooling Load Calculation With Hourly Changing Load Distribution .............. 52
3.3.3.1 Schedule Data ................................................................................................ 52
3.3.3.2 Total Cooling Load ........................................................................................ 53
3.3.4 Summary of Cooling Load Calculations ........................................................... 54
Chapter 4 .................................................................................................................. 55
DESIGN OF HEATING SYSTEM OF GUZEB ................................................... 55
4.1 General Information About Floor Heating Systems ............................................ 55
4.1.1 Advantages of Floor Heating Systems .............................................................. 55
4.1.2 Components of a Radiant Floor Heating System .............................................. 56
4.1.3 Types of Radiant Floor Heating ........................................................................ 56
4.2 Design Criteria of Floor Heating System in GUZEB .......................................... 57
4.3 Results of Floor Heating System in GUZEB ....................................................... 59
Chapter 5 .................................................................................................................. 65
DESIGN OF VENTILATION SYSTEM OF GUZEB ......................................... 65
5.1 General Information about Ventilation System in GUZEB ................................. 65
5.2 Exhaust Ventilation System for Toilets and Canteen .......................................... 66
5.3 Ventilation System for Main Ventilation ............................................................. 66
Chapter 6 .................................................................................................................. 73
DESIGN OF THERMAL ENERGY STORAGE SYSTEM ................................ 73
6.1 General Information About Thermal Energy Storage Systems ........................... 73
6.1.1 Chilled Water Storage ....................................................................................... 76
6.1.2 Ice Harvesting Systems ..................................................................................... 76
vii
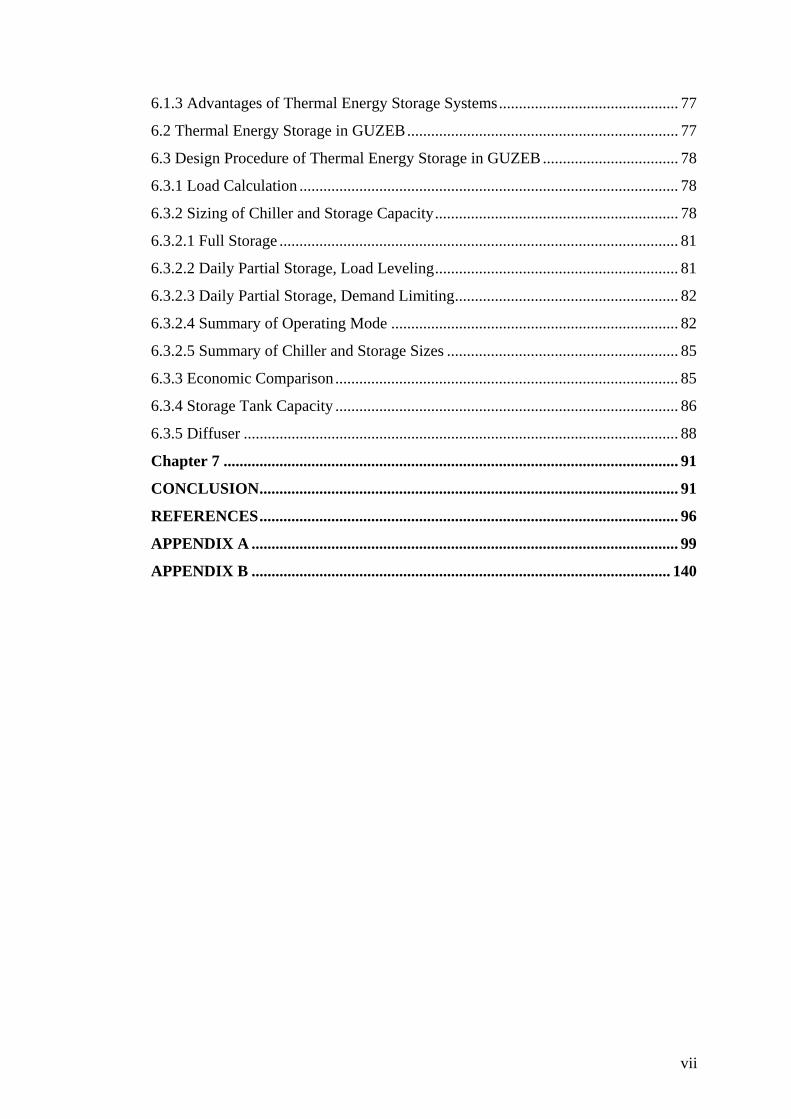
6.1.3 Advantages of Thermal Energy Storage Systems ............................................. 77
6.2 Thermal Energy Storage in GUZEB .................................................................... 77
6.3 Design Procedure of Thermal Energy Storage in GUZEB .................................. 78
6.3.1 Load Calculation ............................................................................................... 78
6.3.2 Sizing of Chiller and Storage Capacity ............................................................. 78
6.3.2.1 Full Storage .................................................................................................... 81
6.3.2.2 Daily Partial Storage, Load Leveling ............................................................. 81
6.3.2.3 Daily Partial Storage, Demand Limiting ........................................................ 82
6.3.2.4 Summary of Operating Mode ........................................................................ 82
6.3.2.5 Summary of Chiller and Storage Sizes .......................................................... 85
6.3.3 Economic Comparison ...................................................................................... 85
6.3.4 Storage Tank Capacity ...................................................................................... 86
6.3.5 Diffuser ............................................................................................................. 88
Chapter 7 .................................................................................................................. 91
CONCLUSION ......................................................................................................... 91
REFERENCES ......................................................................................................... 96
APPENDIX A ........................................................................................................... 99
APPENDIX B ......................................................................................................... 140

viii
LIST OF FIGURES
Figure 1.1: Energy Consumption per Capita, 1992-2000 [2].Hata! Yer işareti tanımlanmamış.
Figure 1.2: Total energy consumption in the sectors in Turkey during 1990–2001
[3,4]. ...................................................................... Hata! Yer işareti tanımlanmamış.
Figure 1.3: A bird’s eye view of both homes. ....... Hata! Yer işareti tanımlanmamış.
Figure 1.4: North view of energy-efficient building in La Pampa, Argentina.Hata! Yer işareti tanım
Figure 1.5: The one-family terrace houses in Harderwijk.Hata! Yer işareti tanımlanmamış.
Figure 1.6: House view from Zoetermeer project. Hata! Yer işareti tanımlanmamış.
Figure 1.7: House view from Etten Leur project. . Hata! Yer işareti tanımlanmamış.
Figure 1.8: Turkey’s Share of Total Primary Energy Supply in 2001 [15].Hata! Yer işareti tanımla
Figure 1.9: Measuring Solar Energy Distribution [16].Hata! Yer işareti tanımlanmamış.
Figure 1.10: World High Temperature Geothermal Provinces [16].Hata! Yer işareti tanımlanmamı
Figure 2.1: Location of Gulbahce Zero Energy Building (GUZEB).Hata! Yer işareti tanımlanmam
Figure 2.2: Location of GUZEB. .......................... Hata! Yer işareti tanımlanmamış.
Figure 2.3: Side View of GUZEB. ........................ Hata! Yer işareti tanımlanmamış.
Figure 2.4: Front Side View of GUZEB. .............. Hata! Yer işareti tanımlanmamış.
Figure 2.5: Plan of GUZEB. ................................. Hata! Yer işareti tanımlanmamış.
Figure 2.6: 3D View of GUZEB. .......................... Hata! Yer işareti tanımlanmamış.
Figure 2.7: 3D View of GUZEB. .......................... Hata! Yer işareti tanımlanmamış.
Figure 2.8: 3D View of GUZEB. .......................... Hata! Yer işareti tanımlanmamış.
Figure 2.9: 3D View of GUZEB. .......................... Hata! Yer işareti tanımlanmamış.
Figure 2.10: Projection of a Church Cooling Load on Sundays.Hata! Yer işareti tanımlanmamış.
Figure 2.11: Pore Structure of Aerogel [20]. ........ Hata! Yer işareti tanımlanmamış.
Figure 2.12: Pore Size Distribution of Silica Aerogel [20].Hata! Yer işareti tanımlanmamış.
Figure 2.13: Flower is Protected From Fire [18]. . Hata! Yer işareti tanımlanmamış.
Figure 2.14: Aerogel in Hand [18]. ....................... Hata! Yer işareti tanımlanmamış.
Figure 2.15: Transparency Example of Aerogel [20].Hata! Yer işareti tanımlanmamış.
Figure 2.16: Pore Structure of Composite Ceramic Insulation Material [23].Hata! Yer işareti tanım
Figure 2.17: Flexibility of Fiber Cable. ................ Hata! Yer işareti tanımlanmamış.
Figure 3.1: Floor Materials and Thicknesses. ....... Hata! Yer işareti tanımlanmamış.
Figure 3.2: Roof Materials and Thicknesses. ........ Hata! Yer işareti tanımlanmamış.

ix
Figure 3.3: Outer Wall Materials and Thicknesses.Hata! Yer işareti tanımlanmamış.
Figure 3.4: Window Materials and Thicknesses. .. Hata! Yer işareti tanımlanmamış.
Figure 3.5: Silica Wall Materials and Thicknesses.Hata! Yer işareti tanımlanmamış.
Figure 3.6: Floor Convection Schema. ................. Hata! Yer işareti tanımlanmamış.
Figure 3.7: Wall Convection Schema. .................. Hata! Yer işareti tanımlanmamış.
Figure 4.1: Installation Method of Floor Heating System.Hata! Yer işareti tanımlanmamış.
Figure 4.2: Modeled floor by Gambit. .................. Hata! Yer işareti tanımlanmamış.
Figure 4.3: Meshed floor by Gambit. .................... Hata! Yer işareti tanımlanmamış.
Figure 4.5: Tubing Construction Style. ................. Hata! Yer işareti tanımlanmamış.
Figure 4.6: Floor Heating Design of GUZEB. ...... Hata! Yer işareti tanımlanmamış.
Figure 4.7: Floor Heating Design Detail A ........... Hata! Yer işareti tanımlanmamış.
Figure 4.8: Floor Heating Design Detail B ........... Hata! Yer işareti tanımlanmamış.
Figure 4.9: Floor Heating Design Detail C ........... Hata! Yer işareti tanımlanmamış.
Figure 5.1: Duct Design of GUZEB. .................... Hata! Yer işareti tanımlanmamış.
Figure 5.2: Duct Design Detail A. ........................ Hata! Yer işareti tanımlanmamış.
Figure 5.3: Duct Design Detail B. ......................... Hata! Yer işareti tanımlanmamış.
Figure 6.1: Full Storage. ....................................... Hata! Yer işareti tanımlanmamış.
Figure 6.2: Load Leveling Partial Storage. ........... Hata! Yer işareti tanımlanmamış.
Figure 6.3: Partial Storage Dependent on Demand.Hata! Yer işareti tanımlanmamış.

x
LIST OF TABLES
Table 1.1: Different building activity energy consumptions [1].Hata! Yer işareti
tanımlanmamış.
Table 1.2: Energy Bottom Line for June 1998. ..... Hata! Yer işareti tanımlanmamış.
Table 1.3: Primary Energy Production and Consumption of Turkey in1998 and 2001
(ktoe) [4,11]. ......................................................... Hata! Yer işareti tanımlanmamış.
Table 1.4: Solar and Wind Energy Potential by Regions of Turkey [11,12].Hata! Yer
işareti tanımlanmamış.
Table 2.1: Aerogel Properties and Features with Their Application [21].Hata! Yer
işareti tanımlanmamış.
Table 3.1: Thermal Conductivity Values of Floor Materials.Hata! Yer işareti
tanımlanmamış.
Table 3.2: Thermal Conductivity Values of Roof Materials.Hata! Yer işareti
tanımlanmamış.
Table 3.3: Thermal Conductivity Values of Outer Walls Materials.Hata! Yer işareti
tanımlanmamış.
Table 3.4: Thermal Conductivity Values of Windows MaterialsHata! Yer işareti
tanımlanmamış.
Table 3.5: Total Heat Losses of Each Space of GUZEB’s.Hata! Yer işareti
tanımlanmamış.
Table 3.6: Space and Equipment Specifications of GUZEB’s.Hata! Yer işareti
tanımlanmamış.
Table 3.7: Total Cooling Load of GUZEB Without Hourly Changing Load
Distribution ........................................................... Hata! Yer işareti tanımlanmamış.
Table 3.8: Schedule Data. ..................................... Hata! Yer işareti tanımlanmamış.
Table 3.9: Cooling Load Data in July. .................. Hata! Yer işareti tanımlanmamış.
Table 3.10: Summary of Cooling Load Calculations.Hata! Yer işareti
tanımlanmamış.

xi
Table 4.1: Net Heat Transfer Rate per meter from Pipes.Hata! Yer işareti
tanımlanmamış.
Table 5.1: Fan Sizes and Pressure Drop Tables of Toilet Exhaust Duct Design. Hata!
Yer işareti tanımlanmamış.
Table 5.2: Fan Sizes and Pressure Drop Tables of Library Main Inlet Duct Design.
............................................................................... Hata! Yer işareti tanımlanmamış.
Table 5.3: Fan Sizes and Pressure Drop Tables of Library Main Outlet Duct Design.
............................................................................... Hata! Yer işareti tanımlanmamış.
Table 6.1: Cooling Load Distribution of GUZEB.Hata! Yer işareti tanımlanmamış.
Table 6.2: Cooling Load Distribution Profile of GUZEB.Hata! Yer işareti
tanımlanmamış.
Table 6.3: Summary of Daily Full Storage Versus Daily Load Distribution....... Hata!
Yer işareti tanımlanmamış.
Table 6.4: Summary of Daily Full Storage with Glycol Versus Daily Load
Distribution ........................................................... Hata! Yer işareti tanımlanmamış.
Table 6.5: Summary of Daily Load Leveling Versus Daily Load Distribution ... Hata!
Yer işareti tanımlanmamış.
Table 6.6: Summary of Daily Load Leveling with Glycol Versus Daily Load
Distribution ........................................................... Hata! Yer işareti tanımlanmamış.
Table 6.7: Summary of Demand Limiting Versus Daily Load DistributionHata! Yer
işareti tanımlanmamış.
Table 6.8: Summary of Chiller and Storage Sizes Hata! Yer işareti tanımlanmamış.
Table 6.9: Economic Comparison Summary ........ Hata! Yer işareti tanımlanmamış.
Table 7.1: Average Solar and Wind Energy Potential of Turkey [11,12].Hata! Yer
işareti tanımlanmamış.
Table 7.2: Cooling Load Comparison on Regular and Special Days.Hata! Yer
işareti tanımlanmamış.

xii
NOMENCLATURE
a :Heat loss coefficient (m3/mh)
Cchrg :Capacity when charging storage
CDconp :Capacity when direct cooling during on-peak period
CRchrg :Capacity ratio when charging storage
CRDcoffp :Capacity ratio when direct cooling during off-peak period
CRDconp :Capacity ratio when direct cooling during on-peak period
CLTD :Cooling load temperature difference (oC)
Fc :Storage capacity
Fri :The Froude Number
g :Gravitaional acceleration constant (9.81 m/s2)
h :Convection coefficient (W/m2K)
H :Building localization coefficient (W/m3 oC)
hi :Minimum inlet opening height
Hchrg :Hours charging storage
HDconp :Hours direct cooling during on-peak period
HDcoffp :Hours direct cooling during off-peak period
k :Thermal conductivity (W/mK)
l :Window or door collapsible length (m)
L :Length (m)
m :Mass flow rate (kg)
n :Pressure drop coefficient
NuL :Nusselt Number
Pr :Prandtl Number
q :Volume flow rate per unit diffuser length
Q :Heat transfer rate (W)
Qm :Maximum flow rate (m3/s)
Qtotal :Total heat loss (W)
R :Room localization coefficient
RaL :Rayleigh Number
toe :Tons of oil equivalent (41.8 GJ)
xiii
TCDcoffp :Total capacity when direct cooling off-peak
TCDconp :Total capacity when direct cooling on-peak
THDCchrg :Ton-hours direct cooling while simultaneously charging
Ts :Ground temperature (oC)
T :Inner air temperature (oC)
Greek Letters
ρi :Density of inlet water
ρa :Density of ambient water
β :Volumetric thermal expansion coefficient (K-1)
:Thermal diffusivity (m2/s)
:Kinematic viscosity (m2/s)
ΔT :Temperature difference
Subscripts
eq :Eqıipment
r :Roof
s :Safety factor
ow :Outer walls
w :Windows
wc :Window shading
Superscripts
· (dot) :Quantity per unit time
Abbreviations
AC :Air condition
FOM : Figure of Merit
GUZEB :Gulbahce Zero Energy House

xiv
HVAC :Heating, ventilation, Air conditoning
IZTECH :Izmir Institute of Technology
PMMA :Polymethylmethacrylat
PV :Photovoltaic
PVC :Polyvinilclorur
TS :Turkish Standards
TES :Thermal Energy Storage
TPES :Total primary energy supply
U.S :The United States
UV :Ultraviolet
WWF :The World Wildlife Fund

1
Chapter 1
INTRODUCTION
In ancient times, the human being was using the natural energy sources in order
to supply their daily needs, which were sufficient in those days, but through the
technological advance, the industrial production starts to direct and generate the daily
needs. Meanwhile this development leads people to be more dependent on different
energy sources, which are unfortunately limited in the world. This limitation forced
people to produce their energy. Also, these energy sources have to be natural; the
importance of producing own energy by using natural energy sources has become more
important. In addition, producing energy became such a ‘powerful gun’ that allowing
countries not to be dependable on other countries. These energy sources have to be
unlimited and friendly to human health. Therefore, increasing necessity for natural and
healthy energy sources impress on importance of geothermal, wind and solar energy.
As known, energy is used to grow food, run the cars, warm and cool the houses,
produce electricity for any kind of purpose from reading, to surfing on Internet, either
using it for listening to radio or air conditioning the surroundings, briefly, in every
phase of the daily life. Fuel is used in our furnaces or boilers for heating, and to heat
water for baths and showers. Furthermore, energy is used to control heating and cooling
system’s automatic control units or etc. These expenses designate energy consumption.
Houses as the basic living areas of human being are firstly subject to utilization
of natural sources. So, these needs differ according to the type of building that is
examined. As indicated in Table 1.1, if building’s usage function is different, their
energy consumptions and expenditures will be different too.
2
Table 1.1: Different building activity energy consumptions [1].
FUELOIL
CONSUMPTION
ELECTRICITY
CONSUMPTION
NATURAL GAS
CONSUMPTION
PRINCIPAL BUILDING ACTIVITY
per building Total primary
(Billion m3) (m3) (trillion Wh)
EDUCATION 69.43 227.7 6.23
HEALTH CARE 38.44 58.9 5.97
MERCANTILE 5.29 461 5.09
OFFICE 9.15 678.2 6.03
PUBLIC ASSEMBLY 14.12 169.1 2.66
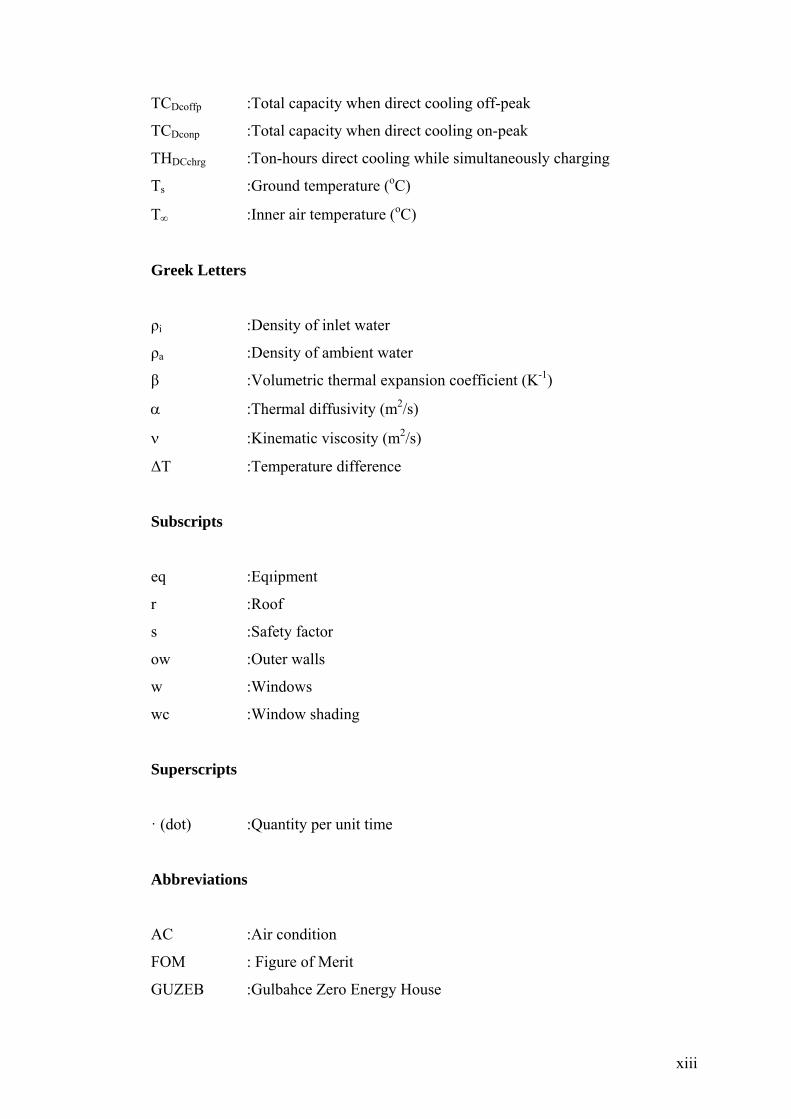
Several notions and methodologies related with these values, which are shown
in Table 1.1 are generated in order to reduce energy consumption. It would be
impossible to stop using energy. But reduction of its use can be possible. It is listed
below the methods, which should be applied to save energy:
i. Passive Heating Method: More glass window area can be added to the
south side of the house to increase the passive heating system, and new
designs are created to transfer this heated air to inner part of the houses.
ii. Shading Method: If the weather is hot, curtains can be placed to shade the
volume and sunrise is tried to keep in control. In addition, plants can be
used for shading.
iii. Insulation Method: Relevant isolation materials can be heavily utilized not
only to isolate the building but also stabilize building energy.
iv. Window Types Method: Infiltration can be reduced with double or triple
window designs, and using special window construction materials, like
PVC, and PVC based materials.
Energy saving level is eventually increased with these methods and applications.
3
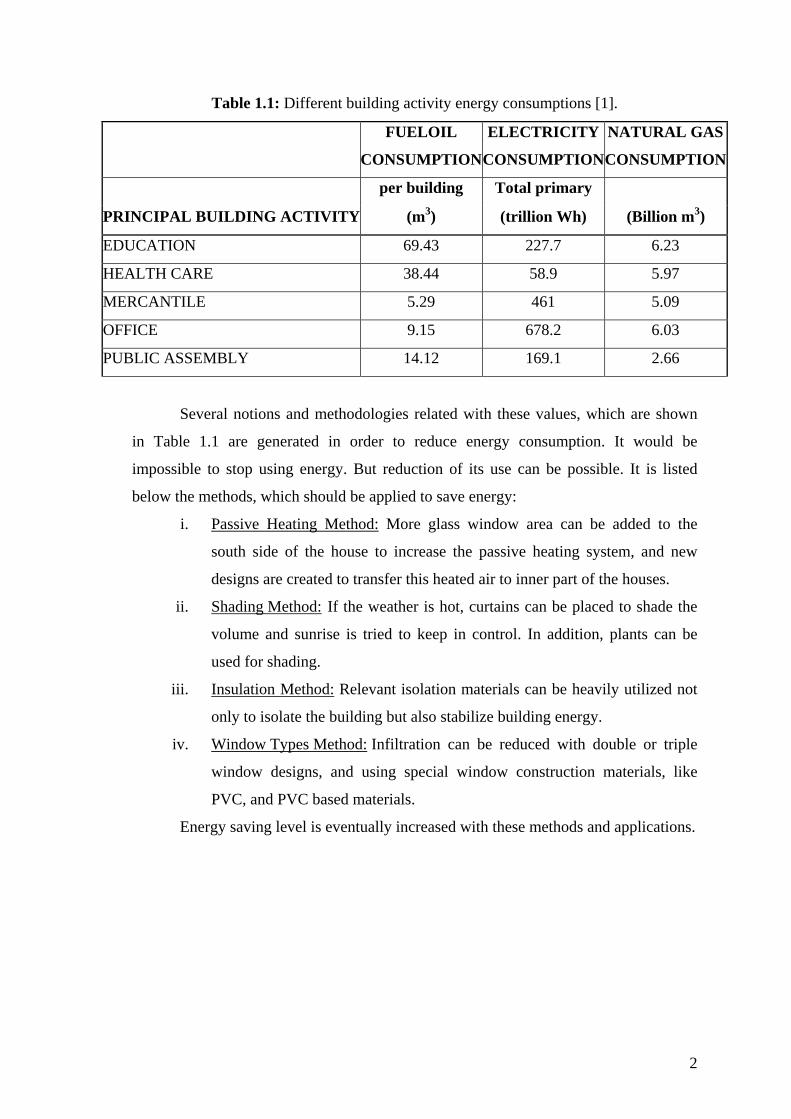
Figure 1.1: Energy Consumption per Capita, 1992-2000 [2].
*TOE (tons of oil equivalent)=41.8 GJ.
0
5000
10000
15000
20000
25000
kto
e
HOUSEHOLD INDUSTRY TRANSPORT AGRICULTURE
Figure 1.2: Total energy consumption in the sectors in Turkey during 1990–2001 [3,4].
As shown in Figure 1.1, total energy consumption per capita in Turkey is
approximately 13.7% of the consumption of the United States [2]. Additionally, total
energy use per capita is shared 10 kW by USA, 4 kW by Europe and 0.1 kW by Africa.
The world population doubles in every 20-30 years, so the growth of the world supply
should be between 4-8% per year [5].

4
From Figure 1.2, if all energy consumption values by different sectors are
summed, without new energy supplies such growth cannot be maintained. So,
renewable energy sources become very important. As the energy is such an important
thing, renewable energy sources have to be everywhere in daily life. So, anticipated that
these renewable energy sources have to be used to produce energy for houses named
“Energy-Efficient Buildings”. These houses produce most of its energy, but not all of
them. These houses only reduce their energy consumption. In the course of time, house,
which covers its energy is developed which is known as “Zero Energy House”. The
main goal of this idea is not to pay bill by generating its own energy.
The main goal of the Zero Energy House initiative is to bring the benefits of
zero energy technology into the mainstream of both the residential and commercial
building industries, but the initiative's near-term focus is on new home construction.
Advantages of Zero Energy Houses can be followed as:
Zero Energy House control temperature changes; it has high comfort.
Zero Energy House continues functioning even during blackouts.
House protects its owner from changes in energy prices.
Zero Energy House saves energy and reduces pollution.
Zero Energy Houses optimize:
Passive solar heating and cooling
Natural day-lighting
Energy-efficient construction
Energy-efficient appliances and lighting
Solar thermal and solar electric systems [6].
Currently, many studies are conducted on energy-efficient buildings. A major
aim during the design of these buildings is to reduce energy consumption. If some
examples should be given from related studies around the world, the first one will be
from Lakeland, Florida [7]:
5
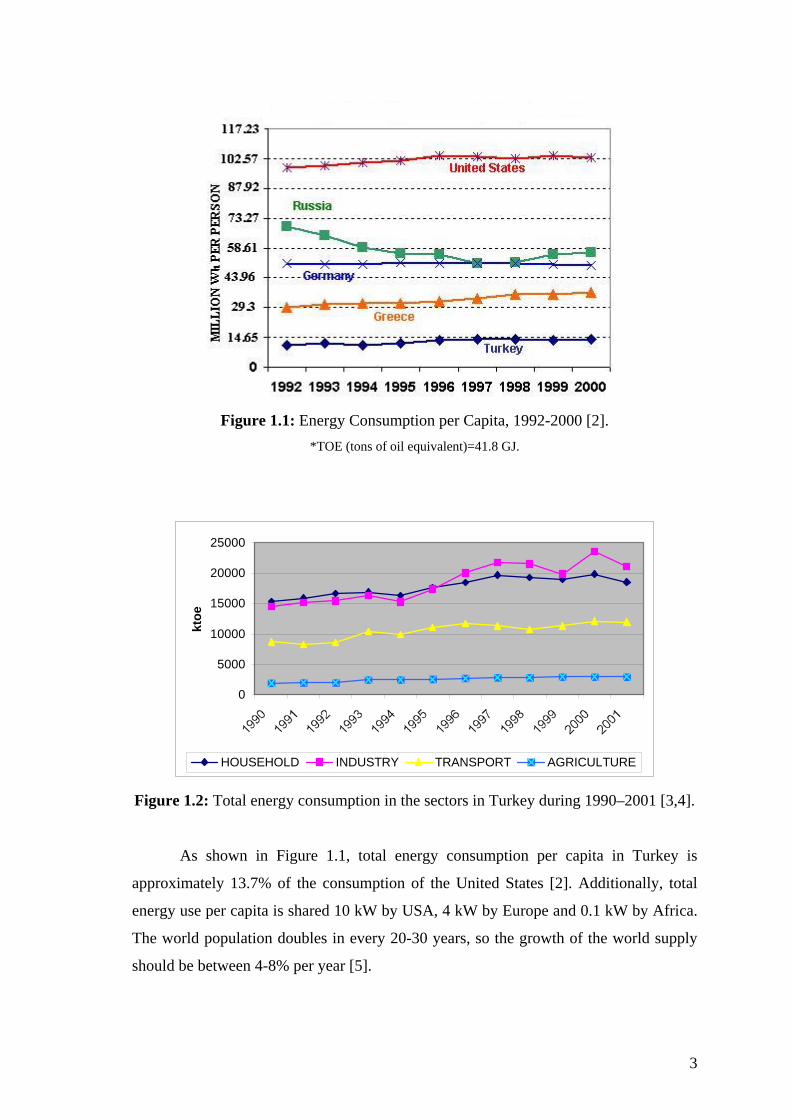
The two houses were built in Lakeland, Florida, in the spring of 1998. They
were constructed by the same builder and had identical compass orientations and floor
plans (of 740 m2). The energy use of both houses was monitored for more than a year.
Figure 1.3: A bird’s eye view of both homes.
Both control and zero energy home features in Florida are listed below:
Control Home Features:
Gray/brown asphalt shingle roof with 1.5-foot overhangs
Attic insulation
Wall insulation on interior of concrete block walls
Single-glazed windows with aluminum frames
Standard appliances (electric range, electric water heater, refrigerator, and
electric dryer)
Standard incandescent lighting (30 recessed-can lights)
Standard-efficiency, 4-ton, seasonal energy efficiency ratio 10, heat pump, (a
typical air conditioner in Florida).

6
Zero Energy Home Features:
2-kW solar water heater
4-kW utility-interactive PV system
White-tile roof with 3-foot overhangs
Attic insulation
Exterior insulation over concrete block system
Advanced solar control double-glazed windows
Oversized, interior-mounted ducts
High-efficiency refrigerator
High-efficiency compact fluorescent lighting
Programmable thermostat
Downsized seasonal energy efficiency ratio 15, variable-speed, and 2-ton air
conditioner with field-verified cooling-coil airflow.
Differences between control home and zero energy home are listed in Table 1.2 and
can be clearly seen that, monthly cost of power for zero energy home is 80% less than
the control home.
Table 1.2: Energy Bottom Line for June 1998.
Site Description
Power
Use
PV Array
Output
Net Power
Use
Monthly
Cost PV Output %
(kWh) (AC kWh) (kWh) of Power of Total Loads
Zero Energy Home 837 502 335 $27 60%
Control Home 1 839* 0 1 839* $147 0%
* Air Conditioning Only
7
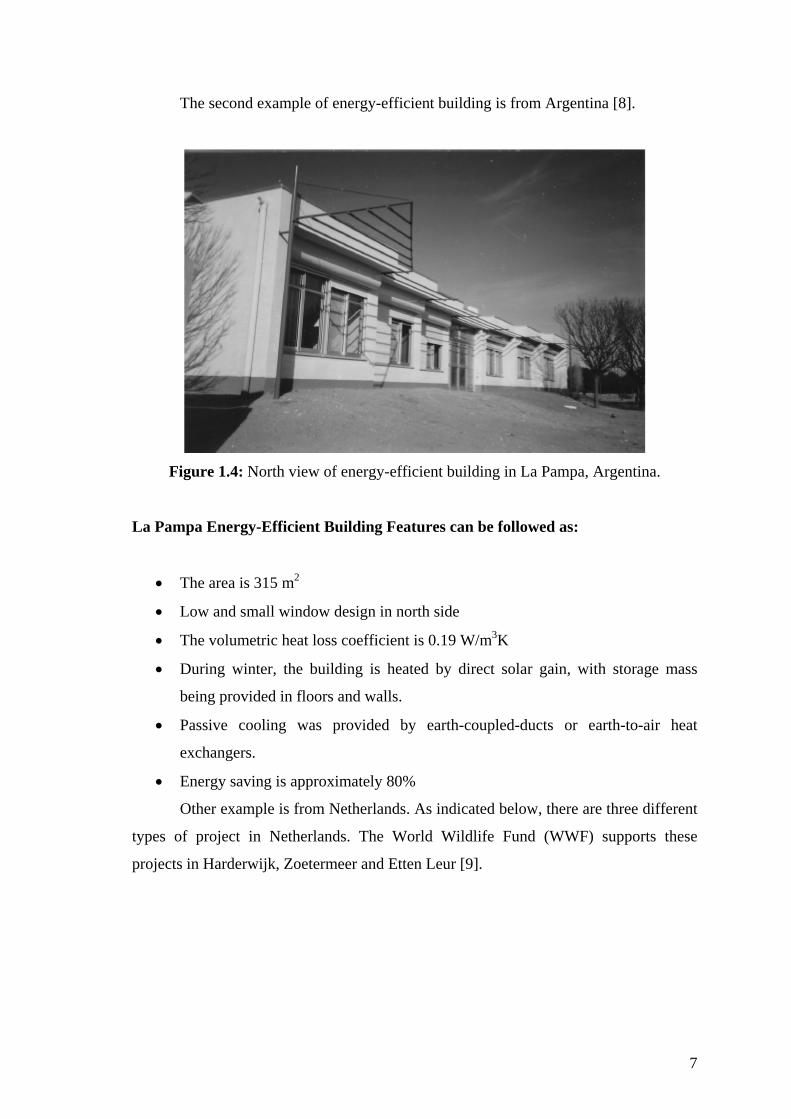
The second example of energy-efficient building is from Argentina [8].
Figure 1.4: North view of energy-efficient building in La Pampa, Argentina.
La Pampa Energy-Efficient Building Features can be followed as:
The area is 315 m2
Low and small window design in north side
The volumetric heat loss coefficient is 0.19 W/m3K
During winter, the building is heated by direct solar gain, with storage mass
being provided in floors and walls.
Passive cooling was provided by earth-coupled-ducts or earth-to-air heat
exchangers.
Energy saving is approximately 80%
Other example is from Netherlands. As indicated below, there are three different
types of project in Netherlands. The World Wildlife Fund (WWF) supports these
projects in Harderwijk, Zoetermeer and Etten Leur [9].
8
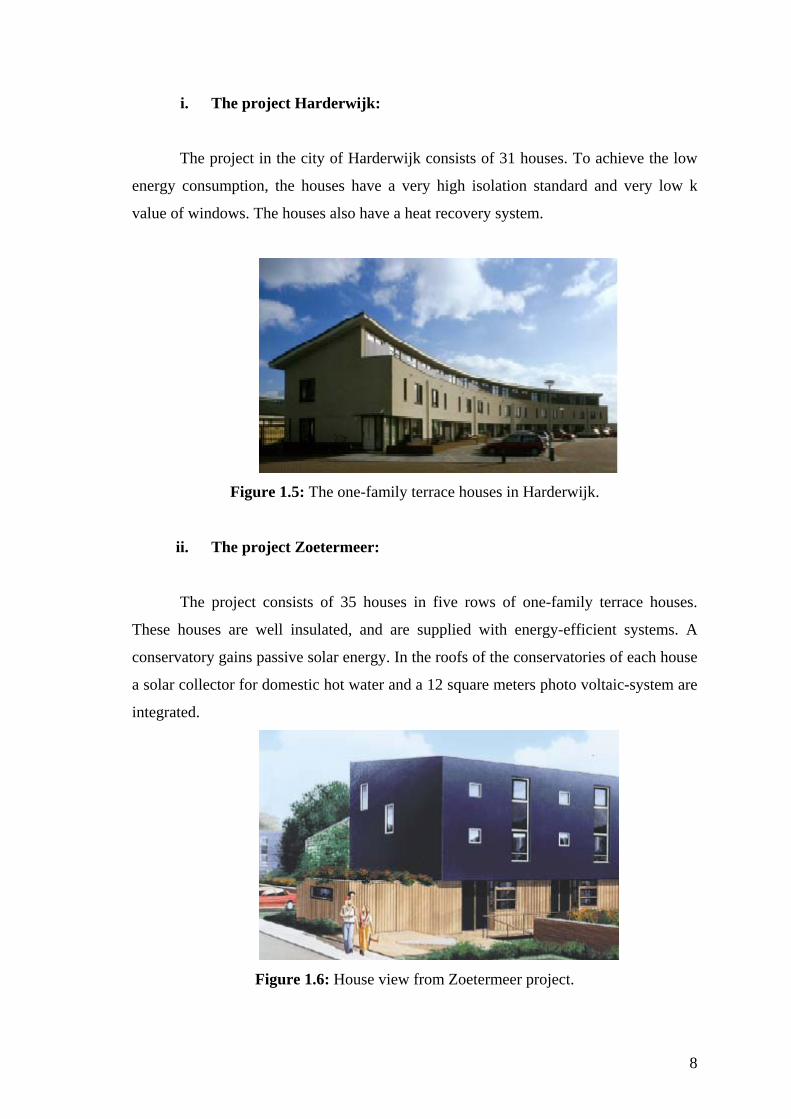
i. The project Harderwijk:
The project in the city of Harderwijk consists of 31 houses. To achieve the low
energy consumption, the houses have a very high isolation standard and very low k
value of windows. The houses also have a heat recovery system.
Figure 1.5: The one-family terrace houses in Harderwijk.
ii. The project Zoetermeer:
The project consists of 35 houses in five rows of one-family terrace houses.
These houses are well insulated, and are supplied with energy-efficient systems. A
conservatory gains passive solar energy. In the roofs of the conservatories of each house
a solar collector for domestic hot water and a 12 square meters photo voltaic-system are
integrated.
Figure 1.6: House view from Zoetermeer project.
9
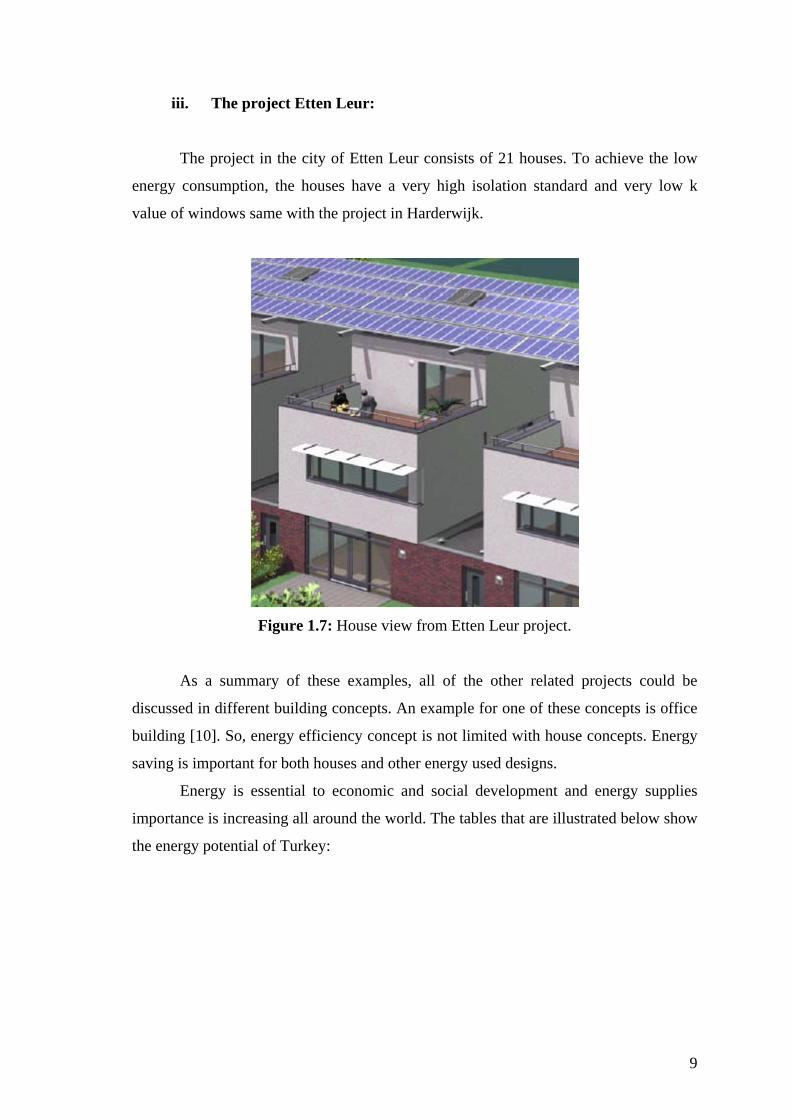
iii. The project Etten Leur:
The project in the city of Etten Leur consists of 21 houses. To achieve the low
energy consumption, the houses have a very high isolation standard and very low k
value of windows same with the project in Harderwijk.
Figure 1.7: House view from Etten Leur project.
As a summary of these examples, all of the other related projects could be
discussed in different building concepts. An example for one of these concepts is office
building [10]. So, energy efficiency concept is not limited with house concepts. Energy
saving is important for both houses and other energy used designs.
Energy is essential to economic and social development and energy supplies
importance is increasing all around the world. The tables that are illustrated below show
the energy potential of Turkey:

10
Table 1.3: Primary Energy Production and Consumption of Turkey in1998 and 2001
(ktoe) [4,11].
Primary Energy Production and Consumption of Turkey in1998 and 2001 (ktoe)
Energy Production Energy Consumption
1998 2001 1998 2001
Hard Coal 1 678 1 255 8 160 6 972
Lignite 1 2514 1 2772 12 414 13 091
Oil 3 230 2679 32 083 30 721
Natural Gas 684 284 10 635 14 967
Total Fossil 18 106 16 990 63 292 65 751
Hydropower 3 632 2 072 3 632 2 072
Geothermal 256 310 256 310
Solar 98 130 98 130
Wood 5 512 5 060 5 512 5 060
Waste and Dung 1 492 1 372 1 492 1 372
Total renewable 10 878 8 945 10 878 8 945
*toe (tons of oil equivalent)=41.8 GJ.
Table 1.3 shows that Turkey’s total energy production is only 30% of its all
consumption. This value clearly indicates that more energy sources are needed. In
Turkey today, oil and natural gas still supply approximately 63% of our energy needs
but these energy sources are expensive. In conclusion, Turkey has to tend to new energy
sources, which include solar, hydropower, biomass, geothermal and wind energy.
When examined the solar, wind and geothermal energy potential of Turkey, it
can be clearly stated that Turkey has great renewable energy sources.

11
Table 1.4: Solar and Wind Energy Potential by Regions of Turkey [11,12].
Solar and Wind Energy Potential by Regions of Turkey
Annual Average
Solar Radiation
Sunshine
Duration
Annual
Average Wind
Density
(kWh/m2year) (h/year) (W/m2)
Black Sea 1 120 1 971 21.31
Marmara 1 168 2 409 51.91
Aegean 1 304 2 738 23.47
Central Anatolia 1 314 2 628 20.14
East Anatolia 1 365 2 664 13.19
Mediterranean 1 390 2 956 21.36
Southeast Anatolia 1 460 2 993 29.33
Turkey Average 1 303 2 623 25.81
As known, Turkey is surrounded by the Black Sea in the North, the Marmara
and the Aegean Sea on the West and the Mediterranean Sea in the South, give it very
long seashores. So, the regions of Aegean, Marmara and East-Mediterranean have high
wind energy potential. Turkey’s total theoretically available potential for wind power is
calculated to be around 90 000 MW annually. It is also estimated that Turkey has an
economical wind power potential of about 10 000 MW [13].
Another energy source is geothermal energy. Turkey has rich geothermal energy
capacity. Data accumulated since 1962 show that there may exist about 4 500 MW of
geothermal energy, which can be used for electrical power generation in high enthalpy
zones. Geothermal central heating, which is less costly than natural gas, could be
feasible for many regions in the country. The total geothermal energy potential of
Turkey is about 2 568 MW in 2000, but both for electrical and thermal uses of
geothermal energy production are only 1 200 MW [11,14].

12
Share of Total Primary Energy Supply* in 2001
TURKEY
Coal 28%
Oil 41%
Gas 18%
Geothermal/solar/wind1%
Comb. renew. & waste9%
Hydro 3%
Hydro Comb. renew. & waste Geothermal/solar/wind Coal Oil Gas
*Share of TPES excludes electricity trade.
Figure 1.8: Turkey’s Share of Total Primary Energy Supply in 2001 [15].
As shown from Figure 1.8 Turkey still meets its energy needs from fossil fuels.
But Turkey has good renewable energy sources compared with the world regarding to
its location, and its very good solar radiation in average of 3 .6 kWh/m2 per day. In
Figure 1.9, can be easily seen that, Turkey has better solar radiation than European
countries and many different areas of the world.
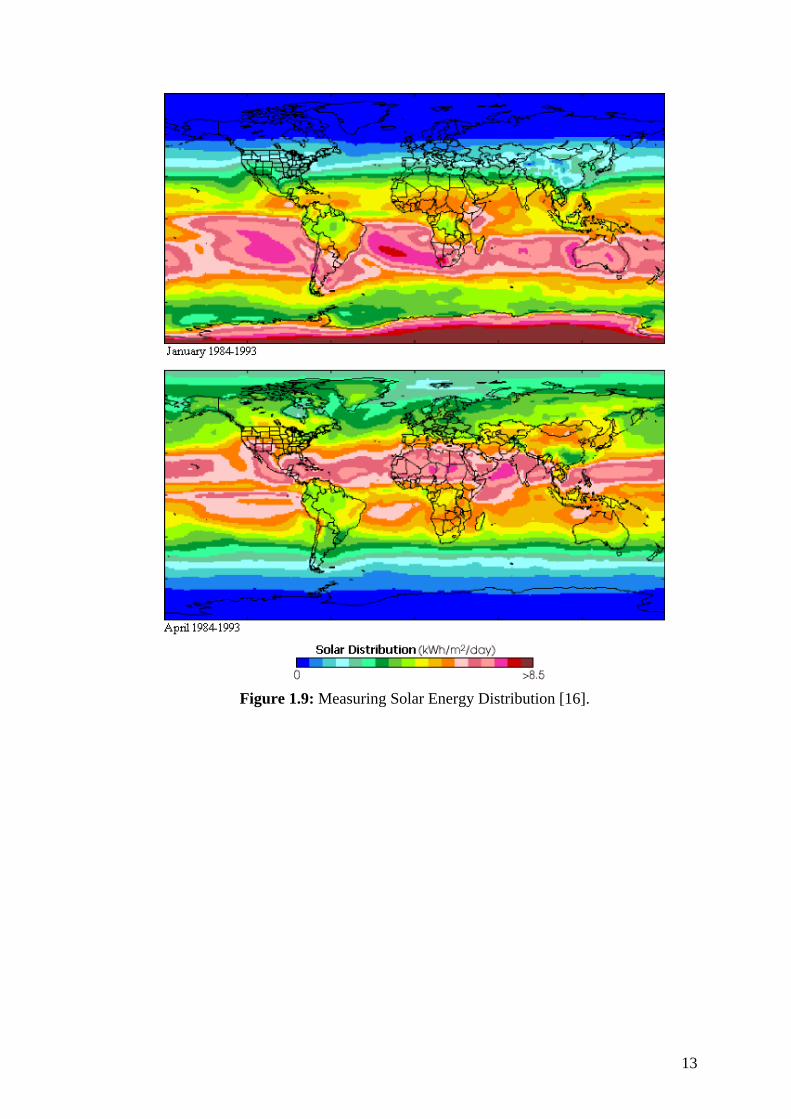
13
Figure 1.9: Measuring Solar Energy Distribution [16].
14
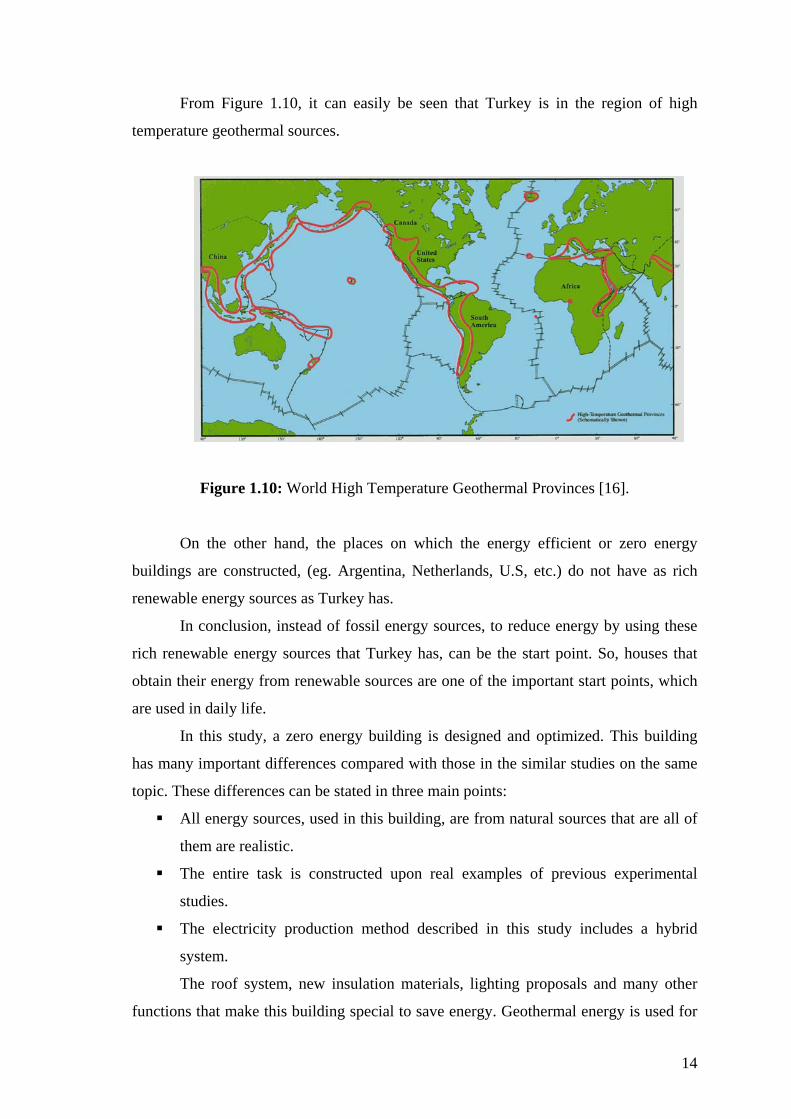
From Figure 1.10, it can easily be seen that Turkey is in the region of high
temperature geothermal sources.
Figure 1.10: World High Temperature Geothermal Provinces [16].
On the other hand, the places on which the energy efficient or zero energy
buildings are constructed, (eg. Argentina, Netherlands, U.S, etc.) do not have as rich
renewable energy sources as Turkey has.
In conclusion, instead of fossil energy sources, to reduce energy by using these
rich renewable energy sources that Turkey has, can be the start point. So, houses that
obtain their energy from renewable sources are one of the important start points, which
are used in daily life.
In this study, a zero energy building is designed and optimized. This building
has many important differences compared with those in the similar studies on the same
topic. These differences can be stated in three main points:
All energy sources, used in this building, are from natural sources that are all of
them are realistic.
The entire task is constructed upon real examples of previous experimental
studies.
The electricity production method described in this study includes a hybrid
system.
The roof system, new insulation materials, lighting proposals and many other
functions that make this building special to save energy. Geothermal energy is used for

15
heating purposes and for hot water production, wind and solar energy for producing
electricity.
The main goal of this study is to heat, cool and ventilate, and to choose the
construction materials and suggest other energy saving methods for the zero energy
building. This study collects many ways, to save energy with many different energy
saving methods, with a single compact example.
Chapter 2 describes the building design, architecture, and functions of the
building: building’s heating and cooling systems, lighting, energy storage and energy
savers etc.
Heating and cooling load calculations results are given in Chapter 3.
In Chapter 4, considered floor-heating system is explained and the design
procedures are given.
Chapter 5 describes the design of ventilation system of the building. Depending
on this design, energy storage design procedures are explained in Chapter 6 and results
are given in Chapter 7.

16
Chapter 2
GULBAHCE ZERO ENERGY BUILDING
2.1 General Information
Gulbahce Zero Energy Building (GUZEB) will be located in URLA, near the
campus area of Izmir Institute of Technology, TURKEY.
Figure 2.1: Location of Gulbahce Zero Energy Building (GUZEB).
2.2 Gulbahce Zero Energy Building’s (GUZEB) Architectural Design
The Architecture Department of Izmir Institute of Technology (IZTECH) made
the architectural project of GUZEB in coordination with the Mechanical Engineering
Department of IZTECH. Its design is based on to save energy more efficiently with
special, and functional designs. GUZEB’s position, architectural views and 3D view can
be seen from Figure 2.2 to 2.9.
As shown in Figure 2.2, the location of the building is near the campus area of
IZTECH, close to the seaside of Aegean Sea. Its location is planned based on the wind
direction on the related location. In Figure 2.3, the roof style is designed as a function of
the wind direction. This style helps to direct the wind into building for natural
ventilation.

17
In general, this building is designed as a showroom. Additionally, the building
will be functioned as a library in usual days. But in special days, this building will be
functioned as a showroom and university’s special day meetings, for instance
symposiums, etc. So, building’s architecture gets importance from that point.
Firstly, as shown in Figure 2.4, two huge triple reflective glasses, which have
80-cm. distances between them, stated in front of the building entrance. Between 80cm
distance pebbles, which absorb the heat and functioned as heat storage system are
spreaded out. From Figure 2.5, while entering the building, between these triple glasses,
entrance is located. This entrance will be functioned as a temporary exhibition hall. This
place can be used for presenting the special day’s related tables or other related
materials, etc. On the other hand, it can be used for break time waiting.
Secondly, on the left side of the entrance, library is located. This library will
include many books and materials about energy efficient buildings. Computers will be
placed for searching data from Internet. Also, this library will be used for symposiums
or other similar events. With removable and portable tables, library can be used for
presentations. Thirdly, there will be two offices for staff in GUZEB.
Also, Canteen capacity will be enough for little coffee breaks, and only a mini
refrigerator and little kitchen equipments will be placed.
There will be two toilets, one for handicapped person.
Lastly, installation room will be placed at the east side of the GUZEB, near the
building. Each plant equipments will be placed in this installation room.

Figure 2.2: Location of GUZEB.

Figure 2.3: Side View of GUZEB.

Figure 2.4: Front Side View of GUZEB.
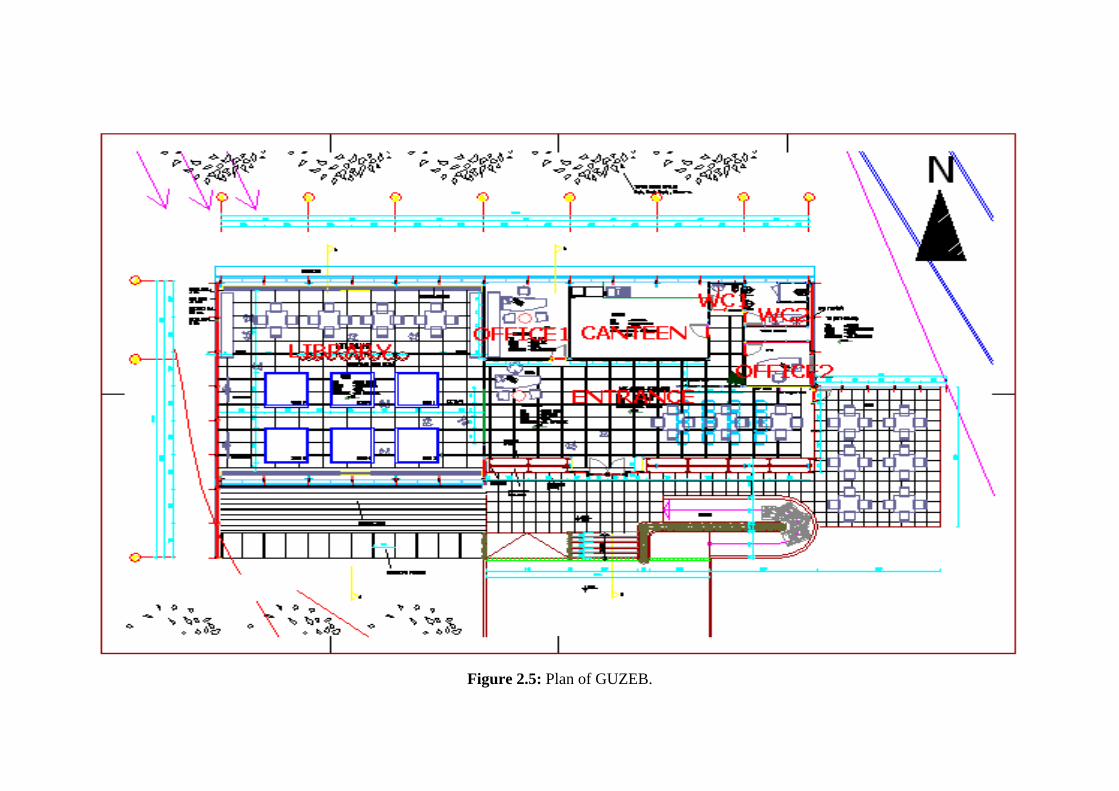
Figure 2.5: Plan of GUZEB.

Figure 2.6: 3D View of GUZEB.
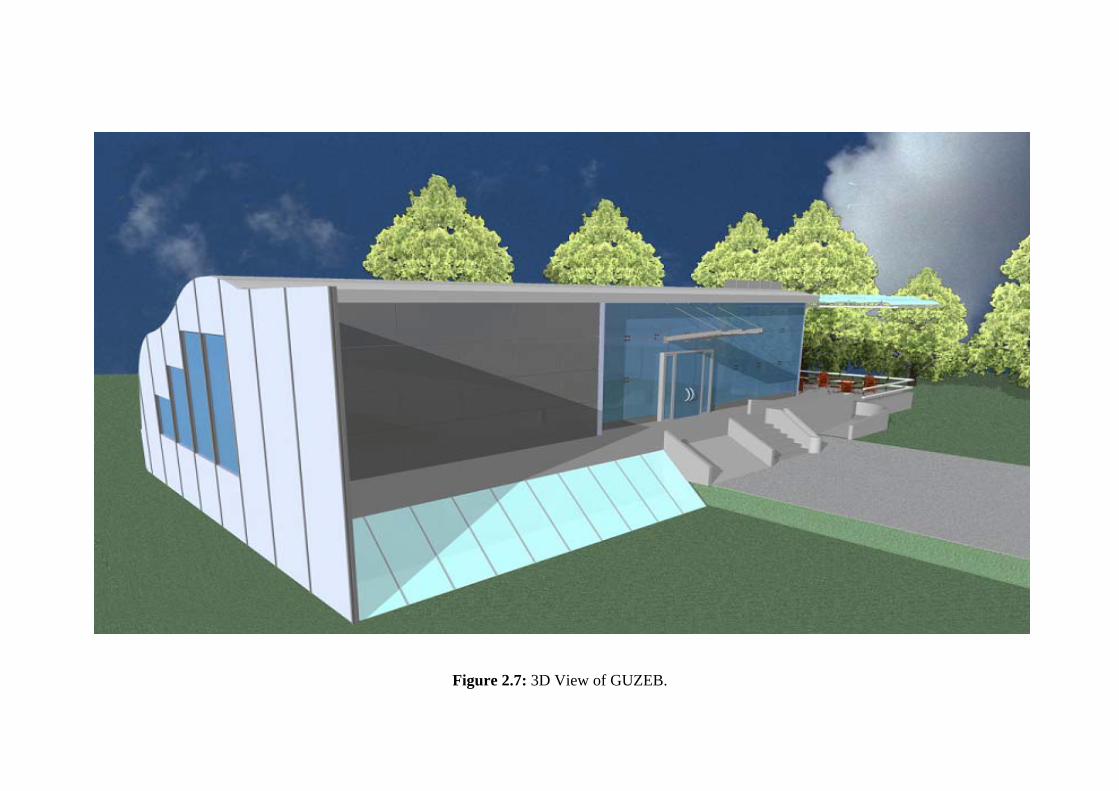
Figure 2.7: 3D View of GUZEB.

Figure 2.8: 3D View of GUZEB.
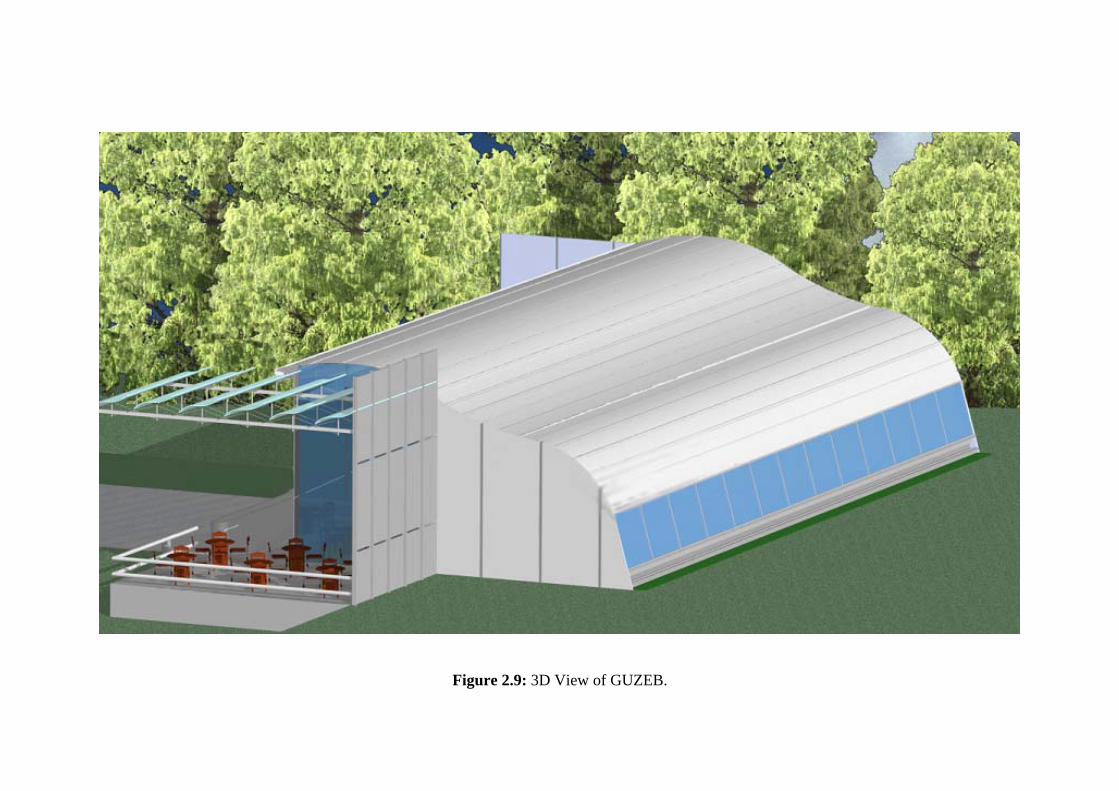
Figure 2.9: 3D View of GUZEB.
26
2.3 Selection of Construction Materials
Many construction materials are used in GUZEB’s design. These materials are
chosen for protecting energy, and for energy saving. These materials are listed below.
2.3.1 Windows
As mentioned before, all of the building’s glasses will be triple glass and PVC.
The air gaps between these three glasses are more helpful to protect energy than double
glass windows (Figure 3.4). At the north side, backside of the building, windows cannot
be collapsible. So, this functionality lowers infiltration. The south side of the building
will be covered with this triple glass as mentioned.
Storing solar energy will not be a problem in winters with the help of the
pebbles between two glasses. But in summer, heat load will cause problems. But these
problems can be solved with curtains that not allow sunshine in.
2.3.2 Walls
Outer walls are made of metal sheet with 20cm. insulation material between
them (Figure 3.3). Metal sheet is chosen because of the special roof style. Furthermore,
some walls are supported by insulation with special insulation material. This insulation
material will be discussed in Chapter 2.
2.3.3 Floor
The building will be single floored. Because of this, floor insulation gains more
importance (Figure 3.1). Floor-heating system will be used for heating the building
(Chapter 4). So, floor is the most important part of the building because of the special
functionality of the building.
2.4 Heating System of the GUZEB
Heating system of GUZEB is designed based on the floor heating system. As
mentioned, Turkey has great geothermal sources. Close to the building area, an ancient
27
cave exists and this cave has approximately 32oC water source. Nevertheless, the
temperature having that value will not be sufficient for floor heating system. Floor
heating systems operate between 29-60ºC, compared to other hydronic heating systems'
range of 54-71ºC. On the contrary, this source is continuous and limitless. So, this
continuity helps us to use this source. More information will be studied in Chapter 4
with the design of floor heating system of GUZEB.
2.5 Cooling System of the GUZEB
GUZEB is designed for library function but on special days, for example on the
symposium day, the building’s cooling load will be maximum or 2-3 times greater than
on usual days. If the cooling system is chosen for regular day cooling load, cooling
system will not be enough on special days, while people load, equipment load or other
loads are maximum.
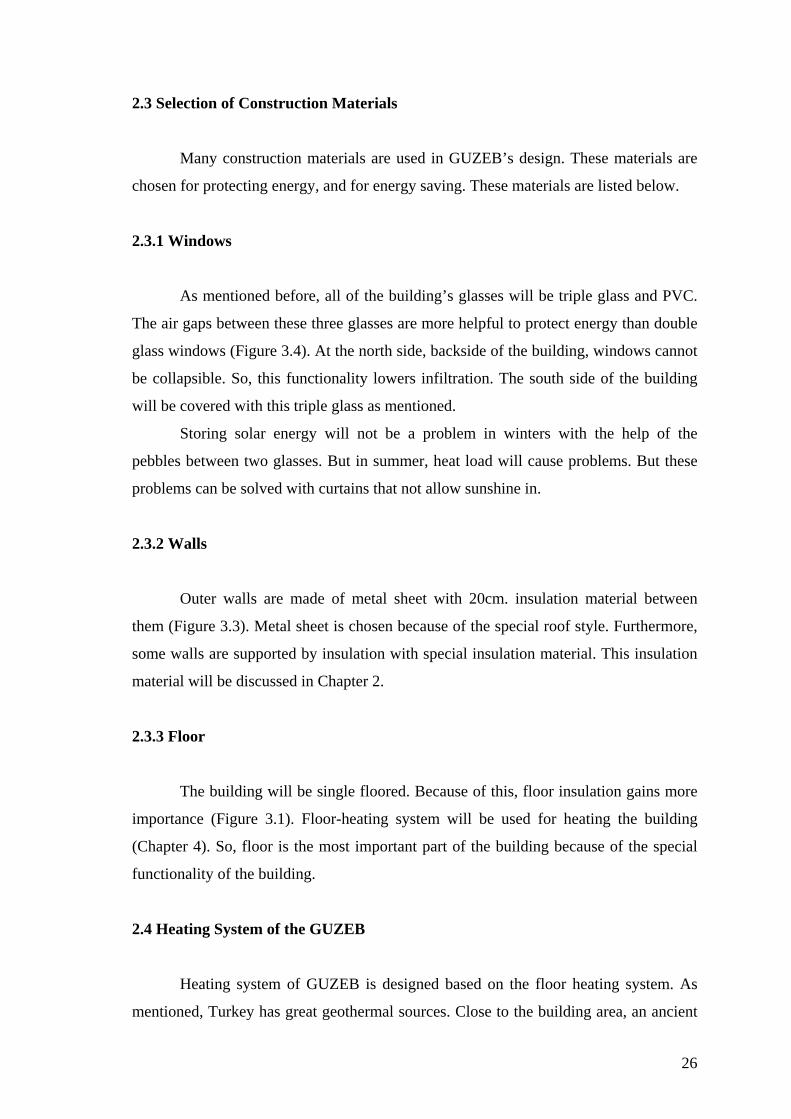
For instance, churches have minimum cooling load on regular days. In contrast,
on Sundays, churches have maximum heat load (Figure 2.10). But if the cooling system
is chosen for Sundays, cooling system will not operate on other days with full capacity.
This means that installation and operating cost will be meaningless. At this stage, stored
energy will be more suitable and operable. This means that while operating on regular
days, energy could be stored for special days (Chapter 6).
Cooling System will be controlled by automatic control systems.
Figure 2.10: Projection of a Church Cooling Load on Sundays.
28
2.6 Clean and Wastewater System of the GUZEB
GUZEB has two toilets and a canteen. As a result, clean and wastewater design
is related with these three spaces. Warm water will be used both in Canteen and in
toilets. This water will be pumped from the ancient cave. Clean water can be taken from
network or an artesian well.
2.7 Fire Protection System of the GUZEB
Fire protection system will be controlled automatically. Fire protection system
will take its water from energy storage tank. In Chapter 6, design of energy storage tank
will be discussed.
2.8 Lighting of the GUZEB
Lighting load of the GUZEB have to be minimum for energy saving. Because of
this reason, window area is taken maximum to let the daylight lighting in. On the
contrary, in summer, large window area will cause problem from the point of view of
cooling load. Curtains simply will solve this problem.
At nights or more lighting is needed, especially for the areas which have not
enough window area, energy efficient lighting sources will be used. These sources are
34W florescent lighting sources. For library lighting, 10 bulbs will be used, 4 bulbs for
entrance, 2 bulbs for each place, canteen and office1, and 1 bulb for each place, office2
and toilets [17]. Fluorescents use up to 75% less energy, and should last approximately
10 000 hours.
Furthermore, other lighting options are suggested. These sources will be
discussed in Chapter 2, Energy Saving Suggestions section. So with the light of these
suggestions, lighting load of the library is taken less then the real calculation data.
29
2.9 Energy Saving Suggestions
2.9.1 Silica Aerogel
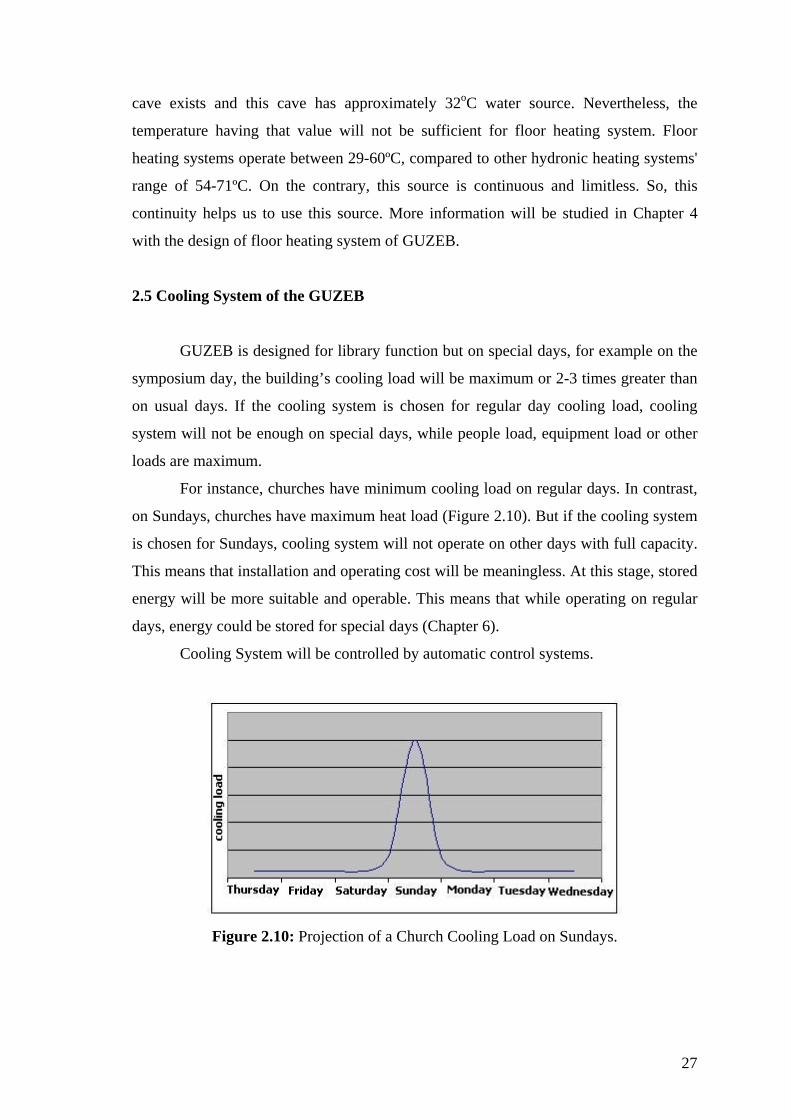
Aerogels are transparent, amazingly porous, low-density foams. Silica aerogel is
a light form of silica that is 99.8% air [18,19]. Figure 2.11 shows the pore structure.
Figure 2.11: Pore Structure of Aerogel [20].
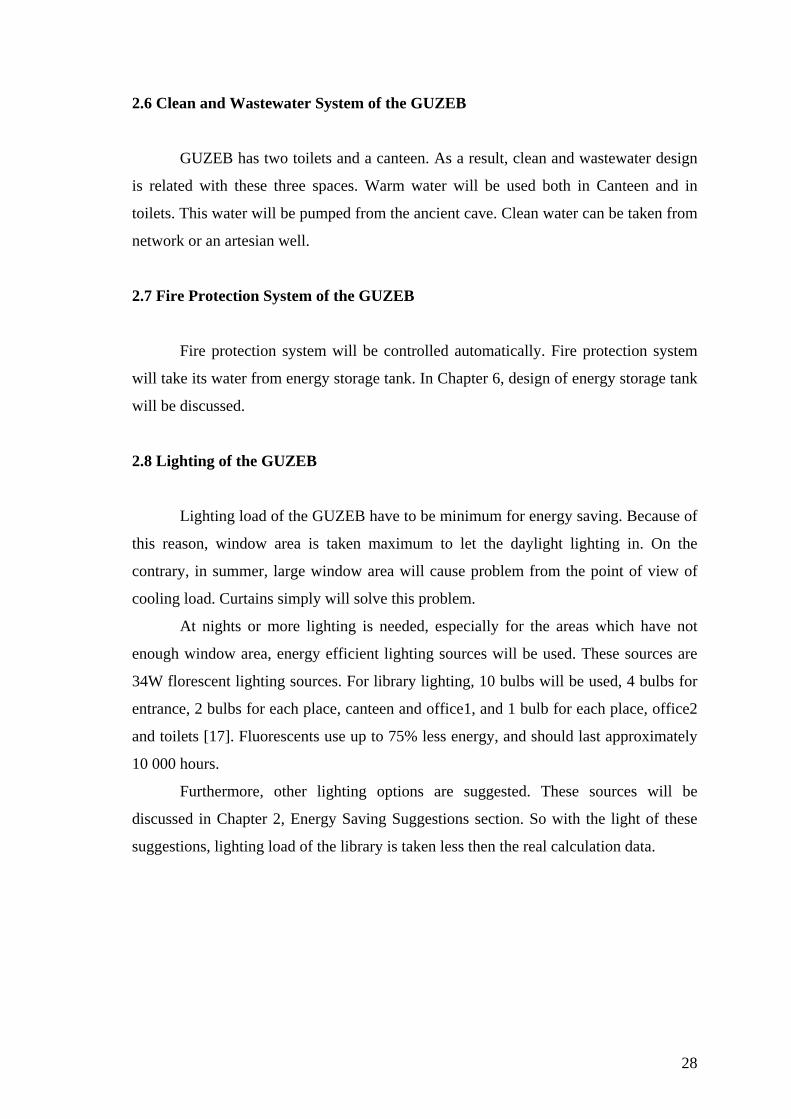
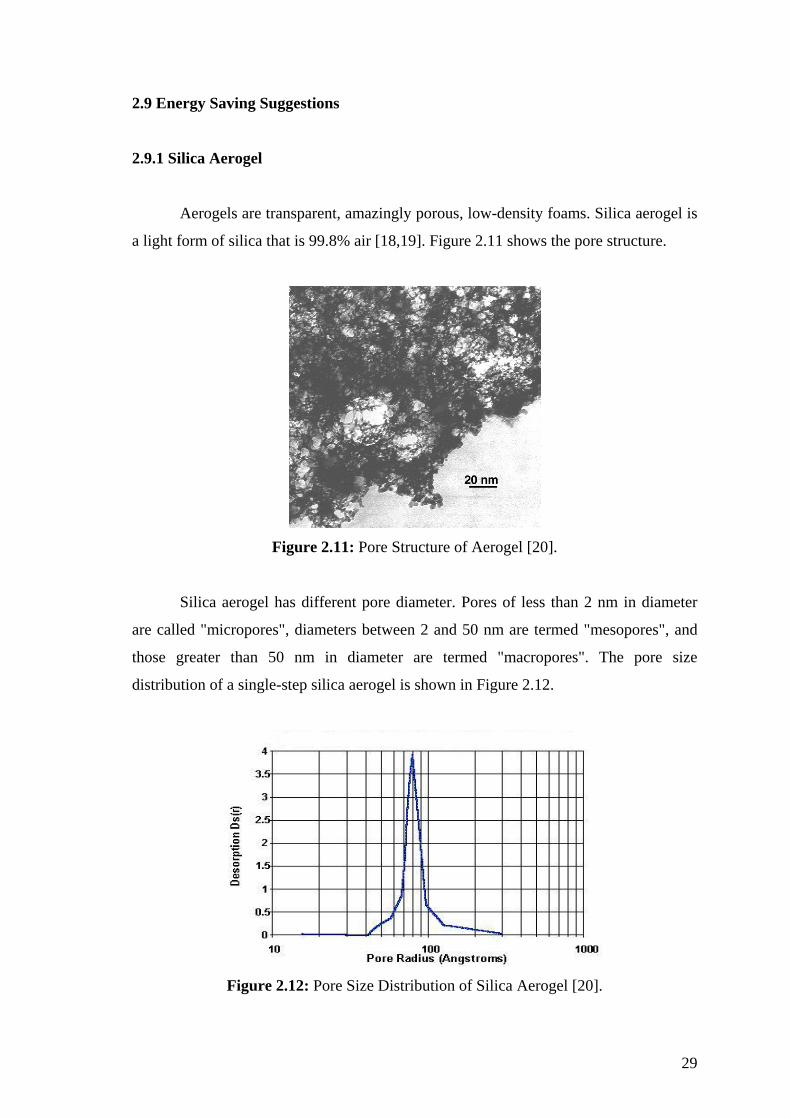
Silica aerogel has different pore diameter. Pores of less than 2 nm in diameter
are called "micropores", diameters between 2 and 50 nm are termed "mesopores", and
those greater than 50 nm in diameter are termed "macropores". The pore size
distribution of a single-step silica aerogel is shown in Figure 2.12.
Figure 2.12: Pore Size Distribution of Silica Aerogel [20].
30
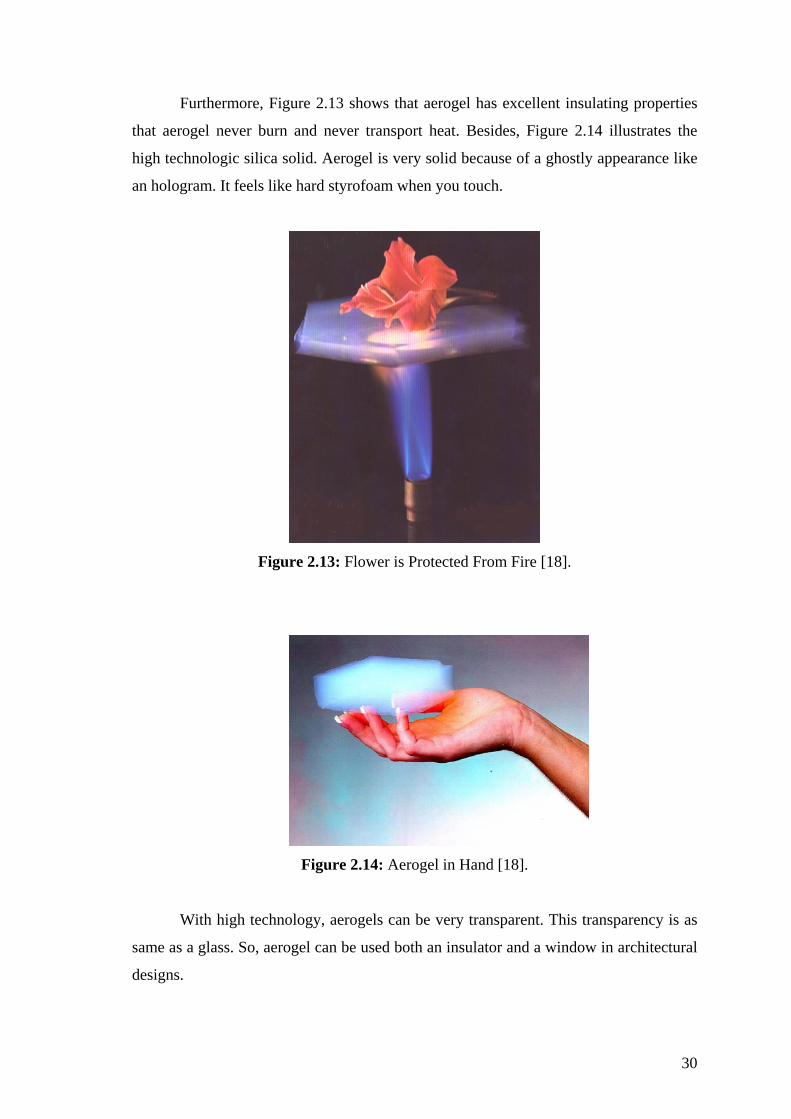
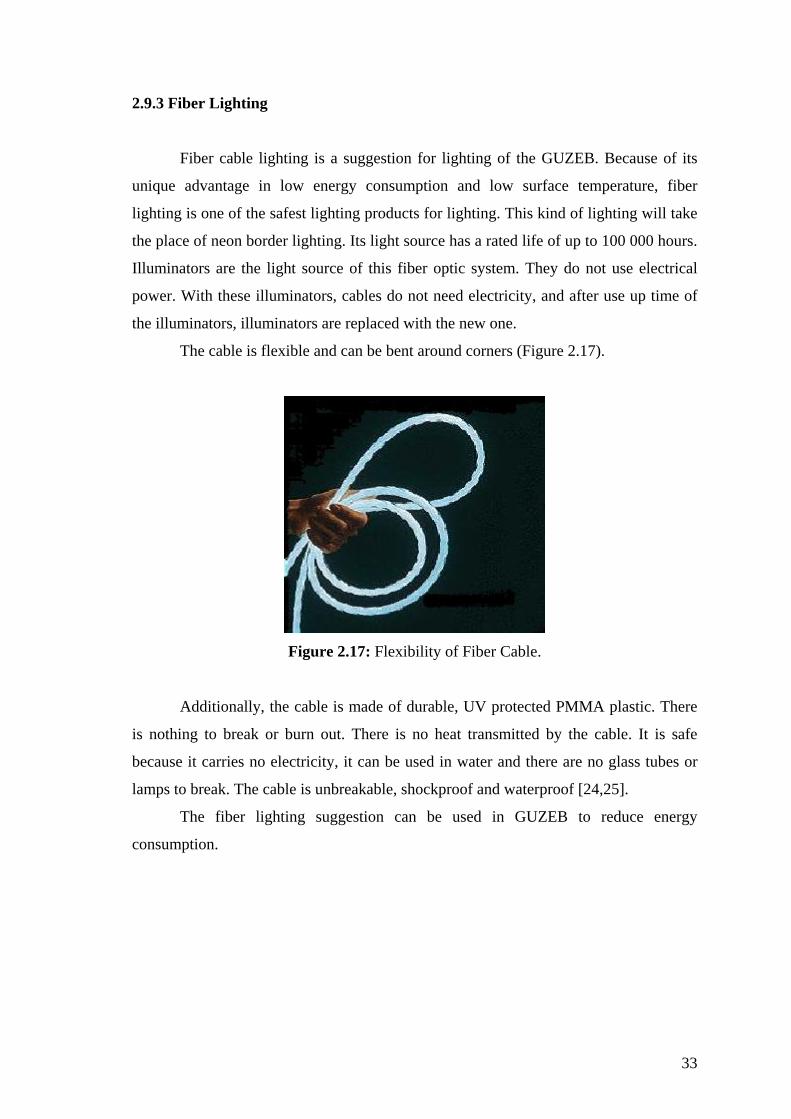
Furthermore, Figure 2.13 shows that aerogel has excellent insulating properties
that aerogel never burn and never transport heat. Besides, Figure 2.14 illustrates the
high technologic silica solid. Aerogel is very solid because of a ghostly appearance like
an hologram. It feels like hard styrofoam when you touch.
Figure 2.13: Flower is Protected From Fire [18].
Figure 2.14: Aerogel in Hand [18].
With high technology, aerogels can be very transparent. This transparency is as
same as a glass. So, aerogel can be used both an insulator and a window in architectural
designs.

31
Figure 2.15: Transparency Example of Aerogel [20].
Silica aerogel are used for many applications. These applications are listed in
Table 2.1 by the properties and features.
Table 2.1: Aerogel Properties and Features with Their Application [21].
Property Features Applications
Thermal Conductivity
*best insulating solid building insulation, *transparent portable coolers,transport vehicles,pipes,cryogenic,*high temperature skylightsspace vehicles and probes,casting molds *lightweight
Density/Porosity
*lightest synthetic solid catalysts,sorbers,sensors,fuel storage, *homogeneous ion exchange ,X-ray lasers *high specific surface area *multiple composition
Optical *low refractive index solid Cherenkov detectors, lightweight optics, *transparent lightguides,special effect optic *multiple composition
Acoustic *lowest sound speed impedance matchers for transducers,speakers
Mechanical *elastic energy aborber,hypervelocity particle trap *lightweight
Electrical *lowest dielectric constant spacers for vacuum electrodes, *high dielectric strength vacuum display spacers,capacitors
*high surface area

32
As shown from the Table 2.1, silica has many applications areas and one of its
most important applications is building insulation because aerogels are the best insulator
that ever discovered. Aerogels provides 39 times more insulating than the best
fiberglass insulation [18]. High technologic aerogel’s thermal conductivity at 300oK is
0.01-0.02 W/m2K [19]. But, this value is changed depends on the types of silica aerogel,
which are granular and monolithic. Because of this property, silica aerogel application
is decided to use in GUZEB. Especially the biggest outer wall, west side of the building,
aerogel application will be used. Approximately, 25-m2 granular silica aerogel will be
used between 6 mm glass panels. Thermal conductivity is taken 0.51 W/m2K [22]. This
kind of aerogel is used for GUZEB because of the investment cost of the building. As
known, given examples above for instance high transparency and high insulation
property, need high technology.
2.9.2 Composite Ceramic Roof Insulation
Composite ceramic insulation is designed for roofs, sidewalls, buildings and
homes to help for insulation. This coating material will be used on roof of GUZEB.
Figure 2.16: Pore Structure of Composite Ceramic Insulation Material [23].
As shown in Figure 2.16, this material is different from other applied coatings.
More air between the particles increases the efficiency of heat transfer. With these kind
of insulation materials energy savings average is 30-75% depending on geographic area.
This coating material’s coat thickness is approximately 0.5mm. It has low permeability,
and reflectivity is 76%, has 100% UV reflection. The most important part for our design
is thermal conductivity. Its thermal conductivity is 0.1 W/m2K [23].
33
2.9.3 Fiber Lighting
Fiber cable lighting is a suggestion for lighting of the GUZEB. Because of its
unique advantage in low energy consumption and low surface temperature, fiber
lighting is one of the safest lighting products for lighting. This kind of lighting will take
the place of neon border lighting. Its light source has a rated life of up to 100 000 hours.
Illuminators are the light source of this fiber optic system. They do not use electrical
power. With these illuminators, cables do not need electricity, and after use up time of
the illuminators, illuminators are replaced with the new one.
The cable is flexible and can be bent around corners (Figure 2.17).
Figure 2.17: Flexibility of Fiber Cable.
Additionally, the cable is made of durable, UV protected PMMA plastic. There
is nothing to break or burn out. There is no heat transmitted by the cable. It is safe
because it carries no electricity, it can be used in water and there are no glass tubes or
lamps to break. The cable is unbreakable, shockproof and waterproof [24,25].
The fiber lighting suggestion can be used in GUZEB to reduce energy
consumption.

34
2.9.4 Curtains and Panels
Many different types of curtains or panels can be used to shade the areas.
Specially, entrance has huge glass window area to let the sunshine in. On the other
hand, in summer, this huge window is a handicap for cooling load. With the curtains or
panels, sunshine will not be let in. For this reason, panels will be better to use outside of
the glass, not in the space. This application can help not to store energy inside of the
space that is 80cm. between two glasses.
35
Chapter 3
HEATING AND COOLING LOAD CALCULATIONS
3.1 General Information
In this chapter, GUZEB’s heating and cooling load are calculated and the results
are given.
Firstly, calculation details, which include material selection that will be used in
construction and thermal conductivity of these selected materials against the thickness
of the materials, are illustrated.
Secondly, for each part of the GUZEB, heating load is calculated according to
TS 825 standard for determination of the heating load in buildings [26]. The results are
given in Table 3.5.
Besides, cooling load is calculated in two different ways that both are based on
ASHRAE standards [27]. Alarko-Carrier’s HVAC Design Software, E20-II Hourly
Analysis Program [28] calculates the cooling load values with hourly changing load
distributions. This distribution is based on the loads that cause changing on cooling load
hour by hour. Software values are compared with the second calculation method, which
calculates the values not with hourly changing load distributions [29].
Finally, cooling load results are given in Table 3.9. Alarko-Carrier’s HVAC
Design Software printouts are given in Appendix A.
36
3.2 Heating Load Calculations
3.2.1 Construction Materials and Thermal Conductivity of the Materials
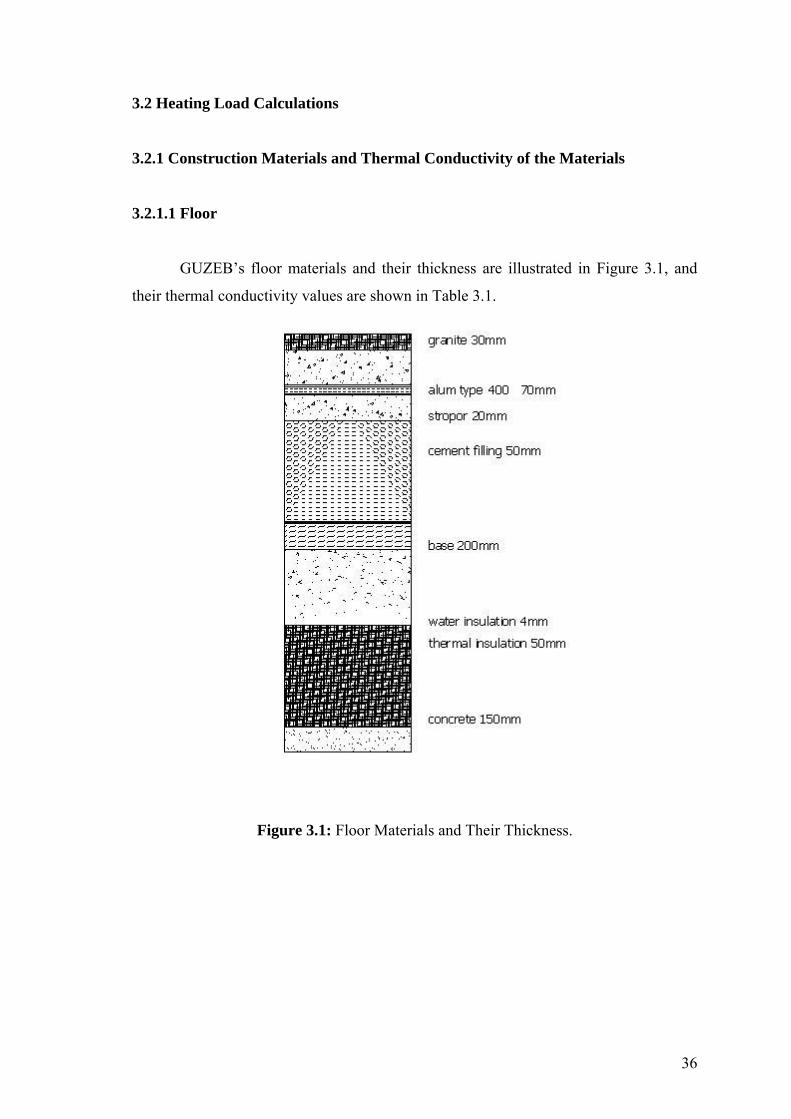
3.2.1.1 Floor
GUZEB’s floor materials and their thickness are illustrated in Figure 3.1, and
their thermal conductivity values are shown in Table 3.1.
Figure 3.1: Floor Materials and Their Thickness.

37
Table 3.1: Thermal Conductivity Values of Floor Materials.
Material Width Thermal Conductivity
(m) (W/mK)
granite 0.03 3.5
alum type 400 0.07 0.72
stropor 0.02 0.04
cement filling 0.05 1.74
base 0.2 2.1
water insulation 0.004 0.7
thermal insulation 0.05 0.04
concrete 0.15 2
stone 0.2 1.4
sand 0.05 2.1
3.2.1.2 Roof
GUZEB’s roof materials and their thickness are illustrated in Figure 3.2, and
their thermal conductivity values are shown in Table 3.2.
Figure 3.2: Roof Materials and Their Thickness.
38
Table 3.2: Thermal Conductivity Values of Roof Materials.
Material Width Thermal Conductivity
(m) (W/mK)
thermal insulation coating 0.003 0.1
zinc cover 0.02 116
water insulation 0.02 0.7
thermal insulation 0.2 0.04
metal sheet 0.05 15.1
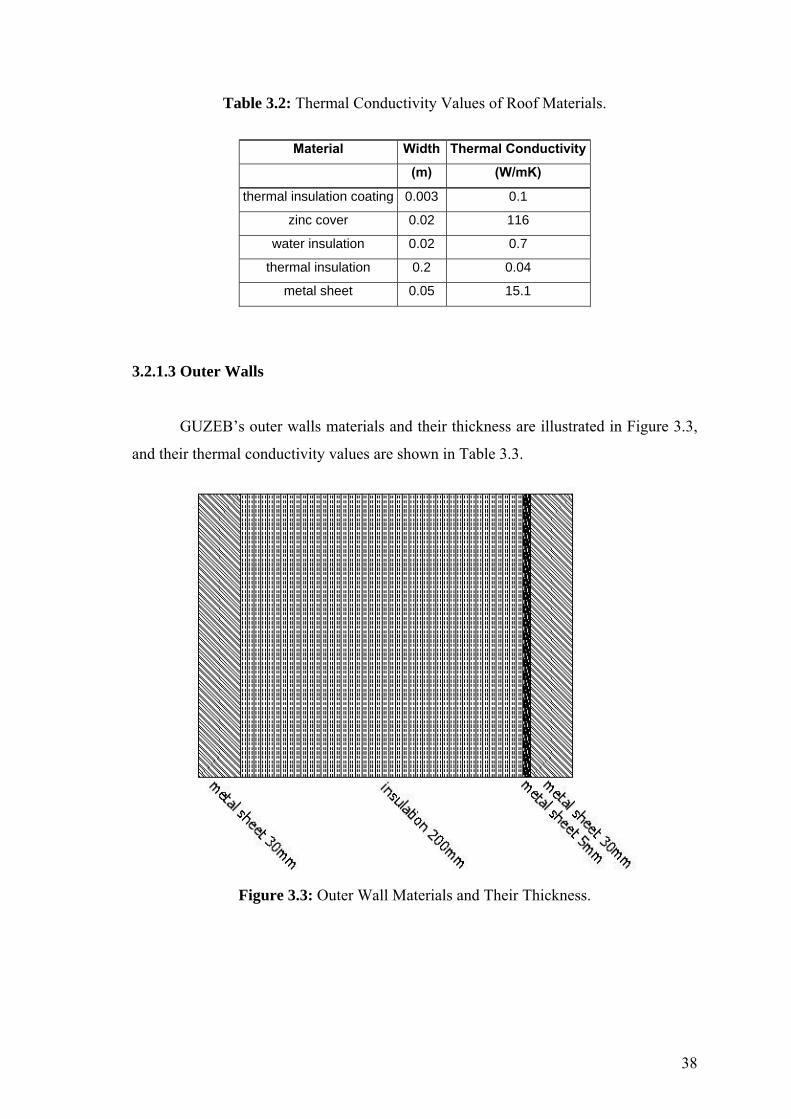
3.2.1.3 Outer Walls
GUZEB’s outer walls materials and their thickness are illustrated in Figure 3.3,
and their thermal conductivity values are shown in Table 3.3.
Figure 3.3: Outer Wall Materials and Their Thickness.
39
Table 3.3: Thermal Conductivity Values of Outer Walls Materials.
Material Width Thermal Conductivity
(m) (W/mK)
metal sheet 0.03 15.1
insulation 0.2 0.04
metal sheet 0.0005 15.1
metal sheet 0.03 15.1
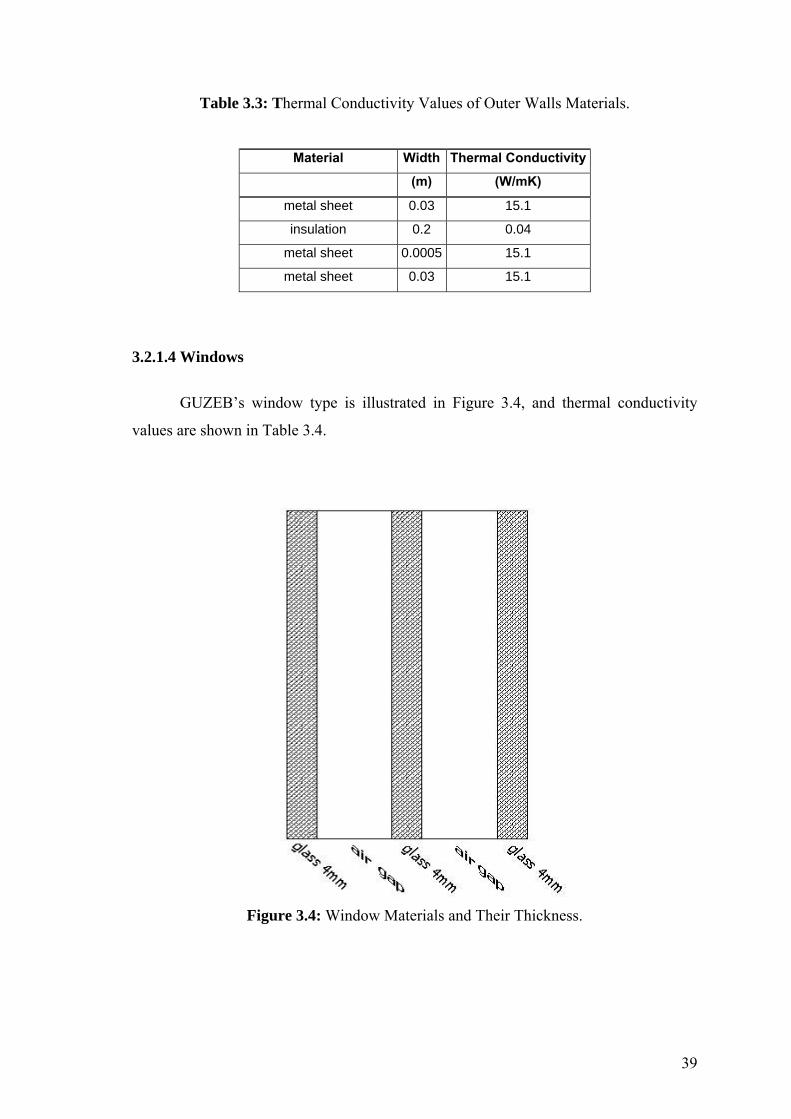
3.2.1.4 Windows
GUZEB’s window type is illustrated in Figure 3.4, and thermal conductivity
values are shown in Table 3.4.
Figure 3.4: Window Materials and Their Thickness.

40
Table 3.4: Thermal Conductivity Values of Windows Materials
Material Width Thermal Conductivity
(m) (W/mK)
glass 0.04 5.23
3.2.1.5 Silica Wall
GUZEB’s outer wall of silica aerogel is illustrated in Figure 3.5, and its thermal
conductivity value is taken as 0.51 W/m2K [22].
Figure 3.5: Silica Wall Materials and Their Thickness.
41
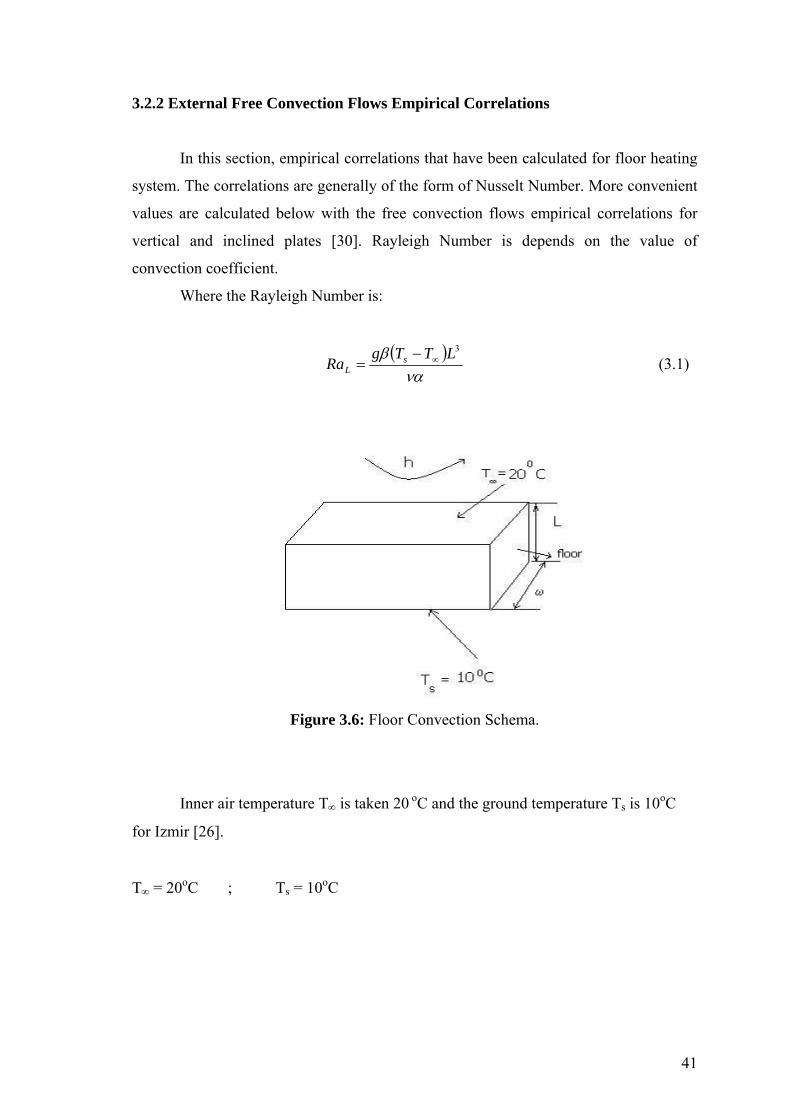
3.2.2 External Free Convection Flows Empirical Correlations
In this section, empirical correlations that have been calculated for floor heating
system. The correlations are generally of the form of Nusselt Number. More convenient
values are calculated below with the free convection flows empirical correlations for
vertical and inclined plates [30]. Rayleigh Number is depends on the value of
convection coefficient.
Where the Rayleigh Number is:
3LTTgRa s
L
(3.1)
Figure 3.6: Floor Convection Schema.
Inner air temperature T is taken 20 oC and the ground temperature Ts is 10oC
for Izmir [26].
T = 20oC ; Ts = 10oC
42
Air properties at 20oC are;
= 15.445·10-6 m2/s
= 21.81·10-6 m2/s
= 0.003389 K-1
k = 25.9·10-3 W/mK
Pr = 0.7083
Then Rayleigh Number from Equation 4.1 for horizontal plates is:
86-6-
3
10522.51081.2110445.15
)824.0(1020003389.081.9
LRa
and Nusselt Number for horizontal plates is:
3/115.0 LL RauN if 107 LRa 1011 (3.2)
and Nusselt Number from Equation 3.2 is:
3/18 )1022.5(15.0 LuN = 123.06
The convection coefficient associated with the sides is then
LuNL
kh (3.3)
For the top and the bottom, L = AS/P /2 if 1 m. is taken,
06.1235.0
109.25 3
h =6.375 W/m2K

43
For vertical plates;
Figure 3.7: Wall Convection Schema.
From Equation 3.1 where L is approximately 2.5m:
106-6-
3
10084.31081.2110445.15
)5.2(020003389.081.9
LRa
if 109 LRa then;
2
27/816/9
6/1
Pr)/492.0(1
387.0825.0
L
L
RauN (3.4)
5974.360)7083.0/492.0(1
)10084.3(387.0825.0
2
27/816/9
6/110
LuN
then ;
L
kuNh L (3.5)

44
838.275.2
193.05974.360 h
3.2.3 Heating Load Summary
In conclusion total heat losses of each space of the GUZEB’s are given in
Table 3.5.
Table 3.5: Total Heat Losses of Each Space of GUZEB’s.
LIBRARY
AREA ∆T Thermal Conductivity Q
(m2) (W/mK) (W) FLOOR 125.6 10 0.419 526.26 ROOF 140 20 0.192 537.60 WINDOW 12.18 20 0.273 66.51 SILICA WALL 25 20 0.51 255 OUTER WALL 26.9 20 0.197 105.98 BACKWALL 14.62 20 0.197 57.61 FRONT WALL 68.4 20 0.197 269.50
QLibrary (W)= 1 818.45
ENTRANCE AREA ∆T Thermal Conductivity Q
(m2) (W/mK) (W)
FLOOR 87.4 8 0.419 292.97 ROOF 93 18 0.192 321.41 WINDOW 84.5 18 0.273 415.23 DOOR 3.9 18 0.273 19.16 OUTER WALL 15.9 18 0.197 56.38
Qentrance (W)= 1 105.15
OFFICE 1 AREA ∆T Thermal Conductivity Q
(m2) (W/mK) (W)
FLOOR 16.8 10 0.419 70.39 ROOF 17.5 20 0.192 67.20 WINDOW 3.85 20 0.273 21.02 OUTER WALL 4.62 20 0.197 18.20
Qoffice1 (W)= 176.82
OFFICE 2 AREA ∆T Thermal Conductivity Q
(m2) (W/mK) (W)
FLOOR 9 10 0.419 37.71 ROOF 9.5 20 0.192 36.48 WINDOW 0.9 20 0.273 4.91 OUTER WALL 11 20 0.197 43.34
Qoffice2 (W)=
122.44
45
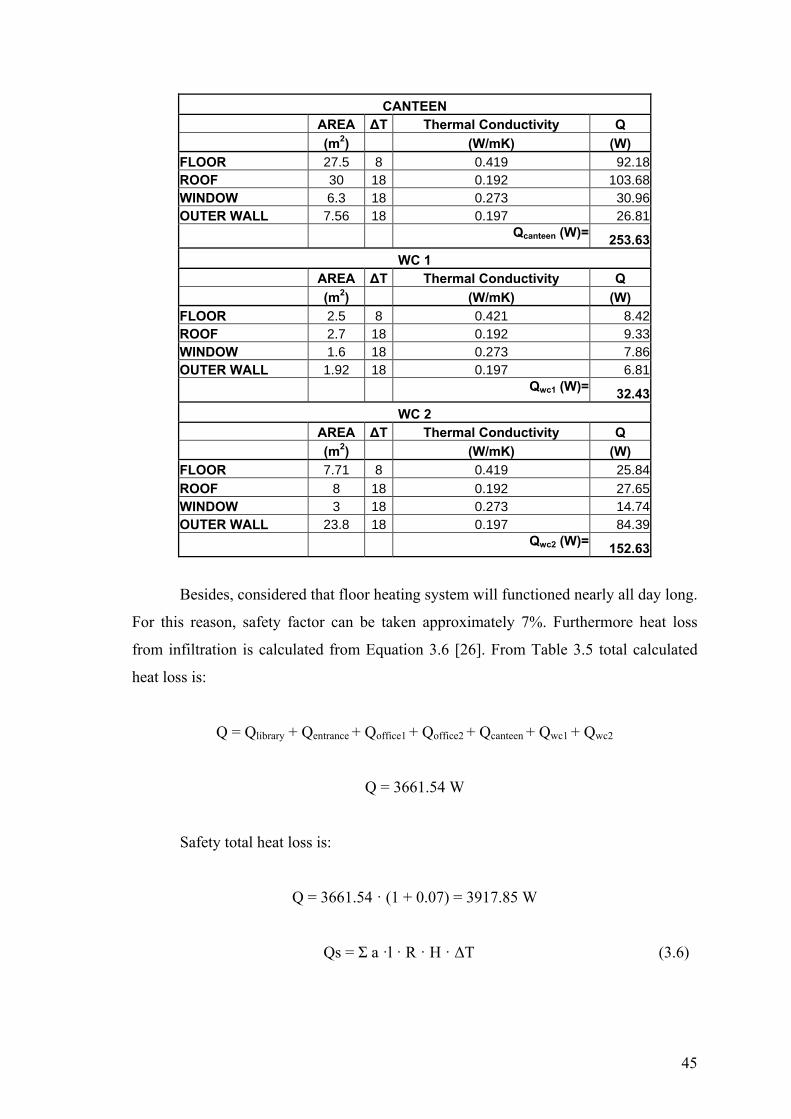
CANTEEN AREA ∆T Thermal Conductivity Q
(m2) (W/mK) (W)
FLOOR 27.5 8 0.419 92.18 ROOF 30 18 0.192 103.68 WINDOW 6.3 18 0.273 30.96 OUTER WALL 7.56 18 0.197 26.81
Qcanteen (W)=
253.63
WC 1 AREA ∆T Thermal Conductivity Q
(m2) (W/mK) (W)
FLOOR 2.5 8 0.421 8.42 ROOF 2.7 18 0.192 9.33 WINDOW 1.6 18 0.273 7.86 OUTER WALL 1.92 18 0.197 6.81
Qwc1 (W)=
32.43
WC 2 AREA ∆T Thermal Conductivity Q
(m2) (W/mK) (W)
FLOOR 7.71 8 0.419 25.84
ROOF 8 18 0.192 27.65 WINDOW 3 18 0.273 14.74 OUTER WALL 23.8 18 0.197 84.39
Qwc2 (W)=
152.63
Besides, considered that floor heating system will functioned nearly all day long.
For this reason, safety factor can be taken approximately 7%. Furthermore heat loss
from infiltration is calculated from Equation 3.6 [26]. From Table 3.5 total calculated
heat loss is:
Q = Qlibrary + Qentrance + Qoffice1 + Qoffice2 + Qcanteen + Qwc1 + Qwc2
Q = 3661.54 W
Safety total heat loss is:
Q = 3661.54 · (1 + 0.07) = 3917.85 W
Qs = Σ a ·l · R · H · ΔT (3.6)

46
where;
a: heat loss coefficient (m3/mh)
l: window or door collapsible length (m)
R: room localization coefficient
H: building localization coefficient (W/m3 oC)
ΔT: temperature difference (K)
Then total heat loss of the building is:
Qtotal = 4256.65 W
3.3 Cooling Load Calculations
3.3.1 Space Specifications
Cooling load is based on the space properties, which include the examination of
window types, areas and directions, or other factors that contain the load of equipment
or human load factors. These specifications are thought as a scenario if a symposium is
organized in GUZEB in summer and specifications are stated in Table 3.6 for each
space of the building. This kind of scenario is constituted for peak load values whether
the system that will be installed can cover up the cooling load or not. Number of people
and equipment loads are designated on a special day, symposium, which constitutes
maximum peak cooling load. If the system can cover up the load on that kind of special
days, it can easily come over the usual days, which has no special load values.
47
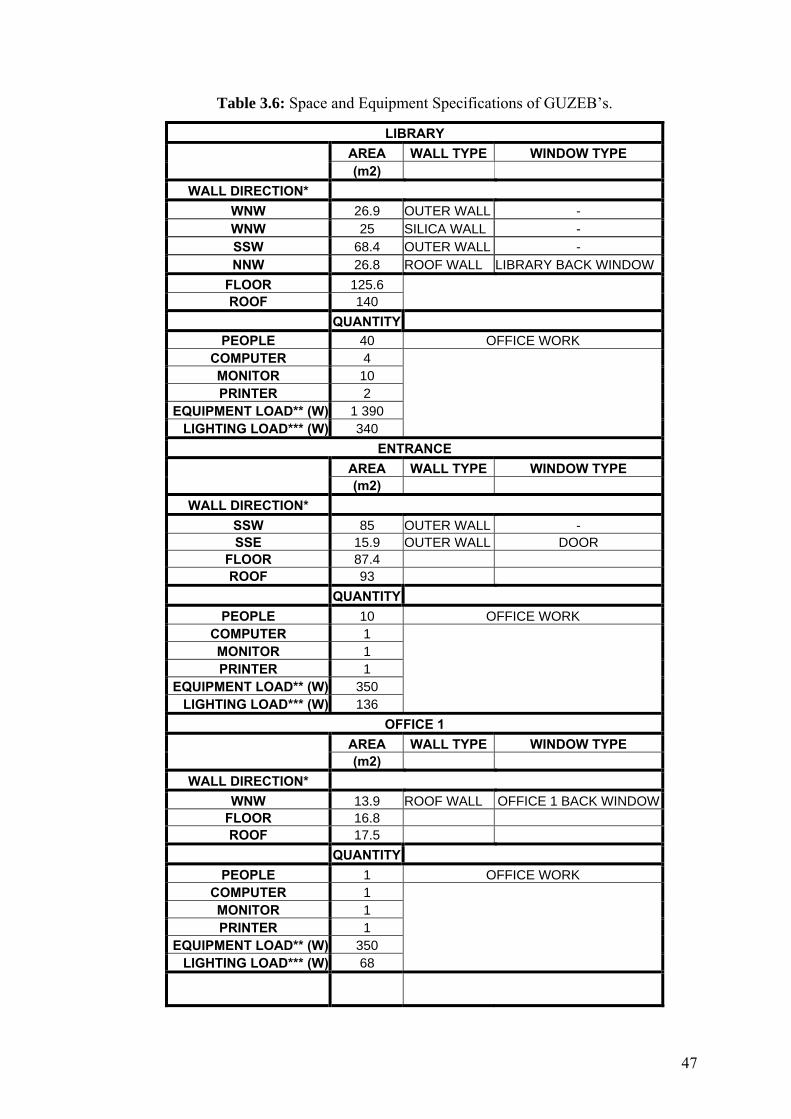
Table 3.6: Space and Equipment Specifications of GUZEB’s.
LIBRARY
AREA WALL TYPE WINDOW TYPE (m2)
WALL DIRECTION*
WNW 26.9 OUTER WALL - WNW 25 SILICA WALL - SSW 68.4 OUTER WALL - NNW 26.8 ROOF WALL LIBRARY BACK WINDOW
FLOOR 125.6 ROOF 140
QUANTITY
PEOPLE 40 OFFICE WORK COMPUTER 4 MONITOR 10 PRINTER 2
EQUIPMENT LOAD** (W) 1 390 LIGHTING LOAD*** (W) 340
ENTRANCE
AREA WALL TYPE WINDOW TYPE (m2)
WALL DIRECTION*
SSW 85 OUTER WALL - SSE 15.9 OUTER WALL DOOR
FLOOR 87.4 ROOF 93
QUANTITY
PEOPLE 10 OFFICE WORK COMPUTER 1 MONITOR 1 PRINTER 1
EQUIPMENT LOAD** (W) 350 LIGHTING LOAD*** (W) 136
OFFICE 1
AREA WALL TYPE WINDOW TYPE (m2)
WALL DIRECTION*
WNW 13.9 ROOF WALL OFFICE 1 BACK WINDOWFLOOR 16.8 ROOF 17.5
QUANTITY
PEOPLE 1 OFFICE WORK COMPUTER 1 MONITOR 1 PRINTER 1
EQUIPMENT LOAD** (W) 350 LIGHTING LOAD*** (W) 68

48
OFFICE 2
AREA WALL TYPE WINDOW TYPE (m2)
WALL DIRECTION*
SE 11.9 OUTER WALL OFFICE 2 WINDOW FLOOR 9
QUANTITY
PEOPLE 1 OFFICE WORK COMPUTER 1 MONITOR 1 PRINTER 1
EQUIPMENT LOAD** (W) 350 LIGHTING LOAD*** (W) 34
* N:NORTH, E:EAST, S:SOUTH, W:WEST ** MEDIUM LOAD DENSITY, ASHRAE 29.13 TABLE 12 *** WITH ENERGY SAVING LAMPS; LIGHTING LOAD: 2.7 W/m2 for library, 1.55 W/m2 for entrance, 4 W/m2 for others.
3.3.2 Cooling Load Calculation Without Hourly Changing Load Distribution
3.3.2.1 General Information
Cooling load calculation determines total sensible cooling load due to heat gain
through structural component for instance, walls, floors, ceilings, and windows.
Equation 3.7 is the main formula for calculating the sensible cooling load using cooling
load temperature differences, (CLTD) m [27].
Qs = Fc · k · A · (CLTD) m (3.7)
In Equation 3.7, Fc is the storage capacity of the space and calculated from
Equation 3.8 and 3.9.
Fc = 1-0.0116 KT (3.8)
KT = fL
1(kA) (3.9)
Other cooling load is related with the window-shading factor. Cooling load from
the types of the windows is calculated generally with Equation 3.10.
49
Qws = Fc · Aws · Sc · SHGF · CLF (3.10)
And cooling load from people, lighting and other equipments, which are used in the
spaces are calculated with the equations from 3.11 to 3.13.
Qlight = N · CLF · Fc (3.11)
Qpeople = S · SHG · CLF · Fc + S · LHG (3.12)
Qeq = Ps · CLF · Fc + Pl (3.13)
where;
Sc: shading factor
SHGF: heat gain factor, [W/m2]
CLF: load factor
N: wattage of lighting equipment
S: number of people
SHG: sensible heat gain factor, [W]
LHG: latent heat gain factor, [W]
Ps: sensible load, [W][31]
Pl: latent load, [W][31]
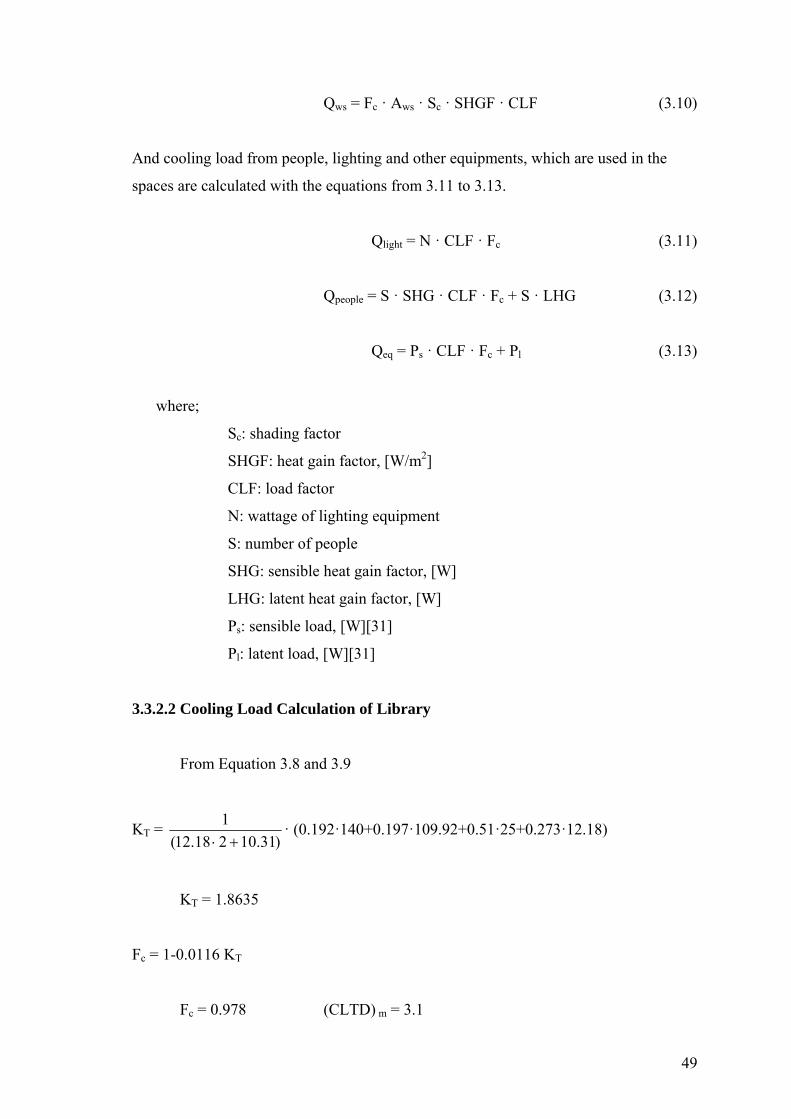
3.3.2.2 Cooling Load Calculation of Library
From Equation 3.8 and 3.9
KT = )31.10218.12(
1
· (0.192·140+0.197·109.92+0.51·25+0.273·12.18)
KT = 1.8635
Fc = 1-0.0116 KT
Fc = 0.978 (CLTD) m = 3.1
50
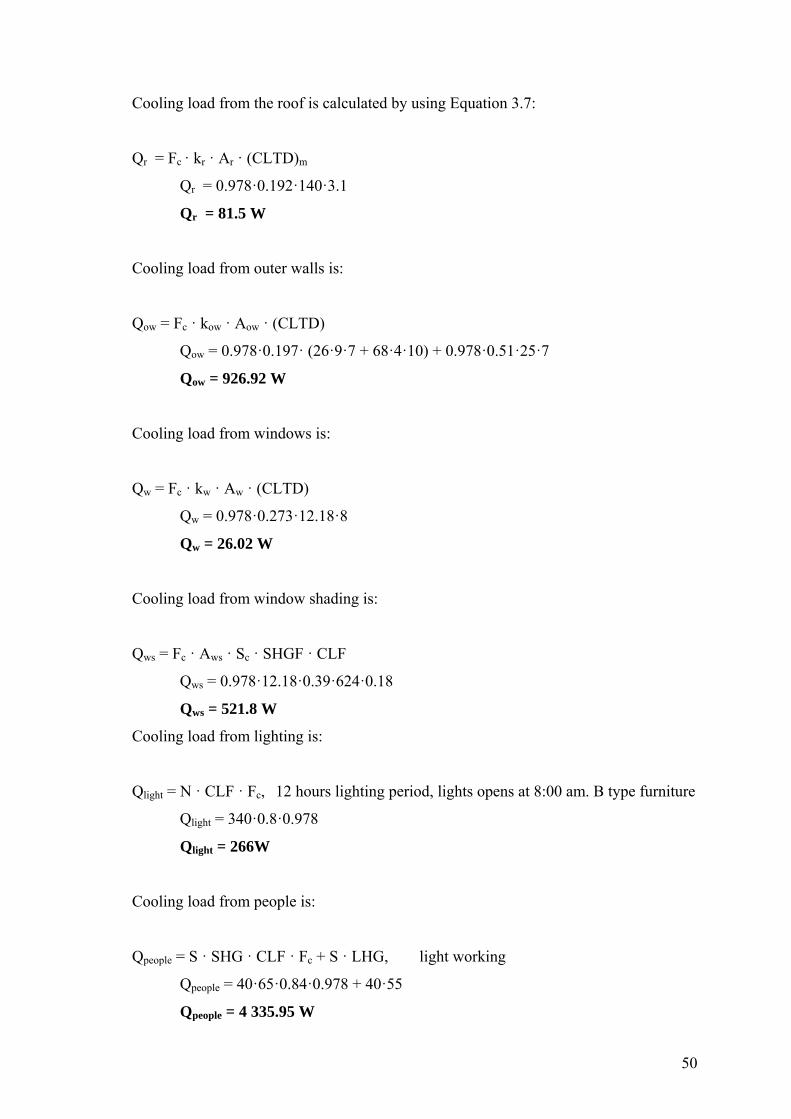
Cooling load from the roof is calculated by using Equation 3.7:
Qr = Fc · kr · Ar · (CLTD)m
Qr = 0.978·0.192·140·3.1
Qr = 81.5 W
Cooling load from outer walls is:
Qow = Fc · kow · Aow · (CLTD)
Qow = 0.978·0.197· (26·9·7 + 68·4·10) + 0.978·0.51·25·7
Qow = 926.92 W
Cooling load from windows is:
Qw = Fc · kw · Aw · (CLTD)
Qw = 0.978·0.273·12.18·8
Qw = 26.02 W
Cooling load from window shading is:
Qws = Fc · Aws · Sc · SHGF · CLF
Qws = 0.978·12.18·0.39·624·0.18
Qws = 521.8 W
Cooling load from lighting is:
Qlight = N · CLF · Fc, 12 hours lighting period, lights opens at 8:00 am. B type furniture
Qlight = 340·0.8·0.978
Qlight = 266W
Cooling load from people is:
Qpeople = S · SHG · CLF · Fc + S · LHG, light working
Qpeople = 40·65·0.84·0.978 + 40·55
Qpeople = 4 335.95 W
51
Cooling load from equipments is:
Qeq = Ps · CLF · Fc + Pl
Qeq = 1390·0.78·0.978
Qeq = 1 060.34 W
Q LIBRARY = 7 218.5 W
3.3.2.3 Cooling Load Other Spaces
As indicated in Chapter 3.3.1.2, same calculations are made for the other spaces
located in GUZEB, entrance, and offices.
QENTRANCE = 10 902.8 W
QOFFICE 1 = 1 208.72 W
QOFFICE 2 = 486.47 W
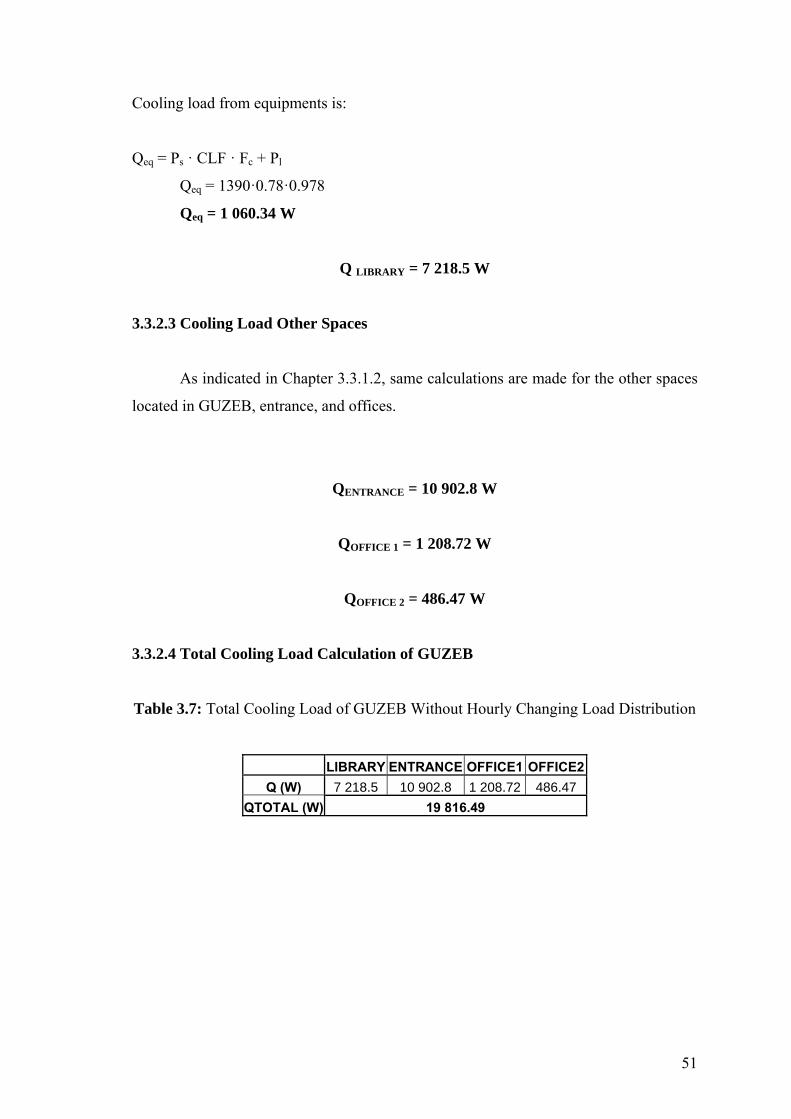
3.3.2.4 Total Cooling Load Calculation of GUZEB
Table 3.7: Total Cooling Load of GUZEB Without Hourly Changing Load Distribution
LIBRARY ENTRANCE OFFICE1 OFFICE2
Q (W) 7 218.5 10 902.8 1 208.72 486.47
QTOTAL (W) 19 816.49

52
3.3.3 Cooling Load Calculation With Hourly Changing Load Distribution
3.3.3.1 Schedule Data
In this section, cooling load calculations are calculated by load distribution.
These distributions include lighting or equipment and people daily load distribution.
The load of these distributions designates daily load distributions. Distribution values
describe the percentage of the loads in a day. These values are different in special days
compared with the usual day loads. Schedule data is shown in Table 3.8.
Table 3.8: Schedule Data.
SCHEDULE DATA
Schedule Name: lighting library
Hour 0 1 2 3 4 5 6 7 8 9 10 11 12 13 14 15 16 17 18 19 20 21 22 23Design Day 0 0 0 0 0 0 0 0 100 100 100 100 100 100 100 100 100 100 100 100 20 0 0 0Week Day 0 0 0 0 0 0 0 0 50 100 100 100 100 100 100 100 100 100 50 0 0 0 0 0
Schedule Name: lighting entrance
Hour 0 1 2 3 4 5 6 7 8 9 10 11 12 13 14 15 16 17 18 19 20 21 22 23Design Day 0 0 0 0 0 0 0 0 100 100 100 100 100 100 100 100 100 100 100 100 20 0 0 0Week Day 0 0 0 0 0 0 0 0 50 50 0 0 0 0 0 0 50 50 50 0 0 0 0 0
Schedule Name: lighting office1
Hour 0 1 2 3 4 5 6 7 8 9 10 11 12 13 14 15 16 17 18 19 20 21 22 23Design Day 0 0 0 0 0 0 0 0 50 100 100 100 100 100 100 100 100 100 100 50 0 0 0 0Week Day 0 0 0 0 0 0 0 0 50 100 100 100 100 50 100 100 100 100 50 0 0 0 0 0
Schedule Name: lighting office2
Hour 0 1 2 3 4 5 6 7 8 9 10 11 12 13 14 15 16 17 18 19 20 21 22 23Design Day 0 0 0 0 0 0 0 0 50 100 100 100 100 100 100 100 100 100 100 50 0 0 0 0Week Day 0 0 0 0 0 0 0 0 50 100 100 100 100 50 100 100 100 100 50 0 0 0 0 0
Schedule Name: lighting toilets
Hour 0 1 2 3 4 5 6 7 8 9 10 11 12 13 14 15 16 17 18 19 20 21 22 23Design Day 0 0 0 0 0 0 0 0 50 100 100 100 100 100 100 100 100 100 100 50 0 0 0 0Week Day 0 0 0 0 0 0 0 0 50 50 50 50 50 100 50 50 50 50 50 0 0 0 0 0
Schedule Name: people library
Hour 0 1 2 3 4 5 6 7 8 9 10 11 12 13 14 15 16 17 18 19 20 21 22 23Design Day 0 0 0 0 0 0 0 0 50 100 100 100 100 100 100 100 100 100 100 50 0 0 0 0Week Day 0 0 0 0 0 0 0 0 25 25 50 50 50 25 50 50 50 25 25 0 0 0 0 0

53
Schedule Name: people entrance
Hour 0 1 2 3 4 5 6 7 8 9 10 11 12 13 14 15 16 17 18 19 20 21 22 23Design Day 0 0 0 0 0 0 0 0 50 100 100 100 100 100 100 100 100 100 100 50 0 0 0 0Week Day 0 0 0 0 0 0 0 0 25 25 25 25 25 25 25 25 25 25 25 0 0 0 0 0
Schedule Name: people office1
Hour 0 1 2 3 4 5 6 7 8 9 10 11 12 13 14 15 16 17 18 19 20 21 22 23Design Day 0 0 0 0 0 0 0 0 50 100 100 100 100 100 100 100 100 100 50 0 0 0 0 0Week Day 0 0 0 0 0 0 0 0 50 100 100 100 100 25 100 100 100 50 50 0 0 0 0 0
Schedule Name: people office2
Hour 0 1 2 3 4 5 6 7 8 9 10 11 12 13 14 15 16 17 18 19 20 21 22 23Design Day 0 0 0 0 0 0 0 0 50 100 100 100 100 100 100 100 100 100 50 0 0 0 0 0Week Day 0 0 0 0 0 0 0 0 50 100 100 100 100 25 100 100 100 50 50 0 0 0 0 0
Schedule Name: equipment library
Hour 0 1 2 3 4 5 6 7 8 9 10 11 12 13 14 15 16 17 18 19 20 21 22 23Design Day 0 0 0 0 0 0 0 0 100 100 100 100 100 100 100 100 100 100 100 100 20 0 0 0Week Day 0 0 0 0 0 0 0 0 25 50 50 50 50 25 50 50 50 50 25 0 0 0 0 0
Schedule Name: equipment entrance
Hour 0 1 2 3 4 5 6 7 8 9 10 11 12 13 14 15 16 17 18 19 20 21 22 23Design Day 0 0 0 0 0 0 0 0 100 100 100 100 100 100 100 100 100 100 100 100 20 0 0 0Week Day 0 0 0 0 0 0 0 0 0 0 10 10 10 0 10 10 10 10 10 0 0 0 0 0
Schedule Name: equipment office1
Hour 0 1 2 3 4 5 6 7 8 9 10 11 12 13 14 15 16 17 18 19 20 21 22 23Design Day 0 0 0 0 0 0 0 0 50 100 100 100 100 100 100 100 100 100 100 50 0 0 0 0Week Day 0 0 0 0 0 0 0 0 50 100 100 100 100 50 100 100 100 100 50 0 0 0 0 0
Schedule Name: equipment office2
Hour 0 1 2 3 4 5 6 7 8 9 10 11 12 13 14 15 16 17 18 19 20 21 22 23Design Day 0 0 0 0 0 0 0 0 50 100 100 100 100 100 100 100 100 100 100 50 0 0 0 0Week Day 0 0 0 0 0 0 0 0 50 100 100 100 100 50 100 100 100 100 50 0 0 0 0 0
3.3.3.2 Total Cooling Load
The cooling peak load is found in July and the distribution of the total cooling
load of GUZEB is shown in Table 3.9.
Table 3.9: Cooling Load Data in July.
Total Cooling Load in July
Hour 0 12 34 56 7 8 9 10 11 12 13 14 15 16 17 18 19 20 21 2223
Cooling Load (kW) 0 00 00 00 09.61212.713.313.713.914.414.614.914.9 14.5 11.9 0 0 0 0
54
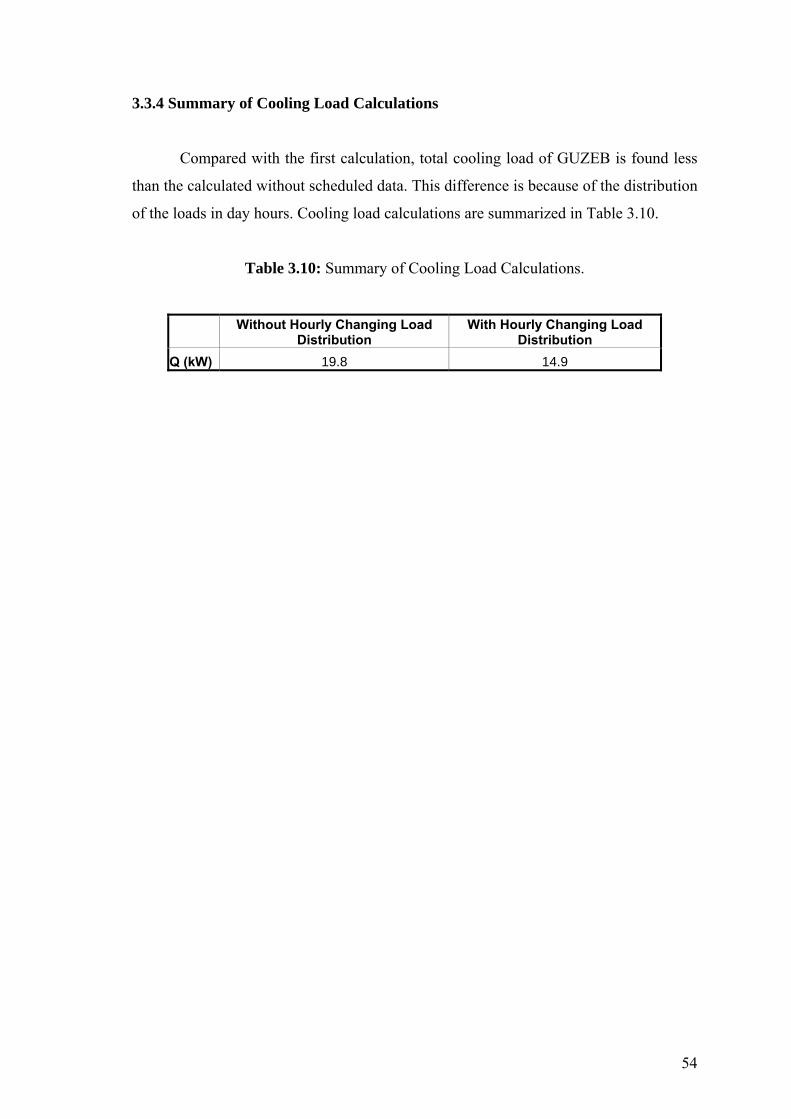
3.3.4 Summary of Cooling Load Calculations
Compared with the first calculation, total cooling load of GUZEB is found less
than the calculated without scheduled data. This difference is because of the distribution
of the loads in day hours. Cooling load calculations are summarized in Table 3.10.
Table 3.10: Summary of Cooling Load Calculations.
Without Hourly Changing Load
Distribution With Hourly Changing Load
Distribution
Q (kW) 19.8 14.9
55
Chapter 4
DESIGN OF HEATING SYSTEM OF GUZEB
4.1 General Information About Floor Heating Systems
Radiant floor heating has been used for centuries. The Romans channeled hot air
under the floors of their villas. The Koreans channeled hot flue gases under their floors
before venting them up the chimney. Radiant floor heating system’s basic idea depends
on these ancient applications.
Radiant floor heating systems use a boiler to heat up hot water and a pump to
circulate the hot water in pipes, which is installed in a concrete slab in a closed loop.
The pipes, embedded in the floor, carry heated water that conducts warmth to the
surface of the floor where it broadcasts energy to the space. While conventional heating
systems rely on air circulation to distribute heat, radiant heating exploits the physical
properties of warm air, which rises, to provide comfortable in houses and even garages.
It’s the same principle as solar heating, which warms people and objects directly.
Installed beneath a home’s flooring, it radiates heat upward and outward, spreading
warmth and comfort with greater efficiency throughout any room in which it is
installed.
Radiant heating systems are also used in ice and snow melt systems for
walkways and streets.
4.1.1 Advantages of Floor Heating Systems
Listed here are some of the benefits of the radiant floor heating system [32]:
Comfort – a radiant floor heating system "radiates" heat from the floor and
delivers the heat evenly throughout the rooms. The room heats from the bottom up,
warming the feet and body first.
Lower boiler temperature – Radiant floors operate between 85-140ºF (29-60ºC),
compared to other heating systems' range of 130-160ºF (54-71ºC).
Silent operation – No hum or whistle of a forced air systems.
Aesthetic- invisible vents or hear air blowing.

56
Energy savings – Evenly distributed heat from a radiant floor heating system can
allow the thermostat to be set 2-4 oC less than in a forced air heating system. Radiant
floor heating proponents claim that fuel savings of 10% to 30% over forced air systems
are possible.
A healthier home – eliminates the draft and dust problems associated with
forced-air heating systems.
Quiet warmth – even with wood, tile, or uncovered concrete floors.
4.1.2 Components of a Radiant Floor Heating System
Many components are needed for radiant floor heating system. Heating source is
one of the main components. This can be electricity, solar, natural gas, propane, oil,
wood, or any other heating source. Boiler contains the water to be heated. Besides,
pumps are necessary to circulate the water through tubing located under the floor. In
addition, many radiant floor-heating projects are in slab-on-grade concrete. Tubing is
one of the other components that installed in the slab. Temperature-controlled water
then circulates though the tubing in the slabs. This process turns the slab into a radiant
panel. Concrete presents the greatest thermal mass of any of the radiant floor heating
methods, which can be a tremendous benefit in rooms or buildings with high ceilings.
Figure 4.1: Installation Method of Floor Heating System.
4.1.3 Types of Radiant Floor Heating
There are three types of radiant floor heat: radiant air floors (air is the heat
carrying medium); electric radiant floors; and hot water (hydronic) radiant floors.
Besides, hydronic (liquid) systems are the most popular and cost-effective systems for
57
heating-dominated climates. They have been in extensive use in Europe for decades.
Hydronic radiant floor systems pump heated water from a boiler through tubing
underneath the floor. A system of zoning valves or pumps and thermostats are done this
flow.
4.2 Design Criteria of Floor Heating System in GUZEB
Floor heating system is required to meet the heating load of GUZEB. As
indicated, an ancient cave is located near the GUZEB’s location. This cave has
approximately 32oC water source but the temperature will not be enough for floor
heating system operation temperature. Floor heating systems operate between 29-60ºC.
On the contrary, this source is continuous and limitless. With a simple circulation pump,
water will be pumped from the cave to the heating system of GUZEB. So, heating
requirement of GUZEB will be solved.
The main problem is the calculation of heat gain from the tubes that lay in the
concrete bottom block of the floor. The total heat flux calculation is calculated by using
a program, which is named as Fluent [33]. Fluent is used for different structures, which
are modeled by using a modeling program called Gambit.
By Gambit, floor is modeled by floor materials and thickness, which is
illustrated in Figure 4.2 and 4.3. In this model, all construction materials are given in its
real sizes with the area of 0.01 m2. In the other meaning, the values that are found will
be the values for 0.01 m2. In this model, the tubing is 1 inch in diameter and the flow
rate is taken 1 kg/s and 28oC, less than the real values that will be from the ancient cave.
Because, the real water temperature value, which is 32 oC, will reduce approximately to
28 oC when circulated in heat exchanger, and on the way from ancient cave to building.
If these values meet the required value for heating, other values can be definitely
enough for the heating requirement. The Fluent program printouts are given in
Appendix B.

58
Figure 4.2: Modeled floor by Gambit.
Figure 4.3: Meshed floor by Gambit.

59
4.3 Results of Floor Heating System in GUZEB
Table 4.1: Net Heat Transfer Rate per meter from Pipes.
From Bottom From Top Net Heat Transfer Rate (W/m) -0.738153 -2.62044
As calculated in Chapter 3.2.3, total heating load of GUZEB is
Qtotal = 4 256.65 W
If Qtotal is divided into net heat transfer rate from top, which means that the heat
transfer rate from pipes to the spaces, 1624.4 m pipe is required to heat the spaces to the
comfort temperature in winter.
Piping will be designed as illustrated in Figure 4.4 and details are given from
Figure 4.6 to Figure 4.9. Although there are different types of piping methods, this type
of piping is the best method for 1” pipes. From the calculations, 1624.4 m pipes for
276.5-m2 spaces can be placed approximately 15 cm intervals between pipes. This is the
best pipe placement for 1” pipe diameter [32].
The floor heating design project of GUZEB is illustrated in Figure 4.5.
Figure 4.5: Tubing Construction Style.

60
As illustrated in Figure 4.6 to 4.9, GUZEB’s floor heating system pipe design is
divided into 14 main parts. Each of these loops has approximately 110m pipe length.
Each collector, which distributes the warm water to the pipes, has 7 loops. Number of
these loops is chosen to protect the heat gain, temperature difference of the water from
inlet to outlet, from the pipes in long distances and to decrease the pump power, which
will be used to pump the warm water through the pipes. In other words, pump power
can be decreased by this method.
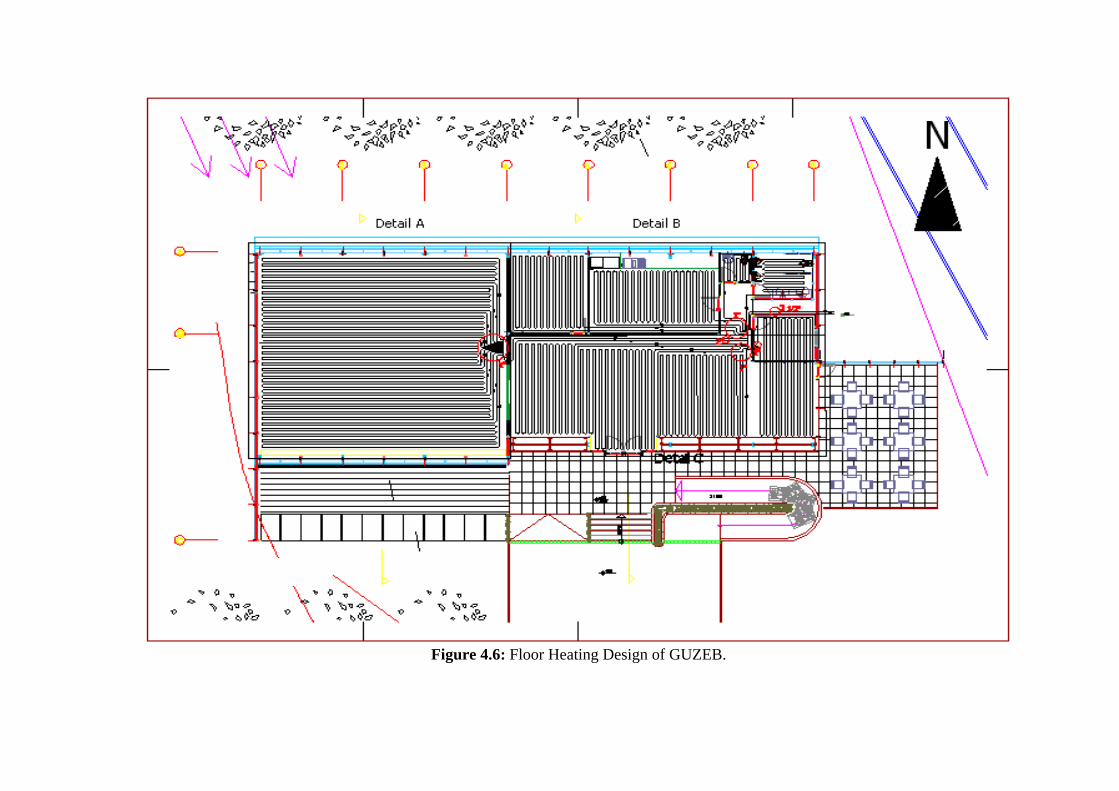
Figure 4.6: Floor Heating Design of GUZEB.

Figure 4.7: Floor Heating Design Detail A
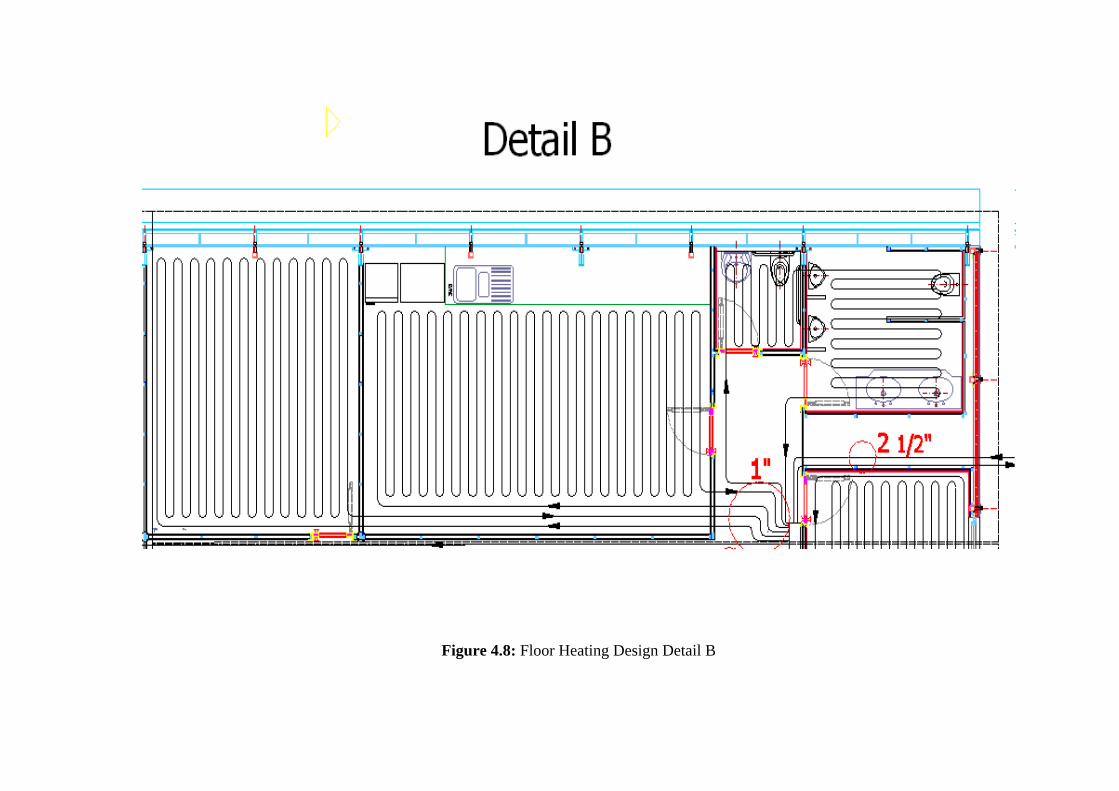
Figure 4.8: Floor Heating Design Detail B
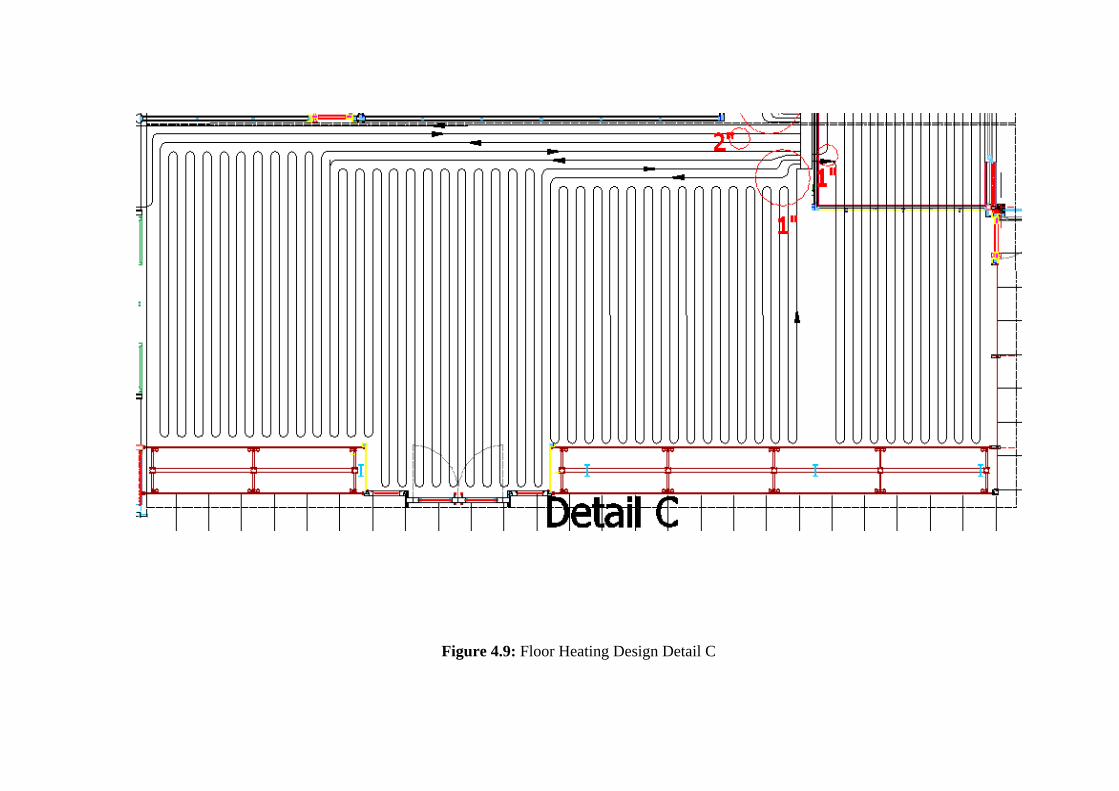
Figure 4.9: Floor Heating Design Detail C
65
Chapter 5
DESIGN OF VENTILATION SYSTEM OF GUZEB
5.1 General Information about Ventilation System in GUZEB
In both energy efficient buildings and zero energy houses, the main idea is to
save energy and to reduce the energy consumption. One of the energy saving methods is
natural ventilation and an effective ventilation design.
In GUZEB’s ventilation design, natural energy is the main ventilation strategy.
As known, the natural ventilation reduces energy consumption for fans and mechanical
cooling and in most cases gives occupants to control over the spaces. Further benefits
include no fan noise and in some cases elimination of the mechanical cooling system.
GUZEB’s special roof design especially in winter ensures the natural ventilation. As
mentioned this special roof design helps to direct the outdoor air inside of the building
with automatic controlled windows on the roof.
On the other hand, when ventilating a building using natural ventilation method,
another distinct design strategy for the summer must be considered. During winter only
small air flows are needed but there is the risk of cold air drafts. During the summer, the
main challenge is providing enough airflow to give effective cooling. GUZEB’s
ventilation design uses mechanical systems to provide cool air for occupants in summer.
But this system is used only for library and office ventilation systems in summer except
for the entrance. The cooling load of the entrance is calculated in Chapter 3, and with
hourly load distribution, as mentioned in Appendix A, total cooling load is
approximately 4kW. This means that, ventilation system may not be necessary for the
entrance. Because, the automatic controlled daylight sensible curtains, which cover the
surface of the glass in front of the entrance, and the natural ventilation inlets and outlets
can meet the cooling load of the entrance. In addition, in the special symposium days,
the load from the people will be in the library. Mechanical ventilation and air-
conditioning of buildings consume large amounts of energy in the world, especially in
developed countries, where buildings are responsible for one-third of all energy
consumption [34]. To reduce the energy consumption, mechanical system can be
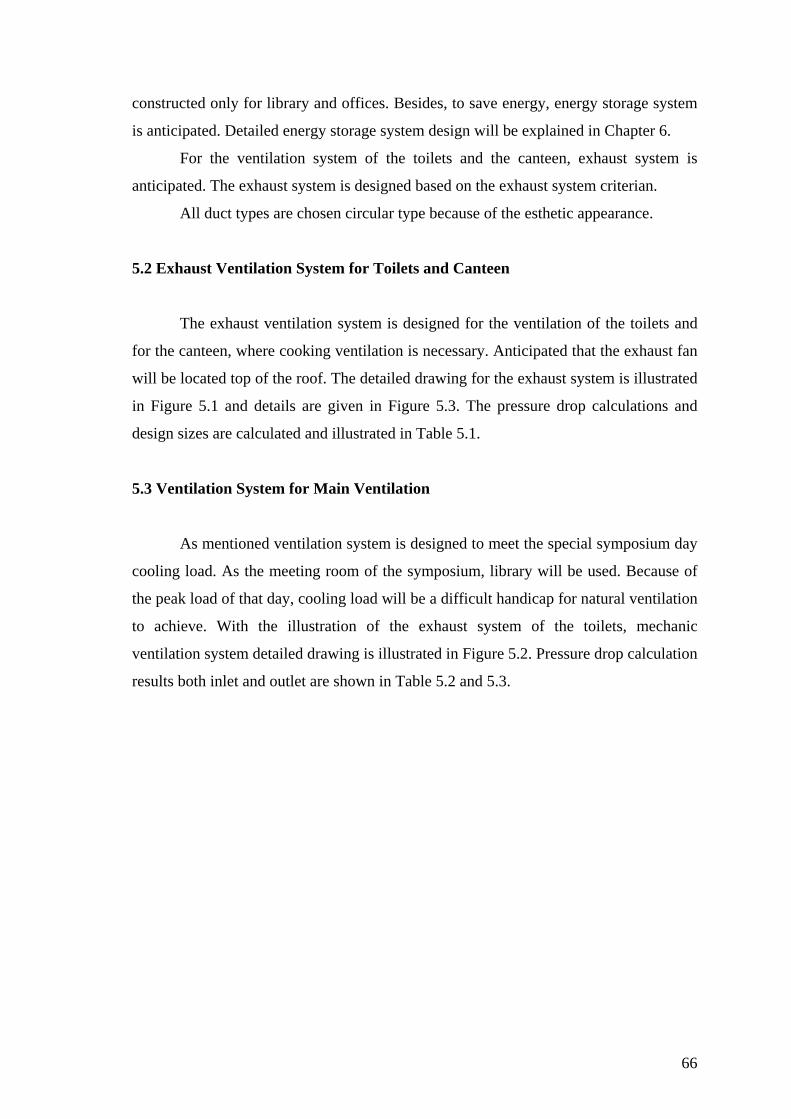
66
constructed only for library and offices. Besides, to save energy, energy storage system
is anticipated. Detailed energy storage system design will be explained in Chapter 6.
For the ventilation system of the toilets and the canteen, exhaust system is
anticipated. The exhaust system is designed based on the exhaust system criterian.
All duct types are chosen circular type because of the esthetic appearance.
5.2 Exhaust Ventilation System for Toilets and Canteen
The exhaust ventilation system is designed for the ventilation of the toilets and
for the canteen, where cooking ventilation is necessary. Anticipated that the exhaust fan
will be located top of the roof. The detailed drawing for the exhaust system is illustrated
in Figure 5.1 and details are given in Figure 5.3. The pressure drop calculations and
design sizes are calculated and illustrated in Table 5.1.
5.3 Ventilation System for Main Ventilation
As mentioned ventilation system is designed to meet the special symposium day
cooling load. As the meeting room of the symposium, library will be used. Because of
the peak load of that day, cooling load will be a difficult handicap for natural ventilation
to achieve. With the illustration of the exhaust system of the toilets, mechanic
ventilation system detailed drawing is illustrated in Figure 5.2. Pressure drop calculation
results both inlet and outlet are shown in Table 5.2 and 5.3.

Table 5.1: Fan Sizes and Pressure Drop Tables of Toilet Exhaust Duct Design.
Q Duct Velocity Friction Loss Length Friction Loss Pdyn n Pressure Drop Total Loss m3/h Diameter(mm) m/s mmH2O/m m mmH2O mmH2O mmH2O mmH2O
1 200 130 4.4 0.22 2.75 0.61 1.18 0.34 0.40 1.01 2 300 150 4.7 0.23 0.70 0.16 1.35 0.21 0.28 0.44 3 400 170 4.9 0.21 3.75 0.79 1.46 1.25 1.83 2.62 4 500 190 5 0.02 4.00 0.08 1.53 1.09 1.66 1.74
5.81
Quantity Circular Type Loss Coefficient (n)
1 1 Damper D/Do=1Q=0 CD9-1 0.19
1 ElbowD=130 CD3-1 0.15
0.34
2 1 Tee Qb/Qc=0,3 As/Ac=0,9 Ab/Ac=0,7 0.21
0.21
3 1 ElbowD=100 CD3-1 0.21
1 ElbowD=170 CD3-1 0.13
1 Tee Qb/Qc=0,3 As/Ac=0,7 Ab/Ac=0,3 0.91
1.25
4 1 Tee Qb/Qc=0,2 As/Ac=0,8 Ab/Ac=0,2 0.76
3 ElbowD=190 CD3-1 0.33
1 Transition Q=45 Ao/A1=1 0
1 FanOutletAb/Ao=1 L/Le=1 0
1.09

Table 5.2: Fan Sizes and Pressure Drop Tables of Library Main Inlet Duct Design.
Q Duct Velocity Friction Loss Length Friction Loss Pdyn n Pressure Drop Total Loss m3/h Diameter(mm) m/s mmH2O/m m mmH2O mmH2O mmH2O mmH2O
1 750 240 4.8 0.130 1.75 0.23 1.41 0.30 0.42 0.65 2 1500 330 5 0.090 3.50 0.32 1.53 1.72 2.62 2.94 3 2250 400 5 0.075 5.25 0.39 1.53 0.31 0.47 0.87 4 3000 460 5 0.065 7.00 0.46 1.53 0.63 0.96 1.42 5 3750 500 5.2 0.065 6.25 0.41 1.65 1.89 3.12 3.52 6 7500 700 5.2 0.042 3.75 0.16 1.65 1.61 2.66 2.81 7 8150 720 5.3 0.042 10.80 0.45 1.71 1.75 3.00 3.45 8 8700 750 5.3 0.040 1.50 0.06 1.71 1.79 3.07 3.13
18.79
Quantity Circular Type Loss Coefficient (n)1 1 Damper D/Do=1 Q=0 CD9-1 0.19
1 Elbow D=240 CR3-1 0.11 0.3
2 1 Tee As/Ac=0,7 Ab/Ac=0,7 Qb/Qc=0,5 ED5-3 1.72 1.72
3 1 Tee As/Ac=0,8 Ab/Ac=0,6 Qb/Qc=0,3 ED5-3 0.31 0.31
4 1 Tee As/Ac=0,9 Ab/Ac=0,5 Qb/Qc=0,3 ED5-3 0.63 0.63
5 1 Tee As/Ac=0,9 Ab/Ac=0,5 Qb/Qc=0,2 ED5-3 1.74 3 Elbow D=500 CR3-10 0.15 1.89
6 1 Wye Ab1/Ac=0,7 Ab2/Ac=0,7 Qb1/Qc=0,5 ED5-9 1.61 1.61
7 1 Tee As/Ac=0,9 Ab/Ac=0,2 Qb/Qc=0,1 ED5-3 1.67 2 Elbow D=720 CR3-10 0.08 1.75
8 1 Tee As/Ac=0,9 Ab/Ac=0,2 Qb/Qc=0,1 ED5-3 1.67 3 Elbow D=750 CR3-10 0.12 1.79
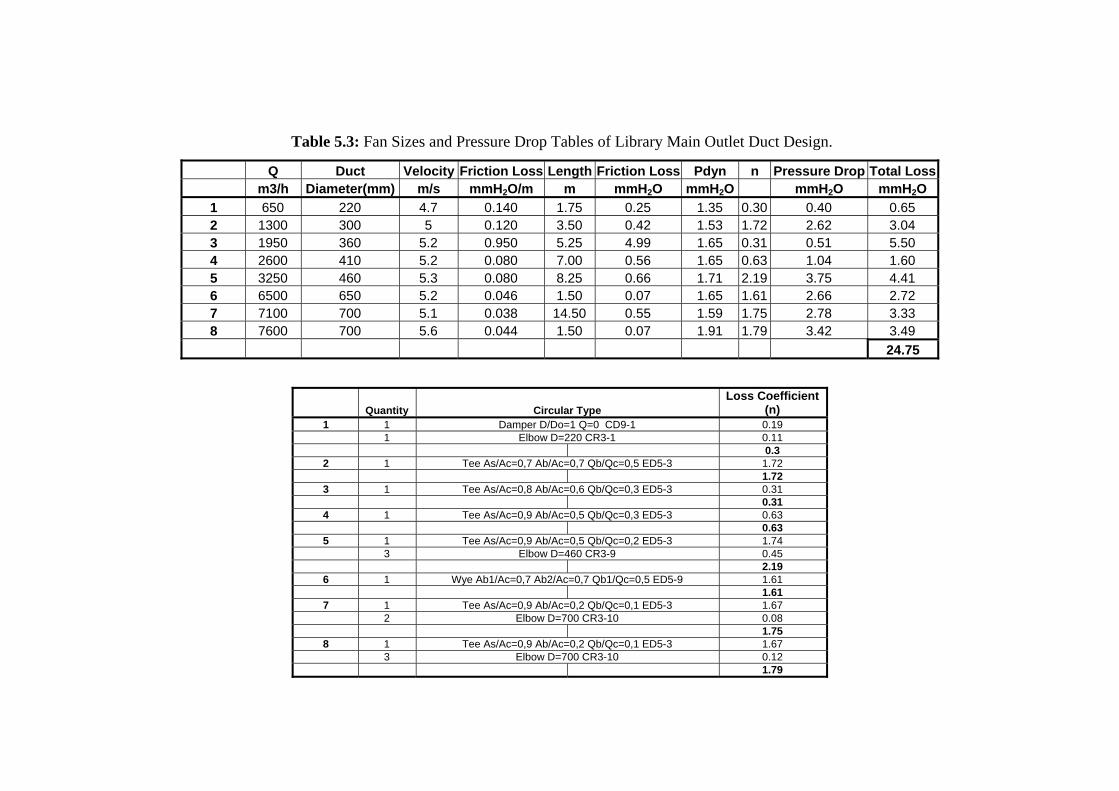
Table 5.3: Fan Sizes and Pressure Drop Tables of Library Main Outlet Duct Design.
Q Duct Velocity Friction Loss Length Friction Loss Pdyn n Pressure Drop Total Loss m3/h Diameter(mm) m/s mmH2O/m m mmH2O mmH2O mmH2O mmH2O
1 650 220 4.7 0.140 1.75 0.25 1.35 0.30 0.40 0.65 2 1300 300 5 0.120 3.50 0.42 1.53 1.72 2.62 3.04 3 1950 360 5.2 0.950 5.25 4.99 1.65 0.31 0.51 5.50 4 2600 410 5.2 0.080 7.00 0.56 1.65 0.63 1.04 1.60 5 3250 460 5.3 0.080 8.25 0.66 1.71 2.19 3.75 4.41 6 6500 650 5.2 0.046 1.50 0.07 1.65 1.61 2.66 2.72 7 7100 700 5.1 0.038 14.50 0.55 1.59 1.75 2.78 3.33 8 7600 700 5.6 0.044 1.50 0.07 1.91 1.79 3.42 3.49
24.75
Quantity Circular Type Loss Coefficient
(n) 1 1 Damper D/Do=1 Q=0 CD9-1 0.19 1 Elbow D=220 CR3-1 0.11 0.3 2 1 Tee As/Ac=0,7 Ab/Ac=0,7 Qb/Qc=0,5 ED5-3 1.72 1.72 3 1 Tee As/Ac=0,8 Ab/Ac=0,6 Qb/Qc=0,3 ED5-3 0.31 0.31 4 1 Tee As/Ac=0,9 Ab/Ac=0,5 Qb/Qc=0,3 ED5-3 0.63 0.63 5 1 Tee As/Ac=0,9 Ab/Ac=0,5 Qb/Qc=0,2 ED5-3 1.74 3 Elbow D=460 CR3-9 0.45 2.19 6 1 Wye Ab1/Ac=0,7 Ab2/Ac=0,7 Qb1/Qc=0,5 ED5-9 1.61 1.61 7 1 Tee As/Ac=0,9 Ab/Ac=0,2 Qb/Qc=0,1 ED5-3 1.67 2 Elbow D=700 CR3-10 0.08 1.75 8 1 Tee As/Ac=0,9 Ab/Ac=0,2 Qb/Qc=0,1 ED5-3 1.67 3 Elbow D=700 CR3-10 0.12 1.79
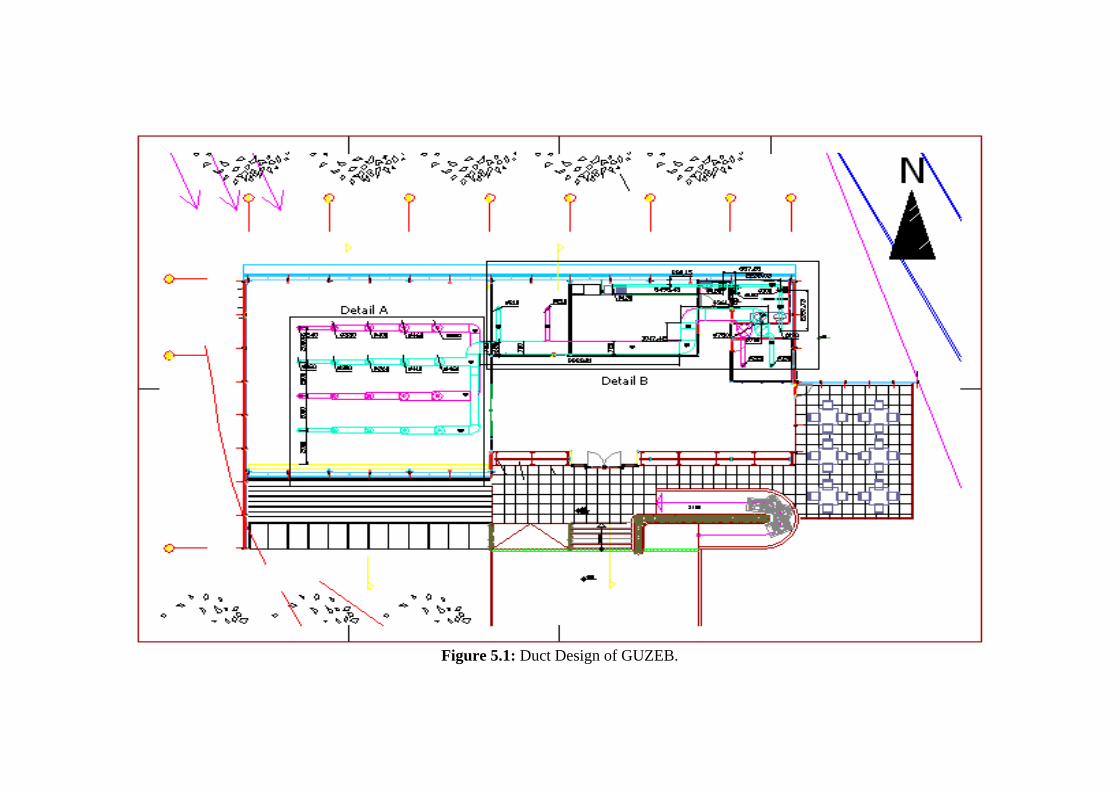
Figure 5.1: Duct Design of GUZEB.
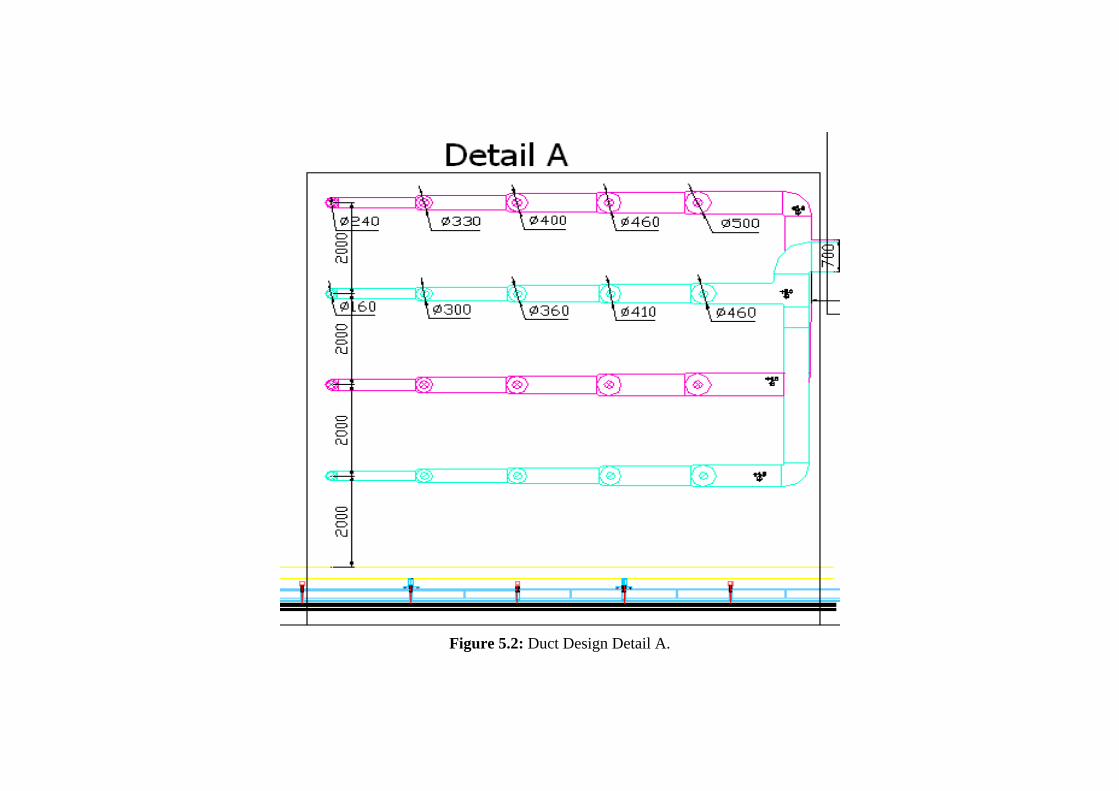
Figure 5.2: Duct Design Detail A.
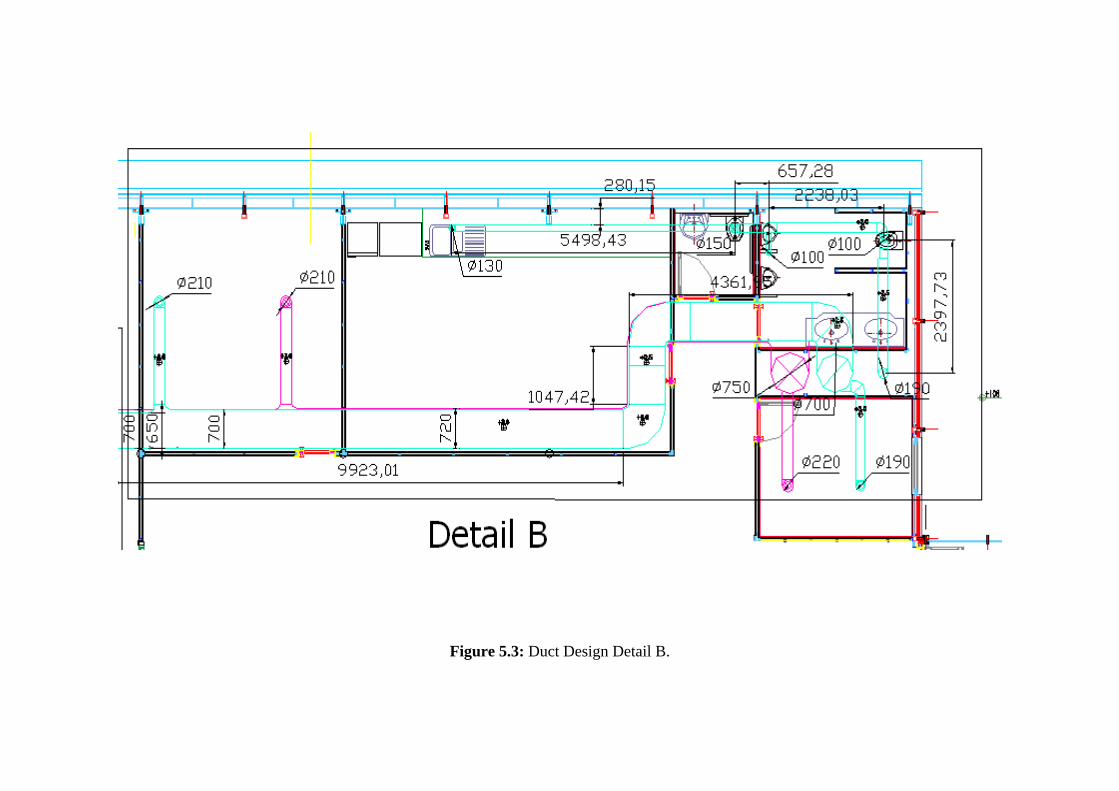
Figure 5.3: Duct Design Detail B.
73
Chapter 6
DESIGN OF THERMAL ENERGY STORAGE SYSTEM
6.1 General Information About Thermal Energy Storage Systems
Thermal energy storage has been used to shift on-peak loads to off-peak periods
in order to reduce utility charges and minimize or avoid high, on-peak demand charges.
Thermal energy storage systems provide energy savings when there are high loads of
short duration, high electric power demand charges, or low electrical charges during
off-peak hours. Thermal energy storage systems may be designed to produce and store
ice or water during off-peak hours when utility rates are generally lower. This stored
energy is used during on-peak hours, which is classified as a load-shift strategy.
In most cooling systems, there are two major components:
Firstly, chiller which make water or some other fluid cool and secondly the
distribution system which take the cool water or fluid from the chiller to a place where
it cools air for the building occupants. In systems, the chiller must be run only when the
building occupants need cool air. In a storage cooling system, the chiller can be run at
times other than only when the occupants want cooling.
Thermal Energy Storage (TES) systems typically involve the production of ice
or chilled water during off-peak electrical usage periods using lower cost electricity.
This stored energy is then used during on-peak electrical usage periods for air
conditioning or process cooling. Thermal energy storage systems can be sized to operate
in a load shifting, partial storage or load leveling, full storage strategy. Often, ice or
water is produced 24 hours a day, a strategy called "full storage”. As shown in Figure
6.1 in a full storage strategy, equipment is allowed to operate 24 hours a day. In this
method, chiller always runs with full capacity as long as it runs. Because of this
discontinuous capacity, great capacities of chiller and storage tank are required.
Automatic control is relatively simple in the full storage systems.
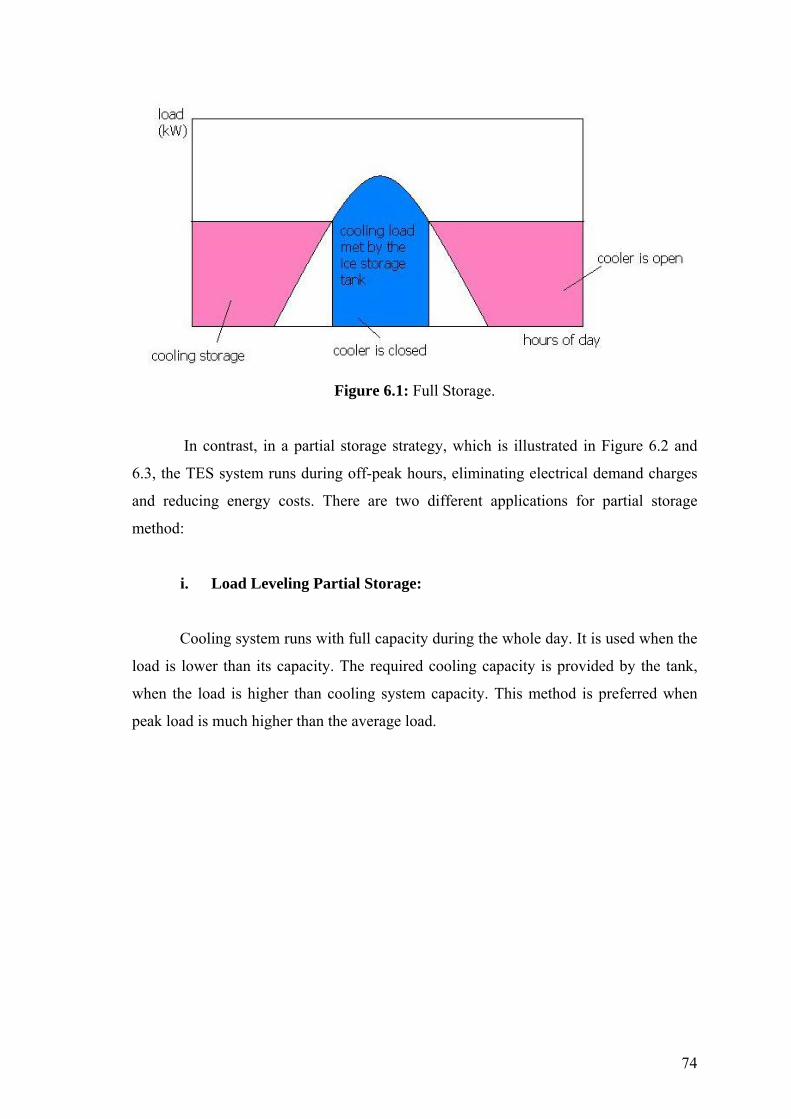
74
Figure 6.1: Full Storage.
In contrast, in a partial storage strategy, which is illustrated in Figure 6.2 and
6.3, the TES system runs during off-peak hours, eliminating electrical demand charges
and reducing energy costs. There are two different applications for partial storage
method:
i. Load Leveling Partial Storage:
Cooling system runs with full capacity during the whole day. It is used when the
load is lower than its capacity. The required cooling capacity is provided by the tank,
when the load is higher than cooling system capacity. This method is preferred when
peak load is much higher than the average load.

75
Figure 6.2: Load Leveling Partial Storage.
ii. Partial Storage Depending on Demand:
In this method, cooling system runs with low capacity, which is determined
according to demand in the peak load.
Figure 6.3: Partial Storage Dependent on Demand.
76
The main advantage of the “full storage” system is that it minimizes electricity
costs. The main advantage of the “partial storage” system is that a smaller chiller and
smaller storage tank reduce the capital costs of the TES system [35].
Five main types of thermal storage systems are used to meet these strategies.
The first type is “chilled water”, which has the advantage of being compatible with
existing chillers and it is probably the most energy efficient storage system. In contrast,
requiring much larger storage tanks than the other storage media is its disadvantage.
The second type of TES system uses a “eutectic salt” water solution as the storage
medium. Eutectic salt systems store cooling energy by freezing a solution at a
temperature nearly at 8.5oC. One of the advantages of these systems is, smaller tanks are
required than for chilled water by storing cooling through a phase change. The next
three storage systems have one thing in common is that ice as the storage material.
Compact storage size is one of their main advantages. Ice tanks may be up to 50 percent
of the size of comparable chilled water and eutectic salt tanks, respectively [36].
6.1.1 Chilled Water Storage
Chilled water storage systems store cooling with the help of the sensible heat
capacity of water. Chiller is used to cool water and water, which is cooled by the chiller,
is stored in a tank for later use in melting cooling needs. The temperature difference is
between the chilled water in the tank and the return water from the load is the reason of
the stored energy.
There are many advantages of chilled thermal storage systems:
There is no need for any special equipment, for instance chiller.
It is economical with the large storage tank sizes. Larger tanks have lower
capital cost compared with chiller plants that are nonstorage.
Storage tank can be used for fire protection water reservoir.
Chilled thermal storage system store both warm and chilled water [35].
6.1.2 Ice Harvesting Systems
According to the chilled water system, ice harvesting refrigeration plant
generates ice with a special designed evaporator section. Water is frozen where it is

77
pumped to the storage tank. There are two modes for making the water chilled water or
ice. Ice making or chiller mode is selected automatically related with the temperature of
the water as it enters the evaporator. If the water is approximately near the freezing
point, ice-making mode is selected. Otherwise chiller mode is chosen.
There are many advantages of ice harvesting systems:
Ice harvesting systems meet the short term cooling needs, usually preferred in
food productions.
From ice generation to chilled-water generation change is done automatically
with the load conditions.
Ice harvesting systems produce high continuous discharge rates [35].
6.1.3 Advantages of Thermal Energy Storage Systems
Briefly, there are many advantages of thermal energy storage systems:
Compared with usual cooling systems, TES systems use smaller equipment
capacity and typically operate during off-peak hours, reducing operating costs.
Compared with the traditional cooling systems, TES systems occasionally provide
savings in initial capital costs. Thermal energy storage systems provide energy savings
when there are high electric power demand charges, or low electrical charges during
off-peak hours.
6.2 Thermal Energy Storage in GUZEB
As mentioned in Chapter 2, GUZEB’s cooling system design is different
compared with the other traditional applications. Because the first main idea of both
systems, especially the high load required systems, is to reduce the energy consumption.
Cooling system is one of the high loaded energy systems. Related to this foresight,
reducing energy from cooling system must be one of the main steps.
GUZEB is designed for library function except on special days that are
symposium days. GUZEB’s cooling load will be many times greater compared with the
usual days. Anticipated that in cooling load calculations, these special symposium days
will be organized only one or two days in a month. As given in church example,
maximum load will be arising only on these special days. Cooling system will not
operate on usual days with full capacity so, installation and operating cost will be
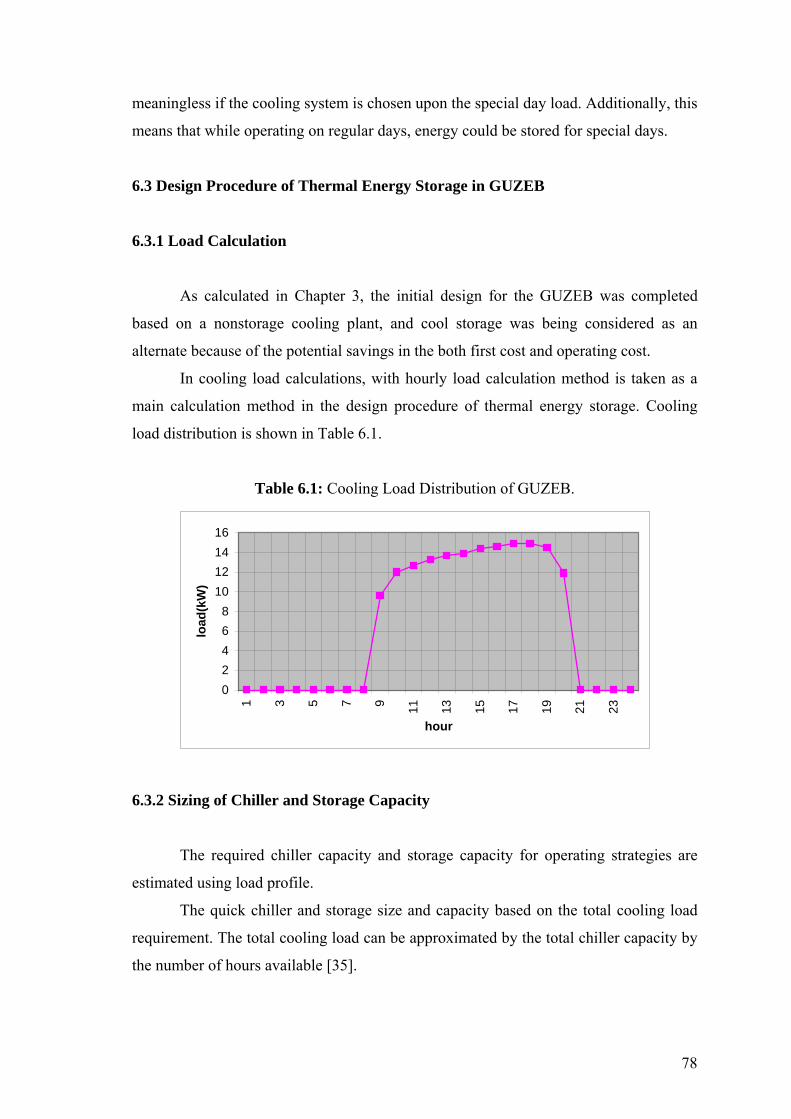
78
meaningless if the cooling system is chosen upon the special day load. Additionally, this
means that while operating on regular days, energy could be stored for special days.
6.3 Design Procedure of Thermal Energy Storage in GUZEB
6.3.1 Load Calculation
As calculated in Chapter 3, the initial design for the GUZEB was completed
based on a nonstorage cooling plant, and cool storage was being considered as an
alternate because of the potential savings in the both first cost and operating cost.
In cooling load calculations, with hourly load calculation method is taken as a
main calculation method in the design procedure of thermal energy storage. Cooling
load distribution is shown in Table 6.1.
Table 6.1: Cooling Load Distribution of GUZEB.
0
2
4
6
8
10
12
14
16
1 3 5 7 9
11 13 15 17 19 21 23
hour
load
(kW
)
6.3.2 Sizing of Chiller and Storage Capacity
The required chiller capacity and storage capacity for operating strategies are
estimated using load profile.
The quick chiller and storage size and capacity based on the total cooling load
requirement. The total cooling load can be approximated by the total chiller capacity by
the number of hours available [35].

79
That is:
Total Cooling Load = Total Chiller Capacity (6.1)
In many systems, the chiller capacity depends on whether it is charging storage
or melting the load. The total capacity is the sum of the chiller capacity in each working
load, times the operated hours.
Total Chiller Capacity = Hchrg*Cchrg + HDConp*CDConp + HDCoffp*CDcoffp (6.2)
where:
Hchrg = hours charging storage
Cchrg = capacity when charging storage
HDconp = hours direct cooling during on-peak period
CDConp = capacity when direct cooling during on-peak period
HDcoffp = hours direct cooling during off-peak period
CDcoffp = capacity when direct cooling during off-peak period
If the nominal chiller capacity at ARI rating conditions (6-7oC chilled water and 29,4oC
condenser water) is defined, the nominal chiller capacity is expressed as follows:
Nominal Chiller Size = DcoffpDCoffpDConDConpchrgchrg CRH pCRH CRH
ngLoadTotalCooli (6.3)
where:
Hchrg = hours charging storage
CRchrg = capacity ratio when charging storage
HDconp = hours direct cooling during on-peak period
CRDconp = capacity ratio when direct cooling during on-peak period
HDcoffp = hours direct cooling during off-peak period
CRDcoffp = capacity ratio when direct cooling during off-peak period

80
The on-peak load capacity is zero for a full storage system. The direct cooling
system is the same during on and off peak for load-leveling system.
The chilled water storage systems, the chiller capacity is assumed constant for
quick chiller sizing (CRchrg = CRDconp = CRDcoffp = 1). For ice harvesting systems, the ice
making capacity is considered the nominal capacity and the direct cooling capacity ratio
is taken between 1.2-1.3. For other ice harvesting systems, the ice making capacity is
taken 0.6-0.7. For direct cooling capacity ratio changes depends on the chilled water
temperature between 0.8 and 0.9.
The required storage capacity is equal to difference of the total cooling load and
the cooling ton-hours supplied directly by the chiller, load that is met either directly or
from storage while storage is being charged.
Storage Capacity = Total Cooling Load – (TCDConp + TCDCoffp + THDCchrg) (6.4)
where:
TCDconp = total capacity when direct cooling on-peak
TCDcoffp = total capacity when direct cooling off-peak
THDCchrg = ton-hours direct cooling while simultaneously charging
From Table 6.1, Table 6.2 summarizes the information for the cooling load.
Table 6.2: Cooling Load Distribution Profile of GUZEB.
Total Cooling Load in July
Hour 0 1 2 3 4 5 6 7 8 9 10 11 12 13 14 15 16 17 18 19 20 212223
Cooling Load (kW) 0 0 0 0 0 0 0 0 9.61212.713.313.713.914.414.614.914.9 14.5 11.9 0 0 0 0
On-peak period is chosen between 10:00-18:00 hours.
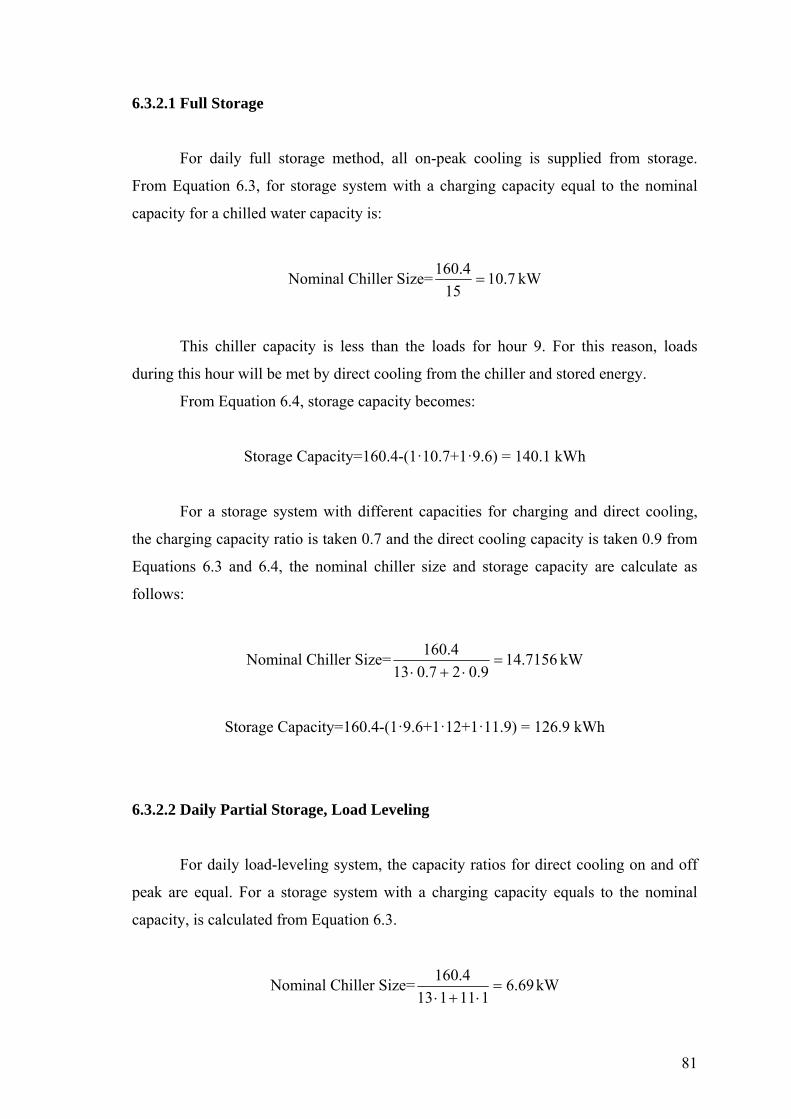
81
6.3.2.1 Full Storage
For daily full storage method, all on-peak cooling is supplied from storage.
From Equation 6.3, for storage system with a charging capacity equal to the nominal
capacity for a chilled water capacity is:
Nominal Chiller Size= 7.1015
4.160 kW
This chiller capacity is less than the loads for hour 9. For this reason, loads
during this hour will be met by direct cooling from the chiller and stored energy.
From Equation 6.4, storage capacity becomes:
Storage Capacity=160.4-(1·10.7+1·9.6) = 140.1 kWh
For a storage system with different capacities for charging and direct cooling,
the charging capacity ratio is taken 0.7 and the direct cooling capacity is taken 0.9 from
Equations 6.3 and 6.4, the nominal chiller size and storage capacity are calculate as
follows:
Nominal Chiller Size= 7156.149.027.013
4.160
kW
Storage Capacity=160.4-(1·9.6+1·12+1·11.9) = 126.9 kWh
6.3.2.2 Daily Partial Storage, Load Leveling
For daily load-leveling system, the capacity ratios for direct cooling on and off
peak are equal. For a storage system with a charging capacity equals to the nominal
capacity, is calculated from Equation 6.3.
Nominal Chiller Size= 69.6111113
4.160
kW

82
And storage capacity is calculated as follows:
Storage Capacity=160.4-(11·6.69·1+1·9.6) = 77.21 kWh
If the charging capacity ratio is taken 0.7 and the direct cooling capacity is taken
0.9, nominal chiller size and storage capacity is calculated as follows:
Nominal Chiller Size= 442.89.0117.013
4.160
kW
Storage Capacity=160.4-(10·8.442·0.9+1·12·0.9+1·9.6)=64.022 kWh
6.3.2.3 Daily Partial Storage, Demand Limiting
A demand limiting system operates similar with a load leveling system.
However, the chiller capacity is limited during on-peak hours to allow additional
demand savings. Using the same chiller capacity ratios used above for the load-leveling
example, with a 50% on-peak load capacity limit, the nominal chiller size is from
Equation 6.3 and the storage size from Equation 6.4 is:
Nominal Chiller Size= 7291.10)9.02()5.09.09(7.013
4.160
kW
Storage Capacity=160.4-[(9·10.7291·0.9·0.5)+(2·10.7291·0.9)+(1·9.6) = 83.035 kWh
6.3.2.4 Summary of Operating Mode
The summary of operating modes is illustrated in Tables 6.3 to 6.7. These tables
illustrate the relation between the cooling load distribution of the GUZEB and the
different operating mode summary.
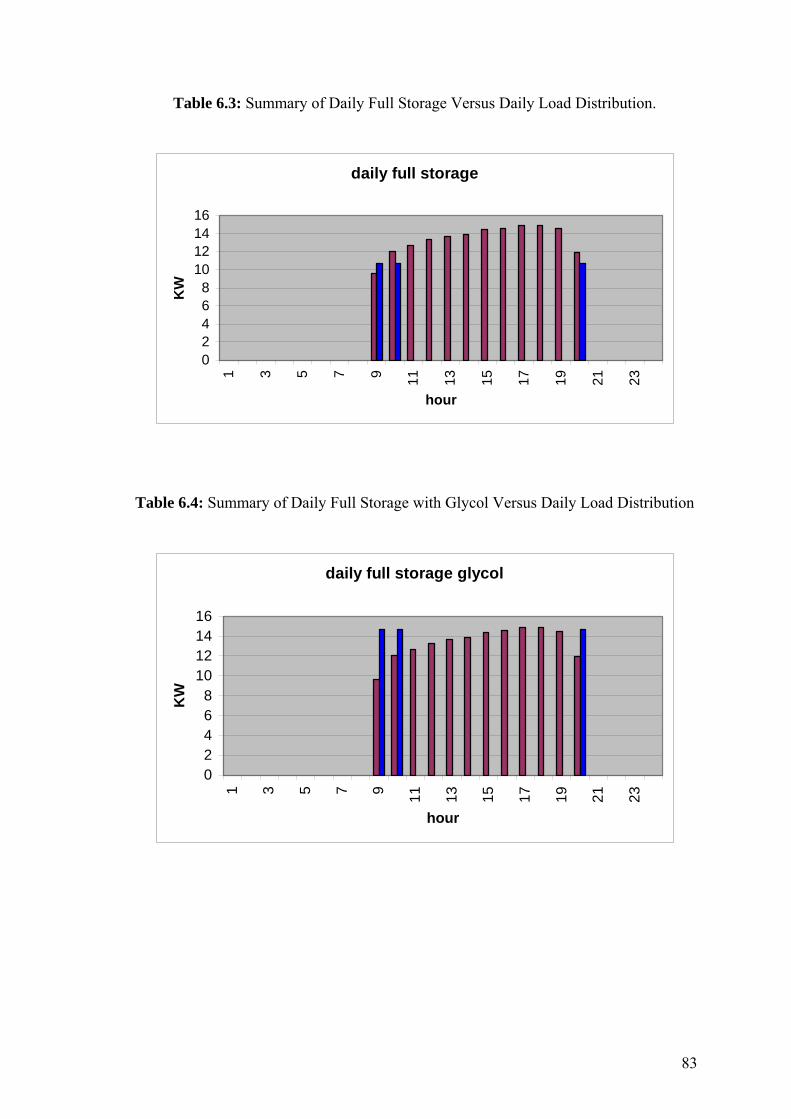
83
Table 6.3: Summary of Daily Full Storage Versus Daily Load Distribution.
daily full storage
02468
10121416
1 3 5 7 9 11 13 15 17 19 21 23
hour
KW
Table 6.4: Summary of Daily Full Storage with Glycol Versus Daily Load Distribution
daily full storage glycol
02468
10121416
1 3 5 7 9
11 13 15 17 19 21 23
hour
KW
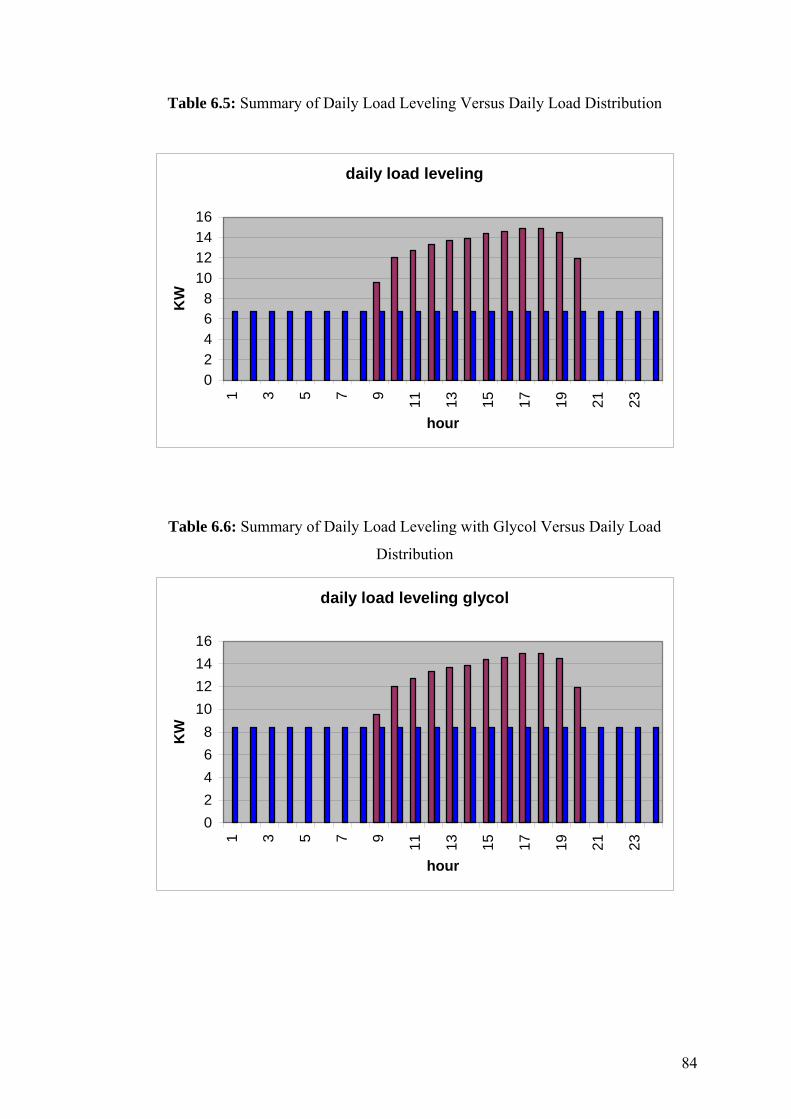
84
Table 6.5: Summary of Daily Load Leveling Versus Daily Load Distribution
daily load leveling
02468
10121416
1 3 5 7 9
11 13 15 17 19 21 23
hour
KW
Table 6.6: Summary of Daily Load Leveling with Glycol Versus Daily Load
Distribution
daily load leveling glycol
0
2
4
6
8
10
12
14
16
1 3 5 7 9
11 13 15 17 19 21 23
hour
KW
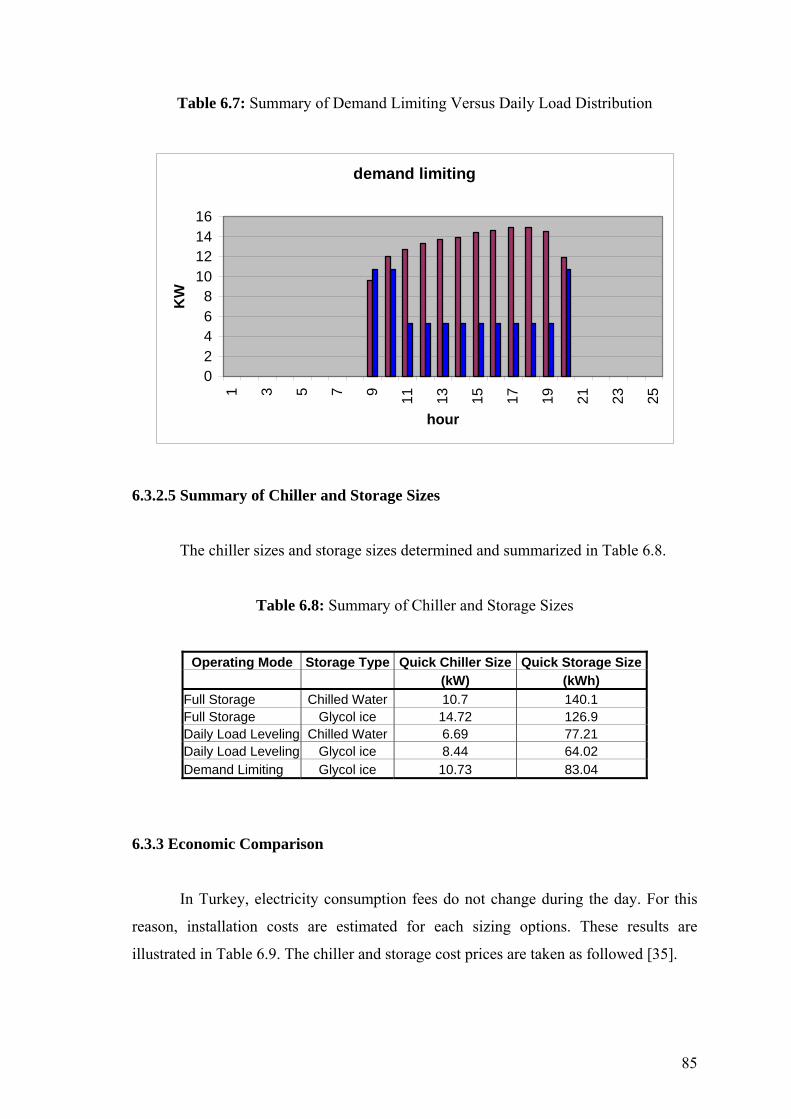
85
Table 6.7: Summary of Demand Limiting Versus Daily Load Distribution
demand limiting
02468
10121416
1 3 5 7 9
11 13 15 17 19 21 23 25
hour
KW
6.3.2.5 Summary of Chiller and Storage Sizes
The chiller sizes and storage sizes determined and summarized in Table 6.8.
Table 6.8: Summary of Chiller and Storage Sizes
Operating Mode Storage Type Quick Chiller Size Quick Storage Size (kW) (kWh)
Full Storage Chilled Water 10.7 140.1 Full Storage Glycol ice 14.72 126.9 Daily Load Leveling Chilled Water 6.69 77.21 Daily Load Leveling Glycol ice 8.44 64.02 Demand Limiting Glycol ice 10.73 83.04
6.3.3 Economic Comparison
In Turkey, electricity consumption fees do not change during the day. For this
reason, installation costs are estimated for each sizing options. These results are
illustrated in Table 6.9. The chiller and storage cost prices are taken as followed [35].
86
Chiller Cost = $170/kW
Storage Cost:
Chilled water = $11.36/kWh
Glycol ice = $17.05/kWh
Table 6.9: Economic Comparison Summary
Operating Mode Storage
Type Quick
Chiller SizeQuick
Storage SizeChiller Cost
Storage Cost
Total Cost
(kW) (kWh) $ $ $ Full Storage Chilled Water 10.7 140.1 1819 1 591.54 3 410.54Full Storage Glycol ice 14.72 126.9 2 501.65 2 163.65 4 665 30Daily Load Leveling Chilled Water 6.69 77.21 1 137.3 877.11 2 014 41Daily Load Leveling Glycol ice 8.44 64.02 1 435.14 1 091.58 2 526.72Demand Limiting Glycol ice 10.73 83.04 1 823.95 1 415.75 3 239.69
As shown from Table 6.4, the most economical operating mode is daily load
leveling, chilled water storage type. This operating mode is suitable for the fire protect
system. Fire protect system can take the fire protect water from this storage tank, and
another storage tank need can be removed with the water type of chilled water system.
6.3.4 Storage Tank Capacity
The storage capacity of chilled water tank increases with the temperature
difference between the stored chilled water and the warm water returning from the load.
For the chilled water storage systems, the most favorite tank shape is flat-
bottomed vertical cylinder. A cylindrical tank has lower surface to volume ratio than a
rectangular tank of the same volume.
Concrete tanks are constructed with height to diameter ratios of 0.25 to 0.5. The
best offer is generally 0.25 and 0.33. Concrete tanks are generally more economical
below 14m heights. Besides, aboveground steel tanks are typically constructed with the
ratio similarly with the concrete tanks of 0.5 to 1.2. Horizontal cylindrical tanks are not
recommended for stratified chilled water storage. Welded steel, precast prestressed
concrete, and cast-in-place concrete tanks are the most common chilled water storage
tanks. Steel tanks are the best choice for the small sized tanks.
The tank volume depends on the temperature difference between the stored
chilled water and the warm water returning. That effectiveness is expressed as the figure
of merit (FOM) of the tank. The FOM is the ratio of the amount of cooling removed
87
from storage to the amount of cooling available from fully charged storage. For well-
designed water storage tanks FOM is 90% or better. If there is no data, a factor of 85 to
90 % is recommended.
The tank volume can be calculated from the following equation [35].
FOMKkgkJmkgK
kWhkJkWhTotaldailymV
o
/2.4/998
/3600)(
33 (6.5)
Total daily load is 152.4 kWh for the cooling load of the GUZEB. If FOM is taken
%85, and the system operates between 4 and 15oC, storage tank capacity will be:
333 15733.1485.02.499811
36004.160)( mmmV
If the steel tank is cost is taken approximately 35 $/m3 [35], storage tank cost
will be 535 $.
If the steel tanks height-to-diameter ratios is taken 0.95, and the storage tank size is
decided to be cylindrical, length and the diameter of the storage tank is:
95.0D
L
495.015
415
2
2
DD
DL
Diameter of the storage tank is found approximately 2.7 m., and the length is
found 2.6 m.
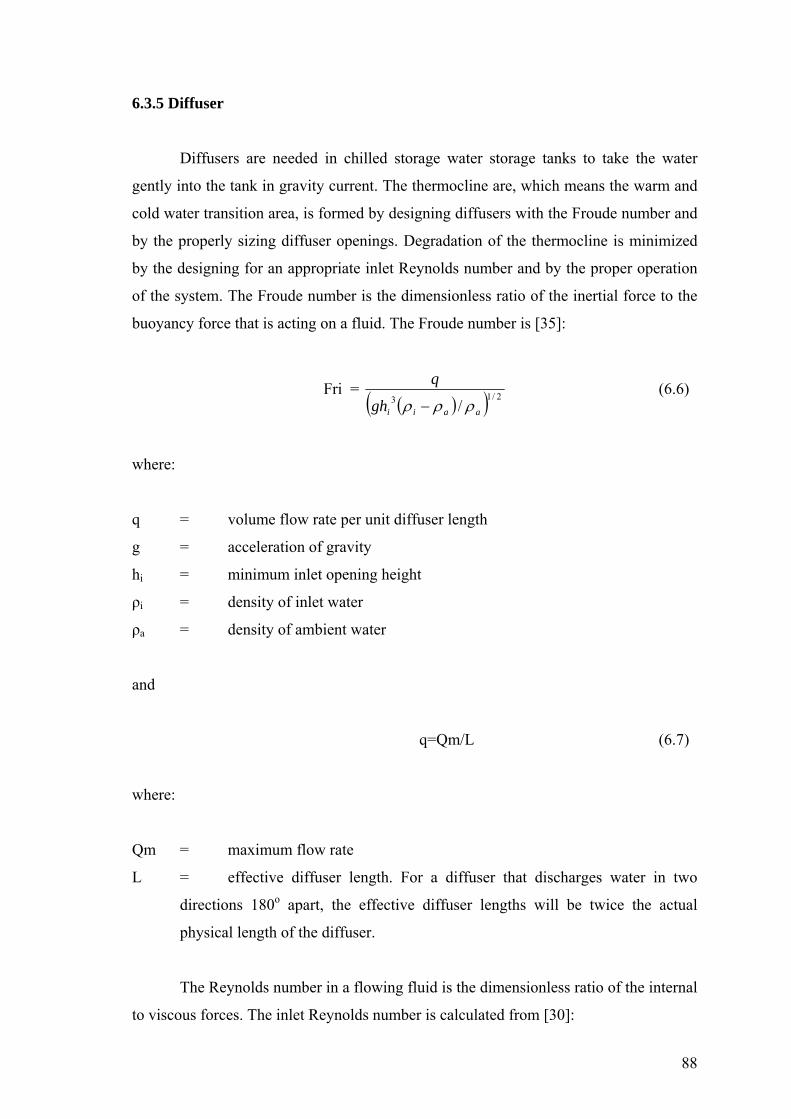
88
6.3.5 Diffuser
Diffusers are needed in chilled storage water storage tanks to take the water
gently into the tank in gravity current. The thermocline are, which means the warm and
cold water transition area, is formed by designing diffusers with the Froude number and
by the properly sizing diffuser openings. Degradation of the thermocline is minimized
by the designing for an appropriate inlet Reynolds number and by the proper operation
of the system. The Froude number is the dimensionless ratio of the inertial force to the
buoyancy force that is acting on a fluid. The Froude number is [35]:
Fri = 2/13 / aaiigh
q
(6.6)
where:
q = volume flow rate per unit diffuser length
g = acceleration of gravity
hi = minimum inlet opening height
ρi = density of inlet water
ρa = density of ambient water
and
q=Qm/L (6.7)
where:
Qm = maximum flow rate
L = effective diffuser length. For a diffuser that discharges water in two
directions 180o apart, the effective diffuser lengths will be twice the actual
physical length of the diffuser.
The Reynolds number in a flowing fluid is the dimensionless ratio of the internal
to viscous forces. The inlet Reynolds number is calculated from [30]:

89
Rei = q/ν (6.8)
where:
q = flow rate per meter of diffuser length (m2/s)
ν = kinematic viscosity of inlet water (m2/s)
For very short tanks, Reynolds is recommended 200, for tank greater than about
5 m deep is between 400 and 850, for 12 m deep or more tanks, Reynolds is 2 000. In
general, an upper limit of 850 is recommended so Reynolds should be used 200 [35].
From Equation 6.8 flow rate is found:
200 = q / 1.566 · 10-6(m2/s) q = 3.132 · 10-4 m2/s
From Equation 6.6 Froude number can be calculate as followed where Froude
number is equaled to 1. The density of inlet water and the density of ambient water are
taken as:
3/8234.9984 mkgCoi
3/9561.99715 mkgCoa
Finally minimum inlet opening height is calculated that:
hi = 0.02177 m
As shown in Table 6.9 tank capacity is taken approximately 80 kWh. If the
water making hours during 12 hours the required power is calculated as:
Required power = 80 / 12 = 6.67 kW
Mass flow rate can be calculated from Equation 6.9:
TCmQ p*
(6.9)

90
)(11)(2.467.6*
KkgK
kJmkW o
skgm /1443.0*
Maximum Flow rate can be calculate:
smmkg
Qm /104454.1/8234.998
1443.0 343
and diffuser length can be calculate from Equation 6.7:
3.132 · 10-4 = 1.4454 · 10-4 / L L = 0.4615 m
For radial disk diffuser, diameter of the diffuser is calculate from Equation 6.10:
D = L / (6.10)
Finally diffuser length is found as:
D = 0.147 m
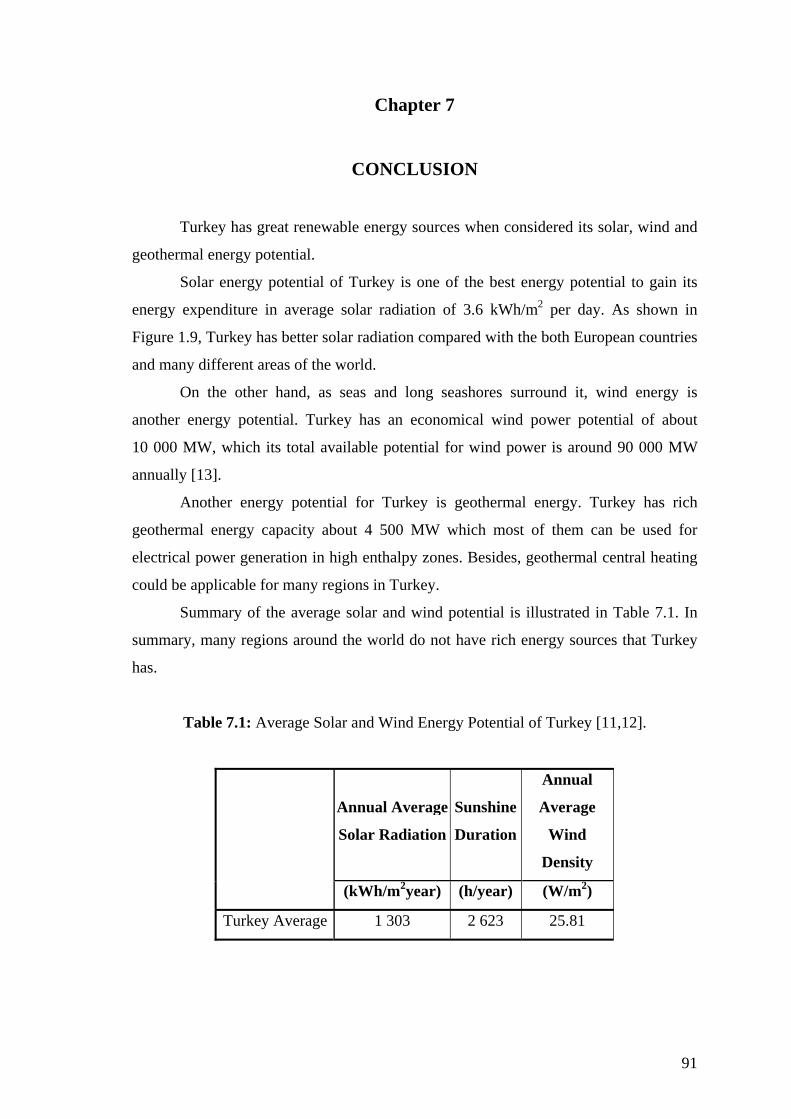
91
Chapter 7
CONCLUSION
Turkey has great renewable energy sources when considered its solar, wind and
geothermal energy potential.
Solar energy potential of Turkey is one of the best energy potential to gain its
energy expenditure in average solar radiation of 3.6 kWh/m2 per day. As shown in
Figure 1.9, Turkey has better solar radiation compared with the both European countries
and many different areas of the world.
On the other hand, as seas and long seashores surround it, wind energy is
another energy potential. Turkey has an economical wind power potential of about
10 000 MW, which its total available potential for wind power is around 90 000 MW
annually [13].
Another energy potential for Turkey is geothermal energy. Turkey has rich
geothermal energy capacity about 4 500 MW which most of them can be used for
electrical power generation in high enthalpy zones. Besides, geothermal central heating
could be applicable for many regions in Turkey.
Summary of the average solar and wind potential is illustrated in Table 7.1. In
summary, many regions around the world do not have rich energy sources that Turkey
has.
Table 7.1: Average Solar and Wind Energy Potential of Turkey [11,12].
Annual Average
Solar Radiation
Sunshine
Duration
Annual
Average
Wind
Density
(kWh/m2year) (h/year) (W/m2)
Turkey Average 1 303 2 623 25.81

92
As mentioned, more energy sources are needed if Turkey’s total energy
production is only 30% of its all consumption. Although oil and natural gas become
very expensive, not only in Turkey but also in the world, these sources supply most of
our energy needs. This means that, Turkey and the world have to tend to new energy
sources, which include solar, hydropower, biomass, geothermal and wind energy, or
have to control their energy expense with the help of many energy saving methods.
In the light of the renewable energy potential of Turkey, and energy reducing
studies around the world, using renewable energy sources instead of fossil energy
sources in life may start with the daily life, with the houses. So, house that produces its
own energy, zero energy house idea, becomes the main point of this study.
Gulbahce Zero Energy Building’s location is chosen near the campus area of
IZTECH. This location is rich because of the natural energy sources. An ancient cave
near the GUZEB has water source at 32oC, which is used for heating the building in
winter and used to meet hot water needs. Besides, the location of GUZEB has good
wind energy potential, which its speed reaches up to 5-7 m/s at the sea level [37].
Additionally, solar energy potential of the location is better than the Turkey’s solar
radiation average when examined geographically.
In summary, the location of the GUZEB is special with the realistic renewable
energy sources.
GUZEB is designed as a library and on special days, can be functioned as a
showroom, where symposiums can be assembled. GUZEB is designed to use these
renewable energy sources more productive that, for instance, roof is designed to help to
take wind for ventilation inside of the building; in addition, floor insulation materials
are chosen related with the floor heating method where geothermal energy can be used
more efficiently. So, these kinds of design methods are chosen to help to store energy
and to use these related renewable sources.
For example, geothermal energy is used to heat the building in winter. With low
temperature geothermal sources, floor-heating system will be the best choice to use this
real hot water reservoir. Although the reservoir has low water temperature for floor
heating systems, the water will meet the heating load because of its continuity. While
the system works continuously, the gain from the water used in the floor heating system
will be enough to meet the heating load of the building.
Wind and solar energy is used to meet the electric consumption of the building.
As mentioned, with good and efficient wind potential of the location; a wind turbine can
93
be used to produce electricity together with the photovoltaic panels, which can be
placed in front of the building. These panels and the wind turbine together, can be used
to meet the electricity consumption including lighting equipments, cooling and
ventilation group, automatic control equipments, pumps, etc.
On the other hand, the building is powered with many recommendations and
many application materials to reduce energy consumption. Firstly, silica aerogel is one
of these insulation materials, which help to reduce energy consumption. Because of its
99.8% is air, and related with this characteristic, its thermal conductivity is very low
that aerogels are the best insulator that ever discovered. Aerogels can be produced, with
high technology, transparent that is as same as a glass. So, aerogel can be used both an
insulator and a window. This means that, wall, which silica aerogel is used, will help to
let the sunshine in that help to reduce lighting consumption.
Secondly, fiber lighting is a lighting recommendation that do not need
electricity. With the illuminators that do not use electrical power, but its electrical
power can help to reduce electricity consumption, if it is used as a lighting option. With
long life-span illuminators, fiber lighting can be a good energy saver.
Thirdly, easy applicable ceramic roof insulation material is another energy
saving option. With these kind of insulation materials, the building can be protected and
power instead of the energy losses.
Curtains and the panels, which is used for shading is other energy saving method
that is recommended for the energy saving. These curtains can be controlled
automatically concerned with the daylight.
Related with these curtains, cooling system is designed not for the entrance.
Because, automatic controlled curtains and panels, the cooling system is designed for
the library and the office spaces. Besides, toilets will have exhaust system. The main
reason of choosing this kind of system is same with the other recommendations, to
reduce energy consumption. If the cooling and ventilation system will be used on
special days, selecting and constructing the full equipped and constructed duct design
can be extravagant, while trying to reduce energy consumption.
In this study, thermal energy storage system is one of the other ways, which is
recommended to produce and store ice or water during off-peak hours. This stored
energy is used during on-peak hours. As mentioned in church example, GUZEB have
less cooling load on regular days than on special symposium days, which will maximum
cooling load where natural ventilation cannot be enough. On the other hand, if the

94
cooling system is chosen for usual days, cooling system will not operate on special days
when full capacity is needed. This means that installation and operating cost will be
meaningless if the plant is chosen related with the special days, which may not be more
than four or five days annually. While operating on regular days, energy could be stored
for special days. So, stored energy can be more suitable and operable and more helpful
on energy saving.
For thermal energy storage system, daily load leveling operating mode and
chilled water storage type is the best operation type if both the chilled water can be used
in fire protection system and its total cost are taken into consideration. Fire protect
system can take the fire protect water from thermal energy storage tank, incase of fire
and another storage tank need can be solved with only one tank.
Table 7.2 shows that, the cooling peak load on special symposium day and the
load if the energy is stored. It is clearly shows that, the cooling system can be chosen
45% less than the peak load. With the light of these data, the first investment cost of the
plant and the operation cost of the low loaded plant will be lower.
Table 7.2: Cooling Load Comparison on Regular and Special Days.
Peak Load Daily Load
Leveling Mode
Cooling Load (kW) 14.9 6.69
Automatic control systems; for instance, how much water will be pumped for
floor-heating system, how much fresh air will be let into the spaces from cooling and
ventilation systems, how much intervals will be opened from natural ventilation
intervals, how much sunshine will be let in from curtains, have to be set up to keep the
building alive. Besides, monitoring systems will be used to monitor these control
systems.
For many different examples and different designs, optimization of each system
will be different from each other. Where the building will be settled, how efficient
renewable sources that the location have, for which functions that the building will
serve, and other qualifications of the building are designated the optimization of the
related building.
95
In this study, the design recommendations are given related with the
qualifications of the GUZEB that are followed above. Optimization of the GUZEB can
be done in the light of these recommendations.
This study is a front study. After cost and performance analysis of each system,
and recommendations, GUZEB can be constructed. But this never means that, zero
energy houses including GUZEB, will be more feasible at the beginning. But, in the
course of the time, these kinds of zero energy house systems can be feasible or
profitable.
Additionally, zero energy house studies have the same main idea that the energy
will be the most important subject which is going to be the most expensive to obtain and
with renewable energy sources, the basic energy consumption for the usual life can be
solved by these kinds of studies. In developed countries, the government supports this
idea if people gain their energy from these renewable energy sources. So, zero energy
houses will be one of the most important parts of the projects that are based on
renewable energy sources where the energy is obtained from nature.
In this study, a zero energy building was designed and optimized. All energy
sources, which are used in GUZEB, are from natural sources that are all of them are
realistic. Geothermal energy, where is taken from an ancient cave near to the location of
the GUZEB, is used for heating and for hot water demand; wind and solar energy,
where both potential are high enough to produce electricity, are for producing
electricity. In summary, GUZEB is constructed upon realistic examples, and with both
of these natural energy sources, a hybrid system is created.
In addition, the building is designed with many different and specific systems,
for instance, the roof design that for natural ventilation, and passive solar heating
recommendations, and the building is powered by new insulation materials, lighting
equipments and many other related functions, which are make GUZEB special to save
energy.
In conclusion, GUZEB produces its own energy. And this study indicates that
with a single compact hybrid example, a building can be designed to save energy and
produce its own energy need with renewable energy sources and many different energy
saving methods.

96
REFERENCES
[1] Energy Information Administration 1999 Commercial Buildings Energy
Consumption Survey: Consumption and Expenditures Tables.
[2] Energy Information Administration Web Page,2004: http://www.eia.doe.gov,2004.
[3] Ogulata R.T., 2002: Sectoral energy consumption in Turkey. Renewable and
Sustainable Energy Reviews 6 (2002) 471–480.
[4] Ministry of Energy and Natural Resources (MENR): Energy Report of Turkey,
Ankara, Turkey, 2001. Website available: http://www.menr.gov.tr.
[5] Twidel J., Weir T., 1996: Renewable Energy Resources. E&FN SPON,
London,1996.
[6] U.S Department of Energy, 2004: U.S Department of Energy Website,
http://www.eere.energy.gov/buildings/zeroenergy/, 2004.
[7] U.S Department of Energy Study , On the Path to Zero Energy Homes, Website
available, http://www.eere.energy.gov.
[8] Filippin C. , Beascochea A., Esteves A., De rosa C., Cortegoso L. and Estelrich D.,
1998: A passive solar building for ecological research in Argentina: the first two years
experience. Solar Energy Vol. 63, No. 2, pp. 105–115, 1998.
[9] Tjerk Reijenga BEAR Architecten., 2004: Energy efficient and zero-energy building
in the Netherlands,The Netherlands, Website available,
www.bear.nl/content/biblio_publications_papers.html.
[10] Elisabeth Gratia, De Herde A.,2003: Design of Low Energy Office Buildings,
Energy and Buildings 35 (2003) 473-491.
[11] Ocak M., Ocak Z., Bilgen S., Keles S., Kaygusuz K., 2003: Energy utilization,
environmental pollution and renewable energy sources in Turkey, Energy Conversion
and Management 45 (2004) 845–864.

97
[12] State Planning Organization (SPO). Eighth Five-Year Development Plan. Energy
Report of Turkey, DPT, Ankara, Turkey, 2001.
[13] Fossil Energy International, FE,. 2003: An Energy Overview of the Republic of
Turkey. Website available, http://www.fe.doe.gov/international/turkover.html.
[14] Kaygusuz K., Sarı A., 2003: Renewable energy potential and utilization in Turkey,
Energy Conversion and Management 44 (2003) 459–478.
[15] International Energy Association Statistics on the Web:
http://www.iea.org/statist/index.htm.
[16] World Energy Council Web Page, http://www.worldenergy.org.
[17] Chamber of Electric Engineers Technical Lighting Load Calculation Methods,
Website available, http://www.emo.org.tr, 2004.
[18] California Institute of Technology Jet Propulsion Laboratory NASA Portal Web
Page: http://stardust.jpl.nasa.gov/tech/aerogel.html, 2004.
[19] Fricke J., Tillotson T., 1997: Aerogels: production, characterization, and
applications, Thin Solid Films 297 (1997) 212-223.
[20] Ernest Orlando Lawrence Berkeley National Laboratory Web Page:
http://eande.lbl.gov/ECS/aerogels/satoc.htm, 2004.
[21] Hrubesh L. W., 1998: Aerogel Applications. Journal of Non-Crystalline Solids 225
(1198) 335-342.
[22] Oral G. K., 2003: Sürdürülebilir Enerji ve Saydam Yalıtım, Yalıtım Dergisi, April
2003.
[23] Mascoat Products Web Page: http://www.deltacoat.com/Weatherbloc.htm, 2004.
[24] Del Lighting Company Web Page: http://www.del-lighting.com, 2004.
[25] Fiber Stars Company Web Page: http://www.fiberstars.com, 2004.
98
[26] Technical Publication of Chamber of Mechanical Engineers, No: 84.
[27] ASHRAE Handbook-Fundamentals, 2001:Residential Cooling and Heating Load
Calculations, ASHRAE Handbook-Fundamentals, 2001, Chapter 28.
[28] Alarko- Carrier, 1992: HVAC design Programs Configuration Program Version
1.41 Hourly Analysis Program v 3.23., 1992.
[29] Tamer Ş., 1990: Klima ve Havalandırma. 1990.
[30] Incropera F. P., Dewitt D. P., 1996:Fundamentals of Heat and Mass Transfer.
1996.
[31] ASHRAE Handbook-Fundamentals, 2001:Residential Cooling and Heating Load
Calculations, ASHRAE Handbook-Fundamentals, 2001, Chapter 29.
[32] Toksoy M., Tanyeri H.,: Egefer Floor Heating Design and Application
Fundamentals.
[33] Fluent Inc., 2001: Fluent 6.0 Software, 2001.
[34] Energy Information Administration, State Energy Data Report 1995, 3–7 Tables,
1995.
[35] ASHRAE, 1990:An Annotated Guide to Models and Algorithms for Energy
Calculations Relating to HVAC Equipment, ASHRAE, 1990.
[36] Wilson P., 1996: Source Energy and Environmental Impacts Of Thermal Energy
Storage. California Energy Commission P500-95-005, 1996.
[37] Turkeli, H.M., 2002: An Experimental Investigation of the Parameters to Classify
Wind Sites, M. Sc. Thesis, Izmir Institute of Technology, 2002.

99
APPENDIX A
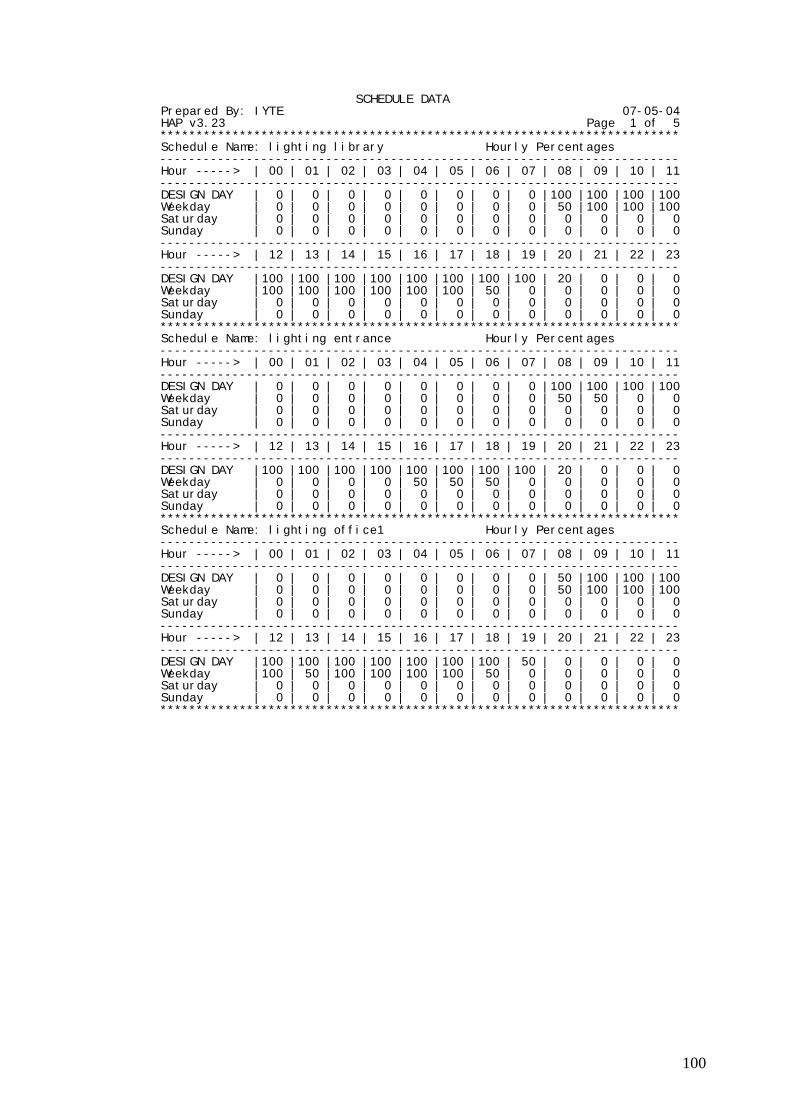
100
SCHEDULE DATA Prepared By: IYTE 07-05-04 HAP v3.23 Page 1 of 5 ************************************************************************ Schedule Name: lighting library Hourly Percentages ------------------------------------------------------------------------ Hour -----> | 00 | 01 | 02 | 03 | 04 | 05 | 06 | 07 | 08 | 09 | 10 | 11 ------------------------------------------------------------------------ DESIGN DAY | 0 | 0 | 0 | 0 | 0 | 0 | 0 | 0 |100 |100 |100 |100 Weekday | 0 | 0 | 0 | 0 | 0 | 0 | 0 | 0 | 50 |100 |100 |100 Saturday | 0 | 0 | 0 | 0 | 0 | 0 | 0 | 0 | 0 | 0 | 0 | 0 Sunday | 0 | 0 | 0 | 0 | 0 | 0 | 0 | 0 | 0 | 0 | 0 | 0 ------------------------------------------------------------------------ Hour -----> | 12 | 13 | 14 | 15 | 16 | 17 | 18 | 19 | 20 | 21 | 22 | 23 ------------------------------------------------------------------------ DESIGN DAY |100 |100 |100 |100 |100 |100 |100 |100 | 20 | 0 | 0 | 0 Weekday |100 |100 |100 |100 |100 |100 | 50 | 0 | 0 | 0 | 0 | 0 Saturday | 0 | 0 | 0 | 0 | 0 | 0 | 0 | 0 | 0 | 0 | 0 | 0 Sunday | 0 | 0 | 0 | 0 | 0 | 0 | 0 | 0 | 0 | 0 | 0 | 0 ************************************************************************ Schedule Name: lighting entrance Hourly Percentages ------------------------------------------------------------------------ Hour -----> | 00 | 01 | 02 | 03 | 04 | 05 | 06 | 07 | 08 | 09 | 10 | 11 ------------------------------------------------------------------------ DESIGN DAY | 0 | 0 | 0 | 0 | 0 | 0 | 0 | 0 |100 |100 |100 |100 Weekday | 0 | 0 | 0 | 0 | 0 | 0 | 0 | 0 | 50 | 50 | 0 | 0 Saturday | 0 | 0 | 0 | 0 | 0 | 0 | 0 | 0 | 0 | 0 | 0 | 0 Sunday | 0 | 0 | 0 | 0 | 0 | 0 | 0 | 0 | 0 | 0 | 0 | 0 ------------------------------------------------------------------------ Hour -----> | 12 | 13 | 14 | 15 | 16 | 17 | 18 | 19 | 20 | 21 | 22 | 23 ------------------------------------------------------------------------ DESIGN DAY |100 |100 |100 |100 |100 |100 |100 |100 | 20 | 0 | 0 | 0 Weekday | 0 | 0 | 0 | 0 | 50 | 50 | 50 | 0 | 0 | 0 | 0 | 0 Saturday | 0 | 0 | 0 | 0 | 0 | 0 | 0 | 0 | 0 | 0 | 0 | 0 Sunday | 0 | 0 | 0 | 0 | 0 | 0 | 0 | 0 | 0 | 0 | 0 | 0 ************************************************************************ Schedule Name: lighting office1 Hourly Percentages ------------------------------------------------------------------------ Hour -----> | 00 | 01 | 02 | 03 | 04 | 05 | 06 | 07 | 08 | 09 | 10 | 11 ------------------------------------------------------------------------ DESIGN DAY | 0 | 0 | 0 | 0 | 0 | 0 | 0 | 0 | 50 |100 |100 |100 Weekday | 0 | 0 | 0 | 0 | 0 | 0 | 0 | 0 | 50 |100 |100 |100 Saturday | 0 | 0 | 0 | 0 | 0 | 0 | 0 | 0 | 0 | 0 | 0 | 0 Sunday | 0 | 0 | 0 | 0 | 0 | 0 | 0 | 0 | 0 | 0 | 0 | 0 ------------------------------------------------------------------------ Hour -----> | 12 | 13 | 14 | 15 | 16 | 17 | 18 | 19 | 20 | 21 | 22 | 23 ------------------------------------------------------------------------ DESIGN DAY |100 |100 |100 |100 |100 |100 |100 | 50 | 0 | 0 | 0 | 0 Weekday |100 | 50 |100 |100 |100 |100 | 50 | 0 | 0 | 0 | 0 | 0 Saturday | 0 | 0 | 0 | 0 | 0 | 0 | 0 | 0 | 0 | 0 | 0 | 0 Sunday | 0 | 0 | 0 | 0 | 0 | 0 | 0 | 0 | 0 | 0 | 0 | 0 ************************************************************************
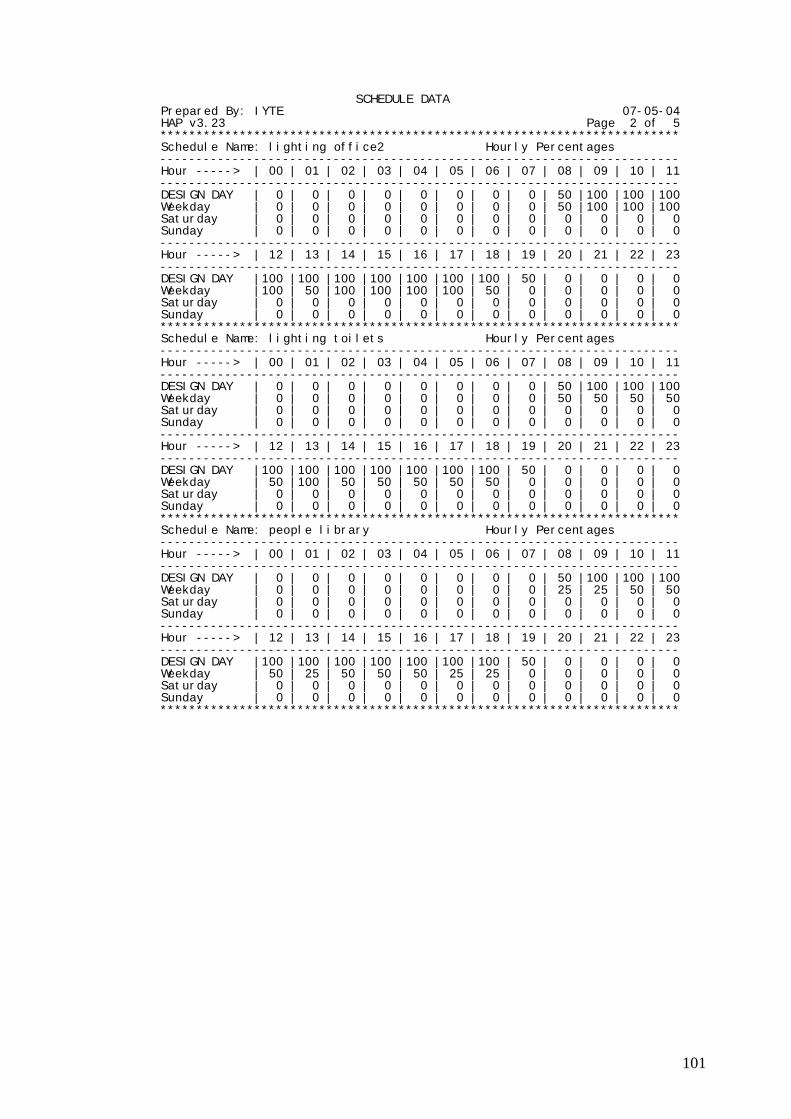
101
SCHEDULE DATA Prepared By: IYTE 07-05-04 HAP v3.23 Page 2 of 5 ************************************************************************ Schedule Name: lighting office2 Hourly Percentages ------------------------------------------------------------------------ Hour -----> | 00 | 01 | 02 | 03 | 04 | 05 | 06 | 07 | 08 | 09 | 10 | 11 ------------------------------------------------------------------------ DESIGN DAY | 0 | 0 | 0 | 0 | 0 | 0 | 0 | 0 | 50 |100 |100 |100 Weekday | 0 | 0 | 0 | 0 | 0 | 0 | 0 | 0 | 50 |100 |100 |100 Saturday | 0 | 0 | 0 | 0 | 0 | 0 | 0 | 0 | 0 | 0 | 0 | 0 Sunday | 0 | 0 | 0 | 0 | 0 | 0 | 0 | 0 | 0 | 0 | 0 | 0 ------------------------------------------------------------------------ Hour -----> | 12 | 13 | 14 | 15 | 16 | 17 | 18 | 19 | 20 | 21 | 22 | 23 ------------------------------------------------------------------------ DESIGN DAY |100 |100 |100 |100 |100 |100 |100 | 50 | 0 | 0 | 0 | 0 Weekday |100 | 50 |100 |100 |100 |100 | 50 | 0 | 0 | 0 | 0 | 0 Saturday | 0 | 0 | 0 | 0 | 0 | 0 | 0 | 0 | 0 | 0 | 0 | 0 Sunday | 0 | 0 | 0 | 0 | 0 | 0 | 0 | 0 | 0 | 0 | 0 | 0 ************************************************************************ Schedule Name: lighting toilets Hourly Percentages ------------------------------------------------------------------------ Hour -----> | 00 | 01 | 02 | 03 | 04 | 05 | 06 | 07 | 08 | 09 | 10 | 11 ------------------------------------------------------------------------ DESIGN DAY | 0 | 0 | 0 | 0 | 0 | 0 | 0 | 0 | 50 |100 |100 |100 Weekday | 0 | 0 | 0 | 0 | 0 | 0 | 0 | 0 | 50 | 50 | 50 | 50 Saturday | 0 | 0 | 0 | 0 | 0 | 0 | 0 | 0 | 0 | 0 | 0 | 0 Sunday | 0 | 0 | 0 | 0 | 0 | 0 | 0 | 0 | 0 | 0 | 0 | 0 ------------------------------------------------------------------------ Hour -----> | 12 | 13 | 14 | 15 | 16 | 17 | 18 | 19 | 20 | 21 | 22 | 23 ------------------------------------------------------------------------ DESIGN DAY |100 |100 |100 |100 |100 |100 |100 | 50 | 0 | 0 | 0 | 0 Weekday | 50 |100 | 50 | 50 | 50 | 50 | 50 | 0 | 0 | 0 | 0 | 0 Saturday | 0 | 0 | 0 | 0 | 0 | 0 | 0 | 0 | 0 | 0 | 0 | 0 Sunday | 0 | 0 | 0 | 0 | 0 | 0 | 0 | 0 | 0 | 0 | 0 | 0 ************************************************************************ Schedule Name: people library Hourly Percentages ------------------------------------------------------------------------ Hour -----> | 00 | 01 | 02 | 03 | 04 | 05 | 06 | 07 | 08 | 09 | 10 | 11 ------------------------------------------------------------------------ DESIGN DAY | 0 | 0 | 0 | 0 | 0 | 0 | 0 | 0 | 50 |100 |100 |100 Weekday | 0 | 0 | 0 | 0 | 0 | 0 | 0 | 0 | 25 | 25 | 50 | 50 Saturday | 0 | 0 | 0 | 0 | 0 | 0 | 0 | 0 | 0 | 0 | 0 | 0 Sunday | 0 | 0 | 0 | 0 | 0 | 0 | 0 | 0 | 0 | 0 | 0 | 0 ------------------------------------------------------------------------ Hour -----> | 12 | 13 | 14 | 15 | 16 | 17 | 18 | 19 | 20 | 21 | 22 | 23 ------------------------------------------------------------------------ DESIGN DAY |100 |100 |100 |100 |100 |100 |100 | 50 | 0 | 0 | 0 | 0 Weekday | 50 | 25 | 50 | 50 | 50 | 25 | 25 | 0 | 0 | 0 | 0 | 0 Saturday | 0 | 0 | 0 | 0 | 0 | 0 | 0 | 0 | 0 | 0 | 0 | 0 Sunday | 0 | 0 | 0 | 0 | 0 | 0 | 0 | 0 | 0 | 0 | 0 | 0 ************************************************************************

102
SCHEDULE DATA Prepared By: IYTE 07-05-04 HAP v3.23 Page 3 of 5 ************************************************************************ Schedule Name: people entrance Hourly Percentages ------------------------------------------------------------------------ Hour -----> | 00 | 01 | 02 | 03 | 04 | 05 | 06 | 07 | 08 | 09 | 10 | 11 ------------------------------------------------------------------------ DESIGN DAY | 0 | 0 | 0 | 0 | 0 | 0 | 0 | 0 | 50 |100 |100 |100 Weekday | 0 | 0 | 0 | 0 | 0 | 0 | 0 | 0 | 25 | 25 | 25 | 25 Saturday | 0 | 0 | 0 | 0 | 0 | 0 | 0 | 0 | 0 | 0 | 0 | 0 Sunday | 0 | 0 | 0 | 0 | 0 | 0 | 0 | 0 | 0 | 0 | 0 | 0 ------------------------------------------------------------------------ Hour -----> | 12 | 13 | 14 | 15 | 16 | 17 | 18 | 19 | 20 | 21 | 22 | 23 ------------------------------------------------------------------------ DESIGN DAY |100 |100 |100 |100 |100 |100 |100 | 50 | 0 | 0 | 0 | 0 Weekday | 25 | 25 | 25 | 25 | 25 | 25 | 25 | 0 | 0 | 0 | 0 | 0 Saturday | 0 | 0 | 0 | 0 | 0 | 0 | 0 | 0 | 0 | 0 | 0 | 0 Sunday | 0 | 0 | 0 | 0 | 0 | 0 | 0 | 0 | 0 | 0 | 0 | 0 ************************************************************************ Schedule Name: people office1 Hourly Percentages ------------------------------------------------------------------------ Hour -----> | 00 | 01 | 02 | 03 | 04 | 05 | 06 | 07 | 08 | 09 | 10 | 11 ------------------------------------------------------------------------ DESIGN DAY | 0 | 0 | 0 | 0 | 0 | 0 | 0 | 0 | 50 |100 |100 |100 Weekday | 0 | 0 | 0 | 0 | 0 | 0 | 0 | 0 | 50 |100 |100 |100 Saturday | 0 | 0 | 0 | 0 | 0 | 0 | 0 | 0 | 0 | 0 | 0 | 0 Sunday | 0 | 0 | 0 | 0 | 0 | 0 | 0 | 0 | 0 | 0 | 0 | 0 ------------------------------------------------------------------------ Hour -----> | 12 | 13 | 14 | 15 | 16 | 17 | 18 | 19 | 20 | 21 | 22 | 23 ------------------------------------------------------------------------ DESIGN DAY |100 |100 |100 |100 |100 |100 | 50 | 0 | 0 | 0 | 0 | 0 Weekday |100 | 25 |100 |100 |100 | 50 | 50 | 0 | 0 | 0 | 0 | 0 Saturday | 0 | 0 | 0 | 0 | 0 | 0 | 0 | 0 | 0 | 0 | 0 | 0 Sunday | 0 | 0 | 0 | 0 | 0 | 0 | 0 | 0 | 0 | 0 | 0 | 0 ************************************************************************ Schedule Name: people office2 Hourly Percentages ------------------------------------------------------------------------ Hour -----> | 00 | 01 | 02 | 03 | 04 | 05 | 06 | 07 | 08 | 09 | 10 | 11 ------------------------------------------------------------------------ DESIGN DAY | 0 | 0 | 0 | 0 | 0 | 0 | 0 | 0 | 50 |100 |100 |100 Weekday | 0 | 0 | 0 | 0 | 0 | 0 | 0 | 0 | 50 |100 |100 |100 Saturday | 0 | 0 | 0 | 0 | 0 | 0 | 0 | 0 | 0 | 0 | 0 | 0 Sunday | 0 | 0 | 0 | 0 | 0 | 0 | 0 | 0 | 0 | 0 | 0 | 0 ------------------------------------------------------------------------ Hour -----> | 12 | 13 | 14 | 15 | 16 | 17 | 18 | 19 | 20 | 21 | 22 | 23 ------------------------------------------------------------------------ DESIGN DAY |100 |100 |100 |100 |100 |100 | 50 | 0 | 0 | 0 | 0 | 0 Weekday |100 | 25 |100 |100 |100 | 50 | 50 | 0 | 0 | 0 | 0 | 0 Saturday | 0 | 0 | 0 | 0 | 0 | 0 | 0 | 0 | 0 | 0 | 0 | 0 Sunday | 0 | 0 | 0 | 0 | 0 | 0 | 0 | 0 | 0 | 0 | 0 | 0 ************************************************************************
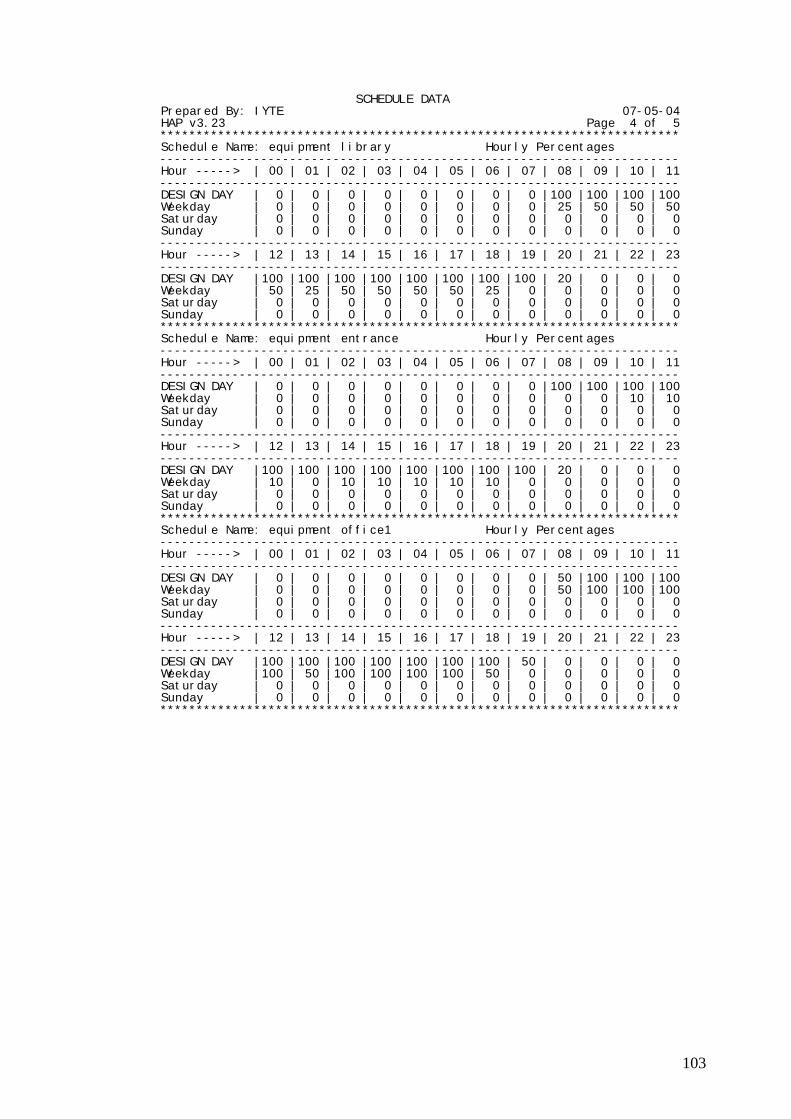
103
SCHEDULE DATA Prepared By: IYTE 07-05-04 HAP v3.23 Page 4 of 5 ************************************************************************ Schedule Name: equipment library Hourly Percentages ------------------------------------------------------------------------ Hour -----> | 00 | 01 | 02 | 03 | 04 | 05 | 06 | 07 | 08 | 09 | 10 | 11 ------------------------------------------------------------------------ DESIGN DAY | 0 | 0 | 0 | 0 | 0 | 0 | 0 | 0 |100 |100 |100 |100 Weekday | 0 | 0 | 0 | 0 | 0 | 0 | 0 | 0 | 25 | 50 | 50 | 50 Saturday | 0 | 0 | 0 | 0 | 0 | 0 | 0 | 0 | 0 | 0 | 0 | 0 Sunday | 0 | 0 | 0 | 0 | 0 | 0 | 0 | 0 | 0 | 0 | 0 | 0 ------------------------------------------------------------------------ Hour -----> | 12 | 13 | 14 | 15 | 16 | 17 | 18 | 19 | 20 | 21 | 22 | 23 ------------------------------------------------------------------------ DESIGN DAY |100 |100 |100 |100 |100 |100 |100 |100 | 20 | 0 | 0 | 0 Weekday | 50 | 25 | 50 | 50 | 50 | 50 | 25 | 0 | 0 | 0 | 0 | 0 Saturday | 0 | 0 | 0 | 0 | 0 | 0 | 0 | 0 | 0 | 0 | 0 | 0 Sunday | 0 | 0 | 0 | 0 | 0 | 0 | 0 | 0 | 0 | 0 | 0 | 0 ************************************************************************ Schedule Name: equipment entrance Hourly Percentages ------------------------------------------------------------------------ Hour -----> | 00 | 01 | 02 | 03 | 04 | 05 | 06 | 07 | 08 | 09 | 10 | 11 ------------------------------------------------------------------------ DESIGN DAY | 0 | 0 | 0 | 0 | 0 | 0 | 0 | 0 |100 |100 |100 |100 Weekday | 0 | 0 | 0 | 0 | 0 | 0 | 0 | 0 | 0 | 0 | 10 | 10 Saturday | 0 | 0 | 0 | 0 | 0 | 0 | 0 | 0 | 0 | 0 | 0 | 0 Sunday | 0 | 0 | 0 | 0 | 0 | 0 | 0 | 0 | 0 | 0 | 0 | 0 ------------------------------------------------------------------------ Hour -----> | 12 | 13 | 14 | 15 | 16 | 17 | 18 | 19 | 20 | 21 | 22 | 23 ------------------------------------------------------------------------ DESIGN DAY |100 |100 |100 |100 |100 |100 |100 |100 | 20 | 0 | 0 | 0 Weekday | 10 | 0 | 10 | 10 | 10 | 10 | 10 | 0 | 0 | 0 | 0 | 0 Saturday | 0 | 0 | 0 | 0 | 0 | 0 | 0 | 0 | 0 | 0 | 0 | 0 Sunday | 0 | 0 | 0 | 0 | 0 | 0 | 0 | 0 | 0 | 0 | 0 | 0 ************************************************************************ Schedule Name: equipment office1 Hourly Percentages ------------------------------------------------------------------------ Hour -----> | 00 | 01 | 02 | 03 | 04 | 05 | 06 | 07 | 08 | 09 | 10 | 11 ------------------------------------------------------------------------ DESIGN DAY | 0 | 0 | 0 | 0 | 0 | 0 | 0 | 0 | 50 |100 |100 |100 Weekday | 0 | 0 | 0 | 0 | 0 | 0 | 0 | 0 | 50 |100 |100 |100 Saturday | 0 | 0 | 0 | 0 | 0 | 0 | 0 | 0 | 0 | 0 | 0 | 0 Sunday | 0 | 0 | 0 | 0 | 0 | 0 | 0 | 0 | 0 | 0 | 0 | 0 ------------------------------------------------------------------------ Hour -----> | 12 | 13 | 14 | 15 | 16 | 17 | 18 | 19 | 20 | 21 | 22 | 23 ------------------------------------------------------------------------ DESIGN DAY |100 |100 |100 |100 |100 |100 |100 | 50 | 0 | 0 | 0 | 0 Weekday |100 | 50 |100 |100 |100 |100 | 50 | 0 | 0 | 0 | 0 | 0 Saturday | 0 | 0 | 0 | 0 | 0 | 0 | 0 | 0 | 0 | 0 | 0 | 0 Sunday | 0 | 0 | 0 | 0 | 0 | 0 | 0 | 0 | 0 | 0 | 0 | 0 ************************************************************************

104
SCHEDULE DATA Prepared By: IYTE 07-05-04 HAP v3.23 Page 5 of 5 ************************************************************************ Schedule Name: equipment office2 Hourly Percentages ------------------------------------------------------------------------ Hour -----> | 00 | 01 | 02 | 03 | 04 | 05 | 06 | 07 | 08 | 09 | 10 | 11 ------------------------------------------------------------------------ DESIGN DAY | 0 | 0 | 0 | 0 | 0 | 0 | 0 | 0 | 50 |100 |100 |100 Weekday | 0 | 0 | 0 | 0 | 0 | 0 | 0 | 0 | 50 |100 |100 |100 Saturday | 0 | 0 | 0 | 0 | 0 | 0 | 0 | 0 | 0 | 0 | 0 | 0 Sunday | 0 | 0 | 0 | 0 | 0 | 0 | 0 | 0 | 0 | 0 | 0 | 0 ------------------------------------------------------------------------ Hour -----> | 12 | 13 | 14 | 15 | 16 | 17 | 18 | 19 | 20 | 21 | 22 | 23 ------------------------------------------------------------------------ DESIGN DAY |100 |100 |100 |100 |100 |100 |100 | 50 | 0 | 0 | 0 | 0 Weekday |100 | 50 |100 |100 |100 |100 | 50 | 0 | 0 | 0 | 0 | 0 Saturday | 0 | 0 | 0 | 0 | 0 | 0 | 0 | 0 | 0 | 0 | 0 | 0 Sunday | 0 | 0 | 0 | 0 | 0 | 0 | 0 | 0 | 0 | 0 | 0 | 0 ************************************************************************
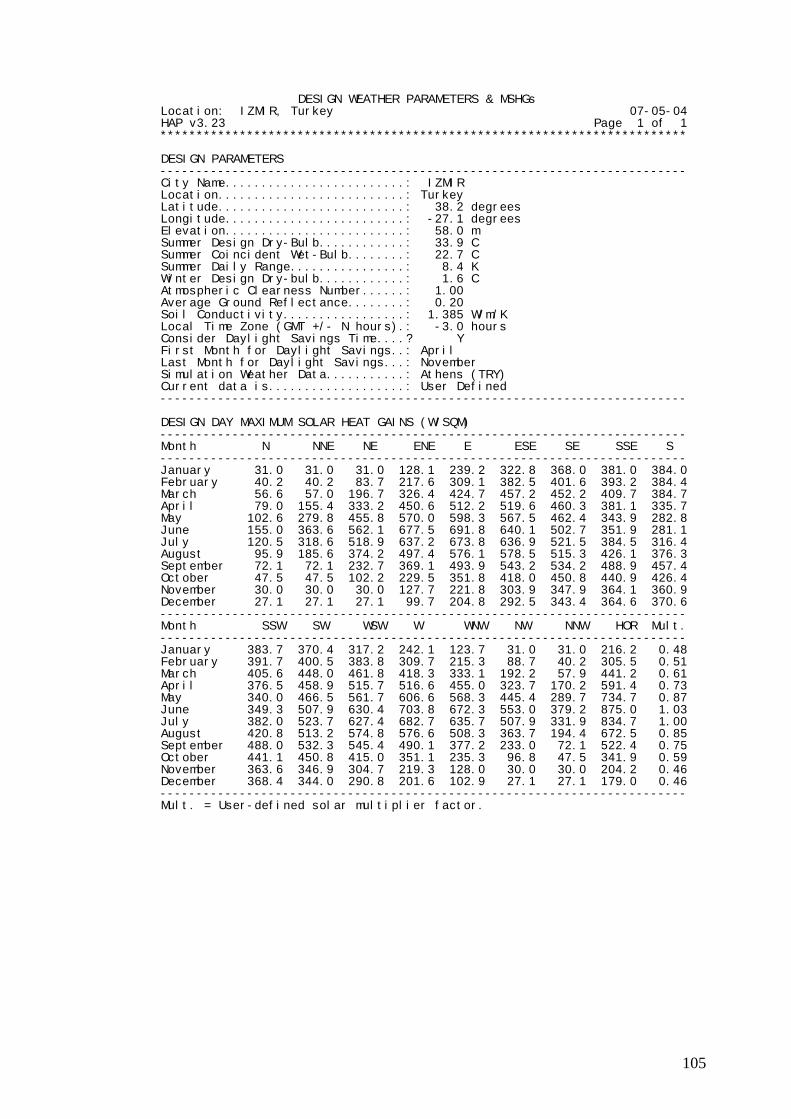
105
DESIGN WEATHER PARAMETERS & MSHGs Location: IZMIR, Turkey 07-05-04 HAP v3.23 Page 1 of 1 ************************************************************************* DESIGN PARAMETERS ------------------------------------------------------------------------- City Name.........................: IZMIR Location..........................: Turkey Latitude..........................: 38.2 degrees Longitude.........................: -27.1 degrees Elevation.........................: 58.0 m Summer Design Dry-Bulb............: 33.9 C Summer Coincident Wet-Bulb........: 22.7 C Summer Daily Range................: 8.4 K Winter Design Dry-bulb............: 1.6 C Atmospheric Clearness Number......: 1.00 Average Ground Reflectance........: 0.20 Soil Conductivity.................: 1.385 W/m/K Local Time Zone (GMT +/- N hours).: -3.0 hours Consider Daylight Savings Time....? Y First Month for Daylight Savings..: April Last Month for Daylight Savings...: November Simulation Weather Data...........: Athens (TRY) Current data is...................: User Defined ------------------------------------------------------------------------- DESIGN DAY MAXIMUM SOLAR HEAT GAINS (W/SQM) ------------------------------------------------------------------------- Month N NNE NE ENE E ESE SE SSE S ------------------------------------------------------------------------- January 31.0 31.0 31.0 128.1 239.2 322.8 368.0 381.0 384.0 February 40.2 40.2 83.7 217.6 309.1 382.5 401.6 393.2 384.4 March 56.6 57.0 196.7 326.4 424.7 457.2 452.2 409.7 384.7 April 79.0 155.4 333.2 450.6 512.2 519.6 460.3 381.1 335.7 May 102.6 279.8 455.8 570.0 598.3 567.5 462.4 343.9 282.8 June 155.0 363.6 562.1 677.5 691.8 640.1 502.7 351.9 281.1 July 120.5 318.6 518.9 637.2 673.8 636.9 521.5 384.5 316.4 August 95.9 185.6 374.2 497.4 576.1 578.5 515.3 426.1 376.3 September 72.1 72.1 232.7 369.1 493.9 543.2 534.2 488.9 457.4 October 47.5 47.5 102.2 229.5 351.8 418.0 450.8 440.9 426.4 November 30.0 30.0 30.0 127.7 221.8 303.9 347.9 364.1 360.9 December 27.1 27.1 27.1 99.7 204.8 292.5 343.4 364.6 370.6 ------------------------------------------------------------------------- Month SSW SW WSW W WNW NW NNW HOR Mult. ------------------------------------------------------------------------- January 383.7 370.4 317.2 242.1 123.7 31.0 31.0 216.2 0.48 February 391.7 400.5 383.8 309.7 215.3 88.7 40.2 305.5 0.51 March 405.6 448.0 461.8 418.3 333.1 192.2 57.9 441.2 0.61 April 376.5 458.9 515.7 516.6 455.0 323.7 170.2 591.4 0.73 May 340.0 466.5 561.7 606.6 568.3 445.4 289.7 734.7 0.87 June 349.3 507.9 630.4 703.8 672.3 553.0 379.2 875.0 1.03 July 382.0 523.7 627.4 682.7 635.7 507.9 331.9 834.7 1.00 August 420.8 513.2 574.8 576.6 508.3 363.7 194.4 672.5 0.85 September 488.0 532.3 545.4 490.1 377.2 233.0 72.1 522.4 0.75 October 441.1 450.8 415.0 351.1 235.3 96.8 47.5 341.9 0.59 November 363.6 346.9 304.7 219.3 128.0 30.0 30.0 204.2 0.46 December 368.4 344.0 290.8 201.6 102.9 27.1 27.1 179.0 0.46 ------------------------------------------------------------------------- Mult. = User-defined solar multiplier factor.

106
COOLING DESIGN TEMPERATURE PROFILES Location: IZMIR, Turkey 07-05-04 HAP v3.23 Page 1 of 1 **************************************************************************** ( Format is Dry-Bulb/Wet-Bulb C ) ---- ----------- ----------- ----------- ----------- ----------- ----------- Hr January February March April May June ---- ----------- ----------- ----------- ----------- ----------- ----------- 0000 7.6/ 5.5 7.8/ 5.5 9.8/ 7.3 13.6/ 10.2 18.0/ 13.8 22.7/ 16.8 0100 7.5/ 5.4 7.5/ 5.3 9.3/ 6.9 13.2/ 9.9 17.3/ 13.3 21.9/ 16.2 0200 7.3/ 5.3 7.3/ 5.2 9.1/ 6.7 12.9/ 9.7 16.9/ 12.9 21.5/ 15.9 0300 7.2/ 5.3 7.2/ 5.0 8.9/ 6.6 12.6/ 9.6 16.6/ 12.7 21.0/ 15.6 0400 7.0/ 5.2 7.0/ 5.0 8.7/ 6.5 12.4/ 9.5 16.2/ 12.5 20.6/ 15.4 0500 6.9/ 5.1 6.9/ 4.9 8.5/ 6.5 12.1/ 9.3 16.0/ 12.4 20.4/ 15.4 0600 6.9/ 5.1 6.8/ 4.8 8.3/ 6.4 12.1/ 9.4 16.3/ 12.9 20.9/ 16.0 0700 6.8/ 5.0 6.8/ 4.8 8.5/ 6.6 13.1/ 10.4 18.0/ 14.6 22.9/ 18.1 0800 6.9/ 5.1 7.1/ 5.1 9.4/ 7.4 14.3/ 11.6 19.3/ 15.9 24.1/ 19.3 0900 7.7/ 5.6 8.1/ 5.7 10.7/ 8.2 15.6/ 12.3 20.6/ 16.5 25.6/ 19.8 1000 8.7/ 6.3 9.2/ 6.5 11.9/ 8.9 16.8/ 12.8 21.9/ 16.9 26.9/ 20.2 1100 9.7/ 6.9 10.2/ 7.1 13.0/ 9.4 18.0/ 13.2 23.0/ 17.2 28.1/ 20.4 1200 10.4/ 7.3 10.9/ 7.5 13.9/ 9.7 18.8/ 13.3 23.9/ 17.2 28.9/ 20.3 1300 10.9/ 7.6 11.5/ 7.7 14.6/ 10.0 19.5/ 13.3 24.4/ 16.9 29.5/ 19.9 1400 11.3/ 7.9 12.0/ 8.2 15.1/ 10.3 19.9/ 13.7 24.7/ 17.2 29.9/ 20.3 1500 11.3/ 7.9 12.0/ 8.2 15.0/ 10.4 19.7/ 13.5 24.6/ 17.1 29.7/ 20.1 1600 11.0/ 7.9 11.8/ 8.2 14.7/ 10.5 19.3/ 13.7 24.2/ 17.3 29.3/ 20.4 1700 10.2/ 7.3 11.1/ 7.8 14.1/ 10.2 18.7/ 13.5 23.6/ 17.2 28.6/ 20.4 1800 9.5/ 6.8 10.2/ 7.2 13.1/ 9.6 17.7/ 13.0 22.5/ 16.7 27.6/ 20.0 1900 9.0/ 6.6 9.5/ 6.8 12.2/ 9.0 16.6/ 12.5 21.4/ 16.1 26.4/ 19.5 2000 8.7/ 6.5 9.1/ 6.7 11.6/ 8.8 15.9/ 12.2 20.6/ 15.9 25.5/ 19.2 2100 8.4/ 6.2 8.7/ 6.3 11.1/ 8.3 15.1/ 11.5 19.8/ 15.1 24.6/ 18.3 2200 8.0/ 5.9 8.3/ 5.9 10.6/ 7.8 14.5/ 10.9 19.1/ 14.4 24.0/ 17.7 2300 7.8/ 5.7 8.1/ 5.7 10.2/ 7.5 14.0/ 10.5 18.5/ 14.1 23.3/ 17.2 ---- ----------- ----------- ----------- ----------- ----------- ----------- Hr July August September October November December ---- ----------- ----------- ----------- ----------- ----------- ----------- 0000 25.2/ 18.6 24.9/ 18.7 21.3/ 15.6 16.8/ 13.3 11.9/ 9.1 9.1/ 6.8 0100 24.5/ 18.1 24.4/ 18.4 20.8/ 15.5 16.6/ 13.2 11.9/ 9.1 9.0/ 6.7 0200 24.0/ 17.9 23.9/ 18.2 20.4/ 15.4 16.3/ 13.0 11.7/ 9.0 8.9/ 6.7 0300 23.5/ 17.6 23.4/ 17.9 20.0/ 15.3 16.0/ 12.9 11.6/ 8.8 8.8/ 6.6 0400 23.1/ 17.5 23.0/ 17.8 19.6/ 15.3 15.8/ 12.8 11.4/ 8.7 8.7/ 6.5 0500 22.7/ 17.3 22.7/ 17.7 19.3/ 15.3 15.5/ 12.7 11.3/ 8.6 8.6/ 6.5 0600 22.9/ 17.7 22.6/ 17.9 19.2/ 15.5 15.4/ 12.7 11.1/ 8.6 8.4/ 6.4 0700 24.5/ 19.4 23.7/ 19.0 19.9/ 16.2 15.6/ 12.9 11.1/ 8.5 8.4/ 6.4 0800 25.6/ 20.5 25.0/ 20.3 21.5/ 17.8 16.9/ 14.2 11.7/ 9.2 8.5/ 6.5 0900 27.2/ 21.1 26.6/ 20.9 23.3/ 18.6 18.6/ 15.1 12.9/ 9.8 9.4/ 7.0 1000 28.7/ 21.7 28.1/ 21.5 24.8/ 19.1 19.9/ 15.7 14.1/ 10.5 10.4/ 7.7 1100 30.0/ 22.0 29.5/ 21.9 26.3/ 19.6 21.2/ 16.1 15.1/ 11.0 11.3/ 8.2 1200 30.9/ 21.9 30.5/ 21.9 27.3/ 19.7 22.1/ 16.3 15.8/ 11.2 11.9/ 8.5 1300 31.5/ 21.5 31.1/ 21.6 28.0/ 19.4 22.8/ 16.3 16.4/ 11.3 12.5/ 8.7 1400 31.8/ 21.9 31.5/ 21.9 28.3/ 19.7 23.1/ 16.5 16.7/ 11.6 12.7/ 9.0 1500 31.7/ 21.8 31.4/ 21.8 28.1/ 19.4 22.9/ 16.3 16.5/ 11.4 12.6/ 8.8 1600 31.4/ 22.1 31.0/ 22.0 27.5/ 19.3 22.2/ 16.2 16.0/ 11.3 12.1/ 8.6 1700 30.8/ 22.0 30.3/ 21.9 26.5/ 18.8 21.1/ 15.6 14.9/ 10.7 11.3/ 8.1 1800 29.9/ 21.6 29.2/ 21.3 25.2/ 18.0 20.1/ 15.1 14.1/ 10.3 10.7/ 7.7 1900 28.7/ 21.0 28.1/ 20.7 24.2/ 17.4 19.2/ 14.9 13.5/ 10.1 10.3/ 7.5 2000 27.8/ 20.7 27.3/ 20.5 23.6/ 17.3 18.7/ 14.8 13.1/ 10.1 10.0/ 7.5 2100 27.0/ 19.9 26.7/ 19.8 22.9/ 16.6 18.2/ 14.3 12.8/ 9.8 9.8/ 7.3 2200 26.4/ 19.3 26.0/ 19.2 22.3/ 16.0 17.6/ 13.7 12.3/ 9.3 9.5/ 7.0 2300 25.8/ 18.9 25.5/ 18.9 21.8/ 15.8 17.2/ 13.5 12.1/ 9.2 9.3/ 6.9

107
AIR SYSTEM INPUT DATA Name: AIR SYSTEM 03-06-04 Type: VARIABLE VOLUME - VAV HAP v3.23 Prepared by: IYTE Page 1 ************************************************************************* 1. SYSTEM NAME AND TYPE ------------------------------------------------------------------------- Name............: AIR SYSTEM Type............: VARIABLE VOLUME - VAV Number of Zones.: 1 ========================================================================= 2. SYSTEM DESCRIPTION ------------------------------------------------------------------------- COOLING SYSTEM DATA Supply Air....................: 12.8 C Coil Bypass Factor............: 0.100 Supply Air Reset..............: Outdoor Air Maximum Reset Temperature.....: 18.3 C OA Temp For Min Supply........: 35.0 C OA Temp For Max Supply........: -1.1 C OUTDOOR VENTILATION DATA Type of Control...............: Proportional to Supply Air Design Ventilation Airflow....: 20 % Minimum Ventilation Rate......: 0 % Dampers Open During Unocc Per.: Y SUPPLY DUCT DATA Duct Heat Gain................: 0 % Duct Leakage Rate.............: 0 % RETURN PLENUM DATA Is a Return Plenum Used.......? N SUPPLY FAN DATA Fan Type......................: FC w/ Variable Speed Drive Configuration.................: Draw-Thru Fan kW........................: 0.0 kW RETURN FAN DATA Fan Type......................: None OUTDOOR AIR ECONOMIZER Outdoor Economizer Type.......: None PREHEAT COIL Preheat Coil Used.............? N PRECOOL COIL Precool Coil Used.............? N HUMIDIFICATION Humidification System Used....? N DEHUMIDIFICATION Dehumidification System Used..? N VENTILATION HEAT RECLAIM Reclaim Unit Type.............: None SAFETY FACTORS Sensible Cooling Factor.......: 0 % Latent Cooling Factor.........: 0 % Heating Factor................: 0 % =========================================================================
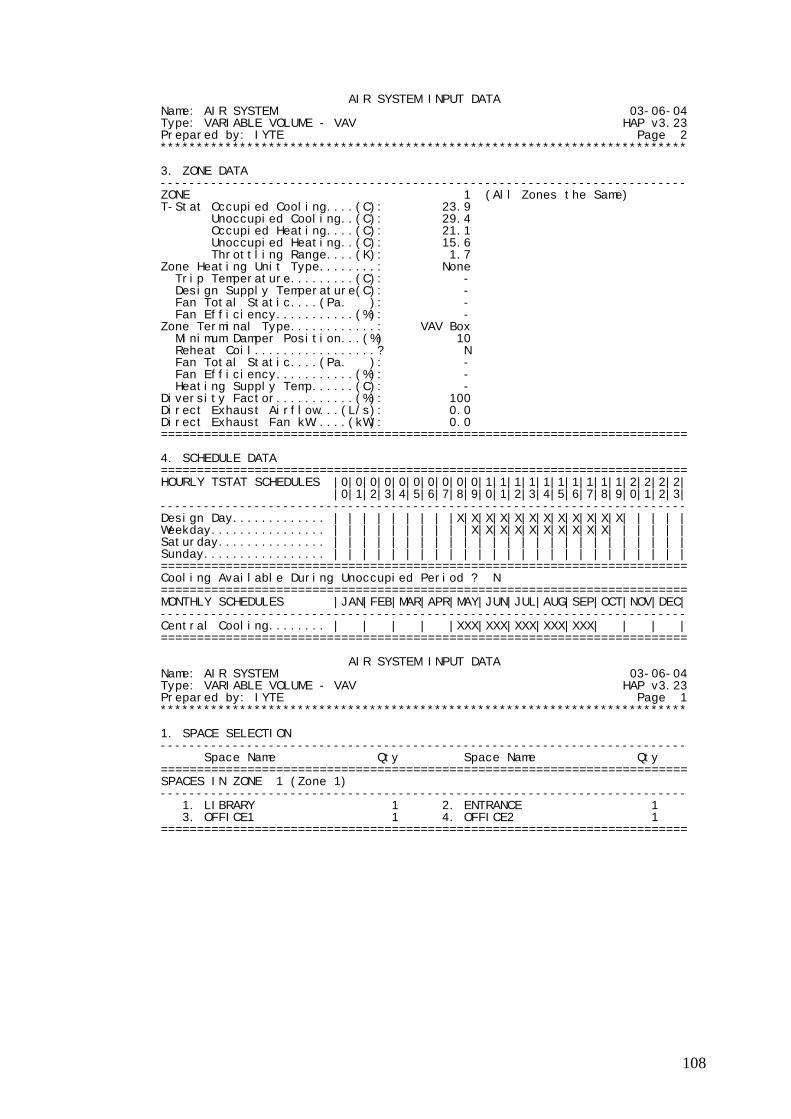
108
AIR SYSTEM INPUT DATA Name: AIR SYSTEM 03-06-04 Type: VARIABLE VOLUME - VAV HAP v3.23 Prepared by: IYTE Page 2 ************************************************************************* 3. ZONE DATA ------------------------------------------------------------------------- ZONE 1 (All Zones the Same) T-Stat Occupied Cooling....(C): 23.9 Unoccupied Cooling..(C): 29.4 Occupied Heating....(C): 21.1 Unoccupied Heating..(C): 15.6 Throttling Range....(K): 1.7 Zone Heating Unit Type........: None Trip Temperature.........(C): - Design Supply Temperature(C): - Fan Total Static....(Pa. ): - Fan Efficiency...........(%): - Zone Terminal Type............: VAV Box Minimum Damper Position...(%) 10 Reheat Coil.................? N Fan Total Static....(Pa. ): - Fan Efficiency...........(%): - Heating Supply Temp......(C): - Diversity Factor...........(%): 100 Direct Exhaust Airflow...(L/s): 0.0 Direct Exhaust Fan kW.....(kW): 0.0 ========================================================================= 4. SCHEDULE DATA ========================================================================= HOURLY TSTAT SCHEDULES |0|0|0|0|0|0|0|0|0|0|1|1|1|1|1|1|1|1|1|1|2|2|2|2| |0|1|2|3|4|5|6|7|8|9|0|1|2|3|4|5|6|7|8|9|0|1|2|3| ------------------------------------------------------------------------- Design Day............. | | | | | | | | |X|X|X|X|X|X|X|X|X|X|X|X| | | | | Weekday................ | | | | | | | | | |X|X|X|X|X|X|X|X|X|X| | | | | | Saturday............... | | | | | | | | | | | | | | | | | | | | | | | | | Sunday................. | | | | | | | | | | | | | | | | | | | | | | | | | ========================================================================= Cooling Available During Unoccupied Period ? N ========================================================================= MONTHLY SCHEDULES |JAN|FEB|MAR|APR|MAY|JUN|JUL|AUG|SEP|OCT|NOV|DEC| ------------------------------------------------------------------------- Central Cooling........ | | | | |XXX|XXX|XXX|XXX|XXX| | | | ========================================================================= AIR SYSTEM INPUT DATA Name: AIR SYSTEM 03-06-04 Type: VARIABLE VOLUME - VAV HAP v3.23 Prepared by: IYTE Page 1 ************************************************************************* 1. SPACE SELECTION ------------------------------------------------------------------------- Space Name Qty Space Name Qty ========================================================================= SPACES IN ZONE 1 (Zone 1) ------------------------------------------------------------------------- 1. LIBRARY 1 2. ENTRANCE 1 3. OFFICE1 1 4. OFFICE2 1 =========================================================================
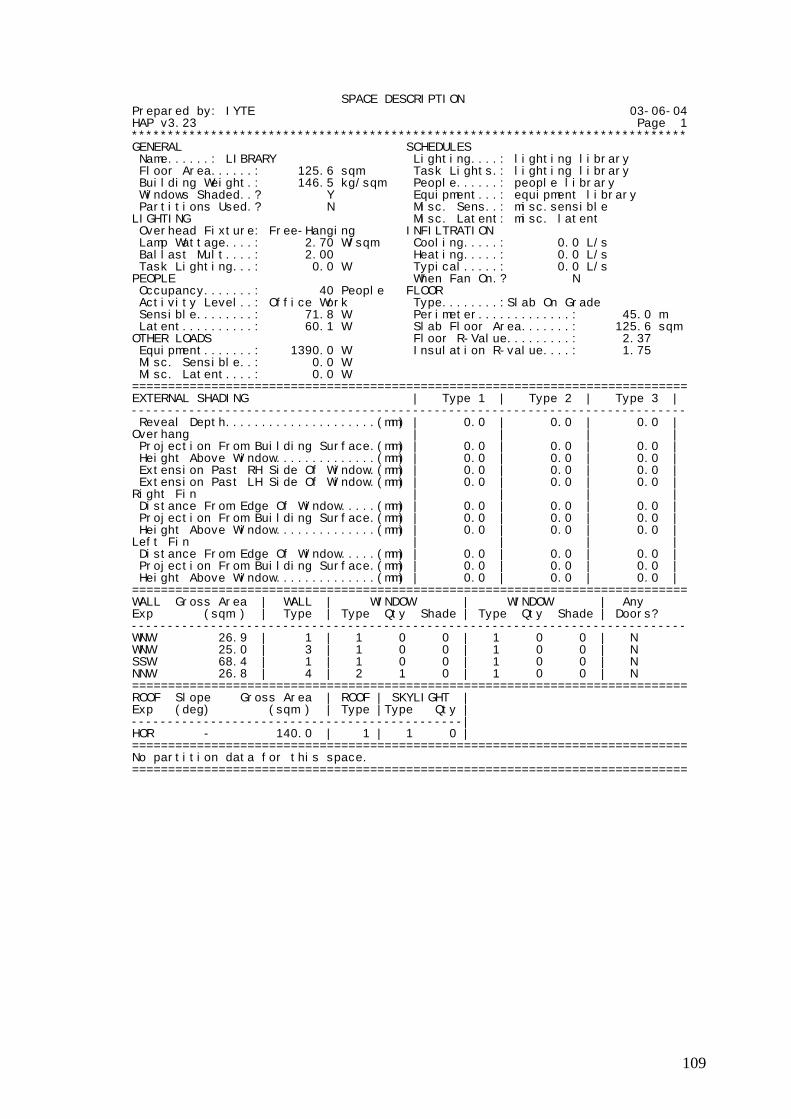
109
SPACE DESCRIPTION Prepared by: IYTE 03-06-04 HAP v3.23 Page 1 ***************************************************************************** GENERAL SCHEDULES Name......: LIBRARY Lighting....: lighting library Floor Area......: 125.6 sqm Task Lights.: lighting library Building Weight.: 146.5 kg/sqm People......: people library Windows Shaded..? Y Equipment...: equipment library Partitions Used.? N Misc. Sens..: misc.sensible LIGHTING Misc. Latent: misc. latent Overhead Fixture: Free-Hanging INFILTRATION Lamp Wattage....: 2.70 W/sqm Cooling.....: 0.0 L/s Ballast Mult....: 2.00 Heating.....: 0.0 L/s Task Lighting...: 0.0 W Typical.....: 0.0 L/s PEOPLE When Fan On.? N Occupancy.......: 40 People FLOOR Activity Level..: Office Work Type........:Slab On Grade Sensible........: 71.8 W Perimeter.............: 45.0 m Latent..........: 60.1 W Slab Floor Area.......: 125.6 sqm OTHER LOADS Floor R-Value.........: 2.37 Equipment.......: 1390.0 W Insulation R-value....: 1.75 Misc. Sensible..: 0.0 W Misc. Latent....: 0.0 W ============================================================================= EXTERNAL SHADING | Type 1 | Type 2 | Type 3 | ----------------------------------------------------------------------------- Reveal Depth.....................(mm) | 0.0 | 0.0 | 0.0 | Overhang | | | | Projection From Building Surface.(mm) | 0.0 | 0.0 | 0.0 | Height Above Window..............(mm) | 0.0 | 0.0 | 0.0 | Extension Past RH Side Of Window.(mm) | 0.0 | 0.0 | 0.0 | Extension Past LH Side Of Window.(mm) | 0.0 | 0.0 | 0.0 | Right Fin | | | | Distance From Edge Of Window.....(mm) | 0.0 | 0.0 | 0.0 | Projection From Building Surface.(mm) | 0.0 | 0.0 | 0.0 | Height Above Window..............(mm) | 0.0 | 0.0 | 0.0 | Left Fin | | | | Distance From Edge Of Window.....(mm) | 0.0 | 0.0 | 0.0 | Projection From Building Surface.(mm) | 0.0 | 0.0 | 0.0 | Height Above Window..............(mm) | 0.0 | 0.0 | 0.0 | ============================================================================= WALL Gross Area | WALL | WINDOW | WINDOW | Any Exp (sqm ) | Type | Type Qty Shade | Type Qty Shade | Doors? ----------------------------------------------------------------------------- WNW 26.9 | 1 | 1 0 0 | 1 0 0 | N WNW 25.0 | 3 | 1 0 0 | 1 0 0 | N SSW 68.4 | 1 | 1 0 0 | 1 0 0 | N NNW 26.8 | 4 | 2 1 0 | 1 0 0 | N ============================================================================= ROOF Slope Gross Area | ROOF | SKYLIGHT | Exp (deg) (sqm ) | Type |Type Qty | ----------------------------------------------| HOR - 140.0 | 1 | 1 0 | ============================================================================= No partition data for this space. =============================================================================
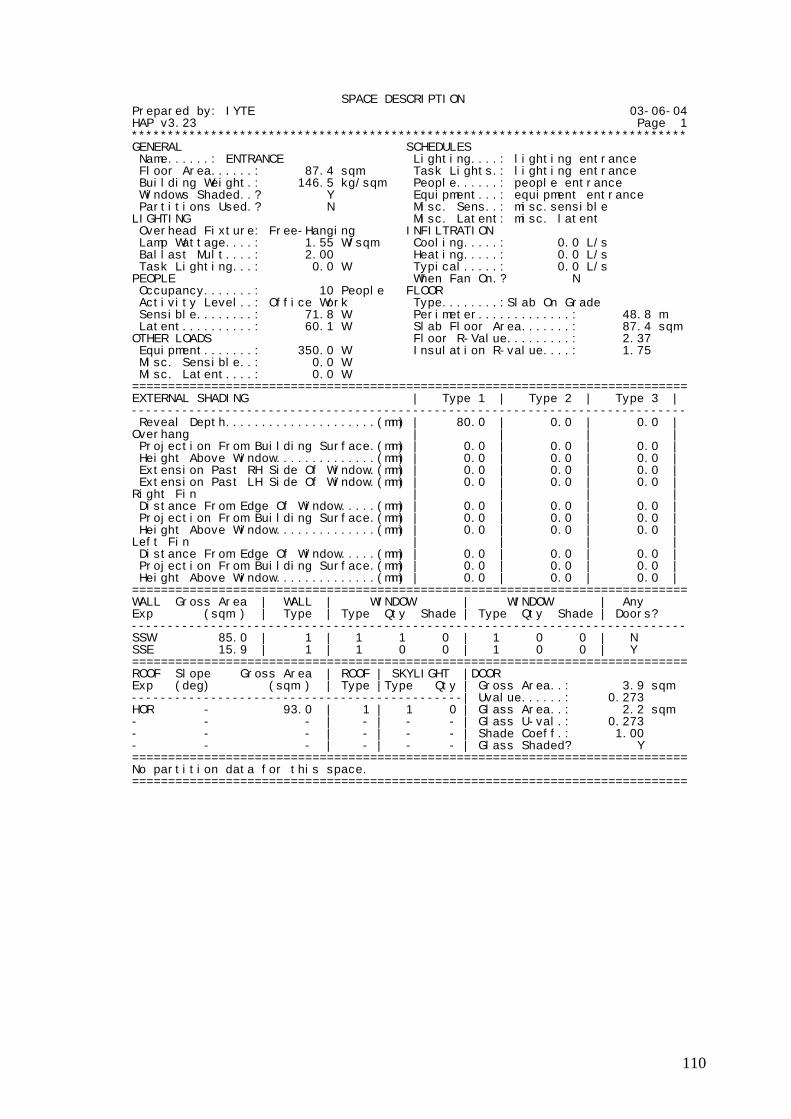
110
SPACE DESCRIPTION Prepared by: IYTE 03-06-04 HAP v3.23 Page 1 ***************************************************************************** GENERAL SCHEDULES Name......: ENTRANCE Lighting....: lighting entrance Floor Area......: 87.4 sqm Task Lights.: lighting entrance Building Weight.: 146.5 kg/sqm People......: people entrance Windows Shaded..? Y Equipment...: equipment entrance Partitions Used.? N Misc. Sens..: misc.sensible LIGHTING Misc. Latent: misc. latent Overhead Fixture: Free-Hanging INFILTRATION Lamp Wattage....: 1.55 W/sqm Cooling.....: 0.0 L/s Ballast Mult....: 2.00 Heating.....: 0.0 L/s Task Lighting...: 0.0 W Typical.....: 0.0 L/s PEOPLE When Fan On.? N Occupancy.......: 10 People FLOOR Activity Level..: Office Work Type........:Slab On Grade Sensible........: 71.8 W Perimeter.............: 48.8 m Latent..........: 60.1 W Slab Floor Area.......: 87.4 sqm OTHER LOADS Floor R-Value.........: 2.37 Equipment.......: 350.0 W Insulation R-value....: 1.75 Misc. Sensible..: 0.0 W Misc. Latent....: 0.0 W ============================================================================= EXTERNAL SHADING | Type 1 | Type 2 | Type 3 | ----------------------------------------------------------------------------- Reveal Depth.....................(mm) | 80.0 | 0.0 | 0.0 | Overhang | | | | Projection From Building Surface.(mm) | 0.0 | 0.0 | 0.0 | Height Above Window..............(mm) | 0.0 | 0.0 | 0.0 | Extension Past RH Side Of Window.(mm) | 0.0 | 0.0 | 0.0 | Extension Past LH Side Of Window.(mm) | 0.0 | 0.0 | 0.0 | Right Fin | | | | Distance From Edge Of Window.....(mm) | 0.0 | 0.0 | 0.0 | Projection From Building Surface.(mm) | 0.0 | 0.0 | 0.0 | Height Above Window..............(mm) | 0.0 | 0.0 | 0.0 | Left Fin | | | | Distance From Edge Of Window.....(mm) | 0.0 | 0.0 | 0.0 | Projection From Building Surface.(mm) | 0.0 | 0.0 | 0.0 | Height Above Window..............(mm) | 0.0 | 0.0 | 0.0 | ============================================================================= WALL Gross Area | WALL | WINDOW | WINDOW | Any Exp (sqm ) | Type | Type Qty Shade | Type Qty Shade | Doors? ----------------------------------------------------------------------------- SSW 85.0 | 1 | 1 1 0 | 1 0 0 | N SSE 15.9 | 1 | 1 0 0 | 1 0 0 | Y ============================================================================= ROOF Slope Gross Area | ROOF | SKYLIGHT |DOOR Exp (deg) (sqm ) | Type |Type Qty | Gross Area..: 3.9 sqm ----------------------------------------------| Uvalue......: 0.273 HOR - 93.0 | 1 | 1 0 | Glass Area..: 2.2 sqm - - - | - | - - | Glass U-val.: 0.273 - - - | - | - - | Shade Coeff.: 1.00 - - - | - | - - | Glass Shaded? Y ============================================================================= No partition data for this space. =============================================================================
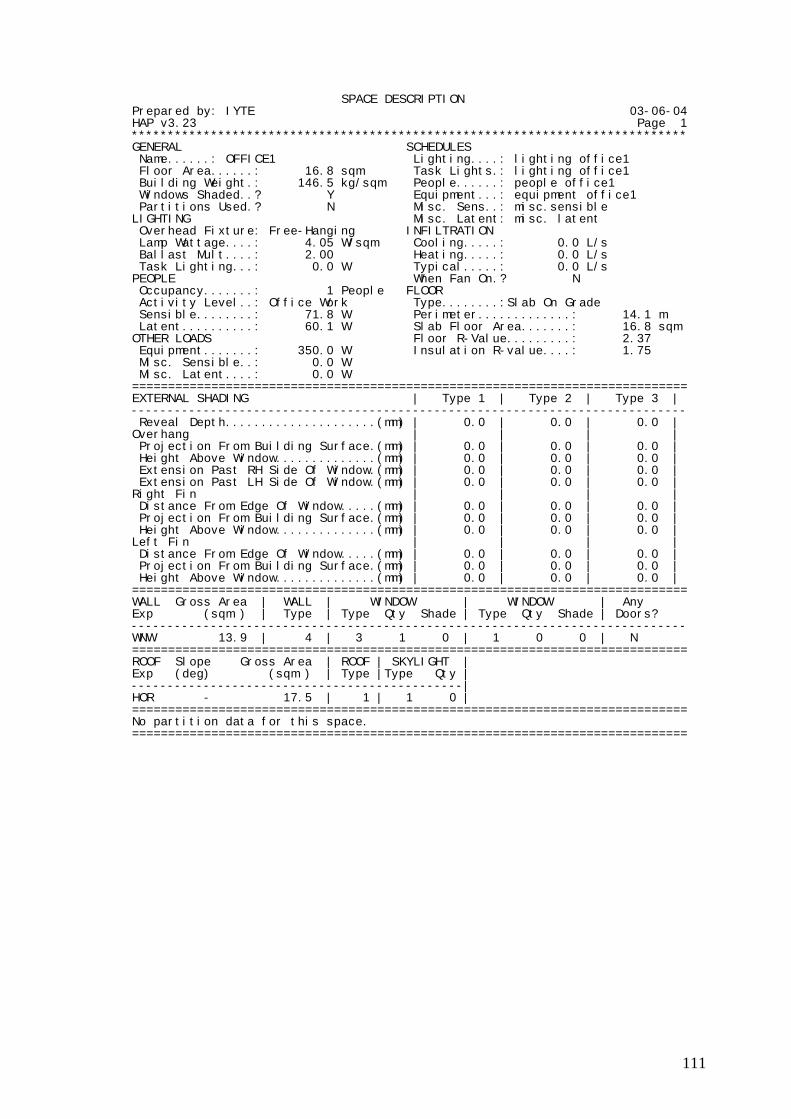
111
SPACE DESCRIPTION Prepared by: IYTE 03-06-04 HAP v3.23 Page 1 ***************************************************************************** GENERAL SCHEDULES Name......: OFFICE1 Lighting....: lighting office1 Floor Area......: 16.8 sqm Task Lights.: lighting office1 Building Weight.: 146.5 kg/sqm People......: people office1 Windows Shaded..? Y Equipment...: equipment office1 Partitions Used.? N Misc. Sens..: misc.sensible LIGHTING Misc. Latent: misc. latent Overhead Fixture: Free-Hanging INFILTRATION Lamp Wattage....: 4.05 W/sqm Cooling.....: 0.0 L/s Ballast Mult....: 2.00 Heating.....: 0.0 L/s Task Lighting...: 0.0 W Typical.....: 0.0 L/s PEOPLE When Fan On.? N Occupancy.......: 1 People FLOOR Activity Level..: Office Work Type........:Slab On Grade Sensible........: 71.8 W Perimeter.............: 14.1 m Latent..........: 60.1 W Slab Floor Area.......: 16.8 sqm OTHER LOADS Floor R-Value.........: 2.37 Equipment.......: 350.0 W Insulation R-value....: 1.75 Misc. Sensible..: 0.0 W Misc. Latent....: 0.0 W ============================================================================= EXTERNAL SHADING | Type 1 | Type 2 | Type 3 | ----------------------------------------------------------------------------- Reveal Depth.....................(mm) | 0.0 | 0.0 | 0.0 | Overhang | | | | Projection From Building Surface.(mm) | 0.0 | 0.0 | 0.0 | Height Above Window..............(mm) | 0.0 | 0.0 | 0.0 | Extension Past RH Side Of Window.(mm) | 0.0 | 0.0 | 0.0 | Extension Past LH Side Of Window.(mm) | 0.0 | 0.0 | 0.0 | Right Fin | | | | Distance From Edge Of Window.....(mm) | 0.0 | 0.0 | 0.0 | Projection From Building Surface.(mm) | 0.0 | 0.0 | 0.0 | Height Above Window..............(mm) | 0.0 | 0.0 | 0.0 | Left Fin | | | | Distance From Edge Of Window.....(mm) | 0.0 | 0.0 | 0.0 | Projection From Building Surface.(mm) | 0.0 | 0.0 | 0.0 | Height Above Window..............(mm) | 0.0 | 0.0 | 0.0 | ============================================================================= WALL Gross Area | WALL | WINDOW | WINDOW | Any Exp (sqm ) | Type | Type Qty Shade | Type Qty Shade | Doors? ----------------------------------------------------------------------------- WNW 13.9 | 4 | 3 1 0 | 1 0 0 | N ============================================================================= ROOF Slope Gross Area | ROOF | SKYLIGHT | Exp (deg) (sqm ) | Type |Type Qty | ----------------------------------------------| HOR - 17.5 | 1 | 1 0 | ============================================================================= No partition data for this space. =============================================================================

112
SPACE DESCRIPTION Prepared by: IYTE 03-06-04 HAP v3.23 Page 1 ***************************************************************************** GENERAL SCHEDULES Name......: OFFICE2 Lighting....: lighting office2 Floor Area......: 9.0 sqm Task Lights.: lighting office2 Building Weight.: 146.5 kg/sqm People......: people office2 Windows Shaded..? Y Equipment...: equipment office2 Partitions Used.? N Misc. Sens..: misc.sensible LIGHTING Misc. Latent: misc. latent Overhead Fixture: Free-Hanging INFILTRATION Lamp Wattage....: 3.77 W/sqm Cooling.....: 0.0 L/s Ballast Mult....: 2.00 Heating.....: 0.0 L/s Task Lighting...: 0.0 W Typical.....: 0.0 L/s PEOPLE When Fan On.? N Occupancy.......: 1 People FLOOR Activity Level..: Office Work Type........:Slab On Grade Sensible........: 71.8 W Perimeter.............: 12.0 m Latent..........: 60.1 W Slab Floor Area.......: 9.0 sqm OTHER LOADS Floor R-Value.........: 2.37 Equipment.......: 350.0 W Insulation R-value....: 1.75 Misc. Sensible..: 0.0 W Misc. Latent....: 0.0 W ============================================================================= EXTERNAL SHADING | Type 1 | Type 2 | Type 3 | ----------------------------------------------------------------------------- Reveal Depth.....................(mm) | 0.0 | 0.0 | 0.0 | Overhang | | | | Projection From Building Surface.(mm) | 0.0 | 0.0 | 0.0 | Height Above Window..............(mm) | 0.0 | 0.0 | 0.0 | Extension Past RH Side Of Window.(mm) | 0.0 | 0.0 | 0.0 | Extension Past LH Side Of Window.(mm) | 0.0 | 0.0 | 0.0 | Right Fin | | | | Distance From Edge Of Window.....(mm) | 0.0 | 0.0 | 0.0 | Projection From Building Surface.(mm) | 0.0 | 0.0 | 0.0 | Height Above Window..............(mm) | 0.0 | 0.0 | 0.0 | Left Fin | | | | Distance From Edge Of Window.....(mm) | 0.0 | 0.0 | 0.0 | Projection From Building Surface.(mm) | 0.0 | 0.0 | 0.0 | Height Above Window..............(mm) | 0.0 | 0.0 | 0.0 | ============================================================================= WALL Gross Area | WALL | WINDOW | WINDOW | Any Exp (sqm ) | Type | Type Qty Shade | Type Qty Shade | Doors? ----------------------------------------------------------------------------- SE 11.9 | 1 | 4 1 0 | 1 0 0 | N ============================================================================= ROOF Slope Gross Area | ROOF | SKYLIGHT | Exp (deg) (sqm ) | Type |Type Qty | ----------------------------------------------| HOR - 9.5 | 1 | 1 0 | ============================================================================= No partition data for this space. =============================================================================
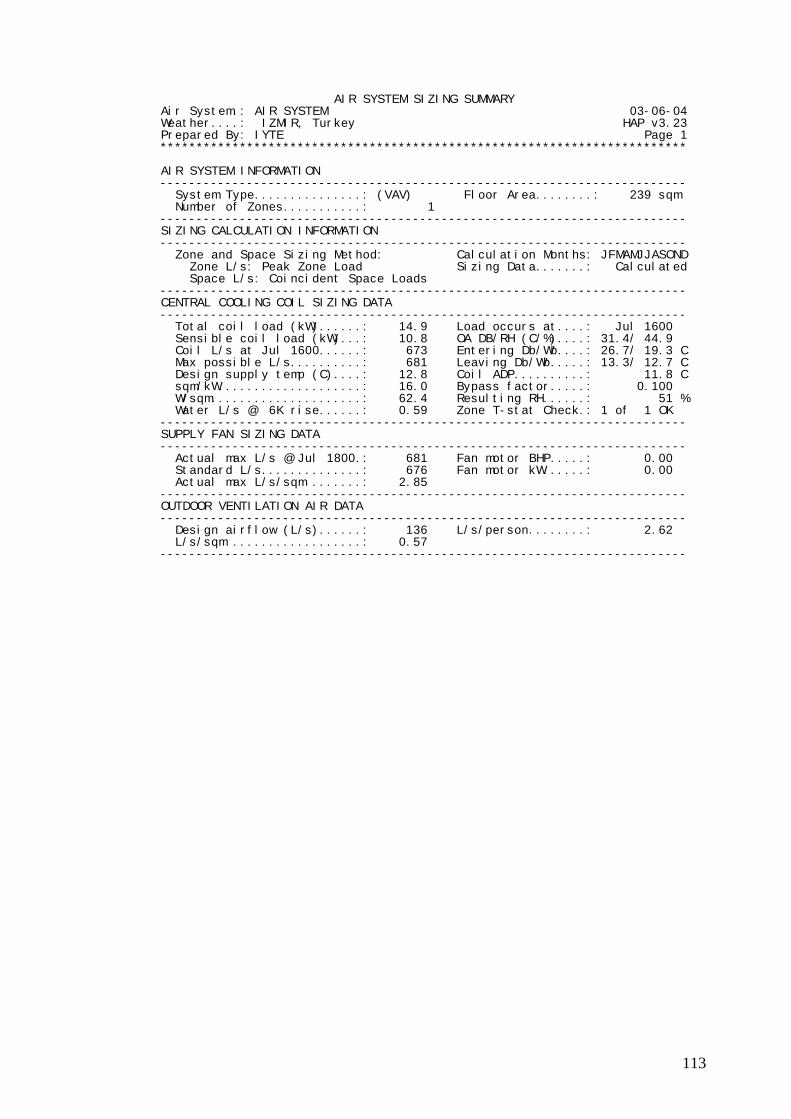
113
AIR SYSTEM SIZING SUMMARY Air System.: AIR SYSTEM 03-06-04 Weather....: IZMIR, Turkey HAP v3.23 Prepared By: IYTE Page 1 ************************************************************************* AIR SYSTEM INFORMATION ------------------------------------------------------------------------- System Type...............: (VAV) Floor Area........: 239 sqm Number of Zones...........: 1 ------------------------------------------------------------------------- SIZING CALCULATION INFORMATION ------------------------------------------------------------------------- Zone and Space Sizing Method: Calculation Months: JFMAMJJASOND Zone L/s: Peak Zone Load Sizing Data.......: Calculated Space L/s: Coincident Space Loads ------------------------------------------------------------------------- CENTRAL COOLING COIL SIZING DATA ------------------------------------------------------------------------- Total coil load (kW)......: 14.9 Load occurs at....: Jul 1600 Sensible coil load (kW)...: 10.8 OA DB/RH (C/%)....: 31.4/ 44.9 Coil L/s at Jul 1600......: 673 Entering Db/Wb....: 26.7/ 19.3 C Max possible L/s..........: 681 Leaving Db/Wb.....: 13.3/ 12.7 C Design supply temp (C)....: 12.8 Coil ADP..........: 11.8 C sqm/kW....................: 16.0 Bypass factor.....: 0.100 W/sqm.....................: 62.4 Resulting RH......: 51 % Water L/s @ 6K rise......: 0.59 Zone T-stat Check.: 1 of 1 OK ------------------------------------------------------------------------- SUPPLY FAN SIZING DATA ------------------------------------------------------------------------- Actual max L/s @ Jul 1800.: 681 Fan motor BHP.....: 0.00 Standard L/s..............: 676 Fan motor kW......: 0.00 Actual max L/s/sqm .......: 2.85 ------------------------------------------------------------------------- OUTDOOR VENTILATION AIR DATA ------------------------------------------------------------------------- Design airflow (L/s)......: 136 L/s/person........: 2.62 L/s/sqm ..................: 0.57 -------------------------------------------------------------------------
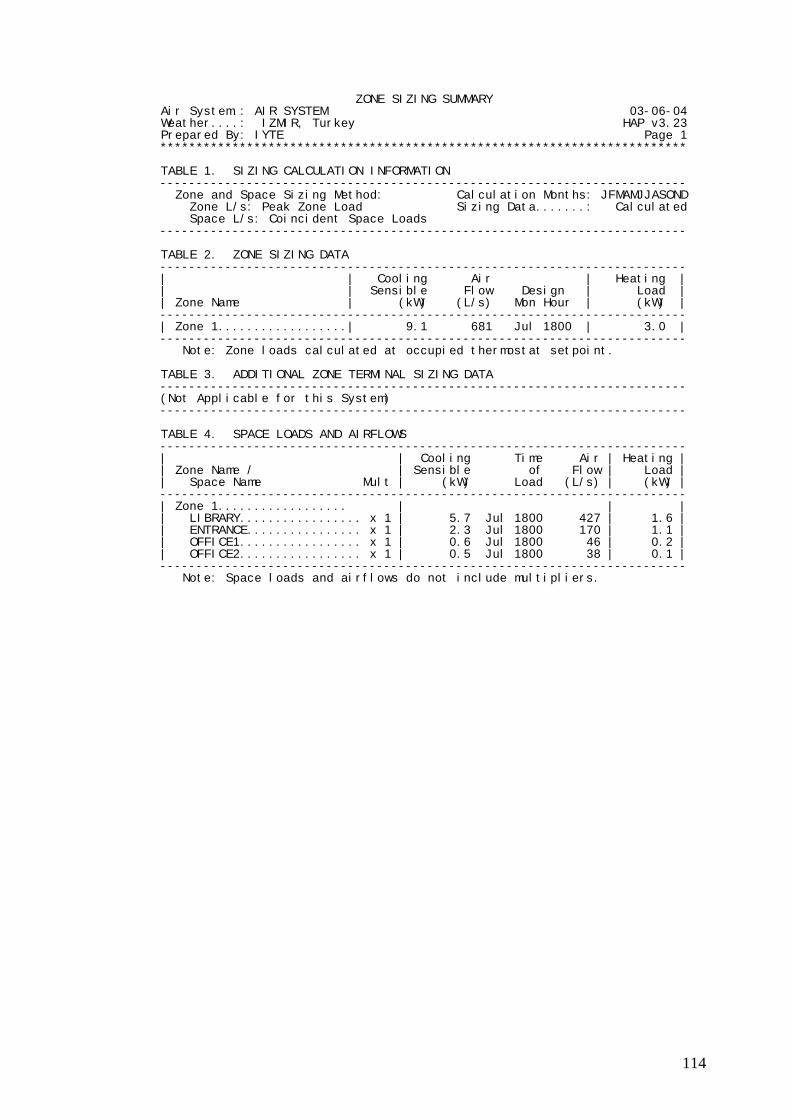
114
ZONE SIZING SUMMARY Air System.: AIR SYSTEM 03-06-04 Weather....: IZMIR, Turkey HAP v3.23 Prepared By: IYTE Page 1 ************************************************************************* TABLE 1. SIZING CALCULATION INFORMATION ------------------------------------------------------------------------- Zone and Space Sizing Method: Calculation Months: JFMAMJJASOND Zone L/s: Peak Zone Load Sizing Data.......: Calculated Space L/s: Coincident Space Loads ------------------------------------------------------------------------- TABLE 2. ZONE SIZING DATA ------------------------------------------------------------------------- | | Cooling Air | Heating | | | Sensible Flow Design | Load | | Zone Name | (kW) (L/s) Mon Hour | (kW) | ------------------------------------------------------------------------- | Zone 1..................| 9.1 681 Jul 1800 | 3.0 | ------------------------------------------------------------------------- Note: Zone loads calculated at occupied thermostat setpoint. TABLE 3. ADDITIONAL ZONE TERMINAL SIZING DATA ------------------------------------------------------------------------- (Not Applicable for this System) ------------------------------------------------------------------------- TABLE 4. SPACE LOADS AND AIRFLOWS ------------------------------------------------------------------------- | | Cooling Time Air | Heating | | Zone Name / | Sensible of Flow | Load | | Space Name Mult | (kW) Load (L/s) | (kW) | ------------------------------------------------------------------------- | Zone 1.................. | | | | LIBRARY................. x 1 | 5.7 Jul 1800 427 | 1.6 | | ENTRANCE................ x 1 | 2.3 Jul 1800 170 | 1.1 | | OFFICE1................. x 1 | 0.6 Jul 1800 46 | 0.2 | | OFFICE2................. x 1 | 0.5 Jul 1800 38 | 0.1 | ------------------------------------------------------------------------- Note: Space loads and airflows do not include multipliers.

115
AIR SYSTEM DESIGN LOAD SUMMARY Air System.: AIR SYSTEM 03-06-04 Weather....: IZMIR, Turkey HAP v3.23 Prepared By: IYTE Page 1 of 1 ************************************************************************* +-----------------------------------------------------------------------+ | COOLING AT........: Jul @ 1600 HEATING AT......: Winter Design | | COOLING OA DB/RH..: 31.4 C / 45 % HEATING OA DB...: 1.6 C | +------------------------+--------------+--------------------+----------+ | | | C O O L I N G | HEATING | | | | Sensible Latent | Sensible | | ZONE LOADS | Details | (W) (W) | (W) | +------------------------+--------------+--------------------+----------+ | Solar Loads | 104 sqm | 394 - | - | | Wall Transmission | 168 sqm | 436 - | 798 | | Roof Transmission | 260 sqm | 1658 - | 973 | | Glass Transmission | 104 sqm | 187 - | 552 | | Skylight Transmission | 0 sqm | 0 - | 0 | | Door Transmission | 2 sqm | 3 - | 9 | | Floor Transmission | 239 sqm | 0 - | 659 | | Partitions | 0 sqm | 0 - | 0 | | Ceiling | 0 sqm | 0 - | 0 | | Overhead Lighting | 1153 W | 1067 - | - | | Task Lighting | 0 W | 0 - | - | | Electric Equipment | 2440 W | 2038 - | - | | People | 52 people| 3071 3124 | - | | Infiltration | | 0 0 | 0 | | Miscellaneous | | 0 0 | - | | Safety Factor | 0/ 0/ 0 %| 0 0 | 0 | +------------------------+--------------+--------------------+----------+ | >>Total Zone Loads (1) | | 8855 3124 | 2991 | +------------------------+--------------+--------------------+----------+ | Zone Conditioning (2) | | 9844 3124 | -271 | | Plenum Wall Load | 0 % | 0 - | - | | Plenum Roof Load | 0 % | 0 - | - | | Plenum Lighting Load | 0 % | 0 - | - | | Return Fan Load | | 0 - | 0 | | Ventilation Load | 135 L/s | 945 981 | 271 | | Supply Fan Load | 673 L/s | 0 - | 0 | | Space Fan Coil Fans | | 0 - | 0 | | Duct Heat Gain/Loss | 0 % | 0 - | 0 | +------------------------+--------------+--------------------+----------+ | >>Total System Loads | | 10790 4105 | 0 | +------------------------+--------------+--------------------+----------+ | Central Cooling Coil | | 10790 4101 | 0 | | Central Heating Coil | | 0 - | 0 | | Precool Coil | | 0 0 | 0 | | Preheat Coil | | 0 - | 0 | | Central Reheat Coil | | 0 - | - | | Humidification Load | | 0 0 | - | | Terminal Reheat Coils | | 0 - | 0 | | Space/Skin Heat Coils | | 0 - | 0 | +------------------------+--------------+--------------------+----------+ | >>Total Conditioning | | 10790 4101 | 0 | +------------------------+--------------+--------------------+----------+ Notes: (1) Zone loads calculated at occupied thermostat setpoint. (2) Zone conditioning based on heat extraction analysis. (3) In the COOLING column, positive loads indicate heat gains, while positive coil loads indicate system heat removal. (4) In the HEATING column, positive loads indicate heat loss, while positive coil loads indicate system heat addition.
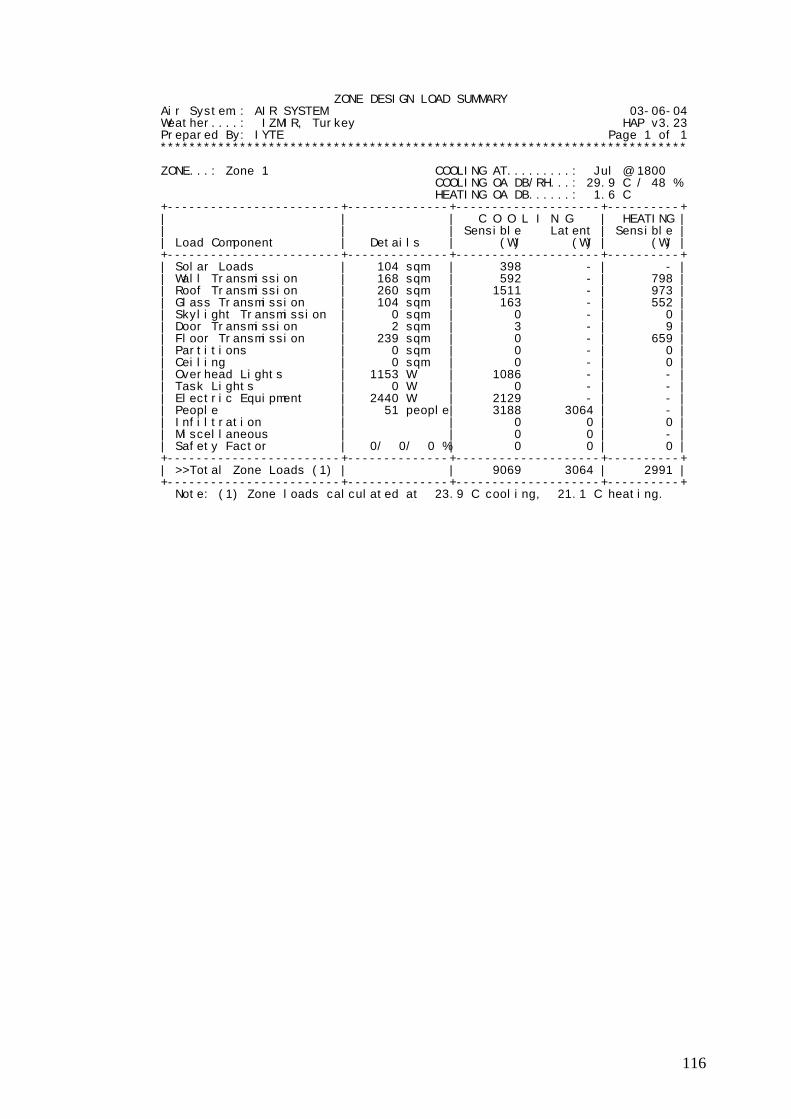
116
ZONE DESIGN LOAD SUMMARY Air System.: AIR SYSTEM 03-06-04 Weather....: IZMIR, Turkey HAP v3.23 Prepared By: IYTE Page 1 of 1 ************************************************************************* ZONE...: Zone 1 COOLING AT.........: Jul @ 1800 COOLING OA DB/RH...: 29.9 C / 48 % HEATING OA DB......: 1.6 C +------------------------+--------------+--------------------+----------+ | | | C O O L I N G | HEATING | | | | Sensible Latent | Sensible | | Load Component | Details | (W) (W) | (W) | +------------------------+--------------+--------------------+----------+ | Solar Loads | 104 sqm | 398 - | - | | Wall Transmission | 168 sqm | 592 - | 798 | | Roof Transmission | 260 sqm | 1511 - | 973 | | Glass Transmission | 104 sqm | 163 - | 552 | | Skylight Transmission | 0 sqm | 0 - | 0 | | Door Transmission | 2 sqm | 3 - | 9 | | Floor Transmission | 239 sqm | 0 - | 659 | | Partitions | 0 sqm | 0 - | 0 | | Ceiling | 0 sqm | 0 - | 0 | | Overhead Lights | 1153 W | 1086 - | - | | Task Lights | 0 W | 0 - | - | | Electric Equipment | 2440 W | 2129 - | - | | People | 51 people| 3188 3064 | - | | Infiltration | | 0 0 | 0 | | Miscellaneous | | 0 0 | - | | Safety Factor | 0/ 0/ 0 %| 0 0 | 0 | +------------------------+--------------+--------------------+----------+ | >>Total Zone Loads (1) | | 9069 3064 | 2991 | +------------------------+--------------+--------------------+----------+ Note: (1) Zone loads calculated at 23.9 C cooling, 21.1 C heating.

117
SPACE DESIGN LOAD SUMMARY Air System.: AIR SYSTEM 03-06-04 Weather....: IZMIR, Turkey HAP v3.23 Prepared By: IYTE Page 1 ************************************************************************* TABLE 1A. SPACE AND ZONE NAME +-----------------------------------------------------------------------+ | SPACE..: LIBRARY COOLING AT........: Jul @ 1800 | | IN ZONE: Zone 1 COOLING OA DB/RH..: 29.9 C / 48 % | | HEATING OA DB.....: 1.6 C | +-----------------------------------------------------------------------+ TABLE 1B. SPACE COMPONENT LOADS +------------------------+--------------+--------------------+----------+ | | | C O O L I N G | HEATING | | | | Sensible Latent | Sensible | | Load Component | Details | (W) (W) | (W) | +------------------------+--------------+--------------------+----------+ | Solar Loads | 12 sqm | 17 - | - | | Wall Transmission | 135 sqm | 502 - | 670 | | Roof Transmission | 140 sqm | 814 - | 524 | | Glass Transmission | 12 sqm | 19 - | 65 | | Skylight Transmission | 0 sqm | 0 - | 0 | | Door Transmission | 0 sqm | 0 - | 0 | | Floor Transmission | 126 sqm | 0 - | 321 | | Partitions | 0 sqm | 0 - | 0 | | Ceiling | 0 sqm | 0 - | 0 | | Overhead Lights | 678 W | 640 - | - | | Task Lights | 0 W | 0 - | - | | Electric Equipment | 1390 W | 1218 - | - | | People | 40 people| 2478 2403 | - | | Infiltration | | 0 0 | 0 | | Miscellaneous | | 0 0 | - | | Safety Factor | 0/ 0/ 0 %| 0 0 | 0 | +------------------------+--------------+--------------------+----------+ | >>Total Space Loads (1)| | 5687 2403 | 1580 | +------------------------+--------------+--------------------+----------+ | Note: (1) Zone loads calculated at 23.9 C cooling, 21.1 C heating. | +-----------------------------------------------------------------------+ TABLE 1C. WALL, WINDOW, DOOR, ROOF +--------------------------------------------+--------------------------+ | | C O O L I N G HEATING| | Area Shade| TRANS. SOLAR TRANS.| | (sqm) Type U-val Coeff| (W) (W) (W)| +--------------------------------------------+--------------------------+ | WNW EXPOSURE | | | WALL......... 26.9 1 0.197 -| 55 - 103| | WNW EXPOSURE | | | WALL......... 25.0 3 0.510 -| 255 - 249| | SSW EXPOSURE | | | WALL......... 68.4 1 0.197 -| 168 - 263| | NNW EXPOSURE | | | WALL......... 14.6 4 0.192 -| 24 - 55| | WINDOW....... 12.2 2 0.273 0.010| 19 17 65| | H EXPOSURE ( 0 degree slope) | | | ROOF......... 140.0 1 0.192 -| 814 - 524| -------------------------------------------------------------------------

118
SPACE DESIGN LOAD SUMMARY Air System.: AIR SYSTEM 03-06-04 Weather....: IZMIR, Turkey HAP v3.23 Prepared By: IYTE Page 2 ************************************************************************* TABLE 2A. SPACE AND ZONE NAME +-----------------------------------------------------------------------+ | SPACE..: ENTRANCE COOLING AT........: Jul @ 1700 | | IN ZONE: Zone 1 COOLING OA DB/RH..: 30.8 C / 47 % | | HEATING OA DB.....: 1.6 C | +-----------------------------------------------------------------------+ TABLE 2B. SPACE COMPONENT LOADS +------------------------+--------------+--------------------+----------+ | | | C O O L I N G | HEATING | | | | Sensible Latent | Sensible | | Load Component | Details | (W) (W) | (W) | +------------------------+--------------+--------------------+----------+ | Solar Loads | 87 sqm | 382 - | - | | Wall Transmission | 12 sqm | 34 - | 48 | | Roof Transmission | 93 sqm | 582 - | 348 | | Glass Transmission | 87 sqm | 149 - | 462 | | Skylight Transmission | 0 sqm | 0 - | 0 | | Door Transmission | 2 sqm | 3 - | 9 | | Floor Transmission | 87 sqm | 0 - | 254 | | Partitions | 0 sqm | 0 - | 0 | | Ceiling | 0 sqm | 0 - | 0 | | Overhead Lights | 271 W | 253 - | - | | Task Lights | 0 W | 0 - | - | | Electric Equipment | 350 W | 301 - | - | | People | 10 people| 606 601 | - | | Infiltration | | 0 0 | 0 | | Miscellaneous | | 0 0 | - | | Safety Factor | 0/ 0/ 0 %| 0 0 | 0 | +------------------------+--------------+--------------------+----------+ | >>Total Space Loads (1)| | 2311 601 | 1121 | +------------------------+--------------+--------------------+----------+ | Note: (1) Zone loads calculated at 23.9 C cooling, 21.1 C heating. | +-----------------------------------------------------------------------+ TABLE 2C. WALL, WINDOW, DOOR, ROOF +--------------------------------------------+--------------------------+ | | C O O L I N G HEATING| | Area Shade| TRANS. SOLAR TRANS.| | (sqm) Type U-val Coeff| (W) (W) (W)| +--------------------------------------------+--------------------------+ | SSW EXPOSURE | | | WALL......... 0.5 1 0.197 -| 1 - 2| | WINDOW....... 84.5 1 0.273 0.010| 145 178 450| | SSE EXPOSURE | | | WALL......... 12.0 1 0.197 -| 33 - 46| | DOOR......... 1.7 - 0.273 -| 3 - 9| | DOOR GLASS... 2.2 - 0.273 1.000| 4 204 12| | H EXPOSURE ( 0 degree slope) | | | ROOF......... 93.0 1 0.192 -| 582 - 348| -------------------------------------------------------------------------
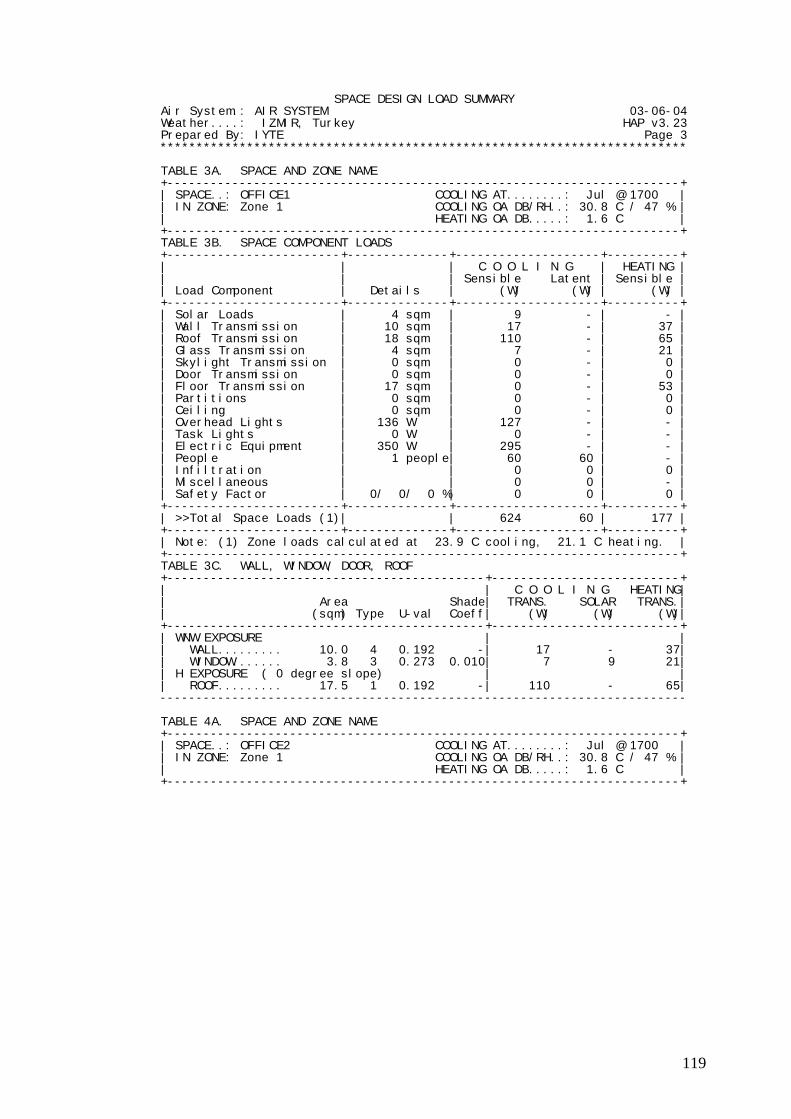
119
SPACE DESIGN LOAD SUMMARY Air System.: AIR SYSTEM 03-06-04 Weather....: IZMIR, Turkey HAP v3.23 Prepared By: IYTE Page 3 ************************************************************************* TABLE 3A. SPACE AND ZONE NAME +-----------------------------------------------------------------------+ | SPACE..: OFFICE1 COOLING AT........: Jul @ 1700 | | IN ZONE: Zone 1 COOLING OA DB/RH..: 30.8 C / 47 % | | HEATING OA DB.....: 1.6 C | +-----------------------------------------------------------------------+ TABLE 3B. SPACE COMPONENT LOADS +------------------------+--------------+--------------------+----------+ | | | C O O L I N G | HEATING | | | | Sensible Latent | Sensible | | Load Component | Details | (W) (W) | (W) | +------------------------+--------------+--------------------+----------+ | Solar Loads | 4 sqm | 9 - | - | | Wall Transmission | 10 sqm | 17 - | 37 | | Roof Transmission | 18 sqm | 110 - | 65 | | Glass Transmission | 4 sqm | 7 - | 21 | | Skylight Transmission | 0 sqm | 0 - | 0 | | Door Transmission | 0 sqm | 0 - | 0 | | Floor Transmission | 17 sqm | 0 - | 53 | | Partitions | 0 sqm | 0 - | 0 | | Ceiling | 0 sqm | 0 - | 0 | | Overhead Lights | 136 W | 127 - | - | | Task Lights | 0 W | 0 - | - | | Electric Equipment | 350 W | 295 - | - | | People | 1 people| 60 60 | - | | Infiltration | | 0 0 | 0 | | Miscellaneous | | 0 0 | - | | Safety Factor | 0/ 0/ 0 %| 0 0 | 0 | +------------------------+--------------+--------------------+----------+ | >>Total Space Loads (1)| | 624 60 | 177 | +------------------------+--------------+--------------------+----------+ | Note: (1) Zone loads calculated at 23.9 C cooling, 21.1 C heating. | +-----------------------------------------------------------------------+ TABLE 3C. WALL, WINDOW, DOOR, ROOF +--------------------------------------------+--------------------------+ | | C O O L I N G HEATING| | Area Shade| TRANS. SOLAR TRANS.| | (sqm) Type U-val Coeff| (W) (W) (W)| +--------------------------------------------+--------------------------+ | WNW EXPOSURE | | | WALL......... 10.0 4 0.192 -| 17 - 37| | WINDOW....... 3.8 3 0.273 0.010| 7 9 21| | H EXPOSURE ( 0 degree slope) | | | ROOF......... 17.5 1 0.192 -| 110 - 65| ------------------------------------------------------------------------- TABLE 4A. SPACE AND ZONE NAME +-----------------------------------------------------------------------+ | SPACE..: OFFICE2 COOLING AT........: Jul @ 1700 | | IN ZONE: Zone 1 COOLING OA DB/RH..: 30.8 C / 47 % | | HEATING OA DB.....: 1.6 C | +-----------------------------------------------------------------------+

120
SPACE DESIGN LOAD SUMMARY Air System.: AIR SYSTEM 03-06-04 Weather....: IZMIR, Turkey HAP v3.23 Prepared By: IYTE Page 4 ************************************************************************* TABLE 4B. SPACE COMPONENT LOADS +------------------------+--------------+--------------------+----------+ | | | C O O L I N G | HEATING | | | | Sensible Latent | Sensible | | Load Component | Details | (W) (W) | (W) | +------------------------+--------------+--------------------+----------+ | Solar Loads | 1 sqm | 2 - | - | | Wall Transmission | 11 sqm | 35 - | 42 | | Roof Transmission | 10 sqm | 59 - | 36 | | Glass Transmission | 1 sqm | 2 - | 5 | | Skylight Transmission | 0 sqm | 0 - | 0 | | Door Transmission | 0 sqm | 0 - | 0 | | Floor Transmission | 9 sqm | 0 - | 31 | | Partitions | 0 sqm | 0 - | 0 | | Ceiling | 0 sqm | 0 - | 0 | | Overhead Lights | 68 W | 63 - | - | | Task Lights | 0 W | 0 - | - | | Electric Equipment | 350 W | 295 - | - | | People | 1 people| 60 60 | - | | Infiltration | | 0 0 | 0 | | Miscellaneous | | 0 0 | - | | Safety Factor | 0/ 0/ 0 %| 0 0 | 0 | +------------------------+--------------+--------------------+----------+ | >>Total Space Loads (1)| | 516 60 | 113 | +------------------------+--------------+--------------------+----------+ | Note: (1) Zone loads calculated at 23.9 C cooling, 21.1 C heating. | +-----------------------------------------------------------------------+ TABLE 4C. WALL, WINDOW, DOOR, ROOF +--------------------------------------------+--------------------------+ | | C O O L I N G HEATING| | Area Shade| TRANS. SOLAR TRANS.| | (sqm) Type U-val Coeff| (W) (W) (W)| +--------------------------------------------+--------------------------+ | SE EXPOSURE | | | WALL......... 11.0 1 0.197 -| 35 - 42| | WINDOW....... 0.9 4 0.273 0.010| 2 2 5| | H EXPOSURE ( 0 degree slope) | | | ROOF......... 9.5 1 0.192 -| 59 - 36| -------------------------------------------------------------------------

121
HOURLY AIR SYSTEM DESIGN DAY LOADS Air System.: AIR SYSTEM 03-06-04 Weather....: IZMIR, Turkey HAP v3.23 Prepared By: IYTE Page 1 of 12 ************************************************************************* +-----------------------------------------------------------------------+ | MONTH: JANUARY | +----+-------+--------------+--------+--------+--------+--------+-------+ | | | CENTRAL | | |TERMINAL| SPACE| | | | OA | COOLING | CENTRAL| PREHEAT| HEATING| & SKIN| SUPPLY| | | TEMP | Sens. Total| HEATING| COIL| COIL| HEATING|AIRFLOW| |Hour| (C) | (kW) (kW)| (kW)| (kW)| (kW)| (kW)| (L/s)| +----+-------+--------------+--------+--------+--------+--------+-------+ |0000 7.6 0.0 0.0 0.0 0.0 0.0 0.0 0| |0100 7.5 0.0 0.0 0.0 0.0 0.0 0.0 0| |0200 7.3 0.0 0.0 0.0 0.0 0.0 0.0 0| |0300 7.2 0.0 0.0 0.0 0.0 0.0 0.0 0| |0400 7.0 0.0 0.0 0.0 0.0 0.0 0.0 0| |0500 6.9 0.0 0.0 0.0 0.0 0.0 0.0 0| |0600 6.9 0.0 0.0 0.0 0.0 0.0 0.0 0| |0700 6.8 0.0 0.0 0.0 0.0 0.0 0.0 0| |0800 6.9 0.0 0.0 0.0 0.0 0.0 0.0 68| |0900 7.7 0.0 0.0 0.0 0.0 0.0 0.0 68| |1000 8.7 0.0 0.0 0.0 0.0 0.0 0.0 68| |1100 9.7 0.0 0.0 0.0 0.0 0.0 0.0 68| |1200 10.4 0.0 0.0 0.0 0.0 0.0 0.0 68| |1300 10.9 0.0 0.0 0.0 0.0 0.0 0.0 68| |1400 11.3 0.0 0.0 0.0 0.0 0.0 0.0 68| |1500 11.3 0.0 0.0 0.0 0.0 0.0 0.0 68| |1600 11.0 0.0 0.0 0.0 0.0 0.0 0.0 68| |1700 10.2 0.0 0.0 0.0 0.0 0.0 0.0 68| |1800 9.5 0.0 0.0 0.0 0.0 0.0 0.0 68| |1900 9.0 0.0 0.0 0.0 0.0 0.0 0.0 68| |2000 8.7 0.0 0.0 0.0 0.0 0.0 0.0 0| |2100 8.4 0.0 0.0 0.0 0.0 0.0 0.0 0| |2200 8.0 0.0 0.0 0.0 0.0 0.0 0.0 0| |2300 7.8 0.0 0.0 0.0 0.0 0.0 0.0 0| +----+-------+--------------+--------+--------+--------+--------+-------+ HOURLY AIR SYSTEM DESIGN DAY LOADS Air System.: AIR SYSTEM 03-06-04 Weather....: IZMIR, Turkey HAP v3.23 Prepared By: IYTE Page 2 of 12 ************************************************************************* +-----------------------------------------------------------------------+ | MONTH: FEBRUARY | +----+-------+--------------+--------+--------+--------+--------+-------+ | | | CENTRAL | | |TERMINAL| SPACE| | | | OA | COOLING | CENTRAL| PREHEAT| HEATING| & SKIN| SUPPLY| | | TEMP | Sens. Total| HEATING| COIL| COIL| HEATING|AIRFLOW| |Hour| (C) | (kW) (kW)| (kW)| (kW)| (kW)| (kW)| (L/s)| +----+-------+--------------+--------+--------+--------+--------+-------+ |0000 7.8 0.0 0.0 0.0 0.0 0.0 0.0 0| |0100 7.5 0.0 0.0 0.0 0.0 0.0 0.0 0| |0200 7.3 0.0 0.0 0.0 0.0 0.0 0.0 0| |0300 7.2 0.0 0.0 0.0 0.0 0.0 0.0 0| |0400 7.0 0.0 0.0 0.0 0.0 0.0 0.0 0| |0500 6.9 0.0 0.0 0.0 0.0 0.0 0.0 0| |0600 6.8 0.0 0.0 0.0 0.0 0.0 0.0 0| |0700 6.8 0.0 0.0 0.0 0.0 0.0 0.0 0| |0800 7.1 0.0 0.0 0.0 0.0 0.0 0.0 68| |0900 8.1 0.0 0.0 0.0 0.0 0.0 0.0 68| |1000 9.2 0.0 0.0 0.0 0.0 0.0 0.0 68| |1100 10.2 0.0 0.0 0.0 0.0 0.0 0.0 68| |1200 10.9 0.0 0.0 0.0 0.0 0.0 0.0 68| |1300 11.5 0.0 0.0 0.0 0.0 0.0 0.0 68| |1400 12.0 0.0 0.0 0.0 0.0 0.0 0.0 68| |1500 12.0 0.0 0.0 0.0 0.0 0.0 0.0 68| |1600 11.8 0.0 0.0 0.0 0.0 0.0 0.0 68| |1700 11.1 0.0 0.0 0.0 0.0 0.0 0.0 68| |1800 10.2 0.0 0.0 0.0 0.0 0.0 0.0 68| |1900 9.5 0.0 0.0 0.0 0.0 0.0 0.0 68| |2000 9.1 0.0 0.0 0.0 0.0 0.0 0.0 0| |2100 8.7 0.0 0.0 0.0 0.0 0.0 0.0 0| |2200 8.3 0.0 0.0 0.0 0.0 0.0 0.0 0| |2300 8.1 0.0 0.0 0.0 0.0 0.0 0.0 0| +----+-------+--------------+--------+--------+--------+--------+-------+

122
HOURLY AIR SYSTEM DESIGN DAY LOADS Air System.: AIR SYSTEM 03-06-04 Weather....: IZMIR, Turkey HAP v3.23 Prepared By: IYTE Page 3 of 12 ************************************************************************* +-----------------------------------------------------------------------+ | MONTH: MARCH | +----+-------+--------------+--------+--------+--------+--------+-------+ | | | CENTRAL | | |TERMINAL| SPACE| | | | OA | COOLING | CENTRAL| PREHEAT| HEATING| & SKIN| SUPPLY| | | TEMP | Sens. Total| HEATING| COIL| COIL| HEATING|AIRFLOW| |Hour| (C) | (kW) (kW)| (kW)| (kW)| (kW)| (kW)| (L/s)| +----+-------+--------------+--------+--------+--------+--------+-------+ |0000 9.8 0.0 0.0 0.0 0.0 0.0 0.0 0| |0100 9.3 0.0 0.0 0.0 0.0 0.0 0.0 0| |0200 9.1 0.0 0.0 0.0 0.0 0.0 0.0 0| |0300 8.9 0.0 0.0 0.0 0.0 0.0 0.0 0| |0400 8.7 0.0 0.0 0.0 0.0 0.0 0.0 0| |0500 8.5 0.0 0.0 0.0 0.0 0.0 0.0 0| |0600 8.3 0.0 0.0 0.0 0.0 0.0 0.0 0| |0700 8.5 0.0 0.0 0.0 0.0 0.0 0.0 0| |0800 9.4 0.0 0.0 0.0 0.0 0.0 0.0 68| |0900 10.7 0.0 0.0 0.0 0.0 0.0 0.0 68| |1000 11.9 0.0 0.0 0.0 0.0 0.0 0.0 68| |1100 13.0 0.0 0.0 0.0 0.0 0.0 0.0 68| |1200 13.9 0.0 0.0 0.0 0.0 0.0 0.0 68| |1300 14.6 0.0 0.0 0.0 0.0 0.0 0.0 68| |1400 15.1 0.0 0.0 0.0 0.0 0.0 0.0 68| |1500 15.0 0.0 0.0 0.0 0.0 0.0 0.0 68| |1600 14.7 0.0 0.0 0.0 0.0 0.0 0.0 68| |1700 14.1 0.0 0.0 0.0 0.0 0.0 0.0 68| |1800 13.1 0.0 0.0 0.0 0.0 0.0 0.0 68| |1900 12.2 0.0 0.0 0.0 0.0 0.0 0.0 68| |2000 11.6 0.0 0.0 0.0 0.0 0.0 0.0 0| |2100 11.1 0.0 0.0 0.0 0.0 0.0 0.0 0| |2200 10.6 0.0 0.0 0.0 0.0 0.0 0.0 0| |2300 10.2 0.0 0.0 0.0 0.0 0.0 0.0 0| +----+-------+--------------+--------+--------+--------+--------+-------+ HOURLY AIR SYSTEM DESIGN DAY LOADS Air System.: AIR SYSTEM 03-06-04 Weather....: IZMIR, Turkey HAP v3.23 Prepared By: IYTE Page 4 of 12 ************************************************************************* +-----------------------------------------------------------------------+ | MONTH: APRIL | +----+-------+--------------+--------+--------+--------+--------+-------+ | | | CENTRAL | | |TERMINAL| SPACE| | | | OA | COOLING | CENTRAL| PREHEAT| HEATING| & SKIN| SUPPLY| | | TEMP | Sens. Total| HEATING| COIL| COIL| HEATING|AIRFLOW| |Hour| (C) | (kW) (kW)| (kW)| (kW)| (kW)| (kW)| (L/s)| +----+-------+--------------+--------+--------+--------+--------+-------+ |0000 13.6 0.0 0.0 0.0 0.0 0.0 0.0 0| |0100 13.2 0.0 0.0 0.0 0.0 0.0 0.0 0| |0200 12.9 0.0 0.0 0.0 0.0 0.0 0.0 0| |0300 12.6 0.0 0.0 0.0 0.0 0.0 0.0 0| |0400 12.4 0.0 0.0 0.0 0.0 0.0 0.0 0| |0500 12.1 0.0 0.0 0.0 0.0 0.0 0.0 0| |0600 12.1 0.0 0.0 0.0 0.0 0.0 0.0 0| |0700 13.1 0.0 0.0 0.0 0.0 0.0 0.0 0| |0800 14.3 0.0 0.0 0.0 0.0 0.0 0.0 68| |0900 15.6 0.0 0.0 0.0 0.0 0.0 0.0 68| |1000 16.8 0.0 0.0 0.0 0.0 0.0 0.0 68| |1100 18.0 0.0 0.0 0.0 0.0 0.0 0.0 68| |1200 18.8 0.0 0.0 0.0 0.0 0.0 0.0 68| |1300 19.5 0.0 0.0 0.0 0.0 0.0 0.0 68| |1400 19.9 0.0 0.0 0.0 0.0 0.0 0.0 68| |1500 19.7 0.0 0.0 0.0 0.0 0.0 0.0 68| |1600 19.3 0.0 0.0 0.0 0.0 0.0 0.0 68| |1700 18.7 0.0 0.0 0.0 0.0 0.0 0.0 68| |1800 17.7 0.0 0.0 0.0 0.0 0.0 0.0 68| |1900 16.6 0.0 0.0 0.0 0.0 0.0 0.0 68| |2000 15.9 0.0 0.0 0.0 0.0 0.0 0.0 0| |2100 15.1 0.0 0.0 0.0 0.0 0.0 0.0 0| |2200 14.5 0.0 0.0 0.0 0.0 0.0 0.0 0| |2300 14.0 0.0 0.0 0.0 0.0 0.0 0.0 0| +----+-------+--------------+--------+--------+--------+--------+-------+

123
HOURLY AIR SYSTEM DESIGN DAY LOADS Air System.: AIR SYSTEM 03-06-04 Weather....: IZMIR, Turkey HAP v3.23 Prepared By: IYTE Page 5 of 12 ************************************************************************* +-----------------------------------------------------------------------+ | MONTH: MAY | +----+-------+--------------+--------+--------+--------+--------+-------+ | | | CENTRAL | | |TERMINAL| SPACE| | | | OA | COOLING | CENTRAL| PREHEAT| HEATING| & SKIN| SUPPLY| | | TEMP | Sens. Total| HEATING| COIL| COIL| HEATING|AIRFLOW| |Hour| (C) | (kW) (kW)| (kW)| (kW)| (kW)| (kW)| (L/s)| +----+-------+--------------+--------+--------+--------+--------+-------+ |0000 18.0 0.0 0.0 0.0 0.0 0.0 0.0 0| |0100 17.3 0.0 0.0 0.0 0.0 0.0 0.0 0| |0200 16.9 0.0 0.0 0.0 0.0 0.0 0.0 0| |0300 16.6 0.0 0.0 0.0 0.0 0.0 0.0 0| |0400 16.2 0.0 0.0 0.0 0.0 0.0 0.0 0| |0500 16.0 0.0 0.0 0.0 0.0 0.0 0.0 0| |0600 16.3 0.0 0.0 0.0 0.0 0.0 0.0 0| |0700 18.0 0.0 0.0 0.0 0.0 0.0 0.0 0| |0800 19.3 4.6 5.8 0.0 0.0 0.0 0.0 451| |0900 20.6 5.5 7.9 0.0 0.0 0.0 0.0 501| |1000 21.9 6.0 8.5 0.0 0.0 0.0 0.0 518| |1100 23.0 6.5 9.0 0.0 0.0 0.0 0.0 537| |1200 23.9 6.9 9.4 0.0 0.0 0.0 0.0 556| |1300 24.4 7.3 9.6 0.0 0.0 0.0 0.0 574| |1400 24.7 7.6 10.0 0.0 0.0 0.0 0.0 590| |1500 24.6 7.8 10.2 0.0 0.0 0.0 0.0 604| |1600 24.2 7.9 10.4 0.0 0.0 0.0 0.0 616| |1700 23.6 7.9 10.3 0.0 0.0 0.0 0.0 625| |1800 22.5 7.6 10.0 0.0 0.0 0.0 0.0 630| |1900 21.4 6.7 7.7 0.0 0.0 0.0 0.0 583| |2000 20.6 0.0 0.0 0.0 0.0 0.0 0.0 0| |2100 19.8 0.0 0.0 0.0 0.0 0.0 0.0 0| |2200 19.1 0.0 0.0 0.0 0.0 0.0 0.0 0| |2300 18.5 0.0 0.0 0.0 0.0 0.0 0.0 0| +----+-------+--------------+--------+--------+--------+--------+-------+ HOURLY AIR SYSTEM DESIGN DAY LOADS Air System.: AIR SYSTEM 03-06-04 Weather....: IZMIR, Turkey HAP v3.23 Prepared By: IYTE Page 6 of 12 ************************************************************************* +-----------------------------------------------------------------------+ | MONTH: JUNE | +----+-------+--------------+--------+--------+--------+--------+-------+ | | | CENTRAL | | |TERMINAL| SPACE| | | | OA | COOLING | CENTRAL| PREHEAT| HEATING| & SKIN| SUPPLY| | | TEMP | Sens. Total| HEATING| COIL| COIL| HEATING|AIRFLOW| |Hour| (C) | (kW) (kW)| (kW)| (kW)| (kW)| (kW)| (L/s)| +----+-------+--------------+--------+--------+--------+--------+-------+ |0000 22.7 0.0 0.0 0.0 0.0 0.0 0.0 0| |0100 21.9 0.0 0.0 0.0 0.0 0.0 0.0 0| |0200 21.5 0.0 0.0 0.0 0.0 0.0 0.0 0| |0300 21.0 0.0 0.0 0.0 0.0 0.0 0.0 0| |0400 20.6 0.0 0.0 0.0 0.0 0.0 0.0 0| |0500 20.4 0.0 0.0 0.0 0.0 0.0 0.0 0| |0600 20.9 0.0 0.0 0.0 0.0 0.0 0.0 0| |0700 22.9 0.0 0.0 0.0 0.0 0.0 0.0 0| |0800 24.1 6.6 8.6 0.0 0.0 0.0 0.0 526| |0900 25.6 7.5 10.9 0.0 0.0 0.0 0.0 566| |1000 26.9 8.1 11.5 0.0 0.0 0.0 0.0 582| |1100 28.1 8.6 12.0 0.0 0.0 0.0 0.0 597| |1200 28.9 9.1 12.4 0.0 0.0 0.0 0.0 614| |1300 29.5 9.5 12.6 0.0 0.0 0.0 0.0 630| |1400 29.9 9.9 13.1 0.0 0.0 0.0 0.0 644| |1500 29.7 10.0 13.2 0.0 0.0 0.0 0.0 657| |1600 29.3 10.1 13.5 0.0 0.0 0.0 0.0 668| |1700 28.6 10.0 13.5 0.0 0.0 0.0 0.0 676| |1800 27.6 9.8 13.1 0.0 0.0 0.0 0.0 678| |1900 26.4 8.7 10.7 0.0 0.0 0.0 0.0 633| |2000 25.5 0.0 0.0 0.0 0.0 0.0 0.0 0| |2100 24.6 0.0 0.0 0.0 0.0 0.0 0.0 0| |2200 24.0 0.0 0.0 0.0 0.0 0.0 0.0 0| |2300 23.3 0.0 0.0 0.0 0.0 0.0 0.0 0| +----+-------+--------------+--------+--------+--------+--------+-------+

124
HOURLY AIR SYSTEM DESIGN DAY LOADS Air System.: AIR SYSTEM 03-06-04 Weather....: IZMIR, Turkey HAP v3.23 Prepared By: IYTE Page 7 of 12 ************************************************************************* +-----------------------------------------------------------------------+ | MONTH: JULY | +----+-------+--------------+--------+--------+--------+--------+-------+ | | | CENTRAL | | |TERMINAL| SPACE| | | | OA | COOLING | CENTRAL| PREHEAT| HEATING| & SKIN| SUPPLY| | | TEMP | Sens. Total| HEATING| COIL| COIL| HEATING|AIRFLOW| |Hour| (C) | (kW) (kW)| (kW)| (kW)| (kW)| (kW)| (L/s)| +----+-------+--------------+--------+--------+--------+--------+-------+ |0000 25.2 0.0 0.0 0.0 0.0 0.0 0.0 0| |0100 24.5 0.0 0.0 0.0 0.0 0.0 0.0 0| |0200 24.0 0.0 0.0 0.0 0.0 0.0 0.0 0| |0300 23.5 0.0 0.0 0.0 0.0 0.0 0.0 0| |0400 23.1 0.0 0.0 0.0 0.0 0.0 0.0 0| |0500 22.7 0.0 0.0 0.0 0.0 0.0 0.0 0| |0600 22.9 0.0 0.0 0.0 0.0 0.0 0.0 0| |0700 24.5 0.0 0.0 0.0 0.0 0.0 0.0 0| |0800 25.6 7.2 9.6 0.0 0.0 0.0 0.0 547| |0900 27.2 8.1 12.0 0.0 0.0 0.0 0.0 582| |1000 28.7 8.7 12.7 0.0 0.0 0.0 0.0 594| |1100 30.0 9.3 13.3 0.0 0.0 0.0 0.0 608| |1200 30.9 9.8 13.7 0.0 0.0 0.0 0.0 623| |1300 31.5 10.2 13.9 0.0 0.0 0.0 0.0 638| |1400 31.8 10.5 14.4 0.0 0.0 0.0 0.0 651| |1500 31.7 10.7 14.6 0.0 0.0 0.0 0.0 663| |1600 31.4 10.8 14.9 0.0 0.0 0.0 0.0 673| |1700 30.8 10.7 14.9 0.0 0.0 0.0 0.0 680| |1800 29.9 10.5 14.5 0.0 0.0 0.0 0.0 681| |1900 28.7 9.4 11.9 0.0 0.0 0.0 0.0 637| |2000 27.8 0.0 0.0 0.0 0.0 0.0 0.0 0| |2100 27.0 0.0 0.0 0.0 0.0 0.0 0.0 0| |2200 26.4 0.0 0.0 0.0 0.0 0.0 0.0 0| |2300 25.8 0.0 0.0 0.0 0.0 0.0 0.0 0| +----+-------+--------------+--------+--------+--------+--------+-------+ HOURLY AIR SYSTEM DESIGN DAY LOADS Air System.: AIR SYSTEM 03-06-04 Weather....: IZMIR, Turkey HAP v3.23 Prepared By: IYTE Page 8 of 12 ************************************************************************* +-----------------------------------------------------------------------+ | MONTH: AUGUST | +----+-------+--------------+--------+--------+--------+--------+-------+ | | | CENTRAL | | |TERMINAL| SPACE| | | | OA | COOLING | CENTRAL| PREHEAT| HEATING| & SKIN| SUPPLY| | | TEMP | Sens. Total| HEATING| COIL| COIL| HEATING|AIRFLOW| |Hour| (C) | (kW) (kW)| (kW)| (kW)| (kW)| (kW)| (L/s)| +----+-------+--------------+--------+--------+--------+--------+-------+ |0000 24.9 0.0 0.0 0.0 0.0 0.0 0.0 0| |0100 24.4 0.0 0.0 0.0 0.0 0.0 0.0 0| |0200 23.9 0.0 0.0 0.0 0.0 0.0 0.0 0| |0300 23.4 0.0 0.0 0.0 0.0 0.0 0.0 0| |0400 23.0 0.0 0.0 0.0 0.0 0.0 0.0 0| |0500 22.7 0.0 0.0 0.0 0.0 0.0 0.0 0| |0600 22.6 0.0 0.0 0.0 0.0 0.0 0.0 0| |0700 23.7 0.0 0.0 0.0 0.0 0.0 0.0 0| |0800 25.0 6.7 9.1 0.0 0.0 0.0 0.0 524| |0900 26.6 7.6 11.4 0.0 0.0 0.0 0.0 559| |1000 28.1 8.2 12.0 0.0 0.0 0.0 0.0 569| |1100 29.5 8.7 12.7 0.0 0.0 0.0 0.0 582| |1200 30.5 9.2 13.1 0.0 0.0 0.0 0.0 596| |1300 31.1 9.6 13.3 0.0 0.0 0.0 0.0 611| |1400 31.5 9.9 13.8 0.0 0.0 0.0 0.0 624| |1500 31.4 10.1 14.0 0.0 0.0 0.0 0.0 636| |1600 31.0 10.2 14.2 0.0 0.0 0.0 0.0 646| |1700 30.3 10.1 14.2 0.0 0.0 0.0 0.0 653| |1800 29.2 9.9 13.7 0.0 0.0 0.0 0.0 656| |1900 28.1 8.8 11.1 0.0 0.0 0.0 0.0 610| |2000 27.3 0.0 0.0 0.0 0.0 0.0 0.0 0| |2100 26.7 0.0 0.0 0.0 0.0 0.0 0.0 0| |2200 26.0 0.0 0.0 0.0 0.0 0.0 0.0 0| |2300 25.5 0.0 0.0 0.0 0.0 0.0 0.0 0| +----+-------+--------------+--------+--------+--------+--------+-------+

125
HOURLY AIR SYSTEM DESIGN DAY LOADS Air System.: AIR SYSTEM 03-06-04 Weather....: IZMIR, Turkey HAP v3.23 Prepared By: IYTE Page 9 of 12 ************************************************************************* +-----------------------------------------------------------------------+ | MONTH: SEPTEMBER | +----+-------+--------------+--------+--------+--------+--------+-------+ | | | CENTRAL | | |TERMINAL| SPACE| | | | OA | COOLING | CENTRAL| PREHEAT| HEATING| & SKIN| SUPPLY| | | TEMP | Sens. Total| HEATING| COIL| COIL| HEATING|AIRFLOW| |Hour| (C) | (kW) (kW)| (kW)| (kW)| (kW)| (kW)| (L/s)| +----+-------+--------------+--------+--------+--------+--------+-------+ |0000 21.3 0.0 0.0 0.0 0.0 0.0 0.0 0| |0100 20.8 0.0 0.0 0.0 0.0 0.0 0.0 0| |0200 20.4 0.0 0.0 0.0 0.0 0.0 0.0 0| |0300 20.0 0.0 0.0 0.0 0.0 0.0 0.0 0| |0400 19.6 0.0 0.0 0.0 0.0 0.0 0.0 0| |0500 19.3 0.0 0.0 0.0 0.0 0.0 0.0 0| |0600 19.2 0.0 0.0 0.0 0.0 0.0 0.0 0| |0700 19.9 0.0 0.0 0.0 0.0 0.0 0.0 0| |0800 21.5 5.2 6.8 0.0 0.0 0.0 0.0 465| |0900 23.3 6.1 9.1 0.0 0.0 0.0 0.0 505| |1000 24.8 6.6 9.7 0.0 0.0 0.0 0.0 517| |1100 26.3 7.1 10.3 0.0 0.0 0.0 0.0 531| |1200 27.3 7.6 10.7 0.0 0.0 0.0 0.0 547| |1300 28.0 8.0 11.0 0.0 0.0 0.0 0.0 564| |1400 28.3 8.4 11.4 0.0 0.0 0.0 0.0 579| |1500 28.1 8.5 11.5 0.0 0.0 0.0 0.0 593| |1600 27.5 8.6 11.5 0.0 0.0 0.0 0.0 604| |1700 26.5 8.4 11.3 0.0 0.0 0.0 0.0 613| |1800 25.2 8.2 10.7 0.0 0.0 0.0 0.0 617| |1900 24.2 7.2 8.4 0.0 0.0 0.0 0.0 566| |2000 23.6 0.0 0.0 0.0 0.0 0.0 0.0 0| |2100 22.9 0.0 0.0 0.0 0.0 0.0 0.0 0| |2200 22.3 0.0 0.0 0.0 0.0 0.0 0.0 0| |2300 21.8 0.0 0.0 0.0 0.0 0.0 0.0 0| +----+-------+--------------+--------+--------+--------+--------+-------+ HOURLY AIR SYSTEM DESIGN DAY LOADS Air System.: AIR SYSTEM 03-06-04 Weather....: IZMIR, Turkey HAP v3.23 Prepared By: IYTE Page 10 of 12 ************************************************************************* +-----------------------------------------------------------------------+ | MONTH: OCTOBER | +----+-------+--------------+--------+--------+--------+--------+-------+ | | | CENTRAL | | |TERMINAL| SPACE| | | | OA | COOLING | CENTRAL| PREHEAT| HEATING| & SKIN| SUPPLY| | | TEMP | Sens. Total| HEATING| COIL| COIL| HEATING|AIRFLOW| |Hour| (C) | (kW) (kW)| (kW)| (kW)| (kW)| (kW)| (L/s)| +----+-------+--------------+--------+--------+--------+--------+-------+ |0000 16.8 0.0 0.0 0.0 0.0 0.0 0.0 0| |0100 16.6 0.0 0.0 0.0 0.0 0.0 0.0 0| |0200 16.3 0.0 0.0 0.0 0.0 0.0 0.0 0| |0300 16.0 0.0 0.0 0.0 0.0 0.0 0.0 0| |0400 15.8 0.0 0.0 0.0 0.0 0.0 0.0 0| |0500 15.5 0.0 0.0 0.0 0.0 0.0 0.0 0| |0600 15.4 0.0 0.0 0.0 0.0 0.0 0.0 0| |0700 15.6 0.0 0.0 0.0 0.0 0.0 0.0 0| |0800 16.9 0.0 0.0 0.0 0.0 0.0 0.0 68| |0900 18.6 0.0 0.0 0.0 0.0 0.0 0.0 68| |1000 19.9 0.0 0.0 0.0 0.0 0.0 0.0 68| |1100 21.2 0.0 0.0 0.0 0.0 0.0 0.0 68| |1200 22.1 0.0 0.0 0.0 0.0 0.0 0.0 68| |1300 22.8 0.0 0.0 0.0 0.0 0.0 0.0 68| |1400 23.1 0.0 0.0 0.0 0.0 0.0 0.0 68| |1500 22.9 0.0 0.0 0.0 0.0 0.0 0.0 68| |1600 22.2 0.0 0.0 0.0 0.0 0.0 0.0 68| |1700 21.1 0.0 0.0 0.0 0.0 0.0 0.0 68| |1800 20.1 0.0 0.0 0.0 0.0 0.0 0.0 68| |1900 19.2 0.0 0.0 0.0 0.0 0.0 0.0 68| |2000 18.7 0.0 0.0 0.0 0.0 0.0 0.0 0| |2100 18.2 0.0 0.0 0.0 0.0 0.0 0.0 0| |2200 17.6 0.0 0.0 0.0 0.0 0.0 0.0 0| |2300 17.2 0.0 0.0 0.0 0.0 0.0 0.0 0| +----+-------+--------------+--------+--------+--------+--------+-------+

126
HOURLY AIR SYSTEM DESIGN DAY LOADS Air System.: AIR SYSTEM 03-06-04 Weather....: IZMIR, Turkey HAP v3.23 Prepared By: IYTE Page 11 of 12 ************************************************************************* +-----------------------------------------------------------------------+ | MONTH: NOVEMBER | +----+-------+--------------+--------+--------+--------+--------+-------+ | | | CENTRAL | | |TERMINAL| SPACE| | | | OA | COOLING | CENTRAL| PREHEAT| HEATING| & SKIN| SUPPLY| | | TEMP | Sens. Total| HEATING| COIL| COIL| HEATING|AIRFLOW| |Hour| (C) | (kW) (kW)| (kW)| (kW)| (kW)| (kW)| (L/s)| +----+-------+--------------+--------+--------+--------+--------+-------+ |0000 11.9 0.0 0.0 0.0 0.0 0.0 0.0 0| |0100 11.9 0.0 0.0 0.0 0.0 0.0 0.0 0| |0200 11.7 0.0 0.0 0.0 0.0 0.0 0.0 0| |0300 11.6 0.0 0.0 0.0 0.0 0.0 0.0 0| |0400 11.4 0.0 0.0 0.0 0.0 0.0 0.0 0| |0500 11.3 0.0 0.0 0.0 0.0 0.0 0.0 0| |0600 11.1 0.0 0.0 0.0 0.0 0.0 0.0 0| |0700 11.1 0.0 0.0 0.0 0.0 0.0 0.0 0| |0800 11.7 0.0 0.0 0.0 0.0 0.0 0.0 68| |0900 12.9 0.0 0.0 0.0 0.0 0.0 0.0 68| |1000 14.1 0.0 0.0 0.0 0.0 0.0 0.0 68| |1100 15.1 0.0 0.0 0.0 0.0 0.0 0.0 68| |1200 15.8 0.0 0.0 0.0 0.0 0.0 0.0 68| |1300 16.4 0.0 0.0 0.0 0.0 0.0 0.0 68| |1400 16.7 0.0 0.0 0.0 0.0 0.0 0.0 68| |1500 16.5 0.0 0.0 0.0 0.0 0.0 0.0 68| |1600 16.0 0.0 0.0 0.0 0.0 0.0 0.0 68| |1700 14.9 0.0 0.0 0.0 0.0 0.0 0.0 68| |1800 14.1 0.0 0.0 0.0 0.0 0.0 0.0 68| |1900 13.5 0.0 0.0 0.0 0.0 0.0 0.0 68| |2000 13.1 0.0 0.0 0.0 0.0 0.0 0.0 0| |2100 12.8 0.0 0.0 0.0 0.0 0.0 0.0 0| |2200 12.3 0.0 0.0 0.0 0.0 0.0 0.0 0| |2300 12.1 0.0 0.0 0.0 0.0 0.0 0.0 0| +----+-------+--------------+--------+--------+--------+--------+-------+ HOURLY AIR SYSTEM DESIGN DAY LOADS Air System.: AIR SYSTEM 03-06-04 Weather....: IZMIR, Turkey HAP v3.23 Prepared By: IYTE Page 12 of 12 ************************************************************************* +-----------------------------------------------------------------------+ | MONTH: DECEMBER | +----+-------+--------------+--------+--------+--------+--------+-------+ | | | CENTRAL | | |TERMINAL| SPACE| | | | OA | COOLING | CENTRAL| PREHEAT| HEATING| & SKIN| SUPPLY| | | TEMP | Sens. Total| HEATING| COIL| COIL| HEATING|AIRFLOW| |Hour| (C) | (kW) (kW)| (kW)| (kW)| (kW)| (kW)| (L/s)| +----+-------+--------------+--------+--------+--------+--------+-------+ |0000 9.1 0.0 0.0 0.0 0.0 0.0 0.0 0| |0100 9.0 0.0 0.0 0.0 0.0 0.0 0.0 0| |0200 8.9 0.0 0.0 0.0 0.0 0.0 0.0 0| |0300 8.8 0.0 0.0 0.0 0.0 0.0 0.0 0| |0400 8.7 0.0 0.0 0.0 0.0 0.0 0.0 0| |0500 8.6 0.0 0.0 0.0 0.0 0.0 0.0 0| |0600 8.4 0.0 0.0 0.0 0.0 0.0 0.0 0| |0700 8.4 0.0 0.0 0.0 0.0 0.0 0.0 0| |0800 8.5 0.0 0.0 0.0 0.0 0.0 0.0 68| |0900 9.4 0.0 0.0 0.0 0.0 0.0 0.0 68| |1000 10.4 0.0 0.0 0.0 0.0 0.0 0.0 68| |1100 11.3 0.0 0.0 0.0 0.0 0.0 0.0 68| |1200 11.9 0.0 0.0 0.0 0.0 0.0 0.0 68| |1300 12.5 0.0 0.0 0.0 0.0 0.0 0.0 68| |1400 12.7 0.0 0.0 0.0 0.0 0.0 0.0 68| |1500 12.6 0.0 0.0 0.0 0.0 0.0 0.0 68| |1600 12.1 0.0 0.0 0.0 0.0 0.0 0.0 68| |1700 11.3 0.0 0.0 0.0 0.0 0.0 0.0 68| |1800 10.7 0.0 0.0 0.0 0.0 0.0 0.0 68| |1900 10.3 0.0 0.0 0.0 0.0 0.0 0.0 68| |2000 10.0 0.0 0.0 0.0 0.0 0.0 0.0 0| |2100 9.8 0.0 0.0 0.0 0.0 0.0 0.0 0| |2200 9.5 0.0 0.0 0.0 0.0 0.0 0.0 0| |2300 9.3 0.0 0.0 0.0 0.0 0.0 0.0 0| +----+-------+--------------+--------+--------+--------+--------+-------+
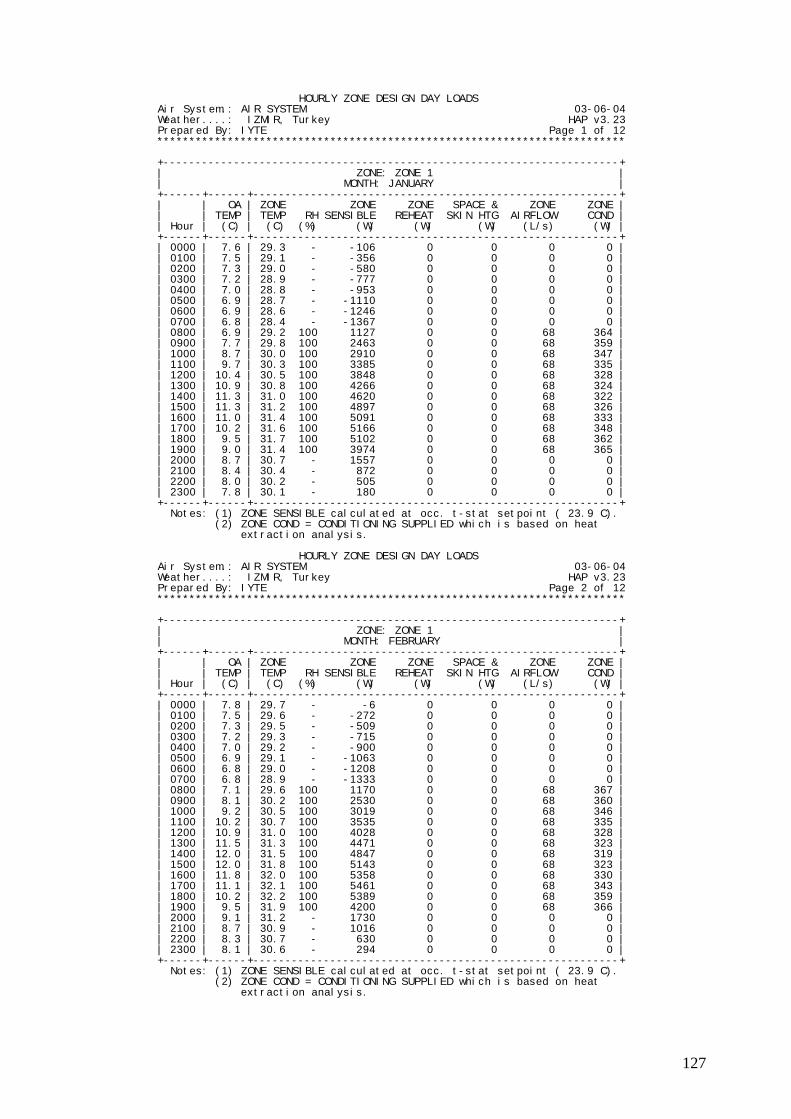
127
HOURLY ZONE DESIGN DAY LOADS Air System.: AIR SYSTEM 03-06-04 Weather....: IZMIR, Turkey HAP v3.23 Prepared By: IYTE Page 1 of 12 ************************************************************************* +-----------------------------------------------------------------------+ | ZONE: ZONE 1 | | MONTH: JANUARY | +------+------+---------------------------------------------------------+ | | OA | ZONE ZONE ZONE SPACE & ZONE ZONE | | | TEMP | TEMP RH SENSIBLE REHEAT SKIN HTG AIRFLOW COND | | Hour | (C) | (C) (%) (W) (W) (W) (L/s) (W) | +------+------+---------------------------------------------------------+ | 0000 | 7.6 | 29.3 - -106 0 0 0 0 | | 0100 | 7.5 | 29.1 - -356 0 0 0 0 | | 0200 | 7.3 | 29.0 - -580 0 0 0 0 | | 0300 | 7.2 | 28.9 - -777 0 0 0 0 | | 0400 | 7.0 | 28.8 - -953 0 0 0 0 | | 0500 | 6.9 | 28.7 - -1110 0 0 0 0 | | 0600 | 6.9 | 28.6 - -1246 0 0 0 0 | | 0700 | 6.8 | 28.4 - -1367 0 0 0 0 | | 0800 | 6.9 | 29.2 100 1127 0 0 68 364 | | 0900 | 7.7 | 29.8 100 2463 0 0 68 359 | | 1000 | 8.7 | 30.0 100 2910 0 0 68 347 | | 1100 | 9.7 | 30.3 100 3385 0 0 68 335 | | 1200 | 10.4 | 30.5 100 3848 0 0 68 328 | | 1300 | 10.9 | 30.8 100 4266 0 0 68 324 | | 1400 | 11.3 | 31.0 100 4620 0 0 68 322 | | 1500 | 11.3 | 31.2 100 4897 0 0 68 326 | | 1600 | 11.0 | 31.4 100 5091 0 0 68 333 | | 1700 | 10.2 | 31.6 100 5166 0 0 68 348 | | 1800 | 9.5 | 31.7 100 5102 0 0 68 362 | | 1900 | 9.0 | 31.4 100 3974 0 0 68 365 | | 2000 | 8.7 | 30.7 - 1557 0 0 0 0 | | 2100 | 8.4 | 30.4 - 872 0 0 0 0 | | 2200 | 8.0 | 30.2 - 505 0 0 0 0 | | 2300 | 7.8 | 30.1 - 180 0 0 0 0 | +------+------+---------------------------------------------------------+ Notes: (1) ZONE SENSIBLE calculated at occ. t-stat setpoint ( 23.9 C). (2) ZONE COND = CONDITIONING SUPPLIED which is based on heat extraction analysis. HOURLY ZONE DESIGN DAY LOADS Air System.: AIR SYSTEM 03-06-04 Weather....: IZMIR, Turkey HAP v3.23 Prepared By: IYTE Page 2 of 12 ************************************************************************* +-----------------------------------------------------------------------+ | ZONE: ZONE 1 | | MONTH: FEBRUARY | +------+------+---------------------------------------------------------+ | | OA | ZONE ZONE ZONE SPACE & ZONE ZONE | | | TEMP | TEMP RH SENSIBLE REHEAT SKIN HTG AIRFLOW COND | | Hour | (C) | (C) (%) (W) (W) (W) (L/s) (W) | +------+------+---------------------------------------------------------+ | 0000 | 7.8 | 29.7 - -6 0 0 0 0 | | 0100 | 7.5 | 29.6 - -272 0 0 0 0 | | 0200 | 7.3 | 29.5 - -509 0 0 0 0 | | 0300 | 7.2 | 29.3 - -715 0 0 0 0 | | 0400 | 7.0 | 29.2 - -900 0 0 0 0 | | 0500 | 6.9 | 29.1 - -1063 0 0 0 0 | | 0600 | 6.8 | 29.0 - -1208 0 0 0 0 | | 0700 | 6.8 | 28.9 - -1333 0 0 0 0 | | 0800 | 7.1 | 29.6 100 1170 0 0 68 367 | | 0900 | 8.1 | 30.2 100 2530 0 0 68 360 | | 1000 | 9.2 | 30.5 100 3019 0 0 68 346 | | 1100 | 10.2 | 30.7 100 3535 0 0 68 335 | | 1200 | 10.9 | 31.0 100 4028 0 0 68 328 | | 1300 | 11.5 | 31.3 100 4471 0 0 68 323 | | 1400 | 12.0 | 31.5 100 4847 0 0 68 319 | | 1500 | 12.0 | 31.8 100 5143 0 0 68 323 | | 1600 | 11.8 | 32.0 100 5358 0 0 68 330 | | 1700 | 11.1 | 32.1 100 5461 0 0 68 343 | | 1800 | 10.2 | 32.2 100 5389 0 0 68 359 | | 1900 | 9.5 | 31.9 100 4200 0 0 68 366 | | 2000 | 9.1 | 31.2 - 1730 0 0 0 0 | | 2100 | 8.7 | 30.9 - 1016 0 0 0 0 | | 2200 | 8.3 | 30.7 - 630 0 0 0 0 | | 2300 | 8.1 | 30.6 - 294 0 0 0 0 | +------+------+---------------------------------------------------------+ Notes: (1) ZONE SENSIBLE calculated at occ. t-stat setpoint ( 23.9 C). (2) ZONE COND = CONDITIONING SUPPLIED which is based on heat extraction analysis.
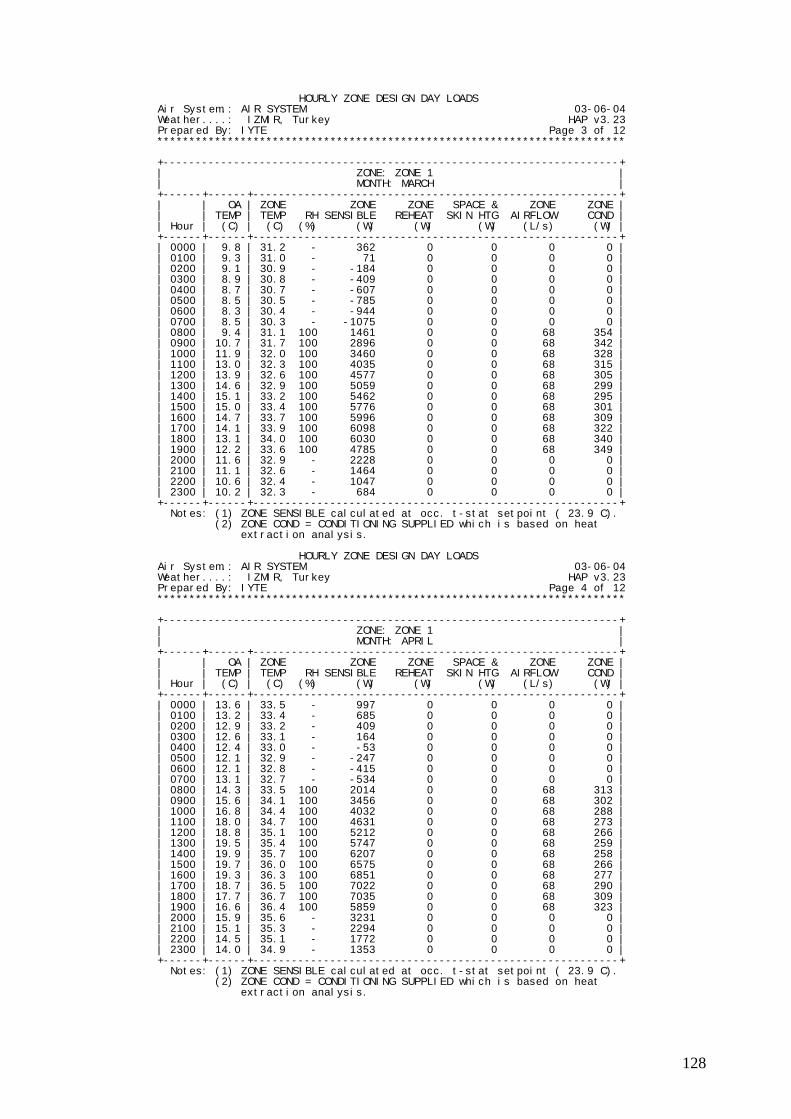
128
HOURLY ZONE DESIGN DAY LOADS Air System.: AIR SYSTEM 03-06-04 Weather....: IZMIR, Turkey HAP v3.23 Prepared By: IYTE Page 3 of 12 ************************************************************************* +-----------------------------------------------------------------------+ | ZONE: ZONE 1 | | MONTH: MARCH | +------+------+---------------------------------------------------------+ | | OA | ZONE ZONE ZONE SPACE & ZONE ZONE | | | TEMP | TEMP RH SENSIBLE REHEAT SKIN HTG AIRFLOW COND | | Hour | (C) | (C) (%) (W) (W) (W) (L/s) (W) | +------+------+---------------------------------------------------------+ | 0000 | 9.8 | 31.2 - 362 0 0 0 0 | | 0100 | 9.3 | 31.0 - 71 0 0 0 0 | | 0200 | 9.1 | 30.9 - -184 0 0 0 0 | | 0300 | 8.9 | 30.8 - -409 0 0 0 0 | | 0400 | 8.7 | 30.7 - -607 0 0 0 0 | | 0500 | 8.5 | 30.5 - -785 0 0 0 0 | | 0600 | 8.3 | 30.4 - -944 0 0 0 0 | | 0700 | 8.5 | 30.3 - -1075 0 0 0 0 | | 0800 | 9.4 | 31.1 100 1461 0 0 68 354 | | 0900 | 10.7 | 31.7 100 2896 0 0 68 342 | | 1000 | 11.9 | 32.0 100 3460 0 0 68 328 | | 1100 | 13.0 | 32.3 100 4035 0 0 68 315 | | 1200 | 13.9 | 32.6 100 4577 0 0 68 305 | | 1300 | 14.6 | 32.9 100 5059 0 0 68 299 | | 1400 | 15.1 | 33.2 100 5462 0 0 68 295 | | 1500 | 15.0 | 33.4 100 5776 0 0 68 301 | | 1600 | 14.7 | 33.7 100 5996 0 0 68 309 | | 1700 | 14.1 | 33.9 100 6098 0 0 68 322 | | 1800 | 13.1 | 34.0 100 6030 0 0 68 340 | | 1900 | 12.2 | 33.6 100 4785 0 0 68 349 | | 2000 | 11.6 | 32.9 - 2228 0 0 0 0 | | 2100 | 11.1 | 32.6 - 1464 0 0 0 0 | | 2200 | 10.6 | 32.4 - 1047 0 0 0 0 | | 2300 | 10.2 | 32.3 - 684 0 0 0 0 | +------+------+---------------------------------------------------------+ Notes: (1) ZONE SENSIBLE calculated at occ. t-stat setpoint ( 23.9 C). (2) ZONE COND = CONDITIONING SUPPLIED which is based on heat extraction analysis. HOURLY ZONE DESIGN DAY LOADS Air System.: AIR SYSTEM 03-06-04 Weather....: IZMIR, Turkey HAP v3.23 Prepared By: IYTE Page 4 of 12 ************************************************************************* +-----------------------------------------------------------------------+ | ZONE: ZONE 1 | | MONTH: APRIL | +------+------+---------------------------------------------------------+ | | OA | ZONE ZONE ZONE SPACE & ZONE ZONE | | | TEMP | TEMP RH SENSIBLE REHEAT SKIN HTG AIRFLOW COND | | Hour | (C) | (C) (%) (W) (W) (W) (L/s) (W) | +------+------+---------------------------------------------------------+ | 0000 | 13.6 | 33.5 - 997 0 0 0 0 | | 0100 | 13.2 | 33.4 - 685 0 0 0 0 | | 0200 | 12.9 | 33.2 - 409 0 0 0 0 | | 0300 | 12.6 | 33.1 - 164 0 0 0 0 | | 0400 | 12.4 | 33.0 - -53 0 0 0 0 | | 0500 | 12.1 | 32.9 - -247 0 0 0 0 | | 0600 | 12.1 | 32.8 - -415 0 0 0 0 | | 0700 | 13.1 | 32.7 - -534 0 0 0 0 | | 0800 | 14.3 | 33.5 100 2014 0 0 68 313 | | 0900 | 15.6 | 34.1 100 3456 0 0 68 302 | | 1000 | 16.8 | 34.4 100 4032 0 0 68 288 | | 1100 | 18.0 | 34.7 100 4631 0 0 68 273 | | 1200 | 18.8 | 35.1 100 5212 0 0 68 266 | | 1300 | 19.5 | 35.4 100 5747 0 0 68 259 | | 1400 | 19.9 | 35.7 100 6207 0 0 68 258 | | 1500 | 19.7 | 36.0 100 6575 0 0 68 266 | | 1600 | 19.3 | 36.3 100 6851 0 0 68 277 | | 1700 | 18.7 | 36.5 100 7022 0 0 68 290 | | 1800 | 17.7 | 36.7 100 7035 0 0 68 309 | | 1900 | 16.6 | 36.4 100 5859 0 0 68 323 | | 2000 | 15.9 | 35.6 - 3231 0 0 0 0 | | 2100 | 15.1 | 35.3 - 2294 0 0 0 0 | | 2200 | 14.5 | 35.1 - 1772 0 0 0 0 | | 2300 | 14.0 | 34.9 - 1353 0 0 0 0 | +------+------+---------------------------------------------------------+ Notes: (1) ZONE SENSIBLE calculated at occ. t-stat setpoint ( 23.9 C). (2) ZONE COND = CONDITIONING SUPPLIED which is based on heat extraction analysis.

129
HOURLY ZONE DESIGN DAY LOADS Air System.: AIR SYSTEM 03-06-04 Weather....: IZMIR, Turkey HAP v3.23 Prepared By: IYTE Page 5 of 12 ************************************************************************* +-----------------------------------------------------------------------+ | ZONE: ZONE 1 | | MONTH: MAY | +------+------+---------------------------------------------------------+ | | OA | ZONE ZONE ZONE SPACE & ZONE ZONE | | | TEMP | TEMP RH SENSIBLE REHEAT SKIN HTG AIRFLOW COND | | Hour | (C) | (C) (%) (W) (W) (W) (L/s) (W) | +------+------+---------------------------------------------------------+ | 0000 | 18.0 | 26.4 - 1661 0 0 0 0 | | 0100 | 17.3 | 26.3 - 1319 0 0 0 0 | | 0200 | 16.9 | 26.2 - 1019 0 0 0 0 | | 0300 | 16.6 | 26.1 - 754 0 0 0 0 | | 0400 | 16.2 | 26.1 - 518 0 0 0 0 | | 0500 | 16.0 | 26.0 - 310 0 0 0 0 | | 0600 | 16.3 | 25.9 - 137 0 0 0 0 | | 0700 | 18.0 | 25.9 - 40 0 0 0 0 | | 0800 | 19.3 | 24.9 58 2635 0 0 451 5219 | | 0900 | 20.6 | 25.0 62 4152 0 0 501 6009 | | 1000 | 21.9 | 25.1 60 4801 0 0 518 6378 | | 1100 | 23.0 | 25.1 59 5452 0 0 537 6753 | | 1200 | 23.9 | 25.2 58 6067 0 0 556 7114 | | 1300 | 24.4 | 25.2 57 6622 0 0 574 7437 | | 1400 | 24.7 | 25.3 57 7096 0 0 590 7713 | | 1500 | 24.6 | 25.3 56 7476 0 0 604 7922 | | 1600 | 24.2 | 25.4 56 7764 0 0 616 8068 | | 1700 | 23.6 | 25.4 56 7935 0 0 625 8134 | | 1800 | 22.5 | 25.4 57 7941 0 0 630 8076 | | 1900 | 21.4 | 25.2 54 6754 0 0 583 7249 | | 2000 | 20.6 | 27.0 - 4120 0 0 0 0 | | 2100 | 19.8 | 26.8 - 3129 0 0 0 0 | | 2200 | 19.1 | 26.6 - 2517 0 0 0 0 | | 2300 | 18.5 | 26.5 - 2048 0 0 0 0 | +------+------+---------------------------------------------------------+ Notes: (1) ZONE SENSIBLE calculated at occ. t-stat setpoint ( 23.9 C). (2) ZONE COND = CONDITIONING SUPPLIED which is based on heat extraction analysis. HOURLY ZONE DESIGN DAY LOADS Air System.: AIR SYSTEM 03-06-04 Weather....: IZMIR, Turkey HAP v3.23 Prepared By: IYTE Page 6 of 12 ************************************************************************* +-----------------------------------------------------------------------+ | ZONE: ZONE 1 | | MONTH: JUNE | +------+------+---------------------------------------------------------+ | | OA | ZONE ZONE ZONE SPACE & ZONE ZONE | | | TEMP | TEMP RH SENSIBLE REHEAT SKIN HTG AIRFLOW COND | | Hour | (C) | (C) (%) (W) (W) (W) (L/s) (W) | +------+------+---------------------------------------------------------+ | 0000 | 22.7 | 27.1 - 2366 0 0 0 0 | | 0100 | 21.9 | 27.0 - 2001 0 0 0 0 | | 0200 | 21.5 | 26.9 - 1682 0 0 0 0 | | 0300 | 21.0 | 26.8 - 1397 0 0 0 0 | | 0400 | 20.6 | 26.8 - 1144 0 0 0 0 | | 0500 | 20.4 | 26.7 - 921 0 0 0 0 | | 0600 | 20.9 | 26.7 - 743 0 0 0 0 | | 0700 | 22.9 | 26.6 - 655 0 0 0 0 | | 0800 | 24.1 | 25.1 54 3272 0 0 526 6705 | | 0900 | 25.6 | 25.2 57 4829 0 0 566 7457 | | 1000 | 26.9 | 25.2 56 5524 0 0 582 7824 | | 1100 | 28.1 | 25.3 55 6225 0 0 597 8207 | | 1200 | 28.9 | 25.3 54 6882 0 0 614 8564 | | 1300 | 29.5 | 25.4 53 7478 0 0 630 8891 | | 1400 | 29.9 | 25.4 52 7987 0 0 644 9166 | | 1500 | 29.7 | 25.5 52 8396 0 0 657 9365 | | 1600 | 29.3 | 25.5 52 8704 0 0 668 9495 | | 1700 | 28.6 | 25.5 52 8884 0 0 676 9539 | | 1800 | 27.6 | 25.5 53 8894 0 0 678 9461 | | 1900 | 26.4 | 25.4 50 7698 0 0 633 8578 | | 2000 | 25.5 | 27.6 - 5048 0 0 0 0 | | 2100 | 24.6 | 27.5 - 4001 0 0 0 0 | | 2200 | 24.0 | 27.3 - 3305 0 0 0 0 | | 2300 | 23.3 | 27.2 - 2784 0 0 0 0 | +------+------+---------------------------------------------------------+ Notes: (1) ZONE SENSIBLE calculated at occ. t-stat setpoint ( 23.9 C). (2) ZONE COND = CONDITIONING SUPPLIED which is based on heat extraction analysis.

130
HOURLY ZONE DESIGN DAY LOADS Air System.: AIR SYSTEM 03-06-04 Weather....: IZMIR, Turkey HAP v3.23 Prepared By: IYTE Page 7 of 12 ************************************************************************* +-----------------------------------------------------------------------+ | ZONE: ZONE 1 | | MONTH: JULY | +------+------+---------------------------------------------------------+ | | OA | ZONE ZONE ZONE SPACE & ZONE ZONE | | | TEMP | TEMP RH SENSIBLE REHEAT SKIN HTG AIRFLOW COND | | Hour | (C) | (C) (%) (W) (W) (W) (L/s) (W) | +------+------+---------------------------------------------------------+ | 0000 | 25.2 | 27.3 - 2623 0 0 0 0 | | 0100 | 24.5 | 27.2 - 2267 0 0 0 0 | | 0200 | 24.0 | 27.1 - 1952 0 0 0 0 | | 0300 | 23.5 | 27.1 - 1671 0 0 0 0 | | 0400 | 23.1 | 27.0 - 1420 0 0 0 0 | | 0500 | 22.7 | 27.0 - 1196 0 0 0 0 | | 0600 | 22.9 | 26.9 - 1008 0 0 0 0 | | 0700 | 24.5 | 26.9 - 891 0 0 0 0 | | 0800 | 25.6 | 25.1 52 3468 0 0 547 7163 | | 0900 | 27.2 | 25.3 56 4987 0 0 582 7870 | | 1000 | 28.7 | 25.3 55 5663 0 0 594 8220 | | 1100 | 30.0 | 25.3 54 6356 0 0 608 8588 | | 1200 | 30.9 | 25.4 53 7014 0 0 623 8937 | | 1300 | 31.5 | 25.4 52 7614 0 0 638 9256 | | 1400 | 31.8 | 25.5 51 8127 0 0 651 9519 | | 1500 | 31.7 | 25.5 51 8540 0 0 663 9715 | | 1600 | 31.4 | 25.5 51 8855 0 0 673 9844 | | 1700 | 30.8 | 25.6 51 9048 0 0 680 9888 | | 1800 | 29.9 | 25.6 52 9069 0 0 681 9797 | | 1900 | 28.7 | 25.4 49 7884 0 0 637 8923 | | 2000 | 27.8 | 27.8 - 5237 0 0 0 0 | | 2100 | 27.0 | 27.6 - 4204 0 0 0 0 | | 2200 | 26.4 | 27.5 - 3533 0 0 0 0 | | 2300 | 25.8 | 27.4 - 3030 0 0 0 0 | +------+------+---------------------------------------------------------+ Notes: (1) ZONE SENSIBLE calculated at occ. t-stat setpoint ( 23.9 C). (2) ZONE COND = CONDITIONING SUPPLIED which is based on heat extraction analysis. HOURLY ZONE DESIGN DAY LOADS Air System.: AIR SYSTEM 03-06-04 Weather....: IZMIR, Turkey HAP v3.23 Prepared By: IYTE Page 8 of 12 ************************************************************************* +-----------------------------------------------------------------------+ | ZONE: ZONE 1 | | MONTH: AUGUST | +------+------+---------------------------------------------------------+ | | OA | ZONE ZONE ZONE SPACE & ZONE ZONE | | | TEMP | TEMP RH SENSIBLE REHEAT SKIN HTG AIRFLOW COND | | Hour | (C) | (C) (%) (W) (W) (W) (L/s) (W) | +------+------+---------------------------------------------------------+ | 0000 | 24.9 | 27.1 - 2442 0 0 0 0 | | 0100 | 24.4 | 27.0 - 2112 0 0 0 0 | | 0200 | 23.9 | 26.9 - 1818 0 0 0 0 | | 0300 | 23.4 | 26.9 - 1553 0 0 0 0 | | 0400 | 23.0 | 26.8 - 1316 0 0 0 0 | | 0500 | 22.7 | 26.8 - 1106 0 0 0 0 | | 0600 | 22.6 | 26.7 - 923 0 0 0 0 | | 0700 | 23.7 | 26.7 - 794 0 0 0 0 | | 0800 | 25.0 | 25.1 53 3341 0 0 524 6754 | | 0900 | 26.6 | 25.2 57 4797 0 0 559 7443 | | 1000 | 28.1 | 25.2 56 5409 0 0 569 7761 | | 1100 | 29.5 | 25.3 54 6053 0 0 582 8108 | | 1200 | 30.5 | 25.3 54 6682 0 0 596 8450 | | 1300 | 31.1 | 25.3 53 7259 0 0 611 8760 | | 1400 | 31.5 | 25.4 52 7754 0 0 624 9022 | | 1500 | 31.4 | 25.4 52 8150 0 0 636 9211 | | 1600 | 31.0 | 25.4 52 8447 0 0 646 9333 | | 1700 | 30.3 | 25.5 52 8627 0 0 653 9371 | | 1800 | 29.2 | 25.5 53 8636 0 0 656 9288 | | 1900 | 28.1 | 25.3 50 7443 0 0 610 8403 | | 2000 | 27.3 | 27.5 - 4784 0 0 0 0 | | 2100 | 26.7 | 27.4 - 3811 0 0 0 0 | | 2200 | 26.0 | 27.2 - 3255 0 0 0 0 | | 2300 | 25.5 | 27.2 - 2816 0 0 0 0 | +------+------+---------------------------------------------------------+ Notes: (1) ZONE SENSIBLE calculated at occ. t-stat setpoint ( 23.9 C). (2) ZONE COND = CONDITIONING SUPPLIED which is based on heat extraction analysis.
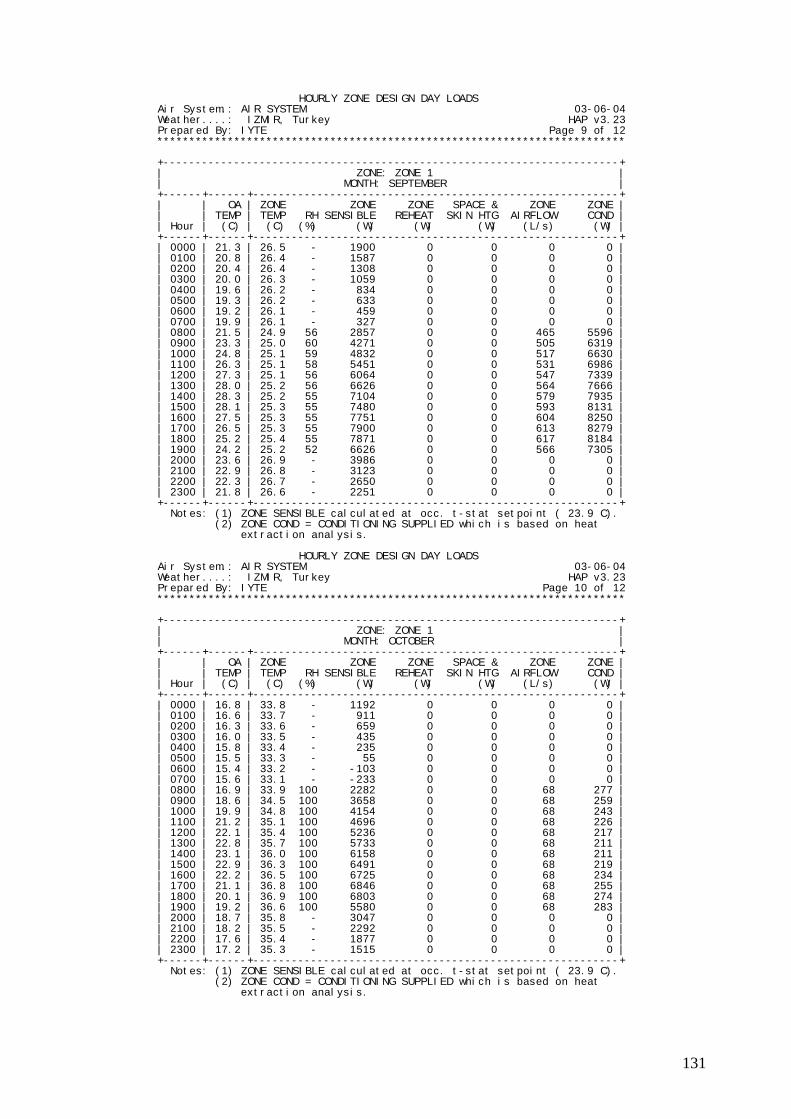
131
HOURLY ZONE DESIGN DAY LOADS Air System.: AIR SYSTEM 03-06-04 Weather....: IZMIR, Turkey HAP v3.23 Prepared By: IYTE Page 9 of 12 ************************************************************************* +-----------------------------------------------------------------------+ | ZONE: ZONE 1 | | MONTH: SEPTEMBER | +------+------+---------------------------------------------------------+ | | OA | ZONE ZONE ZONE SPACE & ZONE ZONE | | | TEMP | TEMP RH SENSIBLE REHEAT SKIN HTG AIRFLOW COND | | Hour | (C) | (C) (%) (W) (W) (W) (L/s) (W) | +------+------+---------------------------------------------------------+ | 0000 | 21.3 | 26.5 - 1900 0 0 0 0 | | 0100 | 20.8 | 26.4 - 1587 0 0 0 0 | | 0200 | 20.4 | 26.4 - 1308 0 0 0 0 | | 0300 | 20.0 | 26.3 - 1059 0 0 0 0 | | 0400 | 19.6 | 26.2 - 834 0 0 0 0 | | 0500 | 19.3 | 26.2 - 633 0 0 0 0 | | 0600 | 19.2 | 26.1 - 459 0 0 0 0 | | 0700 | 19.9 | 26.1 - 327 0 0 0 0 | | 0800 | 21.5 | 24.9 56 2857 0 0 465 5596 | | 0900 | 23.3 | 25.0 60 4271 0 0 505 6319 | | 1000 | 24.8 | 25.1 59 4832 0 0 517 6630 | | 1100 | 26.3 | 25.1 58 5451 0 0 531 6986 | | 1200 | 27.3 | 25.1 56 6064 0 0 547 7339 | | 1300 | 28.0 | 25.2 56 6626 0 0 564 7666 | | 1400 | 28.3 | 25.2 55 7104 0 0 579 7935 | | 1500 | 28.1 | 25.3 55 7480 0 0 593 8131 | | 1600 | 27.5 | 25.3 55 7751 0 0 604 8250 | | 1700 | 26.5 | 25.3 55 7900 0 0 613 8279 | | 1800 | 25.2 | 25.4 55 7871 0 0 617 8184 | | 1900 | 24.2 | 25.2 52 6626 0 0 566 7305 | | 2000 | 23.6 | 26.9 - 3986 0 0 0 0 | | 2100 | 22.9 | 26.8 - 3123 0 0 0 0 | | 2200 | 22.3 | 26.7 - 2650 0 0 0 0 | | 2300 | 21.8 | 26.6 - 2251 0 0 0 0 | +------+------+---------------------------------------------------------+ Notes: (1) ZONE SENSIBLE calculated at occ. t-stat setpoint ( 23.9 C). (2) ZONE COND = CONDITIONING SUPPLIED which is based on heat extraction analysis. HOURLY ZONE DESIGN DAY LOADS Air System.: AIR SYSTEM 03-06-04 Weather....: IZMIR, Turkey HAP v3.23 Prepared By: IYTE Page 10 of 12 ************************************************************************* +-----------------------------------------------------------------------+ | ZONE: ZONE 1 | | MONTH: OCTOBER | +------+------+---------------------------------------------------------+ | | OA | ZONE ZONE ZONE SPACE & ZONE ZONE | | | TEMP | TEMP RH SENSIBLE REHEAT SKIN HTG AIRFLOW COND | | Hour | (C) | (C) (%) (W) (W) (W) (L/s) (W) | +------+------+---------------------------------------------------------+ | 0000 | 16.8 | 33.8 - 1192 0 0 0 0 | | 0100 | 16.6 | 33.7 - 911 0 0 0 0 | | 0200 | 16.3 | 33.6 - 659 0 0 0 0 | | 0300 | 16.0 | 33.5 - 435 0 0 0 0 | | 0400 | 15.8 | 33.4 - 235 0 0 0 0 | | 0500 | 15.5 | 33.3 - 55 0 0 0 0 | | 0600 | 15.4 | 33.2 - -103 0 0 0 0 | | 0700 | 15.6 | 33.1 - -233 0 0 0 0 | | 0800 | 16.9 | 33.9 100 2282 0 0 68 277 | | 0900 | 18.6 | 34.5 100 3658 0 0 68 259 | | 1000 | 19.9 | 34.8 100 4154 0 0 68 243 | | 1100 | 21.2 | 35.1 100 4696 0 0 68 226 | | 1200 | 22.1 | 35.4 100 5236 0 0 68 217 | | 1300 | 22.8 | 35.7 100 5733 0 0 68 211 | | 1400 | 23.1 | 36.0 100 6158 0 0 68 211 | | 1500 | 22.9 | 36.3 100 6491 0 0 68 219 | | 1600 | 22.2 | 36.5 100 6725 0 0 68 234 | | 1700 | 21.1 | 36.8 100 6846 0 0 68 255 | | 1800 | 20.1 | 36.9 100 6803 0 0 68 274 | | 1900 | 19.2 | 36.6 100 5580 0 0 68 283 | | 2000 | 18.7 | 35.8 - 3047 0 0 0 0 | | 2100 | 18.2 | 35.5 - 2292 0 0 0 0 | | 2200 | 17.6 | 35.4 - 1877 0 0 0 0 | | 2300 | 17.2 | 35.3 - 1515 0 0 0 0 | +------+------+---------------------------------------------------------+ Notes: (1) ZONE SENSIBLE calculated at occ. t-stat setpoint ( 23.9 C). (2) ZONE COND = CONDITIONING SUPPLIED which is based on heat extraction analysis.

132
HOURLY ZONE DESIGN DAY LOADS Air System.: AIR SYSTEM 03-06-04 Weather....: IZMIR, Turkey HAP v3.23 Prepared By: IYTE Page 11 of 12 ************************************************************************* +-----------------------------------------------------------------------+ | ZONE: ZONE 1 | | MONTH: NOVEMBER | +------+------+---------------------------------------------------------+ | | OA | ZONE ZONE ZONE SPACE & ZONE ZONE | | | TEMP | TEMP RH SENSIBLE REHEAT SKIN HTG AIRFLOW COND | | Hour | (C) | (C) (%) (W) (W) (W) (L/s) (W) | +------+------+---------------------------------------------------------+ | 0000 | 11.9 | 31.1 - 436 0 0 0 0 | | 0100 | 11.9 | 31.0 - 184 0 0 0 0 | | 0200 | 11.7 | 30.9 - -40 0 0 0 0 | | 0300 | 11.6 | 30.7 - -237 0 0 0 0 | | 0400 | 11.4 | 30.6 - -416 0 0 0 0 | | 0500 | 11.3 | 30.5 - -574 0 0 0 0 | | 0600 | 11.1 | 30.4 - -716 0 0 0 0 | | 0700 | 11.1 | 30.3 - -839 0 0 0 0 | | 0800 | 11.7 | 31.1 100 1666 0 0 68 317 | | 0900 | 12.9 | 31.7 100 3000 0 0 68 307 | | 1000 | 14.1 | 31.9 100 3428 0 0 68 291 | | 1100 | 15.1 | 32.2 100 3885 0 0 68 279 | | 1200 | 15.8 | 32.5 100 4345 0 0 68 272 | | 1300 | 16.4 | 32.7 100 4775 0 0 68 267 | | 1400 | 16.7 | 33.0 100 5150 0 0 68 266 | | 1500 | 16.5 | 33.2 100 5446 0 0 68 273 | | 1600 | 16.0 | 33.5 100 5659 0 0 68 285 | | 1700 | 14.9 | 33.6 100 5770 0 0 68 306 | | 1800 | 14.1 | 33.7 100 5726 0 0 68 320 | | 1900 | 13.5 | 33.4 100 4577 0 0 68 325 | | 2000 | 13.1 | 32.7 - 2133 0 0 0 0 | | 2100 | 12.8 | 32.4 - 1435 0 0 0 0 | | 2200 | 12.3 | 32.3 - 1058 0 0 0 0 | | 2300 | 12.1 | 32.2 - 728 0 0 0 0 | +------+------+---------------------------------------------------------+ Notes: (1) ZONE SENSIBLE calculated at occ. t-stat setpoint ( 23.9 C). (2) ZONE COND = CONDITIONING SUPPLIED which is based on heat extraction analysis. HOURLY ZONE DESIGN DAY LOADS Air System.: AIR SYSTEM 03-06-04 Weather....: IZMIR, Turkey HAP v3.23 Prepared By: IYTE Page 12 of 12 ************************************************************************* +-----------------------------------------------------------------------+ | ZONE: ZONE 1 | | MONTH: DECEMBER | +------+------+---------------------------------------------------------+ | | OA | ZONE ZONE ZONE SPACE & ZONE ZONE | | | TEMP | TEMP RH SENSIBLE REHEAT SKIN HTG AIRFLOW COND | | Hour | (C) | (C) (%) (W) (W) (W) (L/s) (W) | +------+------+---------------------------------------------------------+ | 0000 | 9.1 | 29.7 - 32 0 0 0 0 | | 0100 | 9.0 | 29.6 - -214 0 0 0 0 | | 0200 | 8.9 | 29.5 - -430 0 0 0 0 | | 0300 | 8.8 | 29.3 - -622 0 0 0 0 | | 0400 | 8.7 | 29.2 - -790 0 0 0 0 | | 0500 | 8.6 | 29.1 - -940 0 0 0 0 | | 0600 | 8.4 | 29.0 - -1076 0 0 0 0 | | 0700 | 8.4 | 28.9 - -1195 0 0 0 0 | | 0800 | 8.5 | 29.7 100 1301 0 0 68 346 | | 0900 | 9.4 | 30.2 100 2642 0 0 68 340 | | 1000 | 10.4 | 30.5 100 3087 0 0 68 328 | | 1100 | 11.3 | 30.7 100 3551 0 0 68 318 | | 1200 | 11.9 | 31.0 100 3999 0 0 68 312 | | 1300 | 12.5 | 31.3 100 4403 0 0 68 306 | | 1400 | 12.7 | 31.5 100 4740 0 0 68 306 | | 1500 | 12.6 | 31.7 100 4997 0 0 68 312 | | 1600 | 12.1 | 31.9 100 5162 0 0 68 323 | | 1700 | 11.3 | 32.0 100 5195 0 0 68 339 | | 1800 | 10.7 | 32.1 100 5147 0 0 68 349 | | 1900 | 10.3 | 31.8 100 4052 0 0 68 352 | | 2000 | 10.0 | 31.1 - 1654 0 0 0 0 | | 2100 | 9.8 | 30.9 - 982 0 0 0 0 | | 2200 | 9.5 | 30.7 - 626 0 0 0 0 | | 2300 | 9.3 | 30.6 - 310 0 0 0 0 | +------+------+---------------------------------------------------------+ Notes: (1) ZONE SENSIBLE calculated at occ. t-stat setpoint ( 23.9 C). (2) ZONE COND = CONDITIONING SUPPLIED which is based on heat extraction analysis.
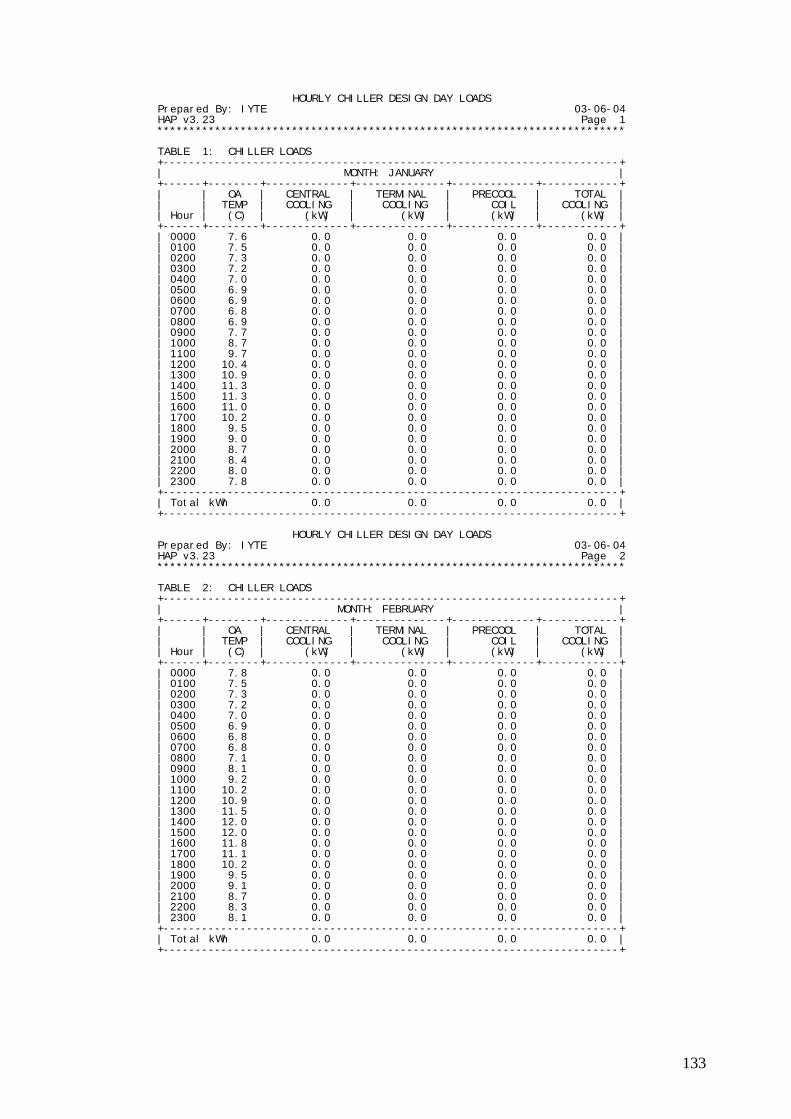
133
HOURLY CHILLER DESIGN DAY LOADS Prepared By: IYTE 03-06-04 HAP v3.23 Page 1 ************************************************************************* TABLE 1: CHILLER LOADS +-----------------------------------------------------------------------+ | MONTH: JANUARY | +------+--------+-------------+--------------+-------------+------------+ | | OA | CENTRAL | TERMINAL | PRECOOL | TOTAL | | | TEMP | COOLING | COOLING | COIL | COOLING | | Hour | (C) | (kW) | (kW) | (kW) | (kW) | +------+--------+-------------+--------------+-------------+------------+ | 0000 7.6 0.0 0.0 0.0 0.0 | | 0100 7.5 0.0 0.0 0.0 0.0 | | 0200 7.3 0.0 0.0 0.0 0.0 | | 0300 7.2 0.0 0.0 0.0 0.0 | | 0400 7.0 0.0 0.0 0.0 0.0 | | 0500 6.9 0.0 0.0 0.0 0.0 | | 0600 6.9 0.0 0.0 0.0 0.0 | | 0700 6.8 0.0 0.0 0.0 0.0 | | 0800 6.9 0.0 0.0 0.0 0.0 | | 0900 7.7 0.0 0.0 0.0 0.0 | | 1000 8.7 0.0 0.0 0.0 0.0 | | 1100 9.7 0.0 0.0 0.0 0.0 | | 1200 10.4 0.0 0.0 0.0 0.0 | | 1300 10.9 0.0 0.0 0.0 0.0 | | 1400 11.3 0.0 0.0 0.0 0.0 | | 1500 11.3 0.0 0.0 0.0 0.0 | | 1600 11.0 0.0 0.0 0.0 0.0 | | 1700 10.2 0.0 0.0 0.0 0.0 | | 1800 9.5 0.0 0.0 0.0 0.0 | | 1900 9.0 0.0 0.0 0.0 0.0 | | 2000 8.7 0.0 0.0 0.0 0.0 | | 2100 8.4 0.0 0.0 0.0 0.0 | | 2200 8.0 0.0 0.0 0.0 0.0 | | 2300 7.8 0.0 0.0 0.0 0.0 | +-----------------------------------------------------------------------+ | Total kWh 0.0 0.0 0.0 0.0 | +-----------------------------------------------------------------------+ HOURLY CHILLER DESIGN DAY LOADS Prepared By: IYTE 03-06-04 HAP v3.23 Page 2 ************************************************************************* TABLE 2: CHILLER LOADS +-----------------------------------------------------------------------+ | MONTH: FEBRUARY | +------+--------+-------------+--------------+-------------+------------+ | | OA | CENTRAL | TERMINAL | PRECOOL | TOTAL | | | TEMP | COOLING | COOLING | COIL | COOLING | | Hour | (C) | (kW) | (kW) | (kW) | (kW) | +------+--------+-------------+--------------+-------------+------------+ | 0000 7.8 0.0 0.0 0.0 0.0 | | 0100 7.5 0.0 0.0 0.0 0.0 | | 0200 7.3 0.0 0.0 0.0 0.0 | | 0300 7.2 0.0 0.0 0.0 0.0 | | 0400 7.0 0.0 0.0 0.0 0.0 | | 0500 6.9 0.0 0.0 0.0 0.0 | | 0600 6.8 0.0 0.0 0.0 0.0 | | 0700 6.8 0.0 0.0 0.0 0.0 | | 0800 7.1 0.0 0.0 0.0 0.0 | | 0900 8.1 0.0 0.0 0.0 0.0 | | 1000 9.2 0.0 0.0 0.0 0.0 | | 1100 10.2 0.0 0.0 0.0 0.0 | | 1200 10.9 0.0 0.0 0.0 0.0 | | 1300 11.5 0.0 0.0 0.0 0.0 | | 1400 12.0 0.0 0.0 0.0 0.0 | | 1500 12.0 0.0 0.0 0.0 0.0 | | 1600 11.8 0.0 0.0 0.0 0.0 | | 1700 11.1 0.0 0.0 0.0 0.0 | | 1800 10.2 0.0 0.0 0.0 0.0 | | 1900 9.5 0.0 0.0 0.0 0.0 | | 2000 9.1 0.0 0.0 0.0 0.0 | | 2100 8.7 0.0 0.0 0.0 0.0 | | 2200 8.3 0.0 0.0 0.0 0.0 | | 2300 8.1 0.0 0.0 0.0 0.0 | +-----------------------------------------------------------------------+ | Total kWh 0.0 0.0 0.0 0.0 | +-----------------------------------------------------------------------+
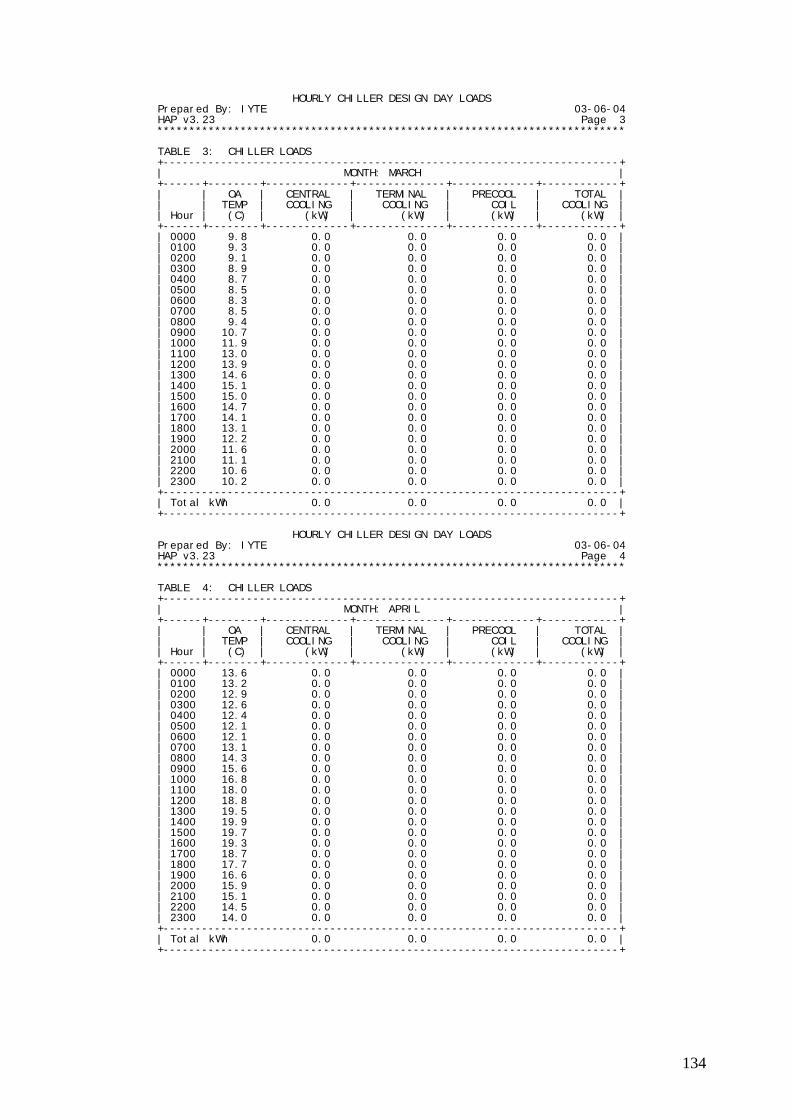
134
HOURLY CHILLER DESIGN DAY LOADS Prepared By: IYTE 03-06-04 HAP v3.23 Page 3 ************************************************************************* TABLE 3: CHILLER LOADS +-----------------------------------------------------------------------+ | MONTH: MARCH | +------+--------+-------------+--------------+-------------+------------+ | | OA | CENTRAL | TERMINAL | PRECOOL | TOTAL | | | TEMP | COOLING | COOLING | COIL | COOLING | | Hour | (C) | (kW) | (kW) | (kW) | (kW) | +------+--------+-------------+--------------+-------------+------------+ | 0000 9.8 0.0 0.0 0.0 0.0 | | 0100 9.3 0.0 0.0 0.0 0.0 | | 0200 9.1 0.0 0.0 0.0 0.0 | | 0300 8.9 0.0 0.0 0.0 0.0 | | 0400 8.7 0.0 0.0 0.0 0.0 | | 0500 8.5 0.0 0.0 0.0 0.0 | | 0600 8.3 0.0 0.0 0.0 0.0 | | 0700 8.5 0.0 0.0 0.0 0.0 | | 0800 9.4 0.0 0.0 0.0 0.0 | | 0900 10.7 0.0 0.0 0.0 0.0 | | 1000 11.9 0.0 0.0 0.0 0.0 | | 1100 13.0 0.0 0.0 0.0 0.0 | | 1200 13.9 0.0 0.0 0.0 0.0 | | 1300 14.6 0.0 0.0 0.0 0.0 | | 1400 15.1 0.0 0.0 0.0 0.0 | | 1500 15.0 0.0 0.0 0.0 0.0 | | 1600 14.7 0.0 0.0 0.0 0.0 | | 1700 14.1 0.0 0.0 0.0 0.0 | | 1800 13.1 0.0 0.0 0.0 0.0 | | 1900 12.2 0.0 0.0 0.0 0.0 | | 2000 11.6 0.0 0.0 0.0 0.0 | | 2100 11.1 0.0 0.0 0.0 0.0 | | 2200 10.6 0.0 0.0 0.0 0.0 | | 2300 10.2 0.0 0.0 0.0 0.0 | +-----------------------------------------------------------------------+ | Total kWh 0.0 0.0 0.0 0.0 | +-----------------------------------------------------------------------+ HOURLY CHILLER DESIGN DAY LOADS Prepared By: IYTE 03-06-04 HAP v3.23 Page 4 ************************************************************************* TABLE 4: CHILLER LOADS +-----------------------------------------------------------------------+ | MONTH: APRIL | +------+--------+-------------+--------------+-------------+------------+ | | OA | CENTRAL | TERMINAL | PRECOOL | TOTAL | | | TEMP | COOLING | COOLING | COIL | COOLING | | Hour | (C) | (kW) | (kW) | (kW) | (kW) | +------+--------+-------------+--------------+-------------+------------+ | 0000 13.6 0.0 0.0 0.0 0.0 | | 0100 13.2 0.0 0.0 0.0 0.0 | | 0200 12.9 0.0 0.0 0.0 0.0 | | 0300 12.6 0.0 0.0 0.0 0.0 | | 0400 12.4 0.0 0.0 0.0 0.0 | | 0500 12.1 0.0 0.0 0.0 0.0 | | 0600 12.1 0.0 0.0 0.0 0.0 | | 0700 13.1 0.0 0.0 0.0 0.0 | | 0800 14.3 0.0 0.0 0.0 0.0 | | 0900 15.6 0.0 0.0 0.0 0.0 | | 1000 16.8 0.0 0.0 0.0 0.0 | | 1100 18.0 0.0 0.0 0.0 0.0 | | 1200 18.8 0.0 0.0 0.0 0.0 | | 1300 19.5 0.0 0.0 0.0 0.0 | | 1400 19.9 0.0 0.0 0.0 0.0 | | 1500 19.7 0.0 0.0 0.0 0.0 | | 1600 19.3 0.0 0.0 0.0 0.0 | | 1700 18.7 0.0 0.0 0.0 0.0 | | 1800 17.7 0.0 0.0 0.0 0.0 | | 1900 16.6 0.0 0.0 0.0 0.0 | | 2000 15.9 0.0 0.0 0.0 0.0 | | 2100 15.1 0.0 0.0 0.0 0.0 | | 2200 14.5 0.0 0.0 0.0 0.0 | | 2300 14.0 0.0 0.0 0.0 0.0 | +-----------------------------------------------------------------------+ | Total kWh 0.0 0.0 0.0 0.0 | +-----------------------------------------------------------------------+

135
HOURLY CHILLER DESIGN DAY LOADS Prepared By: IYTE 03-06-04 HAP v3.23 Page 5 ************************************************************************* TABLE 5: CHILLER LOADS +-----------------------------------------------------------------------+ | MONTH: MAY | +------+--------+-------------+--------------+-------------+------------+ | | OA | CENTRAL | TERMINAL | PRECOOL | TOTAL | | | TEMP | COOLING | COOLING | COIL | COOLING | | Hour | (C) | (kW) | (kW) | (kW) | (kW) | +------+--------+-------------+--------------+-------------+------------+ | 0000 18.0 0.0 0.0 0.0 0.0 | | 0100 17.3 0.0 0.0 0.0 0.0 | | 0200 16.9 0.0 0.0 0.0 0.0 | | 0300 16.6 0.0 0.0 0.0 0.0 | | 0400 16.2 0.0 0.0 0.0 0.0 | | 0500 16.0 0.0 0.0 0.0 0.0 | | 0600 16.3 0.0 0.0 0.0 0.0 | | 0700 18.0 0.0 0.0 0.0 0.0 | | 0800 19.3 5.8 0.0 0.0 5.8 | | 0900 20.6 7.9 0.0 0.0 7.9 | | 1000 21.9 8.5 0.0 0.0 8.5 | | 1100 23.0 9.0 0.0 0.0 9.0 | | 1200 23.9 9.4 0.0 0.0 9.4 | | 1300 24.4 9.6 0.0 0.0 9.6 | | 1400 24.7 10.0 0.0 0.0 10.0 | | 1500 24.6 10.2 0.0 0.0 10.2 | | 1600 24.2 10.4 0.0 0.0 10.4 | | 1700 23.6 10.3 0.0 0.0 10.3 | | 1800 22.5 10.0 0.0 0.0 10.0 | | 1900 21.4 7.7 0.0 0.0 7.7 | | 2000 20.6 0.0 0.0 0.0 0.0 | | 2100 19.8 0.0 0.0 0.0 0.0 | | 2200 19.1 0.0 0.0 0.0 0.0 | | 2300 18.5 0.0 0.0 0.0 0.0 | +-----------------------------------------------------------------------+ | Total kWh 108.7 0.0 0.0 108.7 | +-----------------------------------------------------------------------+ HOURLY CHILLER DESIGN DAY LOADS Prepared By: IYTE 03-06-04 HAP v3.23 Page 6 ************************************************************************* TABLE 6: CHILLER LOADS +-----------------------------------------------------------------------+ | MONTH: JUNE | +------+--------+-------------+--------------+-------------+------------+ | | OA | CENTRAL | TERMINAL | PRECOOL | TOTAL | | | TEMP | COOLING | COOLING | COIL | COOLING | | Hour | (C) | (kW) | (kW) | (kW) | (kW) | +------+--------+-------------+--------------+-------------+------------+ | 0000 22.7 0.0 0.0 0.0 0.0 | | 0100 21.9 0.0 0.0 0.0 0.0 | | 0200 21.5 0.0 0.0 0.0 0.0 | | 0300 21.0 0.0 0.0 0.0 0.0 | | 0400 20.6 0.0 0.0 0.0 0.0 | | 0500 20.4 0.0 0.0 0.0 0.0 | | 0600 20.9 0.0 0.0 0.0 0.0 | | 0700 22.9 0.0 0.0 0.0 0.0 | | 0800 24.1 8.6 0.0 0.0 8.6 | | 0900 25.6 10.9 0.0 0.0 10.9 | | 1000 26.9 11.5 0.0 0.0 11.5 | | 1100 28.1 12.0 0.0 0.0 12.0 | | 1200 28.9 12.4 0.0 0.0 12.4 | | 1300 29.5 12.6 0.0 0.0 12.6 | | 1400 29.9 13.1 0.0 0.0 13.1 | | 1500 29.7 13.2 0.0 0.0 13.2 | | 1600 29.3 13.5 0.0 0.0 13.5 | | 1700 28.6 13.5 0.0 0.0 13.5 | | 1800 27.6 13.1 0.0 0.0 13.1 | | 1900 26.4 10.7 0.0 0.0 10.7 | | 2000 25.5 0.0 0.0 0.0 0.0 | | 2100 24.6 0.0 0.0 0.0 0.0 | | 2200 24.0 0.0 0.0 0.0 0.0 | | 2300 23.3 0.0 0.0 0.0 0.0 | +-----------------------------------------------------------------------+ | Total kWh 145.2 0.0 0.0 145.2 | +-----------------------------------------------------------------------+
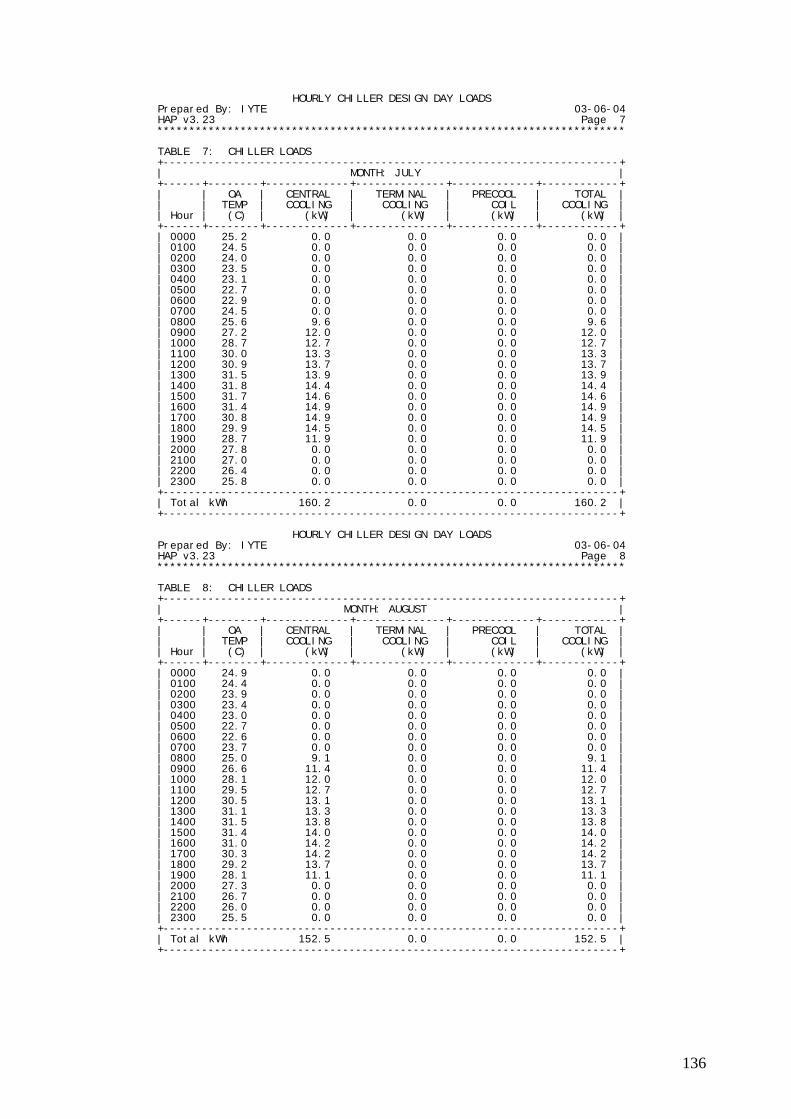
136
HOURLY CHILLER DESIGN DAY LOADS Prepared By: IYTE 03-06-04 HAP v3.23 Page 7 ************************************************************************* TABLE 7: CHILLER LOADS +-----------------------------------------------------------------------+ | MONTH: JULY | +------+--------+-------------+--------------+-------------+------------+ | | OA | CENTRAL | TERMINAL | PRECOOL | TOTAL | | | TEMP | COOLING | COOLING | COIL | COOLING | | Hour | (C) | (kW) | (kW) | (kW) | (kW) | +------+--------+-------------+--------------+-------------+------------+ | 0000 25.2 0.0 0.0 0.0 0.0 | | 0100 24.5 0.0 0.0 0.0 0.0 | | 0200 24.0 0.0 0.0 0.0 0.0 | | 0300 23.5 0.0 0.0 0.0 0.0 | | 0400 23.1 0.0 0.0 0.0 0.0 | | 0500 22.7 0.0 0.0 0.0 0.0 | | 0600 22.9 0.0 0.0 0.0 0.0 | | 0700 24.5 0.0 0.0 0.0 0.0 | | 0800 25.6 9.6 0.0 0.0 9.6 | | 0900 27.2 12.0 0.0 0.0 12.0 | | 1000 28.7 12.7 0.0 0.0 12.7 | | 1100 30.0 13.3 0.0 0.0 13.3 | | 1200 30.9 13.7 0.0 0.0 13.7 | | 1300 31.5 13.9 0.0 0.0 13.9 | | 1400 31.8 14.4 0.0 0.0 14.4 | | 1500 31.7 14.6 0.0 0.0 14.6 | | 1600 31.4 14.9 0.0 0.0 14.9 | | 1700 30.8 14.9 0.0 0.0 14.9 | | 1800 29.9 14.5 0.0 0.0 14.5 | | 1900 28.7 11.9 0.0 0.0 11.9 | | 2000 27.8 0.0 0.0 0.0 0.0 | | 2100 27.0 0.0 0.0 0.0 0.0 | | 2200 26.4 0.0 0.0 0.0 0.0 | | 2300 25.8 0.0 0.0 0.0 0.0 | +-----------------------------------------------------------------------+ | Total kWh 160.2 0.0 0.0 160.2 | +-----------------------------------------------------------------------+ HOURLY CHILLER DESIGN DAY LOADS Prepared By: IYTE 03-06-04 HAP v3.23 Page 8 ************************************************************************* TABLE 8: CHILLER LOADS +-----------------------------------------------------------------------+ | MONTH: AUGUST | +------+--------+-------------+--------------+-------------+------------+ | | OA | CENTRAL | TERMINAL | PRECOOL | TOTAL | | | TEMP | COOLING | COOLING | COIL | COOLING | | Hour | (C) | (kW) | (kW) | (kW) | (kW) | +------+--------+-------------+--------------+-------------+------------+ | 0000 24.9 0.0 0.0 0.0 0.0 | | 0100 24.4 0.0 0.0 0.0 0.0 | | 0200 23.9 0.0 0.0 0.0 0.0 | | 0300 23.4 0.0 0.0 0.0 0.0 | | 0400 23.0 0.0 0.0 0.0 0.0 | | 0500 22.7 0.0 0.0 0.0 0.0 | | 0600 22.6 0.0 0.0 0.0 0.0 | | 0700 23.7 0.0 0.0 0.0 0.0 | | 0800 25.0 9.1 0.0 0.0 9.1 | | 0900 26.6 11.4 0.0 0.0 11.4 | | 1000 28.1 12.0 0.0 0.0 12.0 | | 1100 29.5 12.7 0.0 0.0 12.7 | | 1200 30.5 13.1 0.0 0.0 13.1 | | 1300 31.1 13.3 0.0 0.0 13.3 | | 1400 31.5 13.8 0.0 0.0 13.8 | | 1500 31.4 14.0 0.0 0.0 14.0 | | 1600 31.0 14.2 0.0 0.0 14.2 | | 1700 30.3 14.2 0.0 0.0 14.2 | | 1800 29.2 13.7 0.0 0.0 13.7 | | 1900 28.1 11.1 0.0 0.0 11.1 | | 2000 27.3 0.0 0.0 0.0 0.0 | | 2100 26.7 0.0 0.0 0.0 0.0 | | 2200 26.0 0.0 0.0 0.0 0.0 | | 2300 25.5 0.0 0.0 0.0 0.0 | +-----------------------------------------------------------------------+ | Total kWh 152.5 0.0 0.0 152.5 | +-----------------------------------------------------------------------+
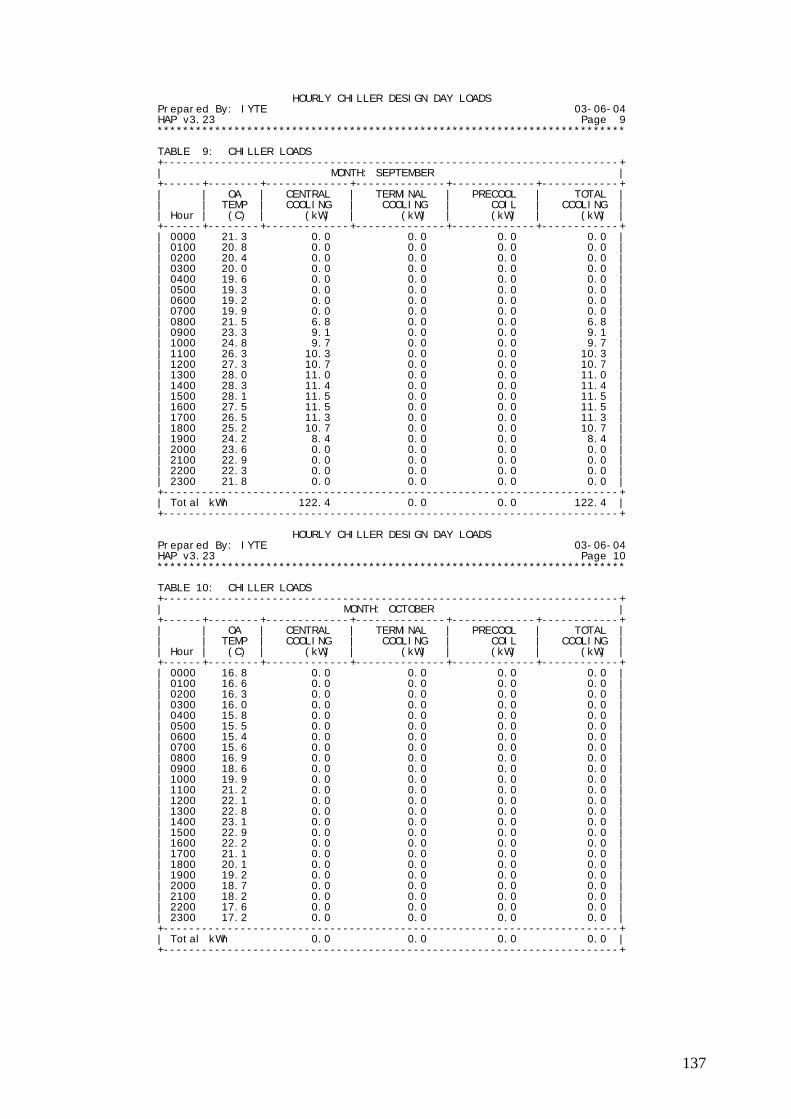
137
HOURLY CHILLER DESIGN DAY LOADS Prepared By: IYTE 03-06-04 HAP v3.23 Page 9 ************************************************************************* TABLE 9: CHILLER LOADS +-----------------------------------------------------------------------+ | MONTH: SEPTEMBER | +------+--------+-------------+--------------+-------------+------------+ | | OA | CENTRAL | TERMINAL | PRECOOL | TOTAL | | | TEMP | COOLING | COOLING | COIL | COOLING | | Hour | (C) | (kW) | (kW) | (kW) | (kW) | +------+--------+-------------+--------------+-------------+------------+ | 0000 21.3 0.0 0.0 0.0 0.0 | | 0100 20.8 0.0 0.0 0.0 0.0 | | 0200 20.4 0.0 0.0 0.0 0.0 | | 0300 20.0 0.0 0.0 0.0 0.0 | | 0400 19.6 0.0 0.0 0.0 0.0 | | 0500 19.3 0.0 0.0 0.0 0.0 | | 0600 19.2 0.0 0.0 0.0 0.0 | | 0700 19.9 0.0 0.0 0.0 0.0 | | 0800 21.5 6.8 0.0 0.0 6.8 | | 0900 23.3 9.1 0.0 0.0 9.1 | | 1000 24.8 9.7 0.0 0.0 9.7 | | 1100 26.3 10.3 0.0 0.0 10.3 | | 1200 27.3 10.7 0.0 0.0 10.7 | | 1300 28.0 11.0 0.0 0.0 11.0 | | 1400 28.3 11.4 0.0 0.0 11.4 | | 1500 28.1 11.5 0.0 0.0 11.5 | | 1600 27.5 11.5 0.0 0.0 11.5 | | 1700 26.5 11.3 0.0 0.0 11.3 | | 1800 25.2 10.7 0.0 0.0 10.7 | | 1900 24.2 8.4 0.0 0.0 8.4 | | 2000 23.6 0.0 0.0 0.0 0.0 | | 2100 22.9 0.0 0.0 0.0 0.0 | | 2200 22.3 0.0 0.0 0.0 0.0 | | 2300 21.8 0.0 0.0 0.0 0.0 | +-----------------------------------------------------------------------+ | Total kWh 122.4 0.0 0.0 122.4 | +-----------------------------------------------------------------------+ HOURLY CHILLER DESIGN DAY LOADS Prepared By: IYTE 03-06-04 HAP v3.23 Page 10 ************************************************************************* TABLE 10: CHILLER LOADS +-----------------------------------------------------------------------+ | MONTH: OCTOBER | +------+--------+-------------+--------------+-------------+------------+ | | OA | CENTRAL | TERMINAL | PRECOOL | TOTAL | | | TEMP | COOLING | COOLING | COIL | COOLING | | Hour | (C) | (kW) | (kW) | (kW) | (kW) | +------+--------+-------------+--------------+-------------+------------+ | 0000 16.8 0.0 0.0 0.0 0.0 | | 0100 16.6 0.0 0.0 0.0 0.0 | | 0200 16.3 0.0 0.0 0.0 0.0 | | 0300 16.0 0.0 0.0 0.0 0.0 | | 0400 15.8 0.0 0.0 0.0 0.0 | | 0500 15.5 0.0 0.0 0.0 0.0 | | 0600 15.4 0.0 0.0 0.0 0.0 | | 0700 15.6 0.0 0.0 0.0 0.0 | | 0800 16.9 0.0 0.0 0.0 0.0 | | 0900 18.6 0.0 0.0 0.0 0.0 | | 1000 19.9 0.0 0.0 0.0 0.0 | | 1100 21.2 0.0 0.0 0.0 0.0 | | 1200 22.1 0.0 0.0 0.0 0.0 | | 1300 22.8 0.0 0.0 0.0 0.0 | | 1400 23.1 0.0 0.0 0.0 0.0 | | 1500 22.9 0.0 0.0 0.0 0.0 | | 1600 22.2 0.0 0.0 0.0 0.0 | | 1700 21.1 0.0 0.0 0.0 0.0 | | 1800 20.1 0.0 0.0 0.0 0.0 | | 1900 19.2 0.0 0.0 0.0 0.0 | | 2000 18.7 0.0 0.0 0.0 0.0 | | 2100 18.2 0.0 0.0 0.0 0.0 | | 2200 17.6 0.0 0.0 0.0 0.0 | | 2300 17.2 0.0 0.0 0.0 0.0 | +-----------------------------------------------------------------------+ | Total kWh 0.0 0.0 0.0 0.0 | +-----------------------------------------------------------------------+

138
HOURLY CHILLER DESIGN DAY LOADS Prepared By: IYTE 03-06-04 HAP v3.23 Page 11 ************************************************************************* TABLE 11: CHILLER LOADS +-----------------------------------------------------------------------+ | MONTH: NOVEMBER | +------+--------+-------------+--------------+-------------+------------+ | | OA | CENTRAL | TERMINAL | PRECOOL | TOTAL | | | TEMP | COOLING | COOLING | COIL | COOLING | | Hour | (C) | (kW) | (kW) | (kW) | (kW) | +------+--------+-------------+--------------+-------------+------------+ | 0000 11.9 0.0 0.0 0.0 0.0 | | 0100 11.9 0.0 0.0 0.0 0.0 | | 0200 11.7 0.0 0.0 0.0 0.0 | | 0300 11.6 0.0 0.0 0.0 0.0 | | 0400 11.4 0.0 0.0 0.0 0.0 | | 0500 11.3 0.0 0.0 0.0 0.0 | | 0600 11.1 0.0 0.0 0.0 0.0 | | 0700 11.1 0.0 0.0 0.0 0.0 | | 0800 11.7 0.0 0.0 0.0 0.0 | | 0900 12.9 0.0 0.0 0.0 0.0 | | 1000 14.1 0.0 0.0 0.0 0.0 | | 1100 15.1 0.0 0.0 0.0 0.0 | | 1200 15.8 0.0 0.0 0.0 0.0 | | 1300 16.4 0.0 0.0 0.0 0.0 | | 1400 16.7 0.0 0.0 0.0 0.0 | | 1500 16.5 0.0 0.0 0.0 0.0 | | 1600 16.0 0.0 0.0 0.0 0.0 | | 1700 14.9 0.0 0.0 0.0 0.0 | | 1800 14.1 0.0 0.0 0.0 0.0 | | 1900 13.5 0.0 0.0 0.0 0.0 | | 2000 13.1 0.0 0.0 0.0 0.0 | | 2100 12.8 0.0 0.0 0.0 0.0 | | 2200 12.3 0.0 0.0 0.0 0.0 | | 2300 12.1 0.0 0.0 0.0 0.0 | +-----------------------------------------------------------------------+ | Total kWh 0.0 0.0 0.0 0.0 | +-----------------------------------------------------------------------+ HOURLY CHILLER DESIGN DAY LOADS Prepared By: IYTE 03-06-04 HAP v3.23 Page 12 ************************************************************************* TABLE 12: CHILLER LOADS +-----------------------------------------------------------------------+ | MONTH: DECEMBER | +------+--------+-------------+--------------+-------------+------------+ | | OA | CENTRAL | TERMINAL | PRECOOL | TOTAL | | | TEMP | COOLING | COOLING | COIL | COOLING | | Hour | (C) | (kW) | (kW) | (kW) | (kW) | +------+--------+-------------+--------------+-------------+------------+ | 0000 9.1 0.0 0.0 0.0 0.0 | | 0100 9.0 0.0 0.0 0.0 0.0 | | 0200 8.9 0.0 0.0 0.0 0.0 | | 0300 8.8 0.0 0.0 0.0 0.0 | | 0400 8.7 0.0 0.0 0.0 0.0 | | 0500 8.6 0.0 0.0 0.0 0.0 | | 0600 8.4 0.0 0.0 0.0 0.0 | | 0700 8.4 0.0 0.0 0.0 0.0 | | 0800 8.5 0.0 0.0 0.0 0.0 | | 0900 9.4 0.0 0.0 0.0 0.0 | | 1000 10.4 0.0 0.0 0.0 0.0 | | 1100 11.3 0.0 0.0 0.0 0.0 | | 1200 11.9 0.0 0.0 0.0 0.0 | | 1300 12.5 0.0 0.0 0.0 0.0 | | 1400 12.7 0.0 0.0 0.0 0.0 | | 1500 12.6 0.0 0.0 0.0 0.0 | | 1600 12.1 0.0 0.0 0.0 0.0 | | 1700 11.3 0.0 0.0 0.0 0.0 | | 1800 10.7 0.0 0.0 0.0 0.0 | | 1900 10.3 0.0 0.0 0.0 0.0 | | 2000 10.0 0.0 0.0 0.0 0.0 | | 2100 9.8 0.0 0.0 0.0 0.0 | | 2200 9.5 0.0 0.0 0.0 0.0 | | 2300 9.3 0.0 0.0 0.0 0.0 | +-----------------------------------------------------------------------+ | Total kWh 0.0 0.0 0.0 0.0 | +-----------------------------------------------------------------------+

139
MAXIMUM COOLING AND HEATING PLANT LOADS By: IYTE 03-06-04 HAP v3.23 Page 1 ************************************************************************* TABLE 1: MAXIMUM COOLING AND HEATING PLANT LOADS +-----------------------------------------------------------------------+ | Maximum Cooling Plant Load.....: 14.9 kW @ Jul 1600 | | Maximum Heating Plant Load.....: 0.0 kW @ Winter Design | +-----------------------------------------------------------------------+ TABLE 2: COINCIDENT COOLING LOADS FOR JUL 1600 AND DESIGN HEATING LOADS +-----------------------------------------------------------------------+ | | TOTAL | TOTAL | | AIR SYSTEM | COOLING | HEATING | | AIR SYSTEM NAME MULTIPLIER | (kW) | (kW) | +-----------------------------------------------------------------------+ | AIR SYSTEM...................... 1 | 14.9 | 0.0 | +-----------------------------------------------------------------------+

140
APPENDIX B
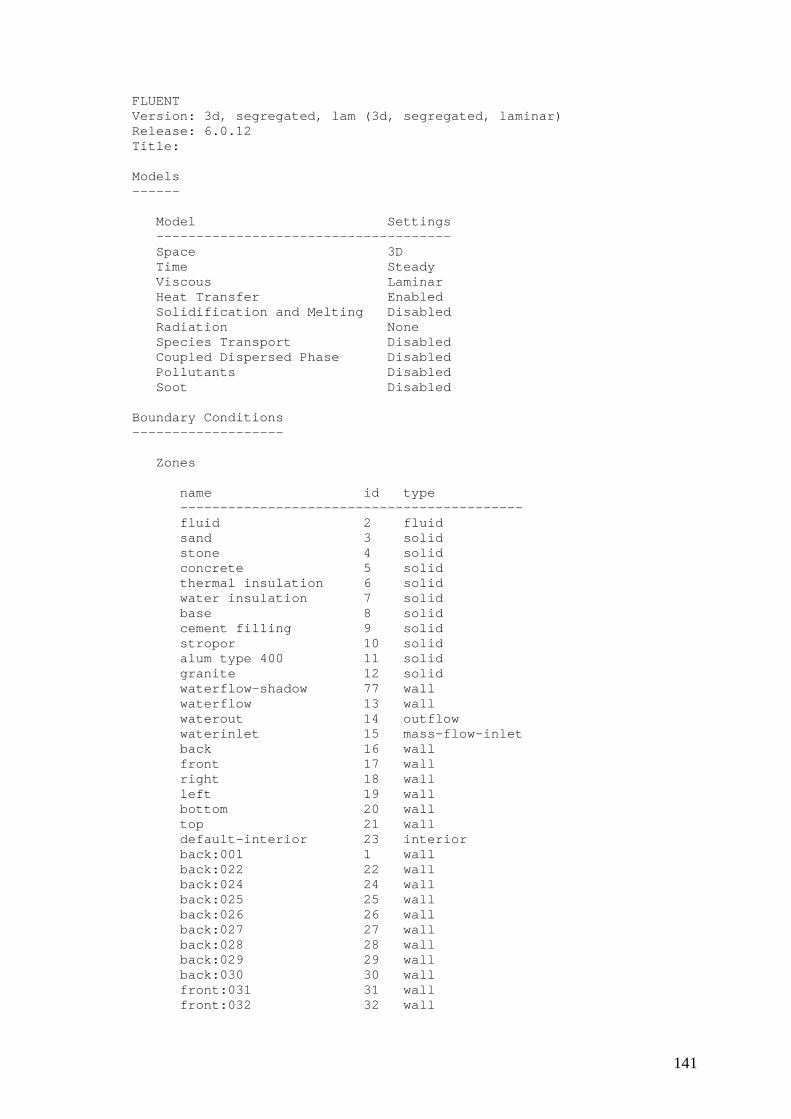
141
FLUENT Version: 3d, segregated, lam (3d, segregated, laminar) Release: 6.0.12 Title: Models ------ Model Settings ------------------------------------- Space 3D Time Steady Viscous Laminar Heat Transfer Enabled Solidification and Melting Disabled Radiation None Species Transport Disabled Coupled Dispersed Phase Disabled Pollutants Disabled Soot Disabled Boundary Conditions ------------------- Zones name id type ------------------------------------------- fluid 2 fluid sand 3 solid stone 4 solid concrete 5 solid thermal insulation 6 solid water insulation 7 solid base 8 solid cement filling 9 solid stropor 10 solid alum type 400 11 solid granite 12 solid waterflow-shadow 77 wall waterflow 13 wall waterout 14 outflow waterinlet 15 mass-flow-inlet back 16 wall front 17 wall right 18 wall left 19 wall bottom 20 wall top 21 wall default-interior 23 interior back:001 1 wall back:022 22 wall back:024 24 wall back:025 25 wall back:026 26 wall back:027 27 wall back:028 28 wall back:029 29 wall back:030 30 wall front:031 31 wall front:032 32 wall

142
front:033 33 wall front:034 34 wall front:035 35 wall front:036 36 wall front:037 37 wall front:038 38 wall front:039 39 wall right:040 40 wall right:041 41 wall right:042 42 wall right:043 43 wall right:044 44 wall right:045 45 wall right:046 46 wall right:047 47 wall right:048 48 wall left:049 49 wall left:050 50 wall left:051 51 wall left:052 52 wall left:053 53 wall left:054 54 wall left:055 55 wall left:056 56 wall left:057 57 wall default-interior:058 58 interior default-interior:059 59 interior default-interior:060 60 interior default-interior:061 61 interior default-interior:062 62 interior default-interior:063 63 interior default-interior:064 64 interior default-interior:065 65 interior default-interior:066 66 interior default-interior:067 67 interior default-interior:068 68 interior default-interior:069 69 interior default-interior:070 70 interior default-interior:071 71 interior default-interior:072 72 interior default-interior:073 73 interior default-interior:074 74 interior default-interior:075 75 interior default-interior:076 76 interior Boundary Conditions fluid Condition Value ------------------------------------------------------------- Material Name water-liquid

143
sand Condition Value ------------------------------------------------------------- Material Name sand stone Condition Value ------------------------------------------------------------- Material Name stone concrete Condition Value ------------------------------------------------------------- Material Name concrete thermal insulation Condition Value ------------------------------------------------------------- Material Name thermal insulation
water insulation Condition Value ------------------------------------------------------------- Material Name water insulation base Condition Value ------------------------------------------------------------- Material Name base cement filling Condition Value ------------------------------------------------------------- Material Name cement filling stropor Condition Value ------------------------------------------------------------- Material Name stropor alum type 400 Condition Value ------------------------------------------------------------- Material Name alum type 400 (profile )))

144
granite Condition Value ------------------------------------------------------------- Material Name granite waterflow-shadow Condition Value ---------------------------------------------------------- Wall Thickness 0 Heat Generation Rate 0 Material Name alum type 400 Thermal BC Type 3 Temperature 300 Heat Flux 0 Convective Heat Transfer Coefficient 0 Free Stream Temperature 300 External Radiation Temperature 300 waterflow Condition Value ---------------------------------------------------------- Wall Thickness 0 Heat Generation Rate 0 Material Name alum type 400 Thermal BC Type 3 Temperature 300 Heat Flux 0 Convective Heat Transfer Coefficient 0 Free Stream Temperature 300 External Radiation Temperature 300 waterout Condition Value --------------------------- Flow rate weighting 1 waterinlet Condition Value ----------------------------------------- Mass Flow Specification Method 0 Mass Flow-Rate 1 Mass Flux 1 Average Mass Flux 1 Upstream Torque Integral 1 Total Temperature 301

145
back Condition Value ------------------------------------------------------------- Temperature 300 Heat Flux 0 Convective Heat Transfer Coefficient 0 External Emissivity 1 External Radiation Temperature 300 front Condition Value ------------------------------------------------------------- Temperature 300 Heat Flux 0 Convective Heat Transfer Coefficient 0 Free Stream Temperature 300 External Radiation Temperature 300 right Condition Value ------------------------------------------------------------- Temperature 300 Heat Flux 0 Convective Heat Transfer Coefficient 0 Free Stream Temperature 300 External Radiation Temperature 300 left Condition Value ------------------------------------------------------------- Temperature 300 Heat Flux 0 Convective Heat Transfer Coefficient 0 Free Stream Temperature 300 bottom Condition Value ---------------------------------------------------------- Material Name sand Thermal BC Type 0 Temperature 283 Heat Flux 0 Convective Heat Transfer Coefficient 0 Free Stream Temperature 300 External Radiation Temperature 300
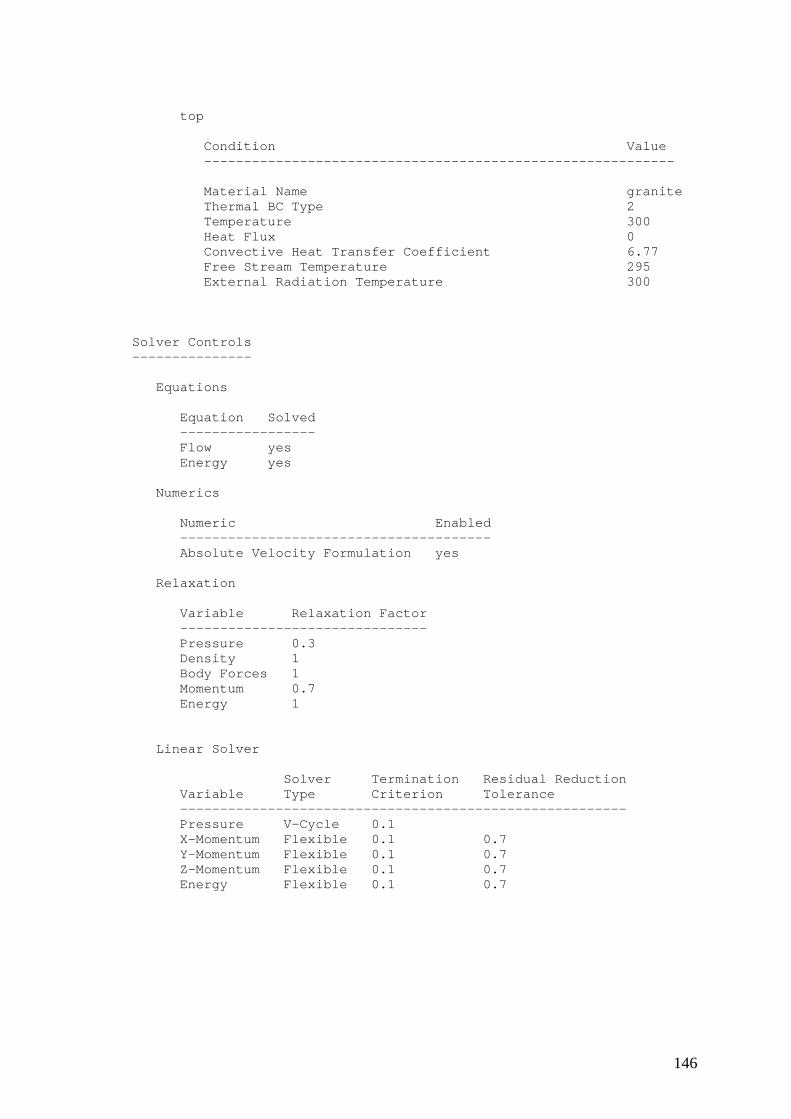
146
top Condition Value ----------------------------------------------------------- Material Name granite Thermal BC Type 2 Temperature 300 Heat Flux 0 Convective Heat Transfer Coefficient 6.77 Free Stream Temperature 295 External Radiation Temperature 300 Solver Controls --------------- Equations Equation Solved ----------------- Flow yes Energy yes Numerics Numeric Enabled --------------------------------------- Absolute Velocity Formulation yes Relaxation Variable Relaxation Factor ------------------------------- Pressure 0.3 Density 1 Body Forces 1 Momentum 0.7 Energy 1 Linear Solver Solver Termination Residual Reduction Variable Type Criterion Tolerance -------------------------------------------------------- Pressure V-Cycle 0.1 X-Momentum Flexible 0.1 0.7 Y-Momentum Flexible 0.1 0.7 Z-Momentum Flexible 0.1 0.7 Energy Flexible 0.1 0.7

147
Solution Limits Quantity Limit ----------------------------------- Minimum Absolute Pressure 1 Maximum Absolute Pressure 5000000 Minimum Temperature 1 Maximum Temperature 5000 Material Properties ------------------- Material: water-liquid (fluid) Property Units Method Value(s) -------------------------------------------------------------- Density kg/m3 constant 998.2 Cp (Specific Heat) j/kg-k constant 4182 Thermal Conductivity w/m-k constant 0.6 Viscosity kg/m-s constant 0.001003 Molecular Weight kg/kgmol constant 18.0152 L-J Characteristic Length angstrom constant 0 L-J Energy Parameter k constant 0 Thermal Expansion Coefficient 1/k constant 0 Degrees of Freedom constant 0 Material: sand (solid) Property Units Method Value(s) ---------------------------------------------------- Density kg/m3 constant 2000 Cp (Specific Heat) j/kg-k constant 800 Thermal Conductivity w/m-k constant 2.0999999 Material: stone (solid) Property Units Method Value(s) --------------------------------------------------- Density kg/m3 constant 1800 Cp (Specific Heat) j/kg-k constant 800 Thermal Conductivity w/m-k constant 1.4 Material: concrete (solid) Property Units Method Value(s) --------------------------------------------------- Density kg/m3 constant 2400 Cp (Specific Heat) j/kg-k constant 780 Thermal Conductivity w/m-k constant 2 Material: thermal insulation (solid) Property Units Method Value(s) ------------------------------------------------------ Density kg/m3 constant 15 Cp (Specific Heat) j/kg-k constant 0 Thermal Conductivity w/m-k constant 0.039999999
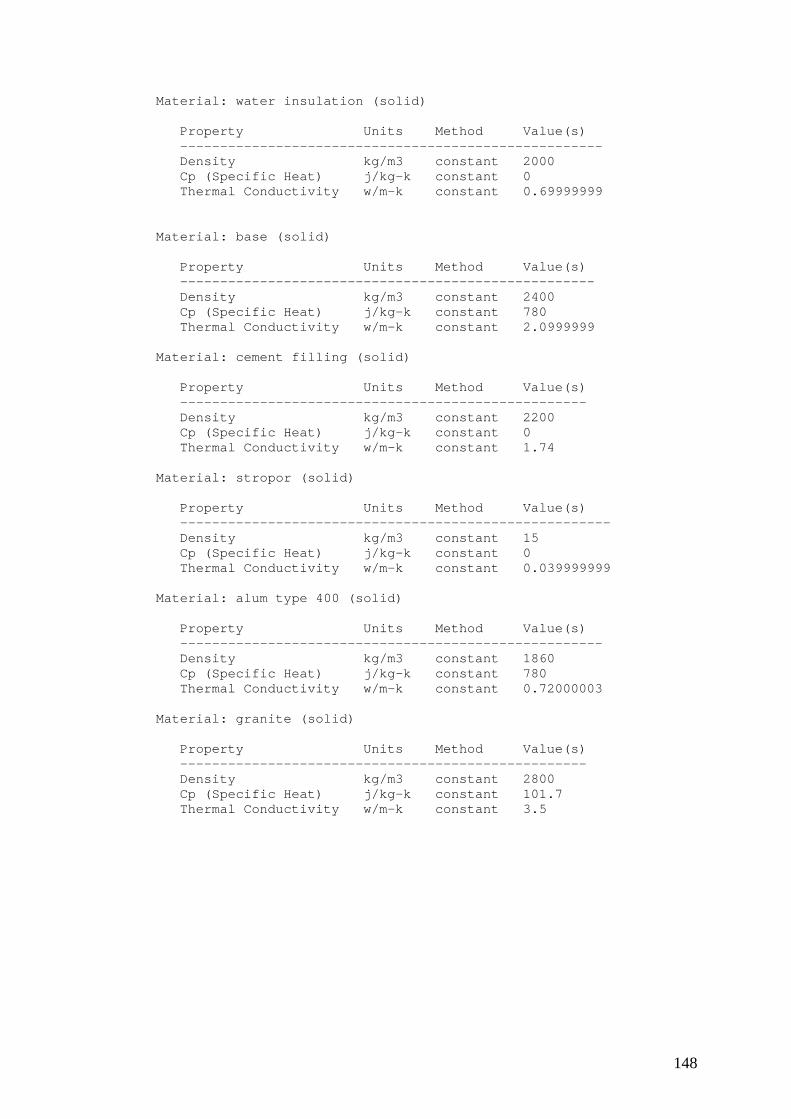
148
Material: water insulation (solid) Property Units Method Value(s) ----------------------------------------------------- Density kg/m3 constant 2000 Cp (Specific Heat) j/kg-k constant 0 Thermal Conductivity w/m-k constant 0.69999999 Material: base (solid) Property Units Method Value(s) ---------------------------------------------------- Density kg/m3 constant 2400 Cp (Specific Heat) j/kg-k constant 780 Thermal Conductivity w/m-k constant 2.0999999 Material: cement filling (solid) Property Units Method Value(s) --------------------------------------------------- Density kg/m3 constant 2200 Cp (Specific Heat) j/kg-k constant 0 Thermal Conductivity w/m-k constant 1.74 Material: stropor (solid) Property Units Method Value(s) ------------------------------------------------------ Density kg/m3 constant 15 Cp (Specific Heat) j/kg-k constant 0 Thermal Conductivity w/m-k constant 0.039999999 Material: alum type 400 (solid) Property Units Method Value(s) ----------------------------------------------------- Density kg/m3 constant 1860 Cp (Specific Heat) j/kg-k constant 780 Thermal Conductivity w/m-k constant 0.72000003 Material: granite (solid) Property Units Method Value(s) --------------------------------------------------- Density kg/m3 constant 2800 Cp (Specific Heat) j/kg-k constant 101.7 Thermal Conductivity w/m-k constant 3.5