design and performance of the dss - uni-stuttgart.de · design and performance of the dss ... the...
TRANSCRIPT

Mostafa 77
Design and Performance of the DSS
MOHAMED M. R. MOSTAFA, Applanix Corp., Richmond Hill
ABSTRACT
Emerge Digital Sensor System (DSS) is a fully integrated fully digital ruggedized system for airborne image acquisition and georeferencing. The DSS consists of a 4K x 4K digital camera, POS/AV direct georeferencing system, and a flight management system. The DSS digital camera component uses a CCD chip with a 9 µm pixel size which allows digital image acquisition with a Ground Sample Distance that ranges from 0.15 m to 1.0 m using its 35 mm and 55 mm lenses. The DSS is used primarily to generate high-resolution color and color infrared digital orthophotos and orthomosaics. The DSS data interfaces directly and seamlessly with commercial off-the-shelf photogrammetric software to allow for fast map production. Orthophotos are created using the DSS-derived directly georeferenced digital images and a Digital Elevation Model (DEM). The orthophotos and/or orthomosaics can then be used for many different mapping, GIS and remote sensing applications. Examples of these are updating and maintaining cadastral GIS databases, classifying and mapping pervious and impervious surface areas, identifying wetland areas, updating land use maps, estimating crop yields and health, preparing timber stand inventories, planning for new construction sites, verifying areas for licensing and permitting. Many of these applications involve small localized areas, corridors, or irregular spot shots, which make the medium format DSS the suitable tool to complete the job. In this paper, an overview of the system design, calibration, and performance is presented in some detail.
1. INTRODUCTION
During the past two decades, the mapping sciences have progressively moved towards digital mapping, making use of multi disciplinary developments in the geomatics field. Instead of regarding geodesy, photogrammetry, and remote sensing as separate sciences, they are seen more as an integrated discipline today. Part of this development has been spurred on by systems capable of acquiring and fusing accurate globally referenced data in fully digital form with short turn around time in a cost effective fashion. A multi sensor system is, thus, the product of integrating the concepts of kinematic geodesy, aerospace engineering, automatic control, remote sensing, and digital photogrammetry, to acquire, store, and process measurable quantities that sufficiently describe spatial and/or physical characteristics of a part of the Earth’s surface. Emerge Digital Sensor System (DSS) is designed based on the concept of multidisciplinary developments. The DSS is a fully operational, fully integrated, and fully digital multi-sensor system developed for digital mapping data acquisition. The DSS consists of a 4K x 4K digital camera, POS/AV direct georeferencing system, and a flight management system. Figure 1 shows the components of the DSS. The DSS is used primarily to generate high-resolution colour and colour infrared digital orthophotos and orthomosaics using direct georeferencing techniques. The orthophotos are created using the POS AV direct exterior orientation data and a Digital Elevation Model (DEM). The orthophotos and/or orthomosaics can then be used for many different mapping, GIS and remote sensing applications. Examples of these are:
1. Updating and maintaining cadastral GIS databases 2. Classifying and mapping pervious and impervious surface areas 3. Identifying wetland areas 4. Update land use maps 5. Estimate crop yields and health 6. Prepare timber stand inventories 7. Plan for new constructions sites 8. Verify areas for licensing and permitting
Photogrammetric Week '03 Dieter Fritsch (Ed.) Wichmann Verlag, Heidelberg, 2003

78 Mostafa
Many of these applications involve small localized areas, corridors, or irregular spot shots, which make the medium format DSS the ideal tool to complete the job. With its small size, light weight, and low power consumption, the DSS is easy to install in light aircrafts or helicopters. Furthermore, it can be configured for pilot-only operation. The Ground Sample Distance (GSD) or ground resolution achievable by the DSS ranges from 0.15 m to 1.0 m. The DSS uses modified off-the-shelf components. One of the main advantages of that approach is that, there is a clear upgrade path when new CCD technology is introduced into the commercial market place. For example, the DSS will have an upgrade path to the new larger CCD’s (such as 4K x 5K) when they become available, and its modularity means it can be used together with a second camera to produce a DualCam for increased coverage.
The DSS imager has been modified to accommodate the aerial survey requirements, such as:
• Each digital back is custom machined to remove the effects of tilts and bowing in the CCD • The camera body is modified to allow the digital back to be rigidly attached to the camera • The CCD’s are high grade quality and are cherry picked for minimum flaws • The lenses use a special locking mechanism and are optimized for focus at infinity • The digital back is modified to allow it to do both color and CIR imaging • The camera is mounted in a proprietary exoskeleton (patent pending) designed to keep the
lens, the camera body, and the IMU rigid with respect to each other • The CCD is calibrated to remove effects of flaws • The system has been ruggedized to survive the shock and vibrations exposed to in the
airborne mapping environment.
2. THE DSS DATA FLOW
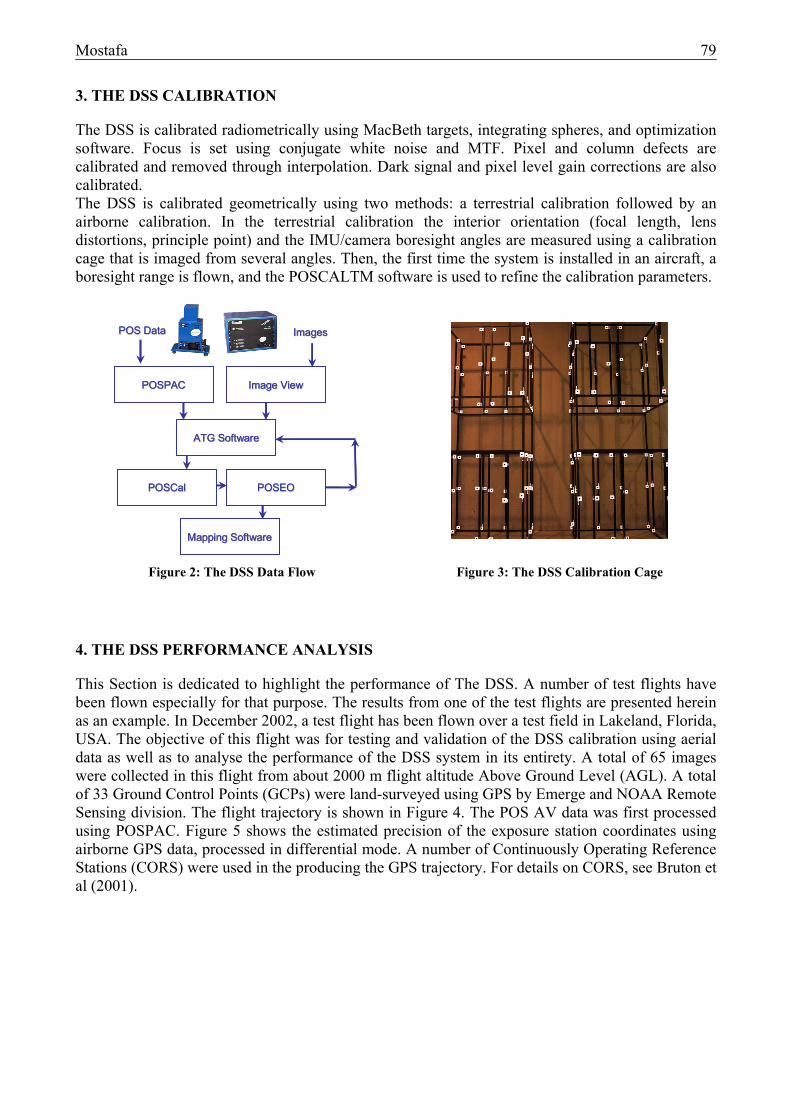
Figure 2 depicts the top-level procedure for data flow, where the POS AV data is run through POSPAC software, while the image data is run through Emerge ImageView Software. The radiometrically calibrated images together with their Exterior Orientation parameters are then imported into commercial third-party Automatic Tiepoint Generation (ATG) software to generate a number of tie/pass points per each image. Then, the image coordinates of tie/pass/GCP, the exterior orientation parameters, and any other available information are imported in POSCalTM software to calibrate the camera/IMU boresight and to do quality control of the camera calibration parameters and datum definition. Then, the data is looped once or twice between the ATG and POSCalTM softwares to obtain the ideal solution for the aforementioned calibration parameters. Then, as a final quality control step, the QC’d exterior orientation parameters, camera calibration parameters, and datum shifts (if any) are imported in a digital photogrammetric workstation to check the DSS-computed GCP ground coordinates against the land-surveyed ones, and to check the remaining y-parallax.
a) DSS Control Unit b) DSS Digital Imager c) Flight Management System
Figure 1: Emerge DSS Components
Mostafa 79
3. THE DSS CALIBRATION
The DSS is calibrated radiometrically using MacBeth targets, integrating spheres, and optimization software. Focus is set using conjugate white noise and MTF. Pixel and column defects are calibrated and removed through interpolation. Dark signal and pixel level gain corrections are also calibrated. The DSS is calibrated geometrically using two methods: a terrestrial calibration followed by an airborne calibration. In the terrestrial calibration the interior orientation (focal length, lens distortions, principle point) and the IMU/camera boresight angles are measured using a calibration cage that is imaged from several angles. Then, the first time the system is installed in an aircraft, a boresight range is flown, and the POSCALTM software is used to refine the calibration parameters.
Image ViewImage View
Mapping SoftwareMapping Software
POSEOPOSEOPOSCalPOSCal
ATG SoftwareATG Software
POSPACPOSPAC
POS DataPOS Data ImagesImages
Image ViewImage View
Mapping SoftwareMapping Software
POSEOPOSEOPOSCalPOSCal
ATG SoftwareATG Software
POSPACPOSPAC
POS DataPOS Data ImagesImages
Figure 2: The DSS Data Flow
Figure 3: The DSS Calibration Cage
4. THE DSS PERFORMANCE ANALYSIS
This Section is dedicated to highlight the performance of The DSS. A number of test flights have been flown especially for that purpose. The results from one of the test flights are presented herein as an example. In December 2002, a test flight has been flown over a test field in Lakeland, Florida, USA. The objective of this flight was for testing and validation of the DSS calibration using aerial data as well as to analyse the performance of the DSS system in its entirety. A total of 65 images were collected in this flight from about 2000 m flight altitude Above Ground Level (AGL). A total of 33 Ground Control Points (GCPs) were land-surveyed using GPS by Emerge and NOAA Remote Sensing division. The flight trajectory is shown in Figure 4. The POS AV data was first processed using POSPAC. Figure 5 shows the estimated precision of the exposure station coordinates using airborne GPS data, processed in differential mode. A number of Continuously Operating Reference Stations (CORS) were used in the producing the GPS trajectory. For details on CORS, see Bruton et al (2001).

80 Mostafa
3030
3040
3050
3060
3070
3080
3090
3100
3110
395 400 405 410 415 42
Easting (Km)
Nor
thin
g (K
m)
Figure 4: Lakeland Flight Trajectory Figure 5: GPS-Estimated Exposure Station Positioning Accuracy
Figure 6: ISAT Footprint Viewer Showing Tie/Pass/GCP points for the Lakeland Flight
The exterior orientation parameters were computed in POSPAC using the terrestrially calibrated boresight. The imagery was run through ImageView for radiometric calibration. Then, the imagery, the POS-derived exterior orientation parameters, and the GCPs were introduced to Image Station for tie point collection. Figure 6 shows the layout of the entire image block including the generated tie/pass points and the GCPs. The ISAT-generated image coordinates along with the POS-generated exterior orientation data were then imported into POSCalTM. The boresight was then re-calibrated to refine the approximate boresight that was calibrated using the terrestrial calibration. Furthermore, the camera calibration parameters were checked as a quality control measure. Figure 7 shows the

Mostafa 81
image coordinate residuals for the entire block where the RMS was about 5 µm. This is almost ½ of the DSS imager pixel size. Figure 8 shows the refined exterior orientation and their residuals.
Figure 7: POSCalTM Showing Image Coordinate Residuals after Boresight/Camera Calibration and Q/C
Figure 8: POSCalTM Showing Exterior Orientation Residuals after Boresight/Camera Calibration and Q/C

82 Mostafa
After performing the in-flight calibration and QC, the data were imported again into ISAT where the EO Analysis function (Madani and Mostafa, 2001) was used to double check the validity of the POSCalTM-calibrated parameters and to analyse the performance of the DSS. Figure 9 shows the resulted analysis. Note that the bottom panel in Figure 9 shows the statistics of the remaining y-parallax for all checkpoints showing in all possible image stereopairs, and the checkpoint residual summary. The upper edit field shows that the ‘EO to Use’ was chosen to be given. This implies that the exterior orientation parameters used in the EO Analysis function was the one computed by POSEO/POSCal. The second last quality control step was to run ISAT photo triangulation function using the aforementioned data. Figure 10 shows the summary of the results. After triangulating the already calibrated block of images, The EO Analysis function was run once more as the last QC step. The results of the last EO Analysis are shown in Figure 11. Note that the results shown in Figure 9 resulted from using the calibrated parameters by POSCalTM and those shown in Figure 11 resulted after running ISAT Photo triangulation on the data. Therefore, the ‘EO to Use’ was chosen as ‘Given’ in Figure 9, while chosen as ‘Computed’ in Figure 11. Running Photo Triangulation resulted in improving the checkpoint residuals by about 30%. Since the GSD is 0.3 m, the resulting RMS of checkpoint residuals proved to be sub-pixel in the horizontal components. In the height component, however, the accuracy is about 2.5 pixels, which is due to the poorer geometry in the case of the DSS than that of a standard 9”x9” camera equipped with a 6” lens.
Figure 9: ISAT EO Analysis Showing the Checkpoint Residuals (Lakeland Flight)

Mostafa 83
Figure 10: ISAT Photo Triangulation Results (Lakeland Flight)
Figure 11: ISAT EO Analysis after Photo Triangulation
5. CALIBRATION VALIDATION USING THE DSS IN-FLIGHT DATA
In order to check the necessary flight data to be used to do a proper in-flight calibration and quality control (QC), the following analysis has been carried out where the effect of the number of strips and number of GCPs on boresight and camera calibration has been studied.

84 Mostafa
Simultaneously, boresight and camera calibration were computed using only 2 strips of the Lakeland flight data. All 2-strip blocks have been used several times to account for the effect of the number of ground control points. The resulting boresight angles and principal point offsets were compared to the reference calibration parameters which were computed using the entire block of images. The differences are assumed here to be the accuracy of the calibration of boresight and principal point offsets. Figure 12 and Figure 13 show the accuracy of boresight and camera calibration using 2 strips of images for different. Note the strong correlation between the principal point offset in x and y components and the boresight angles in the same direction (i.e., around the x and y axis). The same analysis has been done for 3-strip blocks and 4-strip blocks. Figure 14 and Figure 15 show the same results for a 3-strip block of images, while Figure 16 and Figure 17 show the results for 4-strip block of images.
-3.00
-2.00
-1.00
0.00
1.00
2.00
3.00
12_S
WO
2
12_C
heck
23_P
oint
24
34_P
oint
_8
34_P
oint
_11
34_P
oint
_all
34_C
heck
45_N
NE1
45_N
NE2
45_P
oint
_18
45_P
oint
_14
45_P
oint
_12
45_P
oint
_11
45_P
oint
_8
45_P
oint
_all
45_C
heck
56_S
EO2
56_N
NE1
56_N
NE2
56_P
oint
_18
56_P
oint
_14
56_P
oint
_12
56_P
oint
_11
56_P
oint
_all
56_C
heck
Strip_ID_GCP_ID
Bor
esig
ht A
ngle
Diff
eren
ce (a
rcm
in)
DTx DTy DTz
-0.04
-0.03
-0.02
-0.01
0.00
0.01
0.02
0.03
0.04
12_S
WO
2
12_C
heck
23_P
oint
24
34_P
oint
_8
34_P
oint
_11
34_P
oint
_all
34_C
heck
45_N
NE1
45_N
NE2
45_P
oint
_18
45_P
oint
_14
45_P
oint
_12
45_P
oint
_11
45_P
oint
_8
45_P
oint
_all
45_C
heck
56_S
EO2
56_N
NE1
56_N
NE2
56_P
oint
_18
56_P
oint
_14
56_P
oint
_12
56_P
oint
_11
56_P
oint
_all
56_C
heck
Strip_ID_GCP_ID
Prin
cipa
l Poi
nt O
ffset
Diff
eren
ces
(mm
)
DXpp DYpp
Figure 12 Boresight Difference Using 2 Image Strips Figure 13: Principal Point Offset Difference Using 2 Strips
-3.00
-2.00
-1.00
0.00
1.00
2.00
3.00
123_
SWO
2
123_
Che
ck
234_
Poin
t_8
234_
Poin
t_11
234_
Poin
t_24
234_
Poin
t_al
l
234_
Che
ck
345_
NN
E1
345_
NN
E2
345_
Poin
t_8
345_
Poin
t_11
345_
Poin
t_12
345_
Poin
t_14
345_
Poin
t_18
345_
Poin
t_24
345_
Poin
t_al
l
345_
Che
ck
456_
Poin
t_8
456_
Poin
t_11
456_
Poin
t_12
456_
Poin
t_14
456_
Poin
t_18
456_
NN
E1
456_
NN
E2
456_
SEO
2
456_
Poin
t_al
l
456_
Che
ck
Strip_ID_GCP_ID
Bor
esig
ht A
ngle
Diff
eren
ce (a
rcm
in)
DTx DTy DTz
-0.04
-0.03
-0.02
-0.01
0.00
0.01
0.02
0.03
0.04
123_
SWO
2
123_
Che
ck
234_
Poin
t_8
234_
Poin
t_11
234_
Poin
t_24
234_
Poin
t_al
l
234_
Che
ck
345_
NN
E1
345_
NN
E2
345_
Poin
t_8
345_
Poin
t_11
345_
Poin
t_12
345_
Poin
t_14
345_
Poin
t_18
345_
Poin
t_24
345_
Poin
t_al
l
345_
Che
ck
456_
Poin
t_8
456_
Poin
t_11
456_
Poin
t_12
456_
Poin
t_14
456_
Poin
t_18
456_
NN
E1
456_
NN
E2
456_
SEO
2
456_
Poin
t_al
l
456_
Che
ck
Strip_ID_GCP_ID
Prin
cipa
l Poi
nt O
ffset
Diff
eren
ces
(mm
)
DXpp DYpp
Figure 14: Boresight Difference Using 3 Strips Figure 15: Principal Points Offset Difference Using 3 Strips
-3.00
-2.00
-1.00
0.00
1.00
2.00
3.00
123_
SWO
2
123_
Che
ck
234_
Poin
t_8
234_
Poin
t_11
234_
Poin
t_24
234_
Poin
t_al
l
234_
Che
ck
345_
NN
E1
345_
NN
E2
345_
Poin
t_8
345_
Poin
t_11
345_
Poin
t_12
345_
Poin
t_14
345_
Poin
t_18
345_
Poin
t_24
345_
Poin
t_al
l
345_
Che
ck
456_
Poin
t_8
456_
Poin
t_11
456_
Poin
t_12
456_
Poin
t_14
456_
Poin
t_18
456_
NN
E1
456_
NN
E2
456_
SEO
2
456_
Poin
t_al
l
456_
Che
ck
Strip_ID_GCP_ID
Bor
esig
ht A
ngle
Diff
eren
ce (a
rcm
in)
DTx DTy DTz
-0.04
-0.03
-0.02
-0.01
0.00
0.01
0.02
0.03
0.04
1234
_Poi
nt_8
1234
_Poi
nt_1
1
1234
_Poi
nt_2
4
1234
_Poi
nt_S
WO
2
1234
_Poi
nt_a
ll
1234
_Che
ck
2345
_Poi
nt_8
2345
_Poi
nt_1
1
2345
_Poi
nt_1
2
2345
_Poi
nt_1
4
2345
_Poi
nt_1
8
2345
_Poi
nt_2
4
2345
_NN
E1
2345
_NN
E2
2345
_Poi
nt_a
ll
2345
_Che
ck
3456
_Poi
nt_8
3456
_Poi
nt_1
1
3456
_Poi
nt_1
2
3456
_Poi
nt_1
4
3456
_Poi
nt_1
8
3456
_Poi
nt_2
4
3456
_NN
E1
3456
_NN
E2
3456
_SEO
2
3456
_all
3456
_Che
ck
Strip_ID_GCP_ID
Prin
cipa
l Poi
nt O
ffset
Diff
eren
ce (m
m)
DXpp DYpp
Figure 16: Boresight Difference Using 4 Strips Figure 17: Principal Point Offset Difference Using 4 Strips

Mostafa 85
It is clear from the analysis presented in Figures 12, 13, 14, 15 , 16, and 17, that the boresight and principal point offset calibration using flight data is very stable and consistent when using different GCPs and even without using any GCPs. This is one of the design elements of POSCalTM, which is boresight and camera calibration to be done without the need for ground control (see Mostafa, 2001). However, when using only 2 strips of images, the boresight/camera calibration was not consistent when using different 2-strip blocks. That is, for example, the boresight and principal point offsets computed using strips number 1 and 2 are different from those computed using strip number 2 and 3, respectively. On the other hand, boresight and principal point offset calibration was very stable and consistent when using different 3-strip and 4-strip blocks. Therefore, it is recommended to use at least 3 strips of images of at least 8 images each to calibrate the boresight and camera parameters.
6. CONCLUSIONS
Emerge Digital Sensor System (DSS) has been designed for orthophoto generation data collection. It consists of a 4kx4k digital camera, a POS AV system, and a flight management system. The DSS has been tested in numerous test flights since the Spring of 2002. The test results and analysis of one of the flights that was flown over a test field in Lakeland, Florida, are presented. The results proved that the DSS different components and the system as a whole performed to the system specifications. When flying the DSS equipped with a 55 m lens over Lakeland from a 2000 m flight altitude (which resulted in a 0.3 m ground sample distance) the accuracy of directly computing the coordinates of GCPs were at 0.2 and 0.25 m accuracy in X, and Y respectively and 0.8 m in the elevation. Running the entire data set through Photo-T showed an accuracy improvement of about 30% in all three coordinate components. To study the accuracy of calibration using the necessary number of images and image strips, a number of simultaneous boresight/ camera calibration were done using 2-strip, 3-strip, and 4-strip image blocks. The results show that the 2-strip image block is not consistent enough to do the calibration. However, for the 3-strip and 4-strip blocks the results are very stable and consistent when using different configurations of 3- and 4-strip blocks and different configuration of GCPs. It is therefore, recommended to use the data processing flow described in this article and following the quality control procedure presented here when processing DSS-derived data.
7. ACKNOWLEDGEMENTS
Dr. Madani of Z/I Imaging is gratefully acknowledged for his continuous cooperation during the analysis presented here. Joe Hutton, Greg Lipa, and Rosalind Bobbitt of Applanix Corporation are acknowledged for their continuous efforts with data collection, processing and analysis. Mr. Mike Aslaksen of NOAA is gratefully acknowledged for providing the GCPs for Lakeland used for the analysis presented here. Mr. Kikuo Tachibana of PASCO Corporation is thanked for his fruitful discussions.
8. REFERENCES
Beyer, H.A., 1992. Geometric and Radiometric Analysis of a CCD-Camera Based photogrammetric Close-Range System, Ph.D. Thesis, Institut für Geodäsie und Photogrammetrie, ETH-Hönggerberg, CH-8093 Zürich, Mitteilungen Nr. 51.

86 Mostafa
Bruton, A.M., Mostafa, M.M.R., and Scherzinger, B.M., 2001. Airborne DGPS Without Dedicated Base Stations for Mapping Applications. Proceedings of ION-GPS 2001, Salt Lake City, Utah, USA, Sept 11-14.
Ebner H. (1976): Self-Calibrating Block Adjustment. Bildmessung und Luftbildwesen 44, 128-139. FGDC, 1998, Geospatial Positioning Accuracy Standards, FGDC-STD-007.3-1998, Part 3:
National Standard for Spatial Data Accuracy (NSSDA). Fraser, C.S., 1997. Digital Camera Self Calibration, ISPRS Journal of Photogrammetry & Remote
Sensing, 52(1997): 149-159. Gibson, J. R. (1994): Photogrammetric Calibration of a Digital Electro-optical Stereo Imaging
System. GEOMATICA, Vol. 48, pp. 95-109. Greening, T., Schickler, W., Thorpe, A. (2000): The Proper Use of Directly Observed Orientation
Data: Aerial Triangulation is not Obsolete. 2000 ASPRS Annual Conference, Washington, DC, May 22–26.
Hinz, A. (1997): Design concepts for digital photogrammetric cameras. In: Photogrammetric
Week ‘97, Eds. D. Fritsch/D. Hobbie, Wichmann, Heidelberg (this book). Hofmann, O., A. Kaltenecker und F. Müller (1993): Das flugzeuggestützte digitale
Dreizeilenaufnahme- und Auswertesystem DPA - erste Erprobungsberichte. In: Photogrammetric Week ‘93, Eds. D. Fritsch/D. Hobbie, Wichmann, Karlsruhe, pp. 97-107.
Lichti, D.D. and M. A. Chapman, 1997. Constrained FEM Self-Calibration, PE&RS, 63(9): 1111-
1119. Madani, M. and M.M.R. Mostafa (2001). ISAT Direct Exterior Orientation QA/QC Strategy Using
POS Data. Proceedings of OEEPE Workshop: Integrated Sensor Orientation, Hanover, Germany, September 17-18, 2001.
Mostafa, M.M.R., J. Hutton, and E. Lithopoulos, 2001. Direct Georeferencing of Frame Imagery -
An Error Budget. Proceedings, The Third International Mobile Mapping Symposium, Cairo, Egypt, January 3-5.
Mostafa, M.M.R. (2001): Boresight Calibration of Integrated Inertial/Camera Systems. Proceed. Int.
Symposium on Kinematic Systems in Geodesy, Geomatics and Navigation – KIS 2001, Banff, Canada, June 5-8.
Mostafa, M.M.R. and K.P. Schwarz, 2000. A Multi-Sensor System for Airborne Image Capture and
Georeferencing. PE&RS, 66 (12): 1417-1424. Mostafa, M.M.R. and K-P Schwarz, 1999. An Autonomous Multi-Sensor System for Airborne
Digital Image Capture and Georeferencing, Proceedings of the ASPRS Annual Convention, Portland, Oregon, May 17-21, pp. 976 - 987.
Schwarz, K.P., M.A. Chapman, M.E. Cannon and P. Gong, 1993. An Integrated INS/GPS
Approach to The Georeferencing of Remotely Sensed Data, PE&RS, 59(11): 1167-1674.

Mostafa 87
Schwarz, K. P. (1995): Integrated Airborne Navigation Systems for Photogrammetry. In: Photogrammetric Week ‘95, Eds. D. Fritsch/D. Hobbie, Wichmann, Heidelberg, pp. 139-153.
Teuchert, W. D. (1997): New Achievements in an old Art: Overview Account on ”Optical and
Infrared Cameras and Sensors”. Proceed. 3rd International Airborne Remote Sensing Conference and Exhibition, Copenhagen.
Škaloud, J., M. Cramer, K.P. Schwarz, 1996. Exterior Orientation by Direct Measurement of
Position and Attitude, International Archives of Photogrammetry and Remote Sensing, 31 (B3): 125-130.
Ziemann, H. (1997): Comparison the Photogrammetric Performance of film-based aerial cameras
and digital cameras. In: Photogrammetric Week ‘97, Eds. D. Fritsch/D. Hobbie, Wichmann, Heidelberg (this book).
Schenk T. (1996): Digital Aerial Triangulation. In: International Archives of Photogrammetry and
Remote Sensing, (31), Part B3, 735-745.