design and simulation of a pv and sdhw systems...
TRANSCRIPT
Master of Science Thesis KTH School of Industrial Engineering and Management
Energy Technology EGI-2010-2012 Division of xxx
SE-100 44 STOCKHOLM
Design and Simulation of a PV and SDHW Systems using TRNSYS
for Graphit Kropfmühl Aktien Gesellschaft Training School in
Ancuabe
Salomão Chicala
Saide Habibo Abdala Anlaué

-2-
Master of Science Thesis EGI 2012-125MSC
Title
Design and Simulation of a PV and SDHW
Systems using TRNSYS for Graphit
Kropfmühl Aktien Gesellschaft Training
School in Ancuabe
Salomao Chicala
Saide Habibo Abdala Anlaué
Approved
Date
Examiner
Björn Palm
Supervisor
Peter Kjaerboe (KTH)
Jörn von Grabe (Local - TUM)
Geraldo Nhumaio (Local - UEM)
Commissioner
Contact person

-3-
Abstract
Mozambique is a country with some problems concerning the interconnection of electric grid and lack of local distributor of fossil fuels like GPL, gasoline and diesel in many districts. Due to the lack of fuel distributors the price of mentioned fossil fuels increases when moving away from the main three harbors (Nacala, Beira and Maputo) to the inland and many roads are not in good condition for driving fuel trucks. Even in districts where are already connected to the national electric grid it is often observed cut off due to different kind of problems such as obsolete infrastructure, stealing of electric components and lack of alternative (back up) electric grid and resource.
The aim of the present project is to design and simulate a stand-alone photovoltaic system and a solar water heating system for a projected training school in Ancuabe district at the Northern Province of Cabo Delgado. The school project is owned by a Germany mining company called Graphit Kropfmühl AG with graphite exploitation concession in Mozambique. These systems were simulated using TRNSYS software, a transient simulation program.
In the modeling of those systems in TRNSYS all required components where represented by different Types. The results for the photovoltaic system were optimized in such way that the total power consumption comes totally from the system. So to fulfill this goal it was important to monitor the simulation indicator of power coming from grid in order to reduce to zero, without increasing the batteries capacity. Due to this a considerable dumped power were observed and it can be directed to the workshop during the day for the light and low power appliances. Dumped power is the power which is produced and is not used by the system, in other hand the power from grid is the power that the user has to pay from available electricity grid around or it is the power that is not covered by the installed photovoltaic system.
In other hand for the solar water heating system it was optimized so that throughout the year the load hot water temperature during the shower time in dormitory is between 39-40oC as recommended and at the same time the system is designed to work without an auxiliary heating to avoid extra cost with other kind of energy for the auxiliary heater.
The goal of the systems optimization with TRNSYS is to have best gains without increasing the system and consequently reducing the high initial investment cost.
Keywords: Photovoltaic system, solar hot water system, TRNSYS, optimization, power, cost.

-4-
Acknowledgments
Thanks to our Supervisors Peter Kjaerboe, Jörn von Grabe and for Geraldo Nhumaio their efforts in helping with different questions, problems and the report, to the course Director Andrew Martin and Local coordinator Carlos Lucas for organizing the course, to the Technical University of Munich for supporting our thesis performance, to the Oskar Von Miller Forum for the accommodation in Munich. And we would also like to extend our thanks to all who direct or indirectly helped us and made this project possible. Finally we would like to thank our families for their patience and support during the course.

-5-
Abbreviations
AC – Alternative current AG – Aktien Gesellschaft
DC – Direct current dim – dimensionless EHPT – Evacuated Heat Pipe Tube
ETC – evacuated tube collector F – Solar fraction (dim.) FPC – flat plate collector FSOC - Fractional state of charge
GK - Graphit Kropfmühl HVAC - Heating, ventilation and air conditioning IEA – International Energy Agency
MPPT - maximum power point tracker
PV – Photovoltaic
SCT – Solar Concentrating Technology
SDHW – Solar Domestic Hot Water
SHW - Solar Hot Water SOC – state of charge (dim),
STC – Standardized Test Conditions STEP – Solar Total Energy Project TMY - Typical Meteorological Year TRNSYS – Transient System Simulation Program
Acronyms
CO2 – Carbon dioxide
Cos(φ) – power coefficient (dim)
Cp – Specific heat of the collector fluid (J/kgK)
FR – Collector heat removal factor (dim)
GT - Total solar irradiance on the plane of the panel (W/m2)
Iac – alternative current (A)
Idc – direct current (A)
KJ/h – kilojoules per hour L – Annual energy required by the load (GJ).

-6-
L – Required load LAUX – annual energy required by the auxiliary (GJ). ṁ - Mass flow rate of the collector fluid (kg/s)
m/s – meter per second Mton – Mega ton
Ƞinv – inverter efficiency (dim)
nm – nanometer Pin – input power (W)
Pout – output power (W)
q – Present or actual battery capacity (Ah)
Qaux – the annual auxiliary energy required (kJ) Qload – the annual energy required by the load (kJ) Qloss – the annual energy lost from the storage tank and pipes (kJ) qmax – nominal capacity of the battery (Ah)
Qu – rate of useful energy (W) Qu – Thermal energy collected where Qu = mCp(Ti-To)(W) Ta – Ambient air temperature (oC)
Ti – Fluid inlet temperature (oC)
TWh – Terra Watt hour
UA – overall loss conductance (W/K) UL – Collector loss transfer coefficient (W/m2) (UL = Ut +Ub+Ue)
UL – heat loss coefficient (W/m2 _C) V – Storage tank volume (m3) Vac – alternative voltage (V)
Vac – direct voltage (V)
W – Watt W/day – Watt per day
Τα - Tau-alpha product of the collector (dim)
I – Collector efficiency (dim)
-7-
List of figures Figure 2.1: Solar radiation spectrum Figure 2.2: The basic schematic for a typical solar-thermal energy conversion system Figure 2.3: Solar cell Figure 2.4: Flat plate collector Figure 2.5: Evacuated tube collector Figure 2.6 PV/T arrays on the roof of Solar Zentrum Allgäu in Germany
Figure.3.1 Block diagram of photovoltaic system Figure 3.2 Hoppecke battery cell sample Figure 4.1: Daily power consumption
Figure 4.2: Dumped power and power from grid through the year at 0.75 FSOC
Figure 4.3: Dumped power and power from grid through the year at 0.55 FSOC
Figure 4.4 The hourly outlet and load temperature throughout the year by inlet flow at 105 l/h and 8 PFC.
Figure 4.5 The relationship between the load temperature and average tank temperature
Figure 4.6 Load temperature (red line) and average tank temperature (blue line) at flow rate of 105 l/h and 7 collectors.
Figure 4.7 Hourly outlet and load temperature throughout the year by inlet flow at 110 l/h and 8 PFC.
Figure 5.1 Annual wind speed in Ancuabe
Figure 5.2 Water temperatures in tank and in the load during the month of June
Figure 5.3 Average temperature of the water in the month of July
Figure 5.4 Average temperature of the tank and load temperature in the month August
Figure 5.5: Average outlet temperature from the collector in January at mass flow of 105 l/h

-8-
List of tables Table 3.1 PV data and Design parameters for type 94a
Table.3.2. Energy distribution by the system
Table 3.3 State of charge of the battery throughout the year
Table.3.4. Energy distribution by the system
Table 3.5 State of charge of the battery throughout the year
Table.3.6 Energy distribution by the system
Table 3.7 State of charge of the battery throughout the year
Table.3.8 Energy distribution by the system
Table 3.9 State of charge of the battery throughout the year
Table.3.10 Energy distribution by the system
Table 3.11 State of charge of the battery throughout the year
Table.3.12 Energy distribution by the system
Table 3.13 State of charge of the battery throughout the year
Table.3.14 Solar thermal collector type1b
Table 5.1 Correlation between CN, Dumped Energy and Energy from Grid

-9-
Table of Contents Abstract ......................................................................................................................................................................... 3
1 Introduction ....................................................................................................................................................... 11
1.1 Motivation ................................................................................................................................................. 12
1.2 Objectives ................................................................................................................................................ 13
1.2.1 General Objective ........................................................................................................................ 13
1.2.2 Specific Objectives ...................................................................................................................... 13
1.3 Methodology ........................................................................................................................................... 13
1.4 Scope ......................................................................................................................................................... 13
Chapter 2 .................................................................................................................................................................... 14
2 Literature review ............................................................................................................................................. 14
2.1 Solar energy ............................................................................................................................................ 14
2.2 Solar radiation ........................................................................................................................................ 15
2.3 Solar energy technology .................................................................................................................... 16
2.3.1 Applications .................................................................................................................................... 17
2.3.2 Photovoltaic .......................................................................................................................................... 18
2.3.3 Solar thermal collectors ............................................................................................................. 20
2.3.3.1 Flat plate collectors ........................................................................................................................ 20
2.3.3.2 Evacuated tube collectors ........................................................................................................... 23
2.4 PV/T System ........................................................................................................................................... 24
Chapter 3 .................................................................................................................................................................... 26
3 Design and simulation of the system with TRNSYS 16 Software .............................................. 26
3.1 Photovoltaic system description ..................................................................................................... 26
3.1.1 Weather Data – Type 109 TMY ............................................................................................. 27
3.1.2 Photovoltaic Module – Type 94a ........................................................................................... 27
3.1.3 Solar lead acid accumulator .................................................................................................... 28
3.1.4 Inverter and charger controller ............................................................................................... 30
3.1.5 Simulation ....................................................................................................................................... 31
3.2 Hot Water System simulation ........................................................................................................... 37
Chapter 4 .................................................................................................................................................................... 39
4 Optimization of the system ......................................................................................................................... 39
4.1 Optimization of the photovoltaic system ...................................................................................... 40
4.2 Optimization of the hot water system ............................................................................................ 41
Chapter 5 .................................................................................................................................................................... 45
5 Economical Evaluation ................................................................................................................................ 45
5.1 Energy needs ......................................................................................................................................... 45

-10-
5.2 Reason to install PV and SHW systems ..................................................................................... 46
5.2.1 Photovoltaic System ................................................................................................................... 46
5.2.2 Solar hot water system .............................................................................................................. 48
5.3 Overview of the cost ............................................................................................................................ 50
5.3.1 Photovoltaic system .................................................................................................................... 50
5.3.2 Solar hot water system .............................................................................................................. 51
Chapter 6 .................................................................................................................................................................... 52
6 Results and discussion ................................................................................................................................ 52
Chapter 7 .................................................................................................................................................................... 54
7 Conclusions ...................................................................................................................................................... 54
Chapter 8 .................................................................................................................................................................... 54
8 Recommendations ......................................................................................................................................... 54
References ................................................................................................................................................................. 56
Appendices ................................................................................................................................................................ 58

-11-
Chapter 1
1 Introduction
The welfare of the human is sometime measured by the quality of energy availability and so to prepare the scholars for good gains during their professional courses for the Graphite mine at Ancuabe District in the northern province of Cabo Delgado in Mozambique (see appendix 1). Seeking the well being of the trainees, the Graphit Kropfmühl Aktien Gesellschaft (GK AG) is projecting to have a Photovoltaic system and Solar heating water system for its training school in that local.
Cabo Delgado is one of the provinces with the lowest electricity access less than 1,6% in 2004 Chambal et al [1], although this data should be slightly increased now because the province is now connected to National electric grid. The national electric grid as shown in appendix 2 faces many cut off due to diverse reasons, such as normal operational failures and sabotage trough the line. In other hand it has to be taken into account that this grid has no alternative grid to satisfy the clients during the servicing and cut off. Due to the lack of backup systems it is a good investment to have a stand-alone photovoltaic system in the training school which will provide electricity with low cost during the operation. According to recent report from the Key World Energy Statistic [2] statistic about Mozambique indicates that in 2009 the country produced 11.92 Mton of energy and consumed 10.36 TWh of electricity.
Concerning to hot water system, it was not possible to get any kind of local data, because normally the people in Mozambique use basket or other kind of domestic utensils to get hot water, in other hand few people in the provinces capitals cities and around of them use an electrical domestic heater. It happens because the country has no extreme winter, although it has to be mentioned that the people has a habit of getting a shower with hot water.
For the designing and simulation of both systems with TRNSYS [3] it was used the weather data from Pemba available in the software, as the nearest weather station to Ancuabe. Manual calculation for both systems were also performed by the daily solar radiation average considered for Pemba was 5.9 kWh/hm2, according to Cuamba et al 2006 [4].
The performance of the simulation was taken using the TRNSYS 16 Software [3], considering types which are compatible with the existing components in the market of photovoltaic and solar hot water systems. For the photovoltaic system it was used the Type 94a to represent the PV module, for the inverter and charger control it was used the Type 48b and for the battery Type 47c. In other hand the following Types were applied in the hot water system to represent the respective components: Type 73 for the plate flat collector, as controller for the pump, tank and outlet temperature from the collector Type 2d, Type 110 for the variable speed pump, Type 38 for plug flow tank. The same weather data Type was used for both systems as those are simulated for the same place and in the same simulation studio, although for results
-12-
visualization, two separated plotters Type 65 were used, so that the hot water results and PV system results come in separated sheets.
One of the goals of the present project was to simulate and optimize a system for the GK Training School taking into account the reduction of the initial investment cost without reducing its quality and performance., as it is known investments in renewable energies are high, although those are decreasing with a boom production of PV modules from Asian countries such as China and India. Such goals were possible to meet simulating with the TRNSYS software through its Type parameters and those parameters are in many cases in conformity with the data given by solar systems components producer or Technical data provided by the solar system seller.
According to the meteorological simulation data Type 109-TMY2 provided by the software, the PV system was optimized in such way that the electricity coming from the public grid or other source could be less than 1% through the year and at the same time decreasing the capacity of the batteries from 6000 Ah to 2000 Ah calculated in mathematical formulas for PV designing without using TRNSYS see appendix. 3 table, in order to reduce the cost of the system. Those results of less than 1% of electricity coming from other electricity source are important, because Ancuabe District has constant cut off in its electricity grid and so to have a photovoltaic system will avoid lack of electricity during the different activities. The solar water system was also designed and simulated in such way it does not need an auxiliary water heating source and through the year can provide hot water at 40 oC to the consumers [5].
1.1 Motivation
People in developing countries and even in developed countries face energy problems, making these groups of the humanity suffer in different manners. The people in the countryside from developing countries have to walk long distances looking for biomass (wood) for their daily energy needs since last years, in other hand in the developed countries they suffer directly due to fossil fuels crisis, where their energy needs were increased drastically per capita which forced them to look for alternative and sustainable energy sources. The present work can be used in Mozambique as sample in the usage of solar energy for water heating and electricity production for schools, hospitals, governmental institutions and households. In Mozambique presently the solar energy is less used in cities, where they are connected to the national electric grid. This way of thinking shall be changed by the decision makers. With help of TRNSYS software tools, where it is possible to optimize solar energy systems and other types of energy systems through the year, it is time to think ahead in the popularization of solar energy usage in Mozambique both in cities and rural areas. Nevertheless the present job is a small contribution in achieving one of the Millennium Development Goals which expects to reduce the

-13-
dependence on the use of conventional energy sources such as fossil fuels and reducing the present CO2 emission until 2050 to 50% according to International Energy Agency (IEA), energy technology perspective 2008 and 2010 [6,7]. According to IEA statistic CO2 highlight 2011 [8] the CO2 emission in the world derived from electricity and heat production represents 41% of the whole CO2 emission after the transport sector and Industry, so due to those emission statistics every action taken in the energy sector to reduce the CO2 emission is welcome. The mentioned reasons were the motivation to continue working in this area of renewable energy and looking for the best alternative technology in special those which can reduce the cost of the system for the owners.
1.2 Objectives
1.2.1 General Objective
To design and simulate a photovoltaic and solar thermal system
1.2.2 Specific Objectives
Simulate both systems without auxiliary energy sources; Optimize the photovoltaic system; Reduce the power from grid nearly to zero per cent; Optimize the solar thermal system; Keep the load temperature from solar thermal system closed to 40 oC; Recommend the best design with lowest cost.
1.3 Methodology
Literature review; Evaluation and choosing of the appropriate TRNSYS types for the simulation; Evaluation of the different system components available in the market; Analyze TRNSYS type parameters and technical data from producer; Simulation of the system; Results discussion.
1.4 Scope
The present report is divided into 8 chapters, where the chapter 1 focalizes the body of the whole report in introduction, objectives, the methodology and motivation. The chapter 2 deals exclusively with the literature review, in this section it is reviewed the solar technologies in special those which meet the aim of this project. Chapter 3 introduces the TRNSYS software and the description of the manifold components used during the simulation and it also concentrates in the design and simulation of the system using the said software. Chapter 4 deals on the optimization of the hot water system and photovoltaic system. The chapter 5 evaluated the economical side

-14-
of the system, but the evaluation was only based on the market prices of the main components such as PV modules and solar collectors. Chapter 6 presents the results and discussion and comprised the calculated data with simulation results. The chapter 7 is reserved for conclusion and finally the chapter 8 gives some ideas as the results of the present study, could be used in the future or as devices. It is also necessary to mention that this report includes different references and appendices.
Chapter 2
2 Literature review
2.1 Solar energy
The sun has a diameter of about 1,390,000 km composed of a sphere, where a nuclear fusion is taking place continuously. But only a small fraction of the energy produced in the sun is sent to earth surface and it is responsible for the life at the earth surface. This energy emission is climate and year season dependant, although this small energy fraction received from the sun in the earth if it could be totally converted into useful energy it should cover about 15,000 times the energy needs in the whole world, in other hand it has to be considered that the sun duration in different locations will depend on the weather condition, season and geographical location. Due to geographical localization in sunbelts the yearly global solar radiation exceed 2200 kW/m2 and in north Europe the maximum solar radiation on the horizontal surface is about 1100 kWh/m2, Weiss in solar system design for a house 2003 [9].
The total solar energy absorbed by Earth's atmosphere, oceans and land masses is approximately 3,850,000 Exajoule (EJ) per year. The amount of solar energy reaching the surface of the planet is so vast that in one year it is about twice as much as will ever be obtained from all of the Earth's non-renewable resources of coal, oil, natural gas, and mined uranium combined [10].
Almost all of the energy that drives the various systems (climate systems, ecosystems, hydrologic systems and others) found on the Earth originates from the sun. The solar energy is created at the core of the sun when hydrogen atoms are fused into helium by nuclear fusion. The core occupies an area from the sun’s center to about a quarter of the star’s radius [11].
Solar energy refers primarily to the use of solar radiation for practical ends. However, all renewable energies, other than geothermal and tidal, derive their energy from the sun. Solar energy can be harnessed at different levels around the world, mostly depending on distance from the equator.

-15-
Earth's land surface, oceans and atmosphere absorb solar radiation, and this raises their temperature. Warm air containing evaporated water from the oceans rises, causing atmospheric circulation or convection. When the air reaches a high altitude, where the temperature is low, water vapor condenses into clouds, which rain onto the Earth's surface, completing the water cyle. The latent heat of water condensation amplifies convection, producing atmospheric phenomena such as wind, cyclones and anti-cyclones. Sunlight absorbed by the oceans and land masses keeps the surface at an average temperature of 14 °C. By photosynthesis green plants convert solar energy into chemical energy, which produces food, wood and the biomass from which fossil fuels are derived [10].
2.2 Solar radiation
The light emitted by the sun follows closely the emission of radiation by a “perfect” emitter at a temperature of 5800 K [7]. Solar radiation spectrum (Figure 2.1) describes the visible and near-visible (ultraviolet and near-infrared) radiation emitted from the sun. The different regions are described by their wavelength range within the broad band range of 0.20 to 4.0 µm (microns). Terrestrial radiation is a term used to describe infrared radiation emitted from the atmosphere.
Figure 2.1: Solar radiation spectrum (Source: http://en.wikipedia.org/wiki/File:Solar_Spectrum.png)
Given the amount of energy radiated by the sun and the average Earth-Sun distance of 149.5 million kilometers, the amount of radiation intercepted by the outer limits of the atmosphere can be calculated to be around 1367 W/m2. Only about 40% of the solar energy intercepted at the top of Earth's atmosphere passes through to the
-16-
surface. The atmosphere reflects and scatters some of the received visible radiation. Gamma rays, X-rays, and ultraviolet radiation less than 200 nanometers in wavelength are selectively absorbed in the atmosphere by oxygen and nitrogen and turned into heat energy. Most of the solar ultraviolet radiation with a range of wavelengths from 200 to 300 nm is absorbed by the concentration of ozone (O3) gas found in the stratosphere. Infrared solar radiation with wavelengths greater than 700 nm is partially absorbed by carbon dioxide, ozone, and water present in the atmosphere in liquid and vapors forms. Roughly 30% of the sun's visible radiation (wavelengths from 400 nm to 700 nm) is reflected back to space by the atmosphere or the Earth's surface. The reflectivity of the Earth or anybody is referred to as its albedo defined as the ratio of light reflected to the light received from a source, expressed as a number between zero meaning total absorption and one which is considered to be total reflectance [11].
Outside the earth's atmosphere, solar radiation has an intensity of approximately 1367 W/m2. This is the value at mean earth-sun distance at the top of the atmosphere and is referred to as the Solar Constant. On the surface of the earth on a clear day, at noon, the direct beam radiation will be approximately 1000 W/m2 for many locations [12].
The availability of energy is affected by location (including latitude and elevation), season, and time of day. All of which can be readily determined. However, the biggest factors affecting the available energy are cloud cover and other meteorological conditions which vary with location and time.
2.3 Solar energy technology
Solar energy, radiant light and heat from the sun, has been harnessed by humans since ancient times using a range of ever-evolving technologies. Solar energy technologies include heating, photovolltaic, thermal electricity and solar architecture, which can make considerable contributions to solving some of the most urgent problems the world now faces.
Solar technologies are broadly characterized as either passive or active depending on the way they capture, convert and distribute sunlight. Active solar techniques use photovoltaic panels, pumps, solar thermal collectors and fans to convert sunlight into useful outputs. Passive solar techniques include selecting materials with favorable thermal properties, designing spaces that naturally circulate air, and referencing the position of a building to the Sun. Active solar technologies increase the supply of energy and are considered supply side technologies, while passive solar technologies reduce the need for alternate resources and are generally considered demand side technologies [13].
-17-
2.3.1 Applications
Solar energy can be applied in many areas such as Architecture and urban planning (passive solar architecture are orientation relative to the Sun), Agriculture and horticulture (capture of solar energy in order to optimize the productivity of plants and different kind of pest control), Solar lighting (systems collect and distribute sunlight to provide interior illumination), Solar thermal (can be used for water heating, space heating, space cooling and process heat generation), Water heating, Cooking, Solar Power, among others [10].
2.3.1.1 Heating, cooling and ventilation
Heating, ventilation, and air conditioning (HVAC) systems account for 30% (4.65 EJ) of the energy used in commercial buildings and nearly 50% (10.1 EJ) of the energy used in residential buildings. Solar heating, cooling and ventilation technologies can be used to offset a portion of this energy [10].
Thermal mass is any material that can be used to store heat—heat from the Sun in the case of solar energy. Common thermal mass materials include stone, cement and water. Historically they have been used in arid climates or warm temperate regions to keep buildings cool by absorbing solar energy during the day and radiating stored heat to the cooler atmosphere at night. However they can be used in cold temperate areas to maintain warm as well. The size and placement of thermal mass depend on several factors such as climate, daylighting and shading conditions. When properly incorporated, thermal mass maintains space temperatures in a comfortable range and reduces the need for auxiliary heating and cooling equipment [1,].
A solar chimney (or thermal chimney, in this context) is a passive solar ventilation system composed of a vertical shaft connecting the interior and exterior of a building. As the chimney warms, the air inside is heated causing an updraft that pulls air through the building. Performance can be improved by using glazing and thermal mass materials in a way that mimics greenhouses [14].
2.3.1.2 Solar heat process
Solar concentrating technologies (SCT) such as parabolic dish, trough and Scheffler reflectors can provide process heat for commercial and industrial applications. The first commercial system was the Solar Total Energy Project (STEP) in Shenandoah, Georgia, USA where a field of 114 parabolic dishes provided 50% of the process heating, air conditioning and electrical requirements for a clothing factory. This grid-connected cogeneration system provided 400 kW of electricity plus thermal energy in the form of 401 kW steam and 468 kW chilled water, and had a one hour peak load thermal storage [15].
Evaporation ponds are shallow pools that concentrate dissolved solids through evaporation. The use of evaporation ponds to obtain salt from sea water is one of the oldest applications of solar energy. Modern uses include concentrating brine solutions used in leach mining and removing dissolved solids from waste streams.

-18-
2.3.1.3 Solar power
The solar power is the conversion of sunlight into electricity, either directly using photovoltaic module, or directly using a concentrated solar power technology (CSP). CSP systems use lenses or mirrors and tracking systems to focus a large area of sunlight into a small beam. The concentrated heat is then used as source for a conventional power plant, this heat is collected by concentrating linear Fresnel reflectors, stirling dish and solar power tower. Various techniques are used to track the sun and focus light, but all those techniques have the same aim to heat the working fluid for power production (Figure 2.2) or energy storage, in other side PV cells convert light into electric current using the photoelectric effect [13].
In the 1980s was developed the first commercial CSP plants and in the Mojave Desert in Califfornia was installed one of the largest CSP in the world, the called Solar Energy Generating System (SEGS) since 1985 with power production capacity of 354 MW. Other big concentrating solar power plants are the Solnova in Spain with the power capacity of 150 MW, Agua Calient Solar Park in the USA with power capacity production of 247 MW and Charanka Solar Park in India with power capacity production of 214 MW. Some solar projects are now being developed to produce about a 1GW [13].
Figure 2.2 The basic schematic for a typical solar-thermal energy conversion system [9]
2.3.2 Photovoltaic
The first solar cell was constructed by Charles Fritts in the 1880s [13]. In 1931 a German engineer, Dr Bruno Lange, developed a photo cell using silver selenide in place of copper oxide [16]. Although the prototype selenium cells converted less than 1% of incident light into electricity, both Ernst Werner von Siemens and James Clerk Maxwell recognized the importance of this discovery. Following the work of Russell Ohl in the 1940s, researchers Gerald Pearson, Calvin Fuller and Daryl Chapin created the silicon solar cell in 1954 [16].
Solar cells (Figure 2.3) produce direct current electricity from sun light, which can be used to power equipment or to recharge a battery. The first practical application of

-19-
photovoltaics was to power orbiting satellites and other spacecraft, but today the majority of photovoltaic modules are used for grid connected power generation. In this case an inverter is required to convert the DC to AC. There is a smaller market for off-grid power for remote dwellings, boats, recreational vehicles, electric cars, roadside emergecy telephone, remote sensing, and cathodic protection of pipeline.
Photovoltaic power generation employs solar panels composed of a number of solar cells containing a photovoltaic material. Materials presently used for photovoltaics include monocrystaline silicon, polycrystalline silicon, amorphus silicon, cadmmium telluride, and copper idium gallium selenide/sulfide. Due to the growing demand for renewable energy source, the manufacturing of solar cells and PV arrays has advanced considerably in recent years.
Cells require protection from the environment and are usually packaged tightly behind a glass sheet. When more power is required than a single cell can deliver, cells are electrically connected together to form photovoltaic modules, or solar panels. A single module is enough to power an emergency telephone, but for a house or a power plant the modules must be arranged in multiples as arrays.
PV power capacity is measured as maximum power output under standardized test conditions (STC) in "Wp" (Watts peak). The actual power output at a particular point in time may be less than or greater than this standardized, or "rated," value, depending on geographical location, time of day, weather conditions, and other factors. Solar photovoltaic array capacity factors are typically under 25%, which is lower than many other industrial sources of electricity. [16]
A significant market has emerged in off-grid locations for solar-power-charged storage-battery based solutions. These often provide the only electricity available [9]. The first commercial installation of this kind was in 1966 on Ogami Island in Japan to transition Ogami Lighthouse from gas torch to fully self-sufficient electrical power.
Figure 2.3: Solar cell (Source: http://en.wikipedia.org/wiki/File:Solar_cell.png )

-20-
Photovoltaic panels based on crystalline silicon modules are encountering competition in the market by panels that employ thin-film solar cells (CdTe CIGS, amorphous Si, microcrystalline Si), which had been rapidly evolving and are expected to account for 31% of the global installed power by 2013. However, precipitous drops in prices for polysilicon and their panels in late 2011 have caused some thin-film makers to exit the market and others to experience severely squeezed profits. Other developments include casting wafers instead of sawing, concentrator modules, “Silver” cells, and continuous printing [16].
2.3.3 Solar thermal collectors
A solar thermal collector is a solar collector designed to collect heat by absorbing sunlight. The term is applied to solar hot water panels, but may also be used to denote more complex installations such as solar parabolic, solar trough and solar towers or simpler installations such solar air heat. The more complex collectors are generally used in solar power plant, where solar heat is used to generate electricity by heating water to produce steam which drives a turbine connected to an electrical generator. The simpler collectors are typically used for supplemental space heating in residential and commercial buildings. A collector is a device for converting the energy in solar radiation into a more usable or storable form. The energy in sunlight is in the form of electromagnetic radiation from the infrared (long) to the ultraviolet (short) wavelengths. The solar energy striking the Earth's surface depends on weather conditions, as well as location and orientation of the surface, but overall, it averages about 1000 watts per square meter under clear skies with the surface directly perpendicular to the sun's rays [1].
Solar collectors fall into two general categories: non-concentrating and concentrating. In the non-concentrating type, the collector area (i.e., the area that intercepts the solar radiation) is the same as the absorber area (i.e., the area absorbing the radiation). In these types the whole solar panel absorbs the light.
Flat-plate and evacuated-tube solar collectors are examples of non-concentrating collectors which are used to collect heat for space heating, domestic hot water or cooling with an absorption chiller.
2.3.3.1 Flat plate collectors
Flat-plate collectors (Figure 2.4), developed by Hottel and Whillier in the 1950s, are the most common types. They consist of a dark flat-plate absorber of solar energy, a transparent cover that allows solar energy to pass through but reduces heat losses, a heat-transport fluid (air, antifreeze or water) to remove heat from the absorber, and a heat insulating backing. The absorber consists of a thin absorber sheet (of thermally stable polymers, aluminum, steel or copper, to which a matte black or selective coating is applied) often backed by a grid or coil of fluid tubing placed in an insulated casing with a glass or polycarbonate cover. In water heat panels, fluid is usually circulated through tubing to transfer heat from the absorber to an insulated water

-21-
tank. This may be achieved directly or through a heat exchanger. Most air heat fabricators and some water heat manufacturers have a completely flooded absorber consisting of two sheets of metal which the fluid passes between. Because the heat exchange area is greater they may be marginally more efficient than traditional absorbers [13].
Sunlight passes through the glazing and strikes the absorber plate, which heats up, changing solar energy into heat energy. The heat is transferred to liquid passing through pipes attached to the absorber plate. Absorber plates are commonly painted with "selective coatings," which absorb and retain heat better than ordinary black paint. Absorber plates are usually made of metal—typically copper or aluminum—because the metal is a good heat conductor. Copper is more expensive, but is a better conductor and less prone to corrosion than aluminum. In locations with average available solar energy, flat plate collectors are sized approximately one-half- to one-square foot per gallon of one-day's hot water use.
As an alternative to metal collectors, new polymer flat plate collectors are now being produced in Europe. These may be wholly polymer, or they may include metal plates in front of freeze-tolerant water channels made of silicone rubber. Polymers, being flexible and therefore freeze-tolerant, are able to contain plain water instead of antifreeze, so that they may be plumbed directly into existing water tanks instead of needing to use heat exchangers which lower efficiency. By dispensing with a heat exchanger in these flat plate panels, temperatures need not be quite so high for the circulation system to be switched on, so such direct circulation panels, whether polymer or otherwise, can be more efficient, particularly at low light levels.
Some early selectively coated polymer collectors suffered from overheating when insulated, as stagnation temperatures can exceed the melting point of the polymer [17]. For example, the melting point of polypropylene is 160 °C, while the stagnation temperature of insulated thermal collectors can exceed 180 °C if control strategies are not used. For this reason polypropylene is not often used in glazed selectively coated solar collectors. Increasingly polymers such as high temperate silicones (which melt at over 250 °C) are being used. Some non polypropylene polymer based glazed solar collectors are matte black coated rather than selectively coated to reduce the stagnation temperature to 150 °C or less.
In areas where freezing is a possibility, freeze-tolerance (the capability to freeze repeatedly without cracking) can be achieved by the use of flexible polymers. Conventional metal collectors are vulnerable to damage from freezing, so if they are water filled they must be carefully plumbed so they completely drain down using gravity before freezing is expected, so that they do not crack. Many metal collectors are installed as part of a sealed heat exchanger system. Rather than having the potable water flow directly through the collectors, a mixture of water and antifreeze such as propylene glycol (which is used in the food industry) is used as a heat exchange fluid to protect against freeze damage down to a locally determined risk temperature that depends on the proportion of propylene glycol in the mixture. The

-22-
use of glycol lowers the water's heat carrying capacity marginally, while the addition of an extra heat exchanger may lower system performance at low light levels.
A pool or unglazed collector is a simple form of flat-plate collector without a transparent cover. Typically polypropylene or EPDM rubber or silicone rubber is used as an absorber. Used for pool heating it can work quite well when the desired output temperature is near the ambient temperature (that is, when it is warm outside). As the ambient temperature gets cooler, these collectors become less effective. Most flat plate collectors have a life expectancy of over 25 years [18].
The main use of this technology is in residential buildings where the demand for hot water has a large impact on energy bills. This generally means a situation with a large family, or a situation in which the hot water demand is excessive due to frequent laundry washing. Commercial applications include laundromats, car washes, military laundry facilities and eating establishments. The technology can also be used for space heating if the building is located off-grid or if utility power is subject to frequent outages. Solar water heating systems are most likely to be cost effective for facilities with water heating systems that are expensive to operate, or with operations such as laundries or kitchens that require large quantities of hot water.
Unglazed liquid collectors are commonly used to heat water for swimming pools. Because these collectors need not withstand high temperatures, they can use less expensive materials such as plastic or rubber. They also do not require freeze-proofing because swimming pools are generally used only in warm weather or can be drained easily during cold weather [17].
While solar collectors are most cost-effective in sunny, temperate areas, they can be cost effective virtually anywhere in the country so should be considered
Figure 2.4: Flat plate collector (source: http://en.wikipedia.org/wiki/File:Solar_panels,_Santorini.jpg)

-23-
2.3.3.2 Evacuated tube collectors
Most vacuum tube collectors (Figure 2.5) in use in middle Europe use heat pipes for their core instead of passing liquid directly through them. Direct flow is more popular in China. Evacuated heat pipe tubes (EHPTs) are composed of multiple evacuated glass tubes each containing an absorber plate fused to a heat pipe [18]. The heat from the hot end of the heat pipes is transferred to the transfer fluid (water or an antifreeze mix – typically propylene glycon) of a domestic hot water or hydronic space heating system in a heat exchanger called a "manifold". The manifold is wrapped in insulation and covered by a sheet metal or plastic case to protect it from the elements.
The vacuum that surrounds the outside of the tube greatly reduces convection and conduction heat loss to the outside, therefore achieving greater efficiency than flat-plate collectors, especially in colder conditions. This advantage is largely lost in warmer climates, except in those cases where very hot water is desirable, for example commercial process water. The high temperatures that can occur may require special system design to prevent overheating.
Some evacuated tubes (glass-metal) are made with one layer of glass that fuses to the heat pipe at the upper end and encloses the heat pipe and absorber in the vacuum. Others (glass-glass) are made with a double layer of glass fused together at one or both ends with a vacuum between the layers (like a vacuum bottle or flask), with the absorber and heat pipe contained at normal atmospheric pressure. Glass-glass tubes have a highly reliable vacuum seal, but the two layers of glass reduce the light that reaches the absorber. Moisture may enter the non-evacuated area of the tube and cause absorber corrosion. Glass-metal tubes allow more light to reach the absorber, and protect the absorber and heat pipe from corrosion even if they are made from dissimilar materials. The gaps between the tubes may allow for snow to fall through the collector, minimizing the loss of production in some snowy conditions, though the lack of radiated heat from the tubes can also prevent effective shedding of accumulated snow [18].
Figure 2.5: Evacuated tube collector (source: http://en.wikipedia.org/wiki/File:Vakuumroehrenkollektor_01.jpg)

-24-
2.4 PV/T System
A hybrid Photovoltaic-Thermal System (PV/T) would be a good system for this project, because it provides simultaneously hot water and electricity, and the goal of this project is exactly to have a system that provides both.
The hybrid PV/T System was not used to perform the present project because it does not meet the goals, where a determined amount of electricity should be produced from a module without an auxiliary source of power generation and at the same way for the hot water solar system, the aim is to heat water without an auxiliary water heating source. In other hand it is important to take into account that the PV/T system increase electricity production, while the solar thermal production decreases according to Kalogirou [19], although this statement from Kalogirou can be monitored according to the aim of a PV/T system designer. It means that, it is possible to increase the solar thermal production if the aim is to have hot water and the electricity production efficiency will be decreased because of module high temperature, or if the aim is to have more electricity than the heating efficiency will be decreased because water will be used to cool the module. So summarizing it is only possible to increase one of the output energy variables (electricity or thermal production). The equation 2.1 below shows, how the efficiency of such system is calculated.
(eq. 2.1)
Where:
I = Collector efficiency (dim)
Qu = Thermal energy collected where Qu = mCp(Ti-To)(W)
GT = Total solar irradiance on the plane of the panel (W/m2)
FR = Collector heat removal factor (dim)
UL = Collector loss transfer coefficient (W/m2) (UL = Ut +Ub+Ue)
Ti = Fluid inlet temperature (oC)
Ta = Ambient air temperature (oC)
ṁ = Mass flow rate of the collector fluid (kg/s)
Cp = Specific heat of the collector fluid (J/kgK)
Τα = Tau-alpha product of the collector (dim)

-25-
The figure 2.6 shows PV/T collector arrays mounted on the roof of Solar Zentrum Allgäu in German. The PV/T provides hot water and electricity to the company and feed to grid when the electricity needed is reached.
Figure 2.6 PV/T arrays on the roof of Solar Zentrum Allgäu in Germany

-26-
Chapter 3
3 Design and simulation of the system with TRNSYS 16 Software
TRNSYS is considered as a complete and extensible simulation environment for the transient simulation of system, including multi-zone buildings according to TRNSYS manual (getting started) Klein et al 2007 [3], because it fit to use with the common known programming languages like PASCAL, FORTRAN, C, C++ and more other, in other hand it can interact with Microsoft Excel, Matlab COMIS during the simulation. Where is TRNSYS applicable? It is applicable in anything where is required dynamic simulation, such as Low Energy and HVAC system with advanced design features, renewable energy, Solar System (PV and solar thermal), cogeneration, fuels cells. Nevertheless TRNSYS is used by different professional group like engineers, researchers and architectures (getting started). The desired components for the simulation are represented in unique TYPE number, so each component according to its details or technical characteristic has its TYPE number.
3.1 Photovoltaic system description
The photovoltaic system (Figure 3.1) is composed by photovoltaic array, battery storage, inverter/charger controller and load.
Figure.3.1 Block diagram of photovoltaic system
The main components and others are represented in TRNSYS by the following Types:
TYPE 109-TMY- Weather data reader and processor. One of the aims of this component is to send to photovoltaic module the hourly solar radiation data and other weather data;
TYPE 94a, photovoltaic module – crystalline module;
TYPE 47c, Battery as power input, appropriate for lead acid Accumulators simulation;
TYPE 48d, Inverter and Regulator, it simulates inverter and charger controller at the same time according to data input of each component;
Two equations TYPES, for energy units converting and calculating;
-27-
TYPE 65 Online plotters, for displaying the selected photovoltaic system variables in the simulation.
3.1.1 Weather Data – Type 109 TMY
The weather data is important in the simulation because it sends the average historical solar radiation to the PV module, so that the designer can get a better view of the system through TRNSYS simulation studio. It is also important to mention that the weather data does not only provide solar radiation data as output, but a lot of other related weather data are collect from this type such as relative humidity, wind speed, wind direction, temperature and atmospheric pressure, at different angles and for different surfaces.
3.1.2 Photovoltaic Module – Type 94a
The TRNSYS types are characterized by their input parameters and some of them are given by photovoltaic producers as technical data sheets. In other hand some of these parameters should be calculated according to solar energy calculation procedures.
The type 94a can be used to model a mono crystalline or polycrystalline silicone module and their electrical performance at selected PV module. The output in this type is calculated automatically for the whole amount of the PV module in the system, so that at the end of the simulation it is not necessary to do additional calculations on what is in concern to electrical or power output from the module and other output. This task is done because the type itself employs for an empirical equivalent circuit model to predict the current-voltage characteristic of a single module, afterward those results are extrapolated to predict the performance of a multi-module array. For this simulation it was selected a mono crystalline PV module due to its electrical efficiency, but the specific PV module producer selection was made according to available technical data sheet, so for the local installation the owner of the project will be able to change the PV module producer using a recommended technical requirement and assistance.
The table below shows some of used data in the PV module (according to PV manufacturer technical data) and the design parameters for dimensioning of the system using type 94a.

-28-
Table 3.1 PV data and Design parameters for type 94a
Parameter Description Value
Isc Module short circuit current at reference conditions (A) 8.59
Voc Module open circuit voltage at reference conditions (V) 44.90
T Reference temperature (K) 298
G Reference insulation (W/m2) 1000
Parameter Description Value
Vmp Reference voltage at maximum power point at reference condition (V) 36.30
Imp Maximal current at maximum power point at reference condition (A) 8.13
αIsc Temperature coefficient at Isc at reference condition (dim) 0.05
βVoc Temperature coefficient at Voc at reference condition (dim) -0.32
N Number of cells wired in series (dim) 17
N Number of module in series (dim) 4
N Number of module in parallel (dim) 32
NOCT Module temperature at NOCT (oC) 46
NOTC Ambient temperature at NOCT (K) 298
Am Module area (m2) 1.96
Τα Tau-alpha product for normal incidence (dim) 0.95
3.1.3 Solar lead acid accumulator
For a stand-alone solar system it is necessary to use solar batteries (accumulators) for electricity storage, so that the system can be used in the time when solar radiation is low and in the night. The solar lead accumulator differs from the normal car accumulator, because the solar lead accumulator can work by low discharge current and they are able to accept high rate of cycles of deep discharge and discharges without damage.
Nowadays it is available in the market different types of solar or PV batteries, such as nickel cadmium, nickel hydride, lithium and include lead-acid (gel and aqueous). Presently the solar lead batteries are divided in two types according to the state of the acid solution, so we can find the called gel tubular batteries which do not need water refilling, because they have closed mater circulation done by a gelatinous acid solution in the battery cell. In other hand we have the aqua solar batteries, which need periodical or time to time refilling with distilled water to keep them under their lifespan. For the present project gel lead acid tubular batteries were selected, due to their characteristic such as it does not emit and it is so far no maintenance needed because do not need water refilling during its normal operation.

-29-
For the simulation the HOPPECKE´s gel solar battery cell with the following denominations 6OPzV solar power 750 Ah and 8OPzV solar power 1000 Ah, were selected and the format of this cell are shown in the figure 3.2.
Figure 3.2 Hoppecke battery cell sample (source: HOPPECKE data sheet)
The nominal capacity (qmax) of each battery is a parameter used to classify the batteries; the unit of this physical parameter is the number of ampere hours (Ah) that can at maximal extract from the battery. The other parameter that can be taken into account in a battery is the state of charge (SOC), and its calculation is in the equation 3.1, it is the ratio of the present battery capacity by the nominal capacity. SOC is a dimensionless parameter and it ranges from 0 to 1, so SOC equal to one means that the battery is totally charged and SOC equal to zero means that the battery is totally discharged.
(eq. 3.1)
Where,
SOC – state of charge (dim),

-30-
q – present or actual battery capacity (Ah)
qmax – nominal capacity of the battery (Ah)
The lifespan of the battery will be determined by the number of discharge and charge cycles it can sustain before losing its nominal capacity less than 20% of them.
3.1.4 Inverter and charger controller
Inverter is the component that converts the DC to AC, when the owners of the system need to use an AC appliance. This component is characterized by a power-dependent efficiency, as shown in equation 3.2 for power output calculation.
(eq. 3.2)
Where,
Ƞinv – inverter efficiency (dim)
Pout – output power (W)
Pin – input power (W)
Cos(φ) – power coefficient (dim)
Vac – alternative voltage (V)
Iac – alternative current (A)
Idc – direct current (A)
Vac – direct voltage (V)
Nowadays the ideal charge controller used is the called maximum power point tracker (MPPT). MPPT is a device that can control the changing of output voltage against current characteristic from the solar panel and determines the operating point for the batteries or load. The MPPT is an important component for off-grid power systems, due to its outcome of control during the cold weather, cloudy or hazy days and it can also act in the case when the batteries are deeply discharged, Kalogirou [19]. Nevertheless this device is able to collect all the energy produced by the panel array in the installation.

-31-
3.1.5 Simulation
For the simulation of the PV system a PV module Type 94a, Charger controller/inverter Type 48b and Battery Type 47c, were considered with six differentiated parameters (A to F).
3.1.5.1 Simulation A of Photovoltaic system
The selected PV module is a monocrystaline TDB156x156-72-P 295 Wp.
It was designed for 4 PV modules in series and 8 PV modules in parallel
Battery type: OPzV 750 Ah, C50 = 686, Imax = 13.72 A DC, 48V DC
5 Battery cells in parallel
Resulting in 120 Batteries 8OPzV 750 Ah
and Battery bank of 3750 Ah
24 Cell in series
The low limit of FSOC of the battery was 0,4 and charge to discharge limit FSOC was 0,6.
Table.3.2. Energy distribution by the system
Description Generated Energy
Consumed Energy
Dumped Energy
Energy From Grid
Total energy produced (MW/year)
20.42 13.97 1.14 0.05
In percentage (%/year)
100 68.43 5.58 0.33
In this system the dumped energy occurred during 260 hours throughout the year which represent 2.6% of occurrence. In other hand the need of power from grid was verified only 24.75 hours throughout the year and that represents 0.28%.
Table 3.3 State of charge of the battery throughout the year
Description Charged below 0.60
Charged between 0.6 to 0.8
Charged over 0.8
Time (h/year) 108.25 2298.25 6353.50
Percentage (%) 1.24 25.76 72.53
-32-
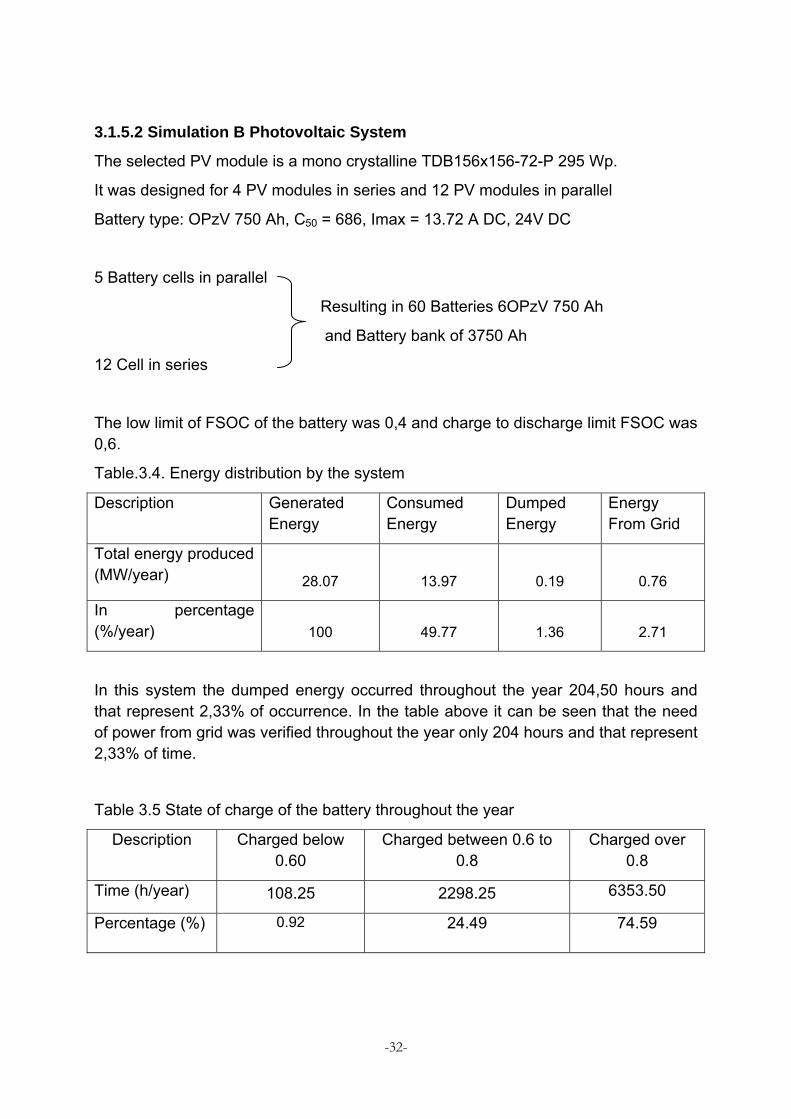
3.1.5.2 Simulation B Photovoltaic System
The selected PV module is a mono crystalline TDB156x156-72-P 295 Wp.
It was designed for 4 PV modules in series and 12 PV modules in parallel
Battery type: OPzV 750 Ah, C50 = 686, Imax = 13.72 A DC, 24V DC
5 Battery cells in parallel
Resulting in 60 Batteries 6OPzV 750 Ah
and Battery bank of 3750 Ah
12 Cell in series
The low limit of FSOC of the battery was 0,4 and charge to discharge limit FSOC was 0,6.
Table.3.4. Energy distribution by the system
Description Generated Energy
Consumed Energy
Dumped Energy
Energy From Grid
Total energy produced (MW/year) 28.07 13.97 0.19 0.76
In percentage (%/year) 100 49.77 1.36 2.71
In this system the dumped energy occurred throughout the year 204,50 hours and that represent 2,33% of occurrence. In the table above it can be seen that the need of power from grid was verified throughout the year only 204 hours and that represent 2,33% of time.
Table 3.5 State of charge of the battery throughout the year
Description Charged below 0.60
Charged between 0.6 to 0.8
Charged over 0.8
Time (h/year) 108.25 2298.25 6353.50
Percentage (%) 0.92 24.49 74.59

-33-
The table 3.5 shows that the battery in the simulation 18 using 60 OPzV batteries was charged more time over 0.80 at 74.59% and Battery SOC below 0.6 can be neglected because it is 0.92%.
3.1.5.3 Simulation C of Photovoltaic System
The selected PV module is a mono crystalline TDB156x156-72-P 295 Wp.
It was designed for 4 PV modules in series and 11 PV modules in parallel
Battery type: 6OPzV 750 Ah, C50 = 686, Imax = 13.72 A,
5 Battery cells in parallel
Resulting in 60 Batteries OPzV 750 Ah
and Battery bank of 3750 Ah
12 Cell in series
The low limit of FSOC of the battery was 0,4 and charge to discharge limit FSOC was 0,6.
Table.3.6 Energy distribution by the system
Description Generated Energy
Consumed Energy
Dumped Energy
Energy From Grid
Total energy produced (MW/year) 28.07 13.97 0.76 0.02
Percentage (%/year) 100 49.77 2.71 0.18
From the table 3.6 it can be seen that the energy coming from grid is 0.02 MW/year and that represent 0.18% in the system. So it was assumed that the photovoltaic simulation C is ideal for GK, because it save in number of batteries cell and number of PV modules compared with other simulations.
In this system the dumped energy occurred throughout the year 204.50 hours and that represent 2.33% of occurrence. In the table above it can be seen that the need of power from grid was verified throughout the year only 204.5 hours and that represent 2.33% of time.

-34-
Table 3.7 State of charge of the battery throughout the year
Description Charged below 0.60
Charged between 0.6 to 0.8
Charged over 0.8
Time (h/year) 81.00 2145.25 6353.50
Percentage (%) 0.92 24.49 74.59
The table 3.7 shows that the battery in the simulation C which consider 60 OPzV batteries was charged more time over 0.80 at 74.59% and Battery SOC below 0.6 can be neglected because it is 0.92%.
3.1.5.4 Simulation D of Photovoltaic System
The selected PV module is a mono crystalline TDB156x156-72-P 295 Wp.
The PV arrangement is constituted of 7 module in parallel and 8 modules in series.
Battery type: 8OPzV 1000 Ah, C50 = 913 Ah, Imax = 18.26 A,
2 Battery cells in parallel
Resulting in 48 Batteries 8OPzV 1000 Ah
and Battery bank of 2000 Ah
24 Cell in series
The low limit of FSOC of the battery was 0,4 and charge to discharge limit FSOC was 0,6.
Table.3.8 Energy distribution by the system
Description Generated Energy
Consumed Energy
Dumped Energy
Energy From Grid
Total energy produced (MW/year) 35.73 13.97 3.05 0.000540
Percentage (%/year) 100 39.10 8.54 0.00
Table 3.8 shows that the energy coming from grid is about 540 W/year and that represent approximately 0.00% in the system throughout the year, so it is not significant. This arrangement could be balanced as one of suggestion to amply at GK

-35-
training School. For this simulation the dumped energy throughout the year is 3.05 MWh/year and that represent 8.54%.
Table 3.9 State of charge of the battery throughout the year
Description Charged below 0.60
Charged between 0.6 to 0.8
Charged over 0.8
Time (h/year) 1.00 2.00 8477.50
Percentage (%) 0.01 0.02 96.78
The table 3.9 shows that the battery in the simulation D using 48 battery cells of 8OPzV solar power 1000 Ah batteries was charged more time over 0.80 at 96.78% and Battery SOC below 0.6 can be neglected because it is 0.01%. In other hand the battery is kept charged under state of charge of the battery between 0.6 and 0.8.
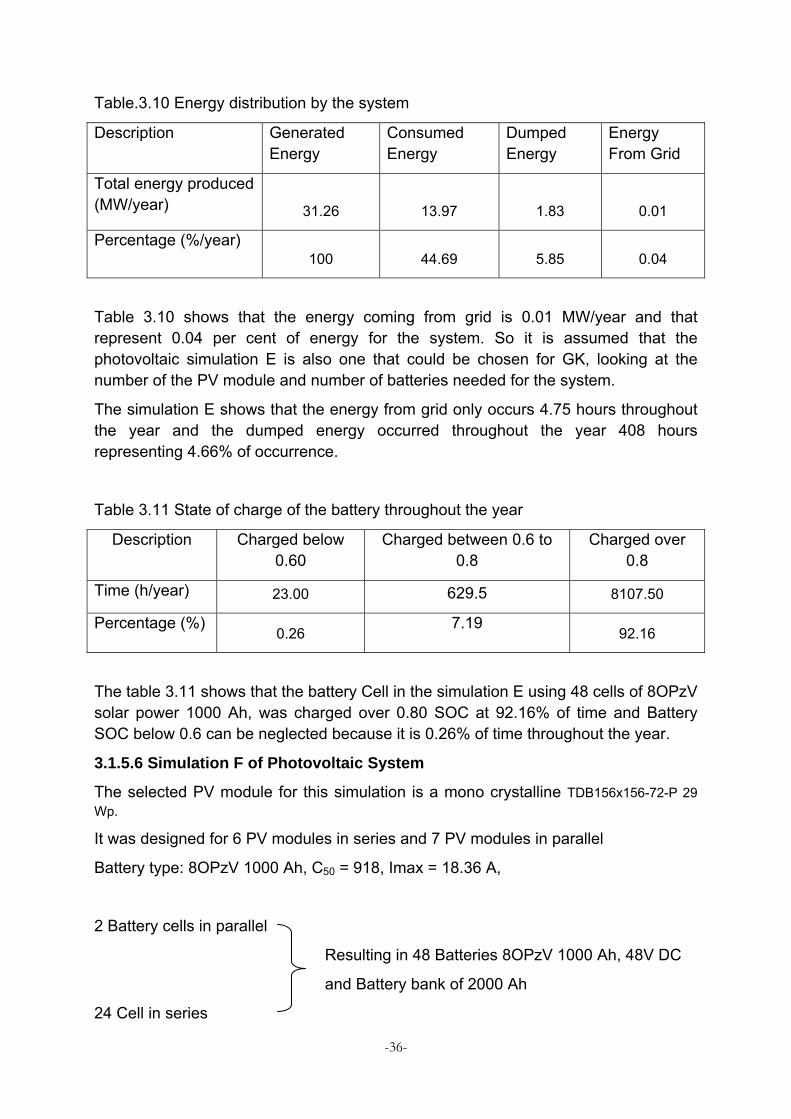
3.1.5.5 Simulation E of Photovoltaic System
The selected PV module for this simulation was a mono crystalline TDB156x156-72-P 29 Wp.
It was designed for 7 PV modules in series and 7 PV modules in parallel
Battery type: 8OPzV 1000 Ah, C50 = 918, Imax = 18.36 A,
2 Battery cells in parallel
Resulting in 48 Batteries 8OPzV 1000 Ah, 48V DC
and Battery bank of 2000 Ah
24 Cell in series
The low limit of FSOC of the battery was 0,4 and charge to discharge limit FSOC was 0,6.
-36-
Table.3.10 Energy distribution by the system
Description Generated Energy
Consumed Energy
Dumped Energy
Energy From Grid
Total energy produced (MW/year) 31.26 13.97 1.83 0.01
Percentage (%/year) 100 44.69 5.85 0.04
Table 3.10 shows that the energy coming from grid is 0.01 MW/year and that represent 0.04 per cent of energy for the system. So it is assumed that the photovoltaic simulation E is also one that could be chosen for GK, looking at the number of the PV module and number of batteries needed for the system.
The simulation E shows that the energy from grid only occurs 4.75 hours throughout the year and the dumped energy occurred throughout the year 408 hours representing 4.66% of occurrence.
Table 3.11 State of charge of the battery throughout the year
Description Charged below 0.60
Charged between 0.6 to 0.8
Charged over 0.8
Time (h/year) 23.00 629.5 8107.50
Percentage (%) 0.26
7.19 92.16
The table 3.11 shows that the battery Cell in the simulation E using 48 cells of 8OPzV solar power 1000 Ah, was charged over 0.80 SOC at 92.16% of time and Battery SOC below 0.6 can be neglected because it is 0.26% of time throughout the year.
3.1.5.6 Simulation F of Photovoltaic System
The selected PV module for this simulation is a mono crystalline TDB156x156-72-P 29
Wp.
It was designed for 6 PV modules in series and 7 PV modules in parallel
Battery type: 8OPzV 1000 Ah, C50 = 918, Imax = 18.36 A,
2 Battery cells in parallel
Resulting in 48 Batteries 8OPzV 1000 Ah, 48V DC
and Battery bank of 2000 Ah
24 Cell in series

-37-
The low limit of FSOC of the battery was 0,4 and charge to discharge limit FSOC was 0,6.
Table.3.12 Energy distribution by the system
Description Generated Energy
Consumed Energy
Dumped Energy
Energy From Grid
Total energy produced (MW/year) 26.80 13.97 0.74 0.03
Percentage (%/year) 100.00 52.14 2.75 0.22
The table 3.12 shows the electricity production resulting from installation of 42 PV modules and the relationship of dumped power and the power from grid or the power that should be produced from external source. The energy coming from grid is 0.03 MW/year and that represent 0.22% additional energy needed from auxiliary source to the system.
From the simulation F it can be seen that the energy from grid only occurs 18.25 hours throughout the year and the dumped energy occurred throughout the year 194.00 hours representing 2.21% of occurrence.
Table 3.13 State of charge of the battery throughout the year
Description Charged below 0.60
Charged between 0.6 to 0.8
Charged over 0.8
Time (h/year) 85.50 2446.5 6228.50
Percentage (%) 0.98 27.92 71.10
The table 3.13 shows that the battery Cell in the simulation F using 48 cells of 8OPzV solar power 1000 Ah, was charged over 0.80 SOC at 71.10% of time and Battery SOC below 0.6 can be neglected because it is 0.98% of time throughout the year.
3.2 Hot Water System simulation
The hot water system for the GK Training School in Ancuabe is constituted by solar flat collectors, pump, diverter, ducts, flow mixer, thermostat and tank. Those components were represented in TRNSYS as follows:
TYPE 1b, solar thermal collector with 2nd order incidence angle modifier, this component models the thermal performance of a flat-plate solar collector;
TYPE 38, Plug flow-tank, used as storage stratified tank;

-38-
TYPE 110, variable speed pump;
TYPE 22, iterative feedback controller, it controls signal (u) required to maintain the controlled variable (y) at the set point (ySet);
TYPE 2d, On/off differential controller
TYPE 31-3, ducts or pipe;
TYPE 65, online plotter for displaying selected hot water system variable
Solar thermal collector - Type 1b
The type 1b is an ideal model for thermal performance of a flat-plate solar collector, so it is adequate for the aim of simulation and it is also governed type parameter. Those type parameters will define the output and the efficiency of the collector, below are shown the main parameters for the present design in the table 3.14
Table.3.14 Solar thermal collector type1b
Parameter Description Value
N Number of collector in series 8
Ac Collector area (m2) 16
Cp Fluid specific heat (kJ/kg.K) 4.190
ṁ Tested fluid rate of the collector (kg/h.m2) 140

-39-
Chapter 4
4 Optimization of the system
For good results in the designing and simulation of solar systems considering it as weather dependant systems it is important to verify the systems with help of software like TRNSYS as the case. So the TRNSYS software is provided with weather data from the last ten years so that the errors of simulation are less.
The systems presented in this report were simulated in order to work through the year without external source of energy. For the water system the aim was to keep hot water at 40oC at the end user, and the average tank temperature should reach at least 60oC once a week to kill legionella bacterium in the tank [4].
The daily power consumption at GK Training School is variable time to time, because the appliances are not operating all at the same time, this picture of the system function is shown in the figure 4.1 as daily power consumption at different time of the day. Due to the difference in the electricity demand it was important to optimize the photovoltaic system to cover the power needs through the day and yearly with quasi zero power from external source. As it is known the solar radiation is natural phenomena and it is totally variable time to time and day to day, so the TRNSYS software allows us to arrange the optimal amount of the battery and module to meet the goals.
Figure 4.1: Daily power consumption

-40-
4.1 Optimization of the photovoltaic system
For good gain in the optimization of photovoltaic system some variables were monitored such as the following: dumped power, power from grid, the state of charge of the battery, the total current from the battery. In other hand a special attention was taken into account by setting battery parameters like the charge to discharge limit on FSOC, the cell energy capacity what is in concern to CN (discharge time of an OPzV battery).
Optimization of power from grid by FSOC
The power from grid was monitored by considering the charge to discharge limit on FSOC parameter. With the same amount of batteries, same discharge time C50 and same of photovoltaic module it was possible to cut the power from grid.
The simulation considered 32 PV modules (8 modules in series and 4 modules in parallel) with technical data “TDB156x156-72-P 295 Wp” and 168 battery cells (7 battery cells in parallel and 24 battery cells in series) with technical data “8OPzV 1000”. As it is shown in Figure 4.2 representing the setting on the battery charger controller of 0.75 charge to discharge limit on FSOC, it can be seen some power from grid.
Figure 4.2: Dumped power and power from grid through the year at 0.75 FSOC.
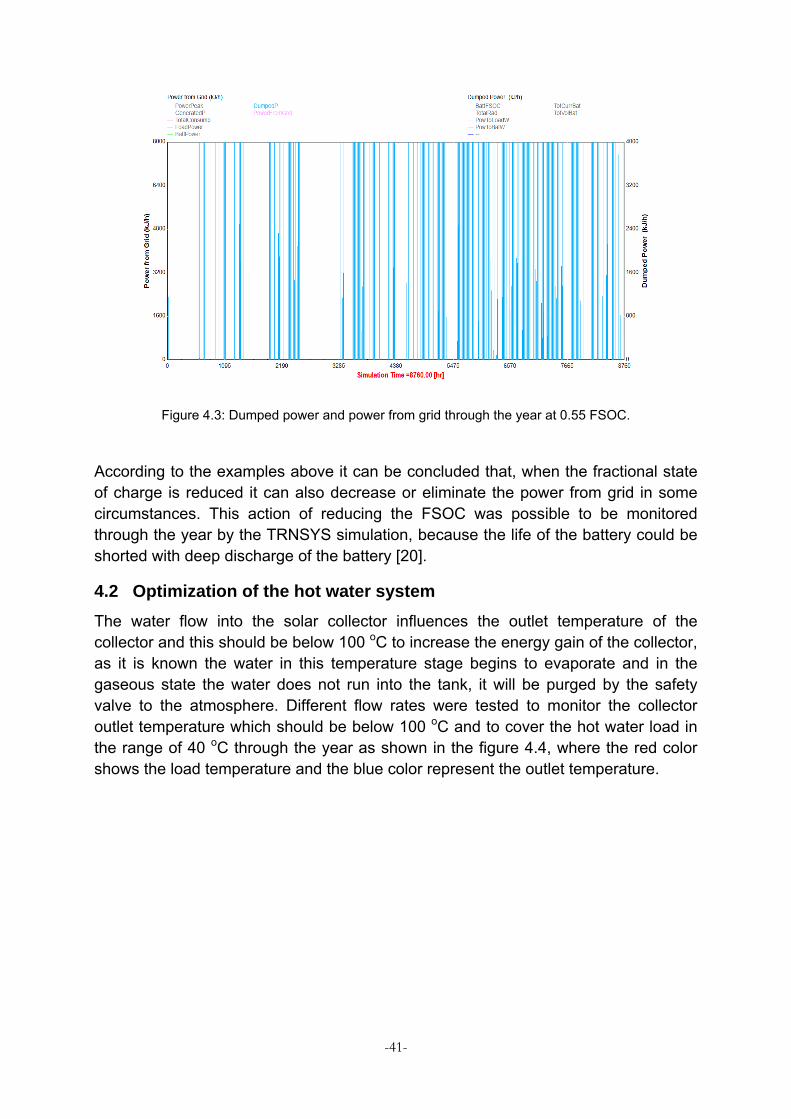
In other hand the power from grid is not verified under the same condition, where it was only changed the setting on the battery charger control from 0.75 to 0.55 charge to discharge limit on FSOC, as shown in Figure 4.3.
The charge to discharge limit setting does not mean that the battery will not charge completely (to 1.0), the set value plays a great role in the period of the year, where the solar radiation is lower than 500 W/m2 or when the power peak is not reached for long period. As consequence of these phenomena the power from grid is verified in the simulation.
-41-
Figure 4.3: Dumped power and power from grid through the year at 0.55 FSOC.
According to the examples above it can be concluded that, when the fractional state of charge is reduced it can also decrease or eliminate the power from grid in some circumstances. This action of reducing the FSOC was possible to be monitored through the year by the TRNSYS simulation, because the life of the battery could be shorted with deep discharge of the battery [20].
4.2 Optimization of the hot water system
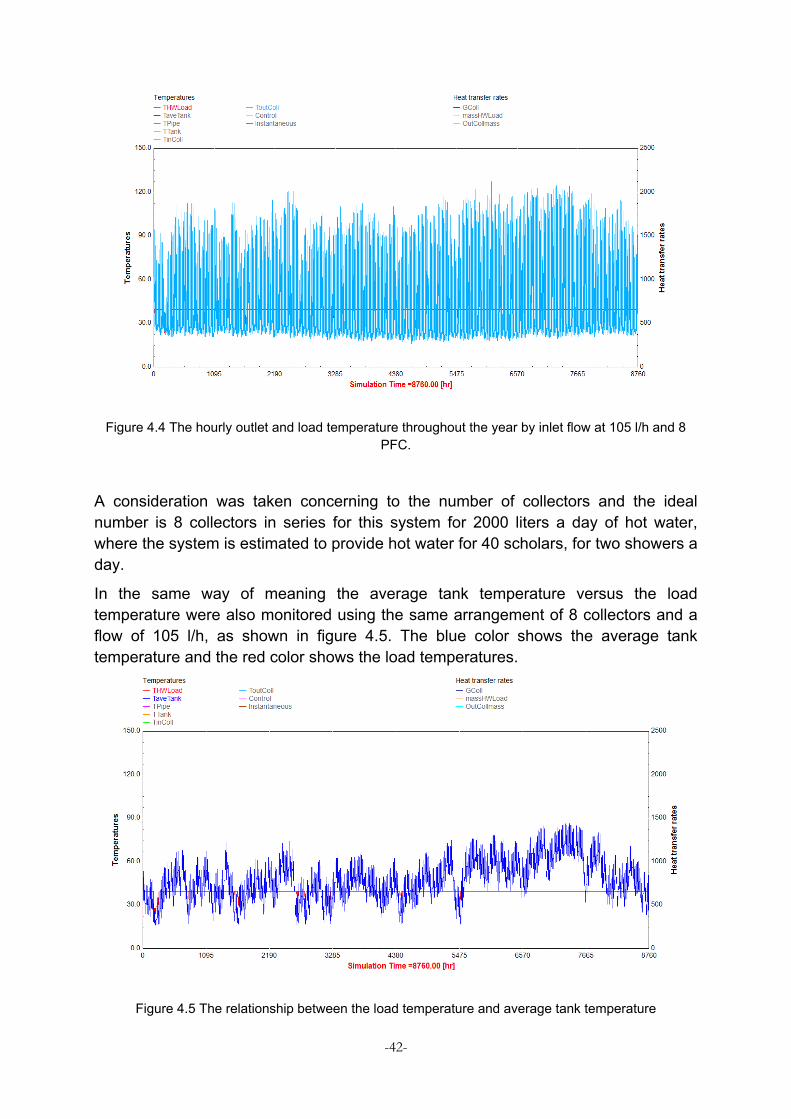
The water flow into the solar collector influences the outlet temperature of the collector and this should be below 100 oC to increase the energy gain of the collector, as it is known the water in this temperature stage begins to evaporate and in the gaseous state the water does not run into the tank, it will be purged by the safety valve to the atmosphere. Different flow rates were tested to monitor the collector outlet temperature which should be below 100 oC and to cover the hot water load in the range of 40 oC through the year as shown in the figure 4.4, where the red color shows the load temperature and the blue color represent the outlet temperature.
-42-
Figure 4.4 The hourly outlet and load temperature throughout the year by inlet flow at 105 l/h and 8 PFC.
A consideration was taken concerning to the number of collectors and the ideal number is 8 collectors in series for this system for 2000 liters a day of hot water, where the system is estimated to provide hot water for 40 scholars, for two showers a day.
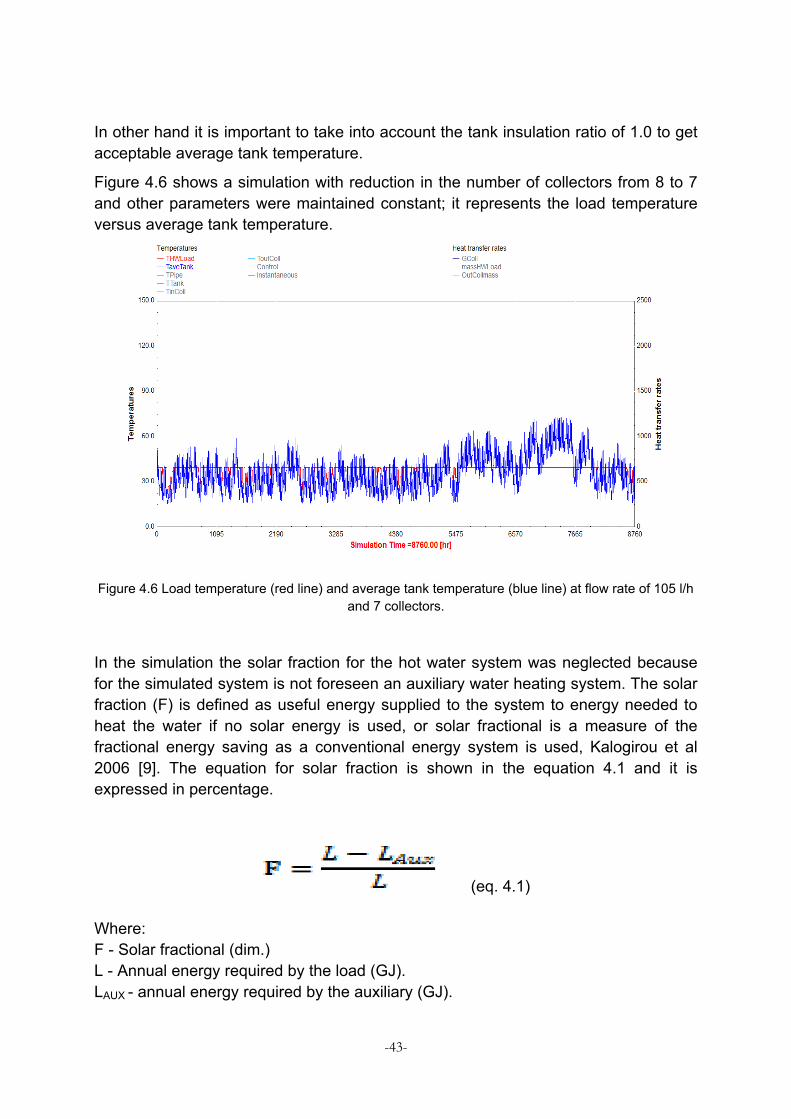
In the same way of meaning the average tank temperature versus the load temperature were also monitored using the same arrangement of 8 collectors and a flow of 105 l/h, as shown in figure 4.5. The blue color shows the average tank temperature and the red color shows the load temperatures.
Figure 4.5 The relationship between the load temperature and average tank temperature
-43-
In other hand it is important to take into account the tank insulation ratio of 1.0 to get acceptable average tank temperature.
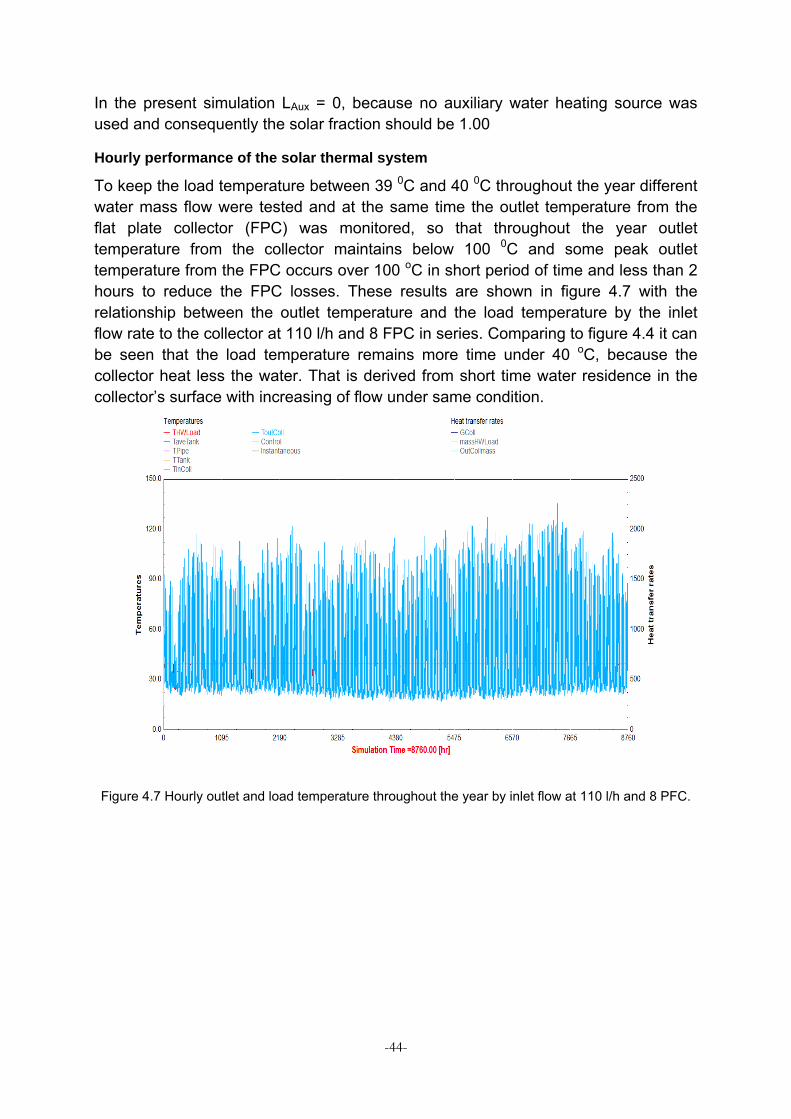
Figure 4.6 shows a simulation with reduction in the number of collectors from 8 to 7 and other parameters were maintained constant; it represents the load temperature versus average tank temperature.
Figure 4.6 Load temperature (red line) and average tank temperature (blue line) at flow rate of 105 l/h and 7 collectors.
In the simulation the solar fraction for the hot water system was neglected because for the simulated system is not foreseen an auxiliary water heating system. The solar fraction (F) is defined as useful energy supplied to the system to energy needed to heat the water if no solar energy is used, or solar fractional is a measure of the fractional energy saving as a conventional energy system is used, Kalogirou et al 2006 [9]. The equation for solar fraction is shown in the equation 4.1 and it is expressed in percentage.
(eq. 4.1)
Where: F - Solar fractional (dim.) L - Annual energy required by the load (GJ). LAUX - annual energy required by the auxiliary (GJ).
-44-
In the present simulation LAux = 0, because no auxiliary water heating source was used and consequently the solar fraction should be 1.00
Hourly performance of the solar thermal system
To keep the load temperature between 39 0C and 40 0C throughout the year different water mass flow were tested and at the same time the outlet temperature from the flat plate collector (FPC) was monitored, so that throughout the year outlet temperature from the collector maintains below 100 0C and some peak outlet temperature from the FPC occurs over 100 oC in short period of time and less than 2 hours to reduce the FPC losses. These results are shown in figure 4.7 with the relationship between the outlet temperature and the load temperature by the inlet flow rate to the collector at 110 l/h and 8 FPC in series. Comparing to figure 4.4 it can be seen that the load temperature remains more time under 40 oC, because the collector heat less the water. That is derived from short time water residence in the collector’s surface with increasing of flow under same condition.
Figure 4.7 Hourly outlet and load temperature throughout the year by inlet flow at 110 l/h and 8 PFC.

-45-
Chapter 5
5 Economical Evaluation
5.1 Energy needs
The GK Training School will be constituted by a Workshop, two classrooms, ten dormitories rooms for four scholars each, a sitting room, a computer room and a school office building. Those rooms and building will be provided with electricity for light and electrical sockets for some small electrical appliances such as fans, printer, computers, data show projector equipment and for charging mobile phones of the users. The electrical appliances will be fed by electricity generated by a photovoltaic system and the hot water system will be provided by solar flat-plate collector system for 40 scholars.
Characteristics of the school
3 blocks (Dormitory, classrooms & administration and workshop) Dormitory 10 bedrooms (4 occupants each) 3 bathrooms 2 storages 1 sitting room 1 Computer room (internet) Classrooms & administration 2 classrooms 1 directive board room 1 trainer’s room 1 trainers storage 1 reception 2 WC Workshop 2 training rooms (electricity and welding) 1 Storage 4 WC 1 terrace
Hot water demand
Bathrooms → 1600 l per day at 40 °C (Assumption: 40 l/occupant; full load – 40 occupants)

-46-
Electrical demand
Dormitory
Bedrooms → 10 x (2 lamps of 36 W; 2 wall socket of 60 W)
Bathrooms → 3 x (2 lamps of 36 W)
Storages → 2 x (2 lamps of 36 W)
Sitting room → 3 lamps of 36 W, 1 LCD TV of 150 W and 1 DVD Player of 40 W
Computer room → 3 lamps of 36 W; 10 PC of 220 W
Classrooms & administration Classrooms → 7x36 W lamps, 1 projector of 150 W, 100 W PC Directive board room → 1x18 W lamp, 1x150 W fan, 1x220 W PC Trainer’s room → 1x36 W lamp, 2x100 W wall socket Trainer’s storage → 1x18 W lamp Reception → 2x36 W lamp, 1x150 W fan, 1x220 W PC, 1x180 W printer/scanner/fax, 180 W extra WC → 2x18 W lamps
Water heating system
Solar circulation pump → 1x85 W
5.2 Reason to install PV and SHW systems
5.2.1 Photovoltaic System
This challenge comes from a big problem of finding energy source in the region of Ancuabe like GPL, diesel or gasoline. There is an electric grid coming from Nampula Province, as shown in app. 2 (the Mozambique electric grid map) but this is not so far trusty because it has a lot of cut off during the year and those cut off sometimes remains longer than a week and everyday some of them are verified. That is why these cut off are already mentioned in this report at the introduction.
So due to this it was important to the GK Training School to install a photovoltaic system to outcome with the electricity energy problems.
The photovoltaic system has a high initial cost investment [20] but it has quasi zero maintenance cost during the operation time, compared to other alternative electricity generators. In other side it is important to mention that the current PV module, according to the technical data from manufacturers, they has a lifetime period over 20 years under efficiency of 80%, and so during this time the owner has not any electricity bill. Although the lifetime of battery is shorter compared to PV modules according to technical data from solar battery manufacturers like Hoppecke Battery technical data, OPzV batteries cell, have a lifetime from 10 to 15 years. In other hand it is important to take into account that recent technology of PV module has increased
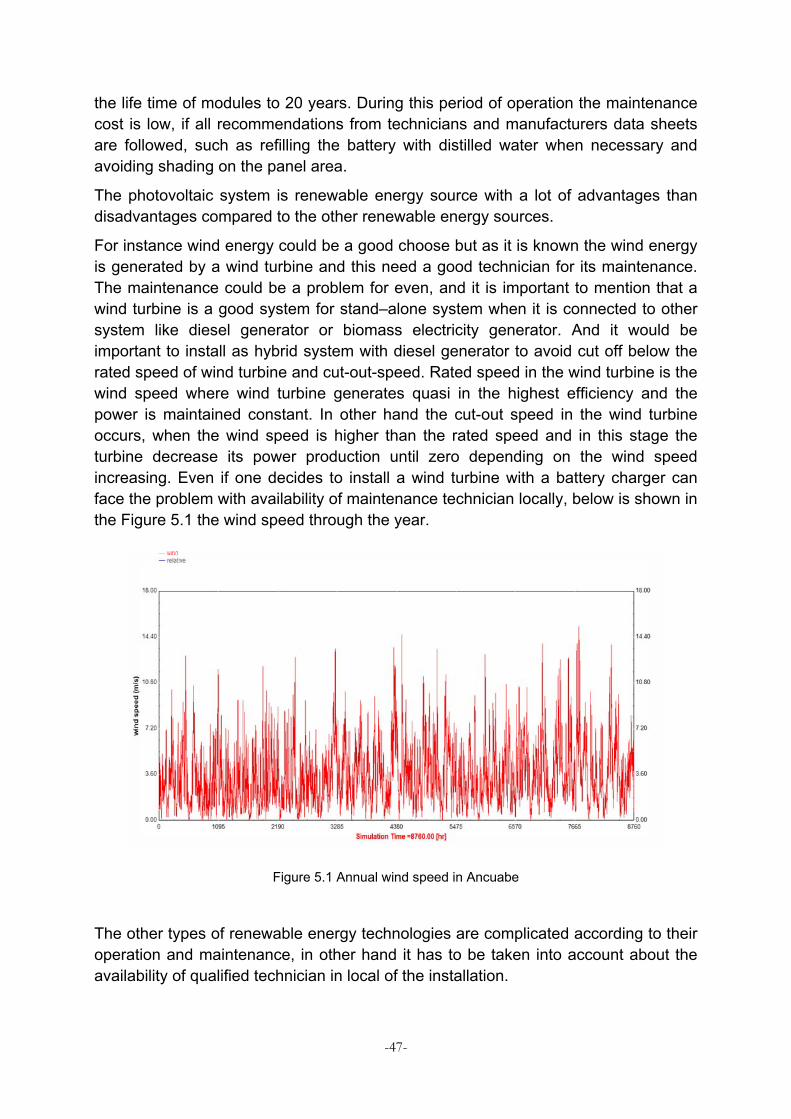
-47-
the life time of modules to 20 years. During this period of operation the maintenance cost is low, if all recommendations from technicians and manufacturers data sheets are followed, such as refilling the battery with distilled water when necessary and avoiding shading on the panel area.
The photovoltaic system is renewable energy source with a lot of advantages than disadvantages compared to the other renewable energy sources.
For instance wind energy could be a good choose but as it is known the wind energy is generated by a wind turbine and this need a good technician for its maintenance. The maintenance could be a problem for even, and it is important to mention that a wind turbine is a good system for stand–alone system when it is connected to other system like diesel generator or biomass electricity generator. And it would be important to install as hybrid system with diesel generator to avoid cut off below the rated speed of wind turbine and cut-out-speed. Rated speed in the wind turbine is the wind speed where wind turbine generates quasi in the highest efficiency and the power is maintained constant. In other hand the cut-out speed in the wind turbine occurs, when the wind speed is higher than the rated speed and in this stage the turbine decrease its power production until zero depending on the wind speed increasing. Even if one decides to install a wind turbine with a battery charger can face the problem with availability of maintenance technician locally, below is shown in the Figure 5.1 the wind speed through the year.
Figure 5.1 Annual wind speed in Ancuabe
The other types of renewable energy technologies are complicated according to their operation and maintenance, in other hand it has to be taken into account about the availability of qualified technician in local of the installation.
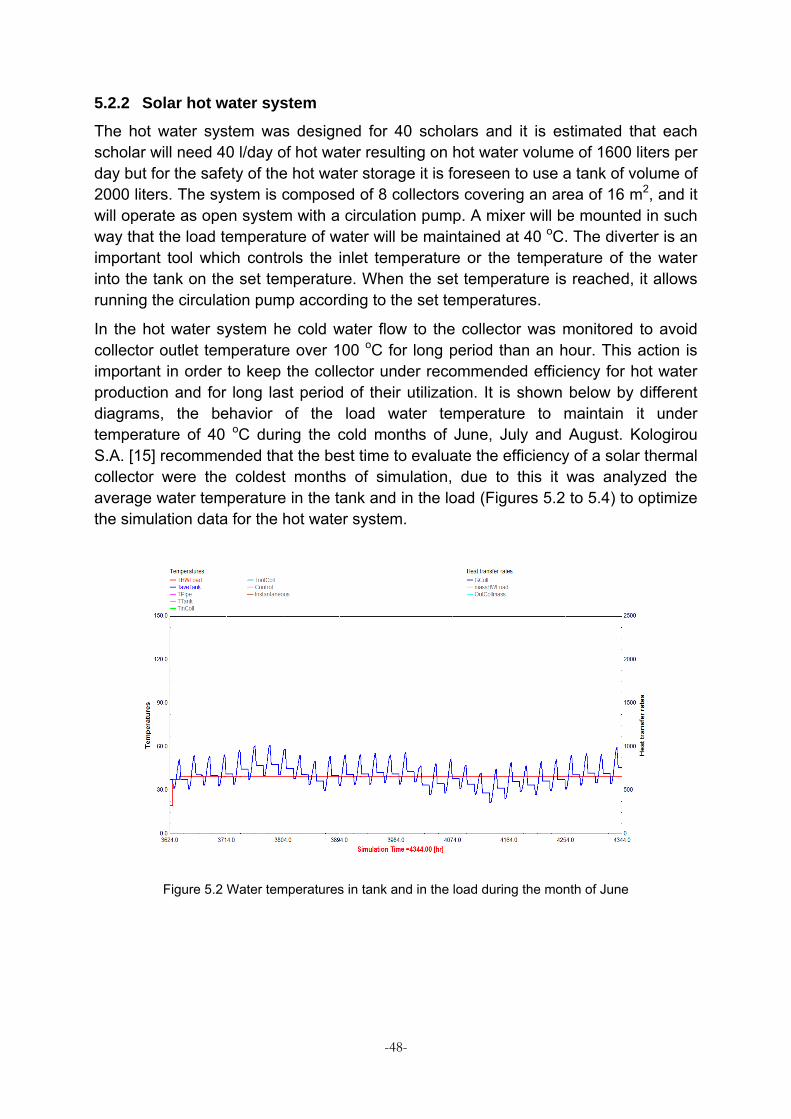
-48-
5.2.2 Solar hot water system
The hot water system was designed for 40 scholars and it is estimated that each scholar will need 40 l/day of hot water resulting on hot water volume of 1600 liters per day but for the safety of the hot water storage it is foreseen to use a tank of volume of 2000 liters. The system is composed of 8 collectors covering an area of 16 m2, and it will operate as open system with a circulation pump. A mixer will be mounted in such way that the load temperature of water will be maintained at 40 oC. The diverter is an important tool which controls the inlet temperature or the temperature of the water into the tank on the set temperature. When the set temperature is reached, it allows running the circulation pump according to the set temperatures.
In the hot water system he cold water flow to the collector was monitored to avoid collector outlet temperature over 100 oC for long period than an hour. This action is important in order to keep the collector under recommended efficiency for hot water production and for long last period of their utilization. It is shown below by different diagrams, the behavior of the load water temperature to maintain it under temperature of 40 oC during the cold months of June, July and August. Kologirou S.A. [15] recommended that the best time to evaluate the efficiency of a solar thermal collector were the coldest months of simulation, due to this it was analyzed the average water temperature in the tank and in the load (Figures 5.2 to 5.4) to optimize the simulation data for the hot water system.
Figure 5.2 Water temperatures in tank and in the load during the month of June

-49-
Figure 5.3 Average temperature of the water in the month of July
Figure 5.4 Average temperature of the tank and load temperature in the month August
At the same time it is important to appreciate the behavior of the outlet temperature of the collector in hot months, as shown in figure 5.5, due to those months sometimes the outlet temperature of the collector rises over 100 oC, as mentioned above such phenomena decreases the efficiency of the collector and in this case it is to see that outlet temperature from the collector does not reach 100 oC.
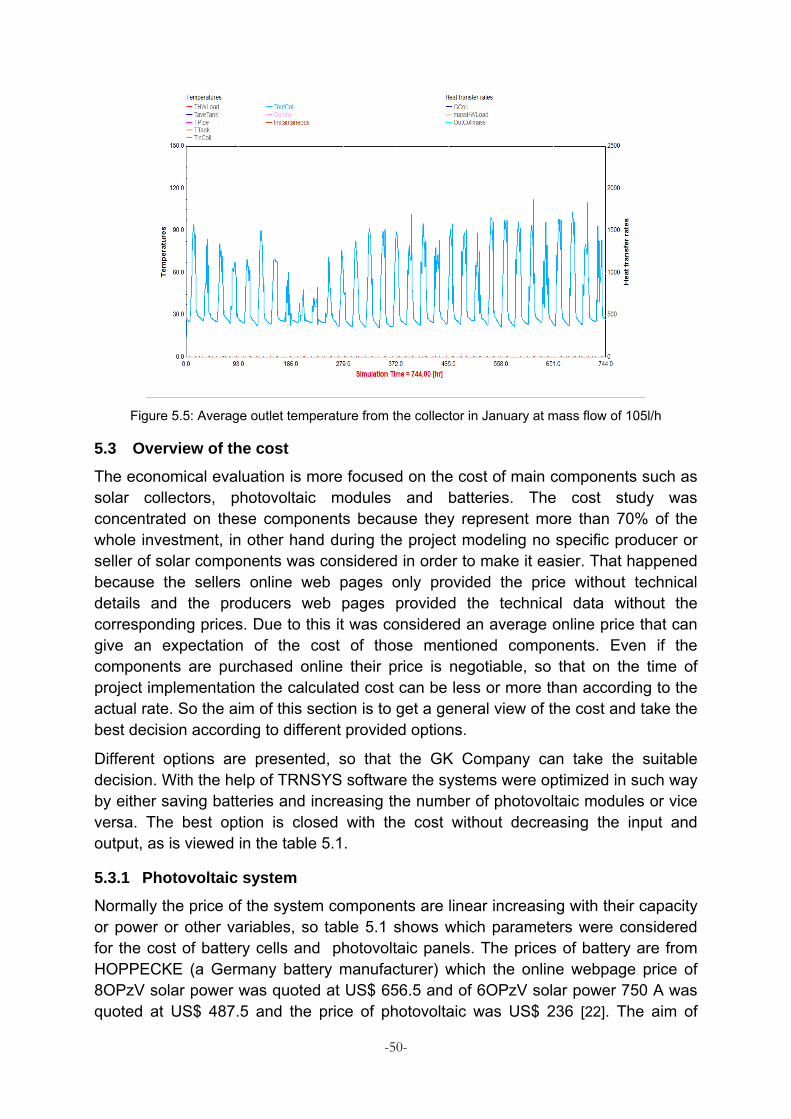
-50-
Figure 5.5: Average outlet temperature from the collector in January at mass flow of 105l/h
5.3 Overview of the cost
The economical evaluation is more focused on the cost of main components such as solar collectors, photovoltaic modules and batteries. The cost study was concentrated on these components because they represent more than 70% of the whole investment, in other hand during the project modeling no specific producer or seller of solar components was considered in order to make it easier. That happened because the sellers online web pages only provided the price without technical details and the producers web pages provided the technical data without the corresponding prices. Due to this it was considered an average online price that can give an expectation of the cost of those mentioned components. Even if the components are purchased online their price is negotiable, so that on the time of project implementation the calculated cost can be less or more than according to the actual rate. So the aim of this section is to get a general view of the cost and take the best decision according to different provided options.
Different options are presented, so that the GK Company can take the suitable decision. With the help of TRNSYS software the systems were optimized in such way by either saving batteries and increasing the number of photovoltaic modules or vice versa. The best option is closed with the cost without decreasing the input and output, as is viewed in the table 5.1.
5.3.1 Photovoltaic system
Normally the price of the system components are linear increasing with their capacity or power or other variables, so table 5.1 shows which parameters were considered for the cost of battery cells and photovoltaic panels. The prices of battery are from HOPPECKE (a Germany battery manufacturer) which the online webpage price of 8OPzV solar power was quoted at US$ 656.5 and of 6OPzV solar power 750 A was quoted at US$ 487.5 and the price of photovoltaic was US$ 236 [22]. The aim of

-51-
those prices of components was to get an overview of the cost of components in the market, but the project owner is free to look for a cheaper seller, but the components should have compatible technical data.
All arrangements were simulated using technical data of an inverter of Oelmeier Technology PAC 5 and a control charger of Xantrex-MPPT-Solar-Charge-Contollers 80 A up to 600 V [21]
Table 5.1 Correlation between CN, Dumped Energy and Energy from Grid
# No of Batt1)
CN No of module2
Gen.En. (MWh/year)
Cons,En (MWh/year)
Dump.En. (MWh/year)
En.F. grid. (MWh/year)
Cost (US$)
Exp A 1203) 50 32 20.42 13.97 1.14 0.05
66052
Exp B 603) 50 48 28.07 13.97 0.76 0.19
40578
Exp C 603) 50 44 28.07 13.97 0.76 0.02
39634
Exp D 481 50 56 35,73 13,97 3,05 0,000540
39928
Exp E 481 50 49 31,26 13,97 1,83 0,01
37096
Exp F 481 50 42 26,80 13,97 0,74 0,03
36624
1) 8OPzV 1000Ah
2) TDB156x156-72-P 295 Wp
3) 6OPzV 750 Ah
The best arrangement of the system was the Exp F due to its use of a battery bank providing a 48 V DC output and this range of voltage is recommended for systems of this dimension, where an Inverter of 6000 W will be installed, according to the manufacturer of inverter and charger control. A set of electrical demand profiles of each section is shown from appendix 4 to 14, where is displays the consumption schedule for each section.
5.3.2 Solar hot water system
For the Solar Hot Water System only the cost of solar flat-plate collector and hot water storage tank were considered as usually the sellers provide the circulation pump with their collector so that it is not necessary to pay attention on it. The solar collector will be constituted of 8 collectors and it will cover 16 m2 on the roof of the school. For this arrangement the prices of the water collector are in the range of US$ 100 – 230 each collector from Chinese market, and the whole hot water solar arrangement is around US$ 1600 - 3200.

-52-
This system was designed in such way that the scholars have a shower in the morning and evening according to the profile shown in appendix 15.
Chapter 6
6 Results and discussion
The aims of optimization in this project were to get desired values of electricity and hot water temperatures at 40 oC through the year without using an auxiliary source for electricity generation and hot water heating respectively. At the same time it was necessary to reduce the amount of components in the system or their capacity without changing the output goals, thus:
The photovoltaic system was calculated in order to provide a power of 7018 Wp/day provided by 24 PV modules of 295 Wp, daily energy consumption of 21902 Wh/day and battery bank capacity of 2935.74 Ah in 48 V DC output. Other arrangement was done with a battery bank of 24 V DC output and capacity of 5871.5 Ah (see appendix 3). The battery capacity was calculated for 3 days of autonomy.
In the second semester of the year dumped power in the range of 1200 W to 4000 W which is produced by the system can be used for full automatic washing machine or other appliances used for short time, because this dumped power last in average between 1 hour to 3 hours (from 11 to 2 pm). This dumped power occurrence can be controlled by the user when the Battery charger control screen shows the battery fractional state of charger exactly 1.0, because in this stage the battery normally do not need no more charge but the system continues producing power and this power is wasted to the atmosphere. This power is produced due to the availability of diffuse radiation in the atmosphere and the load power is saturated.
The hot water system provided water for the users at temperature of 40 oC through the year reaching the goal. And it was important to optimize the water flow to the collectors and monitor the outlet temperature from the collector because this has to be below 100 oC. If the temperature is more than 100 oC the collector efficiency begins to decrease due to water vapor formation (gaseous state of water) and if it happens more water is purged than hot water to the tank.

-53-
The limit of discharge and charge FSOC was set to 0.6 in order to decrease the power from grid, decrease the power peak (amount of PV module) and to cover the need of power for the system with low cost.
The dumped power does not depend strictly on radiation which means that the radiation can be 800 W/h*m2 during the day without a dumped power, and it occurs during days even if radiation is below 800 W/h*m2. So dumped power will depend on state of charge of the battery and the same occurs with power from grid, as following. When the state of charge is below 0.50, so in this situation it is needed power from other source, the called power from grid. In other hand when the state of charge of the battery is 1.0, in this situation the dumped power or waste power that is produced to the atmosphere is verified.
The power from grid in the simulation also appears, when the system has total radiation below 400 W/h*m2 in four consecutive days. This phenomenon normally occurs from March until April.

-54-
Chapter 7
7 Conclusions
One of the big challenges in designing an off-grid PV system and solar hot water system without auxiliary heating source is to cover the energy needs through the year in the period of low radiation. Due to this situation, sometime it is necessary to increase the system with the battery capacity or with the area of PV module in order to reduce to zero the restrictions of the system usage and to keep the hot water load temperature at 40 0C.
In order to reduce the need of power from grid it was necessary to reduce the
battery state of charge through the year in the average of more than 60% over the range of 0.80 charged, and this range is considered as good level for the long last of the battery.
The power peak production in the photovoltaic system is higher, than calculated and it increased 76.75% but in other hand the capacity of the battery bank decreased to 68.13% using 48 V DC output and 63.87% using a battery bank of 24 V DC. But at the end of day this cost will be compensated with the low cost of PV modules.
The experience 7 is the ideal because it has the lowest energy from grid,
lowest cost of PV modules due to their low quantity and low number of battery cells.
So using TRNSYS simulation studio it was possible to reduce the battery capacity from 3000 Ah to 2000 Ah at 48 V DC, although the amount of PV modules was nearly doubled. Nevertheless the cost of the batteries cell are so far two times expensive than the cost of PV module, due to this the cost of the system is reduced considerably.
Chapter 8
8 Recommendations
Solar cables should be used because those are resistant for high temperature on the roof and are UV rays protected.
The installer of the system should follow all technical data used during the simulation in TRNSYS.

-55-
In order to reduce the system cost the storage tank for hot water should be built locally.

-56-
References
1. http://www.iisd.org/tkn/pdf/energy_security_mozambique.pdf, 11.09.2012
2. IEA, Key World Energy Statistic, Energy Outlook 2011
3. Klein S.A. et al., 2007, TRNSYS: Transient System Simulation Program, Version16, Solar Energy Laboratory, Madison Wisconsin, 2007.
4. www.safewater.org, 18.10.2012
5. Goetzberger, Adolf et al., 2005. Photovoltaic Solar Energy Generation. Berlim: Springer Berlin Heidelberg ,2010. ISBN 3540236767.
6. http://www.eoearth.org/article/Solar_radiation, 15.10.2012
7. McDaniels, David K., 1929. The Sun: our future energy source. New York: John Wiley & Sons, 1984. ISBN: 0-471-86859-0
8. Renewable Energy Policy Network for the 21st century (REN21), Renewables 2010 Global Status Report, Paris, 2010, pp. 1–80.
9. Antonio Luque and Steven Hegedus (2003). Handbook of Photovoltaic Science and Engineering. John Wiley and Sons. ISBN 0-471-49196-9.
10. Kaminska, Izabella (June 18, 2012), The exponential growth in solar consumption. The financial Times Ltd. Retrieved 17 September 2012.
11. Kurzweil, Ray (21 February 2011). Climate change no problem, says futurist Ray Kurzweil. The Guardian. Retrieved 17 September 2012.
12. www.rise.org.au., Domestic Hot Water Systems, Retrieved 2008-10-29.
13. Trinkl, Christoph; Wilfried Zörner, Claus Alt, Christian Stadler (2005-06-21). "Performance of Vacuum Tube and Flat Plate Collectors Concerning Domestic Hot Water Preparation and Room Heating". 2nd European Solar Thermal Energy Conference 2005 (estec2005). CENTRE OF EXCELLENCE FOR SOLAR ENGINEERING at Ingolstadt University of Applied Sciences. Retrieved 2010-08-25.
14. Tom Lane. Solar Hot Water Systems: Lessons Learned, 1977 to Today. p. 5.
15. Kalogirou, S. A, Use of TRSYS for modeling and simulation of a hybrid PV-Thermal solar system for Cyprus. Renewable Energy 2001; 23:247-260.
16. IEA, Statistic CO2 highlight emission, Energy outlook, 2011
17. IEA, Energy Technology Perspectives, Energy Outlook, 2008
18. IEA, Energy Technology Perspectives, Energy Outlook,2010
19. Cuamba B.C et al, A solar energy resources assessment in Mozambique. Journal of Energy in Southern Africa 2006; Vol 17 No 4 76- 85
20.http://www.knovel.com.focus.lib.kth.se/web/portal/browse/display?_EXT_KNOVEL_DISPLAY_bookid=2774&VerticalID=0 ,acessed 07.07.2012

-57-
21.http://www.altestore.com/store/Charge-Controllers/Solar-Charge-Controllers/MPPT-Solar-Charge-Controllers/Xantrex-MPPT-Solar-Charge-Contollers/Xantrex-XW-MPPT-80A-Solar-Charge-Controller-up-to-600V-DC-input/p8992/-input/p8992/, retrived on 02.12.2012
22. http://www.solarbag-shop.de/english/hoppecke-8-opzv-solar-power-1000ah.html, retrived on 02.12.2012

-58-
Appendices
Appendix 1: Localization of Ancuabe District and Distance from reference City Pemba
Source: https://maps.google.com/maps?hl=en

-59-
Appendix 2: Mozambique Electric Grid
Source: www.edm.co.mz

Master of Science Thesis KTH School of Industrial Engineering and Management
Energy Technology EGI-2010-2012 Division of xxx
SE-100 44 STOCKHOLM
Appendix 3: Overview of the photovoltaic system consumption calculation
# Location Power (W) Working
hours per day (hr/day)
Energy (Wh)
Capacity (Ah/day) 48VDC
Capacity (Ah/day) 24VDC
Working Time per
week (hr/week)
Working Time per
month (hr/month)
Working Time
per year (hr/year)
1 Bedroom lamps 720 6 5082,352941 105,8823529 211,7647059 42 180 2190 2 Wallsocket for Bedroom 1200 6 8470,588235 176,4705882 352,9411765 42 180 2190 3 Shower rooms lamps 360 5 2117,647059 44,11764706 88,23529412 35 150 1825 4 TV/DVD 190 5 1117,647059 23,28431373 46,56862745 35 150 1825 5 Internet room (Computer) 2200 6 15529,41176 323,5294118 647,0588235 42 180 2190 6 Sitting and Internet rooms lamps 216 7 1778,823529 37,05882353 74,11764706 49 210 2555 7 Administration lamps 180 3 635,2941176 13,23529412 26,47058824 21 90 1095 8 Administration Appliance 1000 6 7058,823529 147,0588235 294,1176471 42 180 2190 9 Fan administration 300 5 1764,705882 36,76470588 73,52941176 35 150 1825
10 Classrooms 252 2 592,9411765 12,35294118 24,70588235 14 60 730 11 Data Show 250 3 882,3529412 18,38235294 36,76470588 21 90 1095 12 Circulation Pump and Other sensors 150 11 1941,176471 40,44117647 80,88235294 77 330 4015
Total 7018 46971,76471 978,5784314 1957,156863
Yearly needs 2561570 3 day autonomy
2935,735294 5871,470588

-61-
Note:
Inverter Efficiency 0,85
Battery 24 V DC OPzV 978,5784314 Ah
Quantity of calculated Modules 23,78983051 modules 7080 Wp/day
Installed modules 295 WP 32 modules 9440 Wp/day
42 modules 12390 Wp/day The best Arrangement
44 modules 12980 Wp/day
48 modules 14160 Wp/day
56 modules 16520 Wp/day
Average solar Irradiation used for calculation
6 kWh/day*m2

-62-
Appendix 4: Daily bedroom lamps profile
Appendix 5: Daily bedrooms Wall socket profile
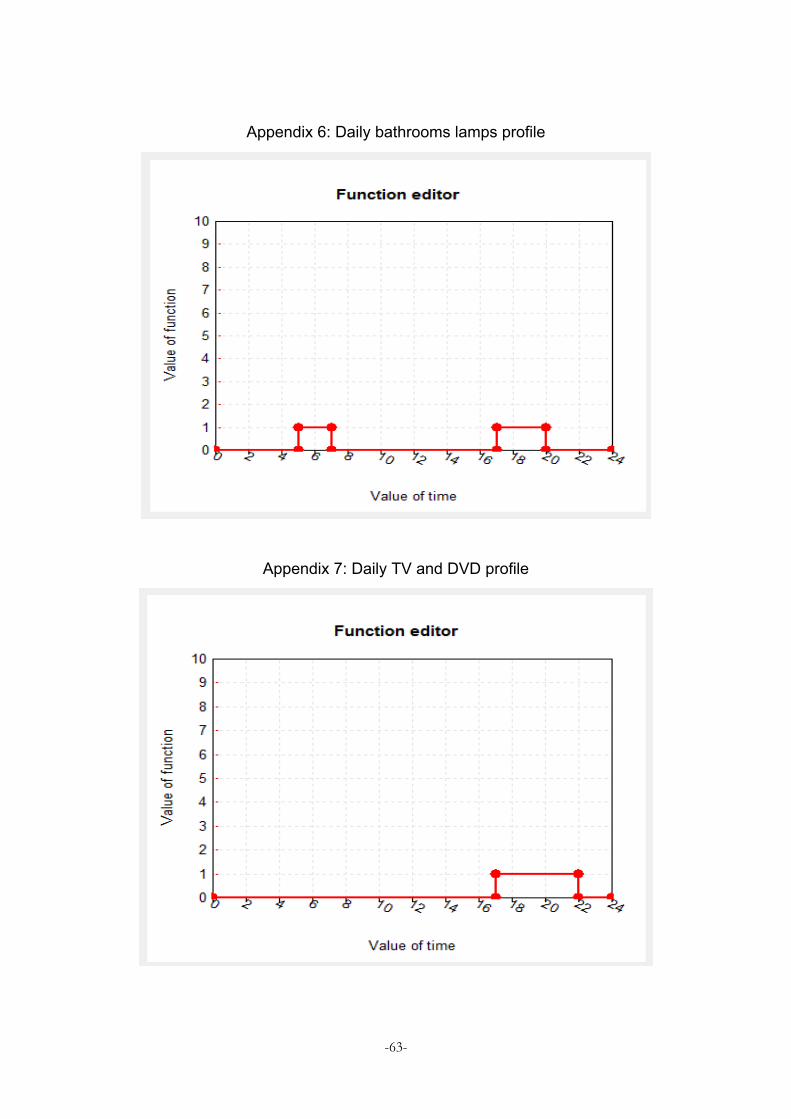
-63-
Appendix 6: Daily bathrooms lamps profile
Appendix 7: Daily TV and DVD profile

-64-
Appendix 8: Daily computers profile
Appendix 9: Daily sitting and internet rooms profile

-65-
Appendix 10: Daily administration room lamps profile
Appendix 11: Daily administration appliances profile

-66-
Appendix 12: Daily fans profile
Appendix 13: Daily classrooms lamps profile
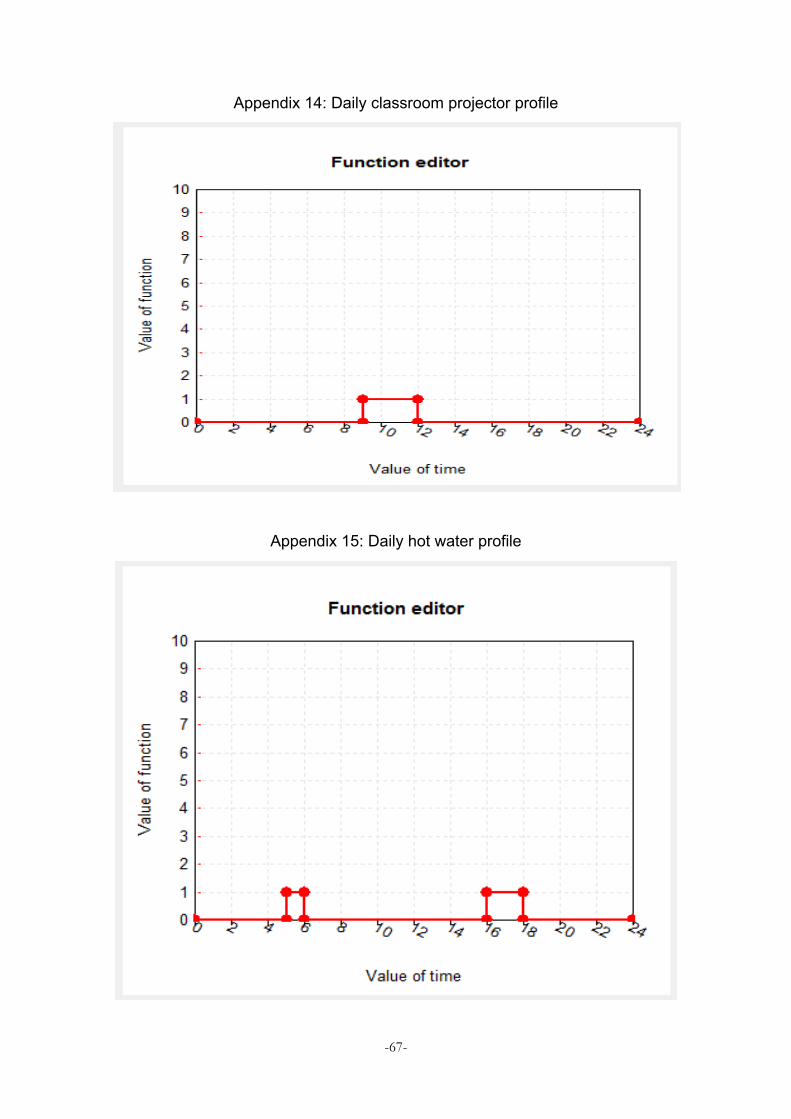
-67-
Appendix 14: Daily classroom projector profile
Appendix 15: Daily hot water profile