design and vibration testing of a flexible seal whisker model lrf
TRANSCRIPT

Design and Vibration Testing of a Flexible Seal Whisker Model
by
Christopher D. Gerber
Submitted to theDepartment of Mechanical Engineering
in Partial Fulfillment of the Requirements for the Degree of
Bachelor of Science in Mechanical Engineering
at the
Massachusetts Institute of Technology
June 2013
C 2013 Massachusetts Institute of Technology. All rights reserved.
/) .4
Signature of Author:
rk 'd
Department of Mechanical EngineeringA May 10, 2013
Certified by:Michael S. Triantafyllou
Professor of Mechanical and Ocean EngineeringThesis Supervisor
Accepted by:Anette Hosoi
Professor of Mechanical EngineeringUndergraduate Officer
JUL 3
LRf RIES
w ILA-1

2
Design and Vibration Testing of a Flexible Seal Whisker Model
by
Christopher D. Gerber
Submitted to the Department of Mechanical Engineeringon May 10, 2013 in Partial Fulfillment of the
Requirements for the Degree of
Bachelor of Science in Mechanical Engineering
ABSTRACT
Harbor seal whiskers have a unique surface structure that dramatically reduces vortex inducedvibrations as they move through the water. Concurrently with rigid whisker experiments, thisproject focuses on the design and testing of a flexible model. The rubber model was cast withintegrated Kevlar strings, for tensioning purposes, and accelerometers to measure vibration data.
The whisker model was mounted to the carriage in the MIT tow tank where it could be towed ata variety of speeds and tension settings. Accelerometer data clarity was a significant problem,but gradual improvements to the whisker mounting design allowed higher quality data to begathered at a larger range of towing speeds. Using this data we observed correlations betweentowing speed, vibration frequency, g forces, and displacement in the whisker's vertical axis ofmotion.
Further work could be done to examine whisker motion in multiple axes, as well as withdifferent angles of attack.
Thesis Supervisor: Michael S. TriantafyllouTitle: Professor of Mechanical and Ocean Engineering
3

Acknowledgements
I am very grateful for the numerous contributions the following people have made to my MIT
education and to my thesis specifically. Many people at the town tank have been very helpful-
especially Heather Beem who helped me every step of the way through this project all the way
from where it started as a UROP last summer. I would also like to thank the MIT student Hobby
Shop staff for building advice on every conceivable topic and for allowing me to monopolized
the CNC router for a week. I would also like to thank Prof. Triantafyllou for his sound guidance
and anyone else who helped me with this project.
4

Table of Contents
Abstract 3
Acknowledgements 4
Table of Contents 5
List of Figures 7
List of Tables 8
1. Introduction 9
1.1 Seal Whisker Structure 10
1.2 Past Work 12
1.2.1 Rigid Whisker Experiments 12
1.2.2 Flexible Structures 12
1.3 Flexible Whisker Introduction 13
1.4 Design Requirements 13
2. Mold Design Process 15
2.1 Mastercam Toolpaths 17
2.1.1 Toolpath Details 18
2.1.2 Toolpath Mirror Imaging 20
2.1.3 Toolpath Optimization 20
2.2 Mold Flexibility Problems 20
2.3 End Bracket Design 21
3. Whisker Features 23
3.1 Accelerometers 23
3.1.1 Accelerometer Mounting 24
3.2 Kevlar Strings 27
3.3 Casting Process 27
4. Mount Design 30
4.1 Mount Structure 30
4.2 Initial Mounting Plan 30
4.3 Revised Mounting Plan 32
4.3.1 Spring and Turnbuckle Selection 33
4.3.2 Spring Constant Experiment 34
5

4.3.3 Implementation on the Mount 35
4.4 Troubleshooting Mount Problems 36
4.5 Final Mount Design 38
5. Experiments and Discussion 41
5.1 Tests without clamps 41
5.1.1 Varying Tension 41
5.1.2 Varying Speed 43
5.2 Tests with clamps 45
5.2.1 Pluck Testing 45
5.3 Discussion 48
5.4 Conclusion 50
6. Bibliography 52
6

List of Figures
Figure 1-1:
Figure 1-2:
Figure 1-3:
Figure 2-1:
Figure 2-2:
Figure 2-3:
Figure 2-4:
Figure 2-5:
Figure 3-1:
Figure 3-2:
Figure 3-3:
Figure 4-1:
Figure 4-2:
Figure 4-3:
Figure 4-4:
Figure 4-5:
Figure 4-6:
Figure 4-7:
Figure 4-8:
Figure 4-9:
Figure 4-10:
Figure 4-11:
Figure 5-1:
Figure 5-2:
Figure 5-3:
Figure 5-4:
Figure 5-5:
Figure 5-6:
Figure 5-7:
Figure 5-8:
Figure 1-1: Close up views of harbor seal and sea lion whiskers
Whisker geometry
VIV Drag Reduction attempts
Half of whisker mold
Mastercam toolpath mesh
Practice toolpath surface finish
Pouring side end bracket
Mold, jig, and brackets (Solidworks)
Test accelerometer cast
Accelerometer mount for casting
Mold prepared for casting
Whisker mount with whisker attached
Obsolete clamping mechanism
Mounting proof of concept mockup
Graph of spring constant vs. deformation
Full scale mount next to proof of concept
PVC pipe attached to prevent Kevlar string damage
Pulleys mounted 6" from top of hydrofoil-prevent rubbing
Half of new end clamp design (Solidworks)
Simple clamp design around left end of whisker
Diagram of mounted whisker and all components
Final whisker/mount design mounted in the tow tank
Whisker test run 0.3 m/sec 105 N tension
Whisker test run 0.3 m/sec 122 N tension
2 Test runs superimposed on each other
Standard deviation of acceleration vs. towing speed
Side view of whisker in tank (shows little bowing)
Pluck test 165 N tension
Power spectra from 165 N Pluck Test
Dominant frequencies vs. towing speed
7

Figure 5-9:
Figure 5-10:
Acceleration, velocity, and displacement plots from integration
Dimensionless amplitude vs. reduced velocity
List of Tables
TABLE 4-1: Plotting spring deformation to find spring constant
8
49
49
34

1. Introduction
Harbor seals use their mystacial vibrissae (whiskers) not only to sense through direct
contact, but also to detect disturbances in the water. It is believed that based on the whisker
vibrations, they can perform hydrodynamic trail following in addition to aiding orientation. This
would allow them to catch prey. Actual seals have been shown to be able to follow objects
underwater while blindfolded and wearing earmuffs. It is hypothesized that the harbor seal is
particularly adept at this because their whiskers experience very little interference due to their
own shape moving through the water. When the whiskers do encounter a flow disturbance, the
resulting vibrations are then more noticeable.
Close-up pictures reveal that seal whiskers are not actually cylindrical as one might think.
The whiskers have an undulated elliptical structure (Figure 1-1). Current experiments in the
MIT Towing Tank suggest that this shape is specialized to reduce vibrations caused by vortex
shedding, or Vortex Induced Vibrations (VIV), as the whisker moves through the water.
Experiments to date have only employed rigid whisker models to attempt to understand their
behavior. The problem with this, of course, is that whiskers are not rigid, so a rigid apparatus
will not comprehensively model the behavior.
This portion of the research focuses on a flexible whisker model. The fabrication was
carried out by casting rubber in a 6' mold made from machinable wax. The flexible whisker has
integrated accelerometers, and it can be tensioned using Kevlar strings. The vibrational response
has been measured over different tension and speed settings,. These findings provide more
accurate biological understanding of how such a structure responds on the real seals. It also has
applications in the advancement of underwater sensors. Finally, this work will help designers of
marine risers determine the usability of the whisker geometry as a VIV reduction mechanism.
9

1.1 Seal whisker morphology
The University of Rostock group first proposed the whisker geometry's vibration
suppression in their paper [1]. This article talks in detail about seal behavior, training, their
methodology, and our main point of interest: the whisker's structure. Using head mounted
cameras, the researchers filmed vibrissa behavior during hydrodynamic trail following tests and
took whisker samples for examination under a microscope.
I
Figure 1-1: Close up views of harbor seal (A,B) and sea lion (C,D) whiskers. [11
Images A and B show the frontal and dorsal views of a harbor seal whisker respectively. Images
C and D show the frontal and dorsal views of a California sea lion whisker, which does not have
the undulating surface structure of interest. The Rostock group used their observations to
generate the geometric description of the whisker in Figure (1-2).
10
x-Y
/
Z iZ
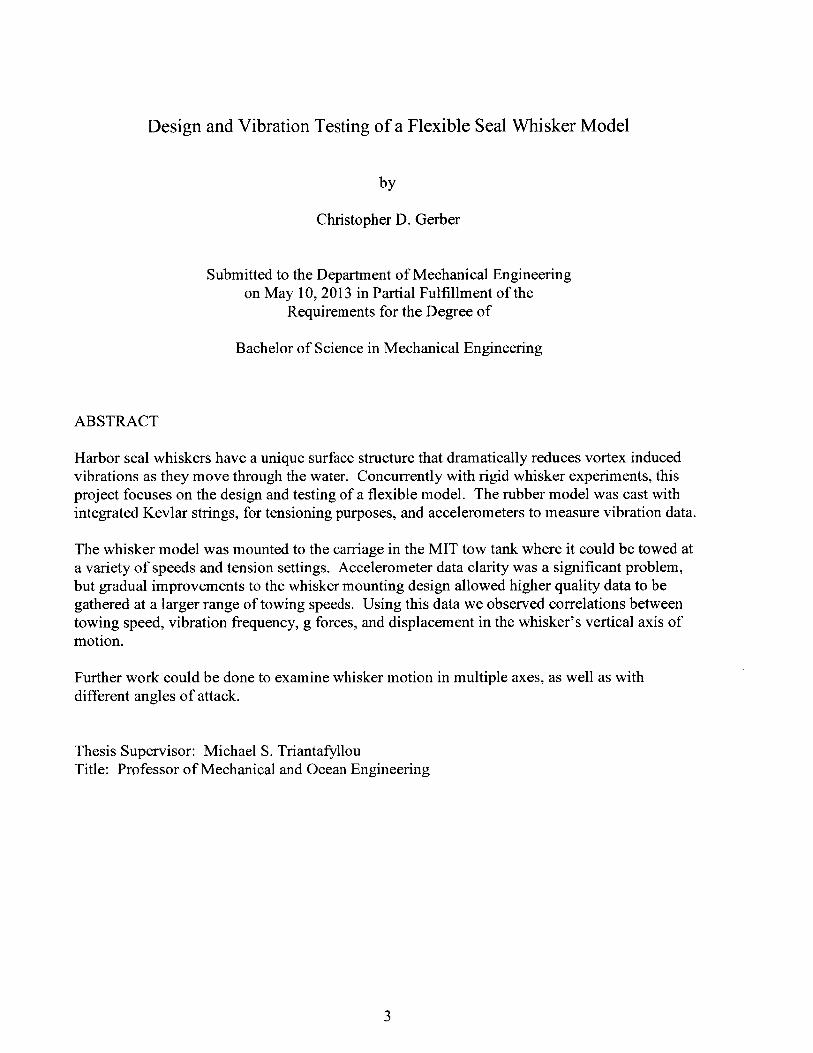
Figure 1-2: Whisker geometry [I]
From the article: "Parameters of the idealized vibrissa surface model. M, the half-period of the
undulation, equals 0.91mm. a and b, the radii of the vibrissal cross-section in the laterally wide
location, equal 0.595mm and 0.24mm, respectively. K and 1, the radii of the vibrissal cross-
section in the laterally narrow location, equal 0.475 mm and 0.29mm, respectively. The
connecting lines between the minima and maxima of the undulation on the rostral and caudal
edges of the vibrissa, and thus the directions in which a and k were measured, were found not to
be perpendicular to the vibrissal axis but oriented at angles a( 15.27 deg) and Pf(l 7.60deg), as
indicated." [1]
Heather Beem used these numbers to create a Solidworks model of the whisker. All future
whisker models are based on the dimensions specified by the Rostock group and are simply
scaled in size based on the application.
11
I
1.2 Previous work
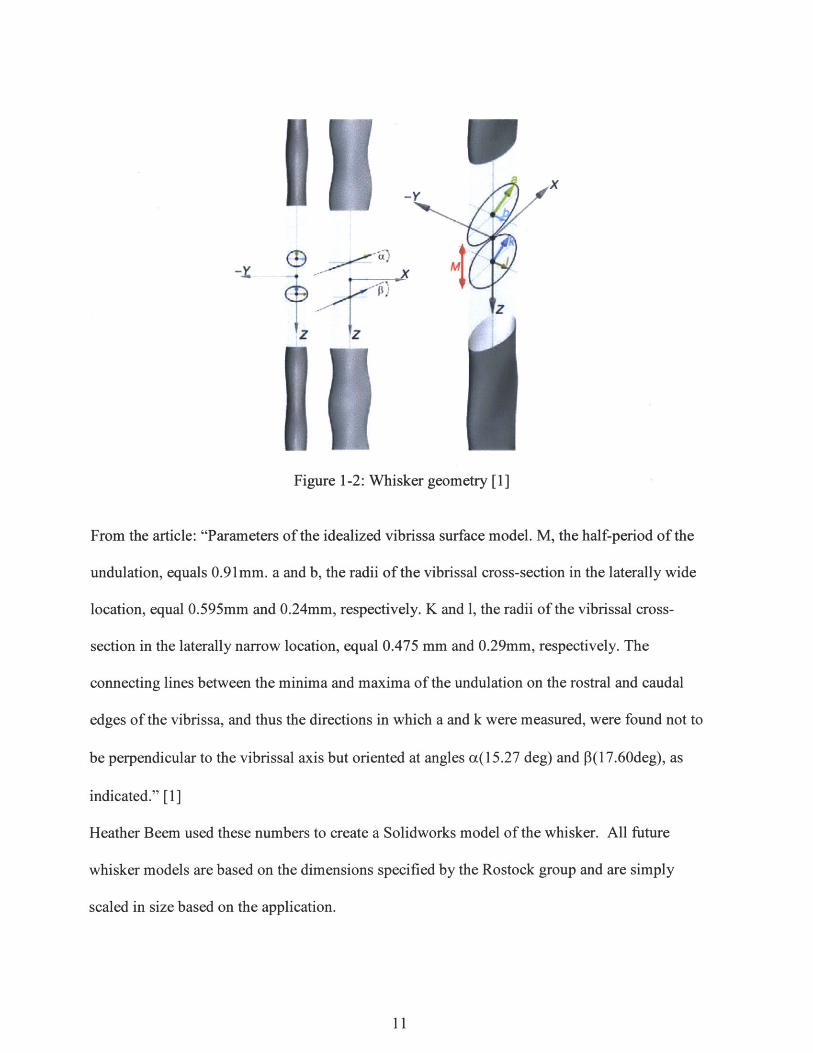
There has been a significant amount of research done in past years in the area of Vortex
Induced Vibrations. Researchers have worked with cylinders in flexible and rigid forms. M.
Zdravkovich experimented with various shapes in an effort to reduce VIV and drag including
helical strakes shown in the image below (a). Unfortunately, while this feature suppressed VIV,
it increased drag.
(a)(M (C)
Figure 1-3: Various different additions to cylinders to try to reduce VIV [6]
Other experiments have been done with cylinders featuring surface bumps. These have been
able to reduce vortex shedding by up to 20%, but like the helical strakes, these increased drag.
To date, no geometry has been found to both reduce VIV and drag. Hopefully the whisker
geometry's will be able to do so. [6]
12

1.2.1 Rigid Whisker Experiments
Prior to and simultaneously with this work, are experiments with rigid whisker models
[2,3]. The current model is connected to strain gauges which show the whisker vibrations caused
by vortex induced vibrations. Experiments have also been conducted to see how the rigid
whisker is affected by the wake from another object. This was done by mounting the rigid
whisker at various locations behind another structure. Unlike the flexible whisker, whose
mounting scheme will be discussed in detail later, the rigid whisker apparatus extends vertically
into the water. This helps keep vital electronics dry and ensure the strain gauges are not affected
by the weight of the whisker body.
1.2.2 Flexible Structures
The area of flexible structures has also been explored before, and past research has shown
that flexible and rigid structures behave very differently. Long underwater pipes or cylindrical
structures often behave like flexible structures despite being made out of metal. This is because
their length-to-hydraulic diameter ratio is usually very large, so the vortex induced vibrations
these structures experience can cause them to flex enormously. Previous experiments have
looked at ways to mitigate these vibrations through the addition of various elements on the
surface of the cylinder such as helical strakes, streamlined covers, spoiler plates, splitters, etc...
1.3 Flexible Whisker Introduction
The purpose of the flexible whisker is to model the flexible characteristics to eventually
combine with the rigid whisker model. The flexible whisker is an incomplete model because it is
13

attached at both ends rather than cantilevered like a real seal whisker. The cantilevered aspect
will be modeled with a much smaller scale rigid whisker.
1.4 Design Requirements
There were a large number of design criteria for the flexible whisker. It needed to be
placed in the Tow Tank horizontally so that the boundary conditions at both ends were the same.
The whisker should be tested under various tensions, which changes the natural frequency. The
model should contain sensors, which are embedded to avoid external devices, which would
disturb the flow. The purpose of these is to measure the vibrations at different points along the
whisker. Ideally, the accelerometers need to be small enough to fit inside the whisker and not
greatly affect the local flexibility. Based on the smallest available size of accelerometers, the
diameter of the model was chosen 1.89" crossflow direction and 4.59" in the in line direction.
Based on the length of the existing mount used to hold flexible cylinders, previously tested in our
lab [4,5], the corresponding length of the whisker model was chosen to be 6'.
The boundary conditions at each end of the whisker were also the subject of concern. A
simply supported boundary condition would be the most ideal for modeling purposes, but rigid
supports would be easier to build and implement. Extensive discussion and design iterations
relating to whisker mounting will be addressed later.
14

2. Mold Design Process
The rigid whiskers were manufactured using stereolithography, which is an additive
manufacturing process similar to 3D printing. This manufacturing method is very fast, but it
expensive and most resins for stereo-lithography are expensive to buy in large amounts.
Additionally, stereolithography has a very limited ability to manufacture with flexible materials
like rubber, and the available machines were not remotely close to the size chosen based on the
above design constraints. Most machines are capable of a 24" range at the most, and machines
with the range to manufacture 6' parts are exceedingly rare and expensive.
Creating the molds using a CNC mill posed a similar problem. Most mills have a range
of 48" at most and paying a company to machine two 6' molds would be far too expensive.
The only machine available with the adequate range to create these molds was the CNC router in
the MIT Hobby Shop. The router has a 4' by 8' range, but it can only machine soft materials.
Machinable wax was chosen for its consistency (as opposed to wood which has knots and other
inconsistencies), resistance to temperature (for the casting process) and machinability. The
largest continuous block of machinable wax available was 4', and buying in that size was
extremely expensive. Instead, buying 12" blocks was the best option. To make one side of the
mold, 6 of the blocks could simply be lined up and machined as if they were a single 6' block.
When the 12" long blocks arrived, they were all inconsistently sized so they had to be
individually hand machined to be identical. After this the blocks were ready to be aligned and
machined. In order to align and secure the blocks during machining, I created a jig out of
plywood by routing a 6 inch wide groove into a 2 x 8 x 74 inch plank of plywood. The blocks
were slid into place in the groove and screwed into place from the underside of the jig using 4
15

wood screws per block. This would ensure that the blocks would not become dislodged during
machining. After the jig was assembled, it was screwed into the particle board that covers the
surface of the CNC router table to keep the entire assembly from moving during machining.
Figure 2-1: Half of the whisker mold (post machining) attached to the router table and plywood
alignment jig
16

2.1 Mastercam Toolpaths:
The toolpaths for the molds were generated using the Mastercam MX5 program. The
procedure to generate the toolpaths started with importing the solid parts from Solidworks in the
form of .DXF files. The next step was to delete all of the extraneous lines in the part, which
includes every line that was not part of the surface loft or the top surface of the mold. In this part
of the process it was also extremely important to delete all of the lines that separated each of the
6 machinable wax blocks so Mastercam would consider all of them one continuous block. This
was important so that the toolpaths would not be interrupted as the transitioned from one block to
the next.
Figure 2-2:The Mastercam mesh of the mold surface is shown above. The neon blue represents
the roughing and finishing toolpaths.
17

2.1.1 Toolpath Details
The first toolpath was a facing toolpath done with a 1/2" diamater flat end mill router bit.
The purpose of this was to make sure the top faces of all 6 machinable wax blocks were level for
the subsequent toolpaths. Although each block was hand machined to be identical, there were
some irregularities in the plywood jig mentioned earlier. Because of this, some of the blocks sat
at an angle in the jig and this called for the use of a facing toolpath. In general, it is good
practice to do a facing toolpath before milling complex toolpaths so the router can be accurately
zeroed.
The second toolpath was a roughing toopath done with the same %/" diameter flat end
mill router bit. The purpose of the roughing toolpath was to remove the vast majority of the
material but use a large enough step over in order to not take up too much time. Roughing
toolpaths do not, however, mill down to the final level of the surface. They leave some material
for the finishing toolpath.
The finishing toolpath was done with a '/2" diameter round end mill router bit. This
toolpath removed the excess material left over from the roughing toolpath and left the surface
mostly smooth. Finishing toolpaths typically use a very small step over to make sure the surface
finish is smooth.
Before running these toolpaths for the first time on hundreds of dollars of machinable
wax and many hours of jig assembly, I decided to conduct some test runs on pieces of wood.
The results of a single roughing toolpath can be seen in the image below.
18

Figure 2-3: (Left) Ripples in the surface are still clearly visible in the mold because only the
roughing toolpath was used. (Right) Both roughing and finishing toolpaths were used. There is a
visible difference in surface smoothness from the finishing toolpath.
2.1.2 Toolpath Mirror Imaging
The second half of the mold needed to be a mirror image of the first side, so this provided
an opportunity to save some time. Instead of importing the second solid part and re-
programming the toolpaths from scratch, I used the mirror toolpath feature in Mastercam, which
created the complimentary mold with one click. This obscure and seldom used command is very
useful for expedited mold machining.
2.1.3 Toolpath Optimization
After creating the first mold there were some clear areas for improvement. The
machining process took an extremely long time, and left a somewhat rough surface finish that
would require extensive sanding. To decrease the machining time, I changed the end mill used
in the facing and roughing toolpaths to a 1" flat end mill router bit. Using a much larger bit
allowed me to increase the step over and significantly decrease the time of the facing and
19

roughing passes. To fix the surface finish problem, I increased the tracking speed of the router
head, and decreased the step over. This ensured a smooth surface finish without an excessive
time increase.
2.2 Mold Flexibility Problems
Due to the immense weight of the machinable wax blocks and the mold length, the
plywood jig had severe deformation problems when it was removed from the router table after
machining. The problem with this deformation is that it opened up the gaps between each
machinable wax block. This would cause severe leaking problems during the casting. In order
to remedy this, I installed metal L brackets connecting the jig to the blocks to increase the mold's
rigidity. The use of metal brackets, however, caused a thread stripping problem when the screws
were driven into the machinable wax blocks. On the second half of the mold, 2x4's were used
with wood screws instead of metal brackets to alleviate the thread stripping problem. After the
molds were machined, extensive sanding was needed to ensure a smooth surface finish. Even the
refined finishing toolpath left a ripple effect from the rounded router bit.
2.3 End-bracket design
At each end of the mold there are end brackets that serve several purposes. They are
machined out of / inch thick aluminum stock and measure 3" tall and 6" wide. The main
purpose of the brackets is to hold the two sides of the mold together at the ends. Each bracket
has 4 % inch holes that match up with - 20 threaded holes in the machinable wax molds. The
holes are also countersunk to accommodate the - 20 socket head screws. Each bracket has a
1" diameter center hole to accommodate T shaped cylindrical mounts. (these were not used in
20

the final mount design ) Both brackets have 1/8 inch guide holes for the Kevlar strings that are
positioned 1/16 inch to the right and left of the center holes. The top bracket has two more 1"
holes to accommodate the pouring of rubber during the casting process. On the bottom bracket,
there are two more 1/8 inch holes to allow airflow during casting.
Figure 2-5: The end bracket for the pouring side of the whisker mold
21

Figure 2-6: Solidworks image showing how the mold, jig, and end brackets connect
22

3. Whisker Features
3.1 Accelerometers
There were a number of factors that came into play when we chose accelerometers to put
inside the whisker. We anticipated that the "g" forces experienced by the whisker would be
relatively low, so an accelerometer with a large range would not be necessary. It would be far
more ideal to buy an accelerometer with a small range but high precision. It would also be
important to measure vertical, horizontal, and lengthwise vibrations in the whisker so the
accelerometers would need to measure 3 axes simultaneously.
By far the most pressing concern, however, was size and weight. If the accelerometer
was too big or too heavy, it would impact the behavior of the whisker and skew the data.
Another concern with size was the structural integrity of the whisker. Based on the density of
the rubber, we knew that a 6' whisker would be around 25-30 lbs and large accelerometers inside
the whisker could pose a tearing problem within the rubber.
Luckily, the Kistler 8688A5 accelerometer met all of these needs. The 8688A5 has a
range of +/ 5g's, and a sensitivity of 1000 mV/g. It measures in 3 axes, weighs only 7 grams,
and is a 2 inch per side cube. For comparison, the whisker is approximately 2" thick and 4"
wide, so the accelerometer would have almost no impact on the structural strength. Additionally,
the average density of the accelerometer is 84 lbs/ft^3 while the density of the rubber is
approximately 70 lbs/ftA. Because these densities are relatively comparable, the weight of the
accelerometer would have very little impact on the whisker's behavior. This combination of size,
weight, and sensitivity made the accelerometer ideal for application in the flexible whisker.
Conveniently, these new Kistler accelerometers were compatible with the 4 channel
couplers/power supplies already mounted on the tow tank carriage, so this saved a significant
23
amount of money. These power supplies are the Kistler 501 OB and the data sheet is shown in
the appendix. The accelerometers are connected to the power supplies with single 4 pin cable
that splits to 3 BNC inputs.
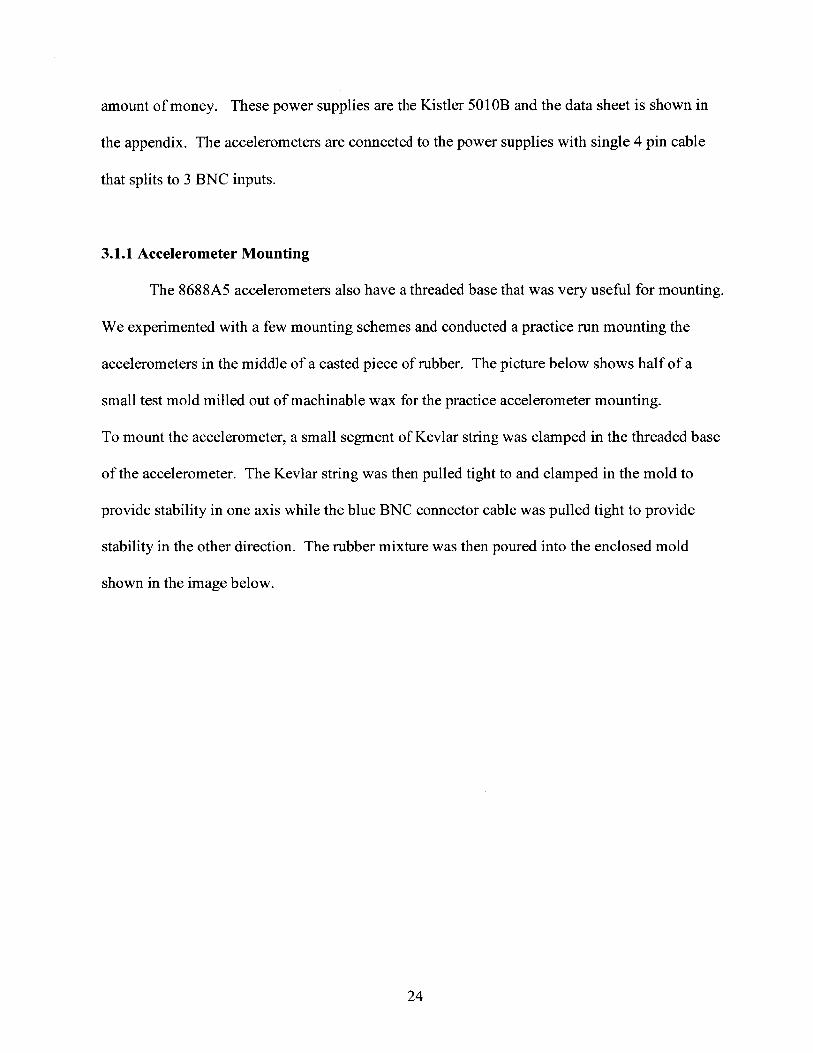
3.1.1 Accelerometer Mounting
The 8688A5 accelerometers also have a threaded base that was very useful for mounting.
We experimented with a few mounting schemes and conducted a practice run mounting the
accelerometers in the middle of a casted piece of rubber. The picture below shows half of a
small test mold milled out of machinable wax for the practice accelerometer mounting.
To mount the accelerometer, a small segment of Kevlar string was clamped in the threaded base
of the accelerometer. The Kevlar string was then pulled tight to and clamped in the mold to
provide stability in one axis while the blue BNC connector cable was pulled tight to provide
stability in the other direction. The rubber mixture was then poured into the enclosed mold
shown in the image below.
24

Figure 3-1: The resulting block of rubber with the embedded accelerometer (shown above)
served as a proof of concept for the Kevlar string mounting scheme which would be used in a
modified manner later on the full scale mold.
Based on the signals measured from this setup, it was determined that the mounting
scheme needed improvement to ensure more accurate alignment of the axes with the mold axes.
Two Kevlar strings were run through the threaded clamp on the bottom of the accelerometers.
These were pulled tight and screwed into the sides of the mold to ensure they were held tight for
the casting process. This technique reduced the movement significantly from when the
accelerometer was mounted on a single Kevlar string, however they still had a tendency to rock
forward and backward, twisting both strings. To reduce this problem, brackets were 3D printed
(Figure 3-2) to fit around the accelerometer casing and extend to the surface of the whisker mold.
This added a third axis of stability for the accelerometer mounts and significantly reduced
rotational movement. The red substance in the image below is wax used to waterproof the
25

connection between the accelerometer and BNC cable. All 3 accelerometers were mounted in
the mold in this fashion and the BNC cables were threaded sequentially out one end of the
whisker mold.
Figure 3-2: Center accelerometer mounted in preparation for casting
26

3.2 KevIar Strings
Kevlar strings were also integrated inside the structure of the whisker. The strings were
used to tension the whisker differently, thus changing the natural frequency. Kevlar was chosen
because of its low deformation under tension and high strength to size ratio. The size was a very
important aspect because we did not want the composition of the whisker to be significantly
impacted by the strings running through it. The Kevlar strings chosen were less than 1/16 inch
thick and had a breaking strength of 200 lbs-well over the maximum tension we intended to
place the whisker under. Two Kevlar strings were placed along the length of the Z axis (the long
cross sectional axis) of the whisker, down the middle, and approximately 1 inch apart. This was
done to allow for angle of attack changes in addition to providing stability. The Kevlar strings
exited the whisker at each end, passed through holes in the mount, and interfaced with the
turnbuckle spring tension system which will be explained in detail later.
3.3 Casting Process
Before attempting casting, there were a number of aspects that were important to consider and
plan thoroughly. First, we would be mixing and pouring over 3 gallons of rubber, so it was
important that the rubber's setting time was not too fast so the rubber wouldn't being setting in
the buckets rather than in the mold. Second, the molds were very heavy 1 00lbs, and would be
even heavier with 3 gallons of rubber inside so we needed to think carefully about how to clamp
it down. Third, how would the rubber actually be poured into the mold? The mold was 6' high
so there could be immense pressure at the bottom if casting was done vertically. This pressure
could cause severe leaking and cause us to run out of rubber and have an unfinished whisker.
27

Because of this problem, we considered pouring the whisker horizontally using some sort of tube
or syringe apparatus, but these seemed more difficult and risky than the vertical method.
In order to mitigate leaking, 16 through holes were drilled to secure each half of the mold
to the other. The end brackets also helped with this purpose. Each gap between machinable wax
blocks was also covered with duct tape to prevent leaking if the mold flexed. For similar casting
projects in the future, it is not recommended to use duct tape to cover the gaps. While the duct
tape did keep most of the leaks at bay, the tape's thickness was enough that it caused
irregularities in the whisker's surface finish. Instead of duct tape, we would recommend using
glue of some sort to seal the gaps, or coat the entire inside of the mold in some waterproof
material.
Figure 3-3: One half of the mold with end brackets and accelerometers mounted in preparation
for casting. Each gap between blocks is covered with duct tape.
28

Prior to casting, all of the rubber was mixed in large buckets. All of the rubber was poured into
the mold vertically, taking special care not to pour a stream of rubber directly onto one of the
accelerometers and possibly dislodge it. There was a copious amount of leaking from the bottom
area of the mold, most likely due to the high pressure. This was mitigated by pouring extra
rubber into the top of the mold. Eventually the rubber began curing and the leaks ceased. The
whisker was allowed to cure for over 24 hours and was removed from the molds. Excess rubber
attached to the whisker was removed and the whisker was ready for mounting.
29

4. Mount Design
4.1 Mount structure
The whisker mount is made out of stainless steel and is composed a 76" cylinder which
terminates at each end with two vertical hydrofoils that extend down into the water. At the
bottom of the hydrofoils, there are square mounting points which is where the Kevlar strings that
come out of the ends of the whisker are threaded. The hydrofoils are hollow and have small
holes in the bottom of each side to let water fill the hollow compartments. The purpose of this is
to minimize the buoyancy force of the mount and the potential interference that this force could
pose on the experimentation with the whisker.
Figure 4-1: Whisker mount with whisker attached
30
The whisker was designed with the length of this mount already in mind. As a result,
there are 3" of leeway on each side of the whisker before the Kevlar strings reach the mounting
points at the bottom of the hydrofoils.
The mount connects to the carriage using a large bracket system. This bracket is screwed
into the - 20 threaded holes on the carriage, and the mount attaches to the bracket with 4
semicircular clamps around the top cylinder of the mount.
4.2 Initial Mounting Plan
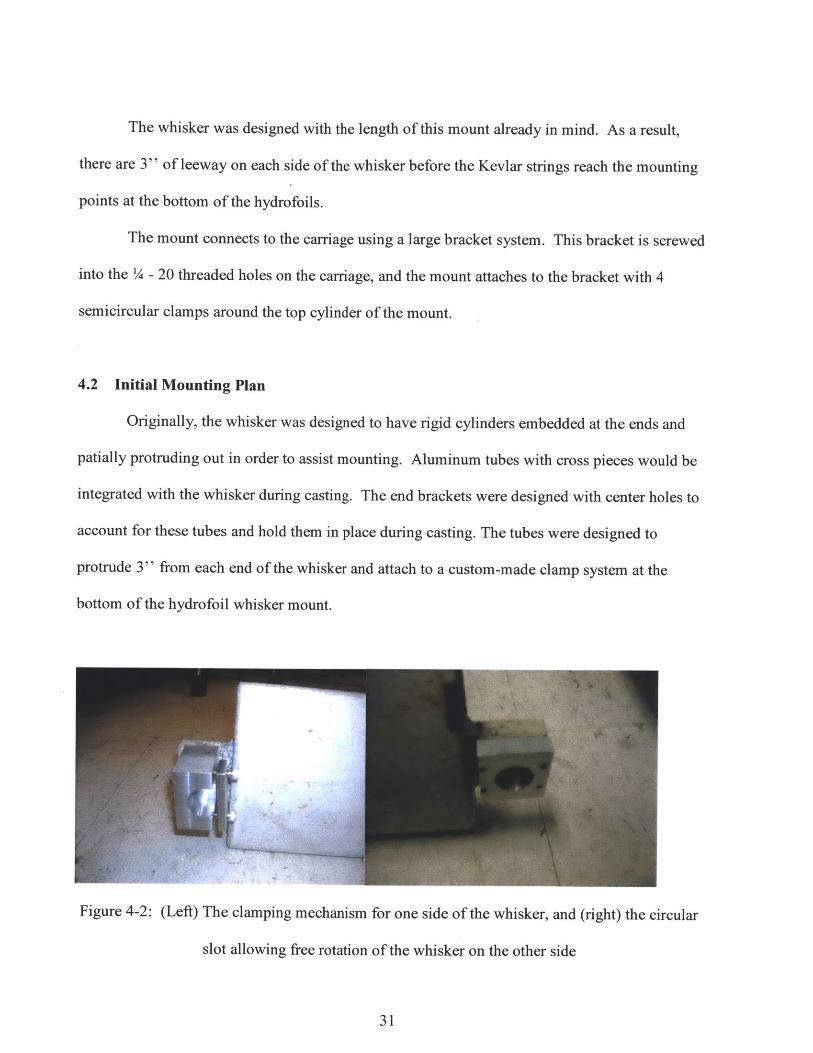
Originally, the whisker was designed to have rigid cylinders embedded at the ends and
patially protruding out in order to assist mounting. Aluminum tubes with cross pieces would be
integrated with the whisker during casting. The end brackets were designed with center holes to
account for these tubes and hold them in place during casting. The tubes were designed to
protrude 3" from each end of the whisker and attach to a custom-made clamp system at the
bottom of the hydrofoil whisker mount.
Figure 4-2: (Left) The clamping mechanism for one side of the whisker, and (right) the circular
slot allowing free rotation of the whisker on the other side
31

The benefit of this design was that it would allow for easy angle of attack adjustments during
testing. However, the idea was discontinued because it constrained the ends of the whisker
rigidly which negatively impacts the flexible behavior modeling. Instead, we opted for a
mounting scheme that involving only the Kevlar strings. This meant the whisker was
dynamically constrained at each end.
4.3 Revised Mounting Plan
The whisker mount needed to have a variable tensioning system and the capability to let
the whisker flex freely due to vibrations. In order to design this mounting system, I consulted
the flexible cylinder tow tank projects whose mount systems had similar capabilities [4,5].
The flexible cylinder project used a spring and screw rod mounted to one of the
hydrofoils to tension the whisker. The screw rod allowed the cylinder to be set at a base level
tension, and the spring allowed the cylinder to lengthen as a result of vibrations. This design
could not be used for the flexible whisker because unlike the cylinders, the whisker has two
Kevlar strings running through its center. These strings need to be kept horizontal for the
whisker to stay level, so attaching them to a screw rod that would twist up the strings was not an
option. So, a new tensioning system had to be designed.
The new mount design uses the same spring and screw principle with some alterations.
The new system was designed with a spring on both sides of the whisker, so they can both move
freely. The tensioning mechanisms were designed to mount to the sides of the hydrofoils in
order to save space. A turnbuckle is attached to the top of each hydrofoil, which holds a spring
32

on each side underneath. The Kevlar strings attach to the bottom of the springs and are threaded
through pulleys at the bottom of each hydrofoil.
Turnbuckle
spring
String
Pulleys
Figure 4-3: The proof of concept mockup (shown above) is made with a wooden frame, small
turnbuckles, and springs. The components are connected by a string, which stands in for the
Kevlar strings and whisker.
4.3.1 Spring and turnbuckle selection
For the full scale model, the turnbuckles and springs were chosen carefully. The springs
chosen were 6" extension springs with a maximum load of 551bs. The turnbuckles were chosen
for their large adjustment range of 3". This would allow us to vary the tension significantly
between experiments.
33
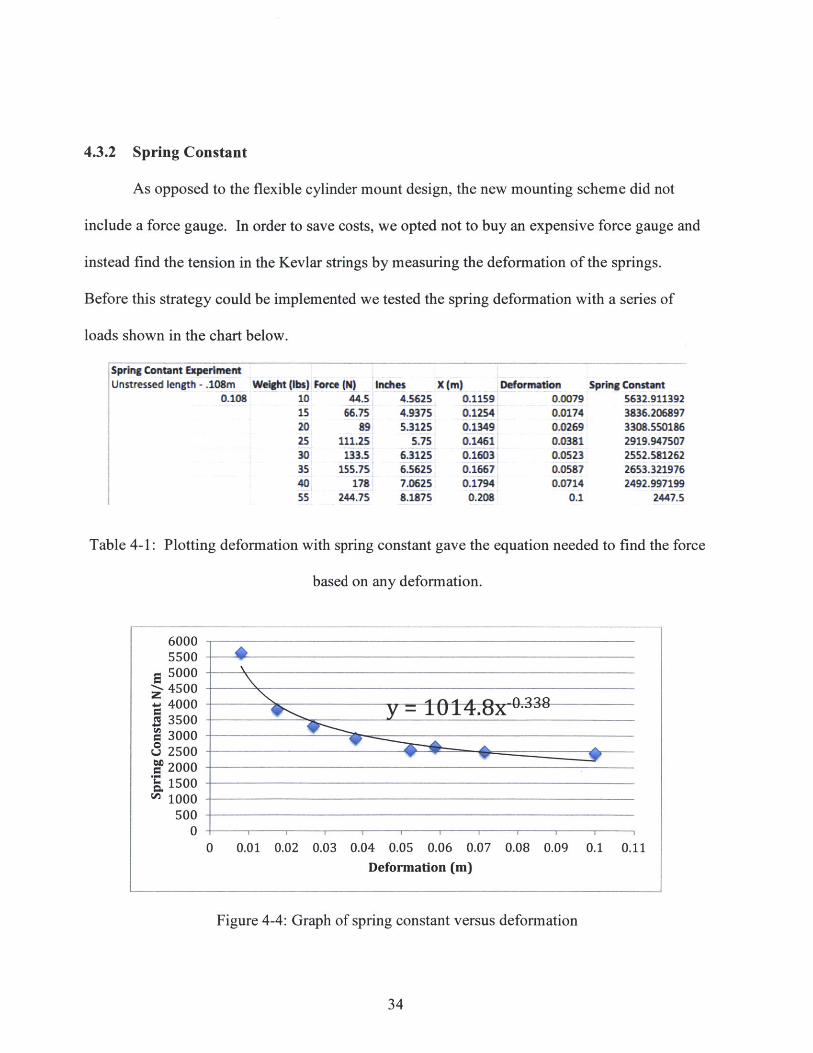
4.3.2 Spring Constant
As opposed to the flexible cylinder mount design, the new mounting scheme did not
include a force gauge. In order to save costs, we opted not to buy an expensive force gauge and
instead find the tension in the Kevlar strings by measuring the deformation of the springs.
Before this strategy could be implemented we tested the spring deformation with a series of
loads shown in the chart below.
Spring Contant ExperimentUnstressed length - .108m Weight (Ibs) Force (N) Inches X (m) Deformation Spring Constant
0.108 10 44.5 4.5625 0.1159 0.0079 5632.91139215 66.75 4.9375 0.1254 0.0174 3836.20689720 89 5.3125 0.1349 0.0269 3308.55018625 111.25 5.75 0.1461 0.0381 2919.94750730 133.5 6.3125 0.1603 0.0523 2552.58126235 155.75 6.5625 0.1667 0.0587 2653.32197640 178 7.0625 0.1794 0.0714 2492.99719955 244.75 8.1875 0.208 0.1 2447.5
Table 4-1: Plotting deformation with spring constant gave the equation needed to find the force
based on any deformation.
0
60005500500045004000350030002500200015001000500
00 0.01 0.02 0.03 0.04 0.05 0.06 0.07 0.08 0.09 0.1 0.11
Deformation (m)
Figure 4-4: Graph of spring constant versus deformation
34
n 4 0 C:) 0 22

4.3.3 Implementation on the mount
To mount the tensioning system to each hydrofoil on the mount, I drilled through-holes
and attached a bolt on each side. Each bolt extends an inch from the side of the hydrofoils, and
they are the points where the entire tensioning system and whisker hang from. High strength
lines are looped through the springs and tied to the bolts. The turnbuckles hang under the
springs. The Kevlar strings, which extend from the ends of the whisker, are threaded into
through-holes in the bottom of each hydrofoil. The Kevlar strings turn vertically after the
through-holes and are tied to the bottom loop of the turnbuckle on each side.
Figure 4-5: The proof of concept tensioning design (left) has the turnbuckle above the spring.
For the full-scale rig (right) the spring and turnbuckle were switched because the Kevlar string
could be attached to the turnbuckle more effectively.
35
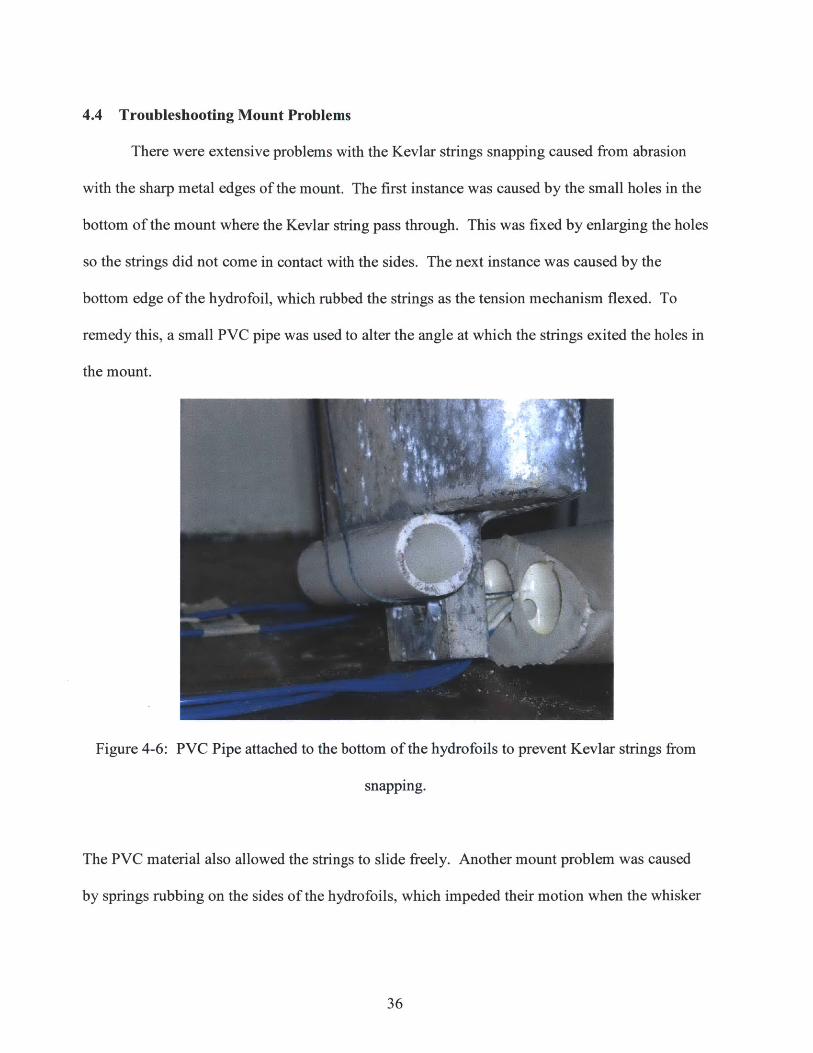
4.4 Troubleshooting Mount Problems
There were extensive problems with the Kevlar strings snapping caused from abrasion
with the sharp metal edges of the mount. The first instance was caused by the small holes in the
bottom of the mount where the Kevlar string pass through. This was fixed by enlarging the holes
so the strings did not come in contact with the sides. The next instance was caused by the
bottom edge of the hydrofoil, which rubbed the strings as the tension mechanism flexed. To
remedy this, a small PVC pipe was used to alter the angle at which the strings exited the holes in
the mount.
Figure 4-6: PVC Pipe attached to the bottom of the hydrofoils to prevent Kevlar strings from
snapping.
The PVC material also allowed the strings to slide freely. Another mount problem was caused
by springs rubbing on the sides of the hydrofoils, which impeded their motion when the whisker
36

needed to flex. This was remedied by the addition of pulleys, which served as spacers to move
the variable tensioning system away from the hydrofoils.
Figure 4-7: Pulleys mounted 6" from top of hydrofoils to prevent springs and turnbuckles from
rubbing
While all previous snapping incidents occurred either out of the tank or during mounting,
the strings experienced catastrophic failure during a 0.7 m/sec test run in the tank. The whisker
had not yet been tested at this speed, and the Kevlar strings alone did not constrain the whisker
enough for such a fast test. The whisker oscillated violently and turned so the broad side faced
forward. This increased the drag immensely and snapped three of the four connections during
the test. We learned two important lessons learned from this failure: increase testing speed
gradually, and leave plenty of slack in the accelerometer cables. The second point is extremely
important because the whisker could have pulled directly on the accelerometer BNC cables as it
separated from the mount if there hadn't been enough slack. Also, during high speed runs in
37
uncharted territory, it is a good idea to be ready to hit the stop button at any time if something
goes wrong. This accident prompted a redesign of the whisker mounting components.
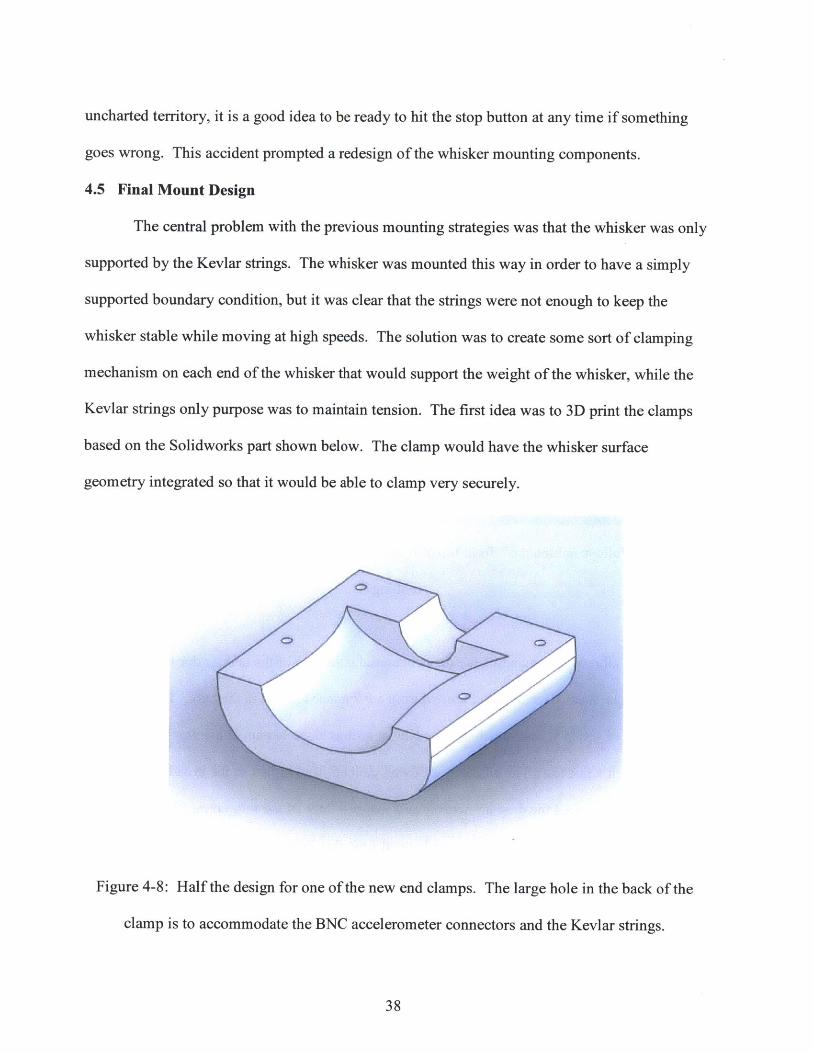
4.5 Final Mount Design
The central problem with the previous mounting strategies was that the whisker was only
supported by the Kevlar strings. The whisker was mounted this way in order to have a simply
supported boundary condition, but it was clear that the strings were not enough to keep the
whisker stable while moving at high speeds. The solution was to create some sort of clamping
mechanism on each end of the whisker that would support the weight of the whisker, while the
Kevlar strings only purpose was to maintain tension. The first idea was to 3D print the clamps
based on the Solidworks part shown below. The clamp would have the whisker surface
geometry integrated so that it would be able to clamp very securely.
Figure 4-8: Half the design for one of the new end clamps. The large hole in the back of the
clamp is to accommodate the BNC accelerometer connectors and the Kevlar strings.
38

Unfortunately, 3D printing these parts would have taken over 20 hours, which did not
work with our timeframe, so we opted for a much simpler clamp design. The final design
involved 2 simple metal brackets. The bottom of each bracket was screwed into the base of the
hydrofoils with 2 '"-20 screws. Four %/" through holes were drilled through the top and
bottom pieces of each bracket. 3" screws were used to tighten the brackets like a sandwich
around each end of the whisker shown in the image below.
Figure 4-9: Clamp mechanism tightened around the left end of the whisker
These brackets have changed the end conditions of the whisker from simply supported to rigidly
constrained, however, they have enabled us to tow the whisker at much higher speeds and
achieve higher tensions on the whisker-both of which are improvements for the validity of our
data. Shown below is the finalized design of the whisker, tensioning system, brackets, and
mount.
39

Mount
Whisker & AccelerometersClamp
Figure 4-10: Diagram of the mounted whisker and all components
Figure 4-11: Final whisker design mounted in the tow tank
40
Pulley
Spring
Turnbuckle
Kevlar String
O' /Z
5. Experiments and Discussion
5.1 Tests without clamps
Data was collected using Kistler accelerometers, which were connected to the Kistler
amplifiers on the tow tank carriage. The data was recorded in Labview and analyzed in Matlab.
5.1.1 Varying Tension
The whisker was tested at different tensions and different speeds while it was only
supported by the Kevlar strings. During these tests the bulk of the acceleration data is due to a
swaying motion the whisker experienced because of the weak constraints. Shown below is a
medium speed run.
0.
06
04
-0.2
41
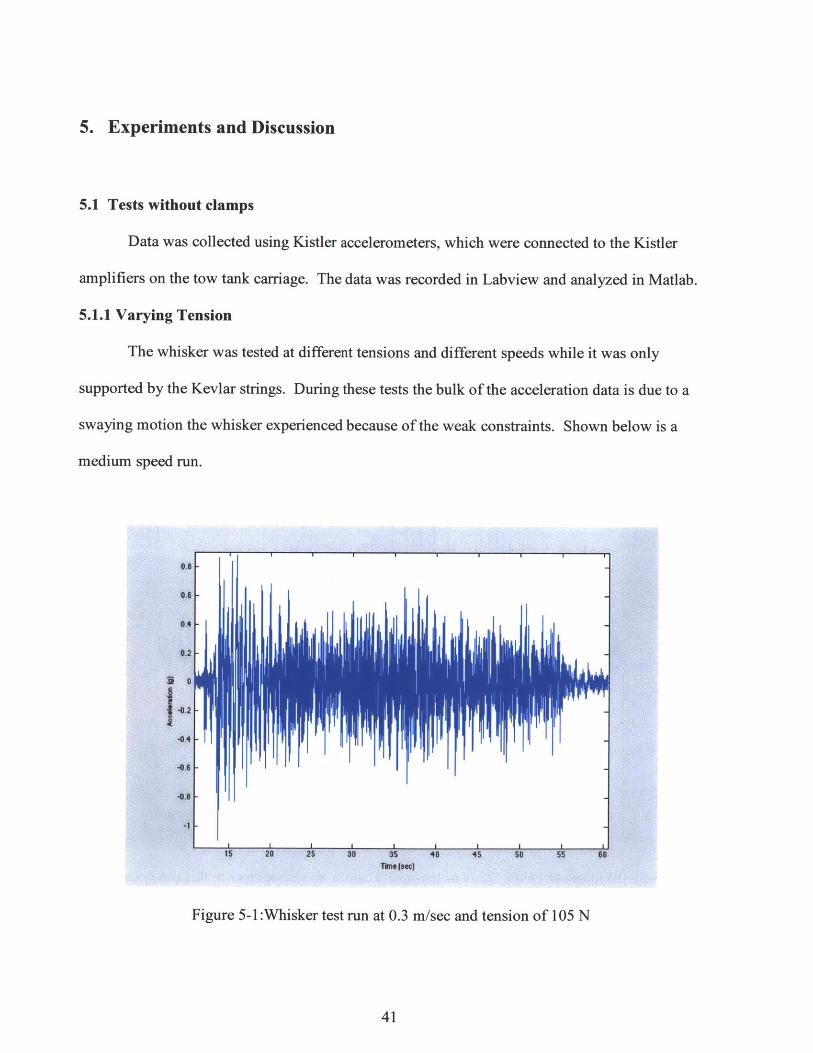
F i 20 25 3 a 35 40 45 so 55 80
Figure 5-1 :Whisker test run at 0.3 rn/sec and tension of 105 N
41

This test run starts at around 12 seconds, the whisker is in motion until -54 seconds, and the
tapering of the data at the end of the run corresponds to some dissipating vibrations still present
after the whisker has stopped. One noticeable aspect of this plot is the gradual taper of the
magnitude of the data from beginning to end. This is caused by initial acceleration imparted to
the whisker from the carriage. Because of the weak constraints of only the Kevlar strings, this
initial acceleration caused a swaying motion in the center of the whisker that dominates the
acceleration data. This gradual taper is from the swaying motion dying out over the course of the
run. One way to decrease the swaying motion was to increase the tension in the Kevlar strings.
The plot below shows a run at the same speed, but with the tension increased to 122 N.
I I I I I I I I
II'' I j~'
II I I I I I I I Iis 2D 25 so 35 40
Th (ac4S soI 55 Go SS
Figure 5-2: 0.3 m/sec run with 122 N of tension. There is no visible taper in this run because the
higher tension has reduced the dominant swaying motion. It is important to note that although
the taper is gone, the swaying motion is still present, just not as dominant.
42
's
0.4
0.2
0
-. 2
-4
4*.
-. 0-
I
9 II .1
I
. 1-

The presence of this swaying motion at lower tensions, along with the repeated snapping of the
Kevlar strings is what prompted the redesign with the clamps.
5.1.2 Varying Speed
Testing the whisker vibrations at different speeds was also an area of interest. During
testing without clamps there was a distinct trend for acceleration data. As the towing speed
increased, the motion became more violent, again due to the loose constraints, so acceleration
magnitudes scaled linearly with towing speed. Below is a plot of two runs--one at 0.2 m/sec
and one at 0.3 m/sec-superimposed on each other.
0.8
04
6.2
-6.2
4.11
0 2u1...
~
C10 10 A 0U l
Figure 5-3: 0.3 m/sec run (blue) superimposed on 0.2 m/sec run (red). It is clear that the
magnitudes of the accelerations for the 0.3 m/sec run are significantly larger.
This trend holds for all of the runs without clamps because the swaying of the whisker is only
exacerbated by the higher speeds. As mentioned earlier in the mount design section, the whisker
sway got so violent at a test run of 0.7 m/sec that the whisker turned sideways (with the long axis
43
1 117 7 11 11111 111111 11 111 Jill
I

of the elliptical cross section perpendicular to the direction of motion rather than parallel.) This
increased the drag enormously and easily snapped the Kevlar strings. Shown below is a plot of
the standard deviation of acceleration data at various speeds and tensions which shows the linear
increase.
0.40 T n :2S.25N
0 Tensiw:26.7N
0.3
0
0.15 0.15 00 .5 OS O.S 04 04
Figure 5-4: The plot shows a clear linear correlation between Stdev of acceleration and towing
speed due to the increasingly violent sway motions that occur as speed increases.
This swaying problem made it clear that in order to obtain reliable data, the whisker would need
to be tensioned as much as possible. During all of these runs, there was a visible downward bow
along the length of the whisker, however, the implementation of the clamps allowed for a much
higher tension and elimination of the bowing problem.
44

5.2 Tests with clamps
In order to achieve high tension with the clamps, the Kevlar strings were tightened fully
while the clamps were still open. After the string was under heavy tension, the screws through
the clamps were tightened to take the load off the Kevlar strings. This way, the large load from
the tension and the even more significant drag loads during high speed runs, were supported by
the clamps. Shown below is the whisker under full tension with very little bow along the length.
Figure 5-5: Whisker under high tension exhibits very little bowing
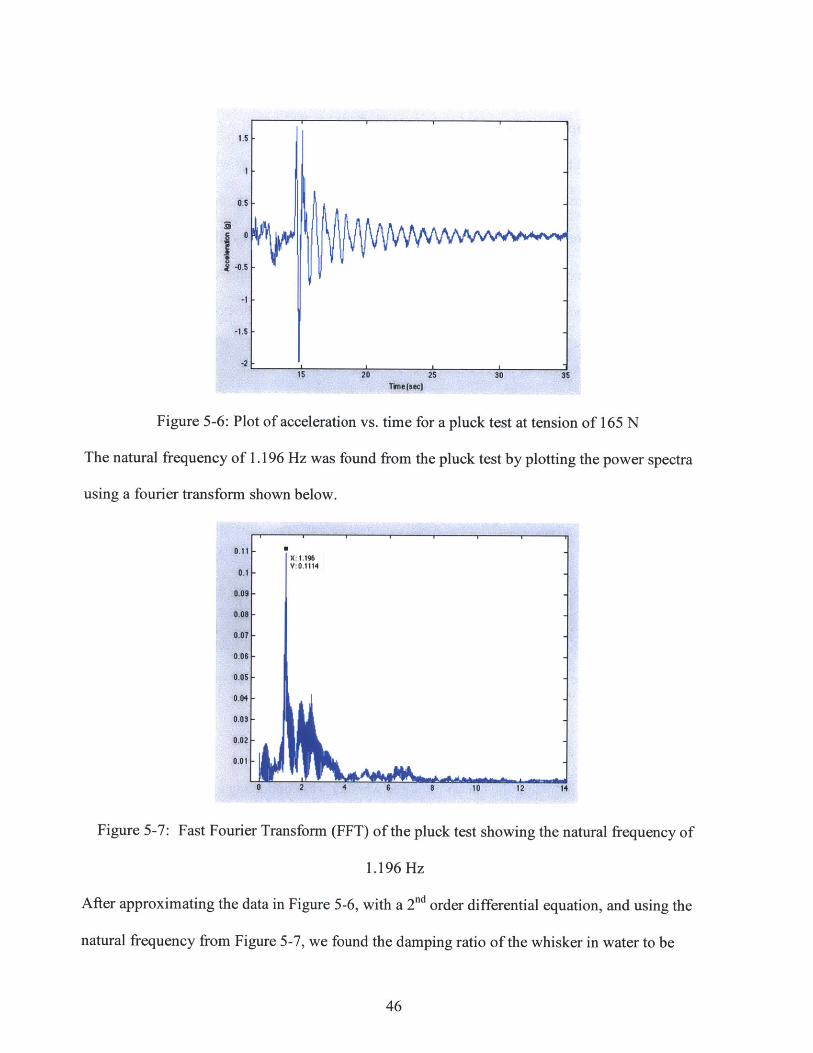
5.2.1 Pluck Testing
The first step in testing the clamp-mounted whisker was conducting a pluck test. The
purpose of the pluck test was to determine the natural frequency of the whisker with the damping
from the water. To perform a pluck test, we simply pulled the whisker up approximately 6" and
released. The whisker was allowed to oscillate until the vibrations died out. Shown below is the
plot of the pluck test for the highest tension with the clamps.
45
0.5
0-0 5
-1
1.5
15 20 30 35Thi.(secJ
Figure 5-6: Plot of acceleration vs. time for a pluck test at tension of 165 N
The natural frequency of 1.196 Hz was found from the pluck test by plotting the power spectra
using a fourier transform shown below.
0.11
0.1
0.090.08
0.07
0.05
0.04
0.03
0.02
0,01
Figure 5-7: Fast Fourier Transform (FFT) of the pluck test showing the natural frequency of
1.196 Hz
After approximating the data in Figure 5-6, with a 2"d order differential equation, and using the
natural frequency from Figure 5-7, we found the damping ratio of the whisker in water to be
46
- X: 1.196Y: 0.1114
-k.w o- 0 2 1

0.112. This indicates that the whisker is under-damped which is very evident from the vibration
data in Figure 5-6 because it is a damping ratio below 1.
Tests were run with the clamped whisker at speeds from 0.2 m/sec to 1.0 m/sec in
increasing 0. 1m/sec increments. From that acceleration data, the power spectra was obtained for
each run and the dominant frequencies plotted to compare with the whisker's natural frequency.
I
2
1.9
1.
1.7
1.6
1.5
1.4
1.3
0.2 0.3 0.4 0.5 0.6 0.7to*hgspeedmItec
0.8 0.9
Figure 5-8: The dominant frequencies during towing are all significantly higher than the natural
frequency of 1.196 Hz. There is also an interesting drop in frequency at 0.8 m/sec suggesting
another mode of vibration beginning at higher speeds.
47
0
080
o 0

5.3 Discussion
The Strouhal number is a dimensionless quantity that describes oscillation mechanics due
to vortex shedding. It is defined as:
f Lst =-
V
where f is the frequency of vortex shedding, L is the characteristic length (hydraulic diameter in
this case) and V is the velocity of the flow (towing speed.) If we assume the vortex shedding
frequency is comparable to the dominating frequency of one of the whisker runs, we can
approximate the Strouhal number for a run at 0.5 m/sec to be 0.17. This Strouhal number is in
the intermediate range, which is characterized by the buildup and rapid shedding of vortices.
The desired Strouhal number at which we want to operate is ~0.2 so the optimal speed is just
under 4.0 m/sec which gives a Strouhal number of 0.21.
The Strouhal number of 0.2 should result in the largest value of non-dimensionalized
amplitude vs. reduced velocity. Reduced velocity is defined as:
U
fd
where U is towing speed, f is frequency, and d is hydraulic diameter. When reduced velocity is
plotted with A/d, it results in a bell curve shape whose greatest A/d value occurs at a Strouhal
number of 0.2. It was the goal of this project to tow the whisker at a variety of speeds, extract
the amplitude from the acceleration data by integrating twice, and then try to recreate this bell
curve. Using "cumtrapz" integrating function in Matlab, the acceleration was integrated to get
velocity data. The problem with the velocity data was that it had a large time bias in the positive
direction. To fix this, we fit a line to the data and subtracted the resulting line from the velocity
data to get it centered around zero. The process was repeated again using the "cumptrapz"
48

function and removal of the time bias to get the displacement data. The Amplitude vs Velocity
plot and 3 corresponding acceleration, velocity, and displacement plots are shown below
I.
0 20 40 50 69 1100 120
0.02[
-0.02
-0.04f
0.2
20 40 60 g0 100 120 140
Figure 5-9: From top to bottom: acceleration, velocity and displacement plots
4 6 8 10 1Rteduced Y804Iyt(LId)
2 14 is is*
Figure 5-10: Dimensionless amplitude vs. reduced velocity. Each data point is averaged from
multiple runs at the same speed and there is no discernible bell curve trend.
49
middjjiij~.uI. Ii . Ja1t.Uii~ LL J.ILMtI~LiL aJLaj1ajia..~ I ~ii. iI~~ .ii.hLJAJ ja ~ j..JiJ
'771 a
U'5 .
4
1.8
1.6
1.4
1.2
1
0.8
0.6
III
0
000
0
0
00
A nit
U *1. 2
7?1 1117"1711171 11 IT T- -I IR
AM 40 60 so 100 120 1, 0

We tried a variety of filters to clean up the accelerometer data including high pass and
low pass filters, and data smoothing by averaging sets of data points. None of these approaches
solved the integration error problem or the time bias so the data was integrated without a filter
and the time bias was eliminated manually for each integral. In the future, the noise problem
could be solved using more advanced filtering techniques, or by reducing the sampling rate of
the accelerometers. The Kistler accelerometers sample at 800 points per second, which is much
higher than what this project needs, and that makes the data difficult to handle in the analysis
phase.
5.4 Conclusion
This project focused very heavily on the manufacturing and design side of the flexible
whisker experiment. Even during data collection we learned three important lessons that related
back to the design of the whisker and mount. First, the whisker needed to be under enough
tension to be as close to horizontal as possible in order for the data to be reliable. Second, the
whisker must be tested at a large variety of towing speeds in order to get an idea of the full
spectrum of the Strouhal number bell curve. And third, the end conditions, which depend on
how the whisker is mounted, play a very large role in the vibration behavior of the whisker.
Each of these issues were resolved by mounting the whisker more rigidly and under higher
tension. This project presented the unique challenge of mounting a large, heavy object that had
to be towed at high speed. Hopefully researchers can learn from these many design iterations
when mounting similar large structures in the future.
There is massive room for the expansion of this project. The area of most importance is
to find displacement data that supports the dimensionless amplitude vs. reduced velocity bell
50

curve. Further testing could be done through varying towing speed, tension, and angle of attack
of the whisker. Testing different angles of attack, however, would require significant changes to
the current mounting design. Additionally, the accelerometers measure vibrations in all 3 axes,
but only the vertical axis was considered in this project. In addition to adding the other axes,
there are two more accelerometers in the whisker-each at 1.5' from the ends-which will
complement the center accelerometer's data and help us to gain a better understanding of the
whisker's behavior. There are numerous directions in which the flexible whisker research
project could go, and I am excited to have developed a testing platform for extensive research in
the future.
51

Bibliography
[1] Hanke, W. et al., 2010 "Harbor seal vibrissae morphology suppresses vortex-inducedvibrations", J. Exp. Biol., 213, 2665-2672.
[2] Beem, H., Dahl, J., Triantafyllou, M. 2011 "Harbor seal vibrissae morphology reducesvortex-induced vibrations", APS Division of Fluid Dynamics.
[3] Beem, H. Triantafyllou, M. 2012 "Seal whisker inspired circular cylinders reducevortex-induced vibrations", APS Division of Fluid Dynamics.
[41 Farrell, D. 2007, "Vortex Induced Vibrations of Cylinders: Experiments in ReducingDrag Force and Amplitude of Motion", MS Thesis, MIT.
[51 Lee, E. 2007, "Airfoil Vortex Induced Vibration Suppression Devices", MS Thesis, MIT.
[6] Zdravkovich, 1980, "Review and Classification of Various Aerodynamic andHydrodynamic Means for Suppressing Vortex Shedding" Journal of Wild Engineering andIndustrial Dynamics, vol. 7, no. 2, pp. 145-189, 1981
52