design basis revision and weak link analysis of lcv-115b/d
TRANSCRIPT

Master Degree Final Project
Nuclear Engineering
Design Basis Revision and Weak Link Analysis of LCV-115B/D
Author: Carlos Santiago Sarasquete Director: Jorge Israel Díaz González Tutor: Elisabet Mas de les Valls Ortiz Date: June 2017
Escola Tècnica Superior d’Enginyeria Industrial de Barcelona

Design Basis Revision and Weak Link Analysis of LCV-115B/D 1
1. Summary
The following document consists in the design basis revision and weak link analysis of LCV-115B/D valves, which connect the Refueling Water Storage Tank with the charging pumps suction header. The studied nuclear power plant consists in two PWRs of three loops with an installed capacity of 1050 MWe each of them, which use slightly enriched uranium as fuel.
All operations and abnormal events were analyzed and approved for the worst case scenarios in order to be conservative. However, in some cases a best estimate approach could be acceptable, but this depends on the individual plant licensing.
The design basis revision should include maximum differential pressure expected during valve opening and closing, as well as pressure for both normal operations and abnormal events, as these operations are included in existing and approved design basis. Furthermore, actuation time and reduced voltage have been studied for each case, in order to demonstrated that LCV-115B/D are capable of performing their functions under design basis conditions. The results of the design basis revision of such valves are included in the section 9.2 of the present project.
Consequently, using maximum pressures and differential pressures obtained for both opening and closing operations, maximum design thrusts have been calculated. Table 1 shows the results of such calculations, which are located in the section 9.3 of this document.
Table 1 Design Basis Revision Results
Valve operation Function Pmax (kg/cm3) Delta P (kg/cm3) Maximum Design
Thrust (lb)
Opening Emptying of the reactor cavity initiation 12,3 11,6 8295,69
Closing Transfer to recirculation phase 13,3 12,6 8977,04
Weak link analysis of the critical components was done using ANSYS code (section 9.4), since the other parts of the valves were already evaluated in the respective Stress Report [9] and proved to be more resistant. The results obtained confirm that such valves could operate without structural failures under design basis conditions, since the minimum critical load calculated is 18503,00 lb (buckling failure of the stem) while the maximum design thrust is 8977,04 lb, which is much lower.
In Conclusion, ANSYS could be used to perform weak link analysis, for it very powerful computers are needed because mesh should be very fine. Nevertheless, models should be rigorously validated in order to use it in nuclear industry, and it is always recommended to perform a valve field diagnostic to be sure that the results are correct.

Design Basis Revision and Weak Link Analysis of LCV-115B/D 2

Design Basis Revision and Weak Link Analysis of LCV-115B/D 3
2. Contents 1. SUMMARY _______________________________________________ 1
2. CONTENTS _______________________________________________ 3
3. INDEX OF FIGURES _______________________________________ 5
4. INDEX OF TABLES ________________________________________ 8
5. GLOSSARY ______________________________________________ 9
6. PREFACE _______________________________________________ 10
7. SCOPE _________________________________________________ 12
8. INTRODUCTION __________________________________________ 13
8.1. Nuclear Power Plant of Study ...................................................................... 13
8.2. Suction Valves from the RWST LCV-115B/D .............................................. 14 8.2.1. Chemical and Volume Control System Description ........................................ 15 8.2.2. Safety Injection System .................................................................................. 16
9. DEVELOPMENT __________________________________________ 17
9.1. Functions ...................................................................................................... 17 9.1.1. Safety functions .............................................................................................. 17 9.1.2. Emergency operations .................................................................................... 18 9.1.3. Normal operations .......................................................................................... 18 9.1.4. Incorrect positioning due to System Malfunction or Operator Error ................ 19
9.2. Design Basis Revision ................................................................................. 19 9.2.1. Case 9.1.1.a Safety Injection signal. OPENING ............................................. 20 9.2.2. Case 9.1.1.b Transfer to recirculation phase. CLOSING ................................ 22 9.2.3. Case 9.1.2 SI flow finalization and realignment of VCT. CLOSING ............... 24 9.2.4. Case 9.1.3.a Very low level signal in the VCT. OPENING ............................. 26 9.2.5. Case 9.1.3.b Recovery from very low level signal in the VCT. CLOSING ...... 28 9.2.6. Case 9.1.3.c Emptying of the reactor cavity initiation. OPENING ................... 29 9.2.7. Case 9.1.3.d Reactor cavity emptying finalization. CLOSING ........................ 31 9.2.8. Case 9.1.4.1 Incorrect position during normal operation. CLOSING .............. 32 9.2.9. Case 9.1.4.2.a Incorrect position during SI phase. OPENING ....................... 33 9.2.10. Case 9.1.4.2.b Incorrect position during recirculation phase. CLOSING ........ 34
9.3. Maximum Design Thrusts ............................................................................ 35
9.4. Weak Link Analysis ...................................................................................... 37

Design Basis Revision and Weak Link Analysis of LCV-115B/D 4
9.4.1. Initial Concepts ................................................................................................38 9.4.2. SpaceClaim Modeling ......................................................................................39 9.4.3. Material Properties ...........................................................................................45 9.4.4. Model Mesh .....................................................................................................46 9.4.5. Contacts, Boundary Conditions and Loads .....................................................49 9.4.6. Evaluation of Results .......................................................................................50 9.4.7. Results Discussion ..........................................................................................69
10. CONCLUSIONS __________________________________________ 70
11. ACKNOWLEDGMENT _____________________________________ 73
12. BIBLIOGRAPHY __________________________________________ 74

Design Basis Revision and Weak Link Analysis of LCV-115B/D 5
3. INDEX OF FIGURES
Figure 1 Picture of the present NPP .................................................................................... 14
Figure 2 LCV-115B/D location ............................................................................................. 15
Figure 3 Case 9.1.1.a .......................................................................................................... 21
Figure 4 Case 9.1.1.b .......................................................................................................... 23
Figure 5 Case 9.1.2 ............................................................................................................. 25
Figure 6 Case 9.1.3.a .......................................................................................................... 27
Figure 7 Case 9.1.3.c ........................................................................................................... 30
Figure 8 LCV-115B/D model ................................................................................................ 40
Figure 9 LCV-115B/D Spaceclaim model plane X view ....................................................... 40
Figure 10 LCV-115B/D Spaceclaim model plane Z view ..................................................... 40
Figure 11 Body Assembly model ......................................................................................... 41
Figure 12 Stem-Disc Connection model .............................................................................. 42
Figure 13 Bonnet model ....................................................................................................... 43
Figure 14 Yoke and torque arm model ................................................................................ 44
Figure 15 Motor operator model........................................................................................... 45
Figure 16 Model Mesh ......................................................................................................... 47
Figure 17 Mesh of critical components ................................................................................ 47
Figure 18 Mesh Quality ........................................................................................................ 48
Figure 19 Aspect Ratio......................................................................................................... 48
Figure 20 Contacts status .................................................................................................... 49
Figure 21 Fixed Supports ..................................................................................................... 49
Figure 22 Load input ............................................................................................................ 50

Design Basis Revision and Weak Link Analysis of LCV-115B/D 6
Figure 23 Stem Maximum Principal Stress Evolution .......................................................... 51
Figure 24 Stem Maximum Principal Stresses Distribution 1 ................................................ 52
Figure 25 Stem Maximum Principal Stresses Distribution 2 ................................................ 52
Figure 26 Stem Buckling Deformation ................................................................................. 53
Figure 27 Stem Pin Maximum Shear Stress Evolution ........................................................ 54
Figure 28 Stem Pin Shear Stresses Distribution .................................................................. 55
Figure 29 Stem Pin Bore Maximum Bearing Stress Evolution ............................................. 55
Figure 30 Stem Pin Bore Maximum Principal Stresses Distribution .................................... 56
Figure 31 Link Maximum Primary Stress Evolution ............................................................. 57
Figure 32 Link Primary Stresses Distribution 1 .................................................................... 57
Figure 33 Link Primary Stresses Distribution 2 .................................................................... 58
Figure 34 Link Bores Maximum Bearing Stress Evolution ................................................... 58
Figure 35 Link Maximum Principal Stresses Distribution 1 .................................................. 59
Figure 36 Link Maximum Principal Stresses Distribution 2 .................................................. 59
Figure 37 Disc Pin Maximum Shear Stress Evolution .......................................................... 60
Figure 38 Disc Pin Shear Stresses Distribution ................................................................... 61
Figure 39 Disc Pin Bore Maximum Bearing Stress Evolution .............................................. 61
Figure 40 Disc Pin Maximum Principal Stresses Distribution ............................................... 62
Figure 41 Bearing Blocks Maximum Shear Stress Evolution ............................................... 63
Figure 42 Bearing Blocks Shear Stresses Distribution ........................................................ 63
Figure 43 Bearing Blocks Bores Maximum Bearing Stress Evolution .................................. 64
Figure 44 Bearing Blocks Maximum Principal Stresses Distribution .................................... 64
Figure 45 Disc Primary Maximum Membrane Stress Evolution ........................................... 65

Design Basis Revision and Weak Link Analysis of LCV-115B/D 7
Figure 46 Disc Ears Maximum Shear Stress Evolution ....................................................... 66
Figure 47 Disc Shear Stresses Distribution 1 ...................................................................... 66
Figure 48 Disc Shear Stresses Distribution 2 ...................................................................... 67
Figure 49 Disc Maximum Primary Bending Stress Evolution ............................................... 67
Figure 50 Disc Maximum Principal Stresses Distribution 1 .................................................. 68
Figure 51 Disc Maximum Principal Stresses Distribution 2 .................................................. 68

Design Basis Revision and Weak Link Analysis of LCV-115B/D 8
4. INDEX OF TABLES
Table 1 Design Basis Revision Results ................................................................................. 1
Table 2 Case 9.1.1.a Delta P Calculations .......................................................................... 21
Table 3 Case 9.1.1.a Maximum P Calculations ................................................................... 22
Table 4 Case 9.1.1.b Delta P Calculations .......................................................................... 23
Table 5 Case 9.1.1.b Maximum P Calculations ................................................................... 24
Table 6 Case 9.1.2 Delta P Calculations ............................................................................. 25
Table 7 Case 9.1.2 Maximum P Calculations ...................................................................... 26
Table 8 Case 9.1.3.a Delta P Calculations .......................................................................... 27
Table 9 Case 9.1.3.a Maximum P Calculations ................................................................... 28
Table 10 Case 9.1.3.c Delta P Calculations ......................................................................... 30
Table 11 Case 9.1.3.c Maximum P Calculations ................................................................. 31
Table 12 Case 9.1.3.d Maximum P Calculations ................................................................. 32
Table 13 Case 9.1.4.2.a Maximum P Calculations .............................................................. 33
Table 14 Maximum opening design thrust calculations ....................................................... 36
Table 15 Maximum closing design thrust calculations ......................................................... 36
Table 16 Material Properties ................................................................................................ 46
Table 17 Weak Link Results ................................................................................................ 69
Table 18 Comparison between ANSYS results and Westinghouse results ......................... 72
Design Basis Revision and Weak Link Analysis of LCV-115B/D 9
5. Glossary
NPP Nuclear Power Plant
PWR Pressurized Water Reactor
RCS Reactor Coolant System
SIS Safety Injection System
SI Safety Injection
CVCS Chemical and Volume Control System
RHR Residual Heat Removal System
ECCS Emergency Core Cooling System
RWST Refueling Water Storage Tank
VCT Volume Control Tank
BAT Boric Acid Storage Tank
LCV Level Control Valve
SG Steam Generator
LOCA Loss of Coolant Accident
SGTR Steam Generator Tube Rupture
ATWS Anticipated Transient Without Scram
NRC Nuclear Regulatory Commission
MOV Motor Operated Valve
USA United States of America
ASME American Society of Mechanical Engineers
UNC Unified Nominal Coarse

Design Basis Revision and Weak Link Analysis of LCV-115B/D 10
6. Preface
All engineering structures and devices- buildings, cars, electrical machinery, and so on- inherently presents elements of risk to their owners, operators, general public or the environment. Nuclear industry is not an exception, but the opinion that people have had about nuclear power has always been exaggerated, mostly due to the harmful effects of the nuclear weapons employed in World War II, and the catastrophic accidents, such as Chernobyl or Fukushima, which were produced because of negligent operation or poor design of those nuclear power plants.
However, nuclear power is one of the least harmful ways of producing large amounts of electrical power. This is due to the effort that both nuclear industry and governments perform in order to establish safety as the priority in design and operation of every nuclear installation. France and other advanced economies are good examples of this assert.
Valves are very important pieces of equipment in nuclear power plants because they are widely used to control all NPP’s processes and safety functions. This is why its reliability contributes significantly to the reliability of the whole plant. Detailed analyses have to be carried out by the manufactures in order to grant all the requirements agreed by relevant standards are fulfilled.
In 1989, the Nuclear Regulatory Commission published the Bulletin 89-10 “ Safety-Related Motor-Operated Valve Testing and Surveillance” [1], and subsequently Supplement 1 of Bulletin 89-10 in 1990 [2], in which NRC staff outlined requirements for a program to provide testing, inspection and maintenance of Motor Operated Valves, in order to provide that MOV would function when subjected to design-basis conditions considered during both normal operation and abnormal events within the design basis of the plant. New design thrust requirements of such valves were found out during the implementation of this program, hence weak link analysis should have been done to assure MOV’s would withstand the new conditions.
Westinghouse Electrics Company is a USA based nuclear power company formed in 1998 from the nuclear power division of the original Westinghouse Electric Corporations. It is the world’s leading supplier of safe and innovate nuclear technology. Westinghouse offers nuclear products and services to utilities internationally, including nuclear fuel, design, control, instrumentation, service and maintenance of nuclear power plants.
Westinghouse is carrying out the analysis of safety valves in many nuclear power plants using its own methodology. Methodology designed by Westinghouse's mechanical division is based on a series of equations that were obtained by studying each of the components in

Design Basis Revision and Weak Link Analysis of LCV-115B/D 11
a detailed and precise way, making the assumptions and simplifications that were deemed appropriate to simplify calculations.
Due to the computational power of ANSYS, very complex calculations can be performed, so that these studies can be carried out in a relatively short time if suitable equipment is available. For this reason, it has been proposed to perform weak link analysis of valves LCV-115B/D using ANSYS code in order to demonstrate that it can be used in those cases in which the Westinghouse methodology is not precise enough.
The majority of the units of measurement used in the present project are British units. This is because the majority of the nuclear engineering literature published, and in particular Westinghouse publications, use British units. However, SI units were also used when they considered appropriated. In addition, some figures are in Spanish since some documents used as reference are in this language.
Due to privacy and confidentiality rights of Westinghouse Electrics Company and its customers, Westinghouse and nuclear power plant documentation on which this project was based cannot be included. Furthermore, specific data needed has been intentionally altered to respect these rights, but always coherently in order not to affect engineering results.

Design Basis Revision and Weak Link Analysis of LCV-115B/D 12
7. Scope
The objective of the present project is the evaluation of the actual operating conditions of a group of LCV-115B/D in case of design based accident, normal operation or testing. Within the analysis of the design conditions, the documentation must include maximum differential pressure expected during valve opening and closing, as well as pressure for both normal operations and abnormal events, as these operations are included in existing and approved design basis.
Furthermore, weak link analysis of the critical components has been done to prove that such components can withstand new maximum design thrust requirements in these valves. In order to accomplish this objective, LCV-115B/D have been modeled using Spaceclaim code, and the stresses and strains within this valves have been analyzed using ANSYS code.

Design Basis Revision and Weak Link Analysis of LCV-115B/D 13
8. Introduction
In 1985, the NRC published Bulletin 85-03 “Motor Operated Valve Common Mode Failures during Plant Transients due to Improper Switch Settings” [3], followed by Supplement 1 of Bulletin 85-03 [4], published in 1988, in which it recommended that licensees develop and implement program to ensure that the MOV’s switch settings (torque, torque bypass, position limit, overload) in several specified systems selected, set, and maintained so that MOV’s would operate under design basis conditions.
Results indicated that such program should be extended to all MOV’s in all Safety-Related systems. Therefore, in 1989 the NRC published Bulletin 89-10 “Safety-Related Motor-Operated Valve Testing and Surveillance” [1], followed by Supplement 1 of Bulletin 89-10 [2], in which NRC Staff outlined requirements of a program to provide testing, inspection and maintenance of MOV’s to assure they would work during both normal operation and abnormal events within the design basis of the plant. This program must include all safety-related and position-changeable MOV’s.
Steps which NRC Bulletin 89-10 recommends to follow for all MOV maintenance program included:
• Review and document the design basis for operation of each MOV.
• Establish correct switch settings for each MOV based on the results.
• Confirm correct MOV operator switch settings for each MOV by testing.
• Prepare or revise procedures to ensure that correct switch settings are determined and maintained throughout the life of the plant.
8.1. Nuclear Power Plant of Study
The present Nuclear Power Plant is located in Spain and it is cooled by water from a river near to the NPP. The plant site occupies an area of approximately 1600 hectares, in a place where irrigated crops and thinly wooded pastures are the most common methods of land exploitation. The plant consists in two PWRs of three loops, which use slightly enriched uranium as fuel. They started operated in 1983, with an installed capacity of 1050 MWe each of them. See Figure 1 as reference.

Design Basis Revision and Weak Link Analysis of LCV-115B/D 14
Figure 1 Picture of the present NPP
8.2. Suction Valves from the RWST LCV-115B/D
The LCV-115B/D motor-operated gate valves are the devices that will be reviewed and analyzed in the present project. They are provided on two separate lines connecting the Refueling Water Storage Tank with the charging pumps suction header. The valves are normally closed and fail “as-is”. The valves open automatically on receipt of a Volume Control Tank low-low level signal or a safety injection signal. Manual operation of the valves from the main control board is also possible. Figure 2 shows the locations of these valves.

Design Basis Revision and Weak Link Analysis of LCV-115B/D 15
Figure 2 LCV-115B/D location
Due to the functions this equipment performs, it can be used either by the CVCS or the SIS, therefore these systems will be briefly described in the following subsections.
8.2.1. Chemical and Volume Control System Description
The Chemical and Volume Control System (CVCS) is designed to provide the following services to the Reactor Coolant System [5]:
• Maintenance of programmed water level in the pressurizer, i.e., maintenance of required water inventory in the Reactor Coolant System.
• Maintenance of seal-water injection flow to the Reactor Coolant Pumps.
• Control of water chemistry conditions, activity level, soluble chemical neutron absorber concentration and makeup.
• High-head emergency core cooling, since part of the system is shared with the Safety Injection System.

Design Basis Revision and Weak Link Analysis of LCV-115B/D 16
8.2.2. Safety Injection System
The primary function of the Safety Injection System (SIS) is to provide Emergency Core Cooling (ECC) in the event of a Loss of Coolant Accident (LOCA) resulting from a break in the primary Reactor Coolant System (RCS). The SIS is also used to provide emergency boration in the event of a steam break accident resulting from a break in the Secondary Steam System. In the case of a LOCA, the heat is removed to an extent that fuel rod damage, which would impede effective cooling of the core, is prevented [6].
Design Basis Revision and Weak Link Analysis of LCV-115B/D 17
9. Development
In this section the design basis revision of LCV-115B/D will be done. Firstly, all the functions or events in which these valves could participate under design basis conditions will be identified. Then maximum differential pressure and maximum line pressure will be evaluated for each of the cases identified. Furthermore, actuation time and reduced voltage requirements will be also studied.
9.1. Functions
In the following subsections all the safety functions, emergency functions, normal functions and events, in which LCV-115B/D valves participate, are described and referenced to their related documents [7].
9.1.1. Safety functions
a. LCV-115B/D will open when it receives a safety injection “S” signal. This is necessary to align the suction of the load pumps with the RWST.
1. E-0 Reactor trip or Safety Injection (Step 6)
2. ECA-0.2 Loss of all AC power recovery with SI required (Step 3)
3. ECA-1.1 Loss of emergency coolant recirculation (Step 12)
4. ECA-1.3 Containment building sumps block (Step 8)
5. FR-S.1 Response to an unwanted power generation and /or ATWS (Step 4)
b. LCV-115B/D is normally closed during transfer from injection phase to cold leg recirculation phase. This is necessary to prevent ingress of water from the sumps to the RWST.
1. ES-1.3 Transfer to cold leg recirculation (Steps 8, 9 and 10)
2. ECA-0.2 Loss of all AC power recovery with SI required (Step 2)
3. ECA-1.3 Containment building sumps block (Step 6)
c. The licensing basis of the present nuclear power plant does not contemplate the cold shutdown using safety class systems.

Design Basis Revision and Weak Link Analysis of LCV-115B/D 18
9.1.2. Emergency operations
During emergency operations, after confirming the necessity of stopping SI flow, the system should reestablish the suction of the load pumps from the VCT after establishing the discharge of the RCS, opening LCV-115C/E valves, and closing LCV-115B/D valves. In those procedures where the load of the RCS is required from an alternative source, the same procedure is followed under equivalent operating conditions.
1. E-3 SG tube rupture (Steps 26 and 29)
2. ES-1.1 SI termination (Steps 11 and 15)
3. ECA-0.1 Loss of all AC power recovery without SI required (Steps 3, 5 and 17)
4. ECA-1.1 Loss of emergency coolant recirculation (Step 15 and 29)
5. ECA-1.3 Containment building sumps block (Steps 20 and 34)
6. ECA-2.1 Uncontrolled depressurization of all SG (Steps 20 and 25)
7. ECA-3.3 SGTR without pressurizer pressure control (Steps 11 and 14)
8. FR-I.1 Response to high-level signal in the pressurizer (Step 1 and 8)
9. FR-P.1 Response to an imminent condition of thermal shock under pressure in the vessel (Steps 13 and 20)
9.1.3. Normal operations
a. LCV-115B/D open because of very low level of the VCT in order to prevent the loss of suction in the load pumps.
• According to DI-1306 LCV-115B/D open and LCV-115C/E close automatically with a very low signal of the VCT (5%) measured by instrumentation. This setpoint can be found on document “Precautions, Limitations and Setpoints” of the present NPP.
b. During recovery of the very low level in the VCT it is necessary to close LCV-115B/D.
• The very low level signal at VCT disappears when that level is above 10%, as indicated on document ”Precautions, Limitations and Setpoints" of the present NPP. Therefore, the LCV-115C/E valves can be opened and the LCV-115B/D valves are closed, in that order.
Design Basis Revision and Weak Link Analysis of LCV-115B/D 19
c. LCV-115B/D valves are opened for emptying the reactor cavity and directing the flow to the RWST.
• According to IA-82 "Residual heat evacuation", sections 6.6 “Draining the Reactor Cavity”, LCV-115B/D valves are ordered to be opened after venting the RHR connection line to the suction of the load pumps.
d. Once the emptying of the reactor cavity is completed, LCV-115B/D valves will be closed to leave them in the correct position for power operation.
• According to IA-82 "Residual heat evacuation", section 6.6 "Draining the reactor cavity", LCV-115B/D valves are closed once the desired level has been reached or at the request of the personnel.
9.1.4. Incorrect positioning due to System Malfunction or Operator Error
9.1.4.1. Normal conditions
It is postulated that during normal operations the valve is positioned incorrectly in the open position. To correct this situation, the valve should be returned to its normally closed position.
9.1.4.2. Abnormal Conditions
a. It is postulated that during LOCA injection phase inadvertently closes one of the valves. Although this performance is covered by the single failure criterion, it is advisable to correct the fault and reposition the opened valve.
b. It is postulated that during LOCA post-recirculation phase inadvertently opens one of the valves. Although this performance is covered by the single failure criterion, it is advisable to correct the fault and reposition the closed valve.
9.2. Design Basis Revision
The following section includes the evaluation of each of the previous functions and events of LCV-115B/D [7]. It provides discussion on:
• Differential pressure: The MOV upstream and downstream pressures are calculated to determine the differential pressure across the valve. The calculation consists in more or less the basic Bernoulli equation, and will include consideration for all significant pressure sources including both the pressure head and elevation head.

Design Basis Revision and Weak Link Analysis of LCV-115B/D 20
Velocity head is not a factor since the calculations assume the valve position to be closed when the maximum differential pressure is experienced.
• Line pressure: This pressure is equal to the maximum downstream or upstream pressure.
• Actuation time: Considerations for the valves actuation time should be provided. It should be identified whether the analysis assumes expeditious valve stroke times or not. This information may be used to relax actuation time requirements identified in the design specifications whenever possible.
• Reduced voltage: Loss of off-site power will be only assumed to occur coincident with an initiating event, and therefore diesel generators will start operating. Functions triggered automatically by control signals occurring simultaneously with loss of external power, such as S signal or T signal, must be able to be performed under such reduced voltage.
The most unfavorable conditions for each scenario are documented, obtaining the maximum differential pressure and line pressure. The values of the pressure heads and elevation heads, which were obtained from NPP documentation, can be seen in Annex 1.
9.2.1. Case 9.1.1.a Safety Injection signal. OPENING
In this section it is evaluated the safety function 9.1.1.a.
9.2.1.1. Differential Pressure
The maximum differential pressure occurs when the upstream pressure is minimized and the downstream pressure is maximized. It is postulated that the upstream pressure is the atmospheric pressure (Patm) plus the pressure corresponding to the minimum water height in the RWST (H9). The maximum delta P occurs at the beginning of the actuation when the valve gate is seated. It is postulated that the CVCS is aligned to the boric acid transfer pump via the emergency boring line before the "S" signal. The maximum downstream pressure is equal to the lift difference (H6) plus the differential pressure of the boric acid transfer pump (delta H3). In order to maximize the valve delta P, the pressure drop along the pipe is conservatively ignored. Figure 3 shows the scheme of this case and Table 2 shows delta P calculations.

Design Basis Revision and Weak Link Analysis of LCV-115B/D 21
Figure 3 Case 9.1.1.a
Table 2 Case 9.1.1.a Delta P Calculations
General Equation
delta P = [Patm + (delta H3 + H6)·(d/10)] – [Patm + H9·(d/10)]
Calculations and Results
Patm H6
H9
d (density)
delta H3
delta P
= 0 kg/cm² = 10,1 m
= 19,1 m
= 0,998 g/cm³ (21 ºC)
= 72 m
= 6,3 kg/cm²
9.2.1.2. Pipe Maximum Pressure
Pipe maximum pressure calculations are shown in Table 3.

Design Basis Revision and Weak Link Analysis of LCV-115B/D 22
Table 3 Case 9.1.1.a Maximum P Calculations
General Equation
Pmax = Patm + (delta H3 + H6)·(d/10)
Calculations and Results
Patm H6
d (density)
delta H3
Pmax
= 0 kg/cm² = 10,1 m
= 0,998 g/cm³ (21 ºC)
= 72 m
= 8,2 kg/cm²
9.2.1.3. Actuation Time
It is necessary to limit the actuation time of the valve to ensure an ECCS response time consistent with the safety analysis. This includes the time required to align the system to the corresponding configuration during the injection phase. An interlock is provided from the open position of the valves, which prevents the closing of the suction valves from the VCT, LCV-115C/E, unless LCV-115B/D are fully open. The actuation time of 10 seconds, identified in the design specifications, is based on engineering judgment and should not be modified.
9.2.1.4. Reduced Voltage
Reduced voltage should be considered as a result of diesel loading when this function is performed. This function is started with the S signal, which can occur simultaneously with the external power loss. Consequently, the actuator may be affected by the diesel charge, hence the implementation of this function under such reduced voltage must be guaranteed.
9.2.2. Case 9.1.1.b Transfer to recirculation phase. CLOSING
In this section it is evaluated the safety function 9.1.1.b.
9.2.2.1. Differential Pressure
The maximum differential pressure occurs when the upstream pressure is minimized and the downstream pressure is maximized. Failure of the check valves of the RWST is postulated, allowing a leak of 11,4 m3/h towards the RWST. The maximum differential pressure occurs when the gate is seated. The downstream pressure is maximized by

Design Basis Revision and Weak Link Analysis of LCV-115B/D 23
postulating the maximum containment pressure during transfer (P1) plus the differential pressure of the RHR pump (delta H2) plus the elevation difference (H7). The upstream pressure is minimized by considering the minimum water level (H5) in the RWST during transfer. In order to maximize the valve delta P, the pressure drop along the pipe is conservatively ignored. Figure 4 shows the scheme of this case and Table 4 shows delta P calculations.
Figure 4 Case 9.1.1.b
Table 4 Case 9.1.1.b Delta P Calculations
General Equation
delta P = [P1 + (delta H2 + H7)·(d/10)] – [Patm + H5·(d/10)]
Calculations and Results
P1 H5
Patm
d (density)
delta H2
H7
delta P
= 3,52 kg/cm² = 7 m
= 0 kg/cm²
= 0,981 g/cm³ (66 ºC)
= 105,1 m
= -5,2 m
= 12,6 kg/cm²

Design Basis Revision and Weak Link Analysis of LCV-115B/D 24
9.2.2.2. Pipe Maximum Pressure
Pipe maximum pressure calculations are shown in Table 5.
Table 5 Case 9.1.1.b Maximum P Calculations
General Equation
Pmax = P1 + (delta H2 + H7)·(d/10)
Calculations and Results
P1
H7
d (density)
delta H2
Pmax
= 3,52 kg/cm² = -5,2 m
= 0,981 g/cm³ (66 ºC)
= 105,1 m
= 13,3 kg/cm²
9.2.2.3. Actuation Time
The transfer time from injection phase to recirculation phase depends on the speed of operation, hence there is a margin that allows relaxation in the actuation time. Closing time is not critical.
9.2.2.4. Reduced Voltage
It is not necessary to assume reduced voltage as a consequence of the diesel charge when this function is performed. Only actions triggered automatically by control signals occurring simultaneously with loss of external power, such as S signal or T signal, are affected.
9.2.3. Case 9.1.2 SI flow finalization and realignment of VCT. CLOSING
In this section it is evaluated the emergency operation 9.1.2.
9.2.3.1. Differential Pressure
The maximum differential pressure occurs when the upstream pressure is minimized and the downstream pressure is maximized. The maximum delta P occurs at the end of the operation when the valve gate is seated. It is postulated that the minimum upstream pressure is equal to the minimum elevation difference due to the level in the RWST (H5). The calculations postulate that the downstream pressure equals the maximum pressure in the VCT (PVCT2) plus the elevation difference (H2). In order to maximize the valve delta P,

Design Basis Revision and Weak Link Analysis of LCV-115B/D 25
the pressure drop along the pipe is ignored. Figure 5 shows the scheme of this case and Table 6 shows delta P calculations.
Figure 5 Case 9.1.2
Table 6 Case 9.1.2 Delta P Calculations
General Equation
delta P = [PVCT2 + H2·(d/10)] – [Patm + H5·(d/10)]
Calculations and Results
Patm H5
d (density)
PVCT2
H2
delta P
= 0 kg/cm² = 7 m
= 0,998 g/cm³ (21 ºC)
= 5,27 kg/cm²
= 8,1 m
= 5,4 kg/cm²
9.2.3.2. Pipe Maximum Pressure
Pipe maximum pressure calculations are shown in Table 7.

Design Basis Revision and Weak Link Analysis of LCV-115B/D 26
Table 7 Case 9.1.2 Maximum P Calculations
General Equation
Pmax = PVCT2 + H2·(d/10)
Calculations and Results
d (density)
PVCT2
H2
Pmax
= 0,998 g/cm³ (21 ºC)
= 5,27 kg/cm²
= 8,1 m
= 6,1 kg/cm²
9.2.3.3. Actuation Time
This operation is not performed in response of an accident, there is no system licensing requirements for rapid actuation of the valve. It can be considered reasonable relaxation in the time of action given the requirements associated with this function.
9.2.3.4. Reduced Voltage
It is not necessary to assume reduced voltage as a consequence of the diesel charge when this function is performed. Only actions triggered automatically by control signals occurring simultaneously with loss of external power, such as S signal or T signal, are affected.
9.2.4. Case 9.1.3.a Very low level signal in the VCT. OPENING
In this section it is evaluated the normal operation 9.1.3.a.
9.2.4.1. Differential Pressure
The maximum differential pressure occurs when the upstream pressure is minimized and the downstream pressure is maximized. The calculations postulate that the downstream pressure is equal to the maximum pressure in the VCT (PVCT2) plus the elevation difference (H8). The maximum delta P occurs at the start of the actuation when the valve gate is seated. The minimum upstream pressure equals the elevation difference with the RWST at its minimum level (H9). In order to maximize the valve delta P, the pressure drop along the pipe is conservatively ignored. Figure 6 shows the scheme of this case and Table 8 shows delta P calculations.

Design Basis Revision and Weak Link Analysis of LCV-115B/D 27
Figure 6 Case 9.1.3.a
Table 8 Case 9.1.3.a Delta P Calculations
General Equation
delta P = [PVCT2 + H8·(d/10)] – [Patm + H9·(d/10)]
Calculations and Results
Patm H9
d (density)
PVCT2
H8
delta P
= 0 kg/cm² = 19,1 m
= 0,998 g/cm³ (21ºC)
= 5,27 kg/cm²
= 7 m
= 4,0 kg/cm²
9.2.4.2. Pipe Maximum Pressure
Pipe maximum pressure calculations are shown in Table 9.

Design Basis Revision and Weak Link Analysis of LCV-115B/D 28
Table 9 Case 9.1.3.a Maximum P Calculations
General Equation
Pmax = PVCT2 + H8·(d/10)
Calculations and Results
d (density)
PVCT2
H8
Pmax
= 0,998 g/cm³ (21ºC)
= 5,27 kg/cm²
= 7 m
= 6,0 kg/cm²
9.2.4.3. Actuation Time
Rapid opening of this valve is needed to avoid damage in the load pumps due to low level in the VCT. An interlock is provided from the open position of the valves, which prevents the closing of the suction valves from the VCT, LCV-115C/E, unless LCV-115B/D are fully open. The actuation time of 10 seconds, identified in the design specifications and that is based on engineering judgment, should not be modified in order not to impact the low-low level setpoint in the VCT.
9.2.4.4. Reduced Voltage
It is not necessary to assume reduced voltage as a consequence of the diesel charge when this function is performed. Only actions triggered automatically by control signals occurring simultaneously with loss of external power, such as S signal or T signal, are affected.
9.2.5. Case 9.1.3.b Recovery from very low level signal in the VCT. CLOSING
In this section it is evaluated the normal operation 9.1.3.b.
9.2.5.1. Differential Pressure
The maximum differential pressure in this case is similar to the maximum differential pressure of case 9.1.2. As discussed in section 9.2.3, the maximum delta P is equal to 5.4 kg/cm2.
9.2.5.2. Pipe Maximum Pressure
The pipe maximum pressure in this case is similar to the pipe maximum pressure of case

Design Basis Revision and Weak Link Analysis of LCV-115B/D 29
9.1.2. As discussed in section 9.2.3, the maximum P is equal to 6.1 kg/cm2.
9.2.5.3. Actuation Time
This operation is not performed in response of an accident, there is no system licensing requirements for rapid actuation of the valve. It can be considered reasonable relaxation in the time of action given the requirements associated with this function.
9.2.5.4. Reduced Voltage
It is not necessary to assume reduced voltage as a consequence of the diesel charge when this function is performed. Only actions triggered automatically by control signals occurring simultaneously with loss of external power, such as S signal or T signal, are affected.
9.2.6. Case 9.1.3.c Emptying of the reactor cavity initiation. OPENING
In this section it is evaluated the normal operation 9.1.3.c.
9.2.6.1. Differential Pressure
The maximum differential pressure occurs when the upstream pressure is maximized and the downstream pressure is minimized. The calculations assume that the same train that is evacuating the residual heat is used for emptying the recharge cavity. The maximum upstream pressure of the valve will be equivalent to the hydrostatic pressure due to difference in elevation between the recharge cavity and the valve (H11) plus the delta P of the RHR pump, which is conservatively assumed to be equal to the shear pressure (Delta H2). The downstream pressure is the one corresponding to the elevation of the RWST, when it is at its minimum level (H5). Figure 7 shows the scheme of this case and Table 10 shows delta P calculations.

Design Basis Revision and Weak Link Analysis of LCV-115B/D 30
Figure 7 Case 9.1.3.c
Table 10 Case 9.1.3.c Delta P Calculations
General Equations
delta P = [(H11 + delta H2)·(d/10)] – [Patm + H5·(d/10)]
Calculations and Results
Patm H5
d (density)
delta H2
H11
delta P
= 0 kg/cm² = 7 m
= 0,998 g/cm³ (21ºC)
= 105,1 m
= 18,6 m
= 11,6 kg/cm²
9.2.6.2. Pipe Maximum Pressure
Pipe maximum pressure calculations are shown in Table 11.

Design Basis Revision and Weak Link Analysis of LCV-115B/D 31
Table 11 Case 9.1.3.c Maximum P Calculations
General Equations
Pmax = (H11 + delta H2)·(d/10)
Calculations and Results
d (density)
delta H2
H11
Pmax
= 0,998 g/cm³ (21ºC)
= 105,1 m
= 18,6 m
= 12,3 kg/cm²
9.2.6.3. Actuation Time
This operation is not performed in response of an accident, there is no system licensing requirements for rapid actuation of the valve. It can be considered reasonable relaxation in the time of action given the requirements associated with this function.
9.2.6.4. Reduced Voltage
It is not necessary to assume reduced voltage as a consequence of the diesel charge when this function is performed. Only actions triggered automatically by control signals occurring simultaneously with loss of external power, such as S signal or T signal, are affected.
9.2.7. Case 9.1.3.d Reactor cavity emptying finalization. CLOSING
In this section it is evaluated the normal operation 9.1.3.d.
9.2.7.1. Differential Pressure
The maximum differential pressure occurs when the upstream pressure is maximized and the downstream pressure is minimized. The valve 8706, that can be seen in Figure 7, is closed before the closing of these valves, whereby the flow through the line is zero and the differential pressure is therefore 0 kg/cm2.
9.2.7.2. Pipe Maximum Pressure
Pipe maximum pressure calculations are shown in Table 12.

Design Basis Revision and Weak Link Analysis of LCV-115B/D 32
Table 12 Case 9.1.3.d Maximum P Calculations
General Equations
Pmax = H3.(d/10)
Calculations and Results
d (density)
H3
Pmax
= 0,998 g/cm³ (21ºC)
= 19,2 m
= 1,9 kg/cm²
9.2.7.3. Actuation Time
This operation is not performed in response of an accident, there is no system licensing requirements for rapid actuation of the valve. It can be considered reasonable relaxation in the time of action given the requirements associated with this function.
9.2.7.4. Reduced Voltage
It is not necessary to assume reduced voltage as a consequence of the diesel charge when this function is performed. Only actions triggered automatically by control signals occurring simultaneously with loss of external power, such as S signal or T signal, are affected.
9.2.8. Case 9.1.4.1 Incorrect position during normal operation. CLOSING
In this case it is evaluated the abnormal event 9.1.4.1.
9.2.8.1. Differential Pressure
The maximum differential pressure in this case is similar to the maximum differential pressure of case 9.1.2. As discussed in section 9.2.3, the maximum delta P is equal to 5.4 kg/cm2.
9.2.8.2. Pipe Maximum Pressure
The pipe maximum pressure in this case is similar to the pipe maximum pressure of case 9.1.2. As discussed in section 9.2.3, the maximum P is equal to 6.1 kg/cm2.
9.2.8.3. Actuation Time
Incorrect positioning is covered by single failure criterion. Consequently there are no limits

Design Basis Revision and Weak Link Analysis of LCV-115B/D 33
on the time required to reposition the valve.
9.2.8.4. Reduced Voltage
It is not necessary to assume reduced voltage as a consequence of the diesel charge when this abnormal event occurs. Only actions triggered automatically by control signals occurring simultaneously with loss of external power, such as S signal or T signal, are affected.
9.2.9. Case 9.1.4.2.a Incorrect position during SI phase. OPENING
In this case it is evaluated the abnormal event 9.1.4.2.a.
9.2.9.1. Differential Pressure
Incorrect positioning is a simple fault since no additional faults are postulated. Therefore, the twin valve on the other train remains open. This prevents a significant delta P from developing through the faulted valve. It is postulated that the Delta P of the valve is equal to 0 kg/cm2.
9.2.9.2. Pipe Maximum Pressure
Pipe maximum pressure calculations are shown in Table 13.
Table 13 Case 9.1.4.2.a Maximum P Calculations
General Equations
Pmax = H3.(d/10)
Calculations and Results
d (density)
H3
Pmax
= 0,998 g/cm³ (21ºC)
= 19,2 m
= 1,9 kg/cm²
9.2.9.3. Actuation Time
Incorrect positioning is covered by single failure criterion. Consequently, there are no limits on the time required to reposition the valve.
9.2.9.4. Reduced Voltage
It is not necessary to assume reduced voltage as a consequence of the diesel charge when

Design Basis Revision and Weak Link Analysis of LCV-115B/D 34
this abnormal event occurs. Only actions triggered automatically by control signals occurring simultaneously with loss of external power, such as S signal or T signal, are affected.
9.2.10. Case 9.1.4.2.b Incorrect position during recirculation phase. CLOSING
In this case it is evaluated the abnormal event 9.1.4.2.b.
9.2.10.1. Differential Pressure
Incorrect positioning is a simple fault since no additional faults are postulated. Therefore, check valves in RWST suction line will prevent reverse flow. This prevents a significant delta P from developing through the valve. It is postulated that the Delta P of the valve is equal to 0 kg/cm2.
9.2.10.2. Pipe Maximum Pressure
The maximum pressure in the pipe is 13,3 kg/cm2, as in Case 9.1.1.b.
9.2.10.3. Actuation Time
Incorrect positioning is covered by single failure criterion. Consequently, there are no limits on the time required to reposition the valve.
9.2.10.4. Reduced Voltage
It is not necessary to assume reduced voltage as a consequence of the diesel charge when this abnormal event occurs. Only actions triggered automatically by control signals occurring simultaneously with loss of external power, such as S signal or T signal, are affected.

Design Basis Revision and Weak Link Analysis of LCV-115B/D 35
9.3. Maximum Design Thrusts
It is important to know the maximum design thrusts requirements for opening and closing operations in order to demonstrate that such valves could operate without failures under design basis conditions. These thrusts are calculated using the following equations obtained from “Gate and Globe Valve Selection Procedure” document [8]:
Where:
• Fopening, is the thrust required for opening
• Fclosing is the thrust required for closing
• VFO is the opening valve factor
• VFC is the closing valve factor
• AMS is the mean seat area
• ∆P is the maximum differential pressure
• Fpacking is the packing load
• Astem is the stem area
• Pline is the line pressure
There are selected the cases with greater pressure and differential pressure for both opening and closing operations of those analyzed in section 9.2. On the one hand, in closing operation maximum pressure and differential pressure of case 9.1.1.b “Transfer to recirculation phase”, which were calculated in section 9.2.2, are used. On the other hand, in opening operation maximum pressure and differential pressure of case 9.1.3.c “Emptying of the reactor cavity initiation”, which were calculated in section 9.2.6. are used.

Design Basis Revision and Weak Link Analysis of LCV-115B/D 36
The main seat diameter and the stem diameter are obtained from the manufacturing drawings [9] in order to calculate the area (π.(D/2)2/2). Furthermore, opening and closing valve factors are assumed to be equal to 1, and the packing friction force equal to 3000 lb [9].
Calculations are shown in Table 14 and Table 15.
Table 14 Maximum opening design thrust calculations
Calculations
VF0 1,00
Dseat 6,38 in
AMS 31,97 in2
∆P 165,65 psi
Fpacking 3000,00 lb
Results Fopening 8295,69 lb
Table 15 Maximum closing design thrust calculations
Calculations
VFC 1,00 Dseat 6,38 in
Dstem 1,25 in
AMS 31,97 in2
Astem 1,23 in2
∆P 179,69 psi
Pline 189,46 psi
Fpacking 3000,00 lb
Results Fclosing 8977,04 lb
In Conclusion, the maximum design thrust LCV-115B/D that can be seen at design basis conditions is equal to 8977,04 lb. This thrust should be compared with the results of the weak link analysis, performed in following section 9.4, in order to demonstrate that these valves will not structurally fail while there are operating under such conditions.

Design Basis Revision and Weak Link Analysis of LCV-115B/D 37
9.4. Weak Link Analysis
ASME code, particularly on Section III [10], provides specific requirements on how to perform the stress analyses in order to verify equipment integrity during operation. Each failure mode has specific stress limits, which are established using conservative hypothesis. All equipment which is part of the pressure boundary should be analyzed; this includes currently studied valves LCV-115B/D, which are classified as Class 1, and should follow recommendations specified in subsection NB-3500.
The present work includes the LCV-115B/D weak link analysis. It consists of determining the maximum thrust a component can withstand without exceeding the allowable stress at design conditions. Critical components have been studied in depth since the other parts of the valves were already evaluated in the respective Stress Report [9] and proved to be more resistant:
• Stem
• Stem Pin
• Link
• Disc Pin
• Bearing Blocks
• Disc
In order to do the weak link analysis, a static structural analysis is performed using ANSYS code, obtaining strains, stresses, and reaction forces under the effect of the applied loads. The procedure followed to perform such analysis is the following:
1. Model LCV-115B/D valves using SpaceClaim code simplifying as much as possible to reduce computational time.
2. Input material characteristics in Engineering Data.
3. Define the contacts in the model.
4. Mesh the model.
5. Introduce the boundary conditions and loads.

Design Basis Revision and Weak Link Analysis of LCV-115B/D 38
6. Solve the structural analysis.
7. Discuss the results obtained.
The most conservative conditions of temperature, pressure, stresses and so on, have been taken into account in such analysis.
9.4.1. Initial Concepts
The following concepts are needed to understand a weak link analysis [10]:
• Stress: It is defined as the force per unit area.
• Strain: It is defined as the deformation of a solid due to stress.
• Normal Stress: It is the component of stress normal to the plane of reference. Normally, it is not uniform through the thickness; hence it turns into two components. One that is uniformly distributed and equal to the average value of stress across the thickness under consideration, and other that varies from this value with the location across the thickness. Normal stresses include tensile and compressive stresses.
• Membrane Stress: It is the uniformly distributed and equal to the average value of stress across the thickness normal stress component.
• Bending Stress: It is the variable normal stress component.
• Shear Stress: It is the component of stress tangent to the plane of reference.
• Bearing Stress: Contact pressure between two separate objects.
• Primary Stress: It is any stress, both normal and shear stress, which is produced by an imposed load necessary to satisfy equilibrium in terms of external and internal forces and moments.
• Secondary Stress: It is any stress, both normal and shear stress, which is developed by the constraint of adjacent material or by self-constraint of the structure.
• Peak Stress: It is an increment of stress that is additive to primary plus secondary stresses by reason of local discontinuities or local thermal stresses.
• Total Stress: It is the sum of primary, secondary and peak stress contributions.
• Yield Strength: Stress at which elastic failure is produced.

Design Basis Revision and Weak Link Analysis of LCV-115B/D 39
• Maximum Principal Stress Theory: According to this theory the failure of a material or a component will take place if the maximum principal stress is greater than the yield strength, where principal stresses are tensile and compressive stresses (normal stresses).
• Maximum Shear Stress Theory: This theory states that failure or yielding of a material will take place when the maximum shear stress reaches the limiting stress, which is usually equal to a half of the yield strength.
• Maximum Distortion Energy Theory: This theory is also known as Von-Mises-Hencky theory. It states that the failure or yielding in a member or material occurs when the distortion energy value, which is the energy stored in the material, in a bi-axial stress reaches the maximum distortion energy value at the yield point.
9.4.2. SpaceClaim Modeling
Valves covered by this project are flexible wedges, rising stem gate valves designed to interrupt or isolate fluid flow. They have been designed and analyzed in accordance with the ASME BPVC NB-3500 rules for Class 1 valves regardless of their actual service application.
SpaceClaim Professional provides a flexible design environment with a modern user experience that speeds contributions to product development process. Therefore, it is a powerful tool for engineers who contribute to the design and manufacture of products across a broad range of industries.
Original manufacturing drawings [9, 11] have been used as reference to build the 3D Spaceclaim model used in the present project.
The main components of a gate valve are:
1. Body Assembly
2. Stem and Disc Assembly
3. Bonnet and Stuffing Box Assembly
4. Yoke and Torque Arm
5. Operator
Figure 8, Figure 9 and Figure 10 show pictures of the whole final model.

Design Basis Revision and Weak Link Analysis of LCV-115B/D 40
Figure 8 LCV-115B/D model
Figure 9 LCV-115B/D Spaceclaim model plane X view
Figure 10 LCV-115B/D Spaceclaim model plane Z view

Design Basis Revision and Weak Link Analysis of LCV-115B/D 41
9.4.2.1. Body Assembly
The body is machined with end connections prepared to butt welding. The top opening is the main flange face. The body-to-bonnet connection is a bolted flange joint. A fully trapped, spiral wound gasket prevents leakage through the connection. Figure 11 shows a picture of the LCV-115B/D body model.
Figure 11 Body Assembly model
A pair of seat rings are welded to the body, and their function is to provide sealing for the disc. The contact surfaces of the seat rings are hardfaced.
Two guides, who retain and guide the disc during valve operation, are installed in parallel slots in the body cavity.
9.4.2.2. Stem and Disc Assembly
9.4.2.2.1 Disc
The disc is a flexible, one-piece wedge with hardfaced contact surface. The upper part of the disc contains a keystoneshaped slot, which retains the bearing blocks of the stem-disc connection.
9.4.2.2.2 Stem-Disc Connection
The stem-disc connection is a double-pinned linkage system, which allows the disc to translate itself relative to the stem in a direction parallel to fluid flow. The disc pin is free to

Design Basis Revision and Weak Link Analysis of LCV-115B/D 42
rotate relative to the link and the bearing blocks, and it is axially constrained by two lock pins. The stem pin is also free to rotate relative to the link and stem head, it is retained by lock rings at both ends. Figure 12 shows the stem and disc assembly model.
Figure 12 Stem-Disc Connection model
9.4.2.2.3 Stem
The upper part of the stem is left-handed threated in order to engage in mating threads of the operator nut.
The bottom part of the stem is a stem head which connects the stem with the linkage system. The top surface of the stem head is a tapered seat which engages the backseat of the bonnet.

Design Basis Revision and Weak Link Analysis of LCV-115B/D 43
9.4.2.3. Bonnet
As it was said before, the bonnet is attached to the body by a bolted flange joint, and welded lips machined into the bonnet flange provides seal welding capability. The stem bore is machined axially through the center of the bonnet. A hardfaced backseat is welded to the bottom of the stem bore, the backseat position is used to replace a valve while stills in service, since a leak seal between the bonnet backseat and the mating seat on the stem head is achieved.
The stem bore is stepped to form a stuffing box, which contains the primary and secondary packing rings and the lantern ring. Packing compression is adjusted by means of gland and gland follower. The gland follower is attached to the bonnet by two UNC studs and nuts.
A radial hole in the upper flange connects the stuffing box to the leak off pipe. This system is used to channelize any fluid that escapes from the primary side, and might otherwise leak to the atmosphere.
Figure 13 shows a picture of the bonnet model.
Figure 13 Bonnet model

Design Basis Revision and Weak Link Analysis of LCV-115B/D 44
9.4.2.4. Yoke and torque arm
Figure 14 shows a picture of the yoke and torque arm Spaceclaim model.
Figure 14 Yoke and torque arm model
9.4.2.4.1 Yoke
The yoke is a structural component that is bolted to the top flange of the bonnet. Its main function is to support the valve operator, which is bolted to the top flange of the yoke. The flat boss on the side wall contains the torque arm and the position-indicating plates. Furthermore, this boss is used as mounting surface for external limit switches. Yoke design permits repacking of the valve without yoke removal, and its windows in the side wall afford access to the stuffing box components.
9.4.2.4.2 Torque arm
The torque arm is inserted into the slot of the yoke. Torque imposed on the stem by the valve operator is transmitted through the torque arm to the yoke. Moreover, the torque arm is used as a position indicator.

Design Basis Revision and Weak Link Analysis of LCV-115B/D 45
9.4.2.5. Motor Operator
The motor operator is mounted on the top of the yoke. The manufactured actuator installed in the studied safety valve has long been a mainstay in nuclear power industry, due to its durable cast-iron housing. The operator is controlled by torque and limit switches. It can produce torque ranging from 15 ft-lb to 60000 ft-lb and handling stem thrusts up to 500000 lb. If an obstruction is encountered before the end of the operation stroke, torque switches will interrupt the power. All operations are equipped with load compensating springs in the closing direction, which absorb excesses of inertial energy during closing operations. Figure 15 shows the manufactured motor operator modeled using Spaceclaim.
Figure 15 Motor operator model
9.4.3. Material Properties
Material properties should be input in Engineering data to show the properly behavior of LCV-115B/D. Data needed must include:
• Yield Strength (Sy): point at which a material begins to deform plastically.
• Allowable Stress Intensity (Sm): Maximum allowable stress permitted in a Class 1 component, it is given by the ASME III-NB code.
• Modulus of Elasticity: It is a number that measures the resistance of a material to deform elastically.
Design Basis Revision and Weak Link Analysis of LCV-115B/D 46
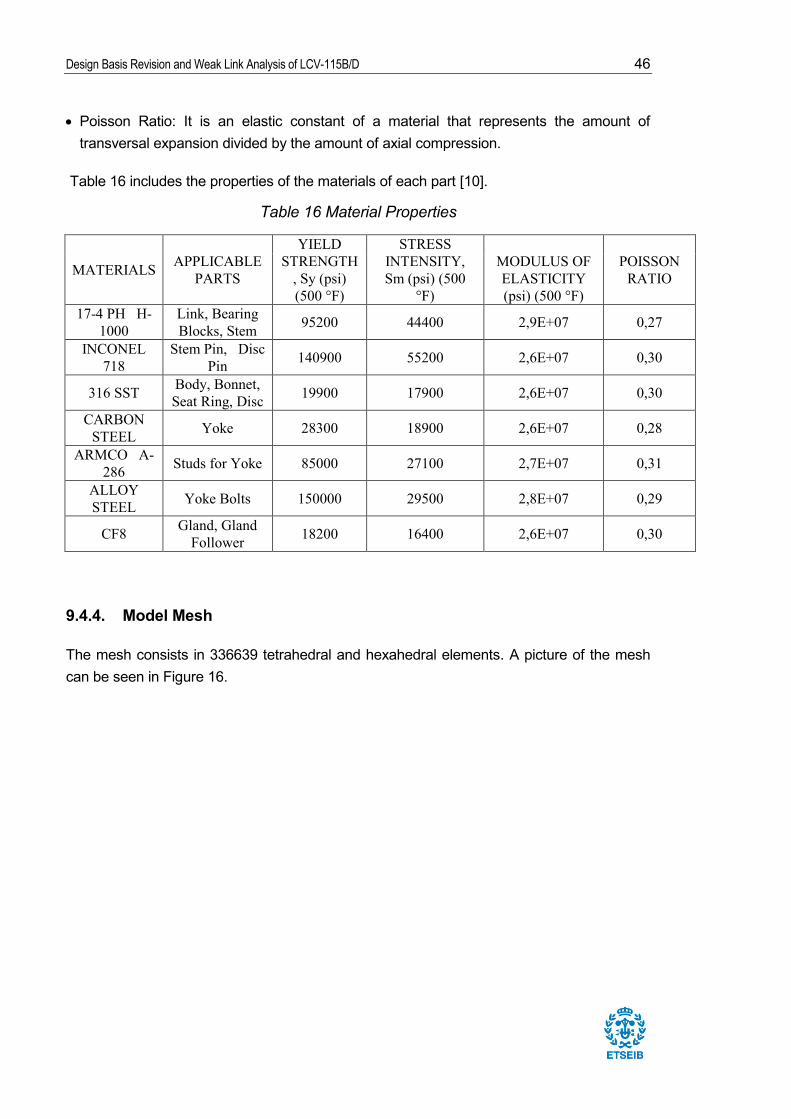
• Poisson Ratio: It is an elastic constant of a material that represents the amount of transversal expansion divided by the amount of axial compression.
Table 16 includes the properties of the materials of each part [10].
Table 16 Material Properties
MATERIALS APPLICABLE PARTS
YIELD STRENGTH
, Sy (psi) (500 °F)
STRESS INTENSITY, Sm (psi) (500
°F)
MODULUS OF ELASTICITY (psi) (500 °F)
POISSON RATIO
17-4 PH H-1000
Link, Bearing Blocks, Stem 95200 44400 2,9E+07 0,27
INCONEL 718
Stem Pin, Disc Pin 140900 55200 2,6E+07 0,30
316 SST Body, Bonnet, Seat Ring, Disc 19900 17900 2,6E+07 0,30
CARBON STEEL Yoke 28300 18900 2,6E+07 0,28
ARMCO A-286 Studs for Yoke 85000 27100 2,7E+07 0,31
ALLOY STEEL Yoke Bolts 150000 29500 2,8E+07 0,29
CF8 Gland, Gland Follower 18200 16400 2,6E+07 0,30
9.4.4. Model Mesh
The mesh consists in 336639 tetrahedral and hexahedral elements. A picture of the mesh can be seen in Figure 16.

Design Basis Revision and Weak Link Analysis of LCV-115B/D 47
Figure 16 Model Mesh
A refined mesh was used in critical components while a coarse mesh was used in others, since they were already evaluated in the respective Stress Report [9] and proved to be more resistant. In Figure 17 can be seen a picture of the refined parts of the mesh.
Figure 17 Mesh of critical components
It is important to know the quality of the mesh since it plays a crucial role in the accuracy and stability of the solution. This metric is based on the ratio of the volume to the sum of the square of the edge lengths for 2D quad/tri elements, or the square root of the cube of the sum of the square of the edge lengths for 3D elements. A value of 1 indicates a perfect cube or square while a value of 0 indicates that the element has a zero or negative volume.

Design Basis Revision and Weak Link Analysis of LCV-115B/D 48
The average quality of the actual mesh is equal to 0,82461, Figure 18 shows a graph of the mesh quality.
Figure 18 Mesh Quality
Furthermore, it is also important to know the aspect ratio of the mesh, which is a measure of the stretching of the cell. It is computed as the ratio between the maximum and the minimum of the following distances: the normal distances between the cell centroid and face centroids, and the distances between the cell centroid and nodes. The average aspect ratio is equal to 1,9732, Figure 19 shows a graph of the aspect ratio of the present mesh.
Figure 19 Aspect Ratio
Accordingly, due to the average mesh quality and aspect ratio obtained, it can be concluded that the results obtained with this mesh will be numerically correct. Furthermore, mesh was refined successive times until the deviation of the results was less than ten percent, ensuring that the physical phenomenon would be properly captured.

Design Basis Revision and Weak Link Analysis of LCV-115B/D 49
9.4.5. Contacts, Boundary Conditions and Loads
Contacts between components are defined, using a friction coefficient of 0,18, which is the friction coefficient of steel on steel [9]. Figure 20 shows the contacts status.
Figure 20 Contacts status
Furthermore, fixed supports are introduced in the valve connections with the pipe, which are the regions in blue that can be seen in Figure 21.
Figure 21 Fixed Supports

Design Basis Revision and Weak Link Analysis of LCV-115B/D 50
Loads are input in the upper part of the stem. The method of loading applied is Short-time Static Loading, which consists of applying load so gradually that at any instant all parts are essentially in equilibrium. In testing, load is increased progressively until failure occurs. The red region of the stem, which can be seen in Figure 22, is where the load is applied.
Figure 22 Load input
9.4.6. Evaluation of Results
For non-pressure retaining component parts comprising the stem to disc connection, the maximum allowable tensile and compressive stresses are specified as 0,65.Sy and shear stresses are evaluated at 0,65.(0,6.Sy). The stem is also evaluated for buckling, taken at 1,0.Sy and failure of the stem head/stem pin connection at 0,65.Sy. The valve disc, which is the only pressure boundary part within the stem to disc connection subjected to the operator thrust loading, is evaluated against 1,0.Sm for primary membrane stresses, 1,5.Sm for plate bending stresses and against 0,6.Sm for shear stresses on the disc ears [10].
Probe ANSYS function is used on each of the critical components in order to obtain the results of each component studied.
9.4.6.1. Stem Evaluation
Stem, which is the component in which the thrust is applied, will be evaluated in the next section. The maximum allowable thrust the stem can resist should be evaluated.

Design Basis Revision and Weak Link Analysis of LCV-115B/D 51
Furthermore, stem can also fail because of buckling, hence it should also be studied.
9.4.6.1.1 Stem Maximum Allowable Thrust
The maximum allowable thrust on the stem due to tensile and compressive loads is determined using Maximum Principal Stress ANSYS function. Figure 23 shows the evolution of the maximum principal stress with the thrust.
Figure 23 Stem Maximum Principal Stress Evolution
As it can be seen in the graph, the maximum allowable thrust on the stem is equal to 24990,91 lb. Figure 24 and Figure 25 show the distribution of the principal stresses in the stem when this load is applied, the red regions at the low part of the stem are where maximum tensile stresses occur.

Design Basis Revision and Weak Link Analysis of LCV-115B/D 52
Figure 24 Stem Maximum Principal Stresses Distribution 1
Figure 25 Stem Maximum Principal Stresses Distribution 2
9.4.6.1.2 Stem Buckling
Buckling is a phenomenon of elastic instability that can occur when a body is subjected to compressive loads, and it is manifested by the appearance of important displacements transverse to the main direction of compression. If the load is greater than the load a material can withstand, it can lead to failure mode. Since the stem is directly under

Design Basis Revision and Weak Link Analysis of LCV-115B/D 53
compression, maximum allowable stem buckling, which is a function of the stem diameter and length of the stem, should be taken into account.
ANSYS provides users with Eigenvalue Buckling analysis, which easily predicts the theoretical buckling strength. The user must perform a static structural analysis of the model, and then transfer the results to Eigenvalue Buckling analysis so loads, boundary conditions and stress states are introduced. By solving such analysis the load needed for buckling failure of the stem is obtained. Figure 26 shows an image of the deformation due to stem buckling.
Figure 26 Stem Buckling Deformation
Results of Eigenvalue Buckling analysis manifest that the load needed for buckling failure of the stem is equal to 18503 lb, as can be seen in the upper left of the previous figure.
9.4.6.2. Stem Pin
Load is transmitted from the stem to the link by means of a simple cylindrical pin. Bearing stresses on the stem pin bore and shear stresses in the stem pin will be studied in the next section.

Design Basis Revision and Weak Link Analysis of LCV-115B/D 54
9.4.6.2.1 Stem Pin Shear
Under a single application of load of sufficient magnitude the pin could fail in double shear. Stem Pin Shear is evaluated using Maximum Shear ANSYS function over this component, in order to find out at which load the stem pin shear limit (0,65(0,6 Sy)) is exceeded. Figure 27 shows the evolution of the maximum shear stress in the stem pin with the thrust.
Figure 27 Stem Pin Maximum Shear Stress Evolution
As it can be seen in the graph, the shear limit (54950 psi) is reached when the load is equal to 29823,13 lb. Figure 28 shows shear stresses distribution when such load is applied.

Design Basis Revision and Weak Link Analysis of LCV-115B/D 55
Figure 28 Stem Pin Shear Stresses Distribution
It can be seen that shear stresses are greater in the red zones, which are the areas in which stem-stem pin and link-stem pin contacts occur. On the other hand, the shear stresses are minimum in the blue regions, which are the extremes of the pin, since no contact is there.
9.4.6.2.2 Bearing Stress on the Stem Pin Bore
The bearing stresses on the bore surface when the surface is loaded by the stem pin are studied using Maximum Principal Stress function in the stem pin. The behavior of the maximum bearing stress with the load can be seen in Figure 29.
0,00
20000,00
40000,00
60000,00
80000,00
100000,00
120000,00
0 10000 20000 30000 40000 50000 60000 70000 80000
Stre
ss (p
si)
Thrust (lb)
MaximumBearingStress
Limit
Figure 29 Stem Pin Bore Maximum Bearing Stress Evolution

Design Basis Revision and Weak Link Analysis of LCV-115B/D 56
The maximum allowable load for this case is equal to 68431,83 lb. Figure 30 shows maximum principal stresses distribution in the stem pin.
Figure 30 Stem Pin Bore Maximum Principal Stresses Distribution
The blue regions are compressive stresses that coincide with the points where the contacts are more closed, while red zones are tensile stresses that oppose these compressive stresses. At the extremes the maximum principal stresses are almost zero since in these regions there is no contact.
9.4.6.3. Link
The link, that is the key part in the stem-disc connection, will be evaluated in the following section. Primary stresses and bearing stresses between pins and link holes should be studied to demonstrate that the link was properly designed.
9.4.6.3.1 Primary Stresses
To evaluate primary stresses in the link Equivalent Von-Mises Stress ANSYS function is used in order to find out at which load the limit (0,65 Sy) is exceeded.

Design Basis Revision and Weak Link Analysis of LCV-115B/D 57
0
20000
40000
60000
80000
100000
120000
140000
160000
180000
0 10000 20000 30000 40000 50000 60000 70000 80000
Stre
ss (p
si)
Thrust (lb)
PrimaryStress
Limit
Figure 31 Link Maximum Primary Stress Evolution
Figure 31 shows that the limit (61880 psi) is reached when the load is equal to 30210,60 lb. Figure 32 and Figure 33 show the distribution of the primary stresses in the link when this load is applied.
Figure 32 Link Primary Stresses Distribution 1

Design Basis Revision and Weak Link Analysis of LCV-115B/D 58
Figure 33 Link Primary Stresses Distribution 2
It can be seen that the primary stresses are maximum in the center of the link, red and yellow regions in the figure above.
9.4.6.3.2 Bearing Stress between Link Bores and Pins
Maximum Principal Stress ANSYS function is used to determine the bearing stresses in order to find the maximum allowable thrust for this case. Figure 34 shows the maximum bearing stress behavior with the load increasing.
0
10000
20000
30000
40000
50000
60000
70000
0 10000 20000 30000 40000 50000 60000 70000 80000
Stre
ss (p
si)
Thrust (lb)
BearingStress
Limt
Figure 34 Link Bores Maximum Bearing Stress Evolution

Design Basis Revision and Weak Link Analysis of LCV-115B/D 59
The maximum allowable thrust in this case is 78670,13 lb. Simulation results when such load is applied to the stem can be seen in Figure 35 and Figure 36.
Figure 35 Link Maximum Principal Stresses Distribution 1
Figure 36 Link Maximum Principal Stresses Distribution 2
It can be seen that the regions in which contacts between the link and the pins are more closed are the regions with greater stresses, which coincide with the red zones in the figures above.

Design Basis Revision and Weak Link Analysis of LCV-115B/D 60
9.4.6.4. Disc Pin
Both bearing stresses on the disc pin bore and the disc pin shear should be evaluated as in the stem pin, therefore same procedures as in section 9.4.6.2 were followed.
9.4.6.4.1 Disc Pin Shear
The maximum allowable thrust in this case is 65557,52 lb. Figure 37 shows how the maximum shear stress varies in the disc pin with the thrust, and Figure 38 shows the shear stresses distribution.
0
10000
20000
30000
40000
50000
60000
70000
0 10000 20000 30000 40000 50000 60000 70000 80000
Stre
ss (p
si)
Thrust (lb)
MaximumShear StressLimit
Figure 37 Disc Pin Maximum Shear Stress Evolution

Design Basis Revision and Weak Link Analysis of LCV-115B/D 61
Figure 38 Disc Pin Shear Stresses Distribution
Like in the stem pin, shear stresses are greater in the contact regions and lower in the extremes of the pin since there is no contact.
9.4.6.4.2 Bearing Stress on the Disc Pin Bore
The maximum allowable thrust this component can resist in this case is 54384,87 lb. Figure 39 shows the maximum bearing stress variation on the disc pin surface with the thrust, and Figure 40 shows the maximum principal stresses distribution.
0
20000
40000
60000
80000
100000
120000
140000
0 10000 20000 30000 40000 50000 60000 70000 80000
Stre
ss (p
si)
Thrust (lb)
MaximumBearingStressLimit
Figure 39 Disc Pin Bore Maximum Bearing Stress Evolution

Design Basis Revision and Weak Link Analysis of LCV-115B/D 62
Figure 40 Disc Pin Maximum Principal Stresses Distribution
The blue zones are compressive stresses that coincide with the points where the contacts are more closed, while red zones are tensile stresses that oppose these compressive stresses.
Opposite to the stem pin, the disc pin will fail because of bearing since its shape is narrower and longer than the stem pin.
9.4.6.5. Bearing Blocks
The bearing blocks, which engage the disc and transmit load from the link and the disc pin to the disc, will be studied in the following section. The bearing blocks yield stress is much higher than the yield stress of the disc, therefore two important stresses should be considered: the shear stresses when the pin attempts to tear out of the bearing blocks and the bearing stresses between the disc pin and the bearing blocks.
9.4.6.5.1 Bearing Blocks Shear
Bearing blocks shear is studied using Maximum Shear Stress ANSYS function. Figure 41 shows how maximum shear stress behaves with the thrust.

Design Basis Revision and Weak Link Analysis of LCV-115B/D 63
0
10000
20000
30000
40000
50000
60000
0 10000 20000 30000 40000 50000 60000 70000 80000
Stre
ss (p
si)
Thrust (lb)
MaximumShearStressLimit
Figure 41 Bearing Blocks Maximum Shear Stress Evolution
As can be seen in the previous figure, bearing blocks shear limit (37128 psi) is reached when the load is equal to 61604,50 lb. Figure 42 shows the shear stresses distribution at such load.
Figure 42 Bearing Blocks Shear Stresses Distribution
In this case it can be seen clearly that load is not uniformly distributed through the bearing blocks, hence areas with greater loads have greater stresses, red regions that can be seen in the figure above.

Design Basis Revision and Weak Link Analysis of LCV-115B/D 64
9.4.6.5.2 Bearing Stresses in the Bearing Blocks Bores
Bearing stresses are evaluated on the bearing blocks bores to determine the maximum allowable thrust in this case. Figure 43 shows the maximum bearing stress in the bearing blocks bores at different loads.
010000200003000040000500006000070000
0 10000 20000 30000 40000 50000 60000 70000 80000
Stre
ss (p
si)
Thrust (lb)
BearingStress
Limt
Figure 43 Bearing Blocks Bores Maximum Bearing Stress Evolution
Limit (61880 psi) is not exceeded in the analysis, therefore extrapolation is used to find the maximum allowable load in this case, which is 114402,40 lb. Figure 44 shows simulation results when the thrust applied is equal to 80000 lb.
Figure 44 Bearing Blocks Maximum Principal Stresses Distribution

Design Basis Revision and Weak Link Analysis of LCV-115B/D 65
It can be seen that such stresses are greater in the regions where contacts take place, and in particular the red areas are those in which the contacts are more closed hence stresses are maximum.
9.4.6.6. Disc
The disc will be studied in the next section. Primary membrane stresses, shear stresses on the disc ears and disc primary bending stresses should be evaluated.
9.4.6.6.1 Primary Membrane Stress
The primary membrane stress is the uniformly distributed and equal to the average value of stress across the thickness normal stress component, and its limit in the disc is 1,0 Sm. Figure 45 shows the maximum primary membrane stress behavior depending on the thrust.
0
2000
4000
6000
8000
10000
12000
14000
16000
18000
20000
0 10000 20000 30000 40000 50000 60000 70000 80000
Stre
ss (p
si)
Thrust (lb)
PrimaryMembraneStressLimit
Figure 45 Disc Primary Maximum Membrane Stress Evolution
Limit (17900 psi) is not exceeded in the analysis, therefore extrapolation is used to find the maximum allowable load in this case, which is 103331,41 lb.

Design Basis Revision and Weak Link Analysis of LCV-115B/D 66
9.4.6.6.2 Shear Stress on Disc Ears
Shear stresses on disc ears are studied using Maximum Shear Stress ANSYS function. Figure 46 shows how the maximum shear stress behaves with the thrust.
05000
1000015000200002500030000350004000045000
0 10000 20000 30000 40000 50000 60000 70000 80000
Stre
ss (p
si)
Thrust (lb)
MaximumShearStress
Limit
Figure 46 Disc Ears Maximum Shear Stress Evolution
The maximum allowable thrust in this case is 24312,14 lb. Results when such load is applied to the stem can be seen in Figure 47 and Figure 48.
Figure 47 Disc Shear Stresses Distribution 1

Design Basis Revision and Weak Link Analysis of LCV-115B/D 67
Figure 48 Disc Shear Stresses Distribution 2
The shear stresses are maximum in the regions in which the bearing blocks contact with the disc, which are the red zones that can be seen in the figures above.
9.4.6.6.3 Disc Primary Bending Stress
Disc primary bending stresses are studied using Maximum Principal Stress ANSYS function. Figure 49 shows the maximum bending stress behavior depending on the thrust.
0
5000
10000
15000
20000
25000
30000
35000
40000
45000
50000
0 10000 20000 30000 40000 50000 60000 70000 80000
Stre
ss (p
si)
Thrust (lb)
MaximumBendingStress
Limit
Figure 49 Disc Maximum Primary Bending Stress Evolution

Design Basis Revision and Weak Link Analysis of LCV-115B/D 68
The maximum thrust in this case is equal to 46526,06 lb. Figure 50 and Figure 51 show the maximum principal stresses distribution when such load is applied.
Figure 50 Disc Maximum Principal Stresses Distribution 1
Figure 51 Disc Maximum Principal Stresses Distribution 2
The blue regions in the disc ears are compressive stresses due to the impact of the bearing blocks with the disc, while the red regions are tensile stresses that oppose such compressive stresses. Furthermore, there are clear compressive stresses in the bottom of the disc, which coincide with the contact between the disc and the seat.

Design Basis Revision and Weak Link Analysis of LCV-115B/D 69
9.4.7. Results Discussion
Table 17 shows the critical load of each one of the components studied.
Table 17 Weak Link Results
Component Failure Mode Stress Limit (psi) Critical Load (lb)
Stem Stem Buckling 61880,00 18503,00
Stem Pin Stem Pin Shear 54951,00 29823,13
Link Primary Stress 61880,00 30210,60 Disc Pin Bearing Stress 91585,00 54384,87
Bearing Blocks Bearing Blocks Shear 37128,00 61605,50
Disc Shear Stress on Disc Ears 10740,00 24312,14
It can be concluded that the first component that would structurally fail is the stem when the load applied is equal to 18503,00 lb (buckling failure). Comparing such critical load with the maximum design load calculated in section 9.3, which is equal to 8977,04 lb, it can be concluded that the LCV-115B/D valves can operate under design basis conditions, without structural failures as there is sufficient margin.

Design Basis Revision and Weak Link Analysis of LCV-115B/D 70
10. Conclusions
Firstly, all the safety functions, emergency functions, normal operations and abnormal events of LCV-115B/D valves were identified and referenced using the documentation provided by the NPP.
Secondly, Design basis revision was done to prove that LCV-115B/D will function when subjected to design-basis conditions considered during both normal operation and abnormal events within the design basis of the plant. This includes: calculations of maximum differential pressure and line pressure, actuation time evaluation and reduced voltage analysis.
The maximum values of the differential pressure and line pressure were obtained in case 9.1.1.b “Transfer to recirculation phase” for closing operation, and in case 9.1.3.c “Emptying of the reactor cavity initiation” for opening operation, and this results were used to calculate the new maximum design thrust requirements. Such maximum line pressure and differential pressure calculations could be seen in section 9.2 of the present document.
Actuation time was also analyzed, and it was concluded that the 10 seconds stroke time, which is stablished in the design specifications by engineering judgment, cannot be modified in order not to impact SIS actuation and the low-low level setpoint in the VCT.
Furthermore, functions triggered automatically by control signals occurring simultaneously with loss of external power, such as S signal or T signal, must be able to be performed when the diesel generators are operating. Consequently, safety function 9.1.1.a “Safety Injection signal” must be guaranteed for such reduced voltage.
New maximum design thrust requirements were calculated using the results obtained from the design basis revision. The maximum thrusts calculated are 8295,69 lb for opening operation and 8977,04 lb for closing operation.
Additionally, Weak link analysis of the critical components was done using ANSYS code, since the other parts of the valves were already evaluated in the respective Stress Report [9] and proved to be more resistant. It can be concluded that the valves could operate under design basis conditions without structural failures, because the lowest critical load, which is the thrust needed for buckling failure of the stem (18503 lb), is much larger than the maximum design thrust (8977,04 lb), therefore there is sufficient margin. However, it is always recommended to perform a valve field diagnostic to be sure that the results are correct.

Design Basis Revision and Weak Link Analysis of LCV-115B/D 71
Hypotheses have been placed on the safety side in all cases, ensuring that the parameters could be used in subsequence calculations without compromising the results. Nonetheless, unnecessary conservatism has been avoided, resulting in inaccurate or unrealistic calculations.
Due to the obtained results, it was demonstrated that LCV-115B/D are capable of performing their safety functions under design-basis conditions.
Non-safety-related operations were analyzed and approved for the worst case scenario in order to be conservative. However, the inability of an MOV to stroke while performing a normal operating function under worst case conditions can adversely impact plant availability and/or component operability. Therefore, it is believed that is acceptable to use a best-estimate approach, since the inability to perform a normal function does not represent a safety concern. Although it may be found that a given worst case scenario could result in a differential pressure which exceeds the limits of the operator, if this is not a safety function it may be acceptable to perform a best-estimate approach of the pressure requirements in sizing and maintaining the setting of the operator. Nevertheless, this depends on the individual plant licensing taken relative to handling of non-safety related operations.
Systems are designed following single failure criteria, hence the mispositioning of MOV’s during design basis events were also investigated. No further failures would be assumed since mispositioning is a single failure, hence the affected equipment is not assumed to recover and the full complement of operable equipment required by Technical Specifications ensures that sufficient remaining systems are available to successfully mitigate design basis events. Therefore, it is believed that if NPP can demonstrate that the mispositioning represents an acceptable single failure a basis exists not to use this case in sizing and maintaining the setting of the operator. This would provide the plant with flexibility when a mispositioning function is determined to be beyond the capability of the operator. Of course this depends on the individual plant licensing taken relative to handling of valve mispositioning.
Comparison between the present weak link results and the results obtained by Westinghouse using its methodology [12] were done, Table 18 contains such comparison.

Design Basis Revision and Weak Link Analysis of LCV-115B/D 72
Table 18 Comparison between ANSYS results and Westinghouse results
Component ANSYS Weak Link Westinghouse Methodology Failure Mode Thrust (lb) Failure Mode Thrust (lb)
Stem Stem Buckling 18503,00 Stem Buckling 17606 Stem Pin Stem Pin Shear 29823,13 Stem Pin Shear 31721
Link Primary Stress 30210,60 Primary Stress 29352 Disc Pin Bearing Stress 54384,87 - -
Bearing Blocks Bearing Block Shear 61605,50 Bearing Block
Shear 76929
Disc Shear Stress on Disc Ears 24312,14 Shear Stress on
Disc Ears 33867
It can be seen that the results obtained with ANSYS are similar to the results obtained by Westinghouse Electric Company, but it is strange that they are more conservative in some cases. This could be because of the simplifications did in the model in order to reduce computational time, such as simplifying the complex profiles of some components or simulating threads using ANSYS instead of modeling them, since the power of the computer was limited. Other reason may be that Westinghouse assumed that the center of gravity of the valve is in the middle, however, the center of mass of the operator is not centered and this displaces the center of mass of the valve. In the present project the distribution of mass in the operator has been adjusted so that ANSYS mechanical showed a more realistic location of the center of mass.
In conclusion, it would be needed a computer with a very powerful processor to perform a weak link analysis with ANSYS in precise way, taking into account the complex geometries of the components that form the valve and the tiny threads of the screws that hold them, since the needed mesh would be extremely fine and therefore the computational time would be enormous. Furthermore, ANSYS models should be rigorously validated from test data in order to be sure it could be used in nuclear industry.

Design Basis Revision and Weak Link Analysis of LCV-115B/D 73
11. Acknowledgment
Firstly, I would like to acknowledge the UPC and Westinghouse Electric Spain, S.A.U. for allowing me to be part of its staff these months; I have learned a lot both professionally and personally. Secondly, I would like to thank Lluis Batet Miracle for handling the internship, and Elisabet Mas de les Valls Ortiz, who was my tutor during such internship. Furthermore, I want to thank Jorge Israel Díaz González for welcoming me in the Mechanical and Fluid Systems Department of Westinghouse Electric Spain, S.A.U. in Madrid, Oriol Noguera Oliva for guiding me during the realization of the present project, and José Manuel López Férnandez because he helped me learn how to use ANSYS and SpaceClaim codes. Finally, I would like to acknowledge Westinghouse Electric’s people, I have always been treated cordially and they always helped me as I required it.

Design Basis Revision and Weak Link Analysis of LCV-115B/D 74
12. Bibliography
The following references have been used as support or guide during the development of the present project:
[1] NRC Bulletin 89-10. Safety-Related Motor-Operated Valve Testing and Surveillance. 1989.
[2] NRC Supplement 1 of Bulletin 89-03.
[3] NRC Bulletin 85-03. Motor Operated Valve Common Mode Failures during Plant Transients due to Improper Switch Settings. 1985.
[4] NRC Supplement 1 of Bulletin 85-03.
[5] PRETEL, C. Topic 5: Auxiliary Systems: Chemical and Volume Control System. Barcelona: Universitat Politècnica de Catalunya, 2015.
[6] CASAMOR, M. Course on PWR Plant Technology, Subject: Safety Injection System. Barcelona: Tecnatom, 2015.
[7] PRIETO, J.L. Evaluación de las Bases de las Válvulas Motorizadas. Madrid: Westinghouse Sistemas Energéticos España, 1995.
[8] MANUFACTURER. Gate and Globe Valve Selection Procedure.
[9] SCHLEMMER, G.L. Stress Report for Westinghouse EMD Class I Nuclear Gate Valves. Cheswick: Westinghouse Electric Corporation, 1994.
[10] ASME BPVC NB-3000. Design. New York: The American Society of Mechanical Engineers, 1972.
[11] Motor Operated Gate Valves, Manually Operated Gate Valves, Swing Check Valves, Instruction Book Revision 1. Cheswick: Westinghouse Electric Corporation, 1996.
[12] GIL, C., SANTAMARIA, J. Weal Link Analysis for 8 in (Group A) E EMD Motor Operated Gate Valves. Tarragona: Westinghouse Electric Corporation, 1996.
[13] LAMARSH, J.R., BARATTA, A.J. Introduction to Nuclear Engineering. New Jersey: Prentice Hall, 2001.

Design Basis Revision and Weak Link Analysis of LCV-115B/D 75
[14] Introduction to ANSYS Mechanical. Pittsburg: ANSYS Inc.
[15] ANSYS Mechanical Advanced Connections. Pittsburg: ANSYS Inc.
[16] Introduction to ANSYS Meshing. Pittsburg: ANSYS Inc.
[17] Introduction to ANSYS SpaceClaim Direct Modeler. Pittsburg: ANSYS Inc.
[18] ASME B16.5. Pipe Flanges and Flanged Fittings. New York: The American Society of Mechanical Engineers, 2009.
[19] ASME B18.2.1. Square, Hex, Heavy Hex, and Askew Head Bolts and Hex, Heavy Hex, Hex Flange, Lobed Head, and Lag Screws (Inch Series). New York: The American Society of Mechanical Engineers, 2012.
[20] https://www.eolss.net/Sample-Chapters/C05/E6-165-13-00.pdf. Last visit: 1/4/2017
[21] http://www.roymech.co.uk/Useful_Tables/Mechanics/stress.html. Last visit: 7/5/2017
[22] https://www.quora.com/What-is-minimum-Principal-stress-Is-it-related-to-compressive-stress. Last visit: 13/5/2017
[23] http://engr.bd.psu.edu/ansysug/strs_class.html. Last visit: 13/5/2017
[24] http://www.ecourses.ou.edu/cgi-bin/eBook.cgi?topic=me&chap_sec=01.2&page=theory. Last visit: 17/5/2017
[25] http://www.ansys.com/-/media/Ansys/corporate/resourcelibrary/article/AA-V2-I1-Analyzing-Buckling.pdf. Last visit: 23/5/2017
[26] https://www.youtube.com/watch?v=gVNaWJNkjIE. Last visit: 23/5/2017

Annex I: Basic Parameters

Annex I: Basic Parameters 1
Annex I: Basic Parameters
Pressures
PARAMETER DESCRIPTION VALUE
P1 Maximum containment pressure
after transfer to cold leg recirculation phase
3,52 kg/cm2 rel.
P2 Maximum full-power RCS pressure 161,7 kg/cm2 rel.
Pps Minimum suction pressure of the
charging pumps -1,0 kg/cm2 rel.
Patm Atmospheric pressure 0 kg/cm2 rel.
Prv1 Timing pressure relief valve 8121 10,5 kg/cm2 rel.
PVCT1 VCT minimum pressure 1,68 kg/cm2 rel.
PVCT2 VCT maximum pressure 5,27 kg/cm2 rel.
Pbat BAT pressure 0 kg/cm2 rel.
Pressures Developed by the pumps
PARAMETER DESCRIPTION VALUE
delta H1 Shutoff pressure of the charging
pumps 1890 m water col.
delta H2 Shutoff pressure of the RHR pumps 105,1 m water col.
delta H3 Differential pressure of the BAT
pumps (BATP) on contribution basis 72 m water col.
delta H4 Minimum differential pressure of the
charging pumps on runout conditions
853 m water col.

Annex I: Basic Parameters 2
Elevations
PARAMETER DESCRIPTION VALUE
H1 Elevation difference between relief
valve 8121 and the valve *
H2 Elevation difference between the
water level in the VCT and the valve 8,1 m
H3 Elevation difference between the maximum level in the RWST and
the valve 19,2 m
H4 Elevation difference between the
RCS and the valve *
H5
Elevation difference between the minimum level in the RWST and the
valve at the time of transfer to recirculation phase
7 m
H6 Elevation difference between the
maximum level in the BAT and the valve
10,1 m
H7 Elevation difference between the
water level in the containment sumps and the valve
- 5,2 m
H8 Elevation difference between very low level in the VCT and the valve
7 m
H9 Elevation difference between the water level in the RWST and the
valve 19,1 m
H10 Elevation difference between the discharge of the miniflow of the charging pumps and the valve
*

Annex I: Basic Parameters 3
H11 Elevation difference between the
maximum level in the reactor cavity and the valve
18,6 m
H12
Elevation difference between the minimum level in the RWST at the beginning of the emptying of the
reactor cavity and the valve
*

Annex II: Weak Link Results Tables

Annex III: Weak Link Results Tables 1
Annex II: Weak Link Results Tables Table 1 Stem Weak Link Results
Time (s) Force (lb) Maximum Principal Stress (psi)
0,00 0,00 0,0000E+00 1,00 2000,00 1,9718E+04 2,00 4000,00 1,6838E+04 3,00 6000,00 2,2309E+04 4,00 8000,00 2,7696E+04 5,00 10000,00 3,2383E+04 6,00 12000,00 3,6747E+04 7,00 14000,00 4,1133E+04 8,00 16000,00 4,5347E+04 9,00 18000,00 4,9353E+04
10,00 20000,00 5,3182E+04 11,00 22000,00 5,6787E+04 12,00 24000,00 6,0244E+04 13,00 26000,00 6,3546E+04 14,00 28000,00 6,6681E+04 15,00 30000,00 6,9769E+04 16,00 32000,00 7,2618E+04 17,00 34000,00 7,5340E+04 18,00 36000,00 7,7919E+04 19,00 38000,00 8,0406E+04 20,00 40000,00 8,2809E+04 21,00 42000,00 8,5219E+04 22,00 44000,00 8,7404E+04 23,00 46000,00 8,9456E+04 24,00 48000,00 9,1474E+04 25,00 50000,00 9,3377E+04 26,00 52000,00 9,5259E+04 27,00 54000,00 9,7194E+04 28,00 56000,00 9,8829E+04 29,00 58000,00 1,0043E+05 30,00 60000,00 1,0197E+05 31,00 62000,00 1,0348E+05 32,00 64000,00 1,0500E+05 33,00 66000,00 1,0650E+05 34,00 68000,00 1,0793E+05 35,00 70000,00 1,0934E+05 36,00 72000,00 1,1072E+05

Annex III: Weak Link Results Tables 2
37,00 74000,00 1,1217E+05 38,00 76000,00 1,1329E+05 39,00 78000,00 1,1432E+05 40,00 80000,00 1,1558E+05
Table 2 Stem Pin Weak Link Results
Time (s) Force (lb)
Maximum Bearing Stress (psi)
Maximum Shear Stress (psi)
0 0 0,0000E+00 0,0000E+00 1 2000 5,5417E+03 1,0047E+04 2 4000 1,3558E+04 2,2056E+04 3 6000 1,8948E+04 2,9651E+04 4 8000 2,1220E+04 3,4963E+04 5 10000 2,2288E+04 3,8576E+04 6 12000 2,3145E+04 4,1514E+04 7 14000 2,4711E+04 4,3563E+04 8 16000 2,5908E+04 4,5398E+04 9 18000 2,6883E+04 4,7046E+04
10 20000 2,7775E+04 4,8598E+04 11 22000 2,8793E+04 5,0086E+04 12 24000 3,0019E+04 5,1469E+04 13 26000 3,1913E+04 5,2734E+04 14 28000 3,4677E+04 5,3879E+04 15 30000 3,7395E+04 5,5055E+04 16 32000 4,0157E+04 5,6098E+04 17 34000 4,2933E+04 5,7046E+04 18 36000 4,5717E+04 5,8052E+04 19 38000 4,8483E+04 5,9032E+04 20 40000 5,1287E+04 6,0000E+04 21 42000 5,4021E+04 6,0746E+04 22 44000 5,6838E+04 6,1480E+04 23 46000 5,9635E+04 6,2270E+04 24 48000 6,2462E+04 6,2873E+04 25 50000 6,5264E+04 6,3598E+04 26 52000 6,8116E+04 6,5718E+04 27 54000 7,0898E+04 6,7830E+04 28 56000 7,3765E+04 6,9979E+04 29 58000 7,6591E+04 7,2095E+04 30 60000 7,9463E+04 7,4237E+04

Annex III: Weak Link Results Tables 3
31 62000 8,2293E+04 7,6353E+04 32 64000 8,5188E+04 7,8513E+04 33 66000 8,8062E+04 8,0652E+04 34 68000 9,0969E+04 8,2853E+04 35 70000 9,3822E+04 8,5004E+04 36 72000 9,6738E+04 8,7162E+04 37 74000 9,9557E+04 8,9300E+04 38 76000 1,0252E+05 9,1496E+04 39 78000 1,0543E+05 9,3685E+04 40 80000 1,0849E+05 9,5928E+04
Table 3 Link Weak Link Results
Time (s) Force (lb) maximum Primary Stress (psi)
Maximum Bearing Stress (psi)
0 0 0,0000E+00 0,0000E+00 1 2000 1,6016E+03 7,5488E+02 2 4000 3,5602E+03 1,4881E+03 3 6000 6,9532E+03 2,6124E+03 4 8000 1,1590E+04 4,1906E+03 5 10000 1,6349E+04 5,8960E+03 6 12000 2,1043E+04 7,5851E+03 7 14000 2,5583E+04 9,2163E+03 8 16000 3,0109E+04 1,0823E+04 9 18000 3,4631E+04 1,2404E+04
10 20000 3,9952E+04 1,4437E+04 11 22000 4,4325E+04 1,6029E+04 12 24000 4,8674E+04 1,7686E+04 13 26000 5,2959E+04 1,9377E+04 14 28000 5,7225E+04 2,1010E+04 15 30000 6,1441E+04 2,2652E+04 16 32000 6,5610E+04 2,4345E+04 17 34000 6,9734E+04 2,6070E+04 18 36000 7,3896E+04 2,7714E+04 19 38000 7,8039E+04 2,9239E+04 20 40000 8,2745E+04 3,1041E+04 21 42000 8,7179E+04 3,2667E+04 22 44000 9,1694E+04 3,4364E+04 23 46000 9,6224E+04 3,6010E+04 24 48000 1,0080E+05 3,7672E+04 25 50000 1,0533E+05 3,9348E+04

Annex III: Weak Link Results Tables 4
26 52000 1,0985E+05 4,1021E+04 27 54000 1,1435E+05 4,2670E+04 28 56000 1,1884E+05 4,4295E+04 29 58000 1,2331E+05 4,5911E+04 30 60000 1,2771E+05 4,7513E+04 31 62000 1,3214E+05 4,9109E+04 32 64000 1,3660E+05 5,0718E+04 33 66000 1,4099E+05 5,2329E+04 34 68000 1,4538E+05 5,3930E+04 35 70000 1,4976E+05 5,5493E+04 36 72000 1,5411E+05 5,7018E+04 37 74000 1,5848E+05 5,8542E+04 38 76000 1,6255E+05 6,0029E+04 39 78000 1,6631E+05 6,1429E+04 40 80000 1,7005E+05 6,2775E+04
Table 4 Disc Pin Weak Link Results
Time (s) Force (lb) Maximum Bearing Stress (psi)
Maximum Shear Stress (psi)
0 0 0,0000E+00 0,0000E+00 1 2000 1,0747E+03 4,8172E+02 2 4000 2,2483E+03 1,1250E+03 3 6000 4,7875E+03 2,3945E+03 4 8000 8,0115E+03 4,0064E+03 5 10000 1,1541E+04 5,7711E+03 6 12000 1,5164E+04 7,5826E+03 7 14000 1,8952E+04 9,4765E+03 8 16000 2,2758E+04 1,1380E+04 9 18000 2,6555E+04 1,3278E+04
10 20000 3,0363E+04 1,5182E+04 11 22000 3,4113E+04 1,7056E+04 12 24000 3,7846E+04 1,8923E+04 13 26000 4,1562E+04 2,0780E+04 14 28000 4,5198E+04 2,2598E+04 15 30000 4,8925E+04 2,4462E+04 16 32000 5,2545E+04 2,6271E+04 17 34000 5,6165E+04 2,8081E+04 18 36000 5,9681E+04 2,9838E+04 19 38000 6,3248E+04 3,1621E+04 20 40000 6,6732E+04 3,3362E+04

Annex III: Weak Link Results Tables 5
21 42000 7,0326E+04 3,5159E+04 22 44000 7,3806E+04 3,6898E+04 23 46000 7,7204E+04 3,8596E+04 24 48000 8,0655E+04 4,0321E+04 25 50000 8,4061E+04 4,2024E+04 26 52000 8,7417E+04 4,3701E+04 27 54000 9,0944E+04 4,5463E+04 28 56000 9,4275E+04 4,7128E+04 29 58000 9,7596E+04 4,8787E+04 30 60000 1,0092E+05 5,0446E+04 31 62000 1,0421E+05 5,2093E+04 32 64000 1,0747E+05 5,3719E+04 33 66000 1,1063E+05 5,5301E+04 34 68000 1,1385E+05 5,6908E+04 35 70000 1,1712E+05 5,8543E+04 36 72000 1,2026E+05 6,0111E+04 37 74000 1,2353E+05 6,1745E+04 38 76000 1,2656E+05 6,3261E+04 39 78000 1,2961E+05 6,4786E+04 40 80000 1,3248E+05 6,6217E+04
Table 5 Bearing Blocks Weak Link Results
Time (s) Force (lb) Maximum Bearing Stress (psi)
Maximum Shear Stress (psi)
0 0 0,0000E+00 0,0000E+00 0,5 1000 7,5641E+02 5,8754E+02
0,75 1500 9,6280E+02 7,6683E+02 1 2000 1,1297E+03 9,5460E+02 2 4000 1,9128E+03 1,9095E+03 3 6000 2,7064E+03 2,8955E+03 4 8000 3,5789E+03 3,9399E+03 5 10000 4,5635E+03 5,0513E+03 6 12000 5,5790E+03 6,1852E+03 7 14000 6,6171E+03 7,3403E+03 8 16000 7,7052E+03 8,5489E+03 9 18000 8,8235E+03 9,7876E+03
10 20000 9,9439E+03 1,1029E+04 11 22000 1,1046E+04 1,2249E+04 12 24000 1,2149E+04 1,3474E+04 13 26000 1,3252E+04 1,4730E+04
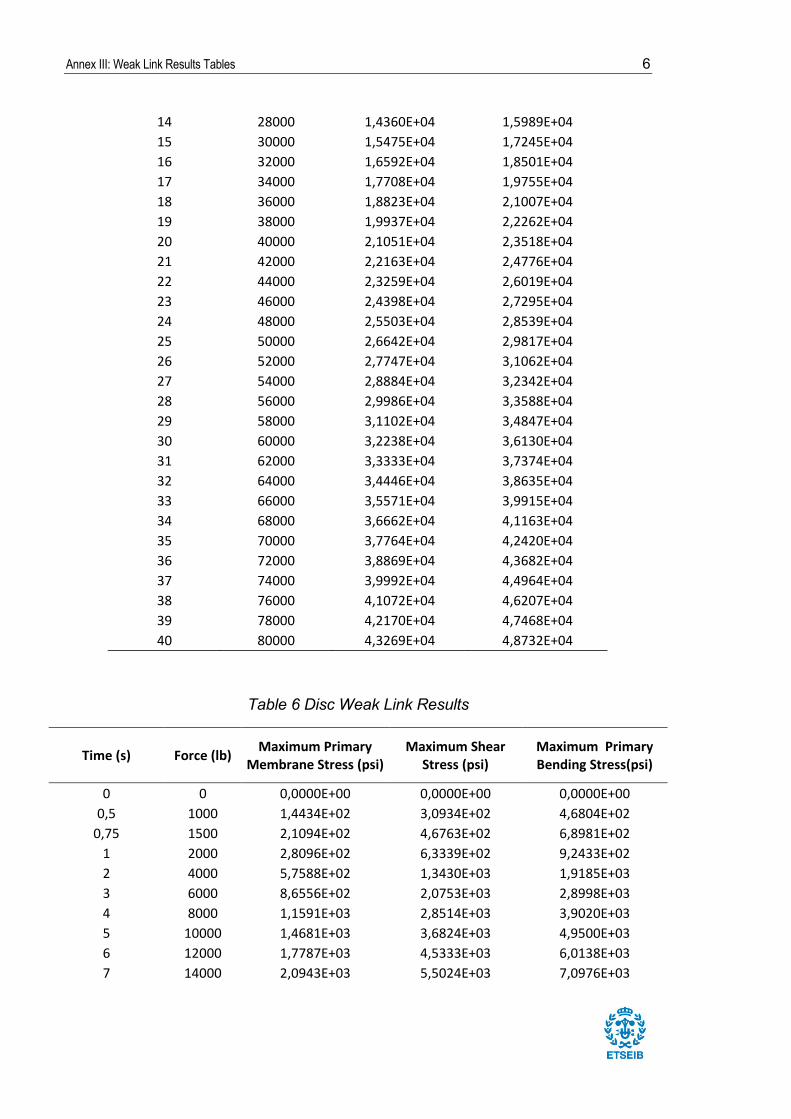
Annex III: Weak Link Results Tables 6
14 28000 1,4360E+04 1,5989E+04 15 30000 1,5475E+04 1,7245E+04 16 32000 1,6592E+04 1,8501E+04 17 34000 1,7708E+04 1,9755E+04 18 36000 1,8823E+04 2,1007E+04 19 38000 1,9937E+04 2,2262E+04 20 40000 2,1051E+04 2,3518E+04 21 42000 2,2163E+04 2,4776E+04 22 44000 2,3259E+04 2,6019E+04 23 46000 2,4398E+04 2,7295E+04 24 48000 2,5503E+04 2,8539E+04 25 50000 2,6642E+04 2,9817E+04 26 52000 2,7747E+04 3,1062E+04 27 54000 2,8884E+04 3,2342E+04 28 56000 2,9986E+04 3,3588E+04 29 58000 3,1102E+04 3,4847E+04 30 60000 3,2238E+04 3,6130E+04 31 62000 3,3333E+04 3,7374E+04 32 64000 3,4446E+04 3,8635E+04 33 66000 3,5571E+04 3,9915E+04 34 68000 3,6662E+04 4,1163E+04 35 70000 3,7764E+04 4,2420E+04 36 72000 3,8869E+04 4,3682E+04 37 74000 3,9992E+04 4,4964E+04 38 76000 4,1072E+04 4,6207E+04 39 78000 4,2170E+04 4,7468E+04 40 80000 4,3269E+04 4,8732E+04
Table 6 Disc Weak Link Results
Time (s) Force (lb) Maximum Primary Membrane Stress (psi)
Maximum Shear Stress (psi)
Maximum Primary Bending Stress(psi)
0 0 0,0000E+00 0,0000E+00 0,0000E+00 0,5 1000 1,4434E+02 3,0934E+02 4,6804E+02
0,75 1500 2,1094E+02 4,6763E+02 6,8981E+02 1 2000 2,8096E+02 6,3339E+02 9,2433E+02 2 4000 5,7588E+02 1,3430E+03 1,9185E+03 3 6000 8,6556E+02 2,0753E+03 2,8998E+03 4 8000 1,1591E+03 2,8514E+03 3,9020E+03 5 10000 1,4681E+03 3,6824E+03 4,9500E+03 6 12000 1,7787E+03 4,5333E+03 6,0138E+03 7 14000 2,0943E+03 5,5024E+03 7,0976E+03

Annex III: Weak Link Results Tables 7
8 16000 2,4266E+03 6,5013E+03 8,2476E+03 9 18000 2,7694E+03 7,5148E+03 9,4232E+03
10 20000 3,1138E+03 8,5332E+03 1,0613E+04 11 22000 3,4650E+03 9,5538E+03 1,1827E+04 12 24000 3,8188E+03 1,0578E+04 1,3046E+04 13 26000 4,1714E+03 1,1616E+04 1,4264E+04 14 28000 4,5237E+03 1,2657E+04 1,5485E+04 15 30000 4,8764E+03 1,3703E+04 1,6708E+04 16 32000 5,2285E+03 1,4750E+04 1,7932E+04 17 34000 5,5808E+03 1,5799E+04 1,9162E+04 18 36000 5,9328E+03 1,6849E+04 2,0390E+04 19 38000 6,2845E+03 1,7899E+04 2,1617E+04 20 40000 6,6368E+03 1,8949E+04 2,2843E+04 21 42000 6,9887E+03 1,9998E+04 2,4068E+04 22 44000 7,3408E+03 2,1036E+04 2,5285E+04 23 46000 7,6896E+03 2,2097E+04 2,6527E+04 24 48000 8,0397E+03 2,3134E+04 2,7755E+04 25 50000 8,3869E+03 2,4195E+04 2,8991E+04 26 52000 8,7350E+03 2,5229E+04 3,0209E+04 27 54000 9,0811E+03 2,6291E+04 3,1433E+04 28 56000 9,4274E+03 2,7323E+04 3,2663E+04 29 58000 9,7720E+03 2,8370E+04 3,3873E+04 30 60000 1,0115E+04 2,9432E+04 3,5087E+04 31 62000 1,0459E+04 3,0460E+04 3,6308E+04 32 64000 1,0801E+04 3,1504E+04 3,7509E+04 33 66000 1,1142E+04 3,2568E+04 3,8716E+04 34 68000 1,1483E+04 3,3595E+04 3,9928E+04 35 70000 1,1823E+04 3,4641E+04 4,1122E+04 36 72000 1,2161E+04 3,5684E+04 4,2319E+04 37 74000 1,2499E+04 3,6745E+04 4,3521E+04 38 76000 1,2836E+04 3,7763E+04 4,4705E+04 39 78000 1,3173E+04 3,8803E+04 4,5894E+04 40 80000 1,3507E+04 3,9847E+04 4,7080E+04