design choices and equity implications of community shared ... · design choices and equity...
TRANSCRIPT
Design Choices and Equity Implications
of Community Shared Solar
Gabe Chan, University of Minnesota
Project Team: Matt Grimley, Ben Ihde, Isaac Evans, Poulomi Mazumder,
Elizabeth Arnold, Jacob Herbers, Maureen Hoffman, Jordan Morgan, Nick
Neuman, Ryan Streitz
USAEE/IAEE North American Conference
November 12-15, 2017

2
Will energy and environmental policies
make the world more or less fair?
Will considering fairness make energy
and environmental policies more or less
effective and politically durable?
Agenda
• Distributional impacts of solar deployment
• The community shared solar model
• Research methods
• Preliminary results
3
DISTRIBUTIONAL IMPACTS OF
SOLAR DEPLOYMENT
4
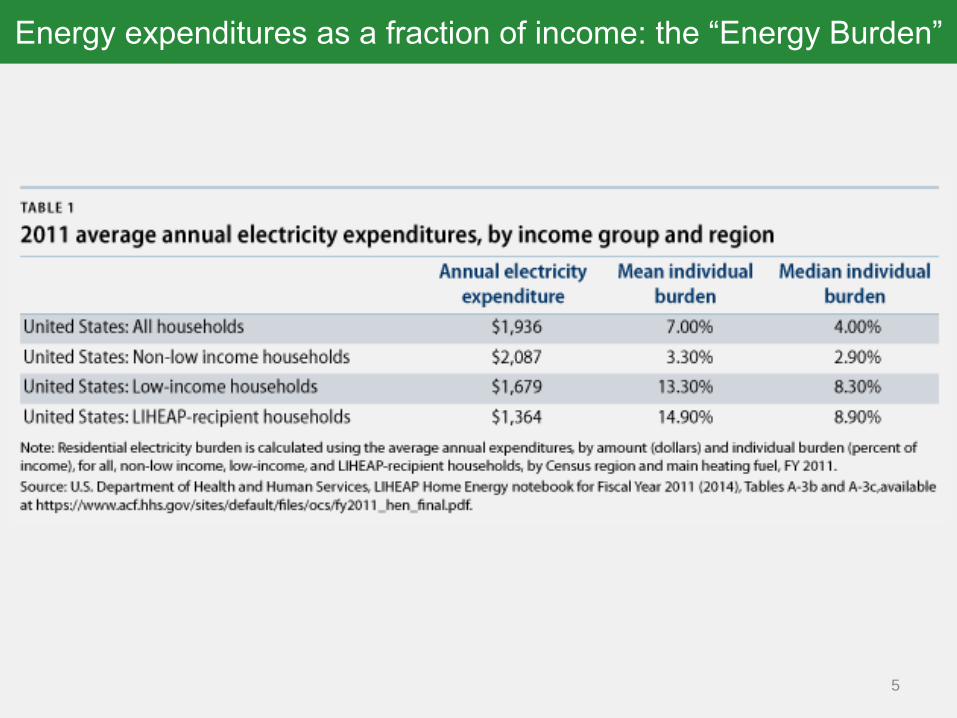
Energy expenditures as a fraction of income: the “Energy Burden”
5
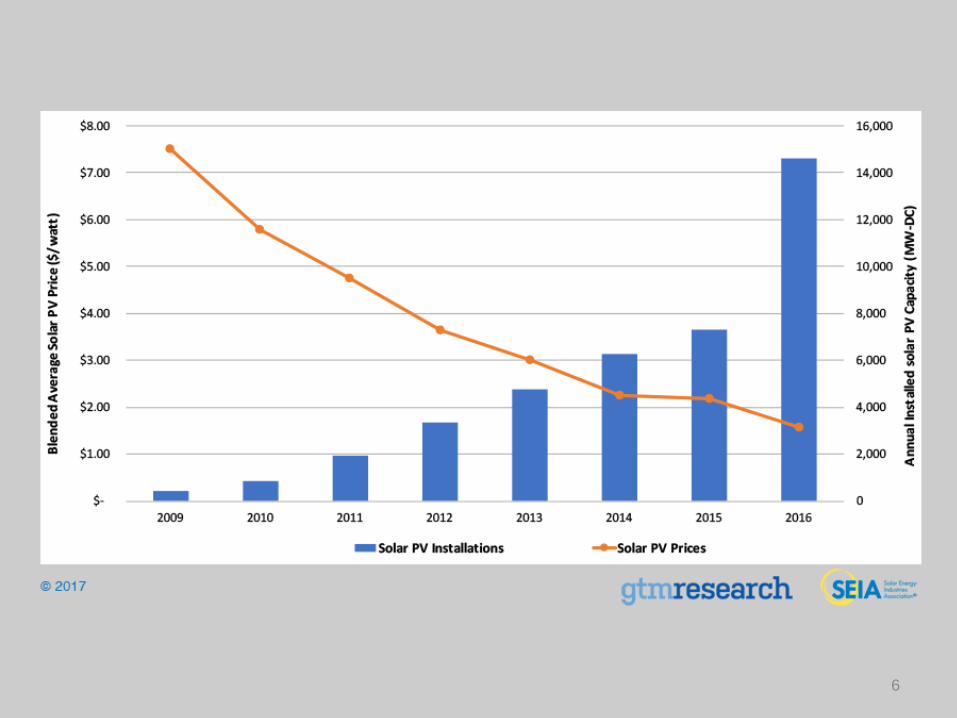
6
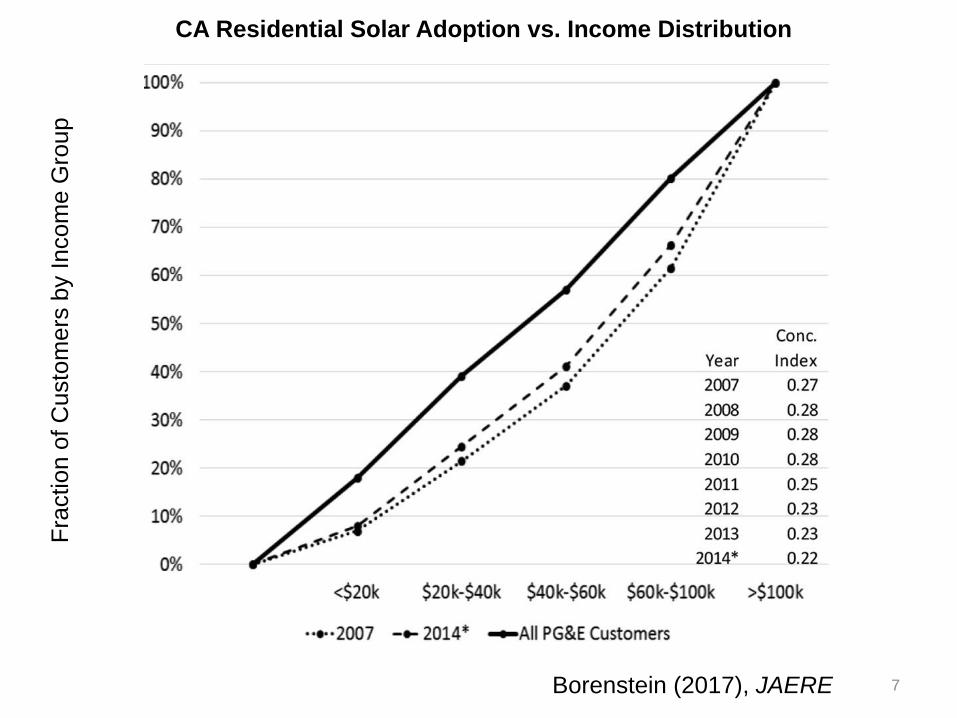
7Borenstein (2017), JAERE
Fra
ction o
f C
usto
mers
by Incom
e G
roup
CA Residential Solar Adoption vs. Income Distribution
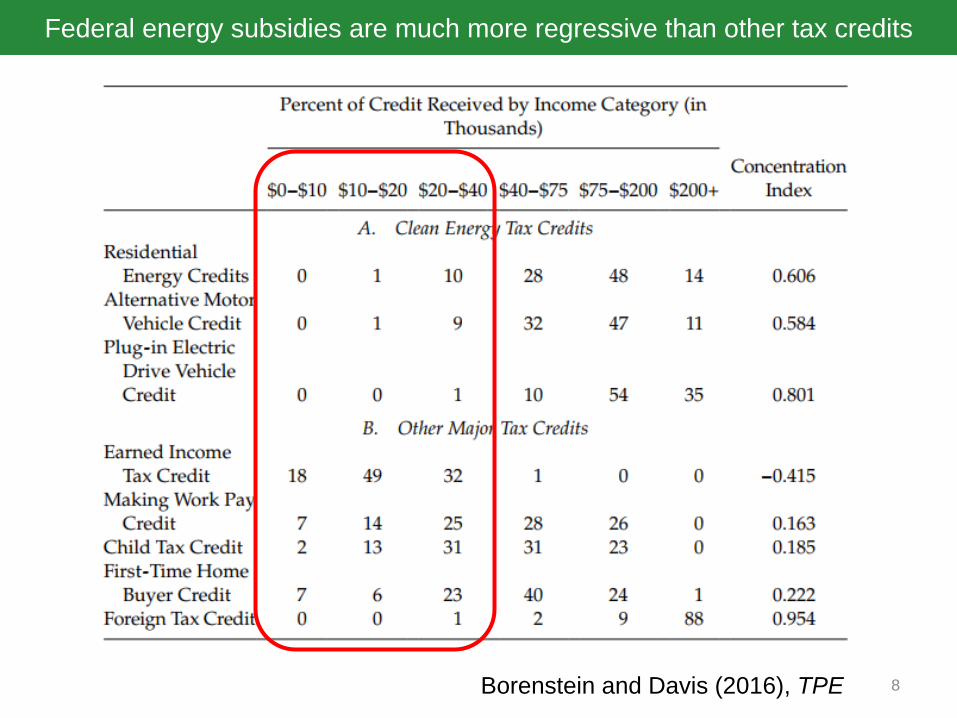
Federal energy subsidies are much more regressive than other tax credits
8Borenstein and Davis (2016), TPE
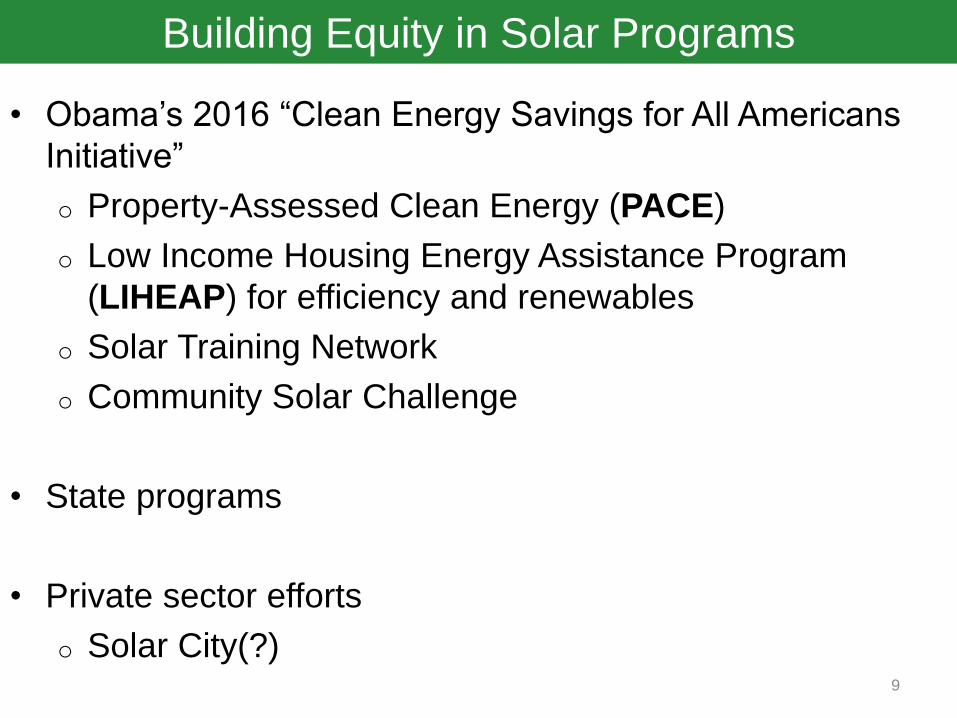
Building Equity in Solar Programs
• Obama’s 2016 “Clean Energy Savings for All Americans
Initiative”
o Property-Assessed Clean Energy (PACE)
o Low Income Housing Energy Assistance Program
(LIHEAP) for efficiency and renewables
o Solar Training Network
o Community Solar Challenge
• State programs
• Private sector efforts
o Solar City(?)9

COMMUNITY SHARED SOLAR
10
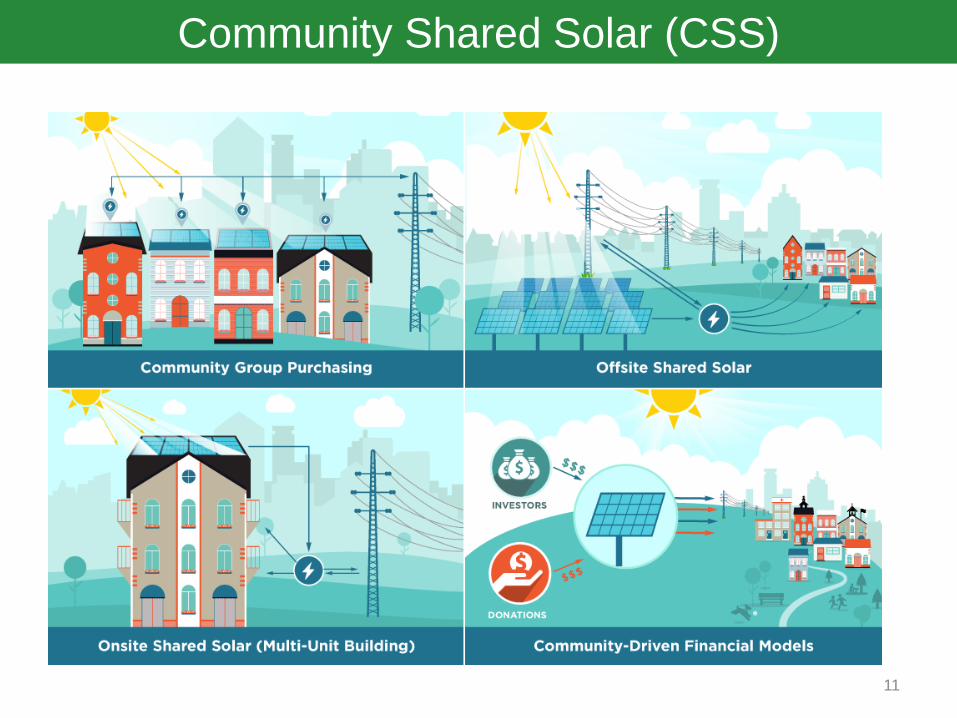
Community Shared Solar (CSS)
11
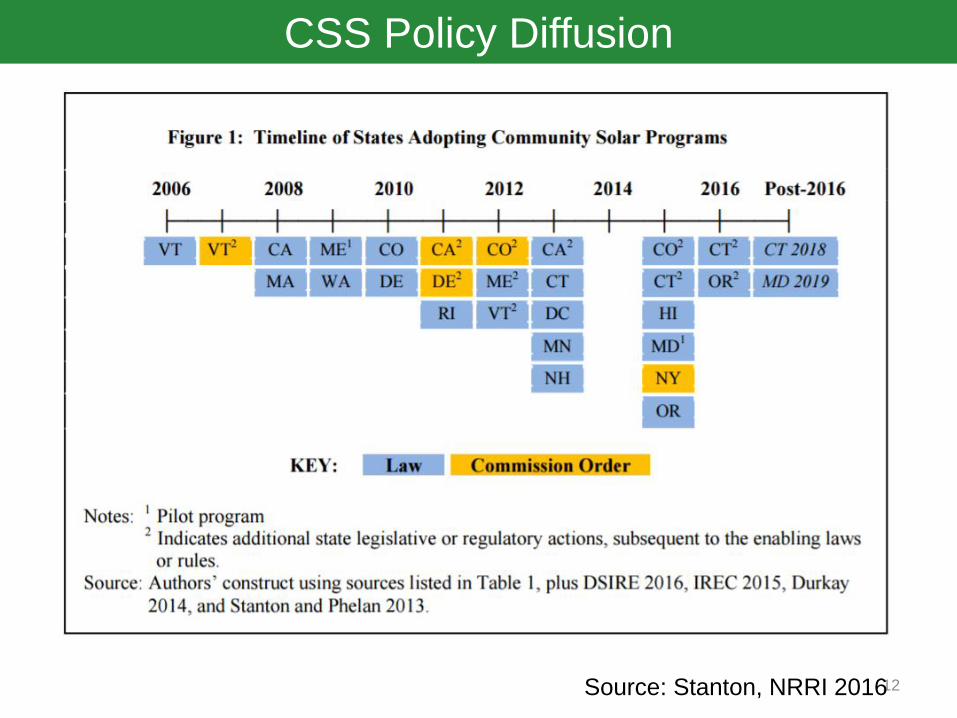
CSS Policy Diffusion
12Source: Stanton, NRRI 2016
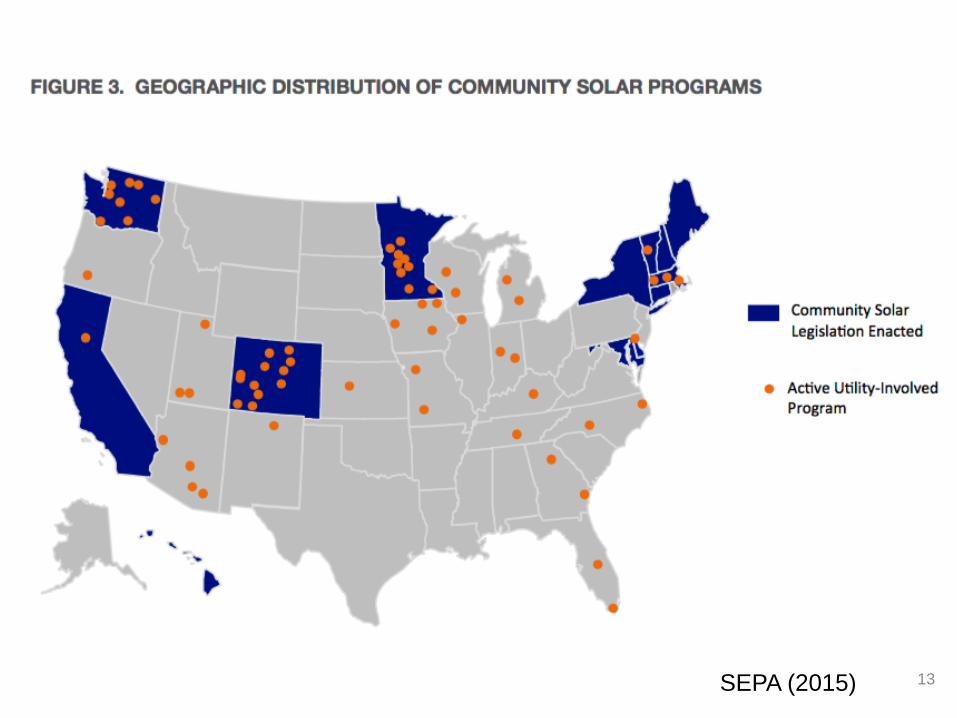
13SEPA (2015)

14ILSR (2017)
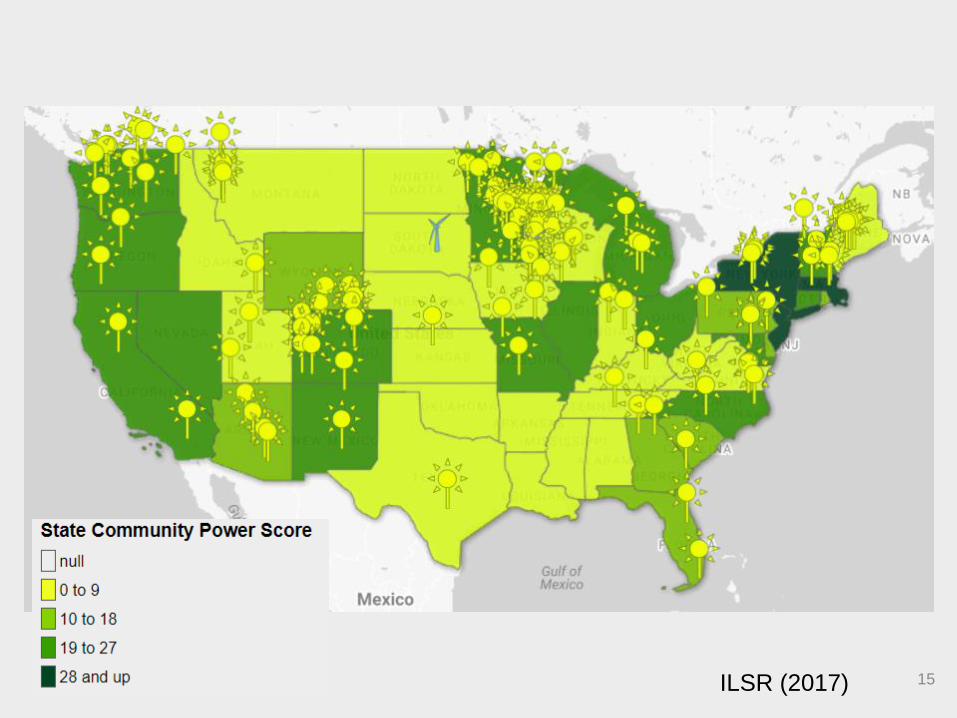
15ILSR (2017)
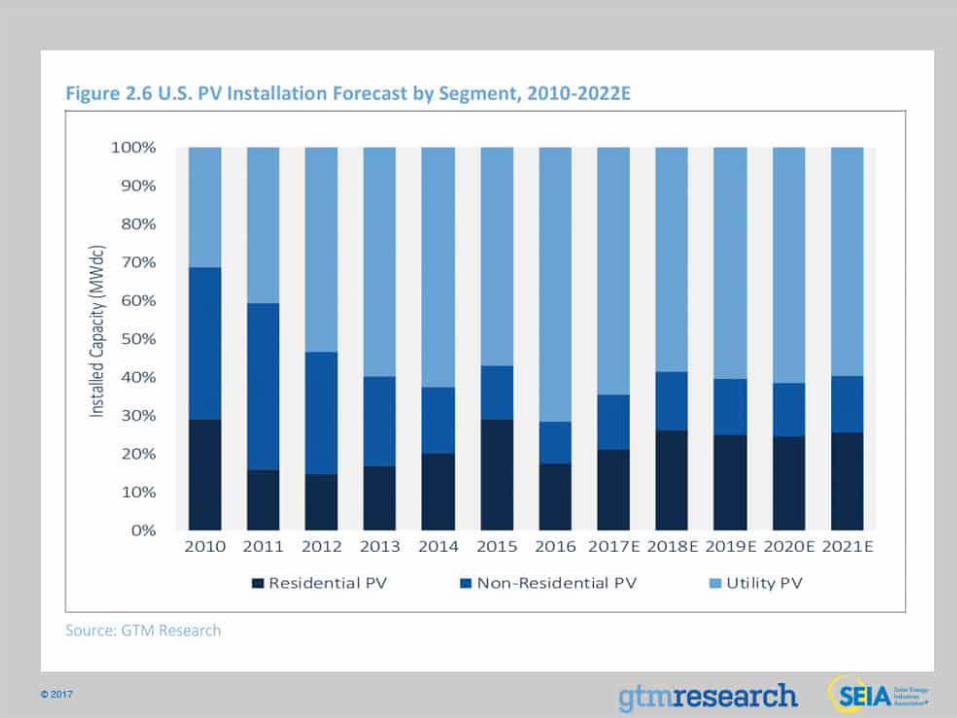
16
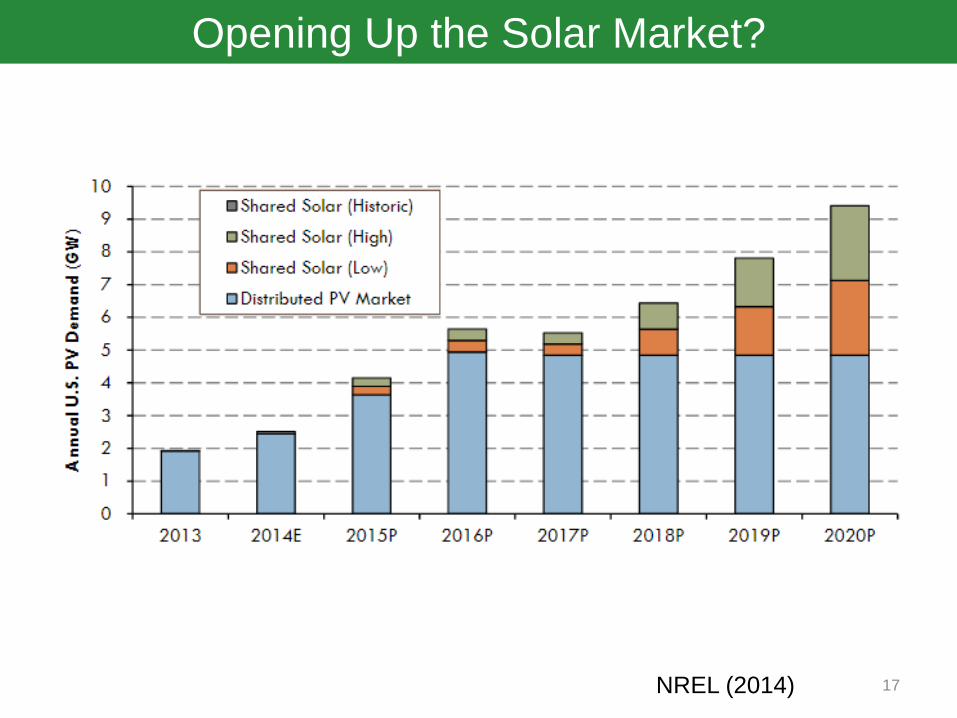
Opening Up the Solar Market?
17NREL (2014)
CSS Design Elements
• Ownership Model
18
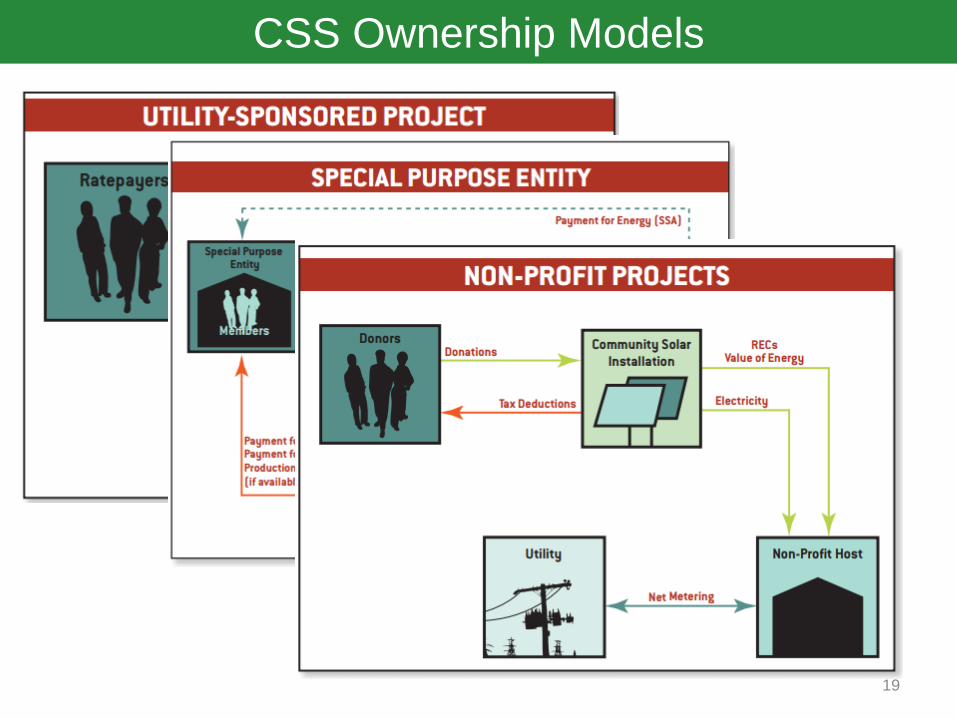
CSS Ownership Models
19
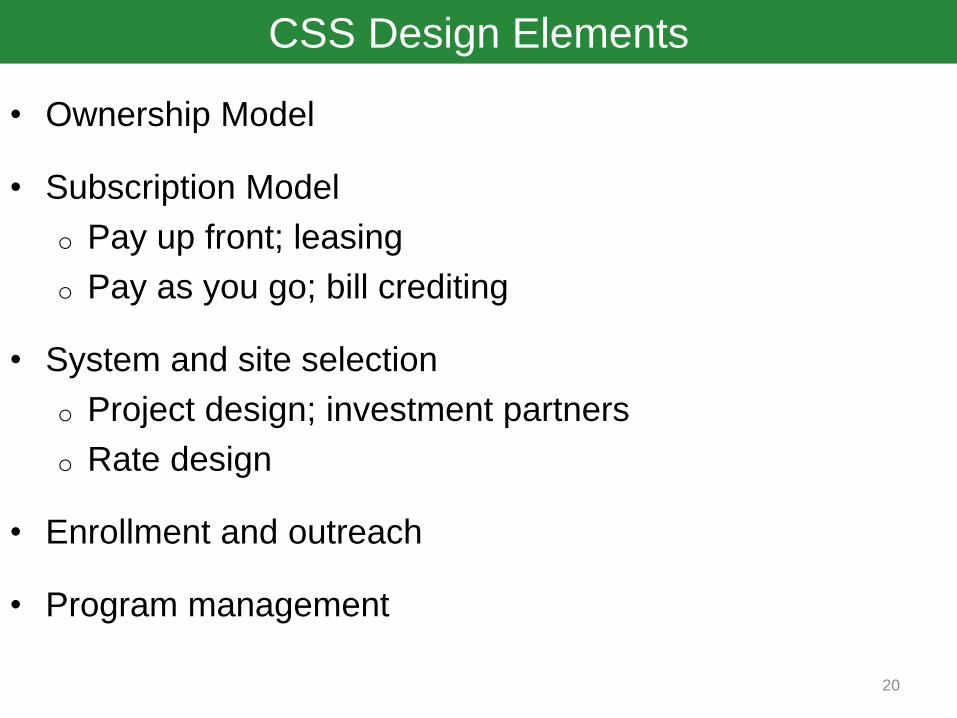
CSS Design Elements
• Ownership Model
• Subscription Model
o Pay up front; leasing
o Pay as you go; bill crediting
• System and site selection
o Project design; investment partners
o Rate design
• Enrollment and outreach
• Program management
20

Opportunities
Scale economies
Could open up access to
finance (flexible ownership)
Eased siting constraints;
siting opportunities
Eased participation
constraints: no building
ownership, roof space,
maintenance, etc.
Challenges
Requires greater institutional
support, coordination
Increased financing
requirements (scale)
Pushes 3rd-party owned DER
challenges further
Participation constraints may
be too low: no “community”
Other Considerations
How distributed? Who participates? Who pays?
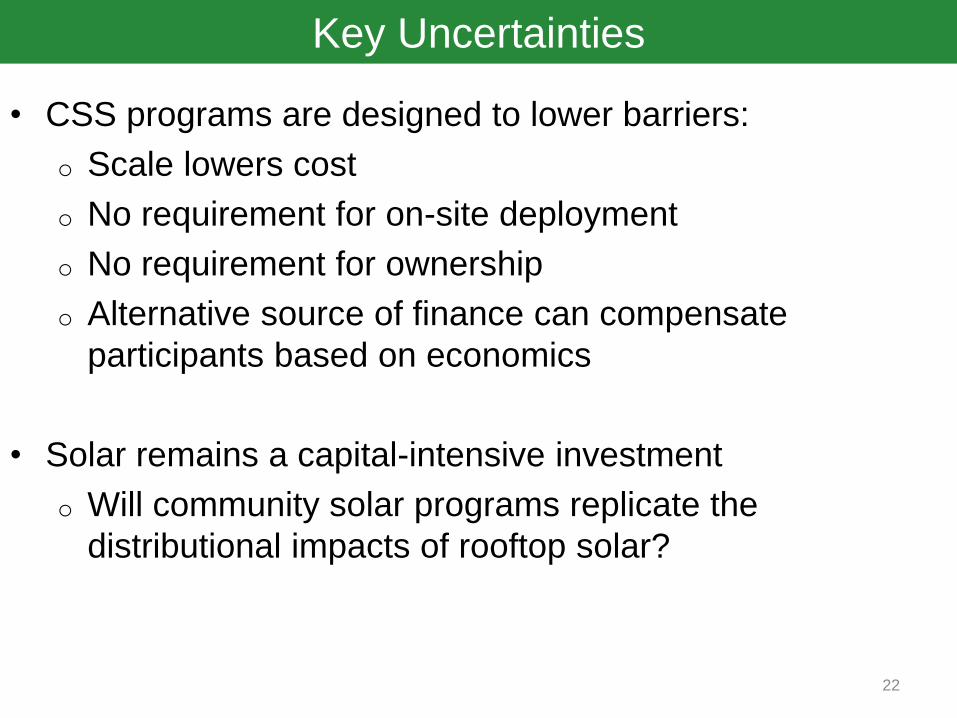
Key Uncertainties
• CSS programs are designed to lower barriers:
o Scale lowers cost
o No requirement for on-site deployment
o No requirement for ownership
o Alternative source of finance can compensate
participants based on economics
• Solar remains a capital-intensive investment
o Will community solar programs replicate the
distributional impacts of rooftop solar?
22

METHODS
23
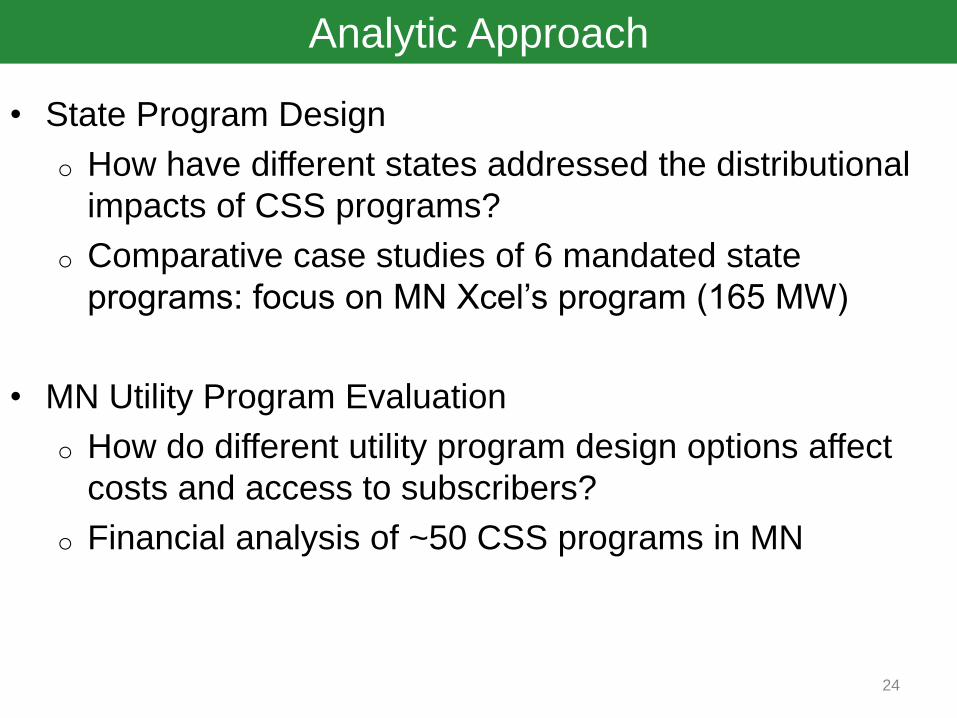
Analytic Approach
• State Program Design
o How have different states addressed the distributional
impacts of CSS programs?
o Comparative case studies of 6 mandated state
programs: focus on MN Xcel’s program (165 MW)
• MN Utility Program Evaluation
o How do different utility program design options affect
costs and access to subscribers?
o Financial analysis of ~50 CSS programs in MN
24

PRELIMINARY RESULTS:
STATE MANDATED PROGRAMS
25
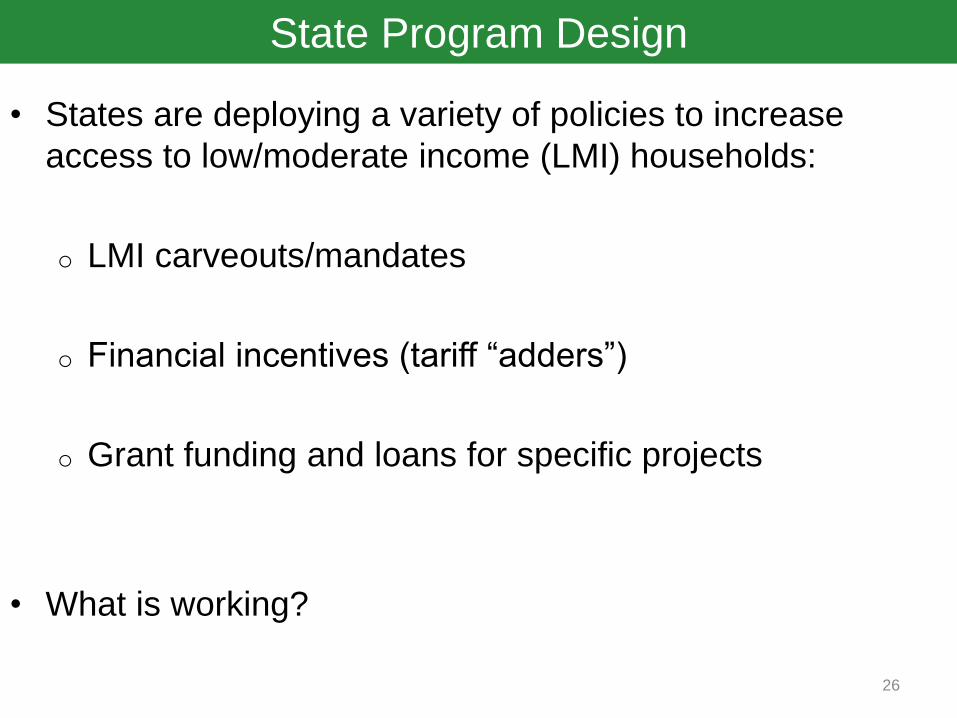
State Program Design
• States are deploying a variety of policies to increase
access to low/moderate income (LMI) households:
o LMI carveouts/mandates
o Financial incentives (tariff “adders”)
o Grant funding and loans for specific projects
• What is working?
26

State Program Design
27
California
(PG&E, SDG&E,
SCE)
Colorado
(Xcel, Black
Hills)
Maryland
(CSEGS Pilot)
Massachusetts
(NRG)
Minnesota
(Xcel)
New York
(NY-SUN)
CSS Capacity
(MW)22 30 0 99 165 3
CSS Planned
Capacity
(MW)
0 >20 53 0 604 794
Carve Out
20% for "most
disadvantaged";
10% for MASH
5% carve-out
10% carve-out;
30% to projects
in LMI areas
-- --
Carve-outs in
Phase I, then
removed
Tariff AdderUnder
consideration-- --
SREC-II and
SREC transfer
Under
consideration--
Grant
Funding
CSI: 10%
directed to LMI
until 2021
$1.2 mil to GRID
AlternativesSpecial Fund
MA Solar Loan
Program--
LMI CSS eligible
for several large
grants ($1.2 bil)
Other
Strategies
Subscription
goals,
certification,
capacity limits
0-down financing -- Anchor offtakers
Anchor
subscribers
(Minneapolis)
--
Siz
eL
MI P
rog
ram
s
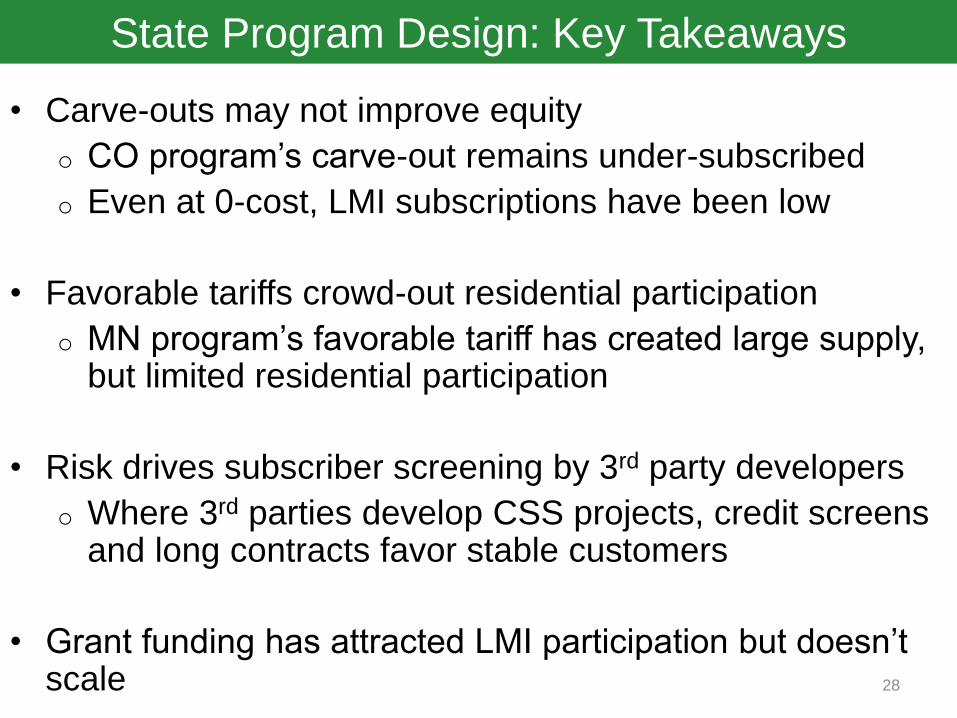
State Program Design: Key Takeaways
• Carve-outs may not improve equity
o CO program’s carve-out remains under-subscribed
o Even at 0-cost, LMI subscriptions have been low
• Favorable tariffs crowd-out residential participation
o MN program’s favorable tariff has created large supply, but limited residential participation
• Risk drives subscriber screening by 3rd party developers
o Where 3rd parties develop CSS projects, credit screens and long contracts favor stable customers
• Grant funding has attracted LMI participation but doesn’t scale 28
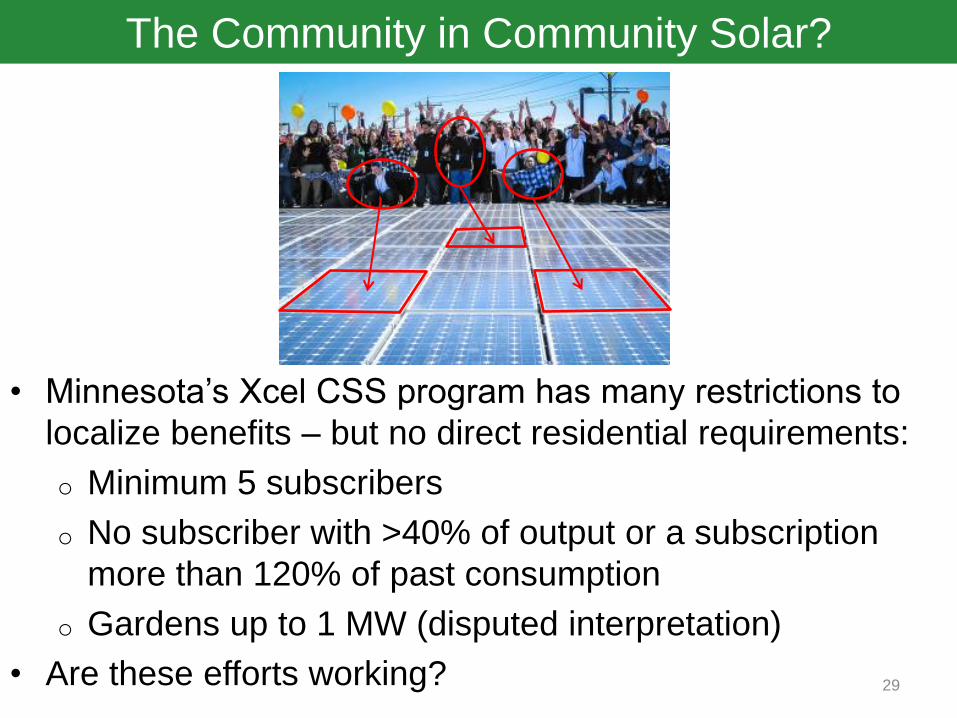
The Community in Community Solar?
29
• Minnesota’s Xcel CSS program has many restrictions to
localize benefits – but no direct residential requirements:
o Minimum 5 subscribers
o No subscriber with >40% of output or a subscription
more than 120% of past consumption
o Gardens up to 1 MW (disputed interpretation)
• Are these efforts working?

Distributional Impacts Remain Skewed
PRELIMINARY RESULTS:
MN CSS PROGRAMS
31
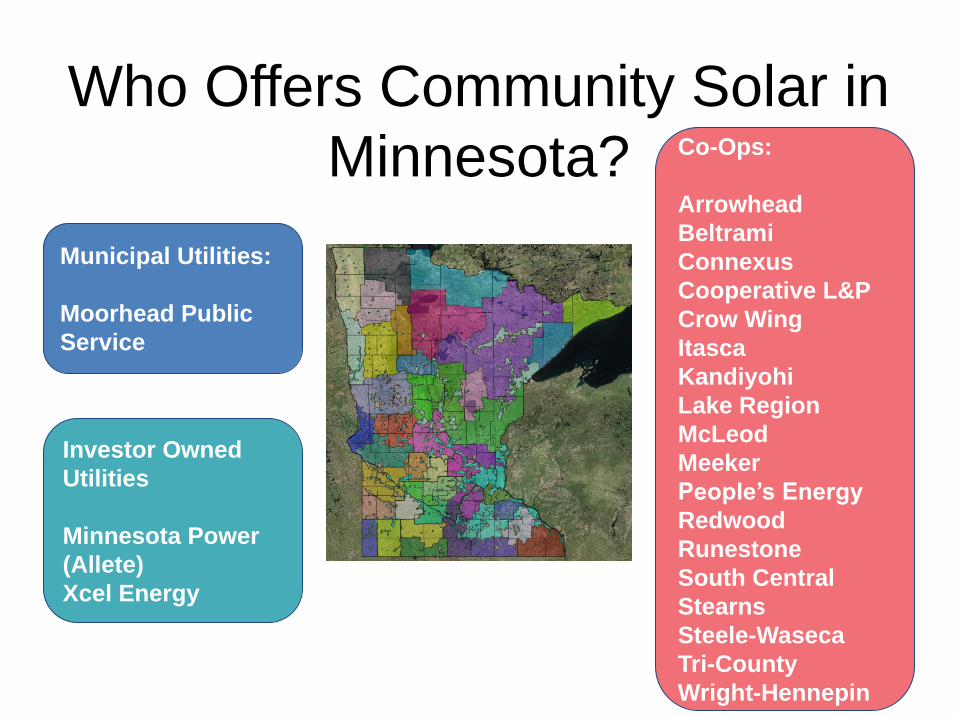
Who Offers Community Solar in
Minnesota?
Municipal Utilities:
Moorhead Public
Service
Investor Owned
Utilities
Minnesota Power
(Allete)
Xcel Energy
Co-Ops:
Arrowhead
Beltrami
Connexus
Cooperative L&P
Crow Wing
Itasca
Kandiyohi
Lake Region
McLeod
Meeker
People’s Energy
Redwood
Runestone
South Central
Stearns
Steele-Waseca
Tri-County
Wright-Hennepin

MN Utility Program Evaluation
33
0
2
4
6
8
10
12
14
16
50 - 45 45 - 40 40 - 35 35 - 30 30 - 25 25 - 20 20 - 15 15 - 10 10 - 5 5 - 0 +0 - +5
Nu
mb
er o
f C
SS C
on
trac
ts
Subscription NPV ($/W)
PAYG PUF/LL
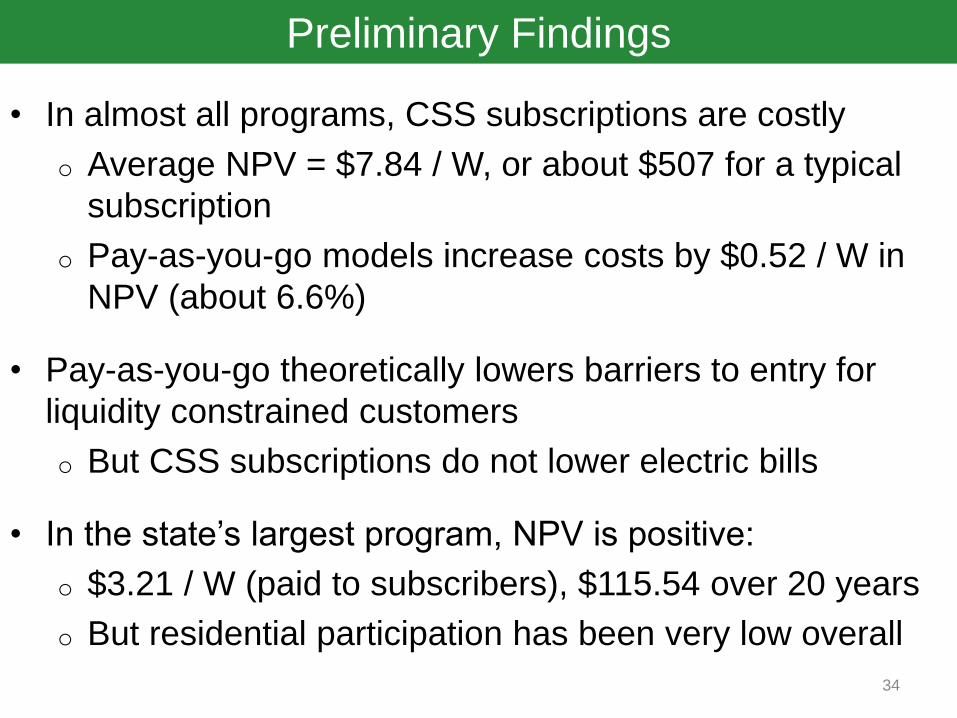
Preliminary Findings
• In almost all programs, CSS subscriptions are costly
o Average NPV = $7.84 / W, or about $507 for a typical
subscription
o Pay-as-you-go models increase costs by $0.52 / W in
NPV (about 6.6%)
• Pay-as-you-go theoretically lowers barriers to entry for
liquidity constrained customers
o But CSS subscriptions do not lower electric bills
• In the state’s largest program, NPV is positive:
o $3.21 / W (paid to subscribers), $115.54 over 20 years
o But residential participation has been very low overall
34
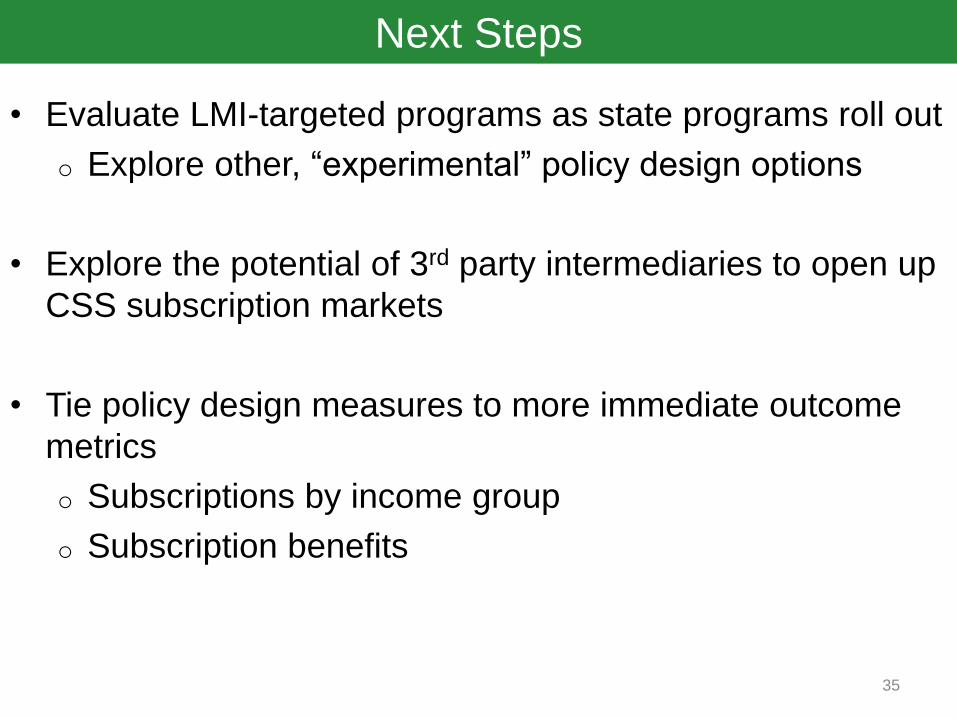
Next Steps
• Evaluate LMI-targeted programs as state programs roll out
o Explore other, “experimental” policy design options
• Explore the potential of 3rd party intermediaries to open up
CSS subscription markets
• Tie policy design measures to more immediate outcome
metrics
o Subscriptions by income group
o Subscription benefits
35
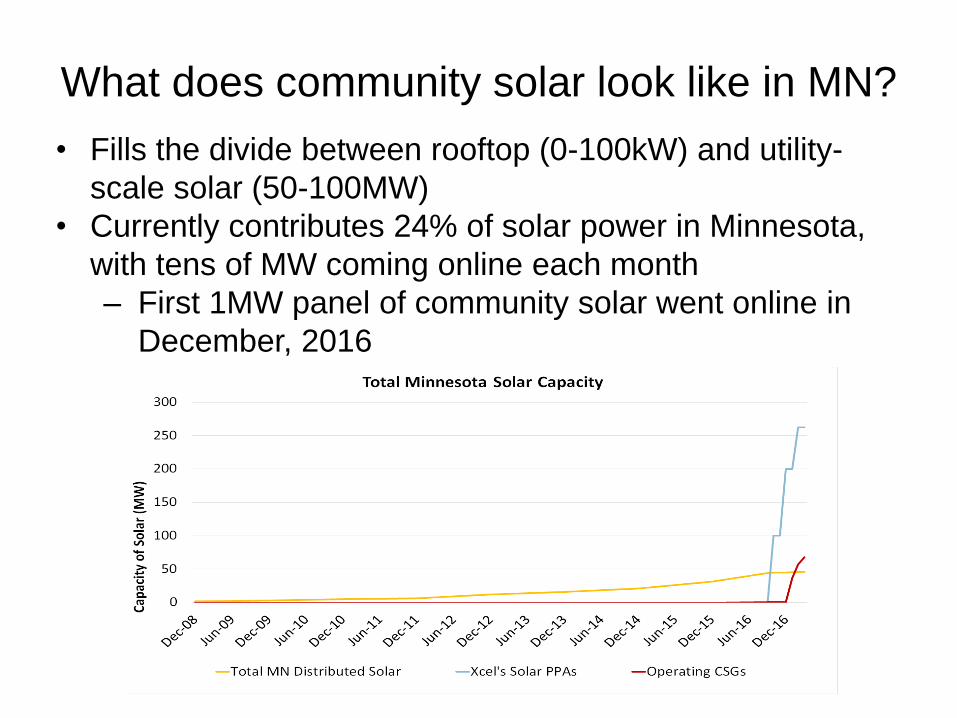
What does community solar look like in MN?
• Fills the divide between rooftop (0-100kW) and utility-
scale solar (50-100MW)
• Currently contributes 24% of solar power in Minnesota,
with tens of MW coming online each month
– First 1MW panel of community solar went online in
December, 2016