design experiments - mcgill university f. yates : statistical tables ... r. a. fisher (1925-1963)....
TRANSCRIPT

BY THE SAME AUTHOR :
Statistical Methods for Research Workers (1925-13th Ed. 1963)
Statistical Methods and Scienf+c Inferenre (1956, 1959)
The Theory of Inbreeding (1949, 1965)
WITH F. YATES : Statistical Tables
(19384th Ed. 1963)
All published by Oliver and Boyd Ltd., Edinburgh
The
Design of Experiments
Sir Ronald A. Fisher, Sc.D., F.R.S. Honorary Research Fejlow, Division of Mathematical Statistics, C.S.I.R.O., University of Adelaide; Foreign Associate, United States National Academy of Sciences, and Foreign Honorary Member, American Academy of Arts and Sciences; Foreign Member of the Swedish Royal Academy of Sciences, and the Royal Danish Academy of Sciences and Letters; Member of the Pontifical Academy; Member of the German Academy of Sciences (Leopoldina) ; formerly Galton Professor, University of London, and Arthur Balfour Professor
of Genetics, University of Cambridge
Oliver and Boyd Edinburgh: Tweeddale Court
London: 3ga Welbeck Street , W. I

PRINTED A N D PUBLISHED IN GREAT BRITAIN
BY OLIVER A N D BOYD LTD., EDINBURGH
I PREFACE TO FIRST EDITION i
I N 1925 the author wrote a book (Statistical Methods for Research Workers) with the object of supplying practical experimenters and, incidentally, teachers of mathematical statistics, with a connected account of the applications in laboratory work of some of the more recent advances in statistical theory. Some of the new methods, such as the analysis of variance, were found to be so intimately related with problems of experimental design that a considerable part of the eighth chapter was devoted to the technique of agricultural experimentation, and these sections have been progressively enlarged with subsequent editions, in response to frequent requests for a fuller treatment of the subject. The design of experiments is, however, too large a subject, and of too great importance to the general body of scientific workers, for any incidental treatment to be adequate. A clear grasp of simple and standardised statistical procedures will, as the reader may satisfy himself, go far to elucidate the principles of experimentation ; but these procedures are themselves only the means to a more important end. Their part is to satisfy the requirements of sound and intelligible experimental design, and to supply the machinery for unambiguous interpretation. T o attain a clear grasp of these requirements we need to study designs which have been widely successful in many fields, and to examine their structure in relation to the requirements of valid inference.
The examples chosen in this book are aimed at vii
26 T H E P R I N C I P L E S O F E X P E R I M E N T A T I O N
such an assessment would be inadmissible and irrelevant in judging the state of the scientific evidence ; more- over, accurately assessable prior information is ordin- arily known to be lacking. Such differences between the logical situations should be borne in mind whenever we see tests of significance spoken of as " Rules of Action ". A good deal of confusion has certainly been caused by the attempt to' formalise the exposition of tests of significance in a logical framework different from that for which they were in fact first developed.
REFERENCES AND OTHER READING
R. A. FISHER (1925-1963). Statistical methods for research workers. Chap. III., $8 15-19
R. A. FISHER (1926). The arrangement of field experiments. Journal of Ministry of Agriculture, xxxiii. 503-513.
A HISTORICAL EXPERIMENT ON GROWTH RATE
13. WE have illustrated a psycho-physical experiment, the result of which depends upon judgments, scored
1 1 " right " or wrong:" and may be appropriately interpreted by the method of the classical theory of probability. This method rests on the enumeration of the frequencies with which different combinations of right or wrong judgments will occur, on the hypo- thesis to be tested. We may now illustrate an experiment in which the results are expressed in quantitative measures, and which is appropriately interpreted by means of the theory of errors.
In the introductory remarks to his book on " The effects of cross and self-fertilisation in the vegetable kingdom,'' Charles Darwin gives an account of the considerations which guided him in the design of his
I experiments and in the presentation of his data, which will serve well to illustrate the principles on which biological experim'ents may be made conclusive. The passage is of especial interest in illustrating the extremely crude and unsatisfactory statistical methods available at the time, and the manner in which careful attention to commonsense considerations led to the adoption of an experimental design, in itself greatly superior to these methods of interpretation.
14. Darwin's Discussion of the Data
" I long doubted whether it was worth while to give the measurements of each separate plant, but have

2 8 EXPERIMENT O N GROWTH R A T E
decided to do so, in order that it may be seen that the superiority of the crossed plants over the self-fertilised does not commonly depend on the presence of two or three extra fine plants on the one side, or of a few very poor plants on the other side. Although several observers have insisted in general terms on the offspring from intercrossed varieties being superior to either parent-form, no precise measurements have beeA given ; and I have met with no observations on the effects of crossing and self-fertilising the individuals of the same variety. Moreover, experiments of this kind require so much t i m e m i n e having been continued during eleven years-that they are not likely soon to be repeated.
" A s only a moderate number of crossed and self- fertilised plants were measured, it was of great importance to me to learn how far the averages were trustworthy. I therefore asked Mr Galton, who has had much experi- ence in statistical researches, to examine some of my tables of measurements, seven in number, namely those of Zpomiza, Digitalis, Reseda lutea, Viola, Limnanthes, Petunia, and Zea. I may premise that if we took by chance a dozen or score of men belonging to two nations and measured them, it would I presume be very rash to form any judgment from such small numbers on their average heights. But the case is somewhat different with my crossed and self-fertilised plants, as they were of exactly the same age, were subjected from first to last to the same conditions, and were descended from the same parents. When only from two to six pairs of plants were measured, the results are manifestly of little or no value, except in so far as they confirm and are confirmed by experiments made on a larger scale with other species. I will now give the report on the seven tables of measurements,
GALTON'S M E T H O D O F I N T E R P R E T A T I O N 29
which Mr Galton has had the great kindness to draw up for me."
15. Galton's Method of Interpretation I I I have examined the measurements of the plants with
care, and by many statistical methods, to find out how far the means of the several sets represent constant realities, such as would come out the same so long as the general conditions of growth remained unaltered. The principal methods that were adopted are easily explained by selecting one of the shorter series of plants, say of 2ea mays, for an example.
" The observations as I received them are shown in columns I I. and I I I., where they certainly have no prima^ facie appearance of regularity. But as soon as we arrange them in the order of their mag~itudes, as in columns IV. and V., the case is materially altered. We now see, with few exceptions, that the largest plant on the crossed side in each pot exceeds the largest plant on the self-fertilised side, that the second exceeds the second, the third the third, and so on. Out of the fifteen cases in the table, there are only two exceptions to this rule.' We may therefore confidently affirm that a crossed series will always be found to exceed a self-fertilised series, within the range of the -
conditions under which the present experiment has been made. 11 Next as regards the numerical estimate of this excess.
I The mean values of the several groups are so discordant, as is shown in the table just given, that a fairly precise numerical estimate seems impossible. But the consideration arises, whether the difference between pot and pot may not be of
I much the same order of importance as that of the other conditions upon which the growth of the plants has been modified. If so, and only on that condition, it would follow that when all the measurements, either of the crossed or the self-fertilised plants, were combined into a single series, that
I series would be statistically regular. The experiment is tried in columns VII. and VIII., where the regularity is abundantly clear, and justifies us in considering its mean as perfectly reliable
* Galton evidently did not notice that this is true also before rearrange- ment.

E X P E R I M E N T O N G;RO;WTH R A T E I G A L T O N ' S M E T H O D O F I N T E R P R E T A T I O N 3 1
* b W i m 0000 VIN - - - -
I have protracted these measurements, and revised them in the usual way, by drawing a curve through them with a free hand, but the revision barely modifies the means derived from the original observations. In the present, and in nearly all the other cases, the difference between the original and revised means is under 2 per cent. of their value. I t is a very remarkable coincidence that in the seven kinds of plants, whose measure- ments I have examined, the ratio between the heights of the crossed and of the self-fertilised ranges in five cases within very narrow limits. In Zea mays it is as loo to 84, and in the others it ranges between loo to $76 and IOO to 86.
TABLE 2
" The determination of the variability (measured by what is technically called the ' probable error ') is a problem of more delicacy than that of determining the means, and I doubt, after making many trials, whether it is possible to derive useful conclusions from these few observations. We ought to have measurements of at least fifty plants in each case, in order to be in a position to deduce fair results. . . . ,1
" Mr Galton sent me at the same time graphical representations which he had made of the measurements, and they evidently form fairly regular curves. He appends the words ' very good ' to those of Zea and Limnanthes. He also calculated the average height of the crossed and self-fertilised plants in the seven tables by a more correct method than that followed by me, namely by including, the heights, as estimated in accordance with statistical rules, of a few plants which
b.
Pot.
I. . . 11. . . 111. . IV. .
Self-fert.
19%
:& I 6
Crossed.
18% 20p 21Q I*
Difference.
foil -I*
-43 -3%

32 E X P E R I M E N T O N G R O W T H R A T E
died before they were measured ; whereas I merely added up the heights of the survivors, and divided the sum by their number. The difference in our results is in one way highly satisfactory, for the average heights of the self-fertilised plants, as deduced by Mr Galton, is less than mine in all the cases excepting one, in which our averages are the same ; and this shows that I have by no means exaggerated the superiority of the crossed over the self-fertilised plants."
16. Pairing and Grouping
It is seen that the method of comparison adopted by Darwin is that of pitting each self-fertilised plant against a cross-fertilised one, in conditions made as equal as possible. The pairs so chosen for comparison had germinated at the same time, and the soil conditions in which they grew were largely equalised by planting in the same pot. Necessarily they were not of the same parentage, as it would be difficult in maize to self- fertilise two plants at the same time as raising a cross- fertilised progeny from the pair. However, the parents were presumably grown from the same batch of seed. The evident object of these precautions is to increase the sensitiveness of the experiment, by making such differences in growth rate as were to be observed as little as possible dependent from environmental circumstances, and as much as possible, therefore, from intrinsic differences due to their mode of origin.
The method of pairing, which is much used in modern biological work, illustrates well the way in which an appropriate experimental design is able to reconcile two desiderata, which sometimes a ear to P be in conflict. On the one hand we require the utmost uniformity in the biological material, which is the subject of experiment, in order to increase the sensitiveness
I P A I R I N G A N D G R O U P I N G 3 3
1
i of each individual observation; and, on the other, we require to multiply the observations so as to demon- strate so far as possible the reliability and consistency of the results. Thus an experimenter with field crops may desire to replicate his experiments upon a large number of plots, but be deterred by the consideration that his facilities allow him to sow only a limited area
I
on the same day. An experimenter with small mammals I may have only a limited supply of an inbred and highly
~ uniform stock, whic$ he believes to be particularly desirable for experimental purposes. Or, he may desire to carry out his experiments on members of the same
1 litter, and feel that his experiment is limited by the size of the largest litter he can obtain. I t has indeed frequently been argued that, beyond a certain moderate degree, further replication can give no further increase I in precision, owing to the increasing heterogeneity with I
which, it is thought, it must be accompanied. In all these cases, however, and in the many analogous cases which constantly arise, there is no real dilemma. Uniformity is only requisite between the objects whose response is to be contrasted (that is, objects treated differently). I t is not requisite that all the parallel plots under the same treatment shall be sown on the same
I day, but only that each such plot shall be sown so far 1 as possible simultaneously with the differently treated
plot or plots with which it is to be compared. If, there- I
fore, only two kinds of treatments are under examina- tion, pairs of plots may be chosen, one plot for each treatment ; and the precision of the experiment will be given its highest value if the members of each pair
I are treated closely alike, but will gain nothing from I I similarity of treatment applied to different pairs, nor I lose anything if the conditions in these are somewhat , varied. In the same way, if the numbers of animals
C

34 E X P E R I M E N T O N G R O W T H R A T E
available from any inbred line are too few for adequate replication, the experimental contrasts in treatments may be applied to pairs of animals from different inbred lines, so long as each pair belongs to the same line. In these two cases it is evident that the principle of combining similarity between controls to be compared, with diversity between parallels, may be extended to cases where three or more treatments are under @vest;- gation. The requirement that animals to be contrasted must come from the same litter limits, not the amount of replication, but the number of different treatments that can be so tested. Thus we might test three, but not so easily four or five treatments, if it were necessary that each set of animals must be of the same sex and litter. Paucity of homogeneous material limits the number of different treatments in an experiment, not the number of replications. I t may cramp the scope and comprehensiveness of an experimental enquiry, but sets no limit to its possible precision.
17. " Student's " t Test * Owing to the historical accident that the theory of
errors, by which quantitative data are to be interpreted, was developed without reference to experimental methods, the vital principle has often been overlooked that the actual and physical conduct of an experiment must govern the statistical procedure of its interpreta- tion. In using the theory of errors we rely for our con- clusion upon one or more estimates of error, derived from the data, and appropriate to the one or more sets
* A full account of this test in more varied applications, and the tables for its use, will be found in Siaiisiical Meikudr fw Research Workers. Its originator, who published anonymously under the pseudonym " Student," possesses the remarkable distinction that, without being a professed mathematician, but a research chemist, he made early in life this revolutionary refinement of the classical theory of errors.
" S T U D E N T ' S T E S T " 3 5
of comparisons which we wish to make. Whether' these estimates are valid, for the purpose for which we intend them, depends on what has been actually done. I t is possible, and indeed it is all too frequent, for an experiment to be so conducted that no valid estimate of error is available. In such a case the experiment cannot be said, strictly, to be capable of proving any- thing. Perhaps it should not, in this case, be called an experiment at all, but be added merely to the body of experience on which, h r lack of anything better, we may have to base our opinions. All that we need to emphasise immediately is that, if an experiment does allow us to calculate a valid estimate of error, its struc- ture must completely determine the statistical procedure by which this estimate is to be calculated. If this were not so, no interpretation of the data could ever be unambiguous ; for we could never be sure that some other equally valid method of interpretation would not lead to a different result.
The object of the experiment is to determine whether the difference in origin between inbred and cross-bred plants influences their growth rate, as measured by height at a given date ; in other words, if the numbers of the two sorts of plants were to be increased indefinitely, our object is to determine whether the average heights, to which these two aggregates of plants will tend; are equal or unequal. The most general statement of our null hypothesis is, therefore, that the limits to which these two averages tend are equal. The theory of errors enables us to test a somewhat more limited hypothesis, which, by wide experience, has been found to be appropriate to the metrical characters of experi-' mental material in biology. The disturbing causes which introduce discrepancies in the means of measure- ments of similar material are found to produce quanti-

3 6 E X P E R I M E N T ON G R O W T H R A T E " S T U D E N T ' S " T E S T 37
tative effects which conform satisfactorily to a theoretical distribution known as the normal law of frequency of error. I t is this circumstance that makes it appropriate to choose, as the null hypothesis to be tested, one for which an exact statistical criterion is available, namely that the two groups of measurements are samples drawn from the same normal population. On the basis of this hypothesis we may proceed to compare the average difference in height, between the cross-fertilised and the self-fertilised plants, with such differences as might be expected between these averages, in view of the observed discrepancies between the heights of plants of like origin.
We must now see how the adoption of the method of pairing determines the details of the arithmetical procedure, so as to lead to an unequivocal interpreta- tion. The pairing procedure, as indeed was its purpose, has equalised any differences in soil conditions, illumina- tion, air-currents, etc., in which the several pairs of individuals may differ. Such differences having been eliminated from the experimental comparisons, and contributing nothing to the real errors of our experiment, must, for this reason, be eliminated likewise from our estimate of error, upon which we are to judge what differences between the means are compatible with the null hypothesis, and what differences are so great as to be incompatible with it. We are therefore not con- cerned with the differences in height among plants of like origin, but only with differences in height between members of the same pair, and with the discrepancies among these differences observed in different pairs. Our first step, therefore, will be to subtract from the height of each cross-fertilised plant the height of the self-fertilised plant belonging to the same pair. The differences are shown below in eighths of an inch.
With respect to these differences our null hypothesis asserts that they are normally distributed about a mean value at zero, and we have to test whether our 15 observed differences are compatible with the supposition that they are a sample from such a population.
TABLE 3
Dzferences in eighth of an inch 6etzpreen cross- and self-fertilised plants of the same pair
The calculations needed to make a rigorous test of the null hypothesis stated above involve no more than the sum, and th,e sum of the squares, of these numbers. The sum is 314, and, since there are 15 plants, the
mean difference is 2 0 3 in favour of the cross-fertilised 1 S -
plants. The sum of the squares is 26,518, and from this is deducted the product of the total and the mean, or 6573, leaving 19,945 for the sum of squares of devia- tions from the mean, representing discrepancies among the differences observed in the 15 pairs. The algebraic fact here used is that
S ( X - ~ ) ~ = S(x2)-2S(x)
where S stands for summation over the sample, and f for the mean value of the observed differences, x.
We may make from this measure of the discrepancies an estimate of a quantity known as the variance of an individual difference, by dividing by 14, one less than the number of pairs observed. Equally, and what is more immediately required, we may make an estimate of the variance of the mean of 15 such pairs, by dividing again by r 5, a process which yields 94.976 as the estimate.

3 8 E X P E R I M E N T O N G R O W T H R A T E F A L L A C I O U S M E T H O D S 39
The square root of the variance is known as the standard error, and it is by the ratio which our observed mean difference bears to its standard error that we shall judge of its significance. Dividing our difference, 20.933, by its standard error 9.746, we find this ratio (which is usually denoted by t) to be 2.148.
The object of these calculations has been to obtain from the data a quantity measuring the average differ- ence in height between the cross-fertilised and the self- fertilised plants, in terms of the observed discrepancies among these differences ; and which, moreover, shall be distributed in a known manner when the null hypo- thesis is true. The mathematical distribution for our present problem was discovered by " Student " in 1908, and depends only upon the number of independent comparisons (or the number of degrees of freedom) available for calculating the estimate of error. With 15 observed differences we have among them 14 inde- pendent discrepancies, and our degrees of freedom are 14. The available tables of the distribution of t show that for 14 degrees of freedom the value 2.145 is exceeded by chance, either in the positive or negative direction, in exactly 5 per cent. of random trials. The observed value o f t , 2.148, thus just exceeds the 5 per cent. point, and the experimental result may be judged significant, though barely so.
i 18. Fallacious Use of Statistics
We may now see that Darwin's judgment was perfectly sound, in judging that it was of importance to learn how far the averages were trustworthy, and that this could be done by a statistical examination of the tables of measurements of individual plants, though not of their averages. The example chosen, in fact, falls just on the border-line between those results which
can suffice by themselves to establish the point at issue, and those which are of little value except in so far as they confirm or are confirmed by other experiments of a like nature. In particular, it is to be noted that
I
Darwin recognised that the reliability of the result must be judged by the consistency of the superiority of the crossed plants over the self-fertilised, and not only on the difference of the averages, which might depend, as he says, on the presence of two or three extra-fine plants on the one side, or of a few very poor plants on the other side ; and that therefore the pre- sentation of the experimental evidence depended essen- tially on giving the measurements of each independent plant, and could not be assessed from the mere averages.
I t may be noted also that Galton's scepticism of the value of the probable error, deduced from only 15 pairs of observations, though, as it turned out, somewhat
, excessive, was undoubtedly right in principle. The standard error (of which the probable error is only a conventional fraction) can only be estimated with con- siderable uncertainty from so small a sample, and,
T
prior to " Student's " solution of the problem, it was
i by no means clear to what extent this uncertainty would invalidate the test of significance. From " Student's " work it is now known that the cause for anxiety was not so great as it might have seemed. Had the standard error been known with certainty, or derived from an effectively infinite number of observations, the 5 per cent. value of t would have been 1.960. When our estimate is based upon only 15 differences, the 5 per cent. value, as we have seen, is 2.145, or less than
, 10 per cent. greater. Even using the inexact theory available at the time, a calculation of the probable error would have provided a valuable guide to the interpretation of the results.

q
2-L
2
cd
u8
c
.- 2 a
.- u
.2
&2
C"-
cd $ Q
.2
c 0
- I-, -2s
z'a5 t: .5 5
2
cd *
2c
%
Ss: r
nk
a.2
d
YQ
Q
+i-
z.5 g
r3 $4
E a
0~
.3
2 $ &
='a a.3
a
XC
~E
,Q
)o
aJ
c
z "5
cd g .2
M +
rn
C~
0
'"
.2 c
3
.2
2 42
- c
.2 2
2.2 e
l;" 42 aJ Y
,Z
75 .s a .B
al
l u
rn
+,
aJ ,
75 g5.;
7
, oc
,
C E
0
42
0, cd
c I+
.@
QJ
aJ
uo
I-,3
h
a t:
o
3 g
u.2
42
0
=',
CU
>
ba
-5
I-,
rn c
c,
% Q
) '-
0
C
Q
00
5
% 2 3
I-, h
5g
.S-g
~
M2
2
f - 7
, ;c
do
-Q,
.S
c~
z8
a
- .2 7
c
a , %
E 2
u
$'"o
25
+2
" '-c cd
3 z .5 .$
- -dc
gg
4
.S.2
c
, I
-,
U+
,0
7
V)
I-,
0
ca
o
LC
aJ
5
03 E
C 4
2
, 2
- Q.5
c G
g.5 7
3 cd
I-,$
G
- I-,
uc
g
7 a
h.?
O
g
.2 2
%
8
"5
.r( 7
I-,,
2 g a
o
o >
=
e- h"0
cd a
2
42
aJ +,
cd'Z , I+
d'"
"3 $
cd 6
$8
gI-
, d
ud
0
c 0
2 E
-k
u
7
QJ
--- c
dC
.2
I-, (d
""b
d.-"E
Q
g,g
; aaJ= 2
0
.c+
03
2 a
8
Q,
O
ac
>
0.
i
cd aJ
I-,
0 .5
G
I-, .-
0
- :: 0 Q,

4 2 E X P E R I M E N T O N G R O W T H R A T E V A L I D I T Y 4 3
estimate, this estimate will be vitiated, and will be incapable of providing a correct statement as to the frequency with which our real error will exceed any assigned quantity ; and such a statement of frequency is the sole purpose for which the estimate is of any use. Nevertheless, though its logical necessity is easily apprehended, the question of the validity of the estimates of error used in tests of significance was for long ignored, and is still often overlooked in practice. One reason for this is that standardised methods of statistical analysis have been taken over ready-made from a mathematical theory, into which questions of experimental detail do not explicitly enter. In consequence the assumptions which enter implicitly into the bases of the theory have not been brought prominently under the notice of practical experimenters. A second reason is that it has not until recently been recognised that any simple precaution would supply an absolute guarantee of the validity of the calculations.
In the experiment under consideration, apart from chance differences in the selection of seeds, the sole source of the experimental error in the average of our fifteen differences lies in the differences in soil fertility, illumination, evaporation, etc., which make the site of each crossed plant more or less favourable to growth than the site assigned to the corresponding self-fertilised plant. I t is for this reason that every precaution, such as mixing the soil, equalising the watering and orienting the pot so as to give equal illumination, may be expected to increase the precision of the experiment. If, now, when the fifteen pairs of sites have been chosen, and in so doing all the differences in environmental circum- stances, to which the members of the different pairs will be exposed during the course of the experiment, have been predetermined, we then assign a t random,
as by tossing a coin, which site shall be occupied by the crossed and which by the self-fertilised plant, we shall be assigning by the same act whether this particular ingredient of error shall appear in our average with a positive or a negative sign. Since each particular error has thus an equal and independent chance of being positive or negative, the error of our average will necessarily be distributed in a sampling distribution, centred a t zero, which will be symmetrical in the sense that to each possible pjositive error there corresponds an equal negative error, which, as our procedure guaran- tees, will in fact occur with equal probability.
Our estimate of error is easily seen to depend only on the same fifteen ingredients, and the arithmetical processes of summation, subwaction and division may be designed, and have in fact been designed, so as to provide the estimate appropriate to the system of chances which our method of choosing sites had imposed on the data. This is to say much more than merely that the experiment is unbiased, for we might still call the experiment unbiased if the whole of the cross- fertilised plants had been assigned to the west side of the pots, and the self-fertilised plants to the east side, by a single toss of the coin. That this would be in- sufficient to ensure the validity of our estimate may be easily seen ; for it might well be that some unknown circumstance, such as the incidence of different illumina- tion a t different times of the day, or the desiccating action of the air-currents prevalent in the greenhouse, might systematically favour all the plants on one side over those on the other. The effect of any such pre- vailing cause would then be confounded with the advantage, real or apparent, of cross-breeding over inbreeding, and would be eliminated from our estimate of error, which is based solely on the discrepancies

4 4 E X P E R I M E N T O N G R O W T H R A T E G E N E R A L T E S T 4 5
between the differences shown by different pairs of plants. Randomisation properly carried out, in which each pair of plants are assigned their positions independently a t random, ensures that the estimates of error will take proper care of all such causes of different growth rates, and relieves the experimenter from the anxiety of considering and estimating the magnitude of the in- numerable causes by which his data may be disturbed. The one flaw in Darwin's procedure was the absence of randomisation.
Had the same measurements been obtained from 1 pairs of plants properly randomised the experiment
would, as we have shown, have fallen on the verge of significance. Galton was led greatly to overestimate its conclusiveness through the major error of attempting to estimate the reliability of the comparisons by re- arranging the two series in order of magnitude. His discussion shows, in other respects, an over-confidence in the power of statistical methods to remedy the irregularities of the actual data. In particular, the attempt mentioned by Darwin to improve on the simple averages of the two series " by a more correct method . . . by including the heights, as estimated in accord- ance with statistical rules, of a few plants which died before they were measured," seems to go far beyond the limits of justifiable inference, and is one of many indications that the logic of statistical induction was in its infancy, even a t a time when the technique of accurate experimentation had already been notably advanced.
21. Test of a Wider Hypothesis
I t has been mentioned that " Student's " t test, in conformity with the classicaI theory of errors, is appro- priate to the null hypothesis that the two groups of measurements are samples drawn from the same normally
distributed population. This is the type of null hypo- thesis which experimenters, rightly in the author's opinion, usually consider it appropriate to test, for reasons not only of practical convenience, but because the unique properties of the normal distribution make it alone suitable for general application. There has, however, in recent years, been a tendency for theoretical statisticians, not closely in touch with the requirements of experimental data, to stress the element of normality, in the hypothesis tested, as though it were a serious limitation to the test applied. I t is, indeed, demonstrable that, as a test of this hypothesis, the exactitude of " Student's " t test is absolute. I t may, nevertheless, be legitimately asked whether we should obtain a materially different result were it possible to test the wider hypothesis which merely asserts that the two series are drawn from the same population, without specifying that this is normally distributed.
In these discussions it seems to have escaped recogni- tion that the physical act of randomisation, which, as has been shown, is necessary for the validity of any test of significance, affords the means, in respect of any particular body of data, of examining the wider hypo- thesis in which no normality of distribution is implied. The arithmetical procedure of such an examination is tedious, and we shall only give the results of its appli- cation in order to show the possibility of an independent check on the more expeditious methods in common use.
On the hypothesis that the two series of seeds are random samples from identical populations, and that their sites have been assigned to members of each pair independently at random, the 15 differences of Table 3 would each have occurred with equal frequency with a positive or with a negative sign. Their sum, taking account of the two negative signs which have actually

G E N E R A L T E S T 4 7 46 E X P E R I M E N T O N G R O W T H R A T E
occurred, is 314, and we may ask how many of the 216
numbers, which may be formed by giving each com- ponent alternatively a positive and a negative sign, exceed this value. Since ex hy9othesi each of these 216 combinations will occur by chance with equal frequency, a knowledge of how many of them are equal to or greater than the value actually observed affords a direct arithmetical test of the significance of this value.
I t is easy to see that if there were no negative signs, or only one, every possible combination would exceed 314, while if the negative signs are 7 or mme, every possible combination will fall short of this value. The distribution of the cases, when there are from 2 to 6 negative values, is shown in the following table :-
TABLE 4
Number of combinations of dzferences, positive or negative, which exceed or fall short of the total observed
In just 863 cases out of 32,768 the total deviation will have a positive value as great as or greater than that observed. In an equal number of cases it will have as great a negative value. The two groups together constitute 5.267 per cent. of the possibilities available,
a result very nearly equivalent to that obtained using the t test with the hypothesis of a normally distributed population. Slight as it is, indeed, the difference between the tests of these two hypotheses is partly due to the continuity of the t distribution, which effectively counts only half of the 28 cases which give a total of exactly 314, as being as great as or greater than the observed value.
Both tests prove that, in about 5 per cent. of trials, samples from the same;batch of seed would show differ- ences just as great, and as regular, as those observed ; so that the experimental evidence is scarcely sufficient to stand alone. In conjunction with other experiments, however, showing a consistent advantage of cross- fertilised seed, the experiment has considerable weight ; since only once in 40 trials would a chance deviation have been observed both so large, and in the right direction.
How entirely appropriate to the present problem is the use of the distribution of t, based on the theory of errors, when accurately carried out, may be seen by inserting an adjustment, which effectively allows for the discontinuity of the measurements. This adjustment is not usually of practical importance, with the t test, and is only given here to show the close similarity of the results of testing the two hypotheses, in one of which the errors are distributed according to the normal law, whereas in the other they may be distributed in any conceivable manner. The adjustment " consists in calculating the value of t as though the total difference between the two sets of measurements were less than that actually observed by half a unit of grouping;
Number of negative values.
-
0 . I 2 . 3 . : 4 . 5 . 6 . 7 or more .
Total . -
+ This adjustment is an extension to the distribution of t of ' ~a te s ' adjustment for continuity, which is of greater importance in the distribution of xa, for which it was developed.
(314
...
. . . 10
189 1,052 2,853 4,982 22,819
3 1,905
>314
I
15 94
Total.
I
I 5 105 45 5
1,365 3,003 S*OO5 22,819
32,968
= 314
. . .
. . . I
'63 , 3 I I 302
138 22
. . .
835
I2 I
...
28

4 8 E X P E R I M E N T O N G R O W T H R A T E
i.e. as if it were 313 instead of 314, since the possible values advance by steps of 2. The value of t is then found to be 2.139 instead of 2.148. The following table shows the effect of the adjustment on the test of significance, and its relation to the test of the more general hypothesis.
TABLE 5 Probability of a Positive Difference exceeding that
1. observed. unadjusted . 2.148 2.485 per cent. Normal hypothesis{adjusted . 2.139 2'529 , ,
General hypothesis . 2.634 ,,
The difference between the two hypotheses is thus . - equivalent to little more than a probability of one in a thousand.
21.1. " Non-parametric " Tests
In recent years tests using the physical act of randomisation to supply (on the Null Hypothesis) a frequency distribution, have been largely advocated under the name of " Non-parametric " tests. Some- what extravagant claims have often been made on their behalf. The example of this Chapter, published in 1935, was by many years the first of its class. The reader will realise that it was in no sense put forward to super- sede the common and expeditious tests based on the Gaussian theory of errors. The utility of such non- parametric tests consists in their being able to supply confirmation whenever, rightly or, more often, wrongly, it is suspected that the simpler tests have been appre- ciably injured by departures from normality.
They assume less knowledge, or more ignorance, of the experimental material than do the standald tests, and this has been an attraction to some mathematicians who often discuss experimentation without personal
G E N E R A L T E S T 4 9
knowledge of the material. In inductive logic, however, an erroneous assumption of ignorance is not innocuous ; it often leads to manifest absurdities. Experimenters should remember that they and their colleagues usually know more about the kind of material they are dealing with than do the authors of text-books written without such personal experience, and that a more complex, or less intelligible, test is not likely to serve their purpose better, in any sense, than those of proved value in their own subject. i
REFERENCES AND OTHER READING
C. DARWIN (1876). The effects of cross- and self-fertilisation in the vegetable kingdom. John Murray, London.
R. A. FISHER (1925). Applications of " Student's " distribution. Metron, v. 90-104.
R. A. FISHER (1925-1963). Statistical methods for research workers. Chap. V., §§ 23-24.
R. A. FISHER (1956, 1959). Statistical methods and scientific inference. Oliver and Boyd Ltd., Edinburgh.
" STUDENT " (1908). The probable error of a mean. Biometrika, vi. 1-25.

.w 9'2 k,~-, BIRTHS AND DEATHS IN LONDON,
1853. VOL XIV.) WEEK EMIMC) SATUSDAY, NOYEMBEE 26. [No. 48.
-'m OF mDmot Dul?muO TEE -
rpoV CBO- IX I)rel'lUCTE IIUPPUED BY WAT&P COXPlWIEk
Aggregrte of DistriotD sopplied chiefly by the reqeetive
Water Comjmuies. Death
WW CiUfI* h u m s d s~pply. *levstion Deaths film t0 100,OM) in feet
Nov. 19.
&=x - - - - 39 2362286 698 30 -.
*(l)%-rsd Springe at Earn- and 80 166956 8 5 (2) NewBira, . Kenmod, two d
rolls, mxl New Rim. New E d - - At C h a d d Springs in 76 €84468 55 9
H d d d k e , from river Lee, and fom wells in MXdlesex and Her&
&and Jun* - TheThames, 360 yards above 38 109636 14 13 Xew Bridge.
C h h - - TheThamea,atBat&rnea- 7 122147 22 18 Kent - - TheBavms-ingent 18 134300 30 22 Warnid- - Thc'hu&,it- - 72 277700 R4 SO
Inndon - The river Ime, at Lee 26 484694 144 33 Bridge.
*(l)'fambethlrna The !lhmea, at Thsmes 1 846563 211 61 ( 2 ) k t B . w t D i i l r n d a t -
Sortthwk - The Thamea at Battaws - 8 11826i 111 94 * (1 )&dmrk T h b ! t h m a , r t m 0 17806 19 101
(2) b t * the Ravemibourne in Kent, ud ditahes aidwalk
* h 1 ~ a a r ( I 8 l u L e d # h 8 n ~ ) t b e m r e d h t r i o t r y e ~ p p ~ d b g t W O o O m p a U .
C48.1 3 c
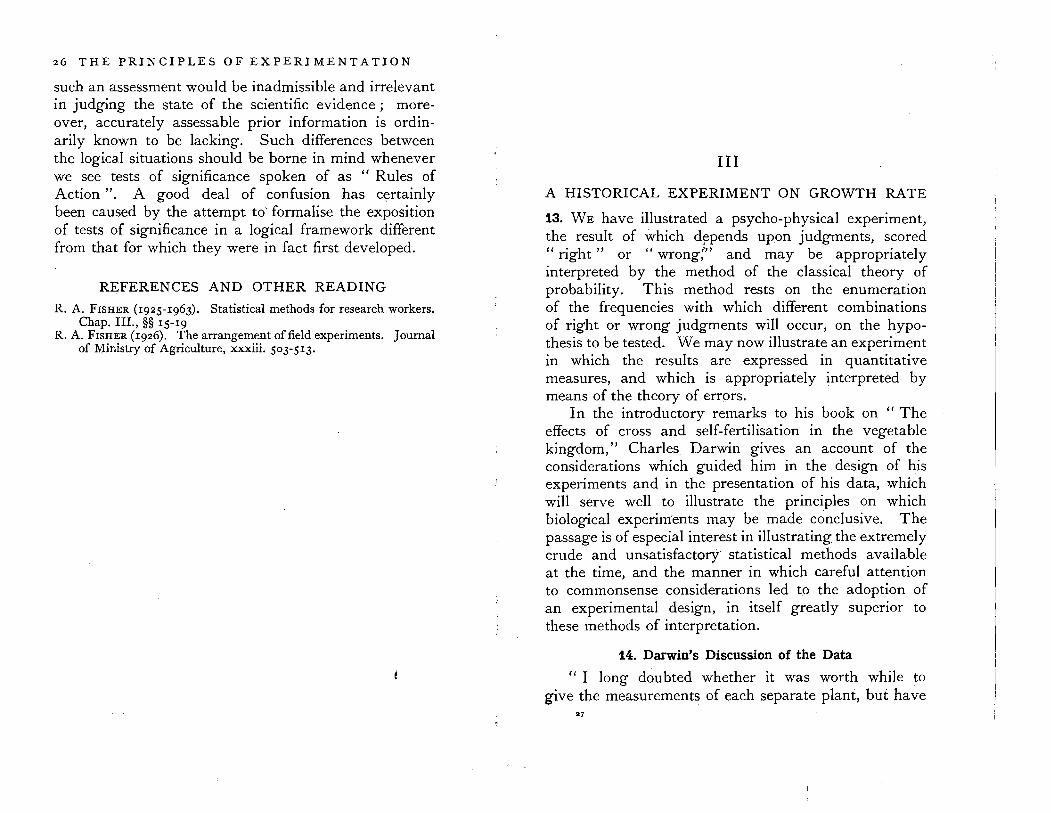
Figure 10.2. Weekly Return of Births and Deaths ( 26 IVovember 1853).

- b t ~ 9 . T b e m e ~ a d y t e m - k e m a greuzau. m ur: - "- "- ------- h ~ 6 6 . S q htbs4mek8thntfbRowedit m i 1 4 8 ~ 9 ~ , 45*7°,~8-50* aod(&tweek) 36-7'.
Intheten ' g reels# of the gem 1845-511 the average number of death6 was 1093, *- --on to inorar of popdation, h m m a 120% mere is an eulep in last *&*I nQPlln, to 137.
DkwrPrdtber have ~ ~ ~ m o t e f b l ; t b t y r o a c f i t o m 1 8 0 h t b e ~ronr~Zt"ZTi~!.tBLchrw~- h m a w 1% f t o m nlolu ~ ~ r i r t r ~ w b t b c ~ ~ r b ~ g r r ~ d ~is~16tmi!?Y3SZ,ith ~ t o ~ m a d s a . a n i i ~ a r a ~ ~ d l ~ l t o & ~ p e m m IatbsML4*cdL. of ~ ~ ~ ~ a d k 8 4 8 4 9 ( r e o k ~ Q t o m l 4 ~ t O c t o b e ? i L ~ e d C r 2 9 ~ ; h ~ ~ n ~ b a a f w e e h of* prerent a& ~0mmmoing41st of1 744* or 315 pmm mamtbrnintbtdkmwr. BcdtbaspSdemicbeginnin a t r a d e r ~ i n 1 8 S S , t h t m e S n t e a ~ ~ b m a n r m a r e i n g e ~ ~ ~ , m d &inB drnapoe for eO. tbim Qa W or.p#P mScbt u n d to conclade that the -per nor pre-a more vi2dent-x &at d 1848.
-. a m applisd chie4ly by the m p m t i t e
'Water Compurie;~.
Ele~tion in feet
e : y !ze m.
Di?atbsfrom C h o h
in 18w& ending
Nov. 19.
Deaths to 100,000 IdubiEants*
-d (2) gsnt* the h w k a r o s i n Kent, I P l d l t o b D l d r a l L . 1 , I I ' ~ t h n r e a # r ( n u r t e d ~ m u o s r i a ) t b e w l l v e ~ u a ~ p p ~ d ~ ~ o ~
fAQ 1 3 c
t
~ X D O H - * ( l ) 5 p 8 & i d d (2) New M.
Nml&irer - - (h.snd Jun- - C h b - - Eat - - wertlldiddkSE!x- a London -
39
80
76
38
3 18 79 26
- . - - - 8@l@8 at h p t d and
EQIvaod, two orterian r a h , and Nem Ever.
At C!hadwell 8- in Herttbrddh fwm river Lee, and foar wells in BWdlesex snd Be*
TheThames, 360 pards above Bkw Bridge.
! r h e T h a m + b t ~ ~ - T h e I L a a v ~ l o W h U T h c U a t m - The river I&. at Lee
2362236
166956
684468
109656
122147 134300 977700 434694
I
698 1 SO - 8
55
14
22 : SO
84 144
5
9
13
18 22 SO 33
