design, fabrication and evaluation of negative …
TRANSCRIPT
DESIGN, FABRICATION AND EVALUATION OF NEGATIVE STIFFNESS ELEMENTS
Lia Kashdan, Dr. Carolyn Seepersad, Dr. Michael Haberman, Dr. Preston S.Wilson Mechanical Engineering Department
University of Texas at Austin, Austin, TX, 78712
Abstract
Recent research has shown that constrained bistable structures can display negative stiffness behavior and provide extremal vibrational and acoustical absorptive capacity. These bistable structures are therefore compelling candidates for constructing new metamaterials for noise reduction, anechoic coatings, and backing materials for broadband imaging transducers. To date, demonstrations of these capabilities have been primarily theoretical, because the geometry of bistable elements is difficult to construct and refine with conventional manufacturing methods and materials. The objective of this research is to exploit the geometric design freedoms provided by selective laser sintering (SLS) technology to design and construct constrained bistable structures with negative stiffness behavior. The static and dynamic behaviors of resulting bistable structures are experimentally investigated. Initial bistable designs and test results are presented in this paper.
1. Introduction
Negative stiffness elements have been identified as unique mechanisms for enhancing acoustical and vibrational damping. Examples of negative stiffness mechanisms include mechanical systems with negative spring constants (Prasad, 1991) and materials with negative moduli (Lakes, 2001a, 2001b). Negative stiffness elements contribute to damping behavior because they tend to assist rather than resist deformation as a result of internally stored energy (Lakes, 2001a, 2001b).

Figure 1: Stages of snap-through movement of a buckled beam. (i) The beam is in an initial stable buckled state. (ii) A force is applied to the spring and sends the beam to the meta-stable state. (iii) The spring is constrained, and a slight change in displacement sends the beam to (iv) the second stable buckled state.
Image from Haberman, 2007.
A simple negative stiffness structure can be created from a buckled beam, as illustrated in Figure 1. Such systems are bistable when unconstrained and include one metastable equilibrium point. Figure 1 illustrates a buckled beam with pinned ends moving though the three points of equilibrium. In (i) the beam is in the first stable equilibrium state and when a force is applied, it is pushed to the metastable state (ii-iii) and through to the second stable state (iv).
Figure 2: Plot of the force vs. displacement of the center of a beam in the transverse direction. The line with x’s represents a beam that is critically buckled, while the line with circles represents a beam that is past the critical buckling range and is displaying negative stiffness in the region marked k<0. The solid line shows the response for an unbuckled beam. The stages of snap-through in the buckled beam on the left are marked on the graph.
Image from Haberman, 2007.
-0.01 -0.008 -0.006 -0.004 -0.002 0 0.002 0.004 0.006 0.008 0.01
-6
-4
-2
0
2
4
6
Normalized Transverse Force of a Beam with Axial Load vs. Normalized Transverse Displacement
Normalized Transverse Displacement @ Midpoint, !norm, ()
Nor
mal
ized
Tra
nsve
rse
Forc
e @
Mid
poin
t, F no
rm, (
) L = L0Faxial=PcritBuckled
k < 0
(1)(2)
(3)
Transverse Displacement
Force vs. Transverse Displacement
Forc
e
(1)
F(x1)
(2)
F(x2)
(3)
F(x3)
1D Example:Post-buckled Beam

Figure 3: Plot of strain energy vs. transient displacement. Points (1), (2) and (3) match those in Figure 2 as well as the legend for the unbuckled, critically buckled and completely buckled states. Image from Haberman, 2007.
The force versus transverse displacement of a buckled beam is plotted in Figure 2, and the strain energy versus transverse displacement is plotted in Figure 3. In both figures, the behavior of a completely buckled beam is plotted alongside the behavior of an unbuckled beam. As illustrated in Figure 3, the equilibrium positions of the buckled beam correspond to local minima and maxima of the strain energy curve. Since the stiffness of the beam corresponds to the spatial derivative of its strain energy, the buckled beam exhibits negative stiffness over the interval indicated in Figure 2. Therefore, negative stiffness can be elicited by applying a transverse force to the center of a beam in state (1) or state (3), each of which is characterized by a strain energy minimum, and transiting the metastable state (2). The buckled beam is a simple 1D example of a bistable structure, and negative stiffness behavior is implicit to constrained bistable elements of any configuration (Prasad, 2006; Qiu, 2004).
This behavior has been confirmed by experimental studies of buckled tubes and carbon nanotubes which found decreased force with increasing strain response and higher damping levels for buckled tubes relative to unbuckled tubes under sinusoidal forcing (Lakes, 2000; Yap, 2007). These findings confirm that buckled beams are negative stiffness elements under specific conditions and that they can therefore be used for damping purposes. However, it is difficult iteratively design and tune negative stiffness elements with conventionally manufacturing methods. Our research is focused on designing, tuning, and testing negative stiffness elements by fabricating them with SLS technology. This research is part of a larger project to test these mechanisms at macroscopic scales and then miniaturize them to create metamaterials or waveguides with very high damping capacity.
The process of using additive manufacturing technologies to create structures or materials that provide acoustic or vibrational damping has not been studied extensively.
-0.01 -0.008 -0.006 -0.004 -0.002 0 0.002 0.004 0.006 0.008 0.01
-0.5
0
0.5
1
1.5
2
2.5
3
3.5
4Normalized Strain Energy of a Beam with Axial Load vs. Normalized Transverse Displacement
Normalized Transverse Displacement @ Midpoint, !norm, ()
Nor
mal
ized
Stra
in E
nerg
y, U
norm
, ()
L = L0Faxial = PcritBuckled
Strain Energy vs. Trans. Displacement
Trans. Displacement
Stra
in E
nerg
y(1)
(2)
(3)

For example, SLS has been used to produce a passive destructive interference acoustic absorber (Godbold, 2007). The absorber minimized sound at specific frequencies by sending acoustic waves through two channels of different lengths thereby creating destructive interference at the exit. However, destructive interference is very different from the negative stiffness mechanism investigated in this research, and negative stiffness has not been investigated with SLS technology. SLS offers the benefit of increased design freedom for fine-tuning the geometry, rapidly iterating through design permutations, and consolidating parts, relative to conventional manufacturing techniques.
2. Research Methodology
The methodology for the research study is presented in Figure 4. This paper follows the methodology through the initial macroscale design phase and reports results of material characterization and design, fabrication, and testing of macroscale designs. Future work will involve miniaturizing our results into smaller-scale and multiscale designs and tuning those designs for specific examples. The results of task clarification are reported in Section 3, followed by materials characterization in Section 4, and macroscale design and empirical testing results in Section 5.
Figure 4: Research Methodology
Task!Clarification!
• Research• Design!Planning
Material!Characterization
• Determine!!Nylon!11!Properties
• Young’s!Modulus• Shear!Modulus• Loss!Factor
Initial!Macroscale Design
• Design!negative!stiffness!structures!using!Nylon!11!and!SLS!technology
• Test!structure• Analyze!results!and!iterate!as!necessary
Multi"scale!Design
• Design!and!build!complex!systems
•Meta"materials• 1"D!waveguides
Implementation
• Design!and!test!negative!stiffness!structures!for!targeted!applications• Transducer!backings• Absorptive!coatings!
3. Task Clarification and Overall Experimental Design
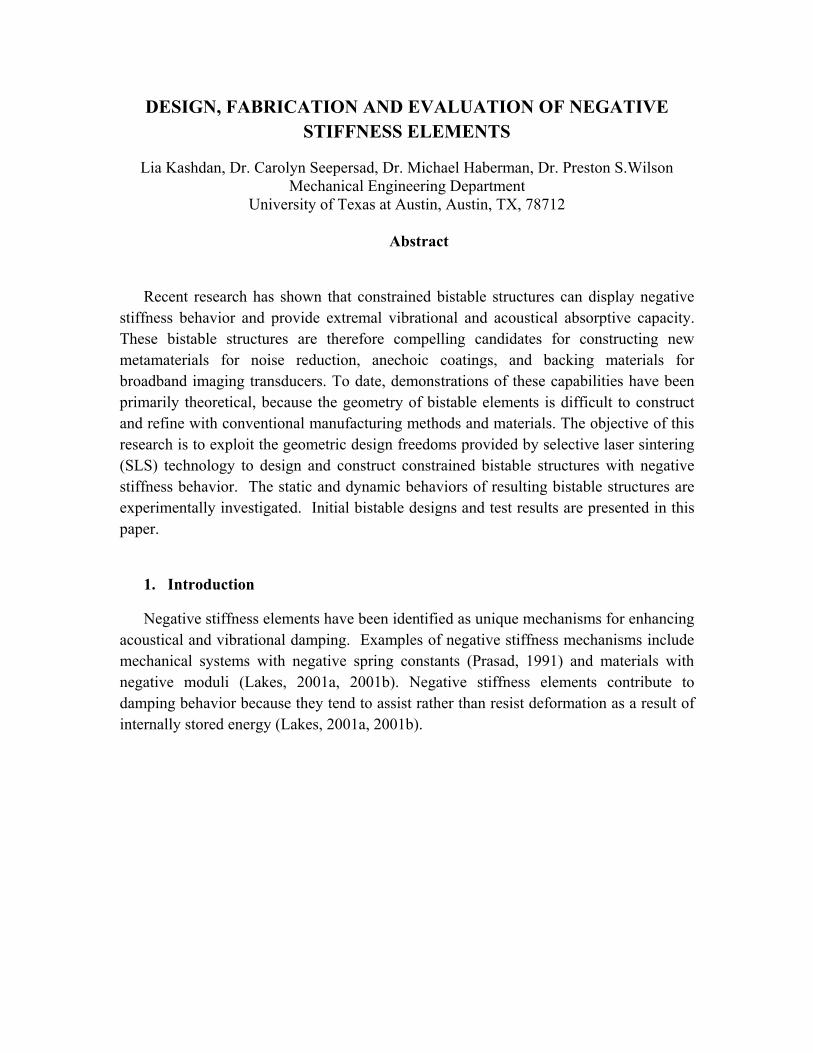
A simple apparatus was designed for testing and tuning the negative stiffness behavior of a buckled beam. As shown in Figure 5, the apparatus consists of a beam connecting two end plates. The endplates are connected together with bolts that can be tightened to pre-buckle the beam. By adjusting the relative tightness of the bolts, the beam can be initialized into an unbuckled state, a metastable state, or a fully buckled state. The spring serves to constrain the specimen; its stiffness is tuned to stabilize the beam in its metastable state when the bolts are tightened to the appropriate length. As described in Section 5, the apparatus is placed on top of a shaker table, with accelerometers attached to the beam and the base of the structure to measure the relative amplitude of the beam’s motion and the transmissibility of the beam. The amplitudes of resonance peaks from the pre-buckled beam are expected to be much lower than those of a beam in its free state, demonstrating the dampening effect of the bistable element. The negative stiffness behavior of the apparatus is very sensitive to the material properties of the beam and the spring. Since the apparatus is being constructed with SLS technology and Nylon 11 material, for which various material properties are not widely documented, it is important to begin the study with material testing.
Figure 5: SolidWorks model of a buckled beam system
4. Material Characterization
Static materials testing is a common and relatively straight-forward method for obtaining material properties of sintered parts. However, it may not always be the most appropriate method when parts are used in dynamic applications. Because the stiffness properties of materials such as Nylon 11 change with strain rate, it is very important to employ dynamic tests to determine properties at a specific frequency. These tests are of added value to this research because limited material property data is available in the literature for sintered Nylon 11. For the purposes of this study, Young’s modulus, shear modulus and loss factor are determined using dynamic tests and static tests. All parts are

made using the 3D Systems Sinterstation HiQ SLS machine and the build parameters outlined in Appendix A.
4.1. Shear Modulus
For this system, shear modulus must be determined to calculate spring coefficients for the spring element that will be included in the test model. The shear modulus is related to the spring coefficient using
!"#$%&' ( )*+,&-. , (1)
where G is the shear modulus, d is the coil thickness, n is the number of active coils and D is the mean coil diameter. The shear modulus is determined using this relationship for both static and dynamics tests of sintered spring elements.
For the static test, two sets of springs (one set seen in Figure 6) with varying coil thicknesses and outer diameters (see Table 1) are produced with one set sintered vertically and the other horizontally. The springs are each loaded in an Instron 3345 Tension Tester machine to obtain force versus displacement curves, thereby directly obtaining kspring by finding the slope of the resulting curves.
Figure 6: Three types of spring designs used in static testing
Table 1: Dimensions of springs for static and dynamic tests *note that n refers to the number of active coils, not total coils. In the case of the springs used in this system, n is
the total number of coils minus one.
Static!Test!"!tested!at!strain!rate!of!5!mm/s!
Dynamic!Test!–!tested!from!5!to!60!Hz!
! n* d (mm) D (mm) n* d (mm) D (mm) Mtot (kg) # Springs /! 9 2.75 5.00 1 2.5 4.6 49.9 0.12 2 0! 8.5 2.76 9.88 2 4.5 4.1 20.2 0.11 3
1! 8.5 3.32 10.18
The parts fabricated for the dynamic test can be seen in Figure 7. These parts are designed to be simple mass-spring systems consisting of two or more springs to insure

the stability of the mass during forced vibration (see Table 1). This configuration is chosen for its simplicity and its well-known mathematical model.
Figure 7: Two different mass-spring systems used for dynamic testing. The system on the left contains three springs and the one on the right has two springs in a “double helix” configuration for stability of the mass
Figure 8: Schematic for dynamic shear modulus test
The test used to determine the dynamic shear modulus is a standard vibration transmissibility test schematized in Figure 8. The spring-mass element is fixed to the top of a shaker table, which is driven by a frequency-swept sinusoidal voltage signal. During the sweep, the acceleration of the base of the sintered part and the top of the mass is measured using two matched accelerometers (PCB 333B30). A ratio of the mass acceleration to the base acceleration yields the transfer function of the system. The peak of this function occurs at the resonant frequency of the system, which for the case of light damping is related to the spring constant by
2& ( 3!"#$%&'
45 , (2)
where !n is the natural angular frequency at resonance, and M is the mass of the blocks shown in Figure 7 plus the accelerometer and 1/3 the total mass of the springs. The measurements of the shear modulus from both these tests are given in Table 2.
Shaker!Table
Vector!Signal!Analyzer
Power!Amplifier
Signal!ConditionerMass!–Spring!System
Accelerometers
Computer

Table 2: Results from shear modulus static and dynamic tests. Six springs were each tested ten times for the static tests, while two mass-spring systems were each tested five times.
G Measurements Static (Pa) Dynamic (Pa) Average 4.77x10⁸ 6.44 x10⁸
Standard Deviation
1.38 x10⁸ 8.04 x10⁷
Results for the static test are very close to the published values of shear modulus for
molded or extruded Nylon 11: 4.38 x 10⁸ – 4.63 x 10⁸ Pa (Granta, 2008). The dynamic test results are outside this range. This result is likely due to the fact that Nylon 11, being a polymer, has strain rate dependent (i.e. frequency dependent) moduli and that the test measured the modulus at the resonant frequency.
4.2. Young’s Modulus
The Young’s modulus of sintered Nylon 11 is also found using both static and dynamic methods. The static method used a tensile testing apparatus and follows ASTM D638, including strain rates specified therein. As Young’s modulus is highly rate dependent, simply determining this value from tensile testing may not provide adequate information, especially for systems that operate over a range of frequencies. It is for this reason that the material is also tested under dynamic conditions, specifically using the log decrement method for a cantilevered beam (Jones, 2001).
Three sets of rectangular beams are designed with a range of dimensions and built in the 3D Systems Sinterstation HiQ SLS. The test beams are clamped to a table (as seen in Figure 9) with an accelerometer affixed to the end of the beam.
Figure 9: Schematic for Young’s modulus dynamic test
The beam is struck on the end to induce motion primarily at its resonant frequency. Output from the accelerometer, an example of which is shown in Figure 10, is captured on the oscilloscope and transferred to the lab computer for analysis. The resonant
Clamp
Nylon!11!Bar
Accelerometer
Table
Signal!Conditioner
OscilloscopeComputer

frequency of the beam is a function of its length, thickness, density, and Young’s modulus. Multiple tests can therefore be run on each beam by shortening the free length in order to obtain modulus information for a range of frequencies. The resonant frequency of this system can be determined using a discrete Fourier transform of the time signal and the Young’s modulus is then calculated as follows (Thompson, 1987):
6 ( 789:;<;=.>? . (3)
Note that Mtot includes the entire mass of the accelerometer plus 0.23 times the mass of the beam, I is the area moment of inertia of the beam, and L is its length.
Figure 10: Sample output from Young’s modulus dynamic test
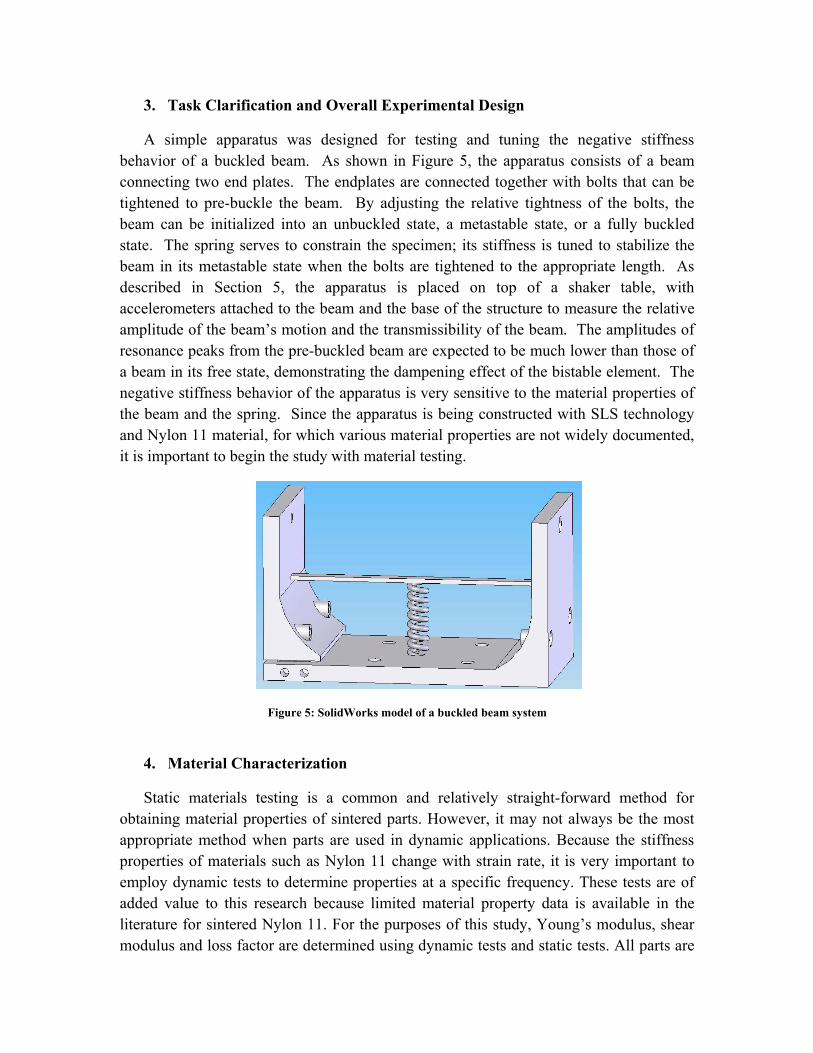
Over two hundred trials are run with this setup, and a chart of the resulting Young’s modulus calculated from the tests is presented below in Figure 11. The bin numbers underneath each column represent the highest value within that column. No correlation to frequency could be determined for these beams as the frequencies sampled are mostly too low (less than 100 Hz), however the Young’s modulus would be expected to increase significantly at higher frequencies.
Tto 13modufalls materdata standand thsize a
Tmultimodutensilultrasultrasempl20 M
4
Kdetermthe saloss decayof thato det
The expected310 MPa (Gulus with tenjust below
rials often dfor six sinte
dard deviatiohe values foand the fact t
The advantagiple tests toulus at the nle tests that sonic tests arsonic testingoyed at low
MHz) (Jones,
.3. Lo
Knowledge omines the daame log decfactor is foying transienat curve is retermine the l
Figure 11: R
d range of theGranta, 2008n samples isthe expecte
display someered Nylon 1on of 172 Mound using ththat the dynage of the dyo be performnatural frequare limited tre another cog is not the
w frequencies2001).
oss Factor
of the loss faamping of thcrement dataund by fittint response oelated to the loss factor a
0.00
5.00
10.00
15.00
20.00
25.00
%!of!D
ata
Results from the
e Young’s m). The averas 1220 MPaed range. Ae reduction i11 bars resu
MPa, a signifhe log decreamic sampleynamic test med with a uency of the to the strainommon methbest choice
s as they stif
actor, ", of she material. a used to deing a logariof the beamlogarithmic
as follows (Jo
0%
0%
0%
0%
0%
0%
Yo
e Young’s modu
modulus for mage for the
a, with a stanA lower modin stiffness d
ulted in an avficantly loweement methoes are tested
is its nondsingle bar.bar, which
n rates set inhod for deter
for the chaffen signific
sintered NyloConvenient
etermine theithmic curve
m, such as thec decrement oones, 2001):
oung's!Modulu
ulus test in hist
molded or exexperimentandard deviatdulus value due to porosverage moduer value than
od possibly dat resonance
destructive n The test acould provi
n the ASTM rmining Youaracterizationcantly at ultr
on 11 is vitatly, the loss e Young’s me to the peae one shownof the respon
us!(MPa)
ogram form
xtruded Nyloally determition of 97.7is expected
sity. Note thulus of 1060n both molddue to the sme. nature, whicalso determide more usestandard. It
ung’s moduln of plasticsrasonic frequ
al to this stufactor can b
modulus. Speaks of the en in Figure 1nse, #, which
on 11 is 124ined Young’7 MPa, whicd as sintere
hat tensile te0 MPa, and ded Nylon 1maller sampl
ch allows foines Young’eful data that is noted thalus. Howeves that will buencies (0.5
udy becausebe found fromecifically, thexponentiall10. The sloph can be use
40 ’s ch ed st a 1 le
or ’s an at
er, be
-
it m he ly pe ed

Figurthe exwhich
5
Tnegatrigid Whenconstexpecunbu
Tenougloosecreateforceaspecwidth1100
re 12 shows xpected valuh agrees wel
. Prelimina
The results frtive stiffnessframe on o
n the beam trains the spcted that thckled beam
The first desgh aspect ra
e to constraied friction ad a redesign
ct ratio and fh of 8 mm, N/m.
the loss facue for mechall with our ex
Figure
ary Dynami
rom the mats system. Fone side andis axially lo
pring to the his configurdue to the nign permuta
atio for the bin the beamand vibratedn of the systefixed ends olength of 15
0.00%
5.00%
10.00%
15.00%
20.00%
25.00%
%!of!D
ata
ctor values canical loss foxperimental
12: Results of t
ic Tests
terial charactor the systemd the beam coaded, the spotherwise mration will egative stiffn
ation used pbeam cross sm to its met, which prodem, as show
on the beam.55 mm and
%
%
%
%
%
%
calculated froor Nylon 11 observation
the loss factor t
terization arm under test, center point pring impart
metastable stdisplay en
fness of the bpinned jointsection dimentastable statduced signif
wn in Figure The new dea spring wi
Loss!F
om the expeis approxim
ns.
test in histogram
re used to dea constrainion the othe
ts the force oate when th
nhanced dambeam. s for the beansions, and hte. During eficant noise 13, to inclu
esign has beith spring co
Factor
erimental damately 0.03 (G
m form
esign and teing spring iser, as shownon the beam
he beam is bmping comp
am, did not had a springexcitation, thin the data.
ude a stiffer eam thicknesonstant of a
ata. Note thaGranta, 2008
st a complet attached to
n in Figure 5m and therebbuckled. It ipared to th
have a largg that was tohe pin jointThese issue
spring, largess of 2.5 mmapproximatel
(4)
at 8)
te a
5. by is
he
ge oo ts es er
m, ly

Figure 13: The buckled beam system made of Nylon 11
The left wall of the system is free to slide towards the right to compress the structure. Threaded rods (not shown) were inserted through the left and right end plates of the part and were used to progressively compress the system by small increments. Holes in the base allow for direct attachment of the part to the shaker table (Labworks Inc. model ET-139). The vibration transmissibility of the apparatus is then determined with the experimental setup shown in Figure 14, which is nearly identical to the test used to determine the shear modulus.
Figure 14: Schematic of dynamic buckled beam test
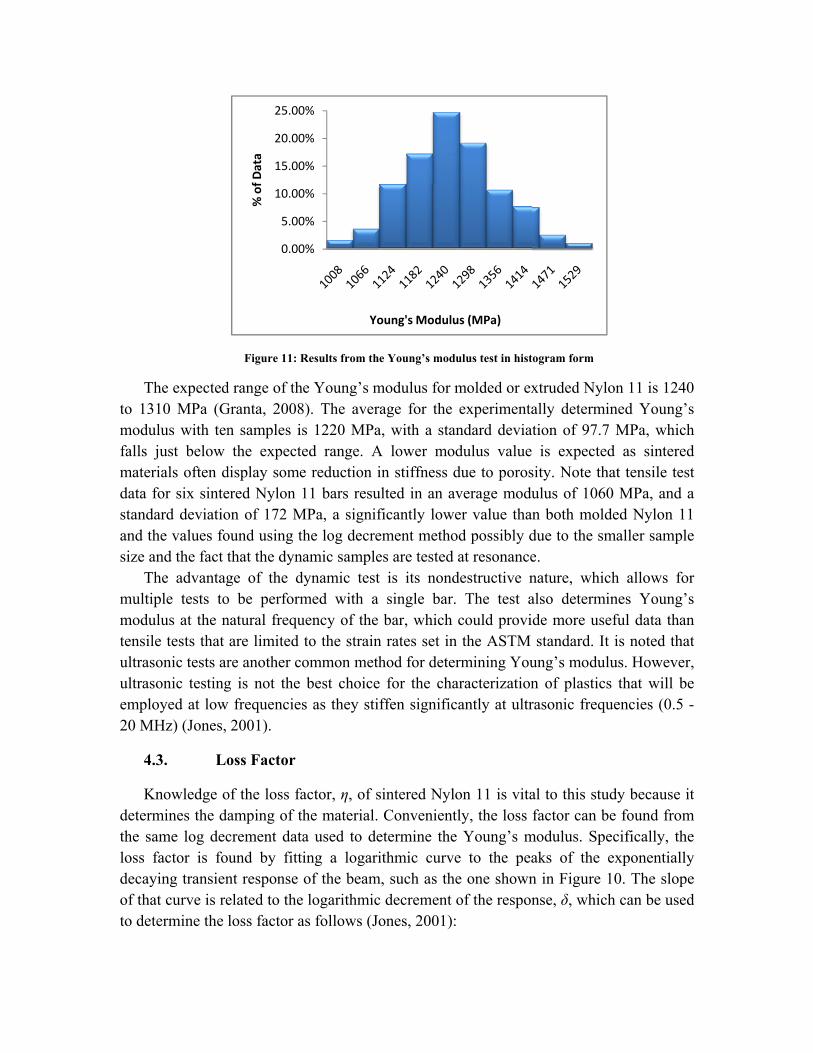
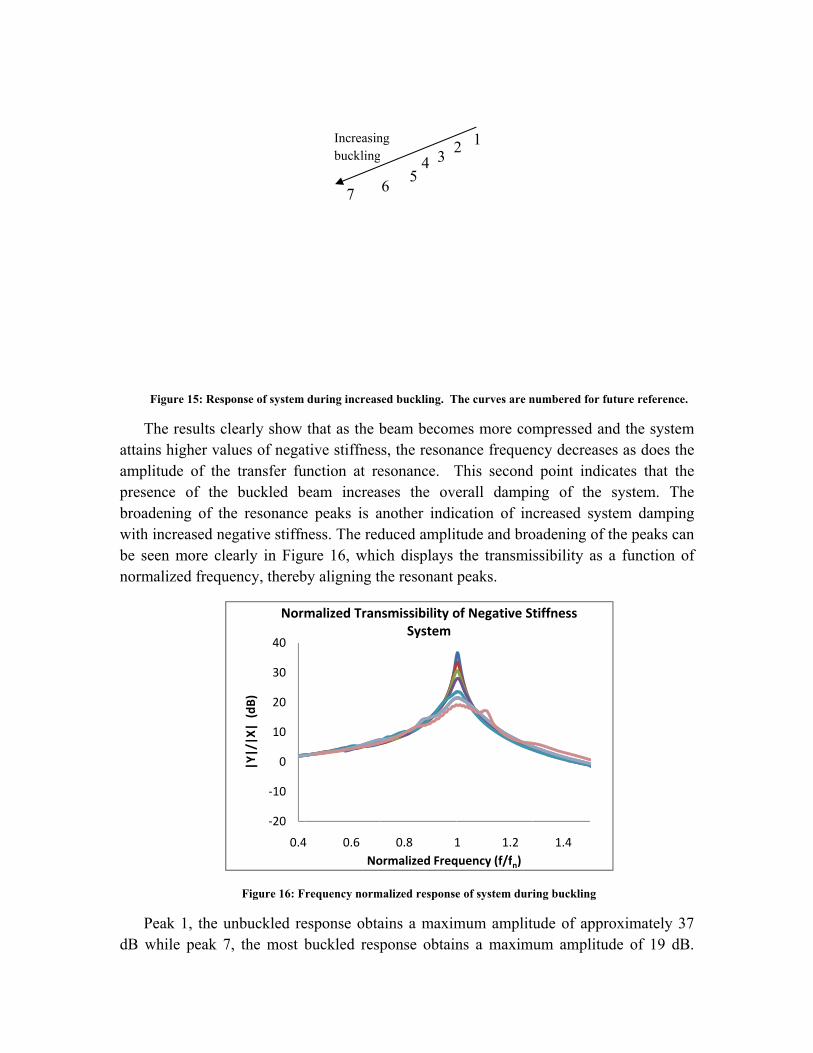
Vibration transmissibility tests are run at multiple levels of axial pre-strain. The tests begin with the beam in a completely uncompressed position and the beam is progressively pre-strained until the beam is in a stable buckled equilibrium position, after passing though the metastable position. Each round of testing begins by compressing the beam by approximately 0.1 mm. The shaker table then excites the system in a sweep from 30 to 200 Hz, a range that contains the first resonance peak. Several representative transmissibility curves are shown in Figure 15. Table 3 matches each curve in Figure 15 with an exaggerated and approximate image of the pre-stressed beam before the shaker test began.
Shaker!Table
Vector!Signal!Analyzer
Power!Amplifier
Signal!ConditionerBistable!System
Accelerometers
Computer
F
Tattainamplipresebroadwith be senorm
PdB w
Figure 15: Resp
The results clns higher valitude of the
ence of the dening of thincreased ne
een more clemalized frequ
eak 1, the uwhile peak 7
ponse of system
learly show lues of negae transfer fu
buckled bhe resonanceegative stiffnearly in Figu
uency, thereb
Figure 16: F
unbuckled re7, the most b
"20
"10
0
10
20
30
40
0.4
|Y|/|X
|!!(d
B)
Nor
during increas
that as the bative stiffnesunction at rebeam increae peaks is aness. The redure 16, whic
by aligning th
Frequency norm
esponse obtabuckled resp
4 0.6No
malized!Tran
Increasinbuckling
7
sed buckling. T
beam becoms, the resonaesonance. Tases the oveanother indicduced amplitch displays he resonant
malized response
ains a maximponse obtain
0.8 1ormalized!Freq
nsmissibility!oSystem
ng g 234
56
The curves are n
mes more comance frequenThis seconderall dampication of intude and brothe transmipeaks.
e of system dur
mum amplitns a maxim
1 1.2quency!(f/fn)
of!Negative!S
1 2
numbered for fu
mpressed anncy decreased point indicing of the
ncreased systoadening of tssibility as
ring buckling
tude of apprmum amplitu
1.4
tiffness!
uture reference
nd the systemes as does thcates that thsystem. Thtem dampinthe peaks caa function o
roximately 3ude of 19 dB
e.
m he he he ng an of
37 B.
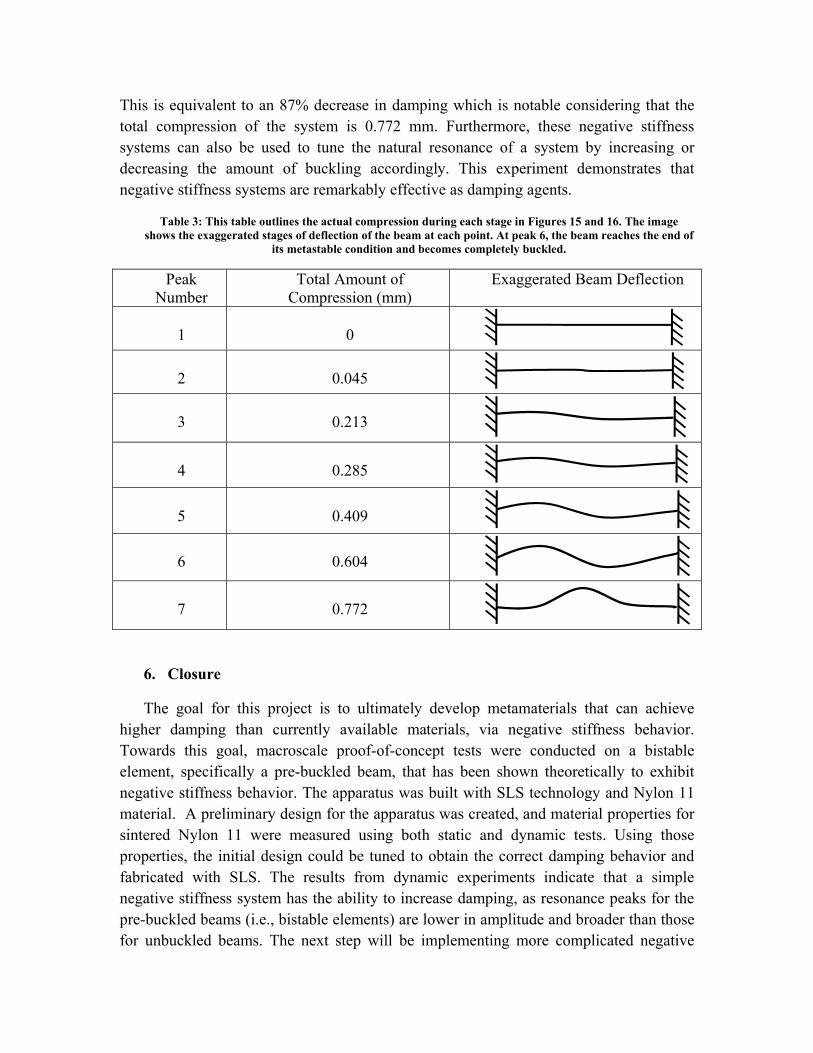
This is equivalent to an 87% decrease in damping which is notable considering that the total compression of the system is 0.772 mm. Furthermore, these negative stiffness systems can also be used to tune the natural resonance of a system by increasing or decreasing the amount of buckling accordingly. This experiment demonstrates that negative stiffness systems are remarkably effective as damping agents.
Table 3: This table outlines the actual compression during each stage in Figures 15 and 16. The image shows the exaggerated stages of deflection of the beam at each point. At peak 6, the beam reaches the end of
its metastable condition and becomes completely buckled.
Peak Number
Total Amount of Compression (mm)
Exaggerated Beam Deflection
1
0
2
0.045
3
0.213
4
0.285
5
0.409
6
0.604
7
0.772
6. Closure
The goal for this project is to ultimately develop metamaterials that can achieve higher damping than currently available materials, via negative stiffness behavior. Towards this goal, macroscale proof-of-concept tests were conducted on a bistable element, specifically a pre-buckled beam, that has been shown theoretically to exhibit negative stiffness behavior. The apparatus was built with SLS technology and Nylon 11 material. A preliminary design for the apparatus was created, and material properties for sintered Nylon 11 were measured using both static and dynamic tests. Using those properties, the initial design could be tuned to obtain the correct damping behavior and fabricated with SLS. The results from dynamic experiments indicate that a simple negative stiffness system has the ability to increase damping, as resonance peaks for the pre-buckled beams (i.e., bistable elements) are lower in amplitude and broader than those for unbuckled beams. The next step will be implementing more complicated negative

stiffness systems, in two and three dimensions, and with composite materials. From there, the ability to use negative stiffness inclusions within materials will be explored.
Acknowledgement The authors would like to acknowledge an internal research and development grant
from Applied Research Laboratories at the University of Texas at Austin for funding this research.
References
Godbold, O. B., R. C. Soar, et al. (2007). "Implications of Solid Freeform Fabrication on Acoustic Absorbers." Rapid Prototyping Journal 13(5): 298-303. Granta (2008), CES EduPack. Haberman, M. (2007) “Design of High Loss Viscoelastic Composites through Micromechanical Modeling and Decision-Based Materials Design,” PhD Thesis, G.W. Woodruff School of Mechanical Engineering, Georgia Institute of Technology, Atlanta, GA. Jones, D.I.G., (2001), Handbook of Viscoelastic Vibration Damping, 1st Edition, John Wiley & Sons, New York, New York. Lakes, R. (2001a). "Extreme Damping in Compliant Composites with a Negative-Stiffness Phase." Philosophical Magazine Letters 81(2): 95-100. Lakes, R.S., T. Lee, A. Bersie, and Y.C. Wang, (2001b) "Extreme Damping in Composite Materials with Negative-Stiffness Inclusions". Nature. 410: 565-567. Platus, D.L., (1991), “Negative-Stiffness-Mechanism Vibration Isolation Systems,” Proceedings of SPIE, Vibration in Microelectronics, Optics, and Metrology. 1619: 44-54. Prasad, J. and A. Diaz (2006). "Synthesis of Bistable Periodic Structures Using Topology Optimization and a Genetic Algorithm." ASME Journal of Mechanical Design 128: 1298-1306.
Qiu, J. and J. Lang (2004). "A Curved-Beam Bistable Mechanism." Journal of Microelectromechanical Systems 13(2): 136-146.
Saif, M. T. A. (2000). "On A Tunable Bistable MEMS - Theory and Experiment." Journal of Microelectromechanical Systems 9(2): 157-170. Thomson, W. T., 1987, "Vibration," in Marks' Standard Handbook for Mechanical Engineers, 9th Ed., edited by E. A. Avallone and T. Baumeister III, McGraw-Hill, New York, pp. 5.67–5.76. Wang, Y. C. and Lakes, R. S. (2004), "Extreme Stiffness Systems due to Negative Stiffness Elements", American Journal of Physics, 72: 40-50. Xinchun, S. and R. Lakes (2007). "Stability of Elastic Material with Negative Stiffness and Negative Poisson's Ratio." Physica Status Solidi-b 244(3): 1008-1026. Yap, H., R. Lakes, et al. (2007). "Mechanical Instabilities of Individual Multiwalled Carbon Nanotubes under Cyclic Axial Compression." Nano Letters 7(5): 1149-1154.
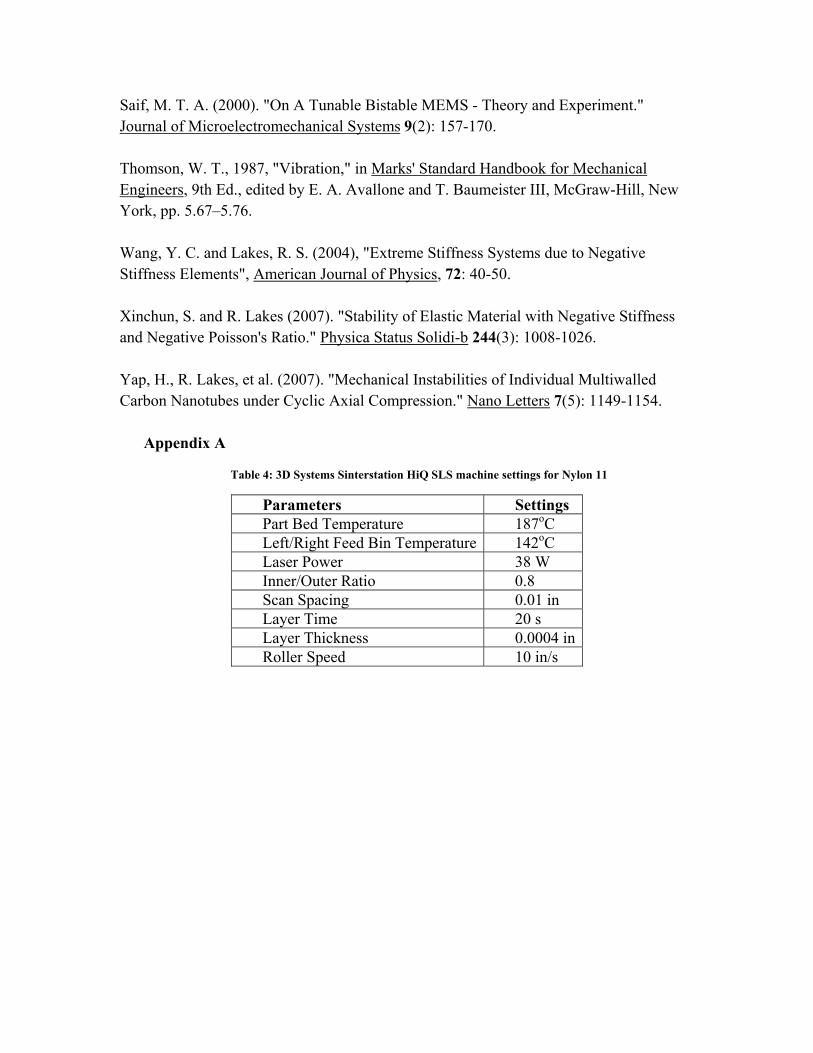
Appendix A
Table 4: 3D Systems Sinterstation HiQ SLS machine settings for Nylon 11
Parameters Settings Part Bed Temperature 187oC Left/Right Feed Bin Temperature 142oC Laser Power 38 W Inner/Outer Ratio 0.8 Scan Spacing 0.01 in Layer Time 20 s Layer Thickness 0.0004 in Roller Speed 10 in/s