design, fabrication, and testing of an internet connected
TRANSCRIPT

Journal of
Actuator NetworksSensor and
Article
Design, Fabrication, and Testing of an InternetConnected Intravenous Drip Monitoring Device
Pranshul Sardana 1,*, Mohit Kalra 2 and Amit Sardana 3
1 Department of Microsystems Engineering—IMTEK, University of Freiburg, 79110 Freiburg, Germany2 Department of Informatik (INFOTECH), University of Stuttgart, 70569 Stuttgart, Germany;
[email protected] Amazon Web Services, Dublin 18, Ireland; [email protected]* Correspondence: [email protected]
Received: 21 November 2018; Accepted: 27 December 2018; Published: 28 December 2018
Abstract: This paper proposes a monitoring system retro-fittable for existing Intravenous (IV) infusionsetup. Traditionally, doctors and nurses use their experience to estimate the time required by an IVbottle to empty which makes the IV therapy vulnerable to human error. The current study proposesan internet connected monitoring platform for IV drip chambers. The device enables doctors andnursing staff to monitor the drip parameters wirelessly while emphasizing on low costs and highdegree of reliability. It has two main units, namely chamber unit and pole unit. Chamber unithouses two types of sensors, optical based for drop detection and capacitive based for level detection,both of which are placed on the chamber unit. The pole unit majorly consists of a microcontrollerand a GSM-based (Global System Mobile Communication) communication module. In addition,the device was tested along with various parameters like accuracy, readout stability, change in fluidused, changes in ambient conditions, end chamber conditions, optical unit malfunctions. Finally,the monitored data was securely and reliably transmitted to commercial cloud service using HTTPAPI calls (Hyper Text Transfer Protocol) (Application Programming Interface). This data was storedand visualized for ease of readability for nurses and doctors.
Keywords: intravenous therapy; medical information systems; multi-sensor platform; chamber basedMonitoring; internet of medical things
1. Introduction
Intravenous therapy is a process of administering medicine into the body directly through theveins. It is the fastest way of delivering fluids and medications throughout the body as it utilizesthe effective cardiovascular channel and its natural pumping forces. The working principle of IV isthat a bottle filled with the desired fluid medication is hung at a level higher than the patient’s bodyto provide the fluid with a pressure, generated by gravitational potential energy, to overcome thecardiovascular pressure.
IV therapy is an easy and effective procedure which allows a drop by drop administration ofmedication. The process also has some innate limitations, like formation of tissue in the needle, rollingof patient on the tube or over the hand, can block the flow of the fluid and compromises with thepatient’s life in severe scenarios. The major bottleneck of the process is monitoring the medicine bottle.This is necessary so that the doctor or the nurse can know when to change the bottle. In general,the bottle is changed when it is completely empty. The time it takes to empty is variable and dependson parameters such as medicine quantity used, changes in back-pressure due to systolic-diastolic andnon-quantifiable dilation or contractions of veins.
J. Sens. Actuator Netw. 2019, 8, 2; doi:10.3390/jsan8010002 www.mdpi.com/journal/jsan

J. Sens. Actuator Netw. 2019, 8, 2 2 of 20
Because of the dynamic nature of the process, measurement based robust monitoring is necessary.Failure of this can lead to various medical complications like backflow of blood into the IV setup.In severe cases, if the bottle gets empty and it is not monitored for some time, it can also cause insertionof air embolism [1,2] in the IV tube, which can be deadly and hence critical monitoring is required.Currently, this monitoring is done by the nurses and/or by the patient’s attendant and in countries likeIndia, they have a poor nurse to patient ratio [3,4]. Over the last two decades, researchers have exploredvarious medical devices which can be connected to the Internet [5–9] which is giving rise to the Internetof Medical Things (IoMT). These publications include devices like wearable sensors, middlewareplatforms to connect the patient with the doctor using these wearable sensors and provides privacychallenges linked with using healthcare information systems. An interesting use case of internetconnected medical devices is presented in [5], where an multiparameter monitoring wrist watch isdiscussed. Whereas, [9] presents a mechanism for visualization, monitoring, and notification by amiddleware and hence shows the various sensors can be used together with software platform toprovide a more involving user experience.
Over the past two decades, many researchers have explored numerous techniques for sensingthe IV drip levels. One common aim of all the researchers was to develop a sensor system whichwas not in contact with the IV fluid. The initial works were focused on developing low cost andlow energy consuming devices. The modern approaches are more inclined towards integrating newalerts and monitoring platforms. However, some of these integrations were platform dependent andhence limits the usability. Table 1 mentions some of the approaches, along with their advantagesand disadvantages.
Infrared detection is the most widely explored methods for drop detection and drip chamber beingthe most widely accepted location of sensor placement. For these kinds of systems, the performance ofthe device can be affected by ambient levels. Researchers have used various methods for reducingambient light. This is either done by software, i.e., by using moving average filters, or by providingsome physical barriers to reduce the effect. The second most common measurement parameter waslevel detection.
The current work deals with design, fabrication and testing of an internet connected IV dripmonitoring device, which is capable of precisely monitoring drip rate, chamber liquid level alongsidedetecting malfunctions in the measurement system. In the device, consideration is taken towardshaving physical and electrical isolation between the sensor and IV fluid which is achieved by placingthe conducting plates between the drip chamber and chamber unit of the device, which makes thedevice retrofit and free from the type of fluid used. The device is made robust against changes in IVdrip used and droplets on sidewalls by using a calibration button. Detailed design specifications arediscussed in the following section. In addition to design aspect, the work focuses on the testing of thedevice in hospital environment for reliability. Apart from normal operations, cases like end chamberconditions and LED pair malfunctions were tested rigorously with different ambient conditions toprove robustness of the device. Detailed experiments and results are discussed in the later section.

J. Sens. Actuator Netw. 2019, 8, 2 3 of 20
Table 1. Summary of Intravenous (IV) drip monitoring techniques, with their advantagesand disadvantages.
Year Sensing Method (Location) Advantages Disadvantages
2001 Infrared detection(Drip chamber) [10]
Minimalistic approach to designthe circuit
Circuit consumes low power
Display consumes high powerNo results provided
2002 Infrared detection(Drip chamber) [11]
Three IR pairs at different planesPrismatic effect compensation
Unconnected systemNo alarms generated
2007 Infrared detection(Drip chamber) [12]
Efficient battery lifeUses wireless sensor networks
Non-consistent monitoringLack of testing
2009 Infrared detection(Drip chamber) [13] Multi-parameter measurement No device or design shown
No results provided
2010 Infrared detection(Drip chamber) [14]
Low energy consumptionMulti-layer software structure
Listening periods reduces the accuracyof the device
2011 Infrared detection(Drip chamber) [15] Infrared region of operation Display consumes high power
Lack of testing
2011 Flexible capacitive sensor(Bottom of the bottle) [16]
Over the bottle setupLow cost, Simple structure &
Compact
Binary value for the liquid levelUse of consumable, i.e., glue spray
2012Microwave time-domain
reflectometry(Bottle) [17]
Non-invasive sensingEasy, low-cost fabrication, and
dimension control
Careful alignment between bottle andholder is must
Dependent on the shape of bottleDifficult to reproduce results
2013 Ray path simulations(Drip chamber) [18] Optical detection Simulations
2015 Infrared detection(Drip chamber) [19]
Lack of testing results providedComparison with other
devices/schemes difficult
2015 Infrared detection(Drip chamber) [20]
Centralized receiver moduleAudio and visual alerts
Incomplete, ineffective and costlydevice
Lack of testing
2016 Infrared detection(Drip chamber) [21]
PC and Android based monitoringMulti-bag setup
Specific liquid amount can be usedUnknown sensor mounting
2016 Infrared detection(Drip chamber) [22] Stakeholders interviewed
No device or design shownUnconnected systemNo results provided
2017 Capacitive Leveldetection [23] Multi-parameter measurement
Lack of testingNo device or design shownUnknown sensor mounting
2017 Load cell(Glucose hanger) [24] Weight-based measurement Restricted to one fluid type
No device or design shown
2017 Pressure sensing (Bottle) [25] Circuit consumes low powerNo alarms generated
Lack of testingNo device or design shown
2018 Infrared sensor(Drip chamber) [26]
Cloud-connected deviceTesting done for ambient
environmentAssumption about droplet volume
2018 Infrared sensor(Drip chamber) [27] Power supply backup
No resultsNo device or design shown
Lack of electrical isolation and safetydetails and reliability
2018 Infrared sensor(Drip chamber) [28] Multi-alert system
Display consumes high powerUnknown sensor mounting
Lack of testing
2018 Infrared Detection(Drip chamber) [29]
Device tested extensively indifferent ambient conditions
No actual device shownRestricted to diameter of infusion tube
2. Materials and Methods
2.1. Working Principle
The two types of sensing were done by using two different sensors both of which were placed onthe chamber of the IV setup. Firstly, for detecting the number of drops, two infrared emitter-detectorpairs were used. And secondly, for detecting the chamber liquid level a pair of curved copper plates

J. Sens. Actuator Netw. 2019, 8, 2 4 of 20
were fabricated to have capacitive level sensing. A detailed explanation of both types of sensors isgiven below.
Drop detection is an essential component of an IV drip system. By detecting the number of dropsper minute, the drip rate can be calculated. This rate gives an estimation of the amount of medicationentering the patient’s body per minute. Caution should be taken here as to calculate the actual amountof medication, volume per drop should be known. As the veins exert a variable amount pressureduring the systolic and diastolic periods, a precise measurement of medication amount cannot beknown. Hence, advance strategies are needed for monitoring the end conditions precisely.
2.2. Design and Fabrication
The optical sensor system comprises of two identical pairs of Infrared (IR) Transmitter (Tx)(OSRAM SFH 4554) and Receiver (Rx) (OSRAM SFH 203). Tx, Rx are matched to operate at IR of850 nm wavelength and has a illumination diameter of 5 mm. Value of Rx is read through Analog toDigital Converter (ADC) of Arduino which has a response time of 100 µs [30]. For capacitive sensorsystem, the plates of the capacitor were fabricated in dimensions of 24 mm × 29 mm, in accordancewith the circumference and height of the drip chamber with 300 µm thickness and press-fitted in theinner layer of the chamber mount. The capacitance value was measured using a CM-1500 digitalcapacitance meter. This value was measured to be 11 pF.
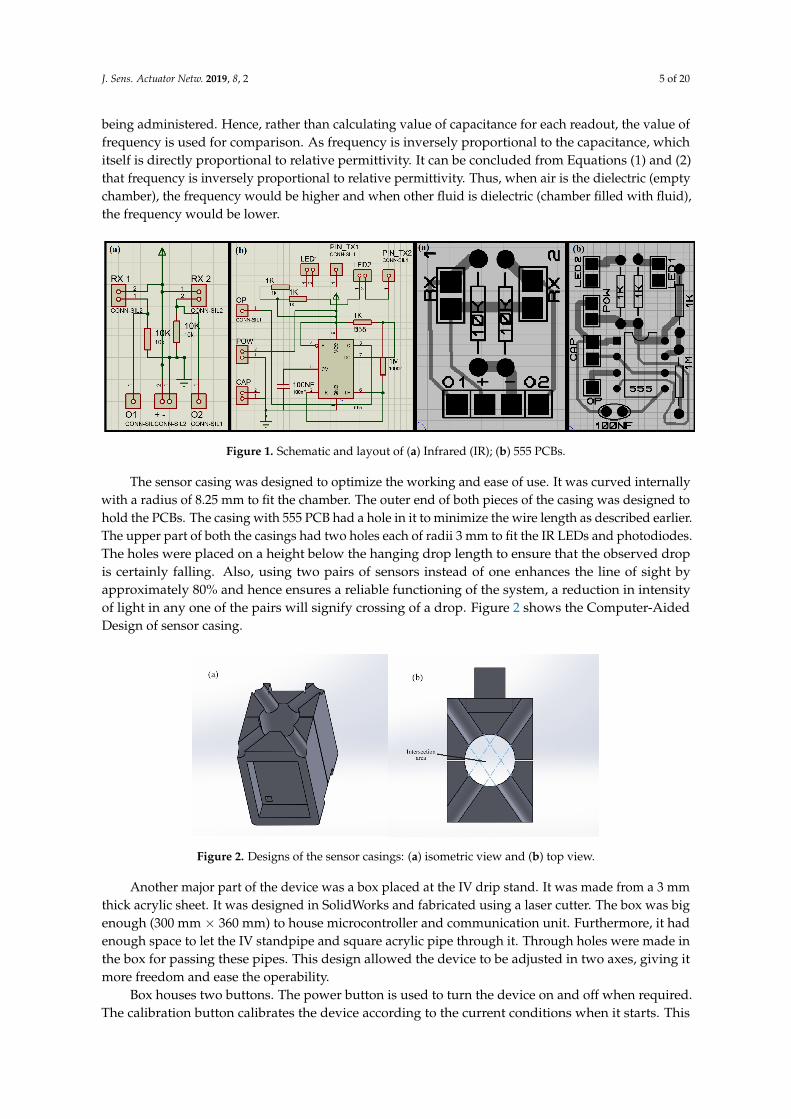
PCB housing the signal conditioning circuitry for optical and capacitive sensor system weredesigned on Proteus 8.1. Dimensions of PCB housing the IR LED and the circuit for capacitance-frequency conversion is 34 mm × 15 mm. The dimensions of IR PCB are 15 mm × 19 mm. Manualrouting was done while PCB designing with minimum track width kept at 15 mils for signal carryingtrack and maximum at 50 mils for the power track. LM555 IC (PDIP packaging, manufactured by TexasInstruments) is used in the capacitance-frequency conversion circuit. Effect of parasitic capacitancewas minimized by routing the connection wires of capacitor by the shortest path along the hinge andthrough hole in the chamber mount. The setup minimizes the stray capacitance and still provides aneasy way of fabrication. The formed measurement unit provides a point to point measurement of thefluid inside the chamber.
Figure 1 shows the schematic and layout of IR, 555 PCBs. The IR PCB contains receiverIR photodiodes and limiting resistors with pin connectors for the diodes. 555 PCB contains thetransmission LEDs and 555 circuit as an astable multi-vibrator to convert the observed capacitanceinto frequency. The frequency signal was then fed to the micro-controller for processing. Equation (1)describes the capacitance to frequency formula as follows:
f =1T
=1.44
(R1 + 2R2).C(1)
where R1 (1 kΩ) is the resistance between VCC and Discharge pin, and R2 (1 MΩ) is the resistancebetween Discharge pin and Trigger pin (connected with Threshold pin). Here, C is the value ofcapacitance which is formed due to the copper plates placed on the inner curved surface of thechamber housing. For a parallel plate capacitor, the value of C depends on the following factors asdescribed in Equation (2).
C = ε0.εr.Ad
(2)
where ε0 is the absolute permittivity of free space, which is equal to 8.85 × 10⁻¹² F/m and εr is therelative permittivity of the dielectric material in between the plates (in our case, Air for Empty Chamberand Intravenous fluid being administered for the full chamber conditions). A is the surface area of thedielectric plates and d is the distance between the plates. In this case, this formula is not used strictlysince the plates are curved and hence are not truly parallel as the distance near the edges (on curvedsurface) is less than measured from the center of the plate. Moreover, the value of relative permittivityis material depended, since our aim is to develop a system which can be used for all types of fluids
J. Sens. Actuator Netw. 2019, 8, 2 5 of 20
being administered. Hence, rather than calculating value of capacitance for each readout, the value offrequency is used for comparison. As frequency is inversely proportional to the capacitance, whichitself is directly proportional to relative permittivity. It can be concluded from Equations (1) and (2)that frequency is inversely proportional to relative permittivity. Thus, when air is the dielectric (emptychamber), the frequency would be higher and when other fluid is dielectric (chamber filled with fluid),the frequency would be lower.
J. Sens. Actuator Netw. 2018, 7, x FOR PEER REVIEW 5 of 19
The sensor casing was designed to optimize the working and ease of use. It was curved internally with a radius of 8.25 mm to fit the chamber. The outer end of both pieces of the casing was designed to hold the PCBs. The casing with 555 PCB had a hole in it to minimize the wire length as described earlier. The upper part of both the casings had two holes each of radii 3 mm to fit the IR LEDs and photodiodes. The holes were placed on a height below the hanging drop length to ensure that the observed drop is certainly falling. Also, using two pairs of sensors instead of one enhances the line of sight by approximately 80% and hence ensures a reliable functioning of the system, a reduction in intensity of light in any one of the pairs will signify crossing of a drop. Figure 2 shows the Computer-Aided Design of sensor casing.
Figure 1. Schematic and layout of (a) Infrared (IR); (b) 555 PCBs.
Figure 2. Designs of the sensor casings: (a) isometric view and (b) top view.
Another major part of the device was a box placed at the IV drip stand. It was made from a 3 mm thick acrylic sheet. It was designed in SolidWorks and fabricated using a laser cutter. The box was big enough (300 mm × 360 mm) to house microcontroller and communication unit. Furthermore, it had enough space to let the IV standpipe and square acrylic pipe through it. Through holes were made in the box for passing these pipes. This design allowed the device to be adjusted in two axes, giving it more freedom and ease the operability.
Box houses two buttons. The power button is used to turn the device on and off when required. The calibration button calibrates the device according to the current conditions when it starts. This allows the user to use IV drips with different material and optical properties without compromising the functionality of the device. An additional stopper was used below the box to hold it at the desired height. Figure 3 shows (a) the device in a hospital setting and (b) positioning of various sensors incorporated in the sensing unit.
Figure 1. Schematic and layout of (a) Infrared (IR); (b) 555 PCBs.
The sensor casing was designed to optimize the working and ease of use. It was curved internallywith a radius of 8.25 mm to fit the chamber. The outer end of both pieces of the casing was designed tohold the PCBs. The casing with 555 PCB had a hole in it to minimize the wire length as described earlier.The upper part of both the casings had two holes each of radii 3 mm to fit the IR LEDs and photodiodes.The holes were placed on a height below the hanging drop length to ensure that the observed dropis certainly falling. Also, using two pairs of sensors instead of one enhances the line of sight byapproximately 80% and hence ensures a reliable functioning of the system, a reduction in intensityof light in any one of the pairs will signify crossing of a drop. Figure 2 shows the Computer-AidedDesign of sensor casing.
J. Sens. Actuator Netw. 2018, 7, x FOR PEER REVIEW 5 of 19
The sensor casing was designed to optimize the working and ease of use. It was curved internally with a radius of 8.25 mm to fit the chamber. The outer end of both pieces of the casing was designed to hold the PCBs. The casing with 555 PCB had a hole in it to minimize the wire length as described earlier. The upper part of both the casings had two holes each of radii 3 mm to fit the IR LEDs and photodiodes. The holes were placed on a height below the hanging drop length to ensure that the observed drop is certainly falling. Also, using two pairs of sensors instead of one enhances the line of sight by approximately 80% and hence ensures a reliable functioning of the system, a reduction in intensity of light in any one of the pairs will signify crossing of a drop. Figure 2 shows the Computer-Aided Design of sensor casing.
Figure 1. Schematic and layout of (a) Infrared (IR); (b) 555 PCBs.
Figure 2. Designs of the sensor casings: (a) isometric view and (b) top view.
Another major part of the device was a box placed at the IV drip stand. It was made from a 3 mm thick acrylic sheet. It was designed in SolidWorks and fabricated using a laser cutter. The box was big enough (300 mm × 360 mm) to house microcontroller and communication unit. Furthermore, it had enough space to let the IV standpipe and square acrylic pipe through it. Through holes were made in the box for passing these pipes. This design allowed the device to be adjusted in two axes, giving it more freedom and ease the operability.
Box houses two buttons. The power button is used to turn the device on and off when required. The calibration button calibrates the device according to the current conditions when it starts. This allows the user to use IV drips with different material and optical properties without compromising the functionality of the device. An additional stopper was used below the box to hold it at the desired height. Figure 3 shows (a) the device in a hospital setting and (b) positioning of various sensors incorporated in the sensing unit.
Figure 2. Designs of the sensor casings: (a) isometric view and (b) top view.
Another major part of the device was a box placed at the IV drip stand. It was made from a 3 mmthick acrylic sheet. It was designed in SolidWorks and fabricated using a laser cutter. The box was bigenough (300 mm × 360 mm) to house microcontroller and communication unit. Furthermore, it hadenough space to let the IV standpipe and square acrylic pipe through it. Through holes were made inthe box for passing these pipes. This design allowed the device to be adjusted in two axes, giving itmore freedom and ease the operability.
Box houses two buttons. The power button is used to turn the device on and off when required.The calibration button calibrates the device according to the current conditions when it starts. This

J. Sens. Actuator Netw. 2019, 8, 2 6 of 20
allows the user to use IV drips with different material and optical properties without compromisingthe functionality of the device. An additional stopper was used below the box to hold it at the desiredheight. Figure 3 shows (a) the device in a hospital setting and (b) positioning of various sensorsincorporated in the sensing unit.J. Sens. Actuator Netw. 2018, 7, x FOR PEER REVIEW 6 of 19
Figure 3. (a) The device in a hospital setting and (b) various sensors in the sensing unit.
The prototype was tested with data being logged on the cloud using GSM as well as on a computer using serial communication. For automated log file generation, Parallax Data Acquisition Tool (PLX DAQ) for Microsoft Excel was used along with UART (Universal Asynchronous Receiver Transmitter) communication with Arduino over USB (Universal Serial Bus) port of the computer. The robustness of the device was further enhanced by using efficient functionalities in the algorithm such as calibration, IR ambient removal, and removal of inherent wait period associated with GSM communication with fixed sensing intervals to allow an uninterrupted sensing.
The microcontroller used for this system was Arduino UNO (based on ATmega328P; Arduino.cc, Turin, Italy), this was selected because of its simplistic (8-bit Architecture), compact design (67 mm × 54 mm, 25 g weight) and ample support material online (open source). With onboard 10-bit ADC, 14-pin GPIO (General Purpose Input Output), serial communication peripherals (UART, I2C etc.) and FT232 USB-UART converter, it provides all in one solution for our requirements such that no external programmers are required, and interface with PC, GSM module and sensors is seamless. Its low power consumption is an added advantage, in our experiment, the power consumption varied (300~600 mW). In the algorithm, read ADC subroutine returns the values after 2.1 ms, thus our sampling rate is (1/2.1) 476 Hz, which is more than 20× faster than the usual drip rate (2 drops per second). The communication module used is SIM900 GSM (SIMCom Wireless Solutions, Shanghai, China) which supports Quad Band: 850/900/1800/1900 MHz with GSM (2G) network. We interface this module with the Arduino using UART and control it via AT commands to specify cloud parameters, transmit data and receive responses.
The cloud platform used was Axelta Osmosis which provides secure API for easy integration to upload collected data and retrieve data for monitoring. Data is sent to cloud platform via HTTP POST calls in Java Script Object Notation (JSON) format and HTTP 200 code is received as an acknowledgement for each successful API call. The management console of the cloud platform provides an easy GUI (Graphical User Interface) to add new devices and generate node keys. Once generated, monitoring system queries cloud via API calls to retrieve data. The platform is scalable, multiple devices can be easily created, each for an IV setup and under each device, multiple nodes can be created for different parameters. This enables easy monitoring of multiple IV apparatus at the same time. In our device three nodes were created, each for one parameter: volume left in the chamber, IR used and drip rate.
For analysis in the cloud, Rules perform checks on critical parameters to be monitored. For testing and validation, three rules were created. The volume rule was made to fire when volume left in chamber drops below 80% of the full chamber level. Secondly, LED detection rule fires when both LEDs are not used for a drop detection. Thirdly, the drip rate rule fires when the drip rate is higher than 150 or lower than 5. In conjunction with rules, alarms are used to perform a specific task or
Figure 3. (a) The device in a hospital setting and (b) various sensors in the sensing unit.
The prototype was tested with data being logged on the cloud using GSM as well as on a computerusing serial communication. For automated log file generation, Parallax Data Acquisition Tool (PLXDAQ) for Microsoft Excel was used along with UART (Universal Asynchronous Receiver Transmitter)communication with Arduino over USB (Universal Serial Bus) port of the computer. The robustness ofthe device was further enhanced by using efficient functionalities in the algorithm such as calibration,IR ambient removal, and removal of inherent wait period associated with GSM communication withfixed sensing intervals to allow an uninterrupted sensing.
The microcontroller used for this system was Arduino UNO (based on ATmega328P; Arduino.cc,Turin, Italy), this was selected because of its simplistic (8-bit Architecture), compact design (67 mm× 54 mm, 25 g weight) and ample support material online (open source). With onboard 10-bit ADC,14-pin GPIO (General Purpose Input Output), serial communication peripherals (UART, I2C etc.)and FT232 USB-UART converter, it provides all in one solution for our requirements such that noexternal programmers are required, and interface with PC, GSM module and sensors is seamless.Its low power consumption is an added advantage, in our experiment, the power consumption varied(300~600 mW). In the algorithm, read ADC subroutine returns the values after 2.1 ms, thus oursampling rate is (1/2.1) 476 Hz, which is more than 20× faster than the usual drip rate (2 drops persecond). The communication module used is SIM900 GSM (SIMCom Wireless Solutions, Shanghai,China) which supports Quad Band: 850/900/1800/1900 MHz with GSM (2G) network. We interfacethis module with the Arduino using UART and control it via AT commands to specify cloud parameters,transmit data and receive responses.
The cloud platform used was Axelta Osmosis which provides secure API for easy integration toupload collected data and retrieve data for monitoring. Data is sent to cloud platform via HTTPPOST calls in Java Script Object Notation (JSON) format and HTTP 200 code is received as anacknowledgement for each successful API call. The management console of the cloud platformprovides an easy GUI (Graphical User Interface) to add new devices and generate node keys. Oncegenerated, monitoring system queries cloud via API calls to retrieve data. The platform is scalable,multiple devices can be easily created, each for an IV setup and under each device, multiple nodescan be created for different parameters. This enables easy monitoring of multiple IV apparatus at the

J. Sens. Actuator Netw. 2019, 8, 2 7 of 20
same time. In our device three nodes were created, each for one parameter: volume left in the chamber,IR used and drip rate.
For analysis in the cloud, Rules perform checks on critical parameters to be monitored. For testingand validation, three rules were created. The volume rule was made to fire when volume left inchamber drops below 80% of the full chamber level. Secondly, LED detection rule fires when bothLEDs are not used for a drop detection. Thirdly, the drip rate rule fires when the drip rate is higher than150 or lower than 5. In conjunction with rules, alarms are used to perform a specific task or function,which are triggered when a rule fires (violated). There are various possibilities of alarms which can beused such as sending an email to a specified address, SMS or phone call to a mobile number.
Previously, there have been internet-based patient remote monitoring solutions [31], but in suchsolutions, there was a dependency on the platform such as Linux, Windows, Android [32], iOS whichran the application GUI. Limitation of such solution is the development time and costs which areincurred due to their diverse running environment. However, with a cloud-based solution, the OSdependency is removed. This enables any device with a web browser to have the monitoring GUI,increasing observability to detect any abnormality in real time. The report UI is user configurable andcan be customized as per the requirement of the hospital.
2.3. Algorithm Description and Cloud
2.3.1. Setup Loop
In setup loop, the hardware and software baud rates, the pins for IR LEDs, the calibration stateLED (include the third LED everywhere) and the buzzer was defined as the output. No power waschanneled through any of the output pins. Figure 4 show the block diagram of setup loop.
J. Sens. Actuator Netw. 2018, 7, x FOR PEER REVIEW 7 of 19
function, which are triggered when a rule fires (violated). There are various possibilities of alarms which can be used such as sending an email to a specified address, SMS or phone call to a mobile number.
Previously, there have been internet-based patient remote monitoring solutions [31], but in such solutions, there was a dependency on the platform such as Linux, Windows, Android [32], iOS which ran the application GUI. Limitation of such solution is the development time and costs which are incurred due to their diverse running environment. However, with a cloud-based solution, the OS dependency is removed. This enables any device with a web browser to have the monitoring GUI, increasing observability to detect any abnormality in real time. The report UI is user configurable and can be customized as per the requirement of the hospital.
2.3. Algorithm Description and Cloud
2.3.1. Setup Loop
In setup loop, the hardware and software baud rates, the pins for IR LEDs, the calibration state LED (include the third LED everywhere) and the buzzer was defined as the output. No power was channeled through any of the output pins. Figure 4 show the block diagram of setup loop.
Figure 4. Block diagram of setup loop.
2.3.2. Main Loop
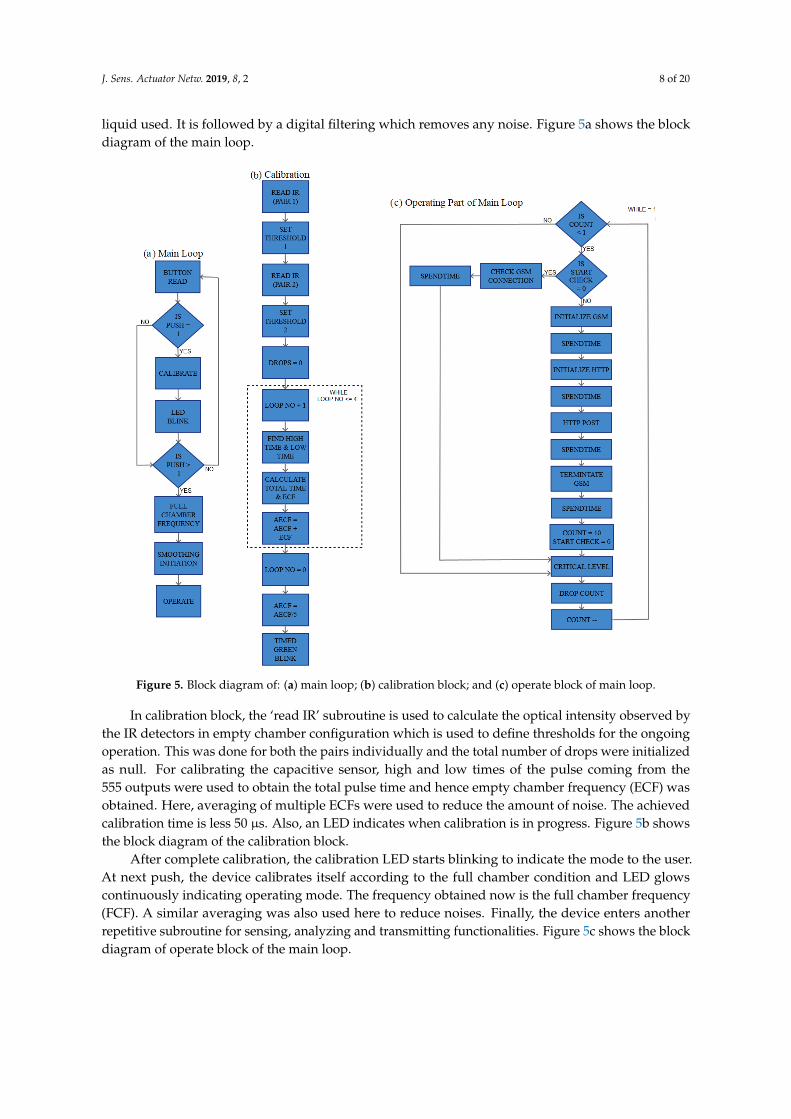
In the main loop, the push state of calibration button was checked. The procedure for calibrating the device is as follows, when the chamber is empty, the calibration button is pushed once, the dielectric material between the capacitive plates is air, hence the value of frequency (dependent on the capacitance value C) is calculated according to Equation (1), the device calibrates according to the optical properties of the empty chamber used and the calibration LED starts blinking. Now, the chamber casing can be removed and placed back after filling with the IV fluid. Next, the calibration button is pushed again, and the device configures the full chamber frequency depending upon the dielectric property of the liquid used. It is followed by a digital filtering which removes any noise. Figure 5a shows the block diagram of the main loop.
In calibration block, the ‘read IR’ subroutine is used to calculate the optical intensity observed by the IR detectors in empty chamber configuration which is used to define thresholds for the ongoing operation. This was done for both the pairs individually and the total number of drops were initialized as null. For calibrating the capacitive sensor, high and low times of the pulse coming from the 555 outputs were used to obtain the total pulse time and hence empty chamber frequency (ECF) was obtained. Here, averaging of multiple ECFs were used to reduce the amount of noise. The
Figure 4. Block diagram of setup loop.
2.3.2. Main Loop
In the main loop, the push state of calibration button was checked. The procedure for calibratingthe device is as follows, when the chamber is empty, the calibration button is pushed once, the dielectricmaterial between the capacitive plates is air, hence the value of frequency (dependent on the capacitancevalue C) is calculated according to Equation (1), the device calibrates according to the optical propertiesof the empty chamber used and the calibration LED starts blinking. Now, the chamber casing can beremoved and placed back after filling with the IV fluid. Next, the calibration button is pushed again,and the device configures the full chamber frequency depending upon the dielectric property of the
J. Sens. Actuator Netw. 2019, 8, 2 8 of 20
liquid used. It is followed by a digital filtering which removes any noise. Figure 5a shows the blockdiagram of the main loop.
J. Sens. Actuator Netw. 2018, 7, x FOR PEER REVIEW 8 of 19
achieved calibration time is less 50 µs. Also, an LED indicates when calibration is in progress. Figure 5b shows the block diagram of the calibration block.
After complete calibration, the calibration LED starts blinking to indicate the mode to the user. At next push, the device calibrates itself according to the full chamber condition and LED glows continuously indicating operating mode. The frequency obtained now is the full chamber frequency (FCF). A similar averaging was also used here to reduce noises. Finally, the device enters another repetitive subroutine for sensing, analyzing and transmitting functionalities. Figure 5c shows the block diagram of operate block of the main loop.
Figure 5. Block diagram of: (a) main loop; (b) calibration block; and (c) operate block of main loop.
2.3.3. GSM Initialization & GSM Termination
This function is used to initialize the GSM module. It is a device specific function, in which the initialization function is called to check if the module has been successfully initialized and a connection has been made. GSM Termination subroutine is used to terminate the GSM connection.
2.3.4. HTTP Initialization
This function is used to establish HTTP connection with the server where data logging is being done. Once established, it allows the data collected at the device to be transmitted following the HTTP protocol. These parameters for establishing the connection and posting data to the cloud have been provided by the cloud provider [33]. Figure 6 shows the block diagram of HTTP initialization.
Figure 5. Block diagram of: (a) main loop; (b) calibration block; and (c) operate block of main loop.
In calibration block, the ‘read IR’ subroutine is used to calculate the optical intensity observed bythe IR detectors in empty chamber configuration which is used to define thresholds for the ongoingoperation. This was done for both the pairs individually and the total number of drops were initializedas null. For calibrating the capacitive sensor, high and low times of the pulse coming from the555 outputs were used to obtain the total pulse time and hence empty chamber frequency (ECF) wasobtained. Here, averaging of multiple ECFs were used to reduce the amount of noise. The achievedcalibration time is less 50 µs. Also, an LED indicates when calibration is in progress. Figure 5b showsthe block diagram of the calibration block.
After complete calibration, the calibration LED starts blinking to indicate the mode to the user.At next push, the device calibrates itself according to the full chamber condition and LED glowscontinuously indicating operating mode. The frequency obtained now is the full chamber frequency(FCF). A similar averaging was also used here to reduce noises. Finally, the device enters anotherrepetitive subroutine for sensing, analyzing and transmitting functionalities. Figure 5c shows the blockdiagram of operate block of the main loop.

J. Sens. Actuator Netw. 2019, 8, 2 9 of 20
2.3.3. GSM Initialization & GSM Termination
This function is used to initialize the GSM module. It is a device specific function, in which theinitialization function is called to check if the module has been successfully initialized and a connectionhas been made. GSM Termination subroutine is used to terminate the GSM connection.
2.3.4. HTTP Initialization
This function is used to establish HTTP connection with the server where data logging is beingdone. Once established, it allows the data collected at the device to be transmitted following the HTTPprotocol. These parameters for establishing the connection and posting data to the cloud have beenprovided by the cloud provider [33]. Figure 6 shows the block diagram of HTTP initialization.J. Sens. Actuator Netw. 2018, 7, x FOR PEER REVIEW 9 of 19
Figure 6. Block diagram of Hyper Text Transfer Protocol (HTTP) initialization.
2.3.5. Post Data
In this function, a string of data is formed containing all the relevant information, such as the device key, drip rate, volume left in the chamber, etc., which is to be transmitted to the cloud. After formation of this string of data, suffixes were added, and the data is posted using cloud defined functions. Figure 7 shows the block diagram of HTTP post.
Figure 7. Block diagram of HTTP post.
2.3.6. Drop Count
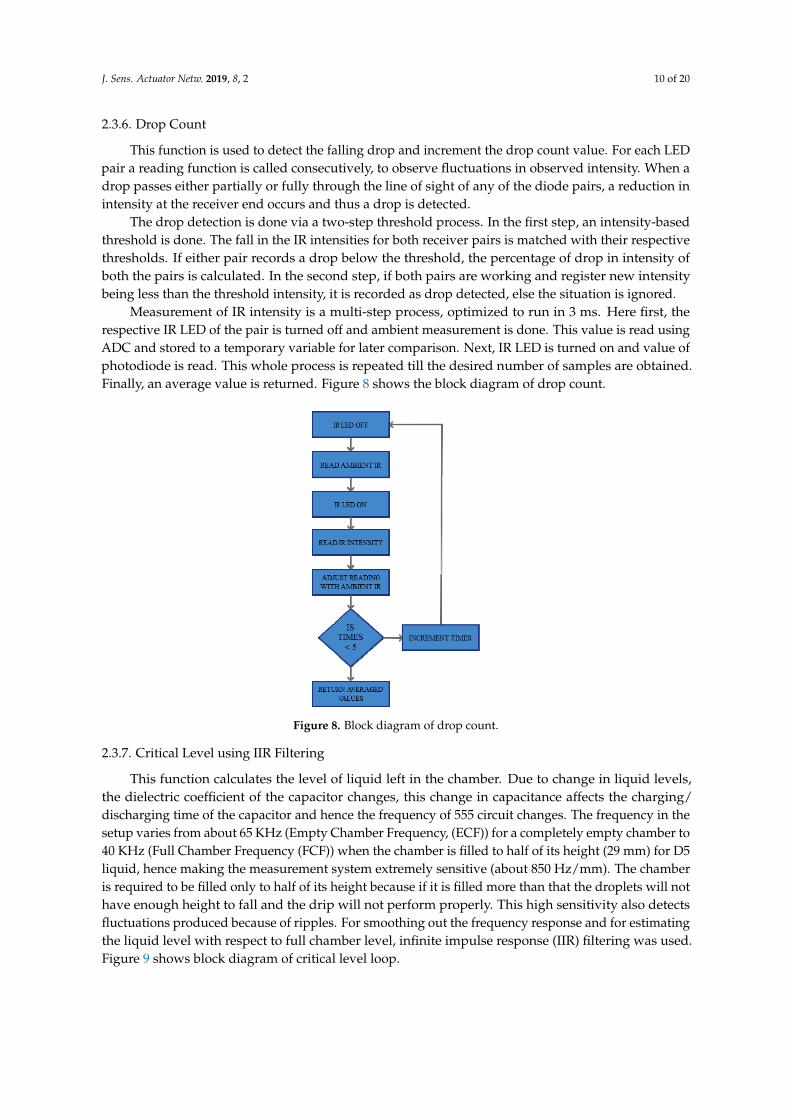
This function is used to detect the falling drop and increment the drop count value. For each LED pair a reading function is called consecutively, to observe fluctuations in observed intensity. When a drop passes either partially or fully through the line of sight of any of the diode pairs, a reduction in intensity at the receiver end occurs and thus a drop is detected.
The drop detection is done via a two-step threshold process. In the first step, an intensity-based threshold is done. The fall in the IR intensities for both receiver pairs is matched with their respective thresholds. If either pair records a drop below the threshold, the percentage of drop in intensity of both the pairs is calculated. In the second step, if both pairs are working and register new intensity being less than the threshold intensity, it is recorded as drop detected, else the situation is ignored.
Measurement of IR intensity is a multi-step process, optimized to run in 3 ms. Here first, the respective IR LED of the pair is turned off and ambient measurement is done. This value is read using ADC and stored to a temporary variable for later comparison. Next, IR LED is turned on and
Figure 6. Block diagram of Hyper Text Transfer Protocol (HTTP) initialization.
2.3.5. Post Data
In this function, a string of data is formed containing all the relevant information, such as thedevice key, drip rate, volume left in the chamber, etc., which is to be transmitted to the cloud. Afterformation of this string of data, suffixes were added, and the data is posted using cloud definedfunctions. Figure 7 shows the block diagram of HTTP post.
J. Sens. Actuator Netw. 2018, 7, x FOR PEER REVIEW 9 of 19
Figure 6. Block diagram of Hyper Text Transfer Protocol (HTTP) initialization.
2.3.5. Post Data
In this function, a string of data is formed containing all the relevant information, such as the device key, drip rate, volume left in the chamber, etc., which is to be transmitted to the cloud. After formation of this string of data, suffixes were added, and the data is posted using cloud defined functions. Figure 7 shows the block diagram of HTTP post.
Figure 7. Block diagram of HTTP post.
2.3.6. Drop Count
This function is used to detect the falling drop and increment the drop count value. For each LED pair a reading function is called consecutively, to observe fluctuations in observed intensity. When a drop passes either partially or fully through the line of sight of any of the diode pairs, a reduction in intensity at the receiver end occurs and thus a drop is detected.
The drop detection is done via a two-step threshold process. In the first step, an intensity-based threshold is done. The fall in the IR intensities for both receiver pairs is matched with their respective thresholds. If either pair records a drop below the threshold, the percentage of drop in intensity of both the pairs is calculated. In the second step, if both pairs are working and register new intensity being less than the threshold intensity, it is recorded as drop detected, else the situation is ignored.
Measurement of IR intensity is a multi-step process, optimized to run in 3 ms. Here first, the respective IR LED of the pair is turned off and ambient measurement is done. This value is read using ADC and stored to a temporary variable for later comparison. Next, IR LED is turned on and
Figure 7. Block diagram of HTTP post.
J. Sens. Actuator Netw. 2019, 8, 2 10 of 20
2.3.6. Drop Count
This function is used to detect the falling drop and increment the drop count value. For each LEDpair a reading function is called consecutively, to observe fluctuations in observed intensity. When adrop passes either partially or fully through the line of sight of any of the diode pairs, a reduction inintensity at the receiver end occurs and thus a drop is detected.
The drop detection is done via a two-step threshold process. In the first step, an intensity-basedthreshold is done. The fall in the IR intensities for both receiver pairs is matched with their respectivethresholds. If either pair records a drop below the threshold, the percentage of drop in intensity ofboth the pairs is calculated. In the second step, if both pairs are working and register new intensitybeing less than the threshold intensity, it is recorded as drop detected, else the situation is ignored.
Measurement of IR intensity is a multi-step process, optimized to run in 3 ms. Here first, therespective IR LED of the pair is turned off and ambient measurement is done. This value is read usingADC and stored to a temporary variable for later comparison. Next, IR LED is turned on and value ofphotodiode is read. This whole process is repeated till the desired number of samples are obtained.Finally, an average value is returned. Figure 8 shows the block diagram of drop count.
J. Sens. Actuator Netw. 2018, 7, x FOR PEER REVIEW 10 of 19
value of photodiode is read. This whole process is repeated till the desired number of samples are obtained. Finally, an average value is returned. Figure 8 shows the block diagram of drop count.
Figure 8. Block diagram of drop count.
2.3.7. Critical Level using IIR Filtering
This function calculates the level of liquid left in the chamber. Due to change in liquid levels, the dielectric coefficient of the capacitor changes, this change in capacitance affects the charging/discharging time of the capacitor and hence the frequency of 555 circuit changes. The frequency in the setup varies from about 65 KHz (Empty Chamber Frequency, (ECF)) for a completely empty chamber to 40 KHz (Full Chamber Frequency (FCF)) when the chamber is filled to half of its height (29 mm) for D5 liquid, hence making the measurement system extremely sensitive (about 850 Hz/mm). The chamber is required to be filled only to half of its height because if it is filled more than that the droplets will not have enough height to fall and the drip will not perform properly. This high sensitivity also detects fluctuations produced because of ripples. For smoothing out the frequency response and for estimating the liquid level with respect to full chamber level, infinite impulse response (IIR) filtering was used. Figure 9 shows block diagram of critical level loop.
Figure 9. Block diagram of critical level loop.
Figure 8. Block diagram of drop count.
2.3.7. Critical Level using IIR Filtering
This function calculates the level of liquid left in the chamber. Due to change in liquid levels,the dielectric coefficient of the capacitor changes, this change in capacitance affects the charging/discharging time of the capacitor and hence the frequency of 555 circuit changes. The frequency in thesetup varies from about 65 KHz (Empty Chamber Frequency, (ECF)) for a completely empty chamber to40 KHz (Full Chamber Frequency (FCF)) when the chamber is filled to half of its height (29 mm) for D5liquid, hence making the measurement system extremely sensitive (about 850 Hz/mm). The chamberis required to be filled only to half of its height because if it is filled more than that the droplets will nothave enough height to fall and the drip will not perform properly. This high sensitivity also detectsfluctuations produced because of ripples. For smoothing out the frequency response and for estimatingthe liquid level with respect to full chamber level, infinite impulse response (IIR) filtering was used.Figure 9 shows block diagram of critical level loop.

J. Sens. Actuator Netw. 2019, 8, 2 11 of 20
J. Sens. Actuator Netw. 2018, 7, x FOR PEER REVIEW 10 of 19
value of photodiode is read. This whole process is repeated till the desired number of samples are obtained. Finally, an average value is returned. Figure 8 shows the block diagram of drop count.
Figure 8. Block diagram of drop count.
2.3.7. Critical Level using IIR Filtering
This function calculates the level of liquid left in the chamber. Due to change in liquid levels, the dielectric coefficient of the capacitor changes, this change in capacitance affects the charging/discharging time of the capacitor and hence the frequency of 555 circuit changes. The frequency in the setup varies from about 65 KHz (Empty Chamber Frequency, (ECF)) for a completely empty chamber to 40 KHz (Full Chamber Frequency (FCF)) when the chamber is filled to half of its height (29 mm) for D5 liquid, hence making the measurement system extremely sensitive (about 850 Hz/mm). The chamber is required to be filled only to half of its height because if it is filled more than that the droplets will not have enough height to fall and the drip will not perform properly. This high sensitivity also detects fluctuations produced because of ripples. For smoothing out the frequency response and for estimating the liquid level with respect to full chamber level, infinite impulse response (IIR) filtering was used. Figure 9 shows block diagram of critical level loop.
Figure 9. Block diagram of critical level loop. Figure 9. Block diagram of critical level loop.
2.3.8. Spend Time
This function was used as a replacement for delays in GSM initialization and post datasubroutines. The function executes monitoring subroutines for a specified time. Doing this resultsin efficient utilization of resources alongside ensuring that critical parameters such as chamber levelare continuously monitored and no drop crossing the IR sensor pair is missed, thereby, increasingefficiency and reliability of the device. Figure 10 shows the block diagram of spend time loop.
J. Sens. Actuator Netw. 2018, 7, x FOR PEER REVIEW 11 of 19
2.3.8. Spend Time
This function was used as a replacement for delays in GSM initialization and post data subroutines. The function executes monitoring subroutines for a specified time. Doing this results in efficient utilization of resources alongside ensuring that critical parameters such as chamber level are continuously monitored and no drop crossing the IR sensor pair is missed, thereby, increasing efficiency and reliability of the device. Figure 10 shows the block diagram of spend time loop.
Figure 10. Block diagram of spend time loop.
2.3.9. Green Blink and Timed Green Blink
These subroutines tell the user if the device is in the calibration mode or not via the calibration LED. The green blink fragment alternatively makes the calibration LED high and low. The alternation is executed along with ‘timed push read’ subroutine so that no button push is missed. The timed green blink subroutine is a way of calling the green blink subroutine for a fixed time. This was also an alternative to delays and added more functionality to the device. Figure 11 shows the block diagram of (a) green blink; (b) timed green blink blocks.
Figure 11. Block diagram of: (a) green blink and (b) timed green blink blocks.
2.3.10. Push Read and Timed Push Read
The function makes use of push read as its subroutine. The uses of both are described as follows. The function push read ensures that the digital input which is read at a pin is read only once for each switch press.
In mechanical switches, a push button press can cause voltage fluctuations. To avoid reading these fluctuating or any stray voltages as pushes, a de-bounce delay was used. Here, the pulse must
Figure 10. Block diagram of spend time loop.
2.3.9. Green Blink and Timed Green Blink
These subroutines tell the user if the device is in the calibration mode or not via the calibrationLED. The green blink fragment alternatively makes the calibration LED high and low. The alternationis executed along with ‘timed push read’ subroutine so that no button push is missed. The timedgreen blink subroutine is a way of calling the green blink subroutine for a fixed time. This was also analternative to delays and added more functionality to the device. Figure 11 shows the block diagramof (a) green blink; (b) timed green blink blocks.

J. Sens. Actuator Netw. 2019, 8, 2 12 of 20
J. Sens. Actuator Netw. 2018, 7, x FOR PEER REVIEW 11 of 19
2.3.8. Spend Time
This function was used as a replacement for delays in GSM initialization and post data subroutines. The function executes monitoring subroutines for a specified time. Doing this results in efficient utilization of resources alongside ensuring that critical parameters such as chamber level are continuously monitored and no drop crossing the IR sensor pair is missed, thereby, increasing efficiency and reliability of the device. Figure 10 shows the block diagram of spend time loop.
Figure 10. Block diagram of spend time loop.
2.3.9. Green Blink and Timed Green Blink
These subroutines tell the user if the device is in the calibration mode or not via the calibration LED. The green blink fragment alternatively makes the calibration LED high and low. The alternation is executed along with ‘timed push read’ subroutine so that no button push is missed. The timed green blink subroutine is a way of calling the green blink subroutine for a fixed time. This was also an alternative to delays and added more functionality to the device. Figure 11 shows the block diagram of (a) green blink; (b) timed green blink blocks.
Figure 11. Block diagram of: (a) green blink and (b) timed green blink blocks.
2.3.10. Push Read and Timed Push Read
The function makes use of push read as its subroutine. The uses of both are described as follows. The function push read ensures that the digital input which is read at a pin is read only once for each switch press.
In mechanical switches, a push button press can cause voltage fluctuations. To avoid reading these fluctuating or any stray voltages as pushes, a de-bounce delay was used. Here, the pulse must
Figure 11. Block diagram of: (a) green blink and (b) timed green blink blocks.
2.3.10. Push Read and Timed Push Read
The function makes use of push read as its subroutine. The uses of both are described as follows.The function push read ensures that the digital input which is read at a pin is read only once for eachswitch press.
In mechanical switches, a push button press can cause voltage fluctuations. To avoid readingthese fluctuating or any stray voltages as pushes, a de-bounce delay was used. Here, the pulse muststay as high state for settling time of at least 50 ms to read it as a high. Timed push read function takesan input argument of spend time, which is the time allowed for push read to run through. Figure 12shows the block diagram of (a) push read; (b) timed push read blocks.
J. Sens. Actuator Netw. 2018, 7, x FOR PEER REVIEW 12 of 19
stay as high state for settling time of at least 50 ms to read it as a high. Timed push read function takes an input argument of spend time, which is the time allowed for push read to run through. Figure 12 shows the block diagram of (a) push read; (b) timed push read blocks.
Figure 12. Block diagram of: (a) push read and (b) timed push read blocks.
2.3.11. GSM Response and GSM Connection Check
The former displays the response messages received from the GSM module. The latter is used to check if the GSM connection is stable or not.
3. Results
All the following experiments were at least performed with Dextrose 5% in Water (D5W or D5). D5 was chosen because it is one of the most common fluids involved in the general IV therapy. Moreover, some experiments like ‘stability of level detection’ and ‘change in the liquid used’ were performed with four different fluids, namely D5, Dextrose 25% in Water (D25), tap water, and packaged drinking water. D25 is another common liquid used in IV therapy. This, along with two different water samples, were selected because different IV fluids have somewhat different optical and material properties but having water as a major component and hence system robustness on these liquids can be tested. Furthermore, as the sensor unit uses optical principle for drop detection, it was crucial to test the device for different ambient conditions, which was done for the test ‘change in ambient condition’. All the other tests were performed in a regular indoor hospital scenario.
The LED used graphs show which LED transmitter-receiver pair (also mentioned simply as LED pair) detected the falling drop. In the graphs below, numbers 1 and 2 shows that one of the two pairs detected the falling drop. The pairs are named as left and right, respectively. Whereas, 3 shows that both the pairs detected the falling drop simultaneously.
3.1. Accuracy of Drop Count
A manual drop count was performed to ensure that the device is counting each falling drop. As the drip chamber is almost covered by the sensor casing, there is very limited space available for verification of the drop count by other mechanisms. Moreover, manual drop count is a standard
Figure 12. Block diagram of: (a) push read and (b) timed push read blocks.
2.3.11. GSM Response and GSM Connection Check
The former displays the response messages received from the GSM module. The latter is used tocheck if the GSM connection is stable or not.

J. Sens. Actuator Netw. 2019, 8, 2 13 of 20
3. Results
All the following experiments were at least performed with Dextrose 5% in Water (D5W or D5).D5 was chosen because it is one of the most common fluids involved in the general IV therapy.Moreover, some experiments like ‘stability of level detection’ and ‘change in the liquid used’ wereperformed with four different fluids, namely D5, Dextrose 25% in Water (D25), tap water, and packageddrinking water. D25 is another common liquid used in IV therapy. This, along with two differentwater samples, were selected because different IV fluids have somewhat different optical and materialproperties but having water as a major component and hence system robustness on these liquids canbe tested. Furthermore, as the sensor unit uses optical principle for drop detection, it was crucial to testthe device for different ambient conditions, which was done for the test ‘change in ambient condition’.All the other tests were performed in a regular indoor hospital scenario.
The LED used graphs show which LED transmitter-receiver pair (also mentioned simply as LEDpair) detected the falling drop. In the graphs below, numbers 1 and 2 shows that one of the two pairsdetected the falling drop. The pairs are named as left and right, respectively. Whereas, 3 shows thatboth the pairs detected the falling drop simultaneously.
3.1. Accuracy of Drop Count
A manual drop count was performed to ensure that the device is counting each falling drop.As the drip chamber is almost covered by the sensor casing, there is very limited space availablefor verification of the drop count by other mechanisms. Moreover, manual drop count is a standardpractice in the IV therapy and hence, it can be efficiently used as a cheap and robust solution for thisverification. Further, it was also made sure that every falling drop is counted only once. The devicewas operated 25 times on different IV speeds with a manual count made alongside. A drop count of 50was made each time and the device detected each count without any error.
3.2. Stability of Level Detection
Stability of level detection is an important parameter to ensure that the readout is stable duringdevice operation. To do that four sets of readings were made with different fluids to ensure that thereadouts are not affected by the fluid change. The drips were operated at different speeds to ensurethat the readouts were also not affected by drip rate. The readouts were performed for around 30 seach. Figure 13 shows the stability of level detection for D5 and D25.
J. Sens. Actuator Netw. 2018, 7, x FOR PEER REVIEW 13 of 19
practice in the IV therapy and hence, it can be efficiently used as a cheap and robust solution for this verification. Further, it was also made sure that every falling drop is counted only once. The device was operated 25 times on different IV speeds with a manual count made alongside. A drop count of 50 was made each time and the device detected each count without any error.
3.2. Stability of Level Detection
Stability of level detection is an important parameter to ensure that the readout is stable during device operation. To do that four sets of readings were made with different fluids to ensure that the readouts are not affected by the fluid change. The drips were operated at different speeds to ensure that the readouts were also not affected by drip rate. The readouts were performed for around 30 s each. Figure 13 shows the stability of level detection for D5 and D25.
Figure 13. Stability of level detection for (a) Dextrose 5% in Water (D5); (b) Dextrose 25% in Water (D25).
The readouts are quite stable with time. If needed, the noise associated can be removed using software filtering or parasitic reduction. As the level detection is done by capacitive setup, the readouts are unaffected by ambient IR.
3.3. Change in Fluid Used
Because of difference in optical properties of IV fluids, it was necessary to test the device on different fluids as mentioned previously. The device should be able to detect the number drops accurately independent of the fluid used. D5 and D25 are also the two most transparent fluids used in the IV therapy because the majority of their content is water. Testing on these fluids will ensure that the device will perform more robustly on more opaque fluids like blood. Secondly, it was very crucial to know that during the operation of the device using the above-mentioned fluids which pair of LEDs were responsible to detect the falling drops. As the output of both the LEDs was logged onto separate controller pins, these pins were consecutively read to know the LED pair(s) responsible for detection. Figure 14 shows the percentage use of LED pairs with the different fluid used.
Figure 14. Percentage use of LED pairs with different fluid used.
In the graph above, 1 shows that only LED pair 1 was responsible, 2 shows that only 2 was responsible, and 3 shows that both the led pairs for that particular readout. It can be seen that in 95% of detection cases, both the pairs were able to detect a falling drop. In only 5% of cases a single LED
Figure 13. Stability of level detection for (a) Dextrose 5% in Water (D5); (b) Dextrose 25% in Water(D25).
The readouts are quite stable with time. If needed, the noise associated can be removed usingsoftware filtering or parasitic reduction. As the level detection is done by capacitive setup, the readoutsare unaffected by ambient IR.
3.3. Change in Fluid Used
Because of difference in optical properties of IV fluids, it was necessary to test the device ondifferent fluids as mentioned previously. The device should be able to detect the number drops

J. Sens. Actuator Netw. 2019, 8, 2 14 of 20
accurately independent of the fluid used. D5 and D25 are also the two most transparent fluids used inthe IV therapy because the majority of their content is water. Testing on these fluids will ensure thatthe device will perform more robustly on more opaque fluids like blood. Secondly, it was very crucialto know that during the operation of the device using the above-mentioned fluids which pair of LEDswere responsible to detect the falling drops. As the output of both the LEDs was logged onto separatecontroller pins, these pins were consecutively read to know the LED pair(s) responsible for detection.Figure 14 shows the percentage use of LED pairs with the different fluid used.
J. Sens. Actuator Netw. 2018, 7, x FOR PEER REVIEW 13 of 19
practice in the IV therapy and hence, it can be efficiently used as a cheap and robust solution for this verification. Further, it was also made sure that every falling drop is counted only once. The device was operated 25 times on different IV speeds with a manual count made alongside. A drop count of 50 was made each time and the device detected each count without any error.
3.2. Stability of Level Detection
Stability of level detection is an important parameter to ensure that the readout is stable during device operation. To do that four sets of readings were made with different fluids to ensure that the readouts are not affected by the fluid change. The drips were operated at different speeds to ensure that the readouts were also not affected by drip rate. The readouts were performed for around 30 s each. Figure 13 shows the stability of level detection for D5 and D25.
Figure 13. Stability of level detection for (a) Dextrose 5% in Water (D5); (b) Dextrose 25% in Water (D25).
The readouts are quite stable with time. If needed, the noise associated can be removed using software filtering or parasitic reduction. As the level detection is done by capacitive setup, the readouts are unaffected by ambient IR.
3.3. Change in Fluid Used
Because of difference in optical properties of IV fluids, it was necessary to test the device on different fluids as mentioned previously. The device should be able to detect the number drops accurately independent of the fluid used. D5 and D25 are also the two most transparent fluids used in the IV therapy because the majority of their content is water. Testing on these fluids will ensure that the device will perform more robustly on more opaque fluids like blood. Secondly, it was very crucial to know that during the operation of the device using the above-mentioned fluids which pair of LEDs were responsible to detect the falling drops. As the output of both the LEDs was logged onto separate controller pins, these pins were consecutively read to know the LED pair(s) responsible for detection. Figure 14 shows the percentage use of LED pairs with the different fluid used.
Figure 14. Percentage use of LED pairs with different fluid used.
In the graph above, 1 shows that only LED pair 1 was responsible, 2 shows that only 2 was responsible, and 3 shows that both the led pairs for that particular readout. It can be seen that in 95% of detection cases, both the pairs were able to detect a falling drop. In only 5% of cases a single LED
Figure 14. Percentage use of LED pairs with different fluid used.
In the graph above, 1 shows that only LED pair 1 was responsible, 2 shows that only 2 wasresponsible, and 3 shows that both the led pairs for that particular readout. It can be seen that in 95% ofdetection cases, both the pairs were able to detect a falling drop. In only 5% of cases a single LED pairdetected the falling drop. The lesser sensitivity for the second pair may be because of various reasonslike droplets on the side walls of the chamber. These droplets reduce the intensity of light reachingthe detector and hence reduce the sensitivity of the pair if compared to the other pair. Another reasoncan be changed in ambient condition as the device operates, the effect of which is studied in the nextsection. Figure 15 shows the graph between drop count and LED used for the different fluid used.From both the graphs it can be seen that the failure of LED pair is consistent during one device settingwhich indicate that the failure might be because of chamber conditions and will be explored in a laterwork with long term device testing.
J. Sens. Actuator Netw. 2018, 7, x FOR PEER REVIEW 14 of 19
pair detected the falling drop. The lesser sensitivity for the second pair may be because of various reasons like droplets on the side walls of the chamber. These droplets reduce the intensity of light reaching the detector and hence reduce the sensitivity of the pair if compared to the other pair. Another reason can be changed in ambient condition as the device operates, the effect of which is studied in the next section. Figure 15 shows the graph between drop count and LED used for the different fluid used. From both the graphs it can be seen that the failure of LED pair is consistent during one device setting which indicate that the failure might be because of chamber conditions and will be explored in a later work with long term device testing.
Figure 15. Graph between drop count and LED used for different fluid used.
3.4. Change in Ambient Conditions
Here, the influence of environmental conditions on device operation was observed. As the drop detection mechanism was optical, stray IR illuminations can cause distortions in operation and can cause drop detection to fail or give false results. However, change in ambient IR light does not cause major functional failures in the prototype since the algorithm has been designed to calibrate on the go. To verify this, the experiment was performed in three different conditions, namely cloudy, home, and night, without changing the drip placement. It was important to ensure that there were no drops on the drip chamber because these droplets can cause a lesser sensitivity of the sensor pairs. As the chamber positioning was not changed, the device was unaffected by drip chamber variations and the readouts were only sensitive to changes in ambient conditions.
Cloudy was a readout in an outdoor environment on a cloudy day where the changes in ambient conditions are very frequent and severe as compared to a normal hospital condition. Secondly, the home condition was a regular indoor hospital environment during the daytime. Finally, the night was a condition in an indoor environment during night time, where ambient and changes in it are significantly lesser than the other two conditions. In these three conditions, both the LED pairs detected drops 97%, 99%, and 100%, respectively.
This output was expected as a cloudy environment shows a higher variation in the intensity and hence reduce the sensitivity of the device for actual drop in the transmitted IR intensity. Whereas, the night condition shows a lower amount of variation as compared to home conditions. Also, these variations are not as high as variations for fluid change where the chamber was repositioned for every case, thereby confirming the reliability of the system. Figure 16 shows the drop count and LED used in different ambient conditions.
Figure 16. Drop count and LED used in different ambient conditions.
Figure 15. Graph between drop count and LED used for different fluid used.
3.4. Change in Ambient Conditions
Here, the influence of environmental conditions on device operation was observed. As the dropdetection mechanism was optical, stray IR illuminations can cause distortions in operation and cancause drop detection to fail or give false results. However, change in ambient IR light does not causemajor functional failures in the prototype since the algorithm has been designed to calibrate on thego. To verify this, the experiment was performed in three different conditions, namely cloudy, home,and night, without changing the drip placement. It was important to ensure that there were no dropson the drip chamber because these droplets can cause a lesser sensitivity of the sensor pairs. As thechamber positioning was not changed, the device was unaffected by drip chamber variations and thereadouts were only sensitive to changes in ambient conditions.

J. Sens. Actuator Netw. 2019, 8, 2 15 of 20
Cloudy was a readout in an outdoor environment on a cloudy day where the changes in ambientconditions are very frequent and severe as compared to a normal hospital condition. Secondly,the home condition was a regular indoor hospital environment during the daytime. Finally, the nightwas a condition in an indoor environment during night time, where ambient and changes in it aresignificantly lesser than the other two conditions. In these three conditions, both the LED pairs detecteddrops 97%, 99%, and 100%, respectively.
This output was expected as a cloudy environment shows a higher variation in the intensity andhence reduce the sensitivity of the device for actual drop in the transmitted IR intensity. Whereas,the night condition shows a lower amount of variation as compared to home conditions. Also, thesevariations are not as high as variations for fluid change where the chamber was repositioned for everycase, thereby confirming the reliability of the system. Figure 16 shows the drop count and LED used indifferent ambient conditions.
J. Sens. Actuator Netw. 2018, 7, x FOR PEER REVIEW 14 of 19
pair detected the falling drop. The lesser sensitivity for the second pair may be because of various reasons like droplets on the side walls of the chamber. These droplets reduce the intensity of light reaching the detector and hence reduce the sensitivity of the pair if compared to the other pair. Another reason can be changed in ambient condition as the device operates, the effect of which is studied in the next section. Figure 15 shows the graph between drop count and LED used for the different fluid used. From both the graphs it can be seen that the failure of LED pair is consistent during one device setting which indicate that the failure might be because of chamber conditions and will be explored in a later work with long term device testing.
Figure 15. Graph between drop count and LED used for different fluid used.
3.4. Change in Ambient Conditions
Here, the influence of environmental conditions on device operation was observed. As the drop detection mechanism was optical, stray IR illuminations can cause distortions in operation and can cause drop detection to fail or give false results. However, change in ambient IR light does not cause major functional failures in the prototype since the algorithm has been designed to calibrate on the go. To verify this, the experiment was performed in three different conditions, namely cloudy, home, and night, without changing the drip placement. It was important to ensure that there were no drops on the drip chamber because these droplets can cause a lesser sensitivity of the sensor pairs. As the chamber positioning was not changed, the device was unaffected by drip chamber variations and the readouts were only sensitive to changes in ambient conditions.
Cloudy was a readout in an outdoor environment on a cloudy day where the changes in ambient conditions are very frequent and severe as compared to a normal hospital condition. Secondly, the home condition was a regular indoor hospital environment during the daytime. Finally, the night was a condition in an indoor environment during night time, where ambient and changes in it are significantly lesser than the other two conditions. In these three conditions, both the LED pairs detected drops 97%, 99%, and 100%, respectively.
This output was expected as a cloudy environment shows a higher variation in the intensity and hence reduce the sensitivity of the device for actual drop in the transmitted IR intensity. Whereas, the night condition shows a lower amount of variation as compared to home conditions. Also, these variations are not as high as variations for fluid change where the chamber was repositioned for every case, thereby confirming the reliability of the system. Figure 16 shows the drop count and LED used in different ambient conditions.
Figure 16. Drop count and LED used in different ambient conditions. Figure 16. Drop count and LED used in different ambient conditions.
3.5. End Chamber Conditions
During the end chamber conditions, the bottle completely drains out and the liquid level in thechamber starts to fall. This is detected by the change in capacitance value and hence is not affectedby the ambient lighting. According to the theory of Equations (1) and (2), it can be concluded thatfrequency is inversely proportional to the relative permittivity, (higher frequency for empty chamber,lower frequency for full chamber). The relative variation of frequency is used to determine the liquidlevel. As mentioned in Section 2.3.7, the empty chamber frequency (ECF) is 65 kHz, the full chamberfrequency (FCF) is 40 kHz, for each read out of frequency value is stored in a variable in Arduino,named new chamber frequency (NCF), the liquid level (%) remaining can be determined by theformulae shown in Equation (3).
Level(%) =
∣∣∣∣NCF − ECFFCF − ECF
∣∣∣∣× 100 (3)
However, as different fluids have different dielectric values, these readouts were performed fordifferent fluids, namely D5, D25, and packaged drinking water and at varying drip rates. Figure 17shows fall in observed chamber percentage during end chamber conditions.
J. Sens. Actuator Netw. 2018, 7, x FOR PEER REVIEW 15 of 19
3.5. End Chamber Conditions
During the end chamber conditions, the bottle completely drains out and the liquid level in the chamber starts to fall. This is detected by the change in capacitance value and hence is not affected by the ambient lighting. According to the theory of Equations (1) and (2), it can be concluded that frequency is inversely proportional to the relative permittivity, (higher frequency for empty chamber, lower frequency for full chamber). The relative variation of frequency is used to determine the liquid level. As mentioned in section 2.3.7, the empty chamber frequency (ECF) is 65 kHz, the full chamber frequency (FCF) is 40 kHz, for each read out of frequency value is stored in a variable in Arduino, named new chamber frequency (NCF), the liquid level (%) remaining can be determined by the formulae shown in Equation (3).
e (%) 100NCF ECFL velFCF ECF
−= ×−
(3)
However, as different fluids have different dielectric values, these readouts were performed for different fluids, namely D5, D25, and packaged drinking water and at varying drip rates. Figure 17 shows fall in observed chamber percentage during end chamber conditions.
Figure 17. Fall in observed chamber percentage during end chamber conditions.
The slopes in the graph are directly proportional the drip rates. The drips were operated from a complete fill to a complete empty condition for every readout. The device was calibrated for empty chamber during calibration loop of each readout and so set a new reference empty for every readout. It can be observed that the drips didn’t end at a zero. Still, the continuous falling slopes indicate a drop-in level and can be used as a reliable indicator for chamber end. This can be resolved by improving the algorithm in future work. Analysis of end chamber conditions is essential so that an alarm can be triggered timely for the hospital staff to take appropriate action, manipulation of these results is explained further in the Cloud results section.
3.6. LED Malfunction
Another important part of the study was to observe device response if one of the LED pairs fail. These malfunctions can be of two types, working malfunction or inherent malfunction. A working malfunction, here, is defined when a pair fails to operate while the device was operating. This kind of malfunction is more critical as the pair malfunctions during operations and the new readouts should not detect the false positives. Meanwhile, the other LED pair should keep on detecting the drops accurately. Figure 18 shows LED pair used during working malfunction.
Figure 17. Fall in observed chamber percentage during end chamber conditions.

J. Sens. Actuator Netw. 2019, 8, 2 16 of 20
The slopes in the graph are directly proportional the drip rates. The drips were operated from acomplete fill to a complete empty condition for every readout. The device was calibrated for emptychamber during calibration loop of each readout and so set a new reference empty for every readout.It can be observed that the drips didn’t end at a zero. Still, the continuous falling slopes indicatea drop-in level and can be used as a reliable indicator for chamber end. This can be resolved byimproving the algorithm in future work. Analysis of end chamber conditions is essential so that analarm can be triggered timely for the hospital staff to take appropriate action, manipulation of theseresults is explained further in the Cloud results section.
3.6. LED Malfunction
Another important part of the study was to observe device response if one of the LED pairs fail.These malfunctions can be of two types, working malfunction or inherent malfunction. A workingmalfunction, here, is defined when a pair fails to operate while the device was operating. This kind ofmalfunction is more critical as the pair malfunctions during operations and the new readouts shouldnot detect the false positives. Meanwhile, the other LED pair should keep on detecting the dropsaccurately. Figure 18 shows LED pair used during working malfunction.J. Sens. Actuator Netw. 2018, 7, x FOR PEER REVIEW 16 of 19
Figure 18. LED pair used during working malfunction.
A set of 100 drops was used for this experiment. At drop number 20, the wire from IR emitter was disconnected to emulate the malfunction of that LED pair. The device was operated at this stage for about 40 readings and then the wire was reattached. This test was performed for both LED pairs and the results can be seen above. The drawback of operating at a single LED pair is the reduction in the chamber area covered by the sensors, but as seen from the graph above, the device will still stay properly functional and accurately detect each drop. In order to verify that the device is counting every falling drop, a manual count was also performed alongside.
An issue present, as can be seen, was reduction in sensitivity of an LED pair when the wire was attached again. This can arise from lost calibration for LED pairs in the prototype. As the wires were manually handled, the force applied can move the emitters from their initial positions. For an actual device, a working malfunction will happen when an emitter stops temporarily, and this will not move it from its initial position and hence no loss of calibration will be there if it works again. The second type of malfunction is an inherent malfunction. Here, the device was operated with LED’s wire removed from the start. The device was again operated with sets of 100 drops for malfunction of each pair. In an inherent malfunction, the device was able to detect every drop and a verification was again performed with a manual count for the readouts alongside. Like the previous case, the device performed accurately even after a reduction in the effective chamber area. Figure 19 shows LED pair used during inherent malfunction.
Figure 19. LED pair used during inherent malfunction.
3.7. Cloud Results
These tests were performed to provide the device readouts on the cloud dashboard. The first experiment was conducted in normal hospital operating conditions, a new bottle of D5 was attached to the IV, the prototype was calibrated for empty and full chamber conditions and the drip was started at a moderate rate. The drip was run for 10 min and output stability was checked for both chamber level and drip rate. Figure 20a shows the dashboard report of volume left in the chamber and Figure 20b shows a graph of the drip rate on normal operation.
Figure 18. LED pair used during working malfunction.
A set of 100 drops was used for this experiment. At drop number 20, the wire from IR emitterwas disconnected to emulate the malfunction of that LED pair. The device was operated at this stagefor about 40 readings and then the wire was reattached. This test was performed for both LED pairsand the results can be seen above. The drawback of operating at a single LED pair is the reductionin the chamber area covered by the sensors, but as seen from the graph above, the device will stillstay properly functional and accurately detect each drop. In order to verify that the device is countingevery falling drop, a manual count was also performed alongside.
An issue present, as can be seen, was reduction in sensitivity of an LED pair when the wirewas attached again. This can arise from lost calibration for LED pairs in the prototype. As the wireswere manually handled, the force applied can move the emitters from their initial positions. For anactual device, a working malfunction will happen when an emitter stops temporarily, and this willnot move it from its initial position and hence no loss of calibration will be there if it works again.The second type of malfunction is an inherent malfunction. Here, the device was operated with LED’swire removed from the start. The device was again operated with sets of 100 drops for malfunction ofeach pair. In an inherent malfunction, the device was able to detect every drop and a verification wasagain performed with a manual count for the readouts alongside. Like the previous case, the deviceperformed accurately even after a reduction in the effective chamber area. Figure 19 shows LED pairused during inherent malfunction.

J. Sens. Actuator Netw. 2019, 8, 2 17 of 20
J. Sens. Actuator Netw. 2018, 7, x FOR PEER REVIEW 16 of 19
Figure 18. LED pair used during working malfunction.
A set of 100 drops was used for this experiment. At drop number 20, the wire from IR emitter was disconnected to emulate the malfunction of that LED pair. The device was operated at this stage for about 40 readings and then the wire was reattached. This test was performed for both LED pairs and the results can be seen above. The drawback of operating at a single LED pair is the reduction in the chamber area covered by the sensors, but as seen from the graph above, the device will still stay properly functional and accurately detect each drop. In order to verify that the device is counting every falling drop, a manual count was also performed alongside.
An issue present, as can be seen, was reduction in sensitivity of an LED pair when the wire was attached again. This can arise from lost calibration for LED pairs in the prototype. As the wires were manually handled, the force applied can move the emitters from their initial positions. For an actual device, a working malfunction will happen when an emitter stops temporarily, and this will not move it from its initial position and hence no loss of calibration will be there if it works again. The second type of malfunction is an inherent malfunction. Here, the device was operated with LED’s wire removed from the start. The device was again operated with sets of 100 drops for malfunction of each pair. In an inherent malfunction, the device was able to detect every drop and a verification was again performed with a manual count for the readouts alongside. Like the previous case, the device performed accurately even after a reduction in the effective chamber area. Figure 19 shows LED pair used during inherent malfunction.
Figure 19. LED pair used during inherent malfunction.
3.7. Cloud Results
These tests were performed to provide the device readouts on the cloud dashboard. The first experiment was conducted in normal hospital operating conditions, a new bottle of D5 was attached to the IV, the prototype was calibrated for empty and full chamber conditions and the drip was started at a moderate rate. The drip was run for 10 min and output stability was checked for both chamber level and drip rate. Figure 20a shows the dashboard report of volume left in the chamber and Figure 20b shows a graph of the drip rate on normal operation.
Figure 19. LED pair used during inherent malfunction.
3.7. Cloud Results
These tests were performed to provide the device readouts on the cloud dashboard. The firstexperiment was conducted in normal hospital operating conditions, a new bottle of D5 was attached tothe IV, the prototype was calibrated for empty and full chamber conditions and the drip was started ata moderate rate. The drip was run for 10 min and output stability was checked for both chamber leveland drip rate. Figure 20a shows the dashboard report of volume left in the chamber and Figure 20bshows a graph of the drip rate on normal operation.J. Sens. Actuator Netw. 2018, 7, x FOR PEER REVIEW 17 of 19
Figure 20. Dashboard report of: (a) volume left in chamber and (b) drip rate.
As can be seen, the results obtained on the cloud are much less volatile and stabilized from the device end, especially for volume left in the chamber. As the cloud results are collected over longer durations, hence are averaged values rather than instantaneous readouts that have lesser noise component. Another functionality of the dashboard is to give out real-time alerts if any of the rules, such as volume left in chamber or drip rate, is violated. To demonstrate this, the device was operated in end chamber conditions. Figure 21 shows instance of volume alarm being triggered as soon as the volume left in chamber dropped below 80%. Therefore, the graph changes the color from green to red, indicating a danger scenario.
Figure 21. Danger alarm for end chamber conditions.
4. Discussion
In the current work, an internet-connected IV drip monitoring platform was prototyped and tested based on seven points of interests. First, the device was tested for accuracy by matching the number of drops obtained by the device with a manual count. This comparison was made several times during the study to ensure proper working when both the pairs were working or one of the malfunctions. The device had an accuracy of 100%. Second, the device provides a stable output and the results do not drift with time. The device showed stable outputs for different fluids used and for various drip rates. Third, the device was able to detect the falling drops even when the administered fluid was changed four times and at different drip rates. Fourth, the device was tested in different ambient conditions. Next, the device tested for end chamber conditions, which was done for different fluids. Here, the chamber was operated from a full condition to a completely empty condition. The level readouts from the device show a falling slope which indicates the decrease in chamber levels and hence indicate end chamber conditions.
5. Conclusions
The sixth point of interest was to know if the device will be able to function properly when one of the LED pairs malfunctions. Two types of malfunction were emulated. The results show that,
Figure 20. Dashboard report of: (a) volume left in chamber and (b) drip rate.
As can be seen, the results obtained on the cloud are much less volatile and stabilized fromthe device end, especially for volume left in the chamber. As the cloud results are collected overlonger durations, hence are averaged values rather than instantaneous readouts that have lesser noisecomponent. Another functionality of the dashboard is to give out real-time alerts if any of the rules,such as volume left in chamber or drip rate, is violated. To demonstrate this, the device was operatedin end chamber conditions. Figure 21 shows instance of volume alarm being triggered as soon as thevolume left in chamber dropped below 80%. Therefore, the graph changes the color from green to red,indicating a danger scenario.
J. Sens. Actuator Netw. 2018, 7, x FOR PEER REVIEW 17 of 19
Figure 20. Dashboard report of: (a) volume left in chamber and (b) drip rate.
As can be seen, the results obtained on the cloud are much less volatile and stabilized from the device end, especially for volume left in the chamber. As the cloud results are collected over longer durations, hence are averaged values rather than instantaneous readouts that have lesser noise component. Another functionality of the dashboard is to give out real-time alerts if any of the rules, such as volume left in chamber or drip rate, is violated. To demonstrate this, the device was operated in end chamber conditions. Figure 21 shows instance of volume alarm being triggered as soon as the volume left in chamber dropped below 80%. Therefore, the graph changes the color from green to red, indicating a danger scenario.
Figure 21. Danger alarm for end chamber conditions.
4. Discussion
In the current work, an internet-connected IV drip monitoring platform was prototyped and tested based on seven points of interests. First, the device was tested for accuracy by matching the number of drops obtained by the device with a manual count. This comparison was made several times during the study to ensure proper working when both the pairs were working or one of the malfunctions. The device had an accuracy of 100%. Second, the device provides a stable output and the results do not drift with time. The device showed stable outputs for different fluids used and for various drip rates. Third, the device was able to detect the falling drops even when the administered fluid was changed four times and at different drip rates. Fourth, the device was tested in different ambient conditions. Next, the device tested for end chamber conditions, which was done for different fluids. Here, the chamber was operated from a full condition to a completely empty condition. The level readouts from the device show a falling slope which indicates the decrease in chamber levels and hence indicate end chamber conditions.
5. Conclusions
The sixth point of interest was to know if the device will be able to function properly when one of the LED pairs malfunctions. Two types of malfunction were emulated. The results show that,
Figure 21. Danger alarm for end chamber conditions.

J. Sens. Actuator Netw. 2019, 8, 2 18 of 20
4. Discussion
In the current work, an internet-connected IV drip monitoring platform was prototyped and testedbased on seven points of interests. First, the device was tested for accuracy by matching the number ofdrops obtained by the device with a manual count. This comparison was made several times duringthe study to ensure proper working when both the pairs were working or one of the malfunctions.The device had an accuracy of 100%. Second, the device provides a stable output and the results donot drift with time. The device showed stable outputs for different fluids used and for various driprates. Third, the device was able to detect the falling drops even when the administered fluid waschanged four times and at different drip rates. Fourth, the device was tested in different ambientconditions. Next, the device tested for end chamber conditions, which was done for different fluids.Here, the chamber was operated from a full condition to a completely empty condition. The levelreadouts from the device show a falling slope which indicates the decrease in chamber levels andhence indicate end chamber conditions.
5. Conclusions
The sixth point of interest was to know if the device will be able to function properly when oneof the LED pairs malfunctions. Two types of malfunction were emulated. The results show that,during both types of malfunction, the device was able to detect the falling drops accurately. Next,the implementation of the prototype as an IoT solution was in emphasis. This point was about theinteraction of the device with the user to improve monitoring. It was achieved by data logging overinternet and cloud visualization. In concurrency with experiment and test cases described in previouspoints, the results were verified manually, on the device and cloud to check for the consistency of thesystem and all three sets of results were coherent. As the device is working efficiently for initial testing,next step is real-time patient monitoring.
Author Contributions: P.S. was involved in conceptualization, methodology, software, resources, validation,investigation, writing-original draft preparation, writing-review & editing, visualization, and supervision.M.K. was involved in methodology, software, resources, formal analysis, writing-original draft preparation,investigation, and writing-review & editing. A.S. was involved in conceptualization, methodology, software,resources, and data curation.
Funding: This research received no external funding.
Conflicts of Interest: The authors declare no conflict of interest.
References
1. Agarwal, S.S.; Kumar, L.; Chavali, K.H.; Mestri, S.C. Fatal Venous Air Embolism Following IntravenousInfusion. J Forensic Sci. 2009, 53, 682–684. [CrossRef] [PubMed]
2. Laskey, A.L.; Dyer, C.; Tobias, J.D. Venous Air Embolism During Home Infusion Therapy. Pediatrics 2002,109, e15. [CrossRef] [PubMed]
3. Senior, K. Wanted: 2.4 million nurses, and that’s just in India, Special theme—Health workforce retention inremote and rural areas. Bull. World Health Organ. 2010, 88, 327–328. [CrossRef] [PubMed]
4. Zhu, X.; You, L.M.; Zheng, J.; Liu, K.; Fang, J.B.; Hou, S.X.; Lu, M.M.; Lv, A.L.; Ma, W.G.; Wang, H.H.; et al.Nurse Staffing Levels Make a Difference on Patient Outcomes: A Multisite Study in Chinese Hospitals.J. Nurs. Scholarsh. 2012, 44, 266–273. [CrossRef] [PubMed]
5. Anliker, U.; Ward, J.A.; Lukowicz, P.; Dolveck, F.; Baer, M.; Keita, F.; Schenker, E.B.; Catarsi, F.; Coluccini, L.;Belardinelli, A.; et al. AMON: A Wearable Multiparameter Medical Monitoring and Alert System. IEEETrans. Inf. Technol. Biomed. 2004, 8, 415–427. [CrossRef] [PubMed]
6. Lee, R.G.; Chen, K.C.; Hsiao, C.C.; Tseng, C.L. A Mobile Care System with Alert Mechanism. IEEE Trans. Inf.Technol. Biomed. 2007, 11, 507–517. [CrossRef] [PubMed]
7. Paschou, M.; Sakkopoulos, E.; Sourla, E.; Tsakalidis, A. Health Internet of Things: Metrics and methods forefficient data transfer. Simul. Model. Pract. Theory 2013, 34, 186–199. [CrossRef]

J. Sens. Actuator Netw. 2019, 8, 2 19 of 20
8. Xu, B.; Xu, L.D.; Cai, H.; Xie, C.; Hu, J.; Bu, F. Ubiquitous Data Accessing Method in IoT-Based InformationSystem for Emergency Medical Services. IEEE Trans. Ind. Inf. 2014, 10, 1578–1586. [CrossRef]
9. Maia, P.; Batista, T.; Cavalcante, E.; Baffa, A.; Delicatod, F.C.; Pires, P.F.; Zomaya, A. A Web platform forinterconnecting body sensors and improving health care. Procedia Comput. Sci. 2014, 40, 135–142. [CrossRef]
10. Kamble, V.V.; Pandey, P.C.; Gadgil, C.P.; Choudhary, D.S. Monitoring of Intravenous Drip Rate.In Proceedings of the ICBME, Bangalore, India, 21–24 December 2001; pp. 51–55.
11. Thariyan, K.K.; Verma, S.; Taneja, S.R.; Gupta, R.C.; Ahluwalia, S.S. Design and Development of a UniqueDrop Sensing Unit for Infusion Pump. J. Sci. Ind. Res. 2002, 61, 798–801.
12. Bilbao, U.; Bustamante, P.; Guarretxena, N.; Domingo, J.S. A new Wireless Sensor for Intravenous DrippingDetection. In Proceedings of the International Conference on Sensor Technologies and Applications, Valencia,Spain, 14–20 October 2007; IEEE: Piscataway, NJ, USA, 2007; pp. 30–35.
13. Yang, W.; Sun, L. A novel medical infusion monitoring system based on ZigBee wireless sensor network. InProceedings of the 2009 International Symposium on Web Information Systems and Applications (WISA’09),Nanchang, China, 22–24 May 2009; Springer: New York, NY, USA; pp. 291–293.
14. Bustamante, P.; Solas, G.; Grandez, K.; Bilbao, U. A new Wireless Sensor for Intravenous Dripping Detection.Int. J. Adv. Netw. Serv. 2010, 3, 50–58.
15. Vasuki, R.; Dennis, C.; Chander, H.P. Designing a portable monitoring device to measure the drips rate.Middle East J. Sci. Res. 2011, 1, 29–35.
16. Wei, Q.; Lee, J.H.; Seong, K.W.; Kim, M.N.; Cho, J.H. The Design of a Wireless Flexible Capacitive SensorDetection System to Detect Liquid Level in Plastic Bag Intravenous Drip Sets. Biomed Eng. Lett. 2011, 1,247–253. [CrossRef]
17. Cataldo, A.; Cannazza, G.; Giaquinto, N.; Trotta, A.; Andria, G. Microwave TDR for real-time control ofintravenous drip infusions. IEEE Trans. Inst. Meas. 2012, 61, 1866–1873. [CrossRef]
18. Du, Q.; Liu, J.; Tian, L. Simulation and Design of Intravenous Infusion Dripping Rate Detection based onInfrared Ray. In Proceedings of the 3rd International Conference on Multimedia Technology (ICMT 2013),Guangzhou, China, 29 November–1 December 2013; Atlantis Press: Paris, France, 2013. [CrossRef]
19. Chen, C.L.; Hsieh, N.C.; Hung, L.P. Developing a wireless based dynamic management mechanism forintravenous drip scheduling. Int. J. Ad Hoc Ubiquitous Comput. 2015, 19, 208–220. [CrossRef]
20. Priyadharshini, R.; Mithuna, S.; Vasanth, K.U.; Kalpana, D.S.; Suthanthira, V.N. Automatic Intravenous FluidLevel Indication System for Hospitals. Int. J. Res. Appl. Sci. Eng. Technol. 2015, 3, 427–432.
21. Alas, G.R.D., Jr.; Padilla, J.N.; Tanguilig, B.T., III. Intravenous piggyback infusion control and monitoringsystem using wireless technology. Int. J. Adv. Technol. Eng. Explor. 2016, 3, 50–57. [CrossRef]
22. Raghavendra, B.; Vijyalakshmi, K.; Arora, M. Intravenous Drip meter & controller, need analysis andconceptual design. In Proceedings of the 8th International Conference on Communication Systems &Networks (COMSNETS), Banglore, India, 5–9 January 2016; IEEE: Piscataway, NJ, USA, 2016; pp. 1–5.
23. Pandi, S.A.; Bharathi, S.; Bharathiraja, R.; Kiruthika, L.; Boopathy, S. Novel approach to maintain the realtime instantaneous data from patient using ultra low power micro controller. Int. J. Adv. Res. Compt. Sci.2017, 8, 452–455. [CrossRef]
24. Gayathri, S.; Ganesh, C.S.S. Automatic indication system of glucose level in glucose trip bottle. Int. J.Multidiscip. Res. Mod. Educ. 2017, 3, 148–151. [CrossRef]
25. Krishnasamy, R.R.; Shabana, N.; Tanmayee, P.; Loganathan, S.; Velmathi, G. Smart drip infusion monitoringsystem for instant alert—Through nRF24L01. In Proceedings of the International Conference on NextgenElectronics Technologies, Chennai, India, 23–25March 2017; IEEE: Piscataway, NJ, USA, 2017; pp. 452–455.
26. Zhang, H.; Li, J.; Wen, B.; Xun, Y.; Liu, J. Connecting intelligent things in smart hospitals using NB-IoT. IEEEInternet Things J. 2018, 5, 1550–1560. [CrossRef]
27. Kumar, C.R.; Vijayalakshmi, B.; Karthik, S.; Hanitha, R.; Hemapreetha, T. Drip rate monitor for infusionfluids. Taga J. 2018, 14, 2312–2316.
28. Alagundagi, S.S.; Pasala, K.; Arora, M. Opto-electronic system for intravenous infusion monitoring.In Proceedings of the 10th International Conference on Communication Systems & Networks (COMSNETS),Banglore, India, 3–7 January 2018; IEEE: Piscataway, NJ, USA, 2018; pp. 688–692.
29. Wang, S.; Jiang, B. Design of wireless infusion monitor based on bluetooth 4.0. In Proceedings of the 13thIEEE Conference on Industrial Electronics and Applications (ICIEA), Wuhan, China, 31 May–2 June 2018.

J. Sens. Actuator Netw. 2019, 8, 2 20 of 20
30. Arduino Documentation. Available online: https://www.arduino.cc/reference/en/language/functions/analog-io/analogread/ (accessed on 21 November 2018).
31. Várady, P.; Benyó, Z.; Benyó, B. An Open Architecture Patient Monitoring System Using StandardTechnologies. IEEE Trans. Inf. Technol. Biomed. 2002, 6, 95–98. [CrossRef] [PubMed]
32. Pan, D.; Dhall, R.; Lieberman, A.; Petitti, D.B. A Mobile Cloud-Based Parkinson’s Disease Assessment Systemfor Home-Based Monitoring. JMIR Mhealth Uhealth 2015, 3, e29. [CrossRef] [PubMed]
33. Axelta Internet Osmosis. Available online: http://aws2.axelta.com/ (accessed on 21 November 2018).
© 2018 by the authors. Licensee MDPI, Basel, Switzerland. This article is an open accessarticle distributed under the terms and conditions of the Creative Commons Attribution(CC BY) license (http://creativecommons.org/licenses/by/4.0/).