design fmea training for litens automotive
TRANSCRIPT

I S O / T S 1 6 9 4 9 R E G I S T E R E D • I S O 1 4 0 0 1 R E G I S T E R E D • w w w . l i t e n s . c o m
DESIGN FMEA Training developed for Litens Automotive
developed by Julian Kalac, P.Eng
Educational training for Litens Automotive
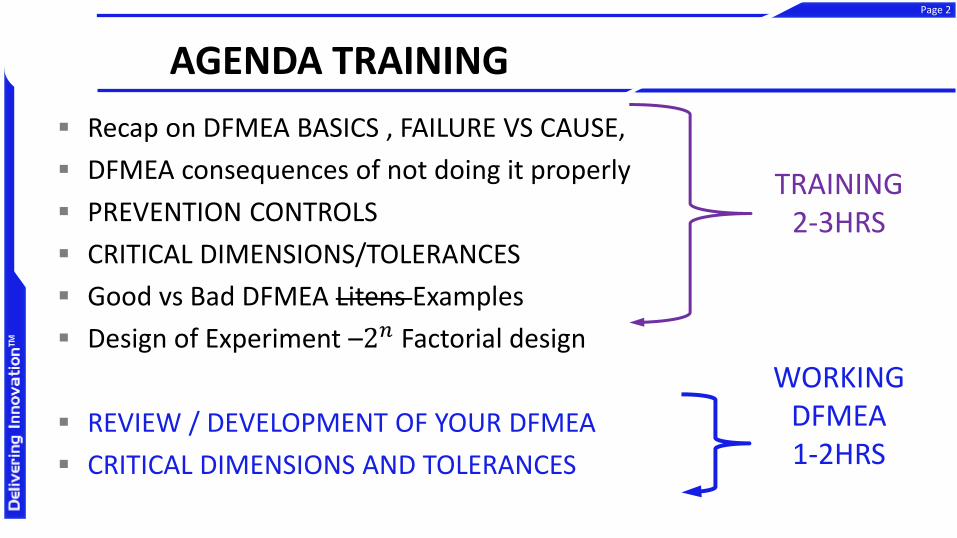
AGENDA TRAINING
Recap on DFMEA BASICS , FAILURE VS CAUSE,
DFMEA consequences of not doing it properly
PREVENTION CONTROLS
CRITICAL DIMENSIONS/TOLERANCES
Good vs Bad DFMEA Litens Examples
Design of Experiment –2𝑛 Factorial design
REVIEW / DEVELOPMENT OF YOUR DFMEA
CRITICAL DIMENSIONS AND TOLERANCES
September 15, 2016
Page 2
WORKING DFMEA 1-2HRS
TRAINING 2-3HRS
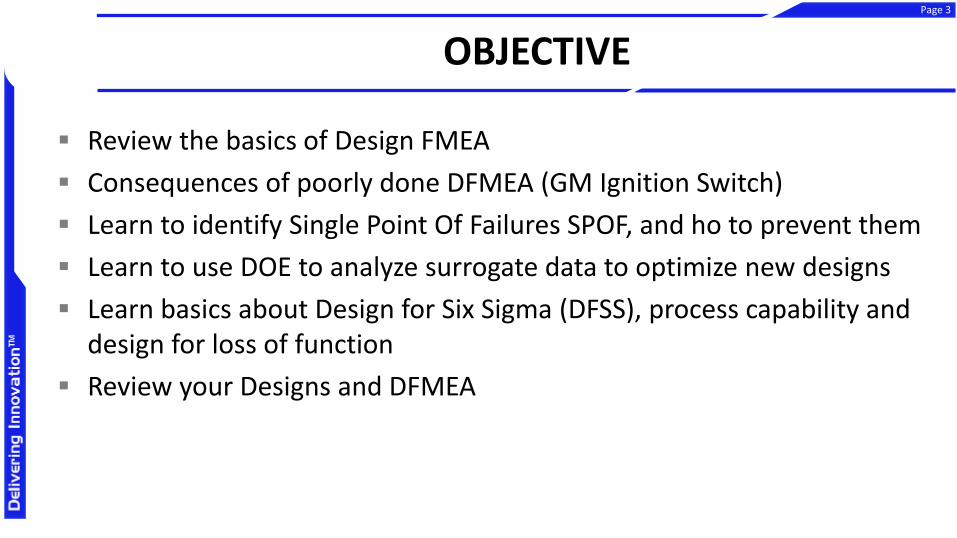
OBJECTIVE
Review the basics of Design FMEA
Consequences of poorly done DFMEA (GM Ignition Switch)
Learn to identify Single Point Of Failures SPOF, and ho to prevent them
Learn to use DOE to analyze surrogate data to optimize new designs
Learn basics about Design for Six Sigma (DFSS), process capability and design for loss of function
Review your Designs and DFMEA
September 15, 2016
Page 3
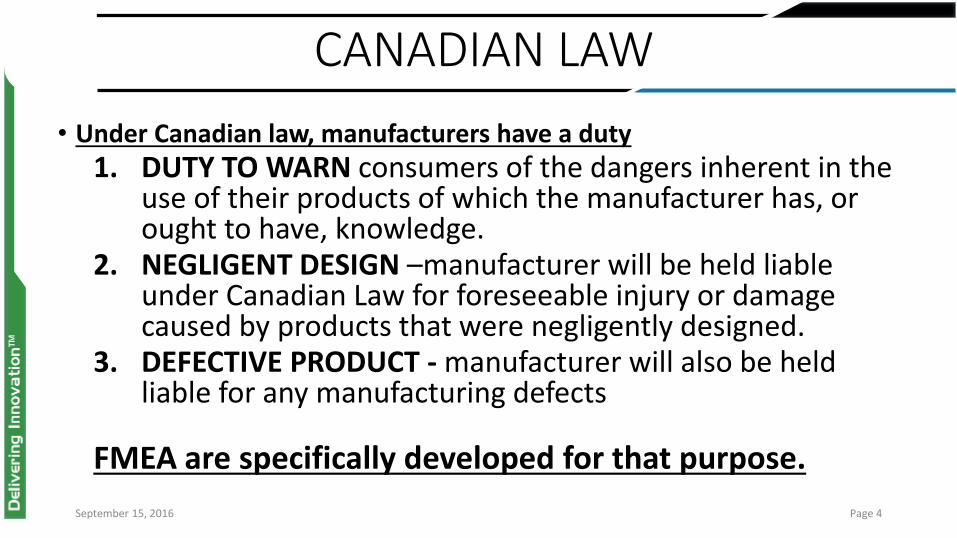
CANADIAN LAW
• Under Canadian law, manufacturers have a duty
1. DUTY TO WARN consumers of the dangers inherent in the use of their products of which the manufacturer has, or ought to have, knowledge.
2. NEGLIGENT DESIGN –manufacturer will be held liable under Canadian Law for foreseeable injury or damage caused by products that were negligently designed.
3. DEFECTIVE PRODUCT - manufacturer will also be held liable for any manufacturing defects
FMEA are specifically developed for that purpose.
September 15, 2016 Page 4

WHAT IS DFMEA ?
• Failure Mode and Effects Analysis (FMEA) is an engineering analysis tool used to identify and prevent failures before they actually happen
• DFMEA are used early in the development phase while the design can be changed as a Design Verification method
• The most efficient way to do a DFMEA is during the design review when, the entire design is being reviewed and the FMEA form can be used as a guide
• DFMEA IS NOT A FORM TO FILL OUT FOR COMPLIANCE REASONS
September 15, 2016
Page 5

September 15, 2016
WHAT IS DFMEA ? Page 6
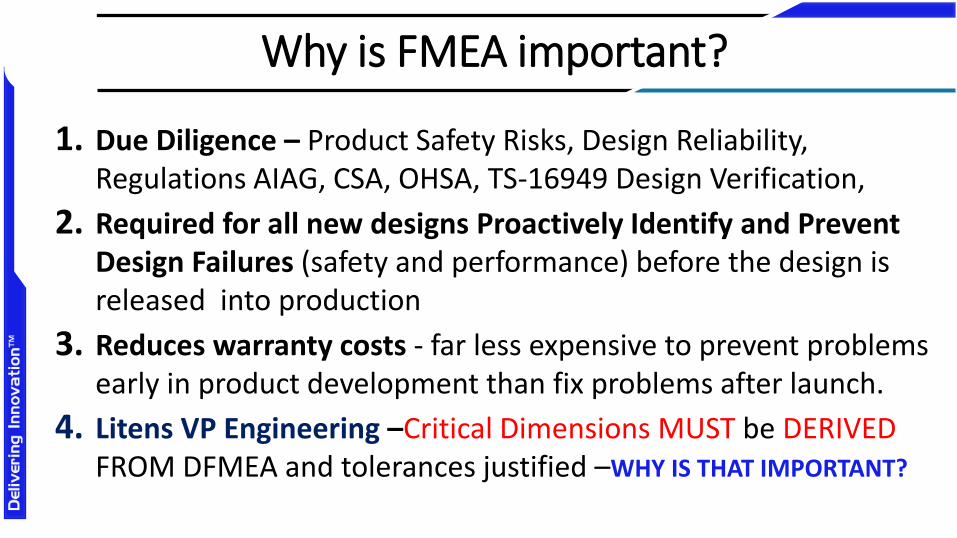
Why is FMEA important?
1. Due Diligence – Product Safety Risks, Design Reliability, Regulations AIAG, CSA, OHSA, TS-16949 Design Verification,
2. Required for all new designs Proactively Identify and Prevent Design Failures (safety and performance) before the design is released into production
3. Reduces warranty costs - far less expensive to prevent problems early in product development than fix problems after launch.
4. Litens VP Engineering –Critical Dimensions MUST be DERIVED FROM DFMEA and tolerances justified –WHY IS THAT IMPORTANT?

WHAT ARE OUTPUTS OF A DFMEA
1. list of Critical Component Dimensions , their specifications (dim/tolerance) and evidence SHOWING how the Critical Tolerance relates to the Cause of Failure
2. A list of potential Failure Modes and Causes, prioritized by RPN
3. A list of action items that have been taken or will be taken to PREVENT the Failures Modes/Causes before PPAP
4. DVP Verification Plan (Conditions, Acceptance Criteria)
5. Lessons learned
FMEAs are legal documents
It is important for the FMEA team to
understand that FMEAs are legal
documents that support the
demonstration of due care in product
development. As legal documents, they
are subject to subpoena for legal
proceedings.
FMEAs, published by John Wiley & Sons. [1]
September 15, 2016 Page 9
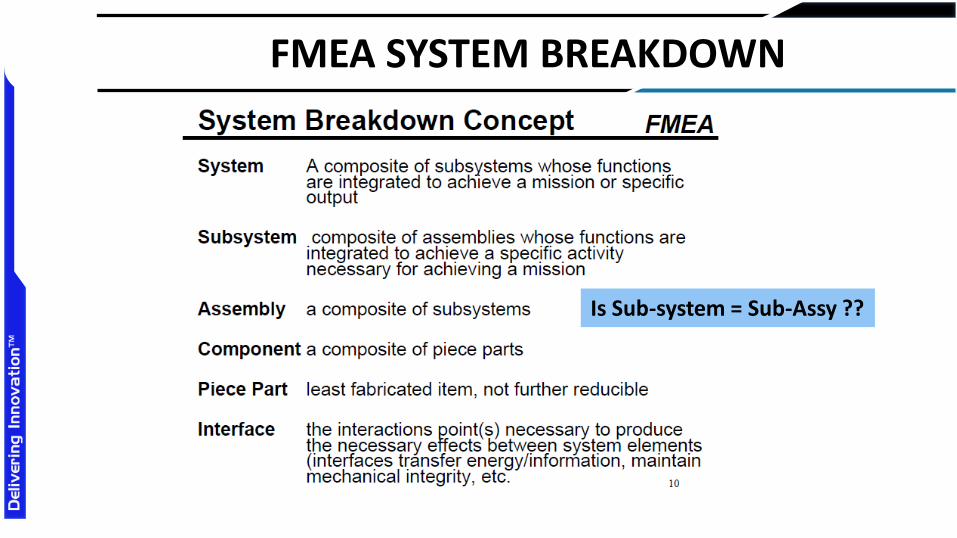
FMEA SYSTEM BREAKDOWN
Is Sub-system = Sub-Assy ??
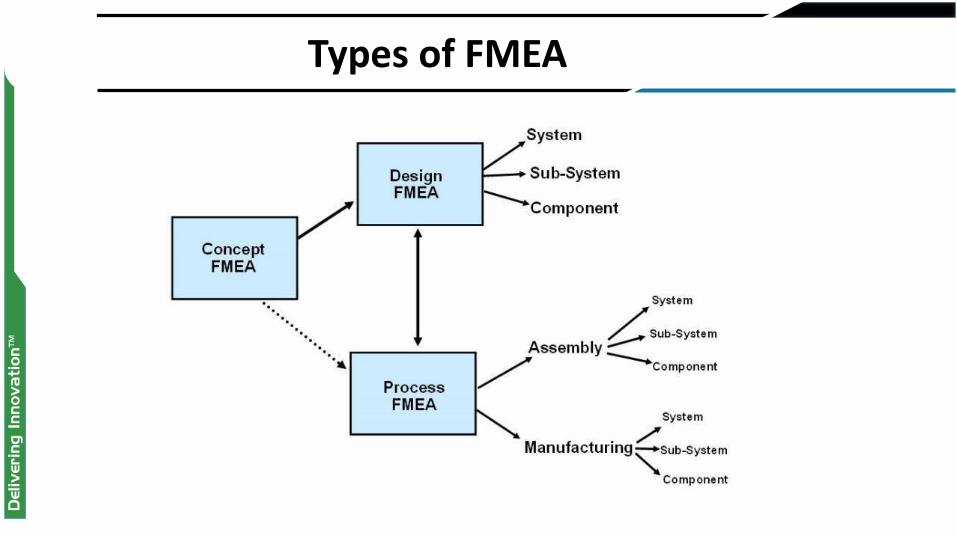
Types of FMEA
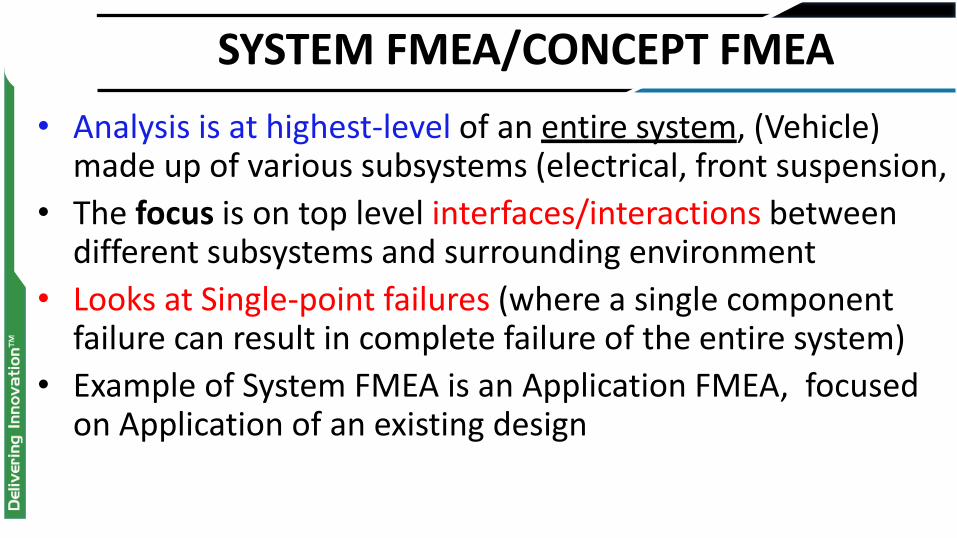
SYSTEM FMEA/CONCEPT FMEA
• Analysis is at highest-level of an entire system, (Vehicle) made up of various subsystems (electrical, front suspension,
• The focus is on top level interfaces/interactions between different subsystems and surrounding environment
• Looks at Single-point failures (where a single component failure can result in complete failure of the entire system)
• Example of System FMEA is an Application FMEA, focused on Application of an existing design

DESIGN FMEA
• Design FMEA evaluates the entire Product Design all levels contained within the boundaries of the product , (Final Assy, components, sub-assy)
• The scope of the Design FMEA includes the subsystem or component itself, as well as the interfaces between adjacent components.
• Critical dimensions are developed from critical failure modes within the DFMEA
• DVP&R Tests criteria are developed and confirmed
Process FMEA
• Process FMEA focuses on the design of the assembly process, development of process specifications in order to meet the critical dimensions specified in the DFMEA
• The scope of a Process FMEA can include manufacturing and assembly operations, shipping, incoming parts, transporting of materials, storage, conveyors, tool maintenance, and labeling.
WHEN TO DO A DFMEA?
Case 1: NEW DESIGNS, new technology, or new process. The scope of the FMEA is the complete design, technology or process.
Case 2: MODIFICATIONS TO EXISTING DESIGN or process (assumes there is a FMEA for the existing design or process). The scope of the FMEA should focus on the modification to design or process, possible interactions due to the modification, and field history.
Case 3: APPLICATION - Use of existing design in a new environment, or Application . The scope assumes there is an FMEA for the existing design or processes of the FMEA is the impact of the new APPLICATION or Environment on the existing design or process.


September 15, 2016
Page 17
September 15, 2016
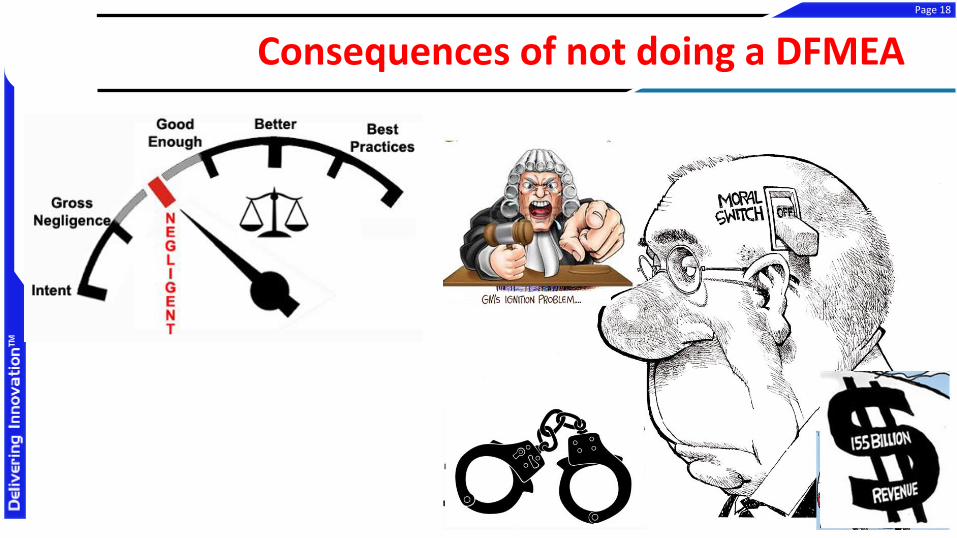
Consequences of not doing a DFMEA Page 18
September 15, 2016
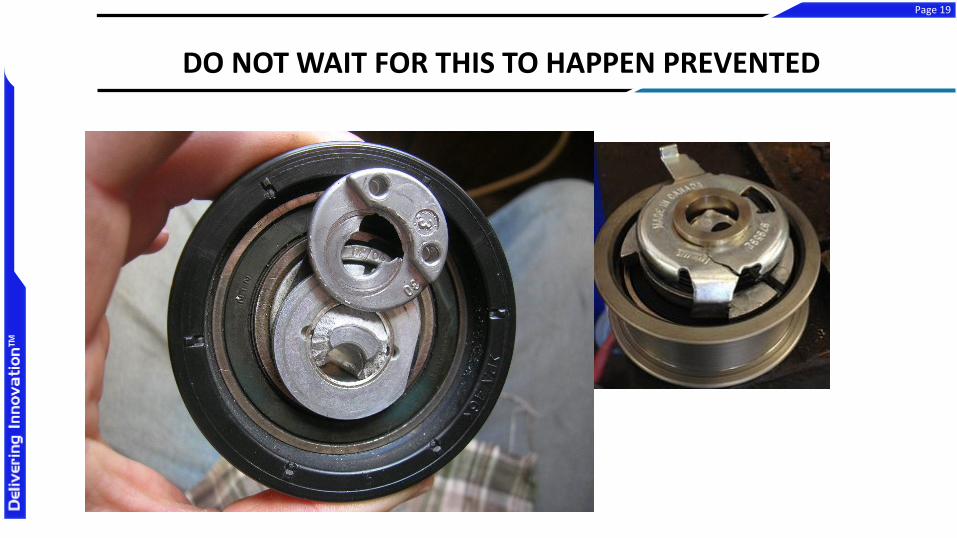
DO NOT WAIT FOR THIS TO HAPPEN PREVENTED
Page 19

September 15, 2016
BECAUSE THIS IS THE EFFECT
Page 20
September 15, 2016
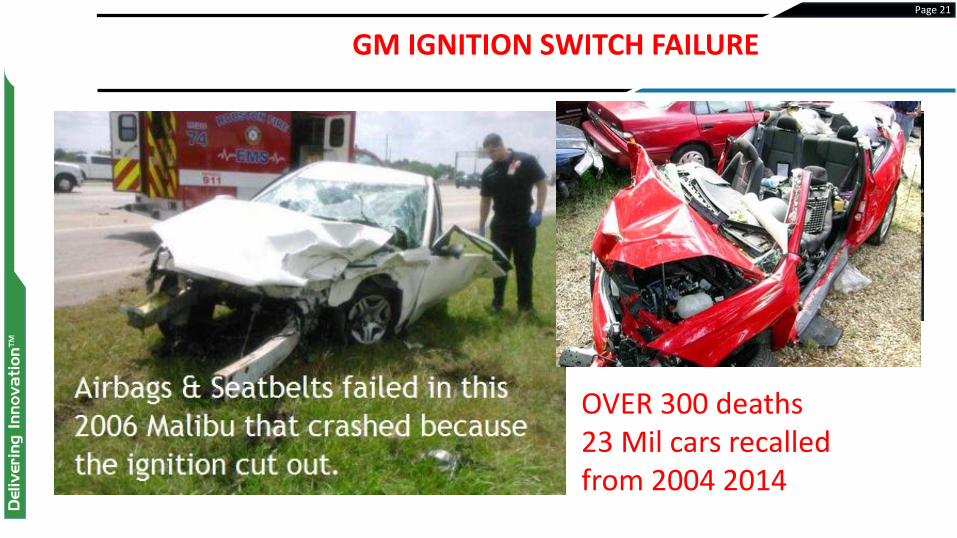
GM IGNITION SWITCH FAILURE
Page 21
OVER 300 deaths 23 Mil cars recalled from 2004 2014
GOOD PRACTICES TO AVOID BAD EVIDENCE
FMEA • It has to be done correctly: • A well-done and properly completed FMEA can be a
strong ally in the defense for the manufacturer in product litigation.
• On the other hand, a poorly done and haphazard completion of an FMEA can be used to support the prosecution. September 15, 2016 Page 22

September 15, 2016
IDENTIFY POTENTIAL FAILURE MODES WITH IGNITION SWITCH
Page 24
September 15, 2016
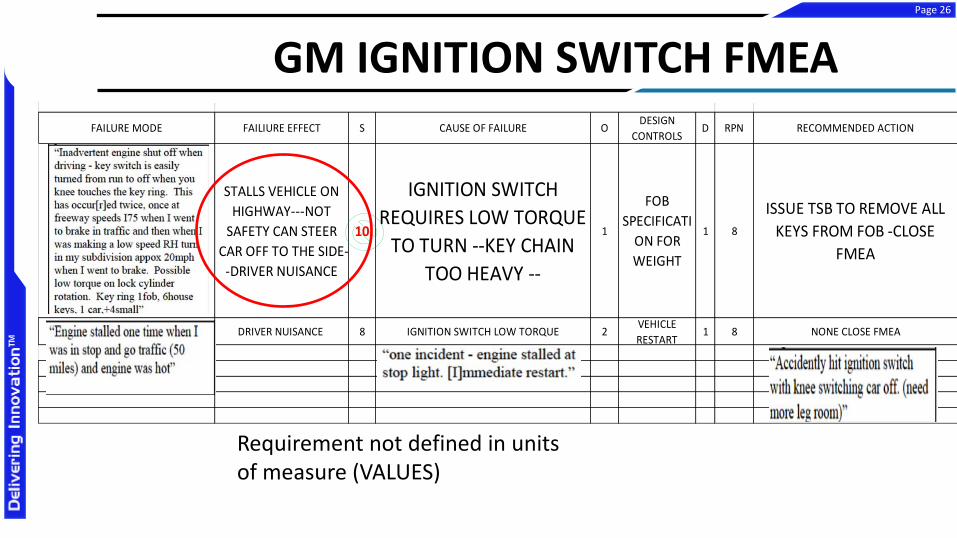
GM IGNITION SWITCH FMEA Page 26
GM IGNITION SWITCH FMEAFAILURE MODE FAILIURE EFFECT S CAUSE OF FAILURE O
DESIGN
CONTROLS D RPN RECOMMENDED ACTION
STALLS VEHICLE ON
HIGHWAY---NOT
SAFETY CAN STEER
CAR OFF TO THE SIDE-
-DRIVER NUISANCE
10
IGNITION SWITCH
REQUIRES LOW TORQUE
TO TURN --KEY CHAIN
TOO HEAVY --
1
FOB
SPECIFICATI
ON FOR
WEIGHT
1 8
ISSUE TSB TO REMOVE ALL
KEYS FROM FOB -CLOSE
FMEA
DRIVER NUISANCE 8 IGNITION SWITCH LOW TORQUE 2VEHICLE
RESTART1 8 NONE CLOSE FMEA
Requirement not defined in units of measure (VALUES)
Lessons Learned from GM ignition Switch
The Federal Crown Prosecutor report suggest that the original GM ignition switch specification contained vague and ambiguous targets for the detent torque, which were never achieved, and provides no evidence that the specification or acceptance criteria were developed using failure modes effects analysis or similar techniques.
As a direct result GM engineers failed to understand the significance of the available evidence for over ten years - and they never asked "Is the specification is fit for the purpose?" - with serious consequences for the company and it's consumers.
September 15, 2016
Page 27

September 15, 2016
EXPLOSIVE PINTO FUEL TANK DESIGN
Page 28
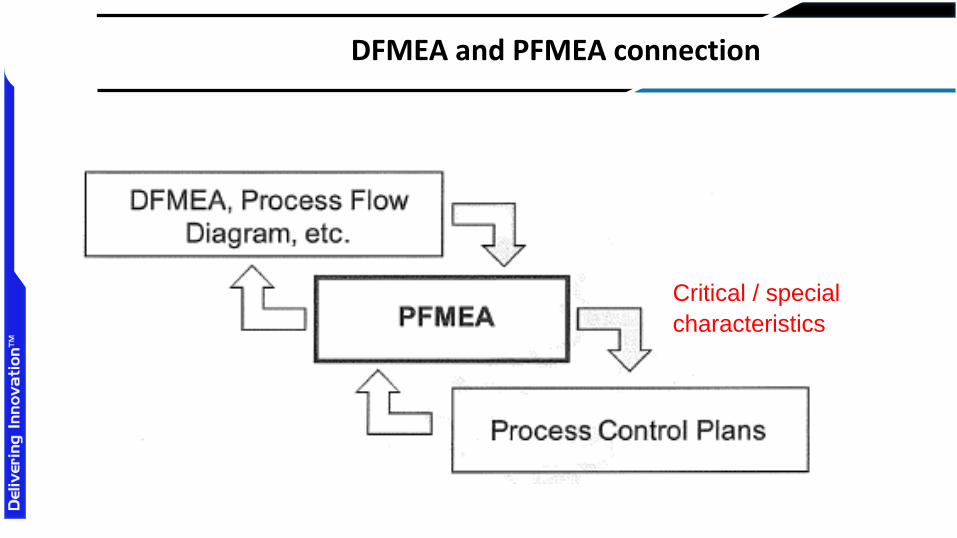
DFMEA and PFMEA connection
Critical / special
characteristics
Brooks Approval:
Date Approved:
Effectivity Date:
Part Number: PCP Number Prepared by:
Part Number Revision: PCP Revision Checked by:
Part Name: PCP Rev Date: Approval:
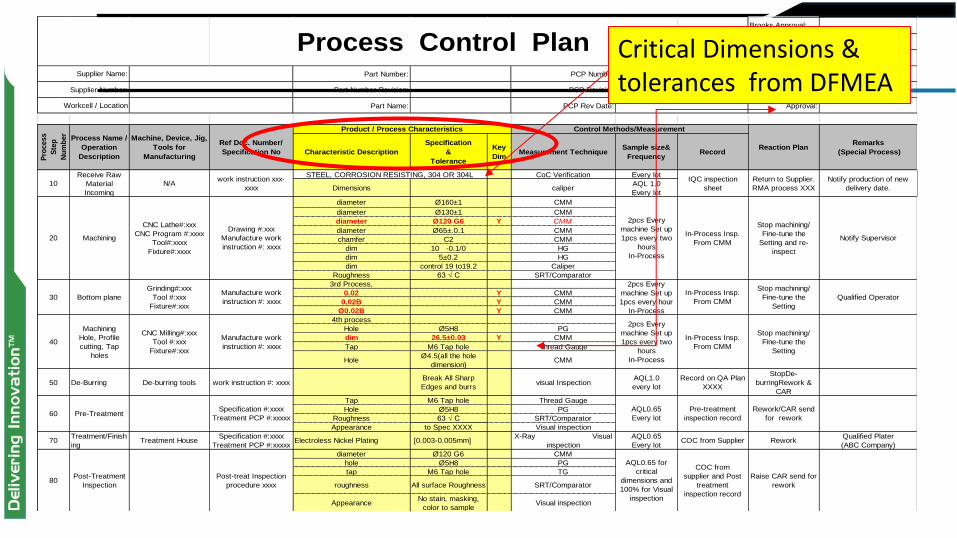
Characteristic Description
Specification
&
Tolerance
Key
DimMeasurement Technique
Sample size&
FrequencyRecord
CoC Verification Every lot
Dimensions caliperAQL 1.0
Every lot
diameter Ø160±1 CMM
diameter Ø130±1 CMM
diameter Ø120 G6 Y CMM
diameter Ø65±.0.1 CMM
chamfer C2 CMM
dim 10 -0.1/0 HG
dim 5±0.2 HG
dim control 19 to19.2 Caliper
Roughness 63 √ C SRT/Comparator
3rd Process,
0.02 Y CMM
0.02B Y CMM
Ø0.02B Y CMM
4th process
Hole Ø5H8 PG
dim 26.5±0.03 Y CMM
Tap M6 Tap hole Thread Gauge
HoleØ4.5(all the hole
dimension)CMM
50 De-Burring De-burring tools work instruction #: xxxxBreak All Sharp
Edges and burrsvisual Inspection
AQL1.0
every lot
Record on QA Plan
XXXX
StopDe-
burringRework &
CAR
Tap M6 Tap hole Thread Gauge
Hole Ø5H8 PG
Roughness 63 √ C SRT/Comparator
Appearance to Spec XXXX Visual inspection
70Treatment/Finish
ingTreatment House
Specification #:xxxx
Treatment PCP #:xxxxx Electroless Nickel Plating [0.003-0.005mm]
X-Ray Visual
inspection
AQL0.65
Every lotCOC from Supplier Rework
Qualified Plater
(ABC Company)
diameter Ø120 G6 CMM
hole Ø5H8 PG
tap M6 Tap hole TG
roughness All surface Roughness SRT/Comparator
AppearanceNo stain, masking,
color to sampleVisual inspection
90 Packagingwork instruction xxx-
xxxxVisual
Each Lot
Received
STD packaging
method
Repack and
Validate
100Out Going
Inspection
work instruction xxx-
xxxx
Refer to out going inspection
sheert
CMM
Visual
AQL 1.0 Every
lot
Review of QA Plan
XXXXXRaise CAR/Rework
Supplier Name:
Process Control Plan
Supplier Number:
Workcell / Location
Pro
cess
Ste
p
Nu
mb
er
Process Name /
Operation
Description
Machine, Device, Jig,
Tools for
Manufacturing
Ref Doc. Number/
Specification No
Control Methods/Measurement
Reaction PlanRemarks
(Special Process)
10work instruction xxx-
xxxx
STEEL, CORROSION RESISTING, 304 OR 304L IQC inspection
sheet
Product / Process Characteristics
Receive Raw
Material
Incoming
Return to Supplier.
RMA process XXX
Notify production of new
delivery date.
40Manufacture work
instruction #: xxxx
Machining
Hole, Profile
cutting, Tap
holes
30Manufacture work
instruction #: xxxxBottom plane
CNC Milling#:xxx
Tool #:xxx
Fixture#:xxx
20
Drawing #:xxx
Manufacture work
instruction #: xxxx
80Post-treat Inspection
procedure xxxx
Pre-Treatment
Post-Treatment
Inspection
60Specification #:xxxx
Treatment PCP #:xxxxx
Machining
N/A
CNC Lathe#:xxx
CNC Program #:xxxx
Tool#:xxxx
Fixture#:xxxx
Grinding#:xxx
Tool #:xxx
Fixture#:xxx
2pcs Every
machine Set up
1pcs every two
hours
In-Process
In-Process Insp.
From CMM
2pcs Every
machine Set up
1pcs every hour
In-Process
In-Process Insp.
From CMM
2pcs Every
machine Set up
1pcs every two
hours
In-Process
In-Process Insp.
From CMM
AQL0.65
Every lot
Pre-treatment
inspection record
AQL0.65 for
critical
dimensions and
100% for Visual
inspection
COC from
supplier and Post
treatment
inspection record
Rework/CAR send
for rework
Raise CAR send for
rework
Stop machining/
Fine-tune the
Setting and re-
inspect
Notify Supervisor
Stop machining/
Fine-tune the
Setting
Qualified Operator
Stop machining/
Fine-tune the
Setting
Critical Dimensions & tolerances from DFMEA
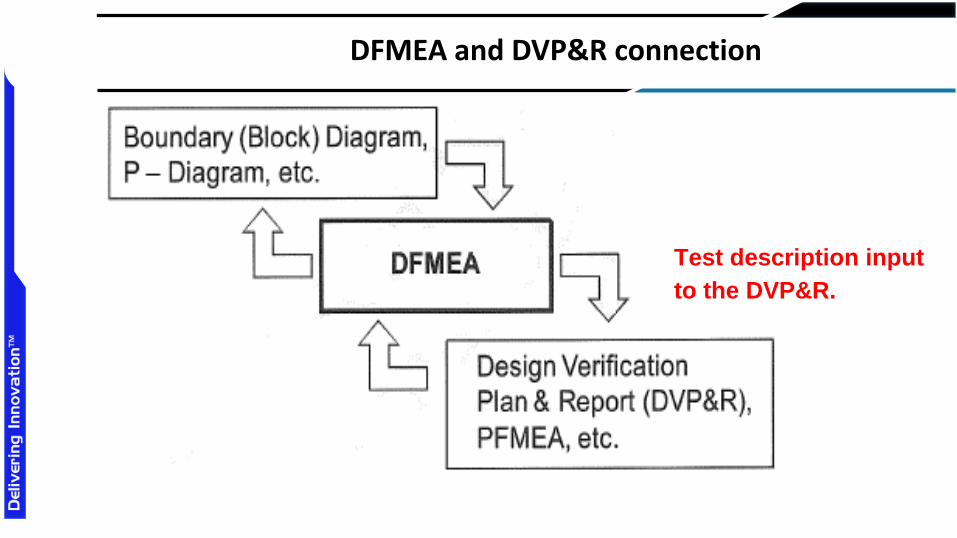
DFMEA and DVP&R connection
Test description input
to the DVP&R.

Email: Email:
Phone: Phone:
Fax: Fax:
Sample
Size or
Truck #
Req. Start End Start End
1)
Material Compliance
DRD# 3.2.3.1.1
Rev #
Dated ##/##/##
Per CEMS D-28
Rev #
Dated ##/##/##
1a) No 6.3 Resin Requirements Table 2 1 day PVAll Must
PassD 1 Lot 2013-12-31 2013-12-31
84576 by
GED 1 2013-12-31 2013-12-31 1 Lot
1b) No6.3 Specific Gravity Table 4 Per ASTM
D792 1 day PV
All Must
Pass
Test
PlaquesD 1 Lot 2013-12-31 2013-12-31
84576 by
GED 2 2013-12-31 2013-12-31 1 Lot
1c) No
6.3 Tensile Strength - Ultimate
Table 4Per ASTM
D6381 day PV
All Must
Pass
Test
PlaquesD 1 Lot 2013-12-31 2013-12-31
84576 by
GED 3-4 2013-12-31 2013-12-31 1 Lot
1d ) No 6.3 Ultimate Elongation Table 4Per ASTM
D6381 day PV
All Must
Pass
Test
PlaquesD 1 Lot 2013-12-31 2013-12-31
84576 by
GED 5-6 2013-12-31 2013-12-31 1 Lot
1e) No 6.3 Flexural Modulus Table 4Per ASTM D
7901 day PV
All Must
Pass
Test
PlaquesD 1 Lot 2013-12-31 2013-12-31
84555 by
GED 5-6 2013-12-31 2013-12-31 1 Lot
1f) No6.3 Flexural Strength Table 4 Per ASTM D
7901 day PV
All Must
Pass
Test
PlaquesD 1 Lot 2013-12-31 2013-12-31
84576 by
GED 7-8 2013-12-31 2013-12-31 1 Lot
1g) No
6.3 Impact Resistance Table 4
Per CEMS-DT-4 /
Rev #
Dated ##/##/##
Per ASTM D
7901 day PV
All Must
Pass
Test
PlaquesD 1 Lot 2013-12-31 2013-12-31
84576 by
GED 9-10 2013-12-31 2013-12-31 1 Lot
1h) No
6.3 Deflection Temperature
Table 4Per ASTM D
7901 day PV
All Must
Pass
Test
PlaquesD 1 Lot 2013-12-31 2013-12-31
84576 by
GED 11-12 2013-12-31 2013-12-31 1 Lot
1i) No 6.3 Color Table 4 1 day PVAll Must
Pass
Molded Part
Detail D.01D 2 Parts 2013-12-31 2013-12-31 ASD256 D 13-14 2013-12-31 2013-12-31 2 Parts
1j) No6.3 Dimensional Stability Table
44 hours PV
All Must
PassMolded Part B 2 Parts 2013-12-31 2013-12-31
ETA Lab
Rpt 56843C 13-14 2013-12-31 2013-12-31 2 Parts
2) No 6.3 Table 4 Other Characteristics 1 day PVAll Must
PassPlated part C 1 Part 2013-12-31 2013-12-31
HB dated
8/21/06C 15-16 2013-12-31 2013-12-31 8 parts
3) No 6.3 Table 4 Other Characteristics 1000 Hours PVAll Must
PassPainted part C 1 Part 2013-12-31 2013-12-31
LCL
Reported
9/29/06
C 17-18 2013-12-31 2013-12-31 9 PartsZ2 = Finish Paint per TMS-9008 Color: Argent, NAV
8752Pass Accept
Testing completed by Supplier
see Paint TabGrille, Painted, Fixed
Testing to be
completed by Supplier
see Paint Tab
Z1 = Chrome Plate per MS-7071B_fk Pass Accept
Testing completed by FGH
Platers, Inc, See Chrome Plate
Tab
Salt Spray applied at 16,
32 56 Hours (Grille,
Chrome, Fixed )
Testing to be
completed by FGH
Platers, Inc, See
Chrome Plate Tab
AA88 = 4 hours at 88° C
Parts will conform to the dimensions and tolerances shown
on the engineering drawings after four hours exposure in
an oven at the temperature indicated by the numeral of the
suffix AA - symbol expressed in degrees Celsius.
Pass AcceptPart Testing Performed by ABC
on Molded Part
Molded part (No
Assembly)
Part Testing to be
performed by ABC
AC1 = Integrally colored Part Pass Accept Verified by ABC To be verified by ABC
S90 = 90° min. deflection temperature at 1820 Kpa98 C
AcceptMaterial Testing Performed by
GE on Test Plaques
Material to be tested
by GE
R235 = 36 in/lbs force at minus 30° F
Parts will show no evidence of cracking when impact
tested at point or points indicated on engineering drawing.299 in-lbs. - Material
AcceptMaterial Testing Performed by
GE on Test Plaques
Material to be tested
by GE
N60 = 60 MPa min.72 MPa
AcceptMaterial Testing Performed by
GE on Test Plaques
Material to be tested
by GE
M17 = 1700 MPa min.2060 MPa
AcceptMaterial Testing Performed by
GE on Test Plaques
Material to be tested
by GE
L100 = 100% min. 150% AcceptMaterial Testing Performed by
GE on Test Plaques
Material to be tested
by GE
K-40 = 40 MPa min. 50 MPa AcceptMaterial Testing Performed by
GE on Test Plaques
Material to be tested
by GE
DF1140 = 1.140+/- 0.05 01-Jan-00 AcceptMaterial Testing Performed by
GE on Test Plaques
Material to be tested
by GE
PC+ABS = Polycarbonate + Acrylonitrile / Butadiene /
Styrene
PC+ABS = Polycarbonate
+ Acrylonitrile / Butadiene /
Styrene
AcceptMaterial Testing Performed by
GE
Material to be tested
by GE
Sample IDActual Timing Sample
Size Tested
PC + ABS DF1140 K40 L100 M17 N60 R235 S90 /
AC1 AA88 Z1 Z2
Test Location / Test
Verification Resp.
Rqmt
Source
Sample
Type
Scheduled TimingReport #
Sample
LevelActual Results
Test Results Status
Accept / RejectTests Completed by Notes / Remarks Test Stage
Target
RqmtsTe
st
Nu
mb
er
Compliance /
Regulatory /
S C/CC/KP C
Specification / Test Name
Test Method
or Test
Procedure
Duration of
TestAcceptance Criteria
630-123-4568 815-123-4568
Testing details and Results Planning information Actual Timing
[email protected] [email protected]
Test Stage ED = Engineering Devel't Test, DV = Design Verification, PV = Production Verification, CCT = Continued Compliance Testing
Target Requirements. State required probability or reliability and confidence of meeting criteria, e.g. R90, C90 or all must pass. Sample
Type / Level A = Prototype (Handmade), B = Prototype (Tooled), C = Production Tool (Not Process), D = Production Tool & Process
630-123-4567 815-123-4567
Title: Chief Engineer Title: Engineering MGR
Grille, Chrome, Fixed 123659749 C
State: MN Country:
Zip / Postal Code: 60586
X
Component (s):w/ Navistar Part
Number(s)Rev
USA
Grille, Chrome, FIxed 1315449691 D
Navistar Design Engineer Supplier Design Engineer (Key Contact)
Grille, Asm 23614649 AName: Steve Peterson Name: James Foley
Grille, Asm
Assembly Name:w/ Navistar Part
Number(s)Rev Supplier
Address: 12364 Jackson St.
23614649 B
City: Andrewsville
Date:
1236364 A 2012-02-13Subsystem: Grille Fixed Supplier Code: 12345 Affected Navistar Program(s): XVY 1235
DESIGN VERIFICATION PLAN AND REPORT ISQ-011-FO
Rev: A Date: 04/01/2013
System: Exterior Trim Supplier Name: One, Two, Three 123 Inc. Core Team:
(list names)
A. Hernandez, B. McGruff, S. Orlander, K.
Keller
DVP&R Number: Revision Level:
DVP&R example
Acceptance Test Criteria from DFMEA---example Min Torque= 70Nm

FAILURES, SYMPTOMS AND ROOT CAUSE ANALYSIS
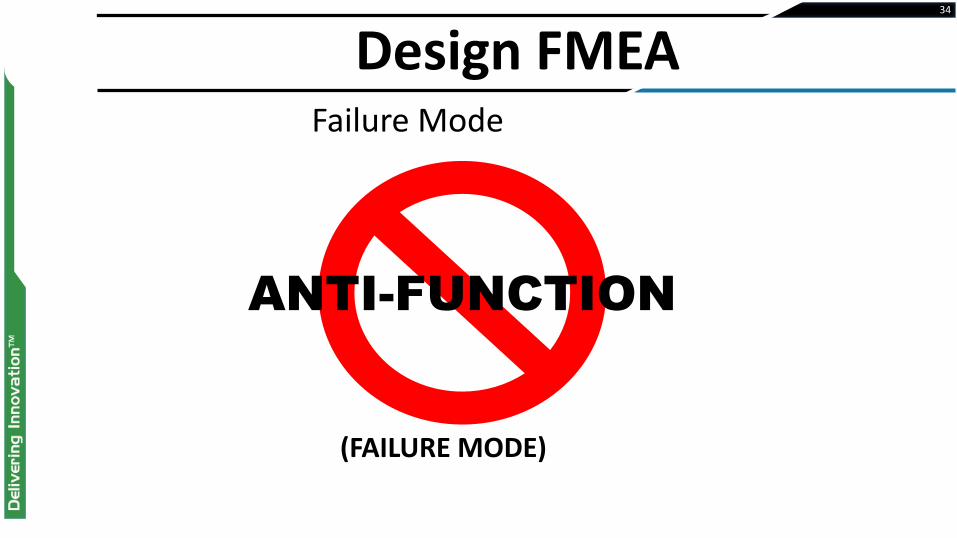
Design FMEA 34
Failure Mode
ANTI-FUNCTION
(FAILURE MODE)

2016-09-15
FMEA Thought Process 35
9/28/2013
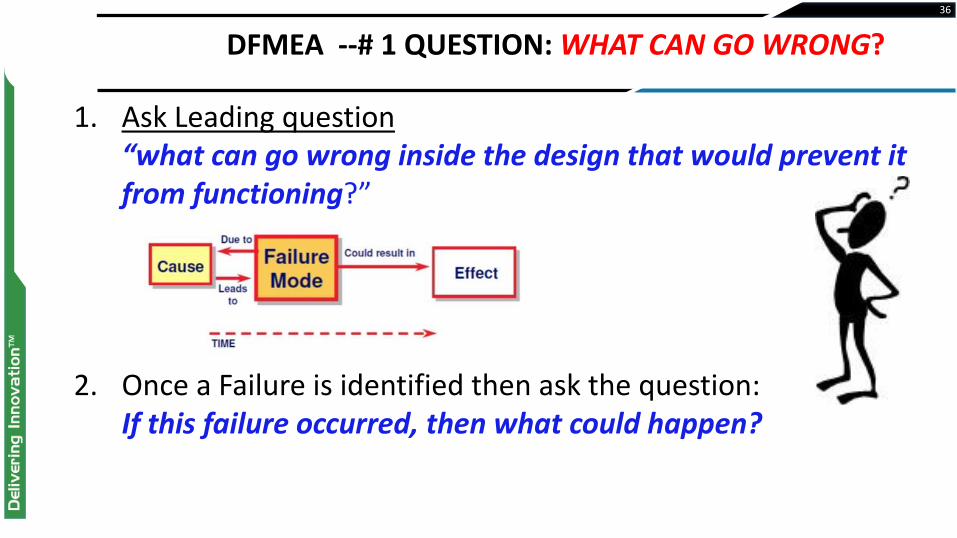
DFMEA --# 1 QUESTION: WHAT CAN GO WRONG?
36
1. Ask Leading question “what can go wrong inside the design that would prevent it from functioning?”
2. Once a Failure is identified then ask the question: If this failure occurred, then what could happen?
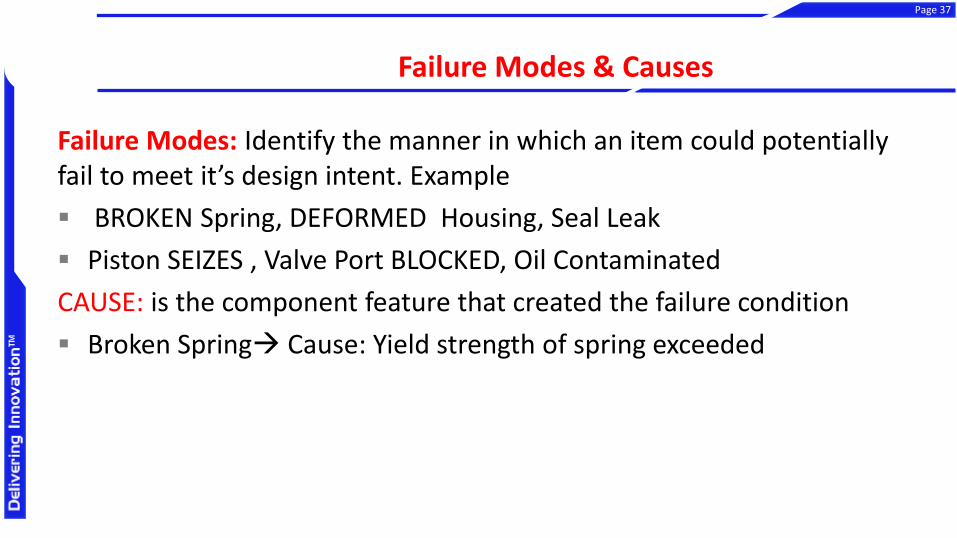
Failure Modes & Causes
Failure Modes: Identify the manner in which an item could potentially fail to meet it’s design intent. Example
BROKEN Spring, DEFORMED Housing, Seal Leak
Piston SEIZES , Valve Port BLOCKED, Oil Contaminated
CAUSE: is the component feature that created the failure condition
Broken Spring Cause: Yield strength of spring exceeded
September 15, 2016
Page 37
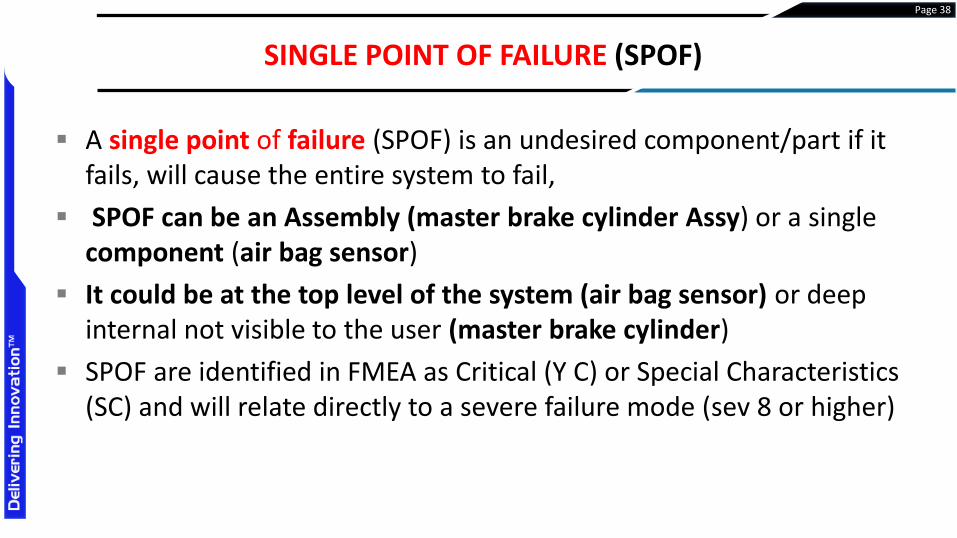
A single point of failure (SPOF) is an undesired component/part if it fails, will cause the entire system to fail,
SPOF can be an Assembly (master brake cylinder Assy) or a single component (air bag sensor)
It could be at the top level of the system (air bag sensor) or deep internal not visible to the user (master brake cylinder)
SPOF are identified in FMEA as Critical (Y C) or Special Characteristics (SC) and will relate directly to a severe failure mode (sev 8 or higher)
September 15, 2016
SINGLE POINT OF FAILURE (SPOF)
Page 38
39
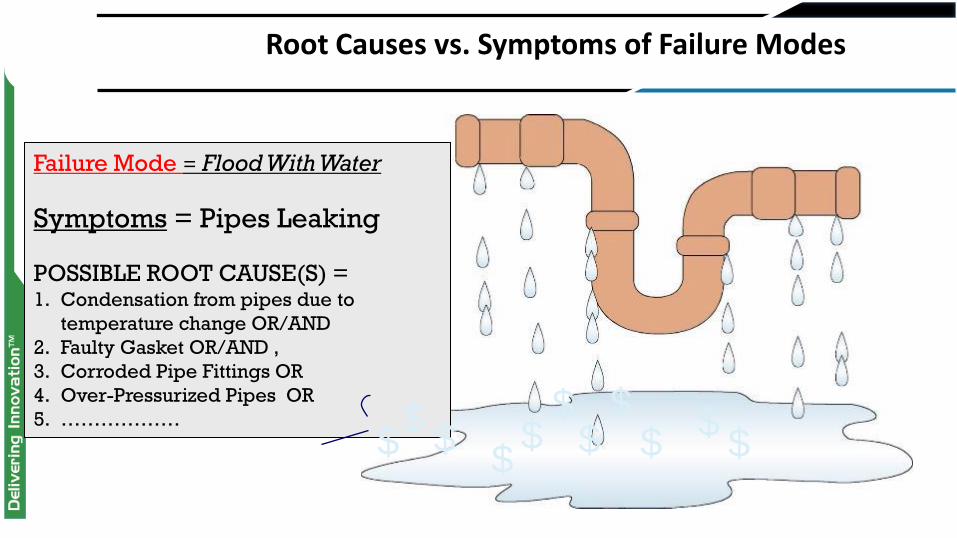
Failure Mode = Flood With Water
Symptoms = Pipes Leaking
POSSIBLE ROOT CAUSE(S) = 1. Condensation from pipes due to
temperature change OR/AND
2. Faulty Gasket OR/AND ,
3. Corroded Pipe Fittings OR
4. Over-Pressurized Pipes OR
5. ………………
$ $ $
$ $ $ $
$ $
$ $
Root Causes vs. Symptoms of Failure Modes
DFMEA INPUTS/OUTPUTS
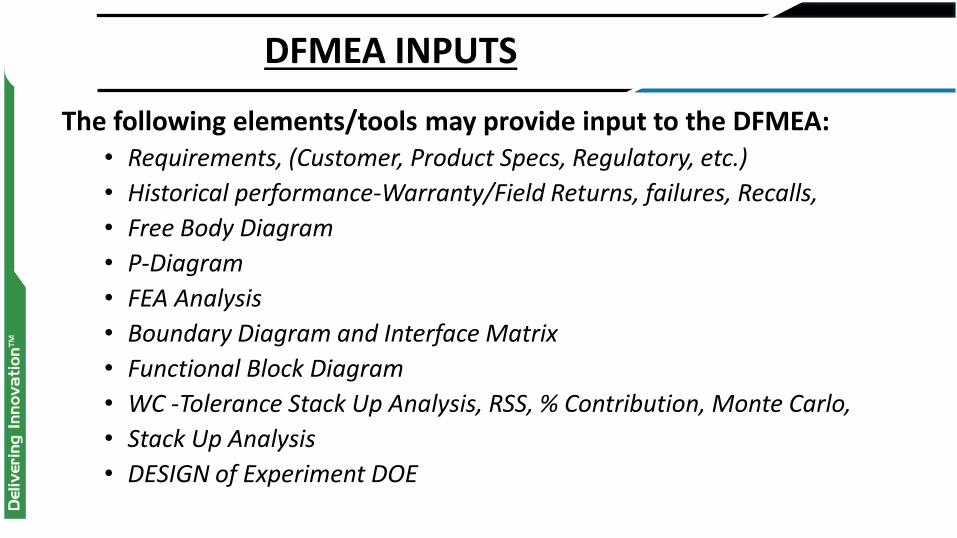
The following elements/tools may provide input to the DFMEA: • Requirements, (Customer, Product Specs, Regulatory, etc.)
• Historical performance-Warranty/Field Returns, failures, Recalls,
• Free Body Diagram
• P-Diagram
• FEA Analysis
• Boundary Diagram and Interface Matrix
• Functional Block Diagram
• WC -Tolerance Stack Up Analysis, RSS, % Contribution, Monte Carlo,
• Stack Up Analysis
• DESIGN of Experiment DOE
DFMEA INPUTS

DFMEA OUTPUTS (MANDATORY)
1. A list of Critical Component Characteristics and their specifications (dim/tolerance) (PFMEA & CONTROL PLAN)
2. A list of potential Failure Modes and Causes, prioritized by RPN
3. A list of Design action items to PREVENT the Failures/Causes
4. DVP Verification Plan (Conditions, Acceptance Criteria)
5. Lessons learned

BOUNDARY DIAGRAM—SYSTEM
Catalytic Converter Assy

September 15, 2016
INTERFACE MATRIX –FAILURE MODES
Page 44
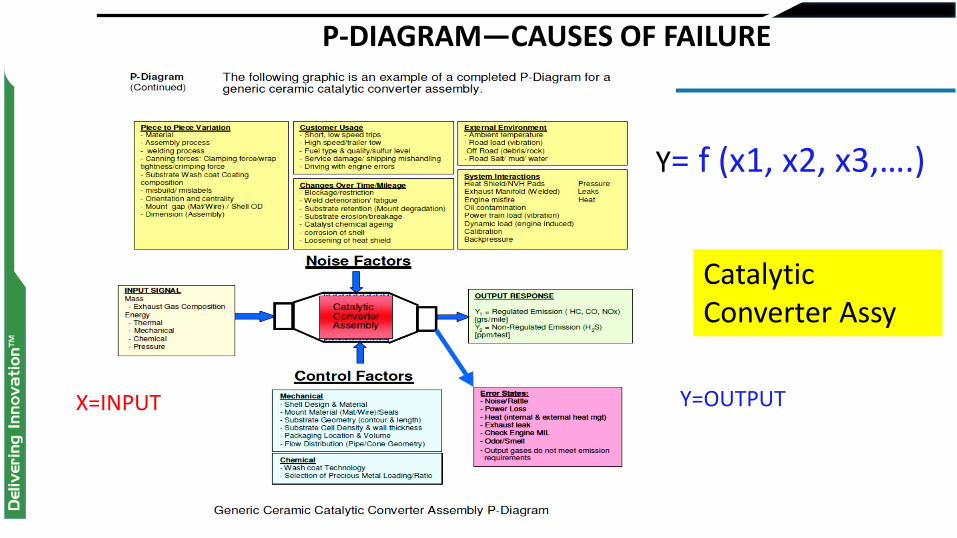
P-DIAGRAM—CAUSES OF FAILURE
Catalytic Converter Assy
Y= f (x1, x2, x3,….)
Y=OUTPUT X=INPUT
Prepared By: Julian Kalac Date: 11-Jun-16
Stack Description: To determine the tolerance between the flange hard stop and sensor surface for the Cmount Cover.
Starting Point: Flange Hard Stop
Ending Point: Sensor Surface
From To
Upper
Tolerance
Lower
Tolerance
Upper
Limit
Lower
Limit
1 Flange Hard Stop Sensor Mount Front + 16.150 0.050 -0.050 16.200 16.100 16.200 16.100 0.100
2 Sensor Mount Front Sensor Mount Rear + 2.000 0.050 -0.050 2.050 1.950 2.050 1.950 0.100
3 Sensor Mount Rear Shim Rear + 0.127 0.000 0.000 0.127 0.127 0.127 0.127 0.000
4 Shim Rear Sensor Surface - 0.750 0.060 -0.060 0.810 0.690 -0.690 -0.810 0.120
A positive or negative Max or Min total indicates only the DIRECTION from the STARTING point to the END point of the stack. Totals: 17.687 17.367
0.093
Mean + Statistical Tolerance = 17.620
Mean - Statistical Tolerance = 17.434
Total Target Dimension= -17.527
Desired Distance for C-Mount Flange Focal Distance = 17.526 +/- .1
Prepared By: Julian Kalac Date: 11-Jun-16
Stack Description: To Determine the required tolerance in the gap appearing on the outside of the housing between the Front Housing and Rear Housing
Starting Point: Exterior Gap Front
Ending Point: Exterior Gap Rear
From To
Upper
Tolerance
Lower
Tolerance
Upper
Limit
Lower
Limit
1 Exterior Gap Front Flange Hard Stop - 43.980 0.050 -0.050 44.030 43.930 -43.930 -44.030 0.100
2 Flange Hard Stop Sensor Mount Front + 28.700 0.050 -0.050 28.750 28.650 28.750 28.650 0.100
3 Sensor Mount Front Sensor Mount Rear + 2.000 0.050 -0.050 2.050 1.950 2.050 1.950 0.100
4 Sensor Mount Rear Housing Rear + 30.100 0.050 -0.050 30.150 30.050 30.150 30.050 0.100
5 Housing Rear Exterior Gap Rear - 16.500 0.050 -0.050 16.550 16.450 -16.450 -16.550 0.100
A positive or negative Max or Min total indicates only the DIRECTION from the STARTING point to the END point of the stack. Totals: 0.57 0.07
0.112
Mean + Statistical Tolerance = 0.432
Mean - Statistical Tolerance = 0.208
Total Target Dimension= 0.224
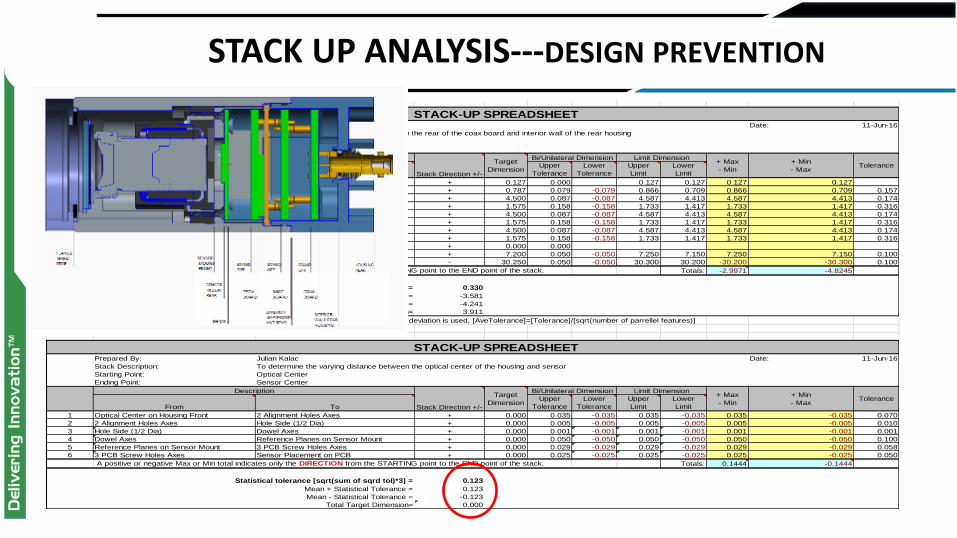
Prepared By: Julian Kalac Date: 11-Jun-16
Stack Description: To determine the varying distance between the rear of the coax board and interior wall of the rear housing
Starting Point: Flange Stop Surface
Ending Point: Housing Rear
From To
Upper
Tolerance
Lower
Tolerance
Upper
Limit
Lower
Limit
1 Sensor Board Rear Shims + 0.127 0.000 0.000 0.127 0.127 0.127 0.127 0.000
2 Shims Sensor Board Rear + 0.787 0.079 -0.079 0.866 0.709 0.866 0.709 0.157
3 Sensor Board Rear Stand Off + 4.500 0.087 -0.087 4.587 4.413 4.587 4.413 0.174
4 Stand Off FPGA Board + 1.575 0.158 -0.158 1.733 1.417 1.733 1.417 0.316
5 FPGA Board Stand Off + 4.500 0.087 -0.087 4.587 4.413 4.587 4.413 0.174
6 Stand Off MISC Board + 1.575 0.158 -0.158 1.733 1.417 1.733 1.417 0.316
7 MISC Board Stand Off + 4.500 0.087 -0.087 4.587 4.413 4.587 4.413 0.174
8 Stand Off Coax Board + 1.575 0.158 -0.158 1.733 1.417 1.733 1.417 0.316
9 Coax Board Interior Read Housing + 0.000 0.000 0.000 0.000 0.000 0.000 0.000 0.000
10 Interior Read Housing Housing Rear Rear + 7.200 0.050 -0.050 7.250 7.150 7.250 7.150 0.100
11 Housing Rear Rear Sensor Mount Rear - 30.250 0.050 -0.050 30.300 30.200 -30.200 -30.300 0.100
A positive or negative Max or Min total indicates only the DIRECTION from the STARTING point to the END point of the stack. Totals: -2.9971 -4.8245
0.330
Mean + Statistical Tolerance = -3.581
Mean - Statistical Tolerance = -4.241
Total Target Dimension= 3.911
**For component/dimensions in parrellel (standoff and connectors) the average standard deviation is used, [AveTolerance]=[Tolerance]/[sqrt(number of parrellel features)]
Prepared By: Julian Kalac Date: 11-Jun-16
Stack Description: To determine the varying distance between the optical center of the housing and sensor
Starting Point: Optical Center
Ending Point: Sensor Center
From To
Upper
Tolerance
Lower
Tolerance
Upper
Limit
Lower
Limit
1 Optical Center on Housing Front 2 Alignment Holes Axes + 0.000 0.035 -0.035 0.035 -0.035 0.035 -0.035 0.070
2 2 Alignment Holes Axes Hole Side (1/2 Dia) + 0.000 0.005 -0.005 0.005 -0.005 0.005 -0.005 0.010
3 Hole Side (1/2 Dia) Dowel Axes + 0.000 0.001 -0.001 0.001 -0.001 0.001 -0.001 0.001
4 Dowel Axes Reference Planes on Sensor Mount + 0.000 0.050 -0.050 0.050 -0.050 0.050 -0.050 0.100
5 Reference Planes on Sensor Mount 3 PCB Screw Holes Axes + 0.000 0.029 -0.029 0.029 -0.029 0.029 -0.029 0.058
6 3 PCB Screw Holes Axes Sensor Placement on PCB + 0.000 0.025 -0.025 0.025 -0.025 0.025 -0.025 0.050
A positive or negative Max or Min total indicates only the DIRECTION from the STARTING point to the END point of the stack. Totals: 0.1444 -0.1444
0.123
Mean + Statistical Tolerance = 0.123
Mean - Statistical Tolerance = -0.123
Total Target Dimension= 0.000
Statistical tolerance [sqrt(sum of sqrd tol)*3] =
STACK-UP SPREADSHEET
Description
Stack Direction +/-
Target
Dimension
Bi/Unilateral Dimension Limit Dimension+ Max
- Min
+ Min
- MaxTolerance
STACK-UP SPREADSHEET
Bi/Unilateral DimensionDescriptionTarget
Dimension
Limit Dimension+ Max
- Min
+ Min
- MaxTolerance
Stack Direction +/-
Limit Dimension+ Max
- Min
+ Min
- MaxTolerance
Statistical tolerance [sqrt(sum of sqrd tol)*3] =
Statistical tolerance [sqrt(sum of sqrd tol)*3] =
STACK-UP SPREADSHEET
Description
Stack Direction +/-
Target
Dimension
Bi/Unilateral Dimension Limit Dimension+ Max
- Min
+ Min
- MaxTolerance
Statistical tolerance [sqrt(sum of sqrd tol)*3] =
STACK-UP SPREADSHEET
Description
Stack Direction +/-
Target
Dimension
Bi/Unilateral Dimension
STACK UP ANALYSIS---DESIGN PREVENTION
September 15, 2016
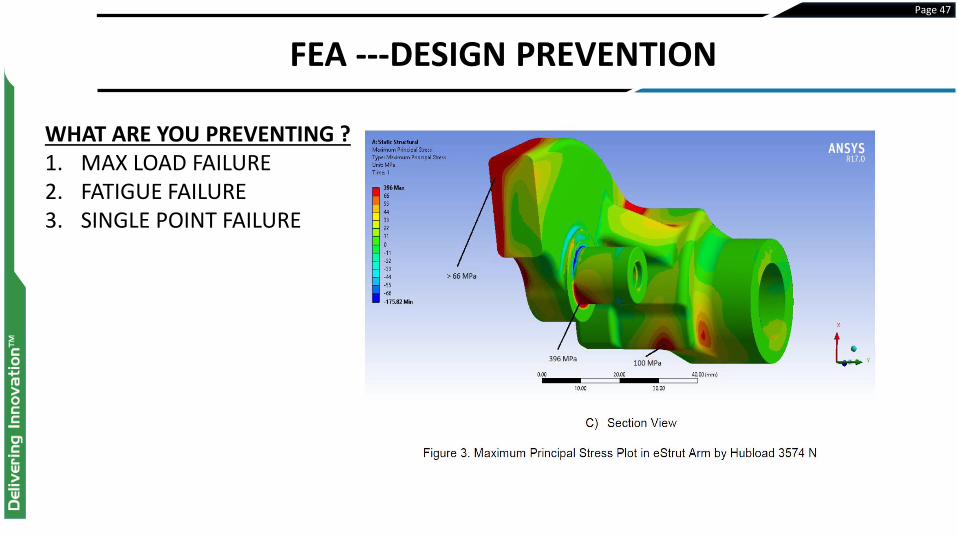
FEA ---DESIGN PREVENTION
Page 47
WHAT ARE YOU PREVENTING ? 1. MAX LOAD FAILURE 2. FATIGUE FAILURE 3. SINGLE POINT FAILURE
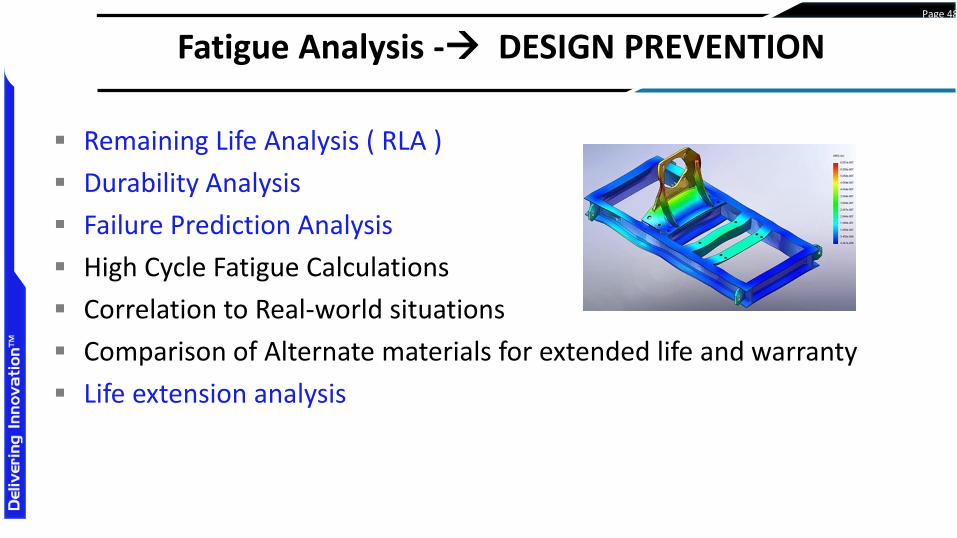
Remaining Life Analysis ( RLA )
Durability Analysis
Failure Prediction Analysis
High Cycle Fatigue Calculations
Correlation to Real-world situations
Comparison of Alternate materials for extended life and warranty
Life extension analysis
September 15, 2016
Fatigue Analysis - DESIGN PREVENTION Page 48
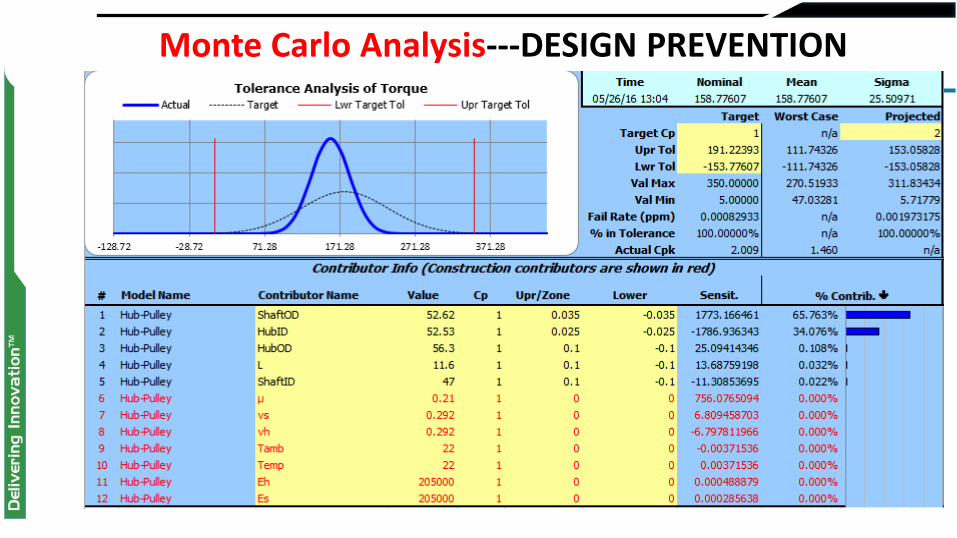
Monte Carlo Analysis---DESIGN PREVENTION
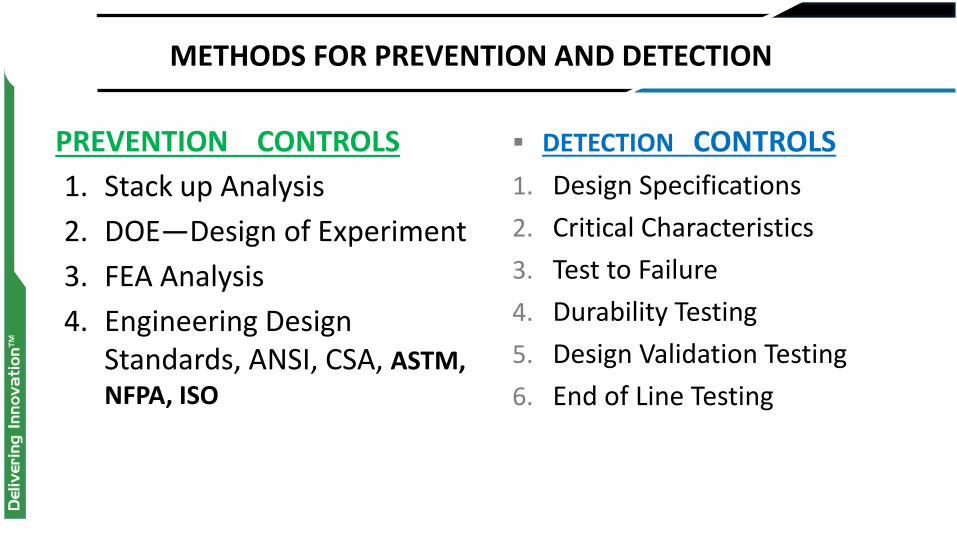
PREVENTION CONTROLS
DETECTION CONTROLS
1. Design Specifications
2. Critical Characteristics
3. Test to Failure
4. Durability Testing
5. Design Validation Testing
6. End of Line Testing
METHODS FOR PREVENTION AND DETECTION
1. Stack up Analysis
2. DOE—Design of Experiment
3. FEA Analysis
4. Engineering Design Standards, ANSI, CSA, ASTM, NFPA, ISO
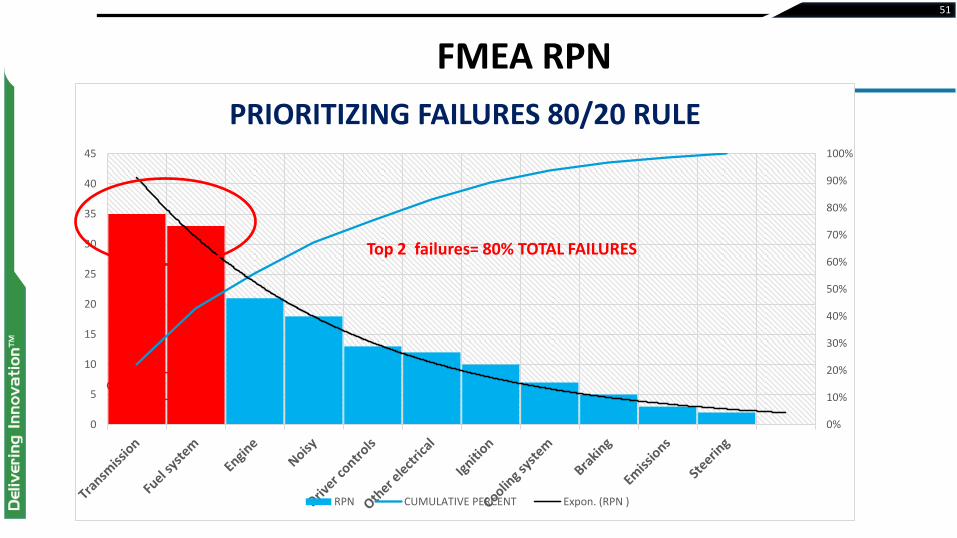
FMEA RPN
51
0%
10%
20%
30%
40%
50%
60%
70%
80%
90%
100%
0
5
10
15
20
25
30
35
40
45
PRIORITIZING FAILURES 80/20 RULE
RPN CUMULATIVE PERCENT Expon. (RPN )
Top 2 failures= 80% TOTAL FAILURES

September 15, 2016
DO NOT WAIT FOR THIS TO HAPPEN PREVENTED
Page 52

NEXT LET’S REVIEW OF YOUR DESIGN FMEA
September 15, 2016
Page 53

THANK YOU