design golden jubilee - government of india · for preparing this well researched document with the...
TRANSCRIPT

PREFACE
In 1950, Professor P.C.Mahalanobis, with the active support of our first Prime Minister Jawaharlal Nehru, launched the Indian National Sample Survey (NSS). The aim was to collect essential statistics relating to socio-economic characters and agricultural production. Since then gradually the NSS has been growing over the years and the Directorate of NSS was reorganized in 1970 by bringing various activities like designing, field survey and data processing etc, under it as the National Sample Survey Organisation (NSSO). Surveys of the NSS are carried out as successive ‘rounds’, mostly of a year’s duration and occasionally of six months, though in the early years of NSS, some of the rounds were even shorter. In order to commemorate the Golden Jubilee of the NSS in the year 2000, it was decided by the Steering Committee set up for the purpose that a critical review of the sample designs of the NSS from the 1st to the 55th round be prepared. The task was given to Shri K.Sankaranarayanan, ex-Joint Director of NSSO who prepared this note. After review by Professor T.J.Rao, the present acting Chairman of the Governing Council of the NSSO, the note was presented at a seminar held on 31st March 2003 at the Survey Design & Research Division (SDRD), Mahalanobis Bhavan, Kolkata. The note has since been modified in the light of suggestions made at the seminar by the participants. The note divides the history of NSS surveys upto the 55th round into three phases: the formative years (1st to 10th round), the period of growth and consolidation (11th to 27th round) and the period after formation of NSSO (28th to 55th round). For the third phase (28th-55th round), the evolution of the sampling design is narrated subject-wise. I hope, this note will serve as a good reference work for researchers and other users of NSS data. I would like to express my sincere appreciation and gratitude to Shri Sankaranarayanan for preparing this well researched document with the assistance of the SDRD, NSSO. My thanks are also due to the academicians and sample survey practitioners whose suggestions have contributed to the improvement of this technical note.
Dr.S.Ray New Delhi Director-General and Chief Executive Officer January 2004 National Sample Survey Organisation
The Formative Years 2
Contents I. Introduction 1 II. The Formative Years 2 III. Period of Growth and Consolidation 7 IV. After Formation of NSSO 10 IV.1 General 10 IV.1a Important Policy Decisions 11 IV.1b The Decennial Programme 12 IV.1c Illustration of the Revised Design: the 28th round 13 IV.2 Consumer Expenditure and Employment Surveys: 27th round onwards 18 IV.3 Non-agricultural Enterprise Surveys 21 IV.3a Non-agricultural Enterprise Surveys: 29th round 21 IV.3b Economic Census 22 IV.3c Non-agricultural Enterprise Surveys: 33rd round 24 IV.3d Non-agricultural Enterprise Surveys: 34th round 26 IV.3e Non-agricultural Enterprise Surveys: 40th round 28 IV.3f Non-agricultural Enterprise Surveys: 41st round 29 IV.3g Non-agricultural Enterprise Surveys: 45th and 46th rounds 32 IV.3h Non-agricultural Enterprise Surveys: 51st and 53rd rounds 35 IV.4 Land Holding and Debt & Investment Surveys 36 IV.4a Land Holding and Debt & Investment Surveys: 37th round 37 IV.4b Land Holding and Debt & Investment Surveys: 48th round 38 AD HOC SURVEYS 41 IV.5 Population and Vital Rates Survey: 38th and 39th rounds 41 IV.6 Livestock Survey: 30th round 42 IV.7 Social Consumption and Related Topics 43 IV.8 Survey on Irrigation & Electrification (Rural): 31st round 46 IV.9 Survey of Slum Dwellers (Urban): 31st round 48 IV.10 Construction Surveys 49 IV.10a Survey on Investment and Financing of Building Construction in
Urban Areas, 1971-73 49
IV.10b Construction Surveys: 27th round (rural sector only) 50 IV.10c Construction Surveys: 35th round 50 IV.10d Construction Surveys: 44th round Survey on Building Construction 52 IV.11 Survey of Housing Condition, 44th round 54 IV.12 Surveys of Tribal Population 54 IV.13 Enquiries on Disability 56 V. Some Concluding Remarks 58 Bibliography 60 Index 62

Evolution of the Sample Design in NSS
1
1
Evolution of the Sample Design in the Indian National Sample Survey from 1st to 55th Round - A critical review I. Introduction The Indian National Sample Survey has completed more than 50 years of service to the nation. This is a good opportunity to give wide publicity to the activities of NSS - especially the large volume of data generated through its successive survey rounds. While most research workers seem to be aware of the quinquennial surveys on consumer expenditure and employment, many did not know about the other data collected in NSS, especially those of the ad hoc rounds, until recently. It is now possible for outside users to obtain primary data – household or establishment level data – from the NSSO, so they can re-tabulate or analyze them as they wish. However, there is a risk in this. The users may not be fully aware of the sampling designs and the estimation procedures of different NSS enquiries. Any re-tabulation without considering these will be disastrous. Supplying the multipliers along with the primary data, as is being done now, will help avoid estimation errors on the part of the users. It is the objective of this paper briefly to recount the evolution of the sample designs of the successive rounds of NSS, from the first to the 55th round. Any special aspects of the estimation procedures adopted in particular rounds will also be touched upon. The most outstanding personality who guided NSS work in its formative period was Professor P.C.Mahalanobis, the Father of the Indian statistical system. It was he who, with the active support of Prime Minister Jawaharlal Nehru, caused the establishment of the National Sample Survey in 1950. Many of the ideas developed by him formed integral parts of NSS design and what may be called NSS culture. K.R.Nair is reported to have said that the single most important contribution of Professor was the establishment of NSS. (A.Rudra, “Prasanta Chandra Mahalanobis, A Biography”)[8] The sample design of the surveys carried out by the Indian National Sample Survey (NSS) has been dealt with in a number of papers. Lahiri [3] discusses important theoretical and practical aspects of the designs of the formative initial rounds of NSS. Murthy [6] treats in detail the design of the 14th round and Bhattacharyya and Roy [1], that of the 19th round. Both these are in a sense key rounds incorporating new ideas in their survey design. Murthy and Roy [8] covers the development of the sample designs of NSS through the first twenty-five rounds. Bhattacharyya [2] updates this up to the 32nd round. Sampling Theory and Methods, a textbook by Murthy [7], discusses NSS designs and estimation procedures in Chapter 15. The period covered in this paper can be divided into three parts. The first period begins with the establishment of NSS and covers up to, say, the 10th round. This may be called the formative period. The second phase is the period of growth and consolidation, covering the

The Formative Years 2
The first round of NSS
11th to 27th rounds. The third period is the period after the formation of the National Sample Survey Organisation, from the 28th to the 55th round. The main aspects of the sample designs of these three periods will be discussed in Chapters II, III and IV respectively. Chapter V will be the concluding chapter. II. The Formative Years The Indian National Sample Survey (NSS) was established in 1950 by the Government of India on the advice of Professor P. C. Mahalanobis, then Statistical Adviser to the Cabinet, with the enthusiastic support of Pandit Jawaharlal Nehru, the Prime Minister. The National Income Committee under the Chairmanship of Professor Mahalanobis had found large gaps in statistical data for computation of national income aggregates, especially those relating to the unorganized / household sector of the economy. The main objective of setting up NSS was to fill these gaps. The first round of NSS: The National Sample Survey inaugurated its survey operations with a multi-subject enquiry conducted in the rural areas only from October 1950 to March 1951. The main emphasis in this survey was on the socio-economic characteristics of households covering (i) general household particulars (ii) agriculture and livestock, (iii) household industry, craft and trade, (iv) services and financial operations and (v) household consumer expenditure. A land utilisation survey (LUS) was also conducted along with the socio-economic enquiries (SE). There was also a village schedule for collecting data on rural retail prices and wages for certain types of manual work. A stratified two-stage design was adopted with village as first-stage unit (fsu) and households as second-stage units for the socio-economic surveys. The LUS was conducted in the same sample villages, with second-stage units as clusters of plots. The whole country was divided into 256 ultimate strata. The sampling frames for selection of villages were collected with great difficulty and the selection procedure could not be made uniform for all the strata. In some strata, villages were selected with probability proportional to population with
replacement while in some it was done with probability proportional to area and in the rest it was done with equal probability, depending on the type of information available. A master sample of 80 households was selected from each village. These households were divided into two categories, viz. agricultural and non-agricultural, and 8 sample households were selected from each at random. A schedule on general household characteristics was
canvassed in all the 16 households; schedules on household enterprises were filled-in-for 2 agricultural and 3 non-agricultural households, a schedule on consumer expenditure was filled in 1 agricultural and 2 non-agricultural households. For LUS, 20 clusters of 5 plots each were selected with probability proportional to area using maps and random perforated sheets. The number of sample villages in which the above scheme was followed was about 1200. Results could be published only for all-India and six Population Zones. See National Sample Survey General Report No.1 [7 ]*
* The survey plan of Indian Statistical Institute, Calcutta, was carried out in 1189 villages and that of Gokhale Institute of Politics and Economics, Pune, was implemented in 644 villages, both sets covering all the strata. The latter withdrew from NSS after first round. This account relates to the Calcutta sample.

Evolution of the Sample Design in NSS
3
3
That was the first round of NSS. Since then NSS has been conducting sample surveys on a variety of topics round after round. The design of the first round described above incorporates many of the features of the sample design adopted in later rounds. First of all they are multi-subject enquiries consisting of three main streams: household socio-economic (SE) enquiries for which household is the ultimate sampling unit, crop surveys for which plots are the ultimate units and, finally, rural retail prices and wages for which the village as a whole may be considered as the sampling unit. Stratification based on district has been adopted in most NSS rounds; so has selection of first-stage units with varying probabilities using appropriate size measures (pps or probability-proportional-to-size sampling). The third feature is the preparation of suitable sampling frames of second-stage units within each first-stage unit. This usually involves classification of households in the village by a relevant characteristic (e.g. agricultural/ non-agricultural, in the 1st round) and preparation of separate sampling frames, based on this classification, for different enquiries However, NSS never again selected a master sample of households, the purpose of which probably was to reduce the work of a somewhat detailed enquiry meant to classify the households. This aim was achieved in later rounds by dividing large villages into several hamlet-groups and selecting one of them for survey. The survey was extended to the urban sector from the 3rd round. The survey periods of all the rounds falling in this period were only a few months. The period ranged from 3 to 6 months except in the case of the important 8th round, whose survey period was 9 months. The subjects covered in these rounds were (rounds are given in brackets):
Consumer expenditure (all rounds) Vital statistics (9) Agriculture and animal husbandry (1 – 7) Small scale manufacture and handicrafts (all except 2) Transport (all except 2) Trade (3 – 10) Professions, services and financial operations (1, 3 – 8) Village statistics (2,4,6 and 10) Wholesale and Retail prices (5,6,8,9 and 10) Opinion on out-turn of rice (7 rural) Land utilization (1, 4 – 10) Crop-cutting experiments (10) Land holdings (8) Trend of self-management of agricultural holding (8) Household indebtedness (8) Farming practices (8) Income and expenditure (9) Employment / urban labour force (9, 10)
As already said, the subjects covered in NSS acquired a set pattern characteristic of NSS. There were three streams, so to say: the socio-economic enquiries consisting of consumer expenditure, household enterprises, employment/ labour force, etc.; the land utilisation and cropcutting surveys; and prices and other village level information.

The Formative Years 4
The basic features of the design remained the same during these rounds. Strata were formed in the rural sector by grouping contiguous districts in the first three rounds. From the fourth round onwards, strata were formed by grouping districts within the ‘natural divisions’ of the 1951 census. A natural division consisted of a group of contiguous districts similar with respect to geographical features, climate, crop pattern and population density. Thus they were suitable for both socio-economic and crop surveys. In some rounds tehsils, which are administrative divisions within districts, were grouped to form rural strata. The number of rural strata was about 250. While the rural strata were closed geographical entities, the urban strata were not. The basis of stratification in the urban sector was the population of the towns.
In the 3rd to the 5th rounds, each of the 4 metro cities (Bombay, Calcutta, Delhi and Madras) constituted one stratum, and the rest of the urban area of the country was divided into just 3 strata by population size of towns. In the following 3 rounds, urban stratification was carried out in a similar way, by making 4 strata by population size of towns within each of four census
zones, thus making up a total of 20 strata including the 4 cities. The number of sample blocks for India as a whole was of the order of only 400–500. From the 9th round the urban sector received more importance with the inclusion of the employment enquiry. A fresh exercise in urban stratification was carried out in that round. Each city with population 3 lakhs or more and the capital cities of all Part A and Part B States (except Shillong) formed an individual stratum. In the remaining urban areas, each natural division formed a stratum. There were 94 strata in all. Sample size also increased to 2108 in the 9th round. This was even greater than the rural sample size. (This was the only round of this kind.) It was reduced in the 10th round to 1328 and further to about 500 in the 11th and 12th rounds. Pps selection was followed in most rounds right from 1st round. In order to avoid the heavy work of cumulation of sizes, a method suggested by Lahiri was used for pps selection. In earlier rounds, when only 1941 census frames were available, villages were selected with probability proportional to population or area depending on data availability. 1951 census frames became available from 4th round. But initially, village lists for rural areas and lists of enumerator’s blocks (EB) for urban areas were not available for all strata. Hence tehsils were selected in the rural sector and towns in the urban sector in the first stage in some rounds. The size measures were the same so that the estimating formula was not affected. Town as a first stage remained up to the 8th round in the urban sector. From the 9th round onwards block selection was done systematically with equal probability. Sub-samples: In NSS the total first-stage sample of a stratum is invariably selected in the form of two or more independent sub-samples. The concept of independent interpenetrating samples (IPNS) was developed at ISI by Mahalanobis and has many uses in sample survey design. Simple presentation of final estimates by sub-samples along with the combined estimates helps the user to form an idea of the variability of the combined estimate. Often, unexpected large divergences between the sub-sample estimates can help locate field or data processing errors. Estimates of standard errors can be easily computed from the sub-sample estimates at stratum level or global level. On the assumption of symmetrical distribution of the sub-sample estimates about the true value, non-parametric confidence intervals can be constructed for the population parameters.
Formation of urban
strata

Evolution of the Sample Design in NSS
5
5
( )1,2,...kiti =t
∑=i
itk1t
( )( )( )1kk
tttv i
2i
−
−=∑
1k211 −−
If are unbiased estimates from ith sub-sample, and then an unbiased estimate of the variance of is given by Then the probability that the true value lies between the smallest and largest of k sub-sample estimates is given by For these reasons, division of the whole sample into two or more (most often two) sub-samples has been a permanent feature of NSS design. In earlier rounds, different field parties surveyed the two sub-samples in each stratum and tabulation of the two sub-samples was done at different processing centres. Crop surveys: Land utilisation survey (LUS) was done in the 1st round. There was no LUS in the 2nd and 3rd rounds. It was resumed in the 4th round when it was carried out in the same villages selected for SE surveys which were generally selected with probability proportional to population. The crop yield surveys were started only from 10th round. In rounds 10 – 13 additional samples were selected for crop surveys from specially demarcated strata with probability proportional to area with replacement. Sample plots for LUS were selected in the form of clusters of contiguous plots. The number of plots in a cluster varied. Initially it was 2, then 5, and later, 10 plots constituted one cluster.
They were selected with probability proportional to area (ppa) with replacement. Where cadastral survey maps were available, a randomly perforated sheet was used for sample selection. The sheet was placed over the survey map and the plot in which the randomly selected perforation fell and the cluster corresponding to it was selected. When cadastral survey was done but maps were not available, the basic plots were selected with ppa or
equal probability and the cluster to which it belonged was selected. When even survey numbers were not available (for example, in the “cadastrally unsurveyed” villages), the clusters consisted of all the plots possessed by a random sample of households. Crop cutting surveys (CC) for obtaining yield rates were started only in the10th round. They were done only in respect of 7 major foodgrains (rice, wheat, jowar, bajra, maize, barley and ragi). The plots for CC were selected for each crop, from the sample plots of LUS growing the particular crop, with ppa, where a was the area under the crop. In each sample plot, one or two sample circular cuts with random centres were selected. One cut consisted of two concentric circles of radii 2", 3" and 4" respectively. All the crop harvested from the larger circle is used for measuring the ‘green weight’, and that from the smaller circle is used to obtain the “driage ratio” which is used for obtaining the final yield. A technique used to improve the efficiency of the sample when samples, mainly of households or enterprises, are selected from within villages or blocks, is to arrange them in some meaningful order before systematic selection. Sometimes they are arranged by more than one criterion simultaneously. For this the listing schedules contained ingeniously
Sampling of plots for crop survey

The Formative Years 6
∑∑∑=i
siji sisi
si
s s
s yhp
HnP
Y
sisis
sissi .h.pn
.HPM =
s
sis
si
si
P.pM.n
hH
=
designed working columns. It is known that arrangement before systematic selection will nearly give the benefit of stratification with proportional allocation. Self-weighting designs: Another procedure introduced in these rounds and adopted in many later rounds is to make the design “self-weighting”. The estimates of totals of study variates are in the form of weighted sums of sample values. These weights (‘multipliers’ in NSS parlance) usually vary from unit to unit, making tabulation tedious and time-consuming. If there is only one multiplier or a few, data processing will be simplified. The procedure is as follows. For a two-stage stratified design with ppswr selection in the first stage and equal probability selection in the second stage, the estimate of total of any variate y is given by where s, i and j are subscripts for stratum, fsu, and ssu respectively; n denotes the number of sample fsu’s, P is the size measure, and H and h are the total and sample number of ssu’s. Then the multiplier is given by Now if M is the constant multiplier, As n, P and p are all fixed, the sampling fraction can be determined by the above equation. M is calculated as the ratio of projected number of ssu’s in the population and the desired number of ssu’s in the sample. Now, E (Mh) = M.E(h) = total no. of ssu’s in the population. That is, E(h) = H / M. In practice, for any particular sample the actual number of sample ssu’s need not equal h. Again, if the projection is wide of the actual value, the achieved value of h may differ from the planned value. Another problem with self-weighting is as follows. The number of sample households to be selected from each fsu is given to the investigator, not in absolute terms, but as a sampling fraction, or more often, as an interval for linear systematic selection. This frequently leads to unequal number of ssu’s in the fsu’s. This is a serious administrative problem for the field organisation. The solutions to this problem (keeping the estimates unbiased) have been rather complicated and requiring much pre-tabulation effort, almost offsetting the benefits of having a self-weighting design. Hamlet-group / sub-block selection: Another procedure which became an integral part of NSS designs later was first introduced in the 9th round. The first-stage sample generally includes a number of large villages, especially in the case of pps selection. It leads to
Evolution of the Sample Design in NSS
7
7
unnecessarily heavy workload at the time of listing. To avoid this, NSS practice allows large villages to be subdivided into a certain number of divisions (depending on the current population) and one of them is selected for survey. In earlier rounds the hamlets in a village were listed with approximate percentage population and one was selected with pps. This was later discontinued from the 14th round, and hamlet-groups of equal size were formed out of which one was selected at random for survey. A similar procedure was followed in the urban sector also, but because urban blocks are artificially formed with population as one of the criteria, this problem was not prevalent to such an extent in the urban sector. This procedure added one more of stage of sampling, which could lead to reduction in efficiency, especially when the characteristics of the population living in the different hamlets differed widely. To overcome this, in recent rounds, two hamlet-groups are selected systematically after arranging them in some order. Estimation procedure: The estimation procedures in NSS are based on the unbiased estimates of aggregates of study variates in accordance with the design adopted. Most estimates are ratio estimates with the numerator and the denominator being unbiased estimates of some aggregate. Examples are: per capita consumption of foodgrains, proportion of population in the labour force, etc. The estimation for crop surveys initially was based on a chain ratio estimator. But soon unbiased estimation was introduced for crop surveys also. Participation of States: An important development towards the end of this formative period was the beginning of the participation of the State governments in the survey programme of NSS. A survey on land holdings was taken up in the 8th round as part of the World Agricultural Census. As the NSS samples were small, the State governments were invited to participate with matching samples so as to enable preparation of estimates at State level which was not possible with the ‘Central sample’ alone. Even after the 8th round many States continued to participate in NSS. At present all the States are participating, with some States doing additional samples over and above the matching sample. But unfortunately, in the case of many States the data collected are not processed. A way remains to be found to bring the tabulation of State sample data up to date. III. Period of Growth and Consolidation By the 10th round NSS was firmly established, with increased financial assistance from the Union Government. The Indian Statistical Institute, too, got a statutory status, with the passing of the ISI Act in Parliament (1959) and this in a way strengthened the status of NSS also, which was a part of ISI. An evidence of its general recognition in academic and Government circles is the interest shown by Government organisations and autonomous bodies in utilizing the NSS survey apparatus for collecting data needed by them which would otherwise have been impossible for them to collect. The first instance of this was the land holdings survey of the 8th round, which was taken up as part of World Agricultural Census sponsored by FAO. The second example was the Second Agricultural Labour Enquiry (ALE) carried out in the 11th-12th rounds. This was carried out for the Labour Bureau. In the rural sector the agricultural labour

Period of Growth and Consolidation 8
/ rural labour households were identified at the time of listing and were made a separate second-stage stratum and the required number of households were selected for ALE. ALE has become a part of NSS rounds devoted to consumer expenditure and employment. Other important surveys of this type are the surveys on Debt and Investment undertaken in the 16-17th rounds, 26th round, etc. on behalf of the Reserve Bank of India and the surveys on Construction carried out at the instance of the National Buildings Organisation (NBO). Up to the 10th round, the NSS rounds had short survey periods. The 11th and 12th rounds together covered one full agricultural year. From the 14th round onwards the survey period became one agricultural year. The 14th round is significant in other respects as well. In the rural sector the survey period of one year was divided into 6 ‘sub-rounds’ of 2 months each and every sample village was visited in each sub-round. The work programme was painstakingly drawn up so as to even out the workload over the sub-rounds. (A description of the programme will take a lot of
space. Interested readers may refer to NSS Report No.70 [4].) One or two facts deserve mention. The same set of 24 sample households (allocated to the 6 villages of a stratum in proportion to their population) were surveyed for Sch.10 (employment) in each sub-round. In the case of population enquiry,
Sch.12.1 (enumeration) was filled in every household listed in sample village numbers 1 and 4 in sub-rounds 1 and 2 respectively. Sch.12.1.1 (re-enumeration) was canvassed in the same set of households in sub-rounds 5 and 6 respectively. This helped in getting good estimates of population growth rates. Another feature of the 14th round was that while in the rural sector there were 6 sub-rounds, there were only 2 sub-rounds of 6 months each in the urban sector. There were 6 sub-rounds in many subsequent rounds as well. . Repeated visits were made for the Survey on Disposal of Cereals by Producer Households, Debt and Investment Surveys, etc. In respect of crop surveys, a new idea was tried from the 10th to 13th rounds. Although LUS was done right from the 1st round, yield rate estimation started only from the 10th round. From that round, full-fledged land utilization and crop-cutting surveys became an integral part of NSS. In the 10th to 13th rounds crop survey was done, not only in the common socio-economic survey sample villages, which were selected with probability proportional to population (ppp), but also in an independent sample of villages selected, after fresh stratification, with probability proportional to area. From the 14th round onwards the sample villages were selected circular systematically with equal probability as a compromise between the requirements of socio-economic and crop surveys. With 18th round probability proportional to size (which was population rounded to the next higher multiple of 1000) was reintroduced along with self-weighting design. With ppp selection the number of sample households was expected to be almost equal for all villages within a stratum. If the population of the strata was also equalised, then the sample size would be equal for all sample villages.
Sub-rounds

Evolution of the Sample Design in NSS
9
9
After the stabilisation of the survey period at one year, another important development was the gradual increase in the sample size. From the 18th round onwards it became fixed at about 8000–9000 sample villages and 4000–5000 urban blocks. With the increase in sample size and the extension of the survey period to one year, it became necessary to have a control on field work in order that the investigation was spread out uniformly over the year. It was for this purpose that the sub-rounds were introduced. Generally the total sample was divided into four equal parts and one was surveyed in each sub-round. When systematic selection was resorted to, samples with orders of selection 1, 5, 9, … were assigned to sub-round 1, those with order of selection 2, 6, 10, …to sub-round 2, and so on. This made each sub-round sample equivalent to a systematic sample selected from the universe with four times the original interval. This made preparation of sub-roundwise estimates possible, either to study seasonal variation or to obtain quick estimates. The combined sample estimates will be free from any seasonal effect as well. Mention may be made of a new design idea that was tried in the 23rd round. For the enterprise survey of this round (small scale manufacture and handicraft – household and non-household), in addition to the common sample of villages and blocks, a special sample of villages and blocks were selected, exclusively for this enquiry, from the strata identified as having concentration of this type of activity. A similar procedure was later followed in the 44th round tribal survey. Urban frame survey: Up to the 18th round the population census list of EB’s (enumeration blocks) was the frame for sampling of blocks in the urban sector. This had some drawbacks. With the passage of years after the census, the EB’s became difficult to identify in the field. Further, there was no concept of area while forming them, so that often a row of houses constituted a block. Now when new houses came up during the inter-censal period, it was difficult to say to which existing block they belonged. This often leads to under coverage. To solve the problem, NSS undertook an Urban Frame Survey (UFS) with the object of carving out areal blocks with permanent landmarks for boundaries and with population around 600 to 800. Initially this was done in the Class I towns and cities only. Each town was first divided into a number of “Investigator Units” (Iv unit for short) of about 10,000 population It was ensured that these units were bounded by permanent identifiable landmarks such as roads, walls, tanks canals, etc. and, as far as possible, did not cut across
municipal ward boundaries. Then detailed maps were prepared for each Iv unit and blocks with the stipulated population were demarcated on them. The population of the blocks thus formed was again checked and adjustments were made if necessary. After the blocks were finalized, they were listed in an Iv unit schedule with descriptions of the northern, eastern, southern and western
boundaries and any landmarks, especially at the corner points. The type of area in which the block was situated (such as residential area, bazaar area, industrial area, slum area, etc.) was also given in the Iv unit schedule. These frames were found to be extremely useful. Later, NSSO's Governing Council established UFS on a firm footing. Now every town of India is covered by UFS once in five years. Census EB’s are now used only in new towns declared as such in a census year. Price enquiry: In the early rounds, rural retail prices were collected from the same sample villages selected for SE and crop surveys, and that too not in every round. In the 16th round a new orientation was given to the collection of rural retail prices. A fixed sample of 419
Urban frame survey

Period of Growth and Consolidation 10
villages was selected from the strata of the 16th round with equal probability. The objective was to use the prices collected from these villages to compute the consumer price index (CPI) of agricultural labourers. (The weighting diagram was to be computed from the consumer expenditure schedules canvassed in the ALE periodically conducted as part of the enquiries on consumer expenditure and employment.) Initially a survey was conducted in the markets identified for this purpose to select the shops frequented by the agricultural labour / rural labour families of the neighbourhood and the varieties of articles most popular among them. Once the shops and varieties were fixed, the prices of these varieties were collected once in a month on an appointed day (first Saturday or first market day for a non-permanent market). The price enquiry was thus separated from the mainstream NSS. Price collection was done in this manner from this fixed set of villages until a new set of price villages was introduced in the 42nd round. Two ad hoc surveys were carried out during this period, both outside the usual NSS framework. One was a set of family living surveys: a Working Class Family Living Survey for the Labour Bureau and a Middle Class Family Living Survey for the Central Statistical Organisation (CSO). The data would be used for compiling Working Class and Middle Class CPI Numbers respectively. Another survey was the survey on Investment and Financing of Building Construction in urban areas undertaken for NBO. As these surveys were not part of any round, their designs are not discussed here. When the National Sample Survey Organisation came into existence in 1970, the 24th round was under way. The designs of the previous rounds were followed in rounds 25-27 without much change. By then the NSSO Governing Council had set up a Working Group to review and redesign NSS. It was in the 28th round that the modified design was first implemented. The designs of the 28th and subsequent rounds will be discussed in the following chapter. IV. After Formation of NSSO IV.1 General The 28th round of NSS (October 1973-June 1974) marks a significant watershed in the evolution of NSS. Although the NSS Oganisation was established in March 1970 (when the 24th round was in operation) as a unit of the Department of Statistics, Government of India, in order to bring all the functions of NSS under one umbrella, full integration was not achieved until June 1972 (on the eve of the launching of the 27th round). Prior to the planning of the 28th round, the sample design of NSS was thoroughly reviewed by a Working Group headed by V.M. Dandekar, the first Chairman of NSSO Governing Council (GC). The other members were: T.V. Hanurav, M.A. Telang, S.K. Gupta, A. Bhattacharyya and G.R. Ayachit. Among the special invitees was C.R. Rao. Following the recommendations of this Working Group, the NSS strata were completely revised and redrawn making use of 1971 census data and other information on crop pattern, etc. There were other innovations as well. Before going into a discussion of the sample designs of the successive rounds of NSS beginning with 28th round, it is necessary and proper to dwell on the key policy decisions of the new NSSO Governing Council which were of fundamental importance for the survey designs, including subject coverage, of the NSS enquiries that followed.

Evolution of the Sample Design in NSS
11
11
IV.1a Important Policy Decisions The National Sample Survey Organisation (NSS0) was established in March 1970 on the recommendations of a committee whose members were B. Sivaraman (Chairman), V.M. Dandekar and R.R. Bahadur. In a way this signalled the end of an era in the history of NSS, during which the statistical work (except field work) of NSS had been carried out by the Indian Statistical Institute, under the guidance of Professor Mahalanobis. At the apex of the new organisation was the Governing Council (GC) with a non-official Chairman to guide all the activities of NSSO. The first Chairman of the GC, NSSO, was V.M. Dandekar. During the past, a number of features of NSS had come under more or less severe criticism from time to time. The newly appointed Chairman of the GC, NSSO, took the initiative to give NSS surveys a new perspective, attempting, at the same time, to modify some of the features which had come under serious attack from a section of the Indian statistical fraternity including himself. One of the first steps taken by the GC was to set up a Working Group (WG) to study the major aspects of NSS sampling design and recommend modifications. The basic design recommended by the WG and approved by the GC at its 12th meeting was, as before, stratified two-stage. However, the basic strata, each of which was a district or part of one, were made common for the rural and urban sectors, so that, if required, estimates could be obtained for the two sectors combined from the basic stratum level upwards without cutting across strata. The WG had recommended allocation of samples to States/UT’s in proportion to population. But this could not be implemented due to administrative constraints. A major change recommended by the WG concerns the concept of interpenetrating network of samples (IPNS). As per the long-standing procedure developed by ISI under Professor Mahalanobis, the total sample of first-stage units was selected in the form of two (usually) equally valid (i.e., of the same sample size) independent interpenetrating sub-samples. Each was surveyed by a separate “party” of investigators and (in some rounds) the data processing for each sub-sample was also done independently at different centres. All reports contained estimates for each sub-sample and also for the combined sample. The main purpose of this procedure was to detect and remove various types of non-sampling errors. Moreover, estimates of variance built up from sub-samplewise estimates give, in the presence of non-sampling errors of a random nature, estimates of total variance, which estimates based on one single sample cannot give. To implement the original concept, an investigator belonging to a particular party surveyed all the samples of a given sub-sample. This entailed travel by each investigator throughout the stratum (thus increasing travel cost). The GC, while retaining selection of samples in the form of two independent sub-samples, abolished the "party" restriction, initially for the State sample only. It retained it in the case of the Central sample with a modification. An investigator of Party I would survey only sub-sample 1 fsu's, but not necessarily of the same stratum. This enabled doing away with the restriction of “good communication facilities between tehsils” for formation of strata. It may be mentioned, however, that the new strata were smaller than before in general, with the result that (a) communication facilities within them would be reasonably good in any case and (b) the sample size of most strata were

Important Policy Decisions 12
smaller than before, so that an investigator would have to survey fsu's of more than one stratum to complete his work quota, especially with the sub-sample restriction. Eventually, the party restriction was removed in the Central sample as well (see summary Record of 16th Meeting of GC). It was also decided by the GC (16th Meeting) to discontinue publication of sub-samplewise estimates (though it was partially re-introduced in some rounds for selected tables), possibly due to shortage of resources. Before the formation of NSSO, each NSS round covered a large number of subjects of enquiry. Besides the so-called socio-economic subjects such as consumer expenditure, demography, employment-unemployment, household enterprises etc., covered in nearly every round (with some breaks and variations in emphasis in some cases), there had been also a survey on land utilisation and crop yield. The estimates of area and production (especially the latter) obtained from these surveys were subjected to much criticism. The Food and Agriculture Ministry was unhappy about the divergences observed between NSS estimates and the official estimates. The GC decided to discontinue the crop surveys in NSS and to restrict the role of NSS to advising the State agencies on how to improve their estimates of area and production of principal crops. From the 27th round onwards the work of crop surveys were assigned to a special wing of the Field Operations Division (FOD) of National Sample Survey Organisation, the nature of work being, mainly, technical supervision of the work of State agencies. IV.1b The Decennial Programme As regards the purely socio-economic enquiries, a long-term programme was drawn up. According to this, it was envisaged that the following topics would be covered once in 10 years: (i) population, births, deaths, disability, morbidity, fertility, maternity and child care, and family planning (ii) debt & investment and capital formation (iii) land holdings and livestock enterprises. The following topics would be covered once in 5 years: (i) employment and unemployment, rural labour enquiry and consumer expenditure (ii) self-employment in the non-agricultural sector. (Later on there were some minor modifications in this programme.) This took away 7 out of 10 years of a cycle. The remaining 3 years could be kept open for trying out surveys on subjects as yet unexplored as also to accommodate special requests from Central or State Governments. (See Doc. 15.1 and the Summary Record of the 15th meeting of the GC. These elucidate the new perspectives for NSSO as conceived by GC.) Thus multi-subject surveys became passe. It may be mentioned that there was vehement criticism on repeating the consumer expenditure enquiry in every round of NSS. It would be taken up, henceforth, only once in five years. (Annual surveys on consumer expenditure were reintroduced, though, on a much smaller scale starting from the 42nd round.) Demographic surveys were conducted in the 28th and the 38th & 39th rounds. Besides, special surveys on disabled persons were carried out in the 36th and 47th rounds. Some questions on

Evolution of the Sample Design in NSS
13
13
migration were included in Schedule 1.2: Housing Condition and Migration. Surveys on land holdings and debt and investments were undertaken in the 26th, 37th and 48th rounds. (The 37th and 48th rounds covered livestock holdings also) The quinquennial surveys on consumer expenditure and employment-unemployment were carried out in the 27th, 32nd, 38th, 43rd, 50th and 55th rounds. Surveys on self-employment in the non-agricultural sector, which took the form of Economic Census follow-up surveys from the 33rd round onwards, were carried out in rounds 33, 34, 40, 41, 45, 46, 51 and 53. (In fact they used up two years out of five years.) The ad hoc rounds with the subjects covered in each are as under:
round subject round subject
30 Livestock survey 44 Living conditions of tribals,
housing condition and construction
31 Migration, rural electrification, condition of slum dwellers in urban areas
47 Culture, literacy and disability
35 Social consumption and construction
49 Housing condition and migration
42 Social consumption, aged persons survey and survey on ex-armed forces personnel
52 Social consumption
Another important step taken by the GC was to establish the Urban Frame Survey (UFS) on a firm footing. It was decided that UFS should cover all the towns and cities of the country once in five years. Separate staff at the Assistant Superintendent level were earmarked for UFS field work. This proved to be extremely helpful in carrying out surveys in the urban sector. Details of the sampling designs of NSS rounds, starting from the 28th round, are given in the following paragraphs. The sample design of NSS 28th round was exactly according to the recommendations of the Working Group (mentioned earlier). Many design features adopted in the 28th round were adopted in the later rounds as well, including some that were part of earlier NSS practice. Hence, once they are discussed in detail here, only brief references to them need be made in subsequent sections. IV.1c Illustration of the Revised Design: the 28th round The survey period of the 28th round was October 1973-June 1974. This was divided into 3 sub-rounds of 3 months each. (A normal round of one year is usually divided into 4 sub-rounds of 3 months each.). The following areas were outside the coverage of the survey: i) Ladakh district of Jammu & Kashmir ii) Six tehsils of Sarguja and Bastar districts of Madhya Pradesh iii) four tehsils of districts Chanda and Amarwati of Maharashtra iv) rural areas of Nagaland v) disturbed villages of Tripura vi) rural parts of Chandigarh vii) Andaman &

Illustration of the Revised Design: the 28th round 14
Nicobar Islands viii) Mizoram ix) Lakshadweep x) Dadra & Nagar Haveli and xi) Siang, Lohit and Tirap districts of Arunachal Pradesh. Some of these were left out due to difficult physical features and inaccessibility, and others due to civil disturbances. The subjects covered in this round were: consumer expenditure (Sch. 1.0), housing condition (Sch. 1.2), population, births, deaths, disability and morbidity (Sch. 12) and fertility, maternal and child care and family planning (Sch. 14). Information was also collected on construction of houses and physically handicapped persons on a complete enumeration basis through the house-listing schedules. Also, as usual, the rural retail price enquiry was carried out once in each month of the survey period. The sampling design of the 28th round was stratified two-stage with 1971 census villages in the rural sector and UFS blocks (mainly) in the urban sector as the first-stage units. The second-stage units were households. The design was self-weighting for Schedules 1.0, 1.2, 12 and 14 at State × sector level in the sense that there was a common multiplier for all the sample households belonging to each sector (rural/urban) of a State. Agro-economic regions: Each State / Union Territory had been divided into one or more agro-economic “regions”. Before the commencement of the 16th round, in 1960, the entire country was divided into 48 regions by grouping contiguous districts within a State/UT which were broadly homogeneous with respect to crop pattern, altitude above sea level and population density. This was done in consultation with the Food and Agriculture Ministry and the State Governments, with a view to tabulating the results of the land holdings survey undertaken in the 16th and 17th rounds by these regions. In 1964 the Resources and Scientific Research Division of the Planning Commission (PC) proposed 38 Development Divisions, which were later increased to 64 by a Working Group. These were formed within States by grouping contiguous districts similar with respect to crop pattern, soil, population density, altitude, topography, mineral resources, etc. Since it was felt
that it would be very desirable to have a uniform set of regions for all agencies collecting and/or using statistical data, the compositions of the 48 NSS regions and the 64 PC regions were studied at the NSS Department of ISI, with a view to evolving a standard set of regions. A new set of regions was formed at ISI,
ensuring that they did not cut across the 14 “natural divisions”. It was attempted to form separate regions consisting of hilly areas, plains, coastal areas, fertile areas, dry areas, economically backward areas, etc. As sample survey estimates would have to be prepared at the region level, it was felt that they should not be too small either and some heterogeneity was permitted in the case of some regions to make them sizeable tabulation units. All these sets of regions - original NSS, PC and revised ISI - were circulated among the States and finally at a meeting convened by CSO in May 1965, in which representatives of CSO, Ministry of Food and Agriculture, ISI and the States participated, a standard set of regions was agreed upon. In all States, except Gujarat, the district was the smallest unit considered for region formation. In Gujarat, taking into account the comments of the Government of Gujarat which wanted areas of concentration of the Scheduled Tribe population as well as the dry areas to be given priority in region formation, talukas were taken as the basic unit, with the result that parts of some districts fell in different regions in that State. These regions have been in use in NSS since the 21st round, except for changes necessitated by formation of new States and districts. They were originally 66 in number without
NSS regions

Evolution of the Sample Design in NSS
15
15
including Arunachal Pradesh, Andaman & Nicobar Islands, Dadra & Nagar Haveli, Lakshadweep and Mizoram. In the 55th round they numbered 78 for the entire country. Basic strata: Basic strata were formed within regions adhering to the following criteria: (i) no basic stratum to cut across district boundaries (ii) each basic stratum would cover about one million rural population (1971 census) (iii) in case more than one stratum were to be formed in a district, they would be formed by grouping contiguous tehsils (or equivalent administrative units) having more or less similar socio-economic characteristics and crop pattern. The number of basic strata to be formed in a district was arrived at as follows:
1971 census rural population of district
no. of basic strata to be
formed less than 1.5 million 1 1.5 to less than 2.5 million 2 2.5 to less than 3.5 million 3 ...... and so on
It may be mentioned that contiguity and similarity in rural population density and crop pattern (acreage under different crops) were the factors considered for grouping tehsils to form basic strata. In Bihar, Orissa and West Bengal, sub-divisions (administrative units intermediate between district and tehsil), thanas and anchals were, respectively, the units which were grouped together to form basic strata. Out of a total of 364 districts then existing in the whole of India, 8 were outside the survey coverage. The total number of basic strata formed in the remaining 356 districts was 524, out of which 17 were purely rural and 8 purely urban. The rural areas of each basic stratum constituted the ultimate strata for sampling of villages in the rural sector. In the urban sector, however, ‘urban sub-strata’ were formed within each basic stratum by grouping towns by their population (1971 census). Each Class I city (population 1 lakh or more) was a sub-stratum by itself. The remaining sub-strata were formed by grouping towns falling in each of the population size classes: 50,000 to under 1 lakh, 20,000 to under 50,0000 and under 20,000. Allocation of sample: The number of sample villages and blocks allocated to each State depended on the field strength and workload per village/block. The distribution of sample villages and blocks and the sample villages of the rural retail price enquiry is given in Table (1). Almost all the State Governments participated in the NSS programme with matching (sometimes larger) State samples where State staff carried out the field work exactly as in the Central sample following the same procedures. Table (1) gives also the sizes of the State samples. The State × sector-wise allocations were further allocated to the basic strata in proportion to their rural/urban population, generally keeping the final allocations a multiple of six for equal distribution among 2 sub-samples × 3 sub-rounds.
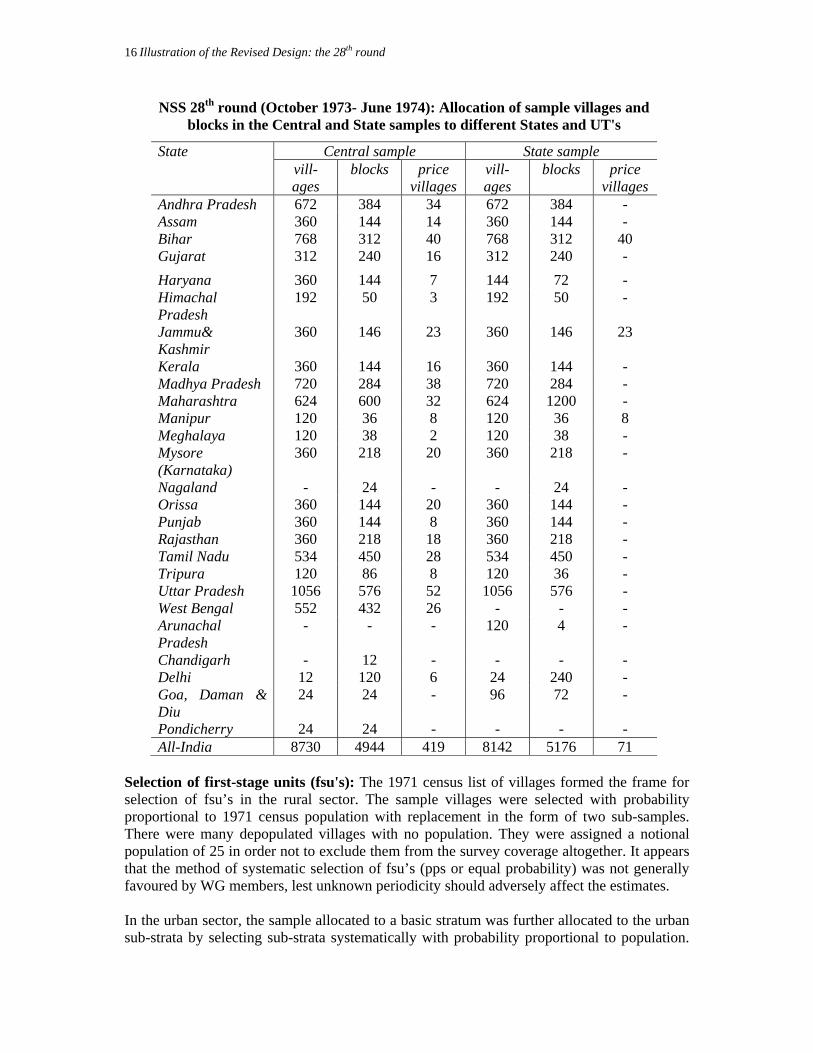
Illustration of the Revised Design: the 28th round 16
NSS 28th round (October 1973- June 1974): Allocation of sample villages and blocks in the Central and State samples to different States and UT's
State Central sample State sample vill-ages
blocks price villages
vill-ages
blocks price villages
Andhra Pradesh 672 384 34 672 384 - Assam 360 144 14 360 144 - Bihar 768 312 40 768 312 40 Gujarat 312 240 16 312 240 - Haryana 360 144 7 144 72 - Himachal Pradesh
192 50 3 192 50 -
Jammu& Kashmir
360 146 23 360 146 23
Kerala 360 144 16 360 144 - Madhya Pradesh 720 284 38 720 284 - Maharashtra 624 600 32 624 1200 - Manipur 120 36 8 120 36 8 Meghalaya 120 38 2 120 38 - Mysore (Karnataka)
360 218 20 360 218 -
Nagaland - 24 - - 24 - Orissa 360 144 20 360 144 - Punjab 360 144 8 360 144 - Rajasthan 360 218 18 360 218 - Tamil Nadu 534 450 28 534 450 - Tripura 120 86 8 120 36 - Uttar Pradesh 1056 576 52 1056 576 - West Bengal 552 432 26 - - - Arunachal Pradesh
- - - 120 4 -
Chandigarh - 12 - - - - Delhi 12 120 6 24 240 - Goa, Daman & Diu
24 24 - 96 72 -
Pondicherry 24 24 - - - - All-India 8730 4944 419 8142 5176 71
Selection of first-stage units (fsu's): The 1971 census list of villages formed the frame for selection of fsu’s in the rural sector. The sample villages were selected with probability proportional to 1971 census population with replacement in the form of two sub-samples. There were many depopulated villages with no population. They were assigned a notional population of 25 in order not to exclude them from the survey coverage altogether. It appears that the method of systematic selection of fsu’s (pps or equal probability) was not generally favoured by WG members, lest unknown periodicity should adversely affect the estimates. In the urban sector, the sample allocated to a basic stratum was further allocated to the urban sub-strata by selecting sub-strata systematically with probability proportional to population.

Evolution of the Sample Design in NSS
17
17
The allocated number was then selected from within the urban sub-strata with probability proportional to size (a measure of the population) with replacement. Due to some practical problems, sample blocks were selected directly from the basic strata circular systematically with pps in Tamil Nadu and West Bengal. Again, in 160 basic strata with very small urban population, only 2 blocks were selected. They were repeated in all three sub-rounds. Large sample villages and blocks were divided into a suitable number of hamlet-groups/ sub-blocks and one of them was selected at random for survey. Selection of sample households for schedules 1.0, 1.2, 12 and 14: Sample households for these schedules were selected linear systematically after they were arranged suitably. In the rural sector, they were arranged by two criteria, viz. means of livelihood, and "whether visited health centre or not". In the urban sector the arrangement was by occupation division. The sampling intervals and random starts for linear systematic selection were specified for each village / block such that the design became self-weighting at State × sector level. The average number of sample households per fsu was 2 for schedule 1.0 and 16 for schedules 1.2, 12 and 14 (all these three schedules were canvassed in the same sample households). Implementation of self-weighting design: Even though a self-weighting design with only one multiplier for a sector lightens data processing load, special care had to be taken to see that the design was properly implemented. The problems encountered and the steps taken in each case are discussed below. 1. The number of hamlet-groups/sub-blocks to be formed (D), the sampling interval (I) and the random start (R) were specified in the sample list against each fsu. Now, if the population of an fsu had changed considerably from its original population resulting in a need to revise D, then I (and R) was also revised such that DI=D'I' where D' and I' were the revised values. If this revision resulted in a small value for I', leading to an unmanageably large sample size of households, investigators were allowed to survey only a fraction 1/k of the required sample size and then they were asked to make (k-1) extra copies of each filled-in schedule. 2. During pre-tabulation processing it was to be seen that the proper intervals had been used in the field and also that the required number of extra copies had been actually prepared. 3. When some fsu’s were casualty, the constant multiplier M was asked to be adjusted to M' as follows: M' = (n /n') M where n and n' were the selected and surveyed number of first-stage units at the level at which the design was made self-weighting. The design of the 28th round has been discussed in considerable detail above, in order to acquaint the readers with the main features of NSS design. The treatment in the following sections will be confined, however, to the important aspects of the designs of the rounds considered. (For example, State-wise sample sizes will not be given hereafter, only the all-India sample sizes). This is done in order to avoid needless repetition.
IV.2 Consumer Expenditure and Employment Surveys: 27th round onwards The quinquennial surveys on consumer expenditure and employment and unemployment (as per the ten-year programme) were carried out in the following rounds: 27th (Oct 1973-Sept 1974), 32nd (July 1977-June 1978), 38th (Jan-Dec 1983), 43rd (July 1987-June 1988), 50th (July 1993-June 1994) and 55th (July 1999-June 2000). Despite the earlier decision of the GC, NSSO, to cover these subjects only once in five years devoting a full round to them, a need was felt for annual estimates of consumer expenditure in order to have an unbroken time series. Thus, starting from the 42nd round (July 1986 - June 1987), in which the main enquiry was on social consumption, a consumer expenditure survey based on a small sample (2 households per fsu) was included in every round (except, of course, the quinquennial survey rounds devoted wholly to consumer expenditure and employment and unemployment). Beginning from the 45th round, a few questions on the activity status of household members were added to the annual survey consumption schedule (Schedule 1.0) so that estimates of both consumer expenditure and employment and unemployment could be had every year. The sampling designs of the 32nd and later rounds are described below. Stratification - rural: The basic strata of the 28th round were by and large used in the rural sector in all subsequent rounds except those devoted to enterprise surveys. However, when 1981 census data became available, those basic strata were marginally redrawn changing the population limit from 1.5 million to 1.8 million, with a view to minimising the need to revise the old basic strata owing to increase in population. At the time of the 38th round this exercise could not be completed in four States, viz., Andhra Pradesh, Assam, Orissa and Tamil Nadu. In these States districts were taken as the strata in the rural sector. By the 43rd round the revision of basic strata was completed in all States except Assam, where the original basic strata were retained, since the 1981 census had not been conducted in Assam. The basis of stratification in the rural sector remained the same in the 50th round. But the 55th round was different in many respects. For the first time in the 54th round, 3 rural strata were identified as follows: 1) all uninhabited villages, 2) villages with population less than or equal to 50, and 3) villages with population greater than or equal to 15,000. These strata were actually formed if there were at least 10 villages of the specified type in a State. A similar procedure was followed in the 55th round. Two strata were identified at State level by grouping a) all villages having population 100 or less and b) all villages having population 15000 or more. These strata were, however, formed only if there were at least 50 villages of the category. The old basic strata were used for the remaining rural areas. Stratification - urban: The basic urban strata (i.e. the urban areas of the basic strata) were themselves taken as the ultimate urban strata in the 32nd round. The procedure of formation of urban sub-strata, adopted in the 28th round, was discarded in later rounds, mainly due to their small size. Moreover, as done first in the 29th round, urban basic strata with very small urban population were pooled with neighbouring ones to form pooled urban strata for sampling purposes. Generally, pooling was done within districts. The basis of urban stratification was revised in the 38th round, taking into account the administrative divisions of the Field Operations Division (FOD). Towns were divided into four population classes: (1) below 50,000, (2) 50,000 to below 2 lakhs, (3) 2 lakhs to below 1,000,000 and (4) 1,000,000 and above. Strata were formed within an FOD sub-region (consisting typically of 1 to 3 districts) by grouping towns belonging to each of the above size

Evolution of the Sample Design in NSS
19
19
classes (1) to (3). Each city of class (4) formed a self-representing stratum by itself. The purpose of choosing these classes was as follows. Some estimates from the survey were to be prepared by these same size classes of towns and hence this mode of stratification would make such estimates more efficient. In the 43rd round urban strata were formed by grouping towns falling in each region by population size classes as follows: (1) less than 50,000. (2) 50,000 to less than 2 lakhs (3) 2 lakhs to less than 4 lakhs (4) 4 lakhs to less than 10 lakhs, and (5) 10 lakhs and above. Each city of the last class formed a stratum by itself, as in the 38th round. A validation exercise on NSS estimates of consumer expenditure by Minhas et al [(4)] indicated that a possible weakness of the design of NSS consumer expenditure surveys could be the small number of sample households belonging to the relatively affluent section of the
population. To overcome this, some modifications were introduced in the survey design of the 43rd round. It was felt that second-stage stratification alone might not be enough. Separate strata might be formed comprising areas where the affluent households of big cities lived. Thus towns with
population 4 lakhs or more were further divided into two parts for the purpose of stratification: (a) areas of concentration of the relatively affluent section of the population and (b) other areas. This procedure was adopted in the 50th round also. In the 55th round, the basis of stratification was revised. Towns within each region were classified by population as follows: less than 50,000, 50,000-1,000,000 and each city with population greater than 1,000,000. Within each of these classes, strata were formed as follows: blocks falling in a hospital area, industrial area or bazaar area formed one stratum and the rest formed another. (The merits of this change are, of course, open to question.) Allocation: As in other rounds, in these rounds also the total number of fsu’s was arrived at by considering the per fsu workload and total number of investigators. (It may be mentioned that in the recent rounds of NSS, the within fsu workload is fixed such that an investigator can complete 1.5 fsu’s per month, or 18 fsu’s per year.) This was allocated to the States/UT’s in proportion to their investigator strength (Central staff). Each State allocation was further allocated to the rural and urban sectors considering the relative sizes of the rural and urban populations. The rural/urban allocation was allocated to the rural/urban strata in proportion to rural/urban population. However, in the urban sector, in 43rd round double weightage was given to the strata formed in the areas of concentration of the affluent households. The stratum allocations were made a multiple of 8 (except in a few cases where it was a multiple of 4 only) to give equal representation to 2 sub-samples x 4 sub-rounds. Selection of fsu’s: In the rural sector, unlike the 32nd and 38th rounds when villages were selected with probability proportional to population (ppp) with replacement, in the 43rd round they were selected circular systematically with ppp. The same procedure was followed in the 50th and 55th rounds as well. In the urban sector, while in the 32nd round the sample blocks were also selected by ppswr (size being a measure of the block population), they were selected by srswor in the 38th round and circular systematically with equal probability in the 43rd, 50th and 55th rounds. Villages and blocks were selected in the form of two independent sub-samples. When selection was systematic each of the two sub-samples were selected by taking independent random starts. The samples of each sub-sample were equally allocated to the four sub-rounds
Affluent households
Consumer Expenditure and Employment Surveys: 27th round onwards 20
into which the survey period of one year had been divided. Hence allocation was made multiple of 8. Strata with allocation as a multiple of 4 only were usually paired within the same region or population size class such that the sub-sample x sub-round wise distribution of samples became uniform at that level. Hamlet-group/sub-block selection: When the current population of a sample village/block was 1200 or more, it was divided into a certain number of parts with approximately equal population (called hamlet-groups in the rural sector and sub-blocks in the urban sector) and one of them was selected at random for survey. The field work was confined to the selected part of the fsu. In the 50th and 55th rounds, two hamlet groups were selected in the rural sector and merged to form the frame for selection of households. Selection of sample households - rural sector: In the 32nd round, 12 sample households were selected circular systematically with a random start after first arranging the households listed in the village (or selected hamlet-group) by their “means of livelihood (m.l.) class” which was identified at the listing stage as one of the following: (1) self-employed in non-agriculture, (2) rural labour, and (3) others. (It may be mentioned that in the 27th round each of these classes formed a second-stage stratum with a self-weighting design.) In the 38th round, households of m.l. class (3) were further arranged in five broad classes of household land possessed and then a total of 10 sample households were selected as in the 32nd round. In the 43rd round, a separate second-stage stratum (sub-stratum 1) was formed by the richest ten households (8 households, if the total number of households listed was less than 80) of the village/ selected hamlet-group and two households were selected from them circular systematically for survey. The rest of the listed households formed sub-stratum 2 and 8 households were selected from this sub-stratum exactly as in the 38th round. Similar procedures were followed in the 50th and 55th rounds also. Selection of sample households - urban sector: In the 32nd round, the households listed in the sample block/sub-block were arranged according to two criteria combined: (1) self-employed or not and (2) average monthly per capita consumer expenditure less than or equal to a given value (A) or greater than A (A varied from State to State). Then a sample of 12 households was selected circular systematically. In the 38th round, the households were first divided into two groups by the first criterion and households of each group were further arranged by 5 broad classes of average monthly per capita consumer expenditure. 10 households were then selected circular systematically with a random start. In the 43rd round, the households were first divided into two second-stage strata (then called sub-strata). Households with average monthly per capita expenditure Rs.800 or more (Rs.1000 or more, in cities with population 10 lakhs and above) formed sub-stratum 1 and the remaining households, sub-stratum 2. The means of livelihood class of each household was identified as one of the following: (a) self-employed, (b) regular wage/salaried employee (c) casual labour and (d) others. From sub-stratum 1, sample households were selected circular systematically with a random start - 4 in strata of concentration of affluent households and 2 in the remaining strata. In sub-stratum 2, the households were first arranged by their m.l. class defined as above. Households of m.l. classes (b) and (c) were further arranged by three broad classes of monthly per capita expenditure (less than A, A to B and above B, where the values of A and B varied between States and were arrived at such that approximately 30%, 60% and 10% of the population fell in these classes respectively). From this arranged frame, sample households (6 in the ‘affluent’ strata and 8 in the rest) were selected circular systematically with a random start. Again, in the 50th and 55th rounds, similar methods were adopted for household selection.

Evolution of the Sample Design in NSS
21
21
In the 55th round one-half of the sample fsu's of each sub-round were revisited in the following sub-round. Annual surveys: Annual surveys were undertaken in all rounds starting with the 42nd round, except in the quinquenial survey rounds. From among all the households listed in the selected village/block, two households were selected for canvassing schedule 1.0, usually circular systematically with a random start. In the rounds devoted to enterprise surveys, in which two hamlet-groups/sub-blocks were selected for survey, one of which was the area with relatively high concentration of the enterprises under investigation in the round, one household each was selected at random from each selected hamlet-group/sub-block. In the case of these annual surveys, the design adopted for selection of first-stage units was usually oriented towards the major subject of the round concerned. When the main enquiry is
a household enquiry, such as social consumption, the design may be appropriate for the consumer expenditure survey as well. However, this may not be so in the cases of enterprise surveys. Some estimates of relative standard errors, based on sub-sample-wise estimates, of the 44th and 45th rounds indicate that the 45th round estimates might have larger relative standard errors compared to those of the 44th round. While the 44th round was devoted to enquiries on living conditions of tribals and housing
condition and construction, the 45th round was an Economic Census follow-up survey on small-scale manufacturing enterprises. IV.3 Non-agricultural Enterprise Surveys The NSS rounds in which surveys on non-agricultural enterprises were carried out in the period covered in this section were the 29th, 33rd, 34th, 40th, 41st, 45th, 46th, 51st and 53rd. The traditional household approach and the corresponding sampling design (which was adopted in the 28th round) were followed in the 29th round for the enterprise survey also. From the 33rd round (1978-79) onwards an establishment approach was adopted following the Economic Census (EC) carried out first in 1977 under the auspices of the Central Statistical Organisation (CSO). The surveys were planned as follow-up surveys of the EC and their sampling design was based on the EC frame to the extent feasible. IV.3a Non-agricultural Enterprise Surveys: 29th round The following five types of ‘household’ enterprises were covered in the 29th round: Small scale manufacture and repair services (Schedule 2.2), transport (Schedule 2.3) trade, hotels and restaurants (Schedule 2.4) services and construction (Schedule 2.5) and mining and quarrying (Schedule 2.6). A household having at least one member self-employed in any of the above kinds of non-agricultural enterprises during the 365 days preceding the day of listing was identified as an enterprise household. Some forestry activities, though classified as agricultural, were included in the survey coverage. A household might be engaged in one or more of the above activities. Manufacturing and repairing services registered under 2m (i) or 2m (ii) of the
Annual surveys of consumer expenditure

Non-agricultural Enterprise Surveys: 29th round 22
Factory Act, 1948, were not covered. As regards other activities, household enterprises having 6 or more employees taking together all establishments of the same type were also kept outside the survey coverage. Besides the household enterprises as defined above, non-registered non-household establishments engaged in manufacture and repair services were also covered (Schedule 2.21). Besides the enterprise survey, there was, in the 29th round, a rural labour enquiry also, for which two schedules were canvassed, namely, Schedule 1.03 (income and expenditure of rural labour households and Schedule 10.1 (employment, unemployment and indebtedness of rural labour households). The procedures for stratification, allocation and selection of fsu’s were more or less the same as those followed in the 28th round. In the urban sector, however, some of the basic urban strata with very low population content were merged such that no pooled urban stratum crossed district boundaries, except in the case of a few districts having very small urban population which had to be merged with a neighbouring district of the same region. Thus 507 basic urban strata were reduced to 386 pooled urban strata. A combined sample of households was selected for all the enterprises from among all the households reporting any enterprise activity as defined above. The sample households were selected linear systematically with pre-assigned intervals such that the design became self-weighting at State x sector level. The expected average number of households per sample village was 12 and per sample block, 28 to 30. Procedures similar to those explained under Section IV.1c (features of the 28th round) had to be resorted to for maintaining the self-weighting nature of the design. The sample households for Schedule 10.1 were selected from rural labour households in a similar way, the average number of sample households per sample village being 4. For Schedule 1.03, sample households were selected linear systematically from the sample of Schedule. 10.1 with 4 as interval (sample households for Schedule 1.03 would thus be 1 per sample village). The rural labour enquiry was, of course, confined to the rural sector. IV.3b Economic Census The Central Statistical Organization (CSO) initiated a prestigious scheme called “Economic Censuses and Surveys” (EC) in the year 1976 to fill in vital data gaps relating to the unorganized segments of the non-agricultural sector of the country’s economy. The scheme envisaged periodically organising countrywide censuses of economic activities, followed by detailed sample surveys. Whereas the census sought to provide basic information on number, location, activity, employment etc. of the non-agricultural enterprises, the follow-up sample surveys were aimed at collection of detailed information about their structure, investment, employment, input, output etc. The programme of sample surveys was formulated so that data from (a) established surveys such as the Annual Survey of Industries, (b) administrative channels and (c) sample surveys were complementary to one another. The first EC was conducted in 1977. It covered all non-agricultural enterprises with usually at least one hired worker (i.e. “establishments”). This was followed by two sample surveys, one in the 33rd round (1978-79) on the unregistered manufacturing sector and the other in the 34th round (1979-80) on the sectors of trade, transport, hotels & restaurants, storage &

Evolution of the Sample Design in NSS
23
23
warehousing and services. Of these the so-called Non-Directory Establishments (NDE's, the smaller establishments, having at least one hired worker but with total workers 5 or less) and Own Account Enterprises (OAE's, with usually no hired worker) were covered in the 33rd round (manufacturing and repair) and the 34th round (other than manufacturing and repair) of NSS. Sample surveys on the Directory Establishments (DE’s) - the establishments having usually at least one hired worker and total workers 6 or more - were carried out directly by CSO with the field investigation conducted by the Assistant Superintendents of FOD, NSSO. The second EC was carried out in 1980 along with the house-listing operations of the 1981 census. It covered all enterprises (i.e. establishments as well as OAE's) in the entire economy, excluding only crop production and plantation sectors. Follow-up sample surveys were undertaken (a) in 1983-84 on transport, hotels & restaurants, storage & warehousing and services (b) in 1984-85 on unregistered manufacturing and (c) in 1985-86 on wholesale and retail trade. The surveys under (a) were carried out by CSO with FOD staff. As regards (b) the NDME’s and OAME’s were surveyed in NSS 40th round and the DME’s were covered in a parallel survey by CSO using the services of FOD Assistant Superintendents. In the case of (c) also the NDTE’s and OATE’s were covered in NSS 41st round and the DTE’s in the parallel CSO enquiry.
Follow-up sample surveys of the second Economic Census, 1980
Survey period
Subject How conducted
1983-84
transport, hotels & restaurants, storage & warehousing and services
by CSO with FOD staff
1984-85
unregistered manufacturing
NDME’s and OAME’s
surveyed in NSS 40th round
DME’s
covered in a parallel survey by CSO using the services of FOD Assistant Superinten-dents
1985-86
wholesale and retail trade
NDTE’s and OATE’s
surveyed in NSS 41st round
DTE’s
covered in the parallel CSO enquiry
In place of a proposed EC in 1986 (which, though approved by the Planning Commission, could not be undertaken due to severe resource constraints), the EC-80 frames were updated in 64 cities. Nevertheless three sample surveys were carried out, as had been done following the 1980 EC. A CSO survey on hotels & restaurants and transport was organised in 1988-89. The survey on non-registered manufacturing was carried out in 1989-90 - NDME's and OAME's covered in NSS 45th round and DME's, in the parallel CSO survey - and the survey on trade was carried out in 1990-91, NSS 46th round, covering NDTE’s and OATE’s, and the corresponding CSO survey covering DTE’s. A survey on the service sector was organised by CSO.

Economic Census 24
The third Economic Census was carried out in 1990 along with the house-listing operations of the 1991 population census. As a follow-up of this, an integrated survey on unorganised manufacturing enterprises was carried out in the 51st round of NSS (July 94–June 95) covering OAME’s, NDME’s and DME’s (“integrated”, because DME’s were also covered by NSS, unlike in earlier rounds). A survey on small trading units (NDTE’s and OATE’s, but not DTE’s) was carried out in the 53rd round. The sampling designs of the NSS surveys mentioned above - rounds 33, 34, 40, 45, 46, 51 and 53 - will be discussed below. IV.3c Non-agricultural Enterprise Surveys: 33rd round The 33rd round of NSS was almost fully devoted to a sample survey of non-registered manufacturing enterprises, that is to say, establishments and own account enterprises engaged in manufacturing (including repair) which were not registered under sections 2m(i) and 2m(ii) of the Factories Act, 1948. The establishments (i.e. enterprises engaging at least one hired worker) were divided into two classes: Directory Establishments (DE). i.e. those having six or more workers including at least one hired worker and/or having annual output of rupees one lakh or more and Non-Directory Establishments (NDE) i.e. those having at least one hired worker with total number of workers five or less and annual output less than one lakh rupees. Only the NDME’s and OAME’s (i.e. Own Account Manufacturing Enterprises) were covered in NSS 33rd round. The DME survey was carried out separately by CSO using NSSO field staff. Besides this, there was also the usual rural retail price enquiry. Also, there was another special survey in the North-Eastern States. The survey period was July 1978 to June 1979, which was divided into four sub-rounds, as usual, of 3 months each. The geographical coverage was the same as that of the 29th round. The list of Enumerator’s Blocks (EB's) of EC (the EC frame) was the basis for the sampling design of the 33rd round. However, due to the delay in the receipt of this frame, some compromises had to be made. Moreover, as the EC frame was possibly incomplete (as it excluded EB’s having no DE’s and NDE’s), a sub-sample of the villages and urban blocks selected in the 29th round had to be surveyed for compete coverage. (Though the proceedings of the concerned Working Group or the GC meeting make no mention of the latter sample, it has been possible to confirm the above through discussions with those who were handling the design of this survey.) Design of the main sample The broad design was stratified two-stage, with EB’s of EC-77 as the fsu’s and non-registered manufacturing enterprises (NDME’s, OAME’s) as the second-stage units. There was thus an important deviation in the definition of both the first-stage as well as the second-
stage units of sampling. The fsu was an EB of EC in this round whereas it had hitherto been a census village and UFS block in the usual rounds. The ssu in NSS had all along been a household and all the enterprises operated by it. But in this round the ssu was an enterprise/establishment located within the
Enterprise sampling

Evolution of the Sample Design in NSS
25
25
sample fsu. Though the fsu reverted to census village in the rural sector after the 34th round, the new definition of ssu’s was retained. Stratification, allocation and selection of fsu’s: Districts were the ultimate strata in both rural and urban sectors. The annual workload of an investigator was taken to be 200 sample enterprises (in the main sample) and on the assumption of a ratio of 1: 4 between NDME’s and OAME’s in an EB (EC frame did not give number of OAME’s), the number of NDME’s to be surveyed by an investigator came to 40. Thus given the numbers of investigators (I) in a State, their total workload in terms of NDME’s could be arrived at as 40 times I. This was allocated to the rural and urban sectors of each district in proportion to the number of NDME's in each stratum. The rural/urban EB’s were selected with probability proportional to number of NDME’s with replacement. The number of EB’s to be selected was not fixed beforehand. Instead, an inverse sampling procedure was adopted: selection of EB’s continued until, based on the frame, the stratum quota of NDME’s was achieved (assuming complete enumeration of all OAME’s and NDME’s in the selected fsu’s). In many States rural EC frames were not ready by July 1978. In these States sample EB’s were selected through census villages for survey in the first sub-round. The rural strata were those of the 32nd round (which were essentially those of the 28th round). First, sample villages were selected with probability proportional to population with replacement and EB’s were selected from the selected villages with probability proportional to number of NDME’s with replacement. In sub-rounds 2 to 4 sample EB’s were selected directly in these States also. (In some cases, the whole village was found to have been treated, contrary to prescribed procedures, as one EB in the Economic Census. Such villages were divided into EB’s in accordance with the prescribed procedures of EC and one of them was selected at random for survey and in such cases the number of NDME’s in the selected part was taken to be their number in the village divided by the number of EB’s formed.) Sub-division of EB’s: In the urban sector, if any EB had current population more than 1600, it was divided into two or more sub-blocks of equal population content and one was selected at random for survey. There was no hamlet-group selection in the rural sector. Sampling of enterprises: In general all the NDME’s and OAME’s in the EB or sub-block were taken up for survey. However, if the total number of enterprises (OAME’s + NDME’s) exceeded 20, a linear systematic sample of enterprises was selected with interval as follows:
number of enterprises 1-20 21-40 41-60 and so on … interval 1 2 3
Repetition and substitution of EB’s: If, in the course of selection with replacement, an EB was repeated in the same agency’s sample (Central/State), the schedules were simply copied. But if the repetition was in a different agency’s sample, a substitute was taken. Repeat sample: One-fourth of the sample villages of each stratum of the 29th round were selected systematically for survey in the 33rd round. In these villages, if EB’s existed, they were divided into two groups (with NDME and without NDME) and one EB was selected at random from each group. In case no EB’s had been formed, two or more EB’s were formed equalising population and one was selected at random for survey. Small villages were taken as one EB and fully surveyed.

Non-agricultural Enterprise Surveys: 33rd round 26
In the urban sector also, one-fourth of the urban sample blocks of the 29th round were selected for repeat survey. Estimation procedure: The estimation procedure adopted was somewhat complicated. From the repeat sample from the 29th round, separate estimates were prepared for the two sub-universes: (a) EB’s with at least one NDME and (b) the rest. The estimate of the former was pooled with the main sample estimate to obtain the final estimate for sub-universe (a) (with weights equal to the number of fsu’s in each). Then this was added to the estimate of sub-universe (b). A similar problem was there regarding the estimates from the main sample of some States whose EC frame became available only after sub-round 1. In such cases two separate estimation formulas had to be used - one for sub-round 1 and the other for sub-round 2-4. These estimates were also pooled with appropriate weights which were proportional to the number of EB’s on which each was based. IV.3d Non-agricultural Enterprise Surveys: 34th round The 34th round of NSS was carried out during July 1979 to June 1980. The geographical coverage was the same as that of the 33rd round. The survey covered both OAE’s and NDE’s engaged in the following activities: trade, hotels & restaurants, transport, storage & ware-housing and services. The definitions of OAE’s, NDE's and DE’s were the same as those of the 33rd round. However, the following activities, in most of which there can hardly be any OAE or NDE, were explicitly excluded from the coverage of the survey (the numbers within brackets give major group as per NIC 1970): air transport, communication, banking and similar types of financial institution (80), provident funds and insurance (81), public administration and defence (90), sanitary services (91), recognised educational institution (920, 921), research and scientific services (922), domestic services (960), repair services (97 - covered in 33rd round) and international and extra-territorial bodies (98). Also, all public sector establishments were left out. Further, all OAE’s and NDE’s which operated for less than 30 days (15 days in the case of seasonal enterprises) during the preceding 365 days were excluded from the survey coverage. The following schedules were canvassed in the 34th round are listed below. The broad sample design was stratified two-stage: Economic Census EB’s were the first-stage units in both rural and urban sectors, and enterprises, the second-stage units. Sch. no.
Description Sch. no.
Description
0.0 List of enterprises 2.51 OAE’s in service sector 2.41B Trade 2.52B Unrecognised educational NDE’s 2.42B Hotels and restaurants 2.53B Medical & health NDE’s 2.31B Mechanised transport 2.54B Community and non-commercial
cultural NDE’s and OAE’s 2.32B Non-mechanised transport 2.55B Other NDE’s in service sector 2.33B Services incidental to transport 3.01 Monthly rural retail prices 2.34B Storage & warehousing 4.0 Investigator’s time record Stratification and allocation: In the rural as well as in the urban sector, each district was a stratum (except in Gujarat, where each part of a district falling in different regions formed a stratum). Within each stratum, the EB’s were divided into two sub-strata: (1) those EB’s

Evolution of the Sample Design in NSS
27
27
having at least one DE/NDE engaged in any of the following industries: trade, hotel & restaurant, transport and storage & warehousing and (2) all other EB’s. (In Gujarat, sub-stratum 2 was further divided as follows: sub-stratum 2, having DE/NDE in any other industry and sub-stratum 3, all remaining EB’s.) The total number of sample EB’s to be selected from each State/UT was decided on the basis of the investigator strength. The number of sample EB’s to be selected from each sector × stratum was determined by allocating the total State allocation in proportion to the total number of DE’s and NDE’s in the above four industries covered in this round. District-wise allocation was allocated to sub-strata 1 and 2 in the ratio 5: 1 in the rural and urban sectors separately. Selection of EB’s: Sample EB’s were selected from sub-stratum 1 with probability proportional to the number of (DE’s + NDE’s) in the above four industries as per EC frame. From sub-stratum 2, sample EB’s were selected with equal probability. (Establishments in the service sector were not considered for allocation or selection because a large number of service sector establishments were outside the survey coverage.) If the population of an EB exceeded 1000 or the number of DE’s + NDE’s under survey coverage exceeded 200, it was divided into 2 or more sub-blocks of nearly equal population/ number of DE’s + NDE’s and one of them was selected at random for survey. Selection of sample enterprises: If the total number of NDE’s coming under the coverage of the survey was less than or equal to 12, all of them were surveyed. When it was greater than 12, the 12 NDE’s to be sampled were distributed among the schedules as follows: First, one NDE is allotted to each schedule. Next one more was allotted to the different schedules in the following order of priority: 2.31B, 2.32B, 2.33B, 2.34B, 2.52B, 2.53B, 2.54B, 2.55B, 2.41B and 2.42B. The allocation was terminated once a total of 12 NDE’s were allocated. The allocated sample was selected independently for each schedule from the available NDE’s of the respective type, circular systematically. As regards OAE’s, a circular systematic sample of 3 or 5 OAE’s were selected taking all schedule types together (except 2.51 - service sector) - 3 in EB’s with at least one NDE under coverage and 5 in EB’s with none at all. All OAE’s in the service sector existing in the sample EB were surveyed for schedule 2.51. Even though the EC frame used in the 33rd and the 34th rounds was the same, there was no attempt in the 34th round to cover the areas not represented in the EC frame by a supplementary sample such as one from the 29th round, as done in the 33rd round. However, an attempt was made at the estimation stage to rectify this possible under-coverage in sub-stratum 2 under-coverage was a possibility in sub-stratum 2 only), using the 1971 census frame. IV.3e Non-agricultural Enterprise Surveys: 40th round The 40th round was a follow-up survey of the second Economic Census, viz. EC-1980, covering NDE’s and OAE’s engaged in manufacturing and repairing. Its survey period was July 1984-June 1985. Geographically it extended over the whole of India except Ladakh and Kargil districts of Jammu & Kashmir and the rural areas of Nagaland.
Non-agricultural Enterprise Surveys: 40th round 28
Even though the sample design was based on the frame of EC-80 and was similar to that of the 34th round, there were many modifications. First of all, in distinguishing between NDME’s and DME’s, the criterion of output had been dropped in EC-80. Secondly OAE’s were also covered in EC-80, which resulted in most villages being included in the EC frame. In formulating the design, villages with no DME, NDME or OAME were explicitly considered and formed into separate strata, so that almost the entire universe was covered by the sample. The details of the sampling design are given in the following paragraphs. Rural sector: Each district (or a group of districts, when the districts were small) was a primary stratum. Each primary stratum was divided into three sub-strata as follows: (1) villages having at least one NDME, (2) other villages with at least one OAME and (3) all the remaining villages. The total sample size of villages and blocks in a State and FOD region within a State were arrived at based on investigator strength. These were further allocated to the rural and urban sectors of the FOD region and then to the respective primary strata in proportion to 3 NDME + OAME. (Value added in one NDME was on the average equal to that of 3 OAME’s). The allocations were made a multiple of 4 at region level and 8 at State level (to enable equal-sized samples to be allocated to 2 sub-samples × 4 sub-rounds). Now, within a primary stratum, sub-stratum 3 was generally given a small allocation of 2 or 4. The remainder was allocated to sub-strata 1 and 2 in the ratio 3: 1. Sample villages were selected by ppswr from sub-strata 1 and 2 where the sizes were, respectively, number of NDME’s and number of OAME’s. Sample villages were selected from sub-stratum 3 circular systematically with equal probability. (In Assam, Arunachal Pradesh and some districts of U.P., other methods were adopted due to the absence or non-availability of the EC frame; they are not described here in order not to make this account too long.) Hamlet-group selection: In case the current population of a sample village was more than 1200, it was divided into two or more “hamlet-groups” depending on the current population. If only two such hamlet-groups were formed, one was selected at random for survey. If more than two hamlet-groups were formed, two were selected by srswor, and the segment of the village formed by these two taken together was surveyed. 10 NDME’s and 4 OAME’s were selected circular systematically from their respective, separate, frames after listing of enterprises. In case the number of listed NDME’s was less than 10, the OAME sample size was increased to have a total sample (NDME + OAME) of size 12. Urban sector: Primary strata were formed in the urban sector also as in the rural sector, but the rural and urban primary strata in terms of districts/groups of districts did not always coincide. In each primary stratum 4 sub-strata were formed. In Class I towns of a stratum the EB’s of EC-80 were grouped into 3 sub-strata just like the villages while all the remaining towns together formed sub-stratum 4. The allocation to the primary strata was done as in the rural sector. Within the primary strata, they were allocated to (a) Class I towns and (b) other towns in proportion to 3 NDME + OAME. In Class I towns, the allocation to sub-strata 1 to 3 was done as in the rural sector. Minimum allocations for sub-strata 1, 2, 3 and 4 were 4,2, 2 and 8 respectively. All allocations to sub-strata were adjusted to even numbers to enable selection of samples in the form of two equal sub-samples. (In EC follow-up surveys equality of sub-round sample sizes could be ensured only at the State level.) Selection of blocks: In sub-strata 1-3 (i.e. in Class I towns) the procedure of selection of blocks was the same as in the rural sector. In class II -VI towns, wards were first selected by

Evolution of the Sample Design in NSS
29
29
ppswr where size was the number of NDME’s (wards with no NDME were given a notional size of 2). In each ward the investigator selected two UFS blocks at random. The second block was surveyed if and only if the number of NDME’s in the first was less than 3. (As in the rural sector, there were a few districts for which EC frame was not available and hence selection procedures different from the above had to be adopted.) Sub-block selection: Sub-block formation and selection was done in the urban sector also. In sub-strata 1 to 3 only one sub-block was selected for survey. But in sub-stratum 4, a second sub-block was selected if the first sub-block contained less than 3 NDME’s. In such cases, the two sub-blocks were considered together for listing and sample selection. Selection of sample enterprises was done in the same manner as in the rural sector. It can be seen from what has been said above that in order to ensure sufficient number of enterprises in the sample, selection procedures akin to inverse sampling were adopted in enterprise surveys. However, the estimation procedures used were of the usual fixed-sample-size type. This might have led to bias in estimates of aggregates. IV.3f Non-agricultural Enterprise Surveys: 41st round The 41st round of NSS was limited to a survey of non-directory and own-account enterprises engaged in trade. The geographical coverage was the same as for the 40th round and the survey period was July 1985-June 1986. The sampling design was based on the EC-80 frame, as in the 40th round and, as usual, was stratified two-stage. Important features of the design are given below. In this round, the NSSO survey on NDTE’s and OATE’s and the corresponding CSO survey on DTE’s had their first-stage sample in common. For this reason, the stratification procedure of the 41st round took into account the number of DTE’s in the villages/EB’s also. Stratification, allocation and selection - rural sector: Each NSS (agro-economic) region within an FOD (administrative) region formed a stratum. They were groups of districts, except in Gujarat, where they were groups of talukas falling in the same NSS region × FOD region. (In a few cases, these primary strata had been merged, but without cutting across NSS region boundaries.) Thus 86 strata were formed out of 76 regions. Further, in 11 States an additional stratum, stratum 0, was formed grouping all the villages found missing from the EC frame (CSO supplied a separate list of such villages). Their total number was about 45,000, the major contributors being Bihar, West Bengal and Orissa. Sub-strata were formed within each primary stratum, more or less as in the 40th round, as follows: sub-stratum 1: villages having at least one DTE; sub-stratum 2: of the rest, those having at least one NDTE; sub-stratum 3: all the remaining villages in the EC frame; sub-stratum 4: villages missing from the EC frame. It may be noted that sub-stratum 4 was there only in primary stratum 0. In fact both were identical. Exceptions were: In Delhi, Goa, Daman & Diu and Pondicherry, villages with at least one DTE/ NDTE formed sub-stratum 1 and the rest, sub-stratum 2. In Arunachal Pradesh, villages with a good number of trading enterprises formed sub-stratum 1 and no cluster sampling was resorted to in this sub-stratum. The remaining villages formed sub-stratum 2.

Non-agricultural Enterprise Surveys: 41st round 30
The total first-stage sample size of about 14,500 was first allocated to the States/UT's and FOD regions considering the investigator strength. It was further allocated to the rural and urban sectors of these States/UT's in proportion to (3 DTE + 1 NDTE) as per EC-80 (EC-77 in Assam). Thus the Central sample consisted of 4408 villages and 9985 urban blocks. The State allocation was further allocated to the rural primary strata by the same formula. The stratum allocations were also allocated to sub-strata 1 and 2 following the same rule, but after allocating a small sample of 8 (or a multiple of 8) villages to sub-stratum 3. A small sample, mostly of size 4 or 8, was allocated to sub-stratum 4 also, in those States where it was formed. Sample villages were selected in the form of two independent sub-samples, circular systematically with probability proportional to size. The sizes varied over the strata and sub-strata. It was number of DTE’s, NDTE’s and OATE’s in sub-strata 1, 2 and 3 respectively. In sub-stratum 3, villages with no OATE were given size 1. In Delhi, Goa, Daman & Diu and Pondicherry, size in sub-stratum 1 was 3 DTE + 1 NDTE. In Chandigarh size was 6 DTE + 2 NDTE + OATE with size 1 assigned to villages with no DTE/NDTE/OATE at all. In Lakshadweep, size was 1981 census population and in Arunachal Pradesh the selection was with equal probability. It may be mentioned that the Central and State samples were selected as linked samples, villages with odd order of selection in each sub-sample forming the Central sample and the rest, the State sample. (This was to ensure better geographical spread for the combined sample and to rule out common units.) Stratification, allocation and selection of fsu’s - urban sector: The sampling frame for selection of fsu’s was 1980-EC EB’s in those Class I cities where they were identifiable and UFS blocks in the remaining Class I cities as well as in all Class II to VI towns. (The EC frame could be used only in 55 of the 225 Class I cities as reported by FOD.) Due to the small number and uneven distribution of wholesale traders, some special steps were taken, at the time of stratification, in order to obtain sufficient number of such enterprises in the sample, because, in terms of total turnover, wholesalers far surpassed the other traders on the average. All towns and cities were divided into two groups: (A) those with high concentration of wholesalers and (B) the other towns*. The urban strata were formed within States/UT's as follows: 1) Each city with 1981 census population 5 lakhs or more constituted a stratum by itself 2) Other Class I cities with EC frame 3) Other Class I cities with UFS frame 4) Classes II to VI towns. In some States, strata were formed at FOD region level by grouping (a) Class I cities and (b) other towns. This was done only to facilitate allocation of sample blocks according to the investigator strength. The total number of urban strata came to 101 out of which 33 were individual Class-I cities with population 5 lakhs or more (of these only 5 had usable EC frame). Sub-strata: The information on EB’s/UFS blocks with high concentration of wholesalers which was collected in towns of Group A was used in sub-stratification. The sub-strata were as follows:
*Information supplied by FICCI was helpful here.

Evolution of the Sample Design in NSS
31
31
Sub-stratum
Strata with EC-80 frame Sub-stratum
Strata using UFS frame
1 EB’s with high concentration of wholesalers
1 Blocks with high concentration of wholesalers
2 Residual EB’s having at least one DTE
2 Residual blocks located in ‘bazaar area’ (as noted in the UFS frame)
3 Residual EB’s having at least one NDTE
3 Residual blocks
4 Residual EB’s Allocation of fsu’s: The total urban sample was allocated to the primary strata in proportion to 3DTE + 1 NDTE. The allocation to sub-strata in strata with EC frame was as follows: A thin sample of 8 (or a multiple of 8) EB’s was allocated to sub-stratum 4. The remaining sample size was allocated to sub-strata 1, 2 and 3 in proportion to 3 DTE + 1 NDTE with 4 times weightage to sub-stratum 1. In sub-strata using UFS frame, too, a thin sample of 8 (or a multiple of 8) blocks was allocated to sub-stratum 3. The rest of the sample was allocated to sub-strata 1 and 2 in proportion to the number of UFS blocks with 4 times weightage to sub-stratum 1. Allocation was made a multiple of 8 except in some sub-strata where all the blocks were included in the sample. Selection of fsu’s: In strata where the EC-80 frame was used, EB's were selected circular systematically with probability proportional to size where size was 3 DTE + 1 NDTE in sub-stratum 1; (number of) DTE in sub-stratum 2; NDTE in sub-stratum 3; and OATE in sub-stratum 4 (EB’s with no OATE of sub-stratum 4 were given size 1). In strata where UFS frame was used, blocks were selected circular systematically with equal probability. Sample EB’s/blocks were always selected in the form of two independent sub-samples. In sub-stratum 1 (EB’s/blocks with concentration of wholesale traders) the EB’s/blocks were arranged by major commodity group (3-digited NIC Group code) before sampling, in an attempt to represent different commodity groups proportionately in the sample. The Central and State samples were selected as linked samples as in the rural sector. Hamlet-group/sub-block selection: pockets of concentration of trading enterprises: Sample villages with current population 1200 or more, and sample blocks having current population 1200 or more or number of trading enterprises 100 or more, were divided into a number of hamlet-groups/sub-blocks and one of them was selected for survey. However, in such cases, it was first ascertained whether there was any compact area within the fsu where a good number (10 or more) of trading enterprises were clustered together (e.g. market, bus stand, etc.) If so, such areas were carved out first and hamlet-groups/sub-blocks were formed in the remaining part only. The area of concentration so carved out was selected for survey with certainty and one hamlet-group/sub-block was selected at random from those formed. (This was the first time in NSS that 2 hamlet-groups/sub-blocks were selected from a village/block.)

32
Selection of enterprises: Four second-stage strata were formed in each fsu as follows:
• OATE -wholesale1
• OATE - others • NDTE - wholesale
• NDTE - others
The enterprises belonging to a second-stage stratum were arranged by 3-digit NIC code and the required number of sample enterprises were selected circular systematically with a random start. Selection was done independently in the ‘area of concentration’ and the other hamlet-group/sub-block selected at random. The number of ssu’s to be selected from each second-stage stratum was as follows:
second- stage stratum
fsu’s where area of concentration was carved
out was carved out
fsu’s where
area of concentration
was not carved out area of
concentration other
h.g./s.block.
OATE - wholesale
2
1
2 OATE - others 2 2 2 NDTE - wholesale 5 1 5 NDTE – others
5 2 5
IV.3g Non-agricultural Enterprise Surveys: 45th and 46th rounds The next pair of enterprise surveys were carried out in NSS 45th (July 1989 - June 1990) and 46th (July 1990 - June 1991) rounds. The former covered manufacturing and the latter, trade. Though the design features were, basically, similar to those of the 40th and 41st rounds, some modifications had to be made due to the partial use of updated EC frame in the urban sector and some special demands for certain estimates made on the trade survey. In both these rounds the EC-80 frame was used for the rural sector wherever available.
For the urban sector the frame used for selection of fsu’s was the UFS frame, though with the following modification. In 64 Class I cities - which includes the ten largest cities with 1981 census population exceeding10 lakhs, a modified form of the Economic Census was conducted in 1986-87. The frame used for this
consisted of the UFS blocks. While counts of OAE’s, NDE’s and DE’s by industry type
1 Wholesale trade: NIC 70 group 600 to 649 Others: (i) retail trade (groups 650-689), (ii) commission agents, brokers, auctioneers etc. (groups 821,
822) and (iii) free collection for sale etc. (groups 027, 040, 052 to 069 & X10)
Sampling frames: 45th &
46th rounds

33
were available for some of the blocks (this was called the EC-4 frame), for other blocks only the total number of OAE’s, NDE's and DE’s were available with information as to the presence or absence of at least one enterprise of each sector - in particular, manufacturing and trade sectors (and this was called the EC-5 frame). As, in both these rounds, the CSO survey on DE’s was also conducted in the same sample fsu’s as the NSSO socio-economic surveys on NDE’s and OAE’s, the design steps took into account the DE’s also (as in the 41st round). Thus, in the rural sector, while the primary strata were districts (with some exceptions like Gujarat), sub-strata were formed exactly as in the 41st round: sub-stratum 1 consisting of villages having at least one DME/ DTE, sub-stratum 2 consisting of residual villages with at least one NDME/ NDTE, and sub-stratum 3 consisting of the remaining villages. The urban design in both rounds made use of the partially updated EC in the 64 towns where this updation had been carried out using UFS frames. In both 45th and 46th rounds, primary strata were formed within regions by grouping towns by population class as follows:
population class of town/city
type of frame used
updated EC UFS
below 50,000 - stratum 1 50,000 to less than 1 lakh - stratum 2 1 lakh to less than 5 lakhs stratum 3 stratum 4 5 lakhs to less than 10 lakhs stratum 5 stratum 6 10 lakhs and above (each city) stratum 7 -
Formation of sub-strata in the 45th and 46th rounds was also similar. (The difference is mainly in the industry sector) In the strata covered by updated EC, the sub-strata of 45th round were:
sub- stratum 1
EC-4 blocks with at least one DME
sub- stratum 2
EC-5 blocks with at least one DME
sub- stratum 3
all the remaining UFS blocks
In the 46th round, however, EC-5 blocks were not considered. Thus the sub-strata in these strata were:
sub- stratum 1
EC-4 blocks with at least one DTE
sub- remaining EC-4 blocks with

Non-agricultural Enterprise Surveys: 41st round 34
stratum 2 at least one NDTE sub- stratum 3
all the remaining UFS blocks of the stratum
This is exactly as in the rural sector. In the remaining strata, two sub-strata were formed in both rounds: sub-stratum 1 consisting of blocks falling in the “industrial area” in the 45th round, and the “bazaar area” in the 46th round. Allocation of fsu's - rural-urban: While allocation of the total sample of fsu’s to the rural and urban sectors was done in the 45th round in proportion to gross value added in the unorganized manufacturing sector in 1978-79, in the 46th round it was done in proportion to a weighted sum of number of enterprises of different kinds according to 1980 EC, viz., 4DTE + 2NDTE + OATE. In the rural sector, in both 45th and 46th rounds State allocation for rural and urban sectors was further allocated to strata in proportion to (DE + NDE). Within strata, after allotting a thin sample of 2 or 4 villages to sub-stratum 3, the rest were allocated to sub-strata 1 and
2 in the ratio 2: 1. In the urban sector also, the stratum sample sizes were made proportional to (DE + NDE) (of manufacturing/trade) in both the rounds (based on 1980 EC). Allocation to sub-strata was done, in the 64 cities where the EC was updated, in proportion to number of UFS blocks, with additional weightage to sub-strata 1 and 2. In the other strata, all the blocks in sub-stratum 1 (industrial area/
bazaar area) were selected for survey subject to a maximum of 50% of the stratum allocation, and the rest was allocated to sub-stratum 2. Sub-stratum allocations were always made a multiple of 2. The procedures of selection of blocks were very similar in the two rounds. In the 64 cities where the updated EC frame was used, sample blocks were selected systematically with pps, where size was number DME’s/ DTE’s in sub-stratum 1 and number of all non-agricultural enterprises (45th round)/ NDTE’s (46th round) in sub-stratum 2. In sub-stratum 3 as well as in the rest of the urban strata, sample blocks were selected circular systematically with equal probability. Sample blocks were always selected in the form of two independent sub-samples. The idea of compulsory selection of pockets of concentration of relevant type of enterprise in large villages/blocks requiring hamlet group/sub-block selection, introduced first in the 41st round, was further refined in these two rounds. In each such fsu, two hamlet-groups/ sub-blocks were selected for survey. The hamlet-group/sub-block having the largest concentration of relevant enterprises was always selected with certainty and, from the rest, one was selected at random. The average size of a hamlet-group/sub-block was reduced accordingly and their minimum number was set at 4. However, this necessitated treating the two selected hamlet-groups/ sub-blocks as two different units
Allocation to strata: 45th & 46th rounds

35
with separate listing and selection of enterprises. The estimator also differed between them. Selection of enterprises - 45th round: Two second-stage strata were formed, one consisting of all OAME’s and the other, of all NDME’s. The number of sample enterprises to be selected from each was prescribed as follows:
enterprise type
number of sample enterprises to be selected whole fsu compulsory
hamlet-group/sub-block
randomly selected hamlet-group/sub-
block OAME 4 2 2 NDME 10 8 2
The required number was selected after arranging the enterprises by broad industry division code (NIC 70) within each second-stage stratum. Selection of enterprises - 46th round: Due to special demands for data and due to the importance and the rare nature of wholesale trading enterprises, six second-stage strata had to be formed in this round. Their composition and prescribed sample sizes were as follows:
second-stage stratum
sample to be selected
whole fsu surveyed
compulsory hamlet-
group/sub-block
randomly selected hamlet-
group/sub-block
forestry, fishing etc. 1 1 1 trading in wood (including fuel wood)
1 1 1
others
OATE wholesale 2 2 1 OATE others 2 2 1 NDTE wholesale 5 3 1 NDTE others 5 3 1
In these as well as in other NSS rounds when the prescribed numbers were not available in any second-stage stratum, the sample sizes of some other suitable strata were increased. This improved their estimates while the investigator’s workload did not fall too much

Non-agricultural Enterprise Surveys: 41st round 36
IV.3h Non-agricultural Enterprise Surveys: 51st and 53rd rounds The next pair of enterprise surveys was conducted in the 51st (manufacturing) and 53rd (trade) rounds. The design features of these rounds were similar to those of the 45th and 46th rounds respectively. Only the important differences will be highlighted here. First of all, unlike in previous rounds, the survey of DME’s, in the 51st round, was the responsibility of NSS, and not of CSO. Next, the Central sample in this round was divided into two, called sample 1 and sample 2. There were significant differences in design between the two samples. While sample 1 of the Central sample and the whole of the State sample had their design similar to those of earlier rounds, there are some changes in the case of sample 2 of the Central sample. For example, while for sample 1 the urban frame consisted of 1990 Economic Census EB’s for Class I towns and UFS blocks for other towns, for sample 2, the urban frame was the UFS frame for all towns. In the rural sector, there was no sub-stratification for sample 2, while for sample 1 of the Central sample and the whole of the State sample there was the usual sub-stratification based on the presence of DME/ NDME/ OAME. While in the urban sector, strata were formed within regions in case of both sample 1 and sample 2 by grouping towns by population, the actual classes differed slightly between samples 1 and 2. Again, while there was sub-stratification in Class I towns where the EB frame was used for sample 1 and the State sample, there was none in sample 2, possibly because the frame was UFS for all towns. As regards the trade survey of the 53rd round, the Directory establishments were taken out of the coverage of NSS. As the Directory establishment surveys of CSO in the 45th and 46th rounds were also carried out in the same first-stage sample, the numbers of such units were also considered for stratification and selection. That was the case in the 51st round also, in which the DME’s formed part of NSS coverage. But in the 53rd round, only NDTE’s were considered for this purpose. The remaining aspects of the sampling designs were similar to those of earlier rounds.
37
IV.4 Land Holding and Debt & Investment Surveys It may be recalled that surveys on land holdings were undertaken in the 8th round and 16th-17th rounds of NSS to meet the requirements of the World Agricultural Census. The Reserve Bank of India had carried out two Rural Credit Surveys, one in 1950 and the other in 1960-61. An enquiry combining the two themes was first conducted as part of the programme of NSS 26th round (July 1971- Sept 1972) which was called “Land Holdings and Debt and Investment Survey”. The next survey on this subject was undertaken in the 37th round (January- December 1982) and the subsequent one in the 48th round (January - December 1992). Basically it was the survey design developed for the 26th round survey that was followed in the following two rounds also, with, of course, some modifications. The households in each sample village (in the rural sector) were divided into 4 second-stage strata called sub-strata. Sub-stratum 1 consisted of households having no operated land. The remaining households were arranged in order of their land operated (total land possessed) and divided into 3 sub-strata such that each sub-stratum had roughly the same total area operated. The boundary points were given for each region in the instruction booklet itself. The sample households (3 on an average from each sub-stratum) were selected linear systematically with a random start such that the design became self-weighting at region level. In sub-stratum 1 the households were arranged according to two dichotomous variables: (a) self-employed or not and (b) 1and owned less than 1 acre or 1 acre and above; and then a linear systematic sample was selected such that the design became self-weighting at State level. Three visits were made to each sample household in the 26th round. There were separate schedules for each visit for each sector. They were: 18.1(R), 18.2(R) and 18.3(R) for the rural sector and 18.1(U), 18.2(U) and 18.3(U) for the urban sector. The periods of the three visits were, roughly, July 1971 to mid-February 1972, mid-February 1972 to June 1972 and July 1972 to September 1972. An inventory of assets and liabilities as on June 30, 1971 was made during the first visit. This also included land owned, leased in and leased out as on June 30, 1971. General particulars of the operational holdings operated by the household during the major part of the agricultural year 1970-71 were also collected in the first visit. In the second visit, information was collected on production and sale of crops, receipts from farm and non-farm business, and transactions of assets and liabilities during July 1, 1971 to December 31, 1971. Corresponding information for the period January 1, 1972 to June 30, 1972 and inventory of physical assets as on June 30, 1972 were collected during the third visit. Thus inventories of physical assets were obtained at two time points one year apart. The survey designs of the 37th and 48th rounds will be reviewed below. IV.4a Land Holding and Debt & Investment Surveys: 37th round

Non-agricultural Enterprise Surveys: 41st round 38
Essentially similar data were collected in the 37th round also but by making only two visits to each sample household. This economy was achieved by starting the field work six months after the starting point (July 1, 1981) of the reference period, viz. July 1981 - June 1982. The survey period of the 37th round was January - December 1982. This made it feasible to collect, during the first visit of the 37th round, data corresponding to those collected in the first two visits of the 26th round taken together. Data on the two subjects of land holdings (including live-stock holdings) and debt & investment were collected in two separate schedules in the 37th round - Schedule 18.1 and Schedule 18.2 respectively. The same schedules were used for both the visits and in both rural and urban sectors. There was a major change in the 37th round as regards operational holdings. While information was collected separately on holdings which operated during the major part of the kharif (first visit) and rabi (second visit) seasons of the agricultural year 1981-82, there was, unlike the 26th round, no attempt made to have data on holdings which operated during the major part of the agricultural year 1981-82 as a whole. Stratification, allocation and selection of first-stage units: In the rural sector, the strata were the basic strata of the 28th round. In the urban sector, too, each district formed a stratum, except that each city with 1971 population above 1 million was separated out to form a separate stratum. Thus Ahmedabad, Bangalore and Kanpur were separated out to form separate strata while the remaining urban areas of their districts formed another stratum in each case. (Bombay, Calcutta, Delhi, Hyderabad and Madras were in any case whole districts.) A district with small urban population was merged with a neighbouring district of the same region. Because of the two-visit programme only about half the normal number of fsu’s could be surveyed in the 37th round (as in the 26th round). The all-India sample size was 4350 villages and 2896 blocks. There were only two sub-rounds, the first half of each visit's survey period designated as sub-round 1 and the second half, as sub-round 2. The State-level allocations were determined on the basis of investigator strength. The allocation of the sample to strata was proportional to the number of 1981 census EB’s (house-listing stage) in the rural sector and the number of UFS blocks in the urban sector. The 1981 census list of villages (prepared at the house-listing stage) was the frame for selection of sample villages (except in Assam where the 1971 census frame was used). Sample villages were selected by ppswr, size being the number of EB’s formed in the village. In the urban sector, the UFS frame was used except in the new towns of the 1981 census where the list of census EB’s was the frame used. Sample villages and blocks were selected in the form of two independent sub-samples. The usual procedure of hamlet-group/sub-block selection was followed in the 37th round also. Selection of households: In the rural sector, four second-stage strata, called sub-strata, were formed using area of land possessed as the stratification variable as in the 26th
round. Sub-stratum 1 consisted of households with less than 0.05 acres of land (including those with no land). Sub-strata 2, 3 and 4 were formed in increasing order of land

39
possessed such that the total area of each sub-stratum was the same. The boundary points were calculated for each sample village by the investigators themselves, using data collected while listing. From each
sub-stratum two households were selected circular systematically with a random start. In sub-stratum1, the households were arranged by their means of livelihood (agricultural labour/ artisan/ others) before sample selection, as done in the 26th round. In the urban sector the listed households were divided into 3 sub-strata by their monthly per capita expenditure. The boundary points were fixed at State level such that the aggregate values of total consumer expenditure of the sub-strata were roughly equal at State level. 2 households were selected circular systematically with a random start from each sub-stratum. Schedules 18.1 and 18.2 were canvassed in the same sample households. The processing of Schedule 18.2 was done entirely by RBI - both Central and State samples - a factor which helped in achieving complete pooling of these two samples. IV.4b Land Holding and Debt & Investment Surveys: 48th round The 48th round was carried out during January to December 1992. The survey design was very similar to that of the 37th round, with two visits to each sample household. The data collected during the first visit (January to August) broadly related to the kharif season of the agricultural year 1991-92 and those collected during the second visit (September to December), to the rabi season. In order to reduce informant fatigue as well as investigator fatigue, Schedules 18.1 and 18.2 were canvassed in independent samples of households in the rural sector. However, as information to be collected on land holdings was expected to be marginal in the urban sector, the two schedules were canvassed in the same sample households in the urban sector. By this time NSS had been extended to almost the whole of the Indian Union. The rural areas of Nagaland were being partly covered from the 44th round. In the rural sector the strata were still the basic strata formed first in the 28th round with modifications from time to time, such as the modification prior to the 38th round using the 1981 census population figures. In the urban sector, strata were formed within each region by grouping towns into the following population size classes: 1) less than 50,000, 2) 50,000 to less than 2 lakhs, 3) 2 lakhs to less than 10 lakhs and 4) 10 lakhs or more. Each city of the last class formed a separate stratum. As usual, the total all-India sample was allocated to the States/ UT’s in proportion to the investigator strength and the total State/UT sample was allocated to the rural and urban sectors proportionately to population with double weightage to the urban sector*. The * In general, in socio-economic (as opposed to enterprise) rounds the urban sample is fixed as nearly twice the rural sample proportionate to population. This is to ensure adequate sample size for the urban sector
Selection of households: 37th round

Non-agricultural Enterprise Surveys: 41st round 40
rural/urban sample for each State was allocated to the rural/urban strata of the State in proportion to rural/urban population. Sample villages were selected by pppwr and sample blocks by srswor in the form of two independent sub-samples. The practice of hamlet-group/sub-block selection in large villages and blocks was adopted in this round also. In the rural sector, the number of hamlet-groups to be formed was decided as follows:
approximate present population
no. of hamlet-groups to be
formed less than 1200 1 1200 - 1799 4 1800 - 2199 5 ...and so on…… ….
Out of these hamlet-groups two were selected systematically with a random start for survey. The listing of households was done in the two selected hamlet-groups in the same listing schedule and sampling of households was done from the combined list. (This procedure was first tried in the 47th round. In large villages it is usual to find households belonging to different castes/ religious groups/ tribes living in separate hamlets. The procedure described above was expected to help in making the selected segments more representative of the village population leading to a reduction in the within-village variation of the estimates.) In the urban sector the usual procedure was followed, with only one sub-block selected for survey. Selection of households - rural: Households listed in the village were divided into 4 second-stage strata according to the area of land possessed (these are called LHS sub-strata) as follows: Households possessing no land or less than 0.005 acres form sub-stratum 1, sub-strata 2, 3 and 4 are formed in increasing order of land possessed by obtaining two boundary points, say x and y, so that households with land 0.005 to x, x to y and above y formed, respectively, sub-strata 2,3 and 4. x and y were obtained by the investigators using the data on land possessed collected at the listing stage such that the total area of land possessed will be the same in each sub-stratum (as in the 37th round). The sample sizes for Schedule 18.1 for the LHS sub-strata 1 to 4 were 1, 3, 2 and 2 respectively. (Usually the sub-strata should get equal numbers of sample households but since sub-stratum 1 is not of much interest for Schedule 18.1, consisting as it does of households with no land, and since sub-stratum 2 contains a far larger number of households than sub-strata 3 and 4, the sample size of sub-stratum 1 is fixed as 1 (so that no part of the universe is omitted) and that of sub-stratum 2 is increased to 3).
which is small compared to the rural sector in terms of population but is much more heterogeneous.

41
For selection of households for Schedule18.2, seven AIDIS sub-strata were formed as follows:
LHS sub-stratum
Indebtedness status
AIDIS sub-stratum
1 Indebted 1 Not indebted 2
2 Indebted 3 Not indebted 4
3&4
Indebted to institutional agencies 5 Indebted but only to non-institutional agencies
6
Not indebted 7 The sample size was 1 for sub-strata 1, 2, 3, and 5 and 2 for sub-strata 4 and 7. Even though the survey lays special stress on indebted households, their proportion in the population is much less than half (as seen from 37th round results) and hence the above allocation. Selection of households - urban: Schedules 18.1 and 18.2 were canvassed in the same sample households in the urban sector. The households listed were divided into three monthly per capita consumer expenditure (MPCE) classes using the boundary points A and B specified at the State level such that MPCE classes 1, 2 and 3 (households with MPCE less than A, A to B and greater than B respectively) contained roughly 30%, 60% and 10% of the population. The ultimate sub-strata were as follows:
MPCE class Indebtedness status
AIDIS sub-stratum
1 Indebted 1 Not indebted 2
2
Indebted to institutional agencies 3 Indebted but only to non-institutional agencies
4
Not indebted 5 3 Indebted 6
Not indebted 7 One household was selected from each sub-stratum except sub-strata 4 and 7, from each of which 2 households were selected. Sample households were selected at random when second-stage sample size was 1 and circular systematically with a random start when sample size was more than 1. Of the two sample households selected for the annual survey on consumer expenditure, the one selected first was surveyed in visit 1 and the other in visit 2.

Non-agricultural Enterprise Surveys: 41st round 42
AD HOC SURVEYS Freeing some rounds for surveys on subjects of current topical importance was one of the most fruitful decisions of the NSSO Governing Council. This enabled NSSO to take up extremely useful surveys on topics on which little or no data existed. Some of these surveys are indeed of a pioneering nature. The designs of these ad hoc surveys will be covered in this section. The surveys considered in this section are the following:
sl. no.
round survey
1. 38th, 39th Population and vital rates 2. 30th Livestock including livestock enterprises 3. 31st (rural) Rural electrification and irrigation 4. 31st (urban) Condition of slum dwellers 5. 35th, 42nd,
52nd Social consumption including surveys on aged persons and ex-armed forces personnel
6. 44th, 49th Housing condition 7. 35th, 44th Construction 8. 36th, 47th Disabled persons 9. 44th Living conditions of tribal population 10. 47th Literacy and culture
Normally the survey period of a round in NSS is the agricultural year, July-June. However, the appropriate survey period for land holdings and debt and investment surveys was found to be the calendar year January-December. Hence it has become a practice to have a round of six months’ duration before and after a survey on the above subject. The survey topics of such rounds were chosen such that they were not overly affected by seasonal variations. IV.5 Population and Vital Rates Survey: 38th and 39th rounds This survey was planned partly as an enumeration-re-enumeration survey (Schedule 12.1) and partly as a one-time survey (Schedule 12). The main survey was carried out in a subset of the sample villages and blocks of sub-rounds 1 and 2 of the 38th round. Out of 4275 villages and 2278 blocks of the 38th round (sub-rounds 1 and 2), the sample for this enquiry consisted of 3684 villages and 1870 blocks. This reduction was done in order to tackle the increased workload within each fsu envisaged in the 39th round. In each stratum × sub-round × sub-sample, when the allocation of the 39th round was less than that of the 38th round, the extra fsu’s were deleted from the end, i.e., in descending order of sample village/block number (order of selection). In all other respects the sample design was the same as that of the 38th round. Schedule 12.1 (part I) was filled in by copying some information from Schedule 10 canvassed in the sample households of the 38th round. During the 39th round, Schedule 12.1 (part II) was canvassed in these same

43
sample households (re-enumeration). Schedule 12 was canvassed in all the remaining households listed during the 39th round (one-time survey). Apart from this main survey, the enumeration-re-enumeration survey was carried out in 192 sample villages and 96 urban blocks of the Sample Registration Scheme (SRS) of the Registrar-General (RG) of India. The sample fsu's were selected by the RG’s office out of the 1900 SRS units introduced in January 1982. (No SRS sample were selected in Haryana, Karnataka, Madhya Pradesh, Orissa, Punjab, Rajasthan and Uttar Pradesh, as new units were introduced in these States only in January 1983.) In the SRS sample, Schedule 12.1 (Part I) was filled in for all the households during January-March 1983 (38th round survey period). Sample villages and blocks were re-surveyed during the same months of 1984 (39th round), as far as possible in the same order, so that the time interval between survey and re-survey was about one year for all sample households. At the time of re-survey, some portion of Schedule 12.1 (Part I) and the whole of Schedule 12.1 (Part II) were filled in for all the households of the sample village/blocks. IV.6 Livestock Survey: 30th round A comprehensive survey on livestock number and consumption of livestock products and livestock enterprises was undertaken in NSS 30th round (July 1975-June 1976). The following schedules were canvassed in this survey apart from the rural and urban listing schedules:
Schedule 19 Livestock number and products Schedule 19.1 Horse, donkey, mule, camel and elephant Schedule 19.2 Cattle, buffalo, yak, mithun and poultry Schedule 19.3 Sheep, goat and pig Schedule 19.4 Consumption of livestock products Schedule 20 Household livestock enterprises Schedule 20.1 Non-household livestock enterprises Schedule 3.1 General information of the village Schedule 3.2 Particulars of migratory flocks of bovines,
pack animals and ovines Besides, there was a survey on railway travel for which Schedule 21 was canvassed. The strata, for rural as well as urban sampling, were the same as those of the 29th round. The all India sample consisted of 8632 villages and 9756 urban blocks (nearly twice the usual sample in the urban sector). These were allocated to the States considering their investigator strength and their rural/urban populations and, as usual, the State quotas were allocated to the strata in proportion to rural/urban populations. Sample villages were selected with pppwr and sample blocks with ppswr (where size was a measure of the block population) in the form of two independent sub-samples. The usual procedure of hamlet-group/sub-block selection in large villages/blocks was adopted in the 30th round also.
Non-agricultural Enterprise Surveys: 41st round 44
Selection of second-stage units Schedule 3.2: All the members of households found camped in a sample village/block (whole village/block) or in its periphery/vicinity during the investigator’s visit and possessing migratory flocks of bovines, pack animals and ovines were surveyed for Schedule 3.2. Schedules 19.1 to 19.4: All the listed households were arranged in one frame with households possessing any livestock or poultry on the date of survey coming first, followed by the other households. In each sample village, a sample of 24 households was selected circular systematically and in each sample block, a sample of 24 households on an average was selected linear systematically such that the design was self-weighting at State level. All the schedules 19.1 to 19.4 were canvassed in all the sample households. Schedule 20: This was meant to collect information on the following enterprises: (i) dairy (ii) poultry (iii) sheep and goat rearing (iv) piggery (v) cattle and buffalo breeding (vi) butchering and sale of meat (vii) processing of wool (clearing and spinning) (viii) flaying, curing and skinning of animals and (ix) collection of goat hair, bones, hoofs and horns. Schedule 20 was canvassed in all the listed households which were usually engaged in the above-mentioned enterprises except those registered under Sections 2m(i) and 2m(ii) of the Factories Act. In the case of enterprise types (i) to (v), households having very small-scale establishments were excluded. Schedule 20.1: This schedule was filled in for all non-household non-registered establishments in one or more of the three enterprise types (i), (ii) and (iv). Schedule 21: A sample of 2 households was selected by srswor from among all the listed households having members who had undertaken any railway journey during the last 90 days. Though the design of the 30th round was not self-weighting for the Schedule 19 series in the rural sector, a partially self-weighting procedure was used at the tabulation stage. A common multiplier Mr for the rth region was obtained as Hr / hr where Hr was the unbiased estimate of number of households obtained from the listing schedule and hr was the number of sample households selected for survey in the rth region (excluding casualty households). Although a slightly biased procedure, it facilitated tabulation work. Moreover, the bias was expected to be small, since sample allocations were proportional to population. IV.7 Social Consumption and Related Topics In order to collect data on the nature and quantum of benefits received by the people out of public expenditure on various services such as public distribution of essential commodities, education and medical services, surveys were conducted in the 35th round

45
(July 1980-June 1981), 42nd round (July 1986-June 1987) and 52nd round (July 1995-June 1996). The sampling designs of these surveys are described below. Schedules of enquiry The subjects studied in these rounds can be classified as follows: (a) public distribution system (b) education and related topics (c) public health services including family planning services (d) medical services Further, in the 42nd round there were two additional enquiries, one on aged persons and the other on ex-armed forces personnel. The schedules of enquiry and the target population for each subject in the 35th round were as follows:
35th round: details of schedules
schedule no.
description target population: households with members in given category
25.0 Availability and utilisation of public health and public distribution services
all households
25.1 Maternity and child care age-group 0 – 4 25.2 Participation in primary education and
drop-outs for children aged 5 - 14 age-group
age-group 5 – 14
25.3 Education and activity particulars of youths of 15 - 24 age-group
age-group 15 – 24
25.4 Participation in post-primary and higher education
enrolled in post-primary classes/ college/technical school
25.5 Education particulars of non-resident members (students)
students living outside
25.6 Activity particulars of educated persons passed class X 25.7 Utilisation of medical services for
illness/injury hospitalised during preceding 365 days/ received medical treatment during preceding 30 days/ had illness/injury during preceding 30 days but had no treatment
25.8 Utilisation of family planning facilities eligible couple
There was some rationalisation and streamlining of the schedules in the 42nd round, besides the introduction of two new schedules, one on aged persons and another on ex-armed forces personnel. The schedules and their respective target populations in the 42nd round were:

Non-agricultural Enterprise Surveys: 41st round 46
42nd round: details of schedules
schedule no.
description target population: households with members in given category
25.1 Maternity, child care, family planning and utilisation of public distribution system
all households
25.2 Participation in education all households 25.7 Utilisation of medical services hospitalised during preceding 365
days or suffered illness or injury during preceding 30 days
27 Survey on persons aged 60 and above aged 60 and above 28 Survey on ex-armed forces personnel ex-armed forces personnel 1.0 Consumer expenditure all households
It may be recalled that annual surveys on consumer expenditure were resumed in the 42nd round. In the 52nd round only two schedules were canvassed: Schedule 25.0: Survey on health care Schedule 25.2: Participation in education For both these schedules the target population was "all households". Stratification, allocation and selection of fsu’s: The rural strata in the 35th round were the basic strata of the 28th round. In the 42nd round also the rural strata were basically the same but with the modifications introduced in the 38th round. The rural strata of the 52nd round were exactly the same with modifications made on the basis of 1991 census population (districts having 2 lakhs or more population were divided into two or more strata). The urban strata in the 35th round were more or less the same as in the 32nd round - urban areas of basic strata (with basic strata having small urban population being pooled with some neighbouring strata). This boiled down to the urban strata being districts or groups of districts generally. However, each city with population ten lakhs or more constituted an independent stratum. This practice became the norm in the subsequent rounds (except enterprise survey rounds). In the 42nd as well as in the 52nd round the urban strata were formed within regions by grouping towns by population into the following classes (same as the 38th round): (1) less than 50,000 (2) 50,000 to less than 2 lakhs (3) 2 lakhs to less than 10 lakhs and (4) 10 lakhs and above. Each city of the last class formed a stratum. Allocation of fsu’s was done in the usual manner. However, in the 42nd round, 27 districts - spread over 10 States - where some concentration of ex-armed forces personnel had been reported were given additional allocation in the rural sector to the extent of 4 villages per stratum. In the 35th and 42nd rounds sample villages were selected by pppwr, whereas sample blocks were selected by srswor. In the 52nd round, however, both villages and urban blocks were selected circular systematically with equal probability. There were 2 sub-samples and 4 sub-rounds as usual.

47
Selection of sample households: In the 35th round 4 sample households were allotted for each schedule, except Schedule 25.5 for which only 2 households were allotted. Selection was done from separate frames for each schedule consisting of only the households belonging to the appropriate target population. In the case of Schedule 25.7, the eligible households were divided into 3 second-stage strata called sub-strata as follows:
Sub-stratum 1 households with any member hospitalised during preceding 365 days.
Sub-stratum 2 Out of the rest, households with any member who had been treated for illness/injury during preceding 30 days.
Sub-stratum 3 Out of the rest, households, with any member who suffered illness/injury during preceding 30 days but received no treatment.
The sample sizes allotted to these three sub-strata were 2, 1 and 1 respectively. In the 42nd round, 4 households each were allotted for Schedules 25.1 and 25.7. 6 households were allotted to Schedule 25.2. Schedules 27 and 28 were allotted 3 and 5 households respectively. The sample households were selected from individual frames consisting of the households belonging to the target population of each schedule. There were 2 sub-strata each for Schedules 25.2 and 25.7. Sub-stratum 1 of Schedule 25.2 consisted of households with any member currently enrolled at post-primary level and Sub-stratum 2, of all the other listed households, each sub-stratum being allotted 3 sample households. For Schedule 25.7 there were, in the 42nd round, only 2 sub-strata: Sub-stratum 1 was the same as in the 35th round and Sub-stratum 2 of the 42nd round comprised Sub-strata 2 and 3 of the 35th round, pooled. 2 households were selected from each sub-stratum for Schedule 25.7. In both the rounds, sample households were selected circular systematically with a random start. The sub-strata and allocation of sample households for schedules 25.0 and 25.2 of 52nd round were as follows:
schedule no.
subject second-stage
stratum
description number of sample
hhs 25.0 survey on
health care 1 households reporting at
least one child aged ‘0’year 2
2 of the rest, those reporting hospitalization during last 365 days
2
3 remaining households 6 25.2 participation in
education 1 households reporting at
least 1 member aged 5-24 enrolled at post-primary level
3
2 all remaining households 3

Non-agricultural Enterprise Surveys: 41st round 48
IV.8 Survey on Irrigation & Electrification (Rural): 31stround In the 31st round, a survey on irrigation and electrification was undertaken in the rural sector, and in the urban sector an enquiry on the economic condition of slum dwellers was carried out in towns with population 1,00,000 or above. The two surveys were entirely unconnected. Survey design: survey on irrigation and rural electrification There was a “general sample” of 8448 villages for the enquiry on irrigation and rural electrification. Besides, the irrigation survey was conducted in a "special sample" of 2054 villages selected from the command areas of ‘major’ projects∗ commissioned after 1947 (1326 villages) and ‘medium’ projects commissioned after 1964 (728 villages). Total sample size (Central sample) was 10,502 villages. In addition to these, a sample of 263 Community Development Blocks was selected for collecting some general particulars on minor irrigation schemes of the Government commissioned after 1947. For the general sample, the strata were the same as those of the 30th round. The sample villages allocated to each State/U.T. were first allocated to the regions in proportion to gross irrigated area in 1970-71, and then the region allocations were further allocated to strata in proportion to population. The sample villages were selected by pppwr in the form of two independent sub-samples. For the special sample, all the villages (within a State) served by each major irrigation project constituted a stratum. The total number of major irrigation strata was 57. Further, all the villages under the command/ culturable areas of all medium projects within a State together formed one stratum. The number of special sample villages to be selected from each stratum was determined on a joint consideration of the area covered by the project, and the workload in the rural general sample villages and the urban areas of the region. Sample villages were selected circular systematically with ppp in the form of two independent sub-samples. In the case of medium project strata, villages were first arranged by region and district before selection using the same procedure. A number of schedules were drawn up for collecting relevant information. They were as follows:
schedule type
schedule no.
description
Listing schedule
0.1 List of households
Village schedule
3.1 General information on irrigation 3.2 General information on electrification
∗ cost above 5 crores – major cost above 25 lakhs to 5 crores – medium cost upto 25 lakhs - minor

49
3.3 General information on diversion scheme in the sample village run by co-operative or joint arrangement or Government
3.4 General information on lift irrigation scheme using power in the sample village run by co-operative or joint arrangement or Government
Household schedule
22.1 Particulars of irrigation in household holding 22.2 Particulars of unirrigated household holding 23.1 Use of electricity for domestic purpose 23.2 Use of power (i.e. electricity or diesel) for
industrial/commercial purposes Project schedule
24.1 General information on major/medium and Government-owned minor flow irrigation project
24.2 General information on State tube-well project 24.3 General information on government-owned or
administered minor irrigation schemes commissioned after 1947 in Community Development Block
Selection of households for household schedules: The households listed were arranged by their “type of cultivation” in the following order (with reference to agricultural year 1975-76): no cultivation 1 cultivated without irrigation gross area sown: less than x* acres 2 x acres or more 3 cultivated with irrigation gross area sown: less than x acres 4 x acres or more 5 Thereafter a fixed number (h) of sample households was selected circular systematically for canvassing schedules 22.1, 22.2 and 23.1. The value of x varied from State to State and the value of h, from region to region. The value of x was determined for each State such that about 60% of the cultivator households had land operated less than x acres. The value of h was determined for each region as follows: The total number of sample households that could be surveyed in a State was decided first considering the State workload. This was allocated to regions in proportion to population. Next h was obtained by dividing this number by the number of sample villages allocated to the region (general sample). The value of h varied around 30 for the general sample. In the case of the special sample h was fixed as 16. The reason was that even with a smaller sample, a sufficient number of households using irrigation would be included in the sample in these villages. Schedule 23.2 was canvassed in all households using power for industrial/commercial purposes. All schedules were canvassed in both general and special sample villages. Project Schedule 24.1 was canvassed in all the projects under coverage. Besides, it was also canvassed in those sample villages of the general sample which had benefited by any Government-owned minor flow irrigation project. Schedule 24.3 was canvassed in the selected Community Development Blocks.
*For the meaning of x, see the next paragraph.

Non-agricultural Enterprise Surveys: 41st round 50
Estimates were prepared separately for the general and special samples. No pooling was done. The estimation procedures for the household schedules were made self-weighting at region (general sample)/ project (major project)/ State (medium project) levels with the common multiplier as H/h, where H was the estimated number of households obtained from the listing schedule and h, the number of sample households surveyed. Due to the method of allocation of sample households adopted for this survey, this multiplier could differ only slightly from the design-based multiplier yielding unbiased estimates of totals. IV.9 Survey of Slum Dwellers (Urban): 31st round The survey was carried out in all Class I towns (as per 1971 census). In cities with population ten lakhs or more, only the declared slums were covered but in other towns slums declared as such by the civic authorities as well as other slums identified by the investigators were covered. Schedule 0.21: Particulars of Slums was canvassed in each slum, declared or not, of all the Class I towns other than cities with population ten lakhs or more. A slum was defined as “an areal unit having 25 or more katcha structures mostly of temporary nature, huddled together, with practically no private latrine and inadequate public latrine and water facilities”. For conducting the household survey a sample of slums was selected from each town circular systematically with pps, where size was a measure of population. In case a sample slum was found to have adequate water and sanitation, it was substituted. A circular systematic sample of 14 households was selected from each sample slum for canvassing Schedule 16.3: Economic Condition of Slum Dwellers. There were 1321 declared slums in 140 Class I towns with population less than ten lakhs and 5626 declared slums in the 8 big cities (population ten lakhs or more). The number of sample slums was 1922 in the Central sample and 2486 in the State sample. The estimation procedure for the household schedule 16.3 was made self-weighting at town level with the common multiplier given by H/h, where H was the total number of slum households in the town as estimated from the listing schedule 0.2 and h, the number of sample households. It may be recalled that similar procedures were used in the irrigation survey in the rural sector of this round, as well as in the 30th round livestock survey. IV.10 Construction Surveys Attempts to collect data on construction in NSS were mostly confined, in the earlier rounds, to taking counts of building constructions through the listing schedule. Details of expenditure on construction (materials, services and labour) were, however, collected as part of capital formation in the 15th (1959-60) and 17th (1961-62) rounds in the rural and urban sectors respectively. The first full-fledged survey on building construction was the survey on Investment and Financing of Building Construction (1971-73) carried out in the urban areas outside the framework of the usual socio-economic survey rounds of NSS. The rural counterpart of this survey was incorporated into the programme of NSS

51
27th round (1972-73). The next survey on construction was undertaken by NSS in the 35th round (1980-81) which consisted of two schemes. Scheme A was carried out in the regular sample villages and blocks of the 35th round and this covered both building and non-building constructions. Scheme B, on the other hand, was a pilot survey carried out only in the urban sector to explore the merits of the municipal sanction lists as a sampling frame for building construction surveys in the urban areas, and had an altogether different sampling design based on the building sanction lists of the civic bodies. The next survey on construction was carried out in the 44th round (1988-89), covering only buildings and this was the last in the series so far. The designs of the above surveys starting from the 1971-73 survey are discussed below. IV.10a Survey on Investment and Financing of Building Construction
in Urban Areas, 1971-73 The survey, which was confined to the urban sector, had a three-stage design with towns, blocks within towns and households as the sampling units in the first, second and third stages respectively. The field work was carried out in two stages: a preliminary enquiry followed by the detailed enquiry. In the first stage the latest boundaries of each sample town were ascertained and blocks demarcated in newly added areas (after 1961). Wards with high intensity of construction were identified with the help of municipal records. After arranging the wards in decreasing order of number of constructions carried out during the preceding 3-4 years, the top wards accounting for 30% of all constructions were identified as wards with high construction intensity. After going round these wards and also the newly added areas, the blocks were given a density code: high-1, medium-2, low-3. This information was used for selection of sample blocks. Within each sample town, blocks with density codes 1 and 2 formed stratum 1 and the rest, stratum 2. In each State, towns were grouped into 4 strata by 1971 census population as follows: (i) 1 lakh or more (ii) 50,000-99,999, (iii) 20,000-49,999 and (iv) below 20,000. All towns of stratum (i), one-half of the towns of stratum (ii), one-fourth of the towns of stratum (iii) and one-tenth of the towns of stratum (iv) were selected systematically after arranging the towns in decreasing order of population, in the form of two sub-samples. The number of sample blocks selected from each sample town was respectively 8, 6, 4 and 2 from towns of strata (i), (ii), (iii) and (iv). (Larger numbers of blocks were, however, selected from the four metro cities.) This was divided equally between strata 1 and 2 within each town. The sample blocks were selected randomly. All households which had done some construction of pucca or semi-pucca houses during the preceding 365 days constituted the frame. They were divided into 3 strata according to the type of construction undertaken by them: (1) pucca houses: new building, (2) pucca houses: additions, alterations and improvements, and (3) all semi-pucca constructions. 2, 1 and 1 sample households were selected from strata (1), (2) and (3) respectively, with equal probability. Households of stratum (1) were arranged into two classes, considering their total expenditure to date, before systematic selection of the two

Non-agricultural Enterprise Surveys: 41st round 52
sample households. Schedule C - Investment and Financing of Building Construction - was canvassed in the sample households. IV.10b Construction Surveys: 27th round (rural sector only) Briefly speaking, the design was stratified unistage as far as the construction survey was concerned. The sample villages were selected circular systematically in two sub-samples. Schedule 1.4 - Current Building Activity - was canvassed in all those households which had completed the construction of any pucca, semi-pucca or katcha house in any part of India during the preceding 365 days. In addition, a village schedule, schedule 1.4(S): Current Building Activity (Supplementary) was filled in where some information was collected from every household which had any incomplete new building under construction. It may be mentioned that the processing of the data collected in this survey as well as the urban survey described earlier was carried out by the National Building Organisation (NBO). IV.10c Construction Surveys: 35th round Scheme A The details of the sample design of the 35th round up to the selection of sample villages and blocks have been already discussed. The construction enquiry was carried out in sub-sample 1 of the rural sample and the whole of the urban sample. The construction enquiry in this round covered pucca and semi-pucca building constructions and all non-building constructions carried out both by households and by
some non-household bodies excepting those by the public sector and the private corporate sector. Minor construction works with expenditure less than Rs.100 were not considered. By construction was meant construction of a new building, addition, alteration and improvement to an existing building or non-building construction works such as wells, tube wells, roads, bridges etc. The sampling
unit was a “construction work” identified at its site. In the case of building the term refers to the whole house or building irrespective of the number of households occupying it. However if different portions of the building were owned by different owners at the time the construction work was undertaken, the part owned by each owner was treated as a separate construction work. As regards non-building construction, each item of construction was taken as a sampling unit. The construction works coming under the coverage of the survey were divided into two sub-strata: (i) building and (ii) non-building. A sample of 4 constructions was selected for survey from sub-stratum 1, circular systematically with a random start. The constructions in sub-stratum 2 were completely enumerated. Schedule 1.4 - Particulars of Construction - was canvassed in the sample constructions.
Constructions as
sampling units

53
Scheme B This was carried out in a sample of towns independent of the main survey of the 35th round. As the survey was a pilot study to examine the usefulness of municipal sanctions as a sampling frame, the design was not oriented towards estimation of universe values. A stratified two-stage design was adopted, where the first-stage units were towns and the second-stage units were “sanctions” given by civic administration for construction of buildings. The towns within each State/U.T. were divided into 4 strata by 1971 census population as follows: (1) 1 lakh and above (Class I), (2) 50,000 to less than 1 lakh (Class II) (3) 20,000 to less than 50,000 (Class III) and (4) less than 20,000 (Classes IV- VI). All Class I towns, 50% of towns of stratum 2, 25% of towns of stratum 3 and 10% of towns of stratum 4 were selected for survey. In strata (2) to (4), towns were selected circular systematically after arranging them in decreasing order of population. In each sample town, all sanctions issued in each of the following calendar months formed the frame for selection of sanctions: 6th, 12th, 28th and 44th month preceding the month of listing. The object was to study the distribution of duration of construction activity from sanction to completion. The list for each month constituted a separate stratum. The eligible sanctions out of these were divided into two second-stage strata or sub-strata: (1) sanctions given to households and non-household bodies other than housing co-operatives; (2) those given to housing co-operatives only. All sanctions of sub-stratum (2) were included in the sample. A sample of sanctions (sample size as given below) was selected from sub-stratum (1) circular systematically with a random start:
town class 1 million and above
other Class I and Class II
Classes III - VI
sample size (for each month-stratum) 25 15 10 As all Class I towns were included in the sample for both Central and State samples, the months covered in the State sample for Class I towns were changed to the 12th, 36th and 52nd month preceding the month of listing. Schedule 1.4 (same as that of Scheme A) was canvassed in the sample sanctions. IV.10d Construction Surveys: 44th round Survey on Building Construction The main topics of the 44th round (July 1988-June 1989) were living conditions of the tribal (Scheduled Tribes) population, current building construction activity, housing condition, and consumer expenditure. The sampling design was oriented towards the tribal enquiry in the rural sector and towards the construction survey in the urban sector.

Non-agricultural Enterprise Surveys: 41st round 54
Stratification: rural In States/U.T.’s with hardly any significant tribal population (Haryana, Jammu & Kashmir, Punjab, Chandigarh, Delhi, Goa, Daman & Diu and Pondicherry) as well as in States/U.T.’s where there existed a uniformly high percentage of tribal population (Meghalaya, Mizoram., Nagaland, Arunachal Pradesh, Sikkim, Dadra & Nagar Haveli and Lakshadweep) the strata of the 43rd round were retained. In the remaining States new strata were formed. Areas with concentration of tribals were demarcated as separate strata called “stratum type 1”. First of all, the districts in which type-1 strata were to be formed were identified. They were those which together accounted for the bulk of the State’s tribal population. Besides these districts, strata of type 1 were also formed in some other districts with relatively small tribal population in order to ensure coverage of as many ethnic groups as possible. Now within each district so identified, the tehsils (or equivalent units) with relatively high proportion of tribal population were selected such that they together accounted for 70% or more of the district’s tribal population. These tehsils together formed the type-1 stratum in that district and the remaining tehsils formed another stratum, a stratum of type 2. The tehsils in a stratum were not always contiguous. Some districts wholly formed a type 1 stratum. Now, all strata of States with tribal concentration were also called type-1 strata and similarly all strata of the States/U.T.’s with no tribal population were classified as type 2. Stratification: urban Towns within a region were divided into four population size classes on the basis of 1981 census population: (i) less than 50,000, (ii) 50,000 to less than 2 lakhs, (iii) 2 lakhs to less than 10 lakhs and (iv) 10 lakhs and above. Towns belonging to classes (i) and (ii) were divided into two groups: (A) towns with significant Scheduled tribe population and (B) others. The UFS blocks of towns of classes (iii) and (iv) were divided into two types: (c) those falling in areas with relatively high level of construction activity and (d) others. The urban strata were formed, within each region, by grouping the smaller towns and by grouping UFS blocks of the larger towns as shown in the table below: population class of town
ST population
of town significant
UFS blocks with level of construction
activity
Stratum no.
(within region)
less than 50,000 Yes - 1 less than 50,000 No - 2 50,000 to less than 2 lakhs Yes - 3 50,000 to less than 2 lakhs No - 4 2 lakhs to less than 10 lakhs - Relatively high 5 2 lakhs to less than 10 lakhs - Others 610 lakhs and above - Relatively high 7 10 lakhs and above - Others 8
Some strata could be empty in some regions.

55
General and special sample villages The tribal enquiry, as well as all the other enquiries, was carried out in a set of common sample villages, called the “general sample”. In order to augment the sample size for the tribal survey, “special samples” of villages were selected in the type-1 strata of the States where such strata were formed. (That is, this was not done in the States with no ST population, nor in those with high proportion of ST population.) Only the schedules of the tribal enquiry were canvassed in the special sample. Allocation of sample villages and blocks The State allocations of general and special sample villages and sample blocks were decided on the basis of investigator strength, rural-urban distribution of population and the size of the tribal population of each State. The general sample villages were allocated to strata (within each State) in proportion to total rural population and the special villages, in proportion to tribal population. The urban sample was allocated to the strata proportionate to population with double weightage to strata 1, 3, 5 and 7. Selection of sample villages and blocks The sample villages were selected circular systematically with probability proportional to total population, and the sample blocks, circular systematically with equal probability, both in the form of two independent sub-samples. In view of the importance attached to the tribal enquiry in this round, NSS was extended for the first time to the rural areas of Nagaland. However, sample villages in Nagaland were selected purposively to include the 164 villages connected by bus routes and 76 villages were selected at random from the 186 villages lying within 5 km of any bus route. Selection of constructions The construction survey was conducted only in the general sample villages and the sample blocks. (Only the tribal enquiry was conducted in the special sample villages.) The usual procedure of hamlet-group/sub-block selection in large villages/blocks was resorted to in the 44th round as well. The definitions of a construction work and the sampling and survey unit in the second stage were the same as in the 35th round scheme A (for building construction). Non-building constructions were not covered in the 44th round. Similarly, constructions by public sector and private corporate sector were not covered, nor were constructions with expenditure during the preceding 365 days less than Rs. 250 in the rural sector and Rs. 500 in the urban sector. Katcha buildings were covered in this round (they were not covered in the 35th round).

Non-agricultural Enterprise Surveys: 41st round 56
The constructions on which some expenditure had been incurred during the preceding 365 days were divided into 3 sub-strata as follows:
Type of construction
sub-stratum
no.
New buildings (pucca and semi-pucca) 1
Additions, alterations and improvements (pucca and semi-pucca)
2
All katcha buildings 3
The units of sub-stratum 1 were arranged by ‘completed’ and ‘under construction’. 4 sample constructions were selected circular systematically with probability proportional to size (size being approximate expenditure during the last year rounded to 1000) from sub-stratum 1. From sub-strata 2 and 3, sample constructions were selected with equal probability. The sample sizes were, respectively, 1 and 2 in the rural sector and 2 and 1 in the urban sector, as the number of katcha constructions was expected to be relatively large in the rural sector. IV.11 Survey of Housing Condition, 44th round A brief reference may be made to the survey on housing condition undertaken in the 44th
round. A combined sample of 8 households was selected circular systematically from the arranged frame of all the listed households (ST and non-ST) and then sample household numbers 1 and 5 were assigned to Schedule 1.0 (the annual consumer expenditure survey started from the 42nd round) and Schedule 1.2 - Housing Condition - was canvassed in the remaining six households. IV.12 Surveys of Tribal Population The 44th Round Survey on the Living Conditions of the Tribal Population A very ambitious, though exploratory, survey on the living conditions of the tribal population of the country was undertaken in the 44th round (July 1988 - June 1989). The term tribal population covered the members of all the tribes listed under Article 342 of the Indian Constitution specifically by State. (A person belonging to a particular tribe but residing in a State where it is not listed under Article 342 as a Scheduled Tribe was not considered as “tribal” for this survey.) Four schedules were canvassed for this survey. They were as follows:
schedule description

57
3.1 General information on village characteristics. 29.1 Level of living of tribals 29.2 Economic activity and enterprise accounts of
tribals 29.3 Particulars of migration and ownership of land by
non-tribals in tribal areas. The sample design of the 44th round described in the context of the construction survey carried out in the same round will apply to the tribal survey as well up to the selection of the first-stage units. Now, Schedules 29.1 and 29.2 were canvassed in all sample villages - general as well as special samples and blocks. Schedules 3.1 and 29.3 were, however, canvassed only in the sample villages of stratum type 1 (both general and special). That is, they were not canvassed in the sample villages of the type-2 strata and in the urban sector. Hamlet-group selection in special villages: In the general sample villages and sample blocks the usual method of hamlet-group/sub-block selection was followed. However in the special sample villages of mixed population, where the tribals lived in separate clusters, a minimum of 3 hamlet-groups were formed (whenever hamlet-group selection was to be done) and then the one containing maximum tribal population was purposively selected for survey and one of the remaining hamlet-groups was selected at random for survey. These purposively selected hamlet-groups were called “area type 1” to distinguish them from the rest at the time of estimation. All the remaining areas were designated as “area type 2”. Selection of households: The number of sample households for each household schedule to be selected from each sample village/block was as follows:
schedule
rural
urban general sample
special sample
stratum type
without area type
area type
1 2 1 2 29.1 6 2 6 4 2 2 29.2 6 2 6 4 2 2 29.3 4 - 4 2 2 -
In the rural sector each household was classified, at the time of listing, (i) as ST or non-ST and (ii) as having one of the following means of livelihood (1) permanent cultivation, (2) shifting cultivation, (3) wage-paid manual labour and (4) others. Then all the listed households were arranged according to these two characteristics, with the former as the major classification. A combined circular systematic sample of the required number of households was selected from the ST households for Schedules 29.1 and 29.2, and then the households with odd order of selection were assigned to Schedule 29.1 and the rest to

Non-agricultural Enterprise Surveys: 41st round 58
Schedule 29.2. The required number of sample households for Schedule 29.3 was selected from the non-ST households circular systematically. In the urban sector, instead of means of livelihood, three levels of household monthly per capita consumption expenditure were used for arrangement. The classes were obtained for each State such that they included the lowest 30%, next 60% and the highest 10% of the State’s urban population. The procedure of selection of the required number of sample households was the same as in the rural sector. All the features of the design were planned in order to net a sufficient number of ST households in the sample representing as many different ethnic groups as possible. These attempts have apparently achieved their objective, as seen from the achieved sample sizes of Schedules 29.1 and 29.2. IV.13 Enquiries on Disability Though almost all the ad hoc surveys undertaken by NSSO served to fill long-felt and serious gaps in the available data bases, the surveys on disability seem to have attracted particular attention of the medical profession, public health workers and others associated with this field. Data on the number of physically handicapped persons had been mainly connected by NSS through the listing schedules of some of the earlier rounds. Disability was the subject of part of Schedule 12, canvassed in the 28th round (October 1973 - June 1974), whose design has been described earlier. But the first detailed survey on disability was undertaken in the 36th round (July-December 1981), during the six-month period intervening between the 35th and the 37th rounds. The next survey on this topic was carried out in the 47th round (July-December 1991) along with a survey on literacy and culture. Sampling design of the 36th round The design was, as usual, stratified two-stage with villages/urban blocks as first-stage units and households as second-stage units. Each district was a stratum in both rural and urban sectors. (In Gujarat a part of a district falling in a region formed a stratum.) In the urban sector districts with small urban population were merged with neighbouring districts of the same region to form strata. Allocation of sample fsu’s to States was proportionate to field strength and within each State, allocation to strata was in proportion to population, with double weightage to the urban strata. The final allocations were made multiples of 4 to have equal-sized samples for 2 sub-samples × 2 sub-rounds. Sample villages were selected by ppswr, where size was number of census enumerator’s blocks (houselisting stage), and sample blocks were selected by srswor, both in the form of two independent sub-samples. The procedure of hamlet-group/sub-block selection was followed in this round as well.

59
In each sample village/block, households were divided into two sub-strata: sub-stratum 1 consisting of households having any member suffering from any of the following disabilities (i) visual (ii) communication (among members aged 5 and above only) and (iii) locomotor and sub-stratum 2 consisting of the remaining households. All the households of sub-stratum 1 were surveyed. From sub-stratum 2 a linear systematic sample was selected with interval 12 in the rural sector and 14 in the urban sector. The same schedule - Schedule 26: Survey on Disabled Persons - was canvassed in all the sample households. Schedule 26 had two parts. Part I, which covered questions on physical disability, was relevant only for households having any disabled member. 47th round survey on disability and literacy and culture Whereas the 36th round was wholly devoted to the disability enquiry, three subjects were covered in the 47th round: disability, literacy and culture. Data on disability were collected in Schedule 26 while those on literacy and culture were collected in Schedule 30. Besides, data on the developmental milestones of children aged 5-14 were collected in Schedule 26.1. There was also a village schedule, Schedule 3.1, to collect information on the availability of facilities relevant to the above subjects to the residents of the sample village. The strata in the rural and urban sectors were the same as those of the 42nd round. The allocation of sample villages and blocks was also made in a similar way. The sample villages were selected circular systematically with ppp and sample blocks with equal probability-- both in the form of two independent sub-samples. There were only two sub-rounds, as in the case of the 36th round (both being six-month rounds). Hamlet-group selection: So far, while in rounds dealing with enterprise enquiries there was provision for selecting two hamlet-groups/sub-blocks, only one had been selected for survey in purely socio-economic rounds. In the 47th round a departure was made from this practice. In villages where hamlet-group selection was to be done, at least 4 hamlet-groups were formed (whose population content was only about half of the hamlet-groups of previous SE rounds) and two of them were selected circular systematically for survey. This was to ensure some heterogeneity in the selected hamlet-groups with better representation of the different sections of the village population, which hopefully would tend to reduce the between-hamlet-group variation and thus increase the design efficiency in such cases. The households listed in the two selected hamlet-groups were, however, pooled together before sample selection. This procedure was to become the general practice in the subsequent rounds of NSS. In the urban sector, though, only one sub-block was selected as before. The sample households for Schedule 26 were selected from households having any disabled member and those for Schedule 30, from all listed households. Now, Schedule 26.1 was canvassed in all the sample households of Schedule 26 and those of Schedule 30 having even order of selection. (A literacy test was to be conducted on a certain class of members in the sample households for Schedule 30 with odd order of selection.) Normally all the households with any disabled member were surveyed for Schedule 26.

Non-agricultural Enterprise Surveys: 41st round 60
The sample size for Schedule 30 was 18 minus the sample size of Schedule 26. But if the number of households in the frame for Schedule 26 exceeded 10, it was seen that the sample size of Schedule 26 and 30 together did not exceed 18 and that the sample size of Schedule 30 was always even and at least 4. The sample size of schedule 30 would never be greater than 8, however. Having thus decided the sample sizes for Schedules 26 and 30, the sample households were selected circular systematically with a random start. The estimation procedures for Schedules 26 and 30 were straightforward using the usual unbiased estimators of totals. For Schedule 26.1, whose sample consisted of all the sample households of Schedule 26 (all belonging to the class of households with any disabled member - the “disability stratum”) and one-half of the sample of Schedule 30 (of which some would belong to the disability stratum and the rest to the “non-disability stratum”), a post-stratified estimation procedure was used. That is, if H1 and H2 denoted the total number of households listed in the disability stratum and the non-disability stratum respectively, and h1 and h2 the corresponding numbers of distinct sample households, the estimated aggregate at village/block level was obtained as (H1 / h1) y1 + (H2 / h2) y2 where y1 and y2 are sample totals. It may be seen that, due to symmetry, each term is the H-T estimator of the corresponding sub-stratum total for any realised values of h1 and h2. This was blown up to the stratum level by the usual method. V. Some Concluding Remarks Some special procedures: Although all the general features of the sample designs of NSS have been covered in the previous sections, some special procedures applicable to
only some particular cases have been omitted to avoid unnecessary digression. For example, in the 32nd and 33rd rounds, besides the common programme, some special surveys were carried out in the North-Eastern region. In the 32nd round, besides a Village Schedule 3.5, a Schedule 16.4 - Integrated Household Survey - was also canvassed in the same sample of households selected for Schedules
1.0 and 10 in the rural sector. In the 33rd round, Schedule 16.4 and Schedule 16.5 - Weaving and Manufacturing of Bamboo and Cane Products - were canvassed in the rural sample of the North-Eastern region. In both these rounds, a special procedure of cluster sampling was adopted for selection of villages in the North-Eastern States. The field staff was given a list of “nucleus” villages and they were asked to select a cluster of villages (4 on an average) adjoining and including each nucleus village for survey. Each village was completely listed. After listing one or more villages, if it was found that 400 or more households had already been listed, no further village was added to the cluster. But if even after listing 4 villages, less than 100 households could be obtained, then one or at most two more villages were taken up for survey. This was first introduced in the 32nd round, at the request of the State Governments, in all the North-Eastern States (Arunachal Pradesh, Assam (Hills), Manipur (excluding plains), Meghalaya, Mizoram and Tripura). From the 35th round onwards, all these States except Arunachal Pracdesh opted out of this procedure. In Arunachal Pradesh it has been continued in all the later rounds (except in the 37th round).
Special cluster sampling in
the villages of NE region

61
Mention may also be made of revenue village selection. In earlier rounds, although the census villages were the unit of selection, the corresponding revenue village was the unit
of survey. This was important for crop surveys as the cadastral survey maps are maintained by revenue villages. There was an adjustment factor for revenue village selection, when the selected census village and its corresponding revenue village were not identical. Such cases, however, were relatively small in number. But even after the
discontinuation of crop surveys, when the boundaries of the sampled census village were unidentifiable, the corresponding revenue village was surveyed. Such cases were extremely few (less than 5 in a round) and this practice was ultimately discontinued.
Mention may be made also of a tendency to adopt methods on what may be called pragmatic or commonsense considerations in some rounds. In the absence of adequate data processing resources, a self-weighting design is of immense utility. But a properly self-weighting design has often the practical drawback of unequal workload for field investigators in terms of ultimate units. Hence in the 30th and 31st rounds, with equal work-load at the village/block level, a self-weighting multiplier was used which was the ratio of estimated number of households obtained from the listing schedule to the number of sample households. This differed from the design-based multiplier which gave unbiased estimates of totals. In the 32nd round, the self-weighting multiplier used for tabulation was P/p where P was the projected population and p the sample population at region × sector level. Though the results, in the case of percentage distribution of population by activity status, did not show any noticeable difference between this procedure and the usual unbiased estimation procedure, sampling theory experts reportedly have taken strong exception to this approach.
Similarly the procedure of selection of sample EB’s in the 33rd round as well as that of sub-block selection adopted in the 40th round (urban, sub-stratum 4) were prompted by the desire to have adequate numbers of enterprises in the sample. The number of sample EB’s to be selected from a stratum was not fixed beforehand in the 33rd round. Sampling (by ppswr) of EB’s was continued until the quota of number of enterprises for the stratum (as per the frame) was attained. Similarly, in the 40th round, one or two sub-blocks were required to be selected according as the first selected sub-block contained a given number of enterprises or not. Though these were in the nature of inverse sampling procedures, estimators corresponding to ppswr or srs were used, which could lead to biased estimates (possibly over-estimates). The cluster sampling procedure (for the North-Eastern States), too, belongs to this category. (No theoretical result on the comparative merits of different estimators under such circumstances could, however, be traced in the literature. But some numerical examples have supported this.) The Working Group on sample design set up by the Governing Council wanted that the rural and urban strata be formed within the same basic strata, which would not cut across district boundaries. This was a good idea in case estimates were to be obtained for rural and urban sectors pooled together. It would also be desirable for preparing district-wise estimates for either sector separately. Thus, in the 28th round, the rural part of each basic stratum formed a rural stratum and the urban part, an urban stratum, and the urban strata were further divided into sub-strata by population size-class of towns. However this could
Selection of revenue
villages

Non-agricultural Enterprise Surveys: 41st round 62
not be continued since some of the urban strata (not to speak of sub-strata) had very small urban populations and hence did not get even the minimum required sample allocation. (In the 28th round the sample of the urban strata was “allocated” to the sub-strata “circular systematically with pps”, which actually amounted to selecting sub-strata first and sample blocks in the next stage. Some sub-strata had no allocation.) Many urban strata had to be pooled, sometimes even across districts. Later it was felt that stratification by size-class of towns/cities was more suitable for the urban sector and this was adopted from the 38th round. In fact, the population classes were the same as those by which estimates were generally required, and such urban strata were formed within regions (in the 38th round it was field administrative region consisting of a group of districts). The Working Group, reportedly, did not favour systematic selection of first-stage units (no record could be traced to substantiate this) due to the possibility of the presence of unknown periodicities. Hence first-stage units were selected with pps with replacement during the 28th to the 42nd rounds. However, systematic sampling was re-introduced in the 43rd round to ensure better geographical spread of the selected units and to avoid sample repetition. But, it has recently again been discarded due to strong objection to it from some quarters. The pragmatic estimation procedures adopted in the 30th to 32nd rounds were prompted by a shortage of tabulation resources. Progressive computerisation was the ultimate answer. The tabulation work of the 36th round, carried out by NSSO’s Data Processing Division using hired computer time, was completed in record time. Later as per the recommendations of a Working Group on Acceleration of NSS Data Processing, DPD acquired three mini-computers and 108 offline data-entry machines. The Department of Statistics Computer Centre in New Delhi also undertook the processing of NSS data. All these enabled the time gap between completion of field work and tabulation to be reduced to 15-18 months, despite the fact that in many rounds a large number of multipliers had to be calculated for each first-stage unit. At present all data processing work – data entry, editing and preparation of final tables – is done by DPD and the survey results are brought out soon after the completion of field work without any delay. The many modifications and innovations brought about in the sampling designs of various rounds/enquiries were prompted mainly by theoretical a priori considerations. However, it must be admitted that no serious study on the evaluation of the practical performances of the designs has been made so far. Calculation of the standard errors, at least of key estimates, is of great importance for this evaluation. Many individual authors have, of course, published estimates of relative standard errors for selected rounds. However, it is perhaps necessary to include estimates of standard errors in the approved tabulation plans of NSS rounds and publish them as part of regular reports. The first- and second-stage sample sizes have always been determined in NSS on the basis of available resources. It is necessary to carry out studies for estimating the first- and second-stage components of variance for important characteristics in order to arrive at the desirable sample sizes for different enquiries. A study by the present author may be referred to in this connection [11].

63
Apart from these, validation studies of the estimates obtained in NSS, especially those comparing NSS estimates with comparable external data, are extremely important. Results of such studies have sometimes been included in reports. Two papers, one by Minhas et al [4] and another by Minhas [5] are indeed monumental. Bibliography [1] Bhattacharyya, A.K. and Roy, A.S. (1968): “Technical Paper on Sample Design, NSS 19th round (July ’64 – June ’65)”, NSS Report No.125, Government of India. [2] Bhattacharyya, A.K. (1976): “Evolution of the Sample Designs of the Indian National Sample Survey”, Sankhya, C, Vol.38, Parts 1 & 3, p.9-25 (published in 1981). [3] Lahiri, D.B. (1954): “Technical Paper on Some Aspects of the Development of the Sample Design”, NSS Report No.5, Govt. of India, reprinted in Sankhya, V.14, p. 264-316. [4] Minhas, B.S., Kansal, S.M., Kumar, J. and Joshi, P.D. (1986): “On the Reliability of the Available Estimates of Private Consumption Expenditure in India”, read at the IARNIW Seminar on Tangible Wealth and Consumption, Bhopal. [5] Minhas, B.S. (1988): “Validation of Large Scale Sample Survey Data: Case of NSS Estimates of Household Consumption Expenditure”, Sankhya, B, V.50, Pt.3, Supplement, p.1-63. [6] Murthy, M.N. (1962): “Technical paper on Sample Design, NSS 14th round (July 1958 – June, 1959)”, NSS Report No.70, Govt. of India. [7] Murthy, M.N. (1967): “Sampling Theory and Methods”, Statistical Publishing Society, Calcutta. [8] Murthy, M.N. and Roy, A.S. (1975): “Development of the Sample Design of the Indian National Sample Survey during the First Twenty-five Rounds”, Sankhya, C, Vol.37, Pt.1, p. 1-42. [9] National Sample Survey (1952): “General Report No.1”, Govt. of India. [10] Rudra, A. (1996): “Prasanta Chandra Mahalanobis, A Biography”, Oxford University Press, New Delhi. [11] Sankaranarayanan, K. (1989): “On Stage-wise Variance Components of a Stratified Two-stage Design”, Sarvekshana, Vol.XIII, No.2, 1989.

Non-agricultural Enterprise Surveys: 41st round 64
Index
(Where the number of occurrences of a word or phrase is very large, only the first few occurrences are referred below. An asterisk indicates that reference is given for the first occurrence only.) affluent households 19-21 aged persons, survey of 13,41,44 agro-economic regions 14,29 annual survey of consumer expenditure
12,18,21,41,45,54 area of concentration 9,14,19-21,31,32,34,45,52 basic strata 11,15,17,18,37,39,45,59 bazaar area 9,19,31,34 bias 29,43,59 cadastral survey 5,58 capital formation 12,49 census villages 14,25,58 Central sample 7,11,12,15,16,30,36,46,49 Central Statistical Organisation (CSO) 10,14,21-
24,29,30,33,35,36 circular systematic sample 8,17,19-21,27,… Class I towns/cities 9,15,29-31,33,36,… Class II towns 29,30,51 cluster, cluster sampling 2,5,30,55,58,59 confidence intervals 4 construction as sampling unit 51 consumer price index (CPI) 10 crop surveys 3,4,5,7-9,12,58 crop-cutting 3,8 demography 12 depopulated villages 16 design-based multiplier 48,59 Directory Establishments (DE) 23* disabled persons, survey on 12,41,45,56 disposal of cereals, survey on 8 DME 23* DTE 23* EC-4 frame 33-34 EC-5 frame 33-34 EC-77 25,30 EC-80 24,28-30,31,33 Economic Census (EC) 13,21-23,… enumeration re-enumeration survey 8,41,42 enumerator's block (EB) 3,4,9,24,25,… establishment 1,21-24,… ex-armed forces personnel, survey on 13,41,44-
45 family living surveys 10 family planning, survey on 12,14,44 fertility, survey on 12,14 Field Operations Division (FOD) 12,19,23,28-31 first-stage unit (fsu) 2,3,6,11,12,14,… FOD region 28,30,31
follow-up surveys of Economic Census 13, 21-24,28,29
Governing Council (GC) of NSSO 9,10,11,41,59
hamlet-groups 3,6,7,17,20,21,25,… household enterprise 2,3,12,22 housing condition and migration 13,14 H-T estimator 58 Indian Statistical Institute 2,7,11 industrial area 9,19,34 interpenetrating sub-samples (IPNS) 4,11 inverse sampling 25,29,59 Investigator 6,11,12,17,19,25,… Investigator Unit (Iv Unit) 9 land utilisation survey (LUS) 2,3,5,8,12 linear systematic sample 6,17,22,25,36,37,43,56 master sample 2,3 maternity and child care, survey on 12,44 means of livelihood (m.l.) class 17,20,38,55,56 middle class family living surveys 10 morbidity, survey on 12,14 multipliers 1,6,14,17,43,48,49,58-60 National Buildings Organisation 8,10,50 natural divisions 4,14 NDME 23* NDTE 23* Non-Directory Establishments (NDE) 23* non-sampling errors 11 notional population 16 NSS regions 14,15,19,20,22,… nucleus villages 58 OAME 23* OATE 23* orientation of design 9,21,51,52 Own Account Enterprises (OAE) 23* pilot survey, pilot study 49,51 pooling of hamlet-groups 57 pooling of samples 26,38,48 pooling of strata 18,22,45,59 population, births and deaths 12,14 ppa (probability proportional to area) 2,5,8 ppp (probability proportional to population)
2,4,5,8,17,19,25,39,42,45,47,57 pps (probability proportional to size)
3,4,6,7,8,17,30,31,34,48,54,59 ppswr 6,19,28,29,38,42,56,59 proportional allocation 6 repeat sample 26

65
Reserve Bank of India 8,36,38 revenue villages 58 rural labour 8,10,12,20,22 rural labour enquiry 12,22 rural retail prices 2,3,9,14,15,24,27 Sample Registration Scheme (SRS) 42 sampling frame 2,3,4,9,13,16,… sampling unit 3,49,51 seasonal variation 9,26,41 second-stage strata 8,19,20,32,35,… second-stage units 2,3,14,25,26,… self-weighting design 6,8,14,17,20,22,36,37,43,48,49,58,59 slum 9,13,41,46,48,49 small scale manufacture and handicraft, survey on 3,9 socio-economic (SE) enquiries 2,3,4,8,12,33,49,57 srs (simple random sampling) 59 srswor (simple random sampling without replacement) 20,28,39,43,45,56 standard errors 4,21,60 State sample 7,11,15,16,30,32,36,38,49,52 strata, stratification 2,3,4,5,6,… sub-block 6,17,20,21,25,27,… sub-rounds 8,9,13,16,17,19,… sub-samples 4,5,11,12,… sub-strata 17,18,20,27-31,.. systematic sampling 4-9,17,19,20,…
systematic sampling of first-stage units 8,17,19,20,26,28,30,… talukas 14,30 tehsils 4,11,13,15,52 three-stage design 49 unbiased 5-7,43,48,57,59 uninhabited villages 18 Urban Frame Survey (UFS) 9,13,14,25,29,… variance estimate 5,11,60 variance, components of 60 village schedule 2,47,50,57,58 working class family living surveys 10