design improvements of sirocco type fans by means of...
TRANSCRIPT

_______________________________________________________________________________ FAN 2012 Senlis (France) 18-20 April 2012
DESIGN IMPROVEMENTS OF SIROCCO TYPE FANS BY MEANS OF COMPUTATIONAL FLUID DYNAMICS AND
STEREOSCOPIC PARTICLE IMAGE VELOCIMETRY
Stefan FRANK1, Manoochehr DARVISH1, Bastian TIETJEN1 and Adam STUCHLIK1,2 1 University of Applied Sciences HTW Berlin,
Wilhelminenhofstr. 75A, 12459 Berlin, Germany email: [email protected]
2 now: I-D-E-A-S, Ulmenstr. 28, 13595 Berlin, Germany
SUMMARY
This paper treats the investigation of the complex internal flow in Sirocco type fans by means of both numerical and experimental methods. In order to improve the design and efficiency of these fans, Computational Fluid Dynamics (CFD) with high-quality, high-resolution structured and unstructured grids are used. Simulations are verified by both integral measurements at a high-precision chamber test rig according to ISO 5801 and by means of Stereoscopic Particle Image Velocimetry (Stereoscopic PIV). Comparison between numerical and experimental data shows a high consistency. Performance curves and efficiencies can be predicted with less than five per cent deviation in a wide operating range.
INTRODUCTION
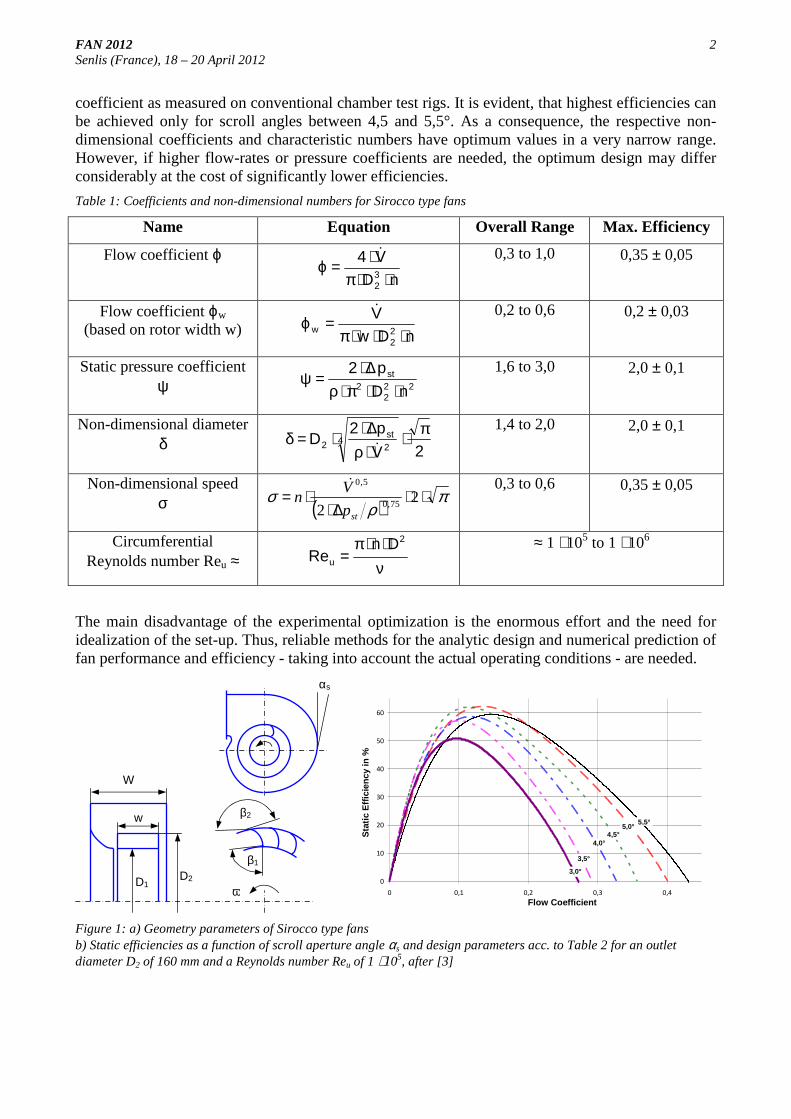
Sirocco type fans, sometimes also called squirrel-cage fans, consist of a radial impeller with short forward curved blades and a scroll housing [1, 2]. They are widely used in industry, especially in edificial and automotive HVAC applications where relatively high mass flows, size compactness and low noise levels are required. The main disadvantage is their relatively low efficiency and the need for empirical designing. The latter results from the fact that the performance curve of Sirocco fans cannot be derived directly from the Euler turbo-machine equation. Therefore, the non-dimensional coefficients of Sirocco fans cannot be found on the Cordier curve [1], but form a small separate band below it (compare Table 1). The flow in Sirocco fans is mostly unsteady, fully three-dimensional, turbulent and shows virtually unavoidable flow separation within the blades and the scroll, even at the best efficiency point. Experimental optimization of these fans has been investigated for a long time, e.g. by Roth [2] and many others. The main design parameters such as blade number, ratio of inlet to outlet diameter etc. can be found in Figure 1a and Table 2 respectively. For instance, in order to optimize the housing, both the scroll width W and the aperture angle αs can be varied. Other parameters including the scroll outlet area have been kept constant according to Table 2 in this investigation. Figure 1b shows the max. obtainable static efficiencies for a given set of parameters (Table 2) as a function of scroll aperture angle and flow
FAN 2012 2 Senlis (France), 18 – 20 April 2012
coefficient as measured on conventional chamber test rigs. It is evident, that highest efficiencies can be achieved only for scroll angles between 4,5 and 5,5°. As a consequence, the respective non-dimensional coefficients and characteristic numbers have optimum values in a very narrow range. However, if higher flow-rates or pressure coefficients are needed, the optimum design may differ considerably at the cost of significantly lower efficiencies.
Table 1: Coefficients and non-dimensional numbers for Sirocco type fans
Name Equation Overall Range Max. Efficiency
Flow coefficient ϕ
nDV432 ⋅⋅π
⋅=ϕ&
0,3 to 1,0 0,35 ± 0,05
Flow coefficient ϕw (based on rotor width w) nDw
V22
w ⋅⋅⋅π=ϕ
&
0,2 to 0,6 0,2 ± 0,03
Static pressure coefficient ψ 22
22
st
nD
p2
⋅⋅π⋅ρ∆⋅
=ψ 1,6 to 3,0 2,0 ± 0,1
Non-dimensional diameter δ 2V
p2D 4
2st
2
π⋅⋅ρ∆⋅
⋅=δ&
1,4 to 2,0 2,0 ± 0,1
Non-dimensional speed σ ( ) π
ρσ ⋅⋅
∆⋅⋅= 2
2 75,0
5,0
stp
Vn
&
0,3 to 0,6 0,35 ± 0,05
Circumferential Reynolds number Reu ≈ ν
⋅⋅π=
2
u
DnRe
≈ 1 ⋅ 105 to 1 ⋅ 106
The main disadvantage of the experimental optimization is the enormous effort and the need for idealization of the set-up. Thus, reliable methods for the analytic design and numerical prediction of fan performance and efficiency - taking into account the actual operating conditions - are needed.
0
10
20
30
40
50
60
0 0,1 0,2 0,3 0,4
Flow Coefficient
Sta
tic E
ffici
ency
in %
5,5°
3,0°
3,5°
4,5°5,0°
4,0°
Figure 1: a) Geometry parameters of Sirocco type fans b) Static efficiencies as a function of scroll aperture angle αs and design parameters acc. to Table 2 for an outlet diameter D2 of 160 mm and a Reynolds number Reu of 1 ⋅ 105, after [3]
W
w
D2 D1
αs
β1
β2
ω

FAN 2012 3 Senlis (France), 18 – 20 April 2012
Table 2: Optimum design parameters for max. efficiency of Sirocco type fans [e.g. 1, 2]
Name Symbol Value
Blade Number z ≈ 40
Ratio of Inlet to Outlet Diameter D1/D2 ≈ 0,8
Ratio of Rotor Width to Outlet Diameter w/D2 ≈ 0,4
Ratio of Rotor to Scroll Width w/W ≈ 1,1
Blade Inlet Angle β1 ≈ 80°
Blade Outlet Angle β2 ≈ 170°
Aperture Angle of Logarithmic Scroll αS ≈ 5°
EXPERIMENTAL SET-UP
The experimental investigations are performed on a special fan test rig with variable speed drive. In order to determine integral performance values like flow-rate, pressure increase and power the fan is connected to a highly accurate chamber test rig according to ISO 5801 / DIN 24163 (manufacturer: ILK Dresden). A threefold orifice plate pipe section and a twofold differential pressure cascade allows for max. uncertainties of less than one per cent of the reading for the flow-rate in the entire operating range of 10 to 2.000 m³/h. The respective uncertainties for the pressure increase amount to less than half a per cent of the reading. However, uncertainties of fan efficiency amount to one to seven per cent depending on the load of the mechanical torque sensor. In addition to these integral measurements, instantaneous velocity field measurements are performed by Particle Image Velocimetry (PIV). This is a state-of-the-art optical method of flow measurement used in research [4, 5].
Figure 2: Schematic of the set-up for Particle Image Velocimetry (PIV) measurements (top view) Left: 2D-PIV (2D-2C); Right: Stereoscopic PIV (2D-3C)
Frame CCD1 Reduced Image
Rotor Scheimpflug Condition
CCD 1 CCD 2
Camera 1 Camera 2
Stereoscopic PIV
Scroll
Frame CCD2
Laser Lightsheet
CCD
Camera
Image
2D-PIV
Tongue

FAN 2012 4 Senlis (France), 18 – 20 April 2012
Figure 2 shows the schematic set-up for measurements of the two- or three-dimensional velocity field in the measuring plane (2D plane - 2 velocity components: 2D-2C and 2D-3C, respectively). Scroll and side walls are manufactured from acrylic glass in optical quality. This allows for the entrance of the laser light-sheet and the view of the flow field for the CCD cameras (see Figure 3).
Figure 3: Experimental set-up for Stereoscopic Particle Image Velocimetry in two dimensional planes in order to
measure the three dimensional velocity field (i.e. 2D-3C PIV). The two CCD cameras are to be seen in the foreground, the transparent scroll of the fan with illuminated laser light sheet and the chamber test rig in the background
The PIV measurements are performed using a system by Intelligent Laser Applications ILA, Jülich. A pressurized atomizer with DEHS provides the seeding of the flow via a cyclone to the inlet of the auxiliary fan of the chamber test rig. Hence, the particle inlet is about five meters upstream of the test-section. This allows for a very homogeneous seeding of the flow field with particles of adequate size and quality. The parameters of the used PIV System are given in Table 3.
Table 3: Parameters of the Particle Image Velocimetry System
Parameter Value
Resolution of CCD Cameras 2048² Pixel
Max. Energy per Laser Shot 220 mJ
Double Frames per Plane and Operating Point 100
Repetition Rate 5 Hz
In order to evaluate the PIV data, the flow field has to be calibrated for each measuring plane (Figure 4) using a well-known target with an x,y-grid. The latter is exactly centred via the scroll, whereas the distance from the wall, i.e. the position of the laser light sheet, is adjusted by special pins. Since reflections of the laser light can cause severe problems during the evaluation process some parts of the scroll, namely the tongue, are covered with a Rhodamin containing tape. Thus, the green laser light is absorbed and orange light is re-emitted. The CCD cameras are equipped with green interferential filters. As a consequence, high quality pictures can be obtained also in these potentially difficult areas. The frames are not correlated to the variable rotor position, which results in a statistical average of the flow field. Each double frame is evaluated by a cross correlation process followed by several subsequent adaptive cross correlations and global and local filtering

FAN 2012 5 Senlis (France), 18 – 20 April 2012
using the VidPIV software [6]. Outliers are identified by means of filtering, subsequently removed and interpolated. Eventually, all double frames are averaged in order to calculate the velocity field. The RMS value of velocity for a single interrogation window is about five per cent, thus yielding a statistical error for its average of about one per cent at a confidence level of 95 %. Hence, the number of 100 double frames is sufficiently high.
Figure 4: a) Measuring planes for PIV measurements b) Single frame of the CCD-camera of the Sirocco fan with scroll, rotor (D2 = 200 mm) and tongue
NUMERICAL FLOW SIMULATION
For the numerical flow calculations commercially available Finite Volume Method software with Reynolds Averaged Navier-Stokes (RANS) equation is used [7, 8]. Mesh generation is performed by both structured grids with hexahedral cells [9] and unstructured grids with polyhedral cells [10]. Unstructured grids provide the advantage of higher flexibility than structured grids. For equivalent cell numbers and comparable cell quality criteria, structured and unstructured grids may yield the same degree of reliability. The calculations using structured grids are slightly faster than with unstructured grids. However, this is usually more than compensated by the faster meshing process for the latter.
Reliable numerical simulations of Sirocco type fans are characterized by a cell number of about four million (two thirds in the rotor, one third in the stator), the use of state-of-the-art turbulence models such as the Shear-Stress-Transport (SST) or Realizable k-epsilon model. The adequate resolution of the boundary layer is crucial for the simulation. As a consequence the non-dimensional wall distance y+ has to be controlled down to values about one to two in the rotor, especially around the blades. In these investigations steady calculations using the "Moving Reference Frame" approach (also called "Frozen Rotor") are performed exclusively. More details of the CFD calculations are described elsewhere [9 - 11].
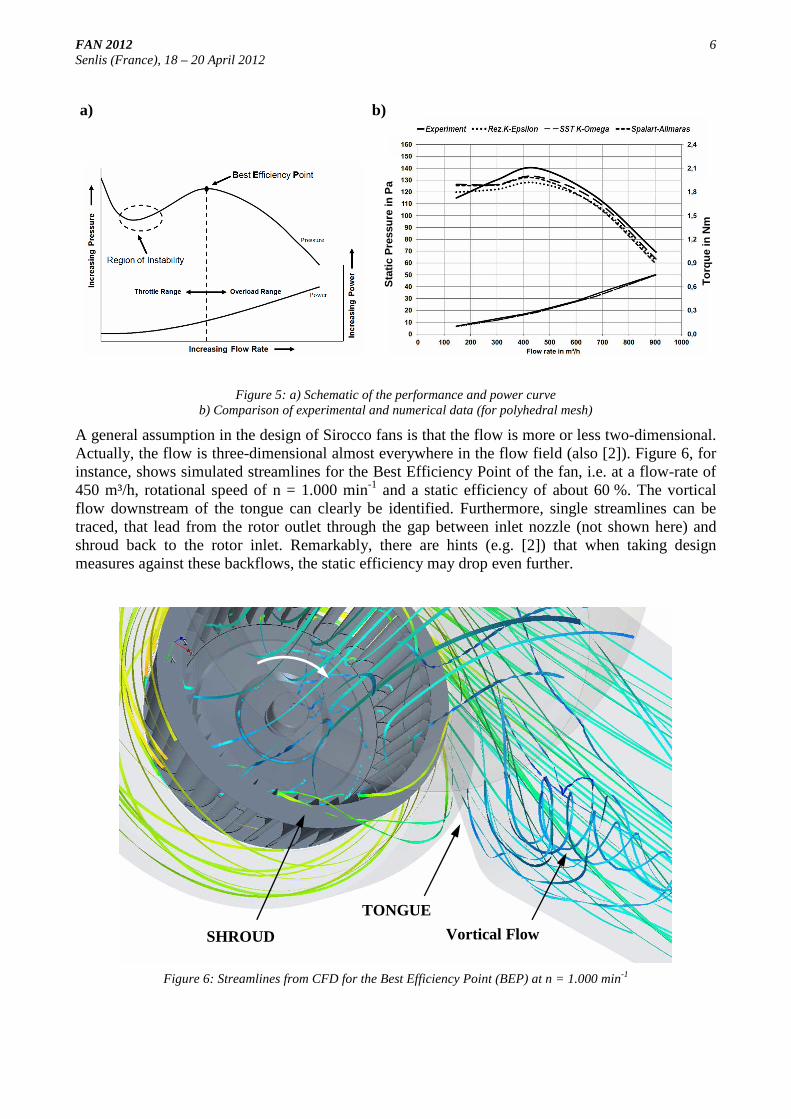
Figure 5a shows a typical performance curve of a Sirocco type fan exhibiting a region of instability in the throttle range, whereas Figure 5b depicts a comparison of numerical data obtained using different turbulence models and experimental data. For a wide range of fan operation a quite high degree of quantitative accordance between experiments and simulations has been obtained. A fundamental advantage of CFD over any experimental method is that all field properties such as pressure and velocity are available for the entire flow field. Due to the employment of RANS equations the stationary macroscopic vortices can be shown here.
a) b)
PIV analysis section for several measuring planes
Plane 1
Plane 5
ROTOR
TONGUE
FAN 2012 6 Senlis (France), 18 – 20 April 2012
Figure 5: a) Schematic of the performance and power curve b) Comparison of experimental and numerical data (for polyhedral mesh)
A general assumption in the design of Sirocco fans is that the flow is more or less two-dimensional. Actually, the flow is three-dimensional almost everywhere in the flow field (also [2]). Figure 6, for instance, shows simulated streamlines for the Best Efficiency Point of the fan, i.e. at a flow-rate of 450 m³/h, rotational speed of n = 1.000 min-1 and a static efficiency of about 60 %. The vortical flow downstream of the tongue can clearly be identified. Furthermore, single streamlines can be traced, that lead from the rotor outlet through the gap between inlet nozzle (not shown here) and shroud back to the rotor inlet. Remarkably, there are hints (e.g. [2]) that when taking design measures against these backflows, the static efficiency may drop even further.
Figure 6: Streamlines from CFD for the Best Efficiency Point (BEP) at n = 1.000 min-1
a) b)
TONGUE
SHROUD Vortical Flow
Sta
tic P
ress
ure
in P
a
Tor
que
in N
m
FAN 2012 7 Senlis (France), 18 – 20 April 2012
a)
b)
c)
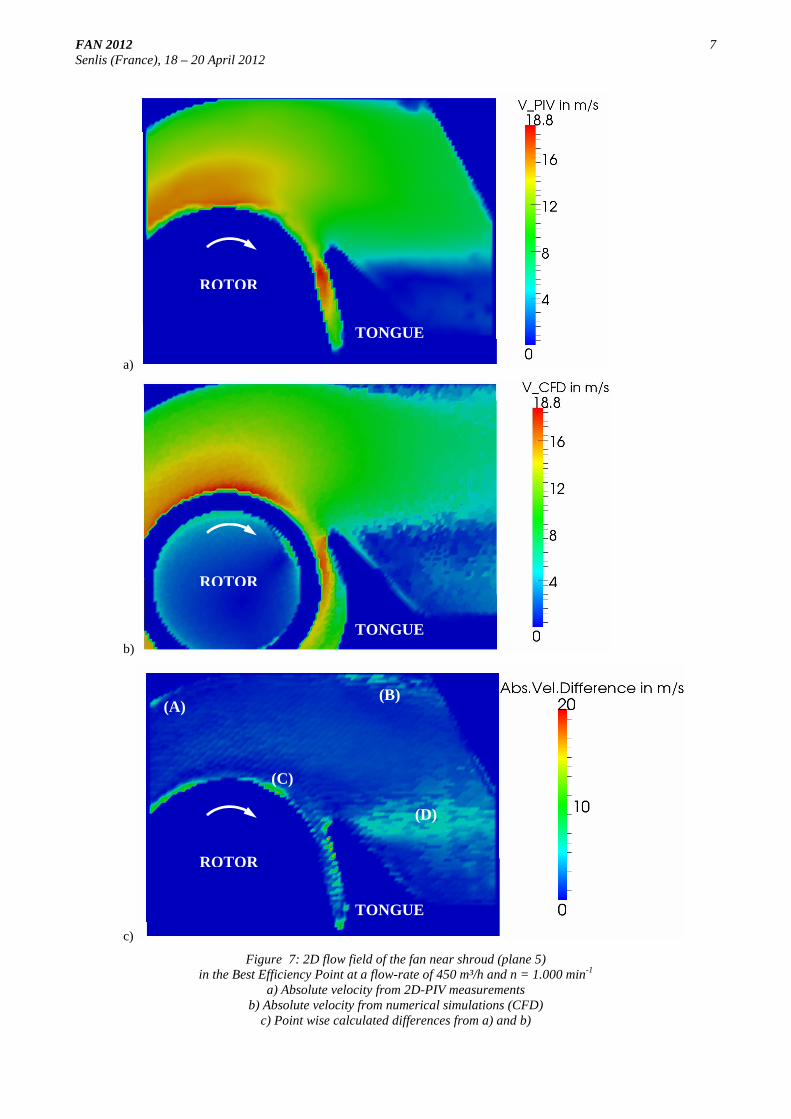
Figure 7: 2D flow field of the fan near shroud (plane 5) in the Best Efficiency Point at a flow-rate of 450 m³/h and n = 1.000 min-1
a) Absolute velocity from 2D-PIV measurements b) Absolute velocity from numerical simulations (CFD)
c) Point wise calculated differences from a) and b)
(A) (B)
(C)
(D)
ROTOR
TONGUE
ROTOR
TONGUE
ROTOR
TONGUE
FAN 2012 8 Senlis (France), 18 – 20 April 2012
COMPARISON OF RESULTS
The experimental investigations start with 2D-PIV and just one CCD camera with a resolution of 2048² pixels and a focus length of 50 mm. The camera is oriented perpendicular to the laser light sheet plane (see Figure 2). Measurements are taken in five planes (as shown in Figure 4a) for operating points from 150 to 900 m³/h. Plane 5 is the most remote measuring plane close to the shroud, yielding the greatest experimental challenges. For comparison the 2D-PIV and CFD results at the BEP are shown in Figure 7a and b as colour-plots using the free open source software ParaView [12]. Concerning the simulations, steady RANS calculations with the SST turbulence model are performed. A high degree of qualitative accordance between the two methods can be seen at a glance. However, in order to make a more detailed statement a common evaluation grid with about six thousand points is generated for the PIV and CFD data. Subsequently, the vectorial differences of absolute velocity have been calculated point by point. It is worth mentioning, that using this method the highest possible relative deviation may reach up to 200 % for vectors of equal value but opposite orientation.
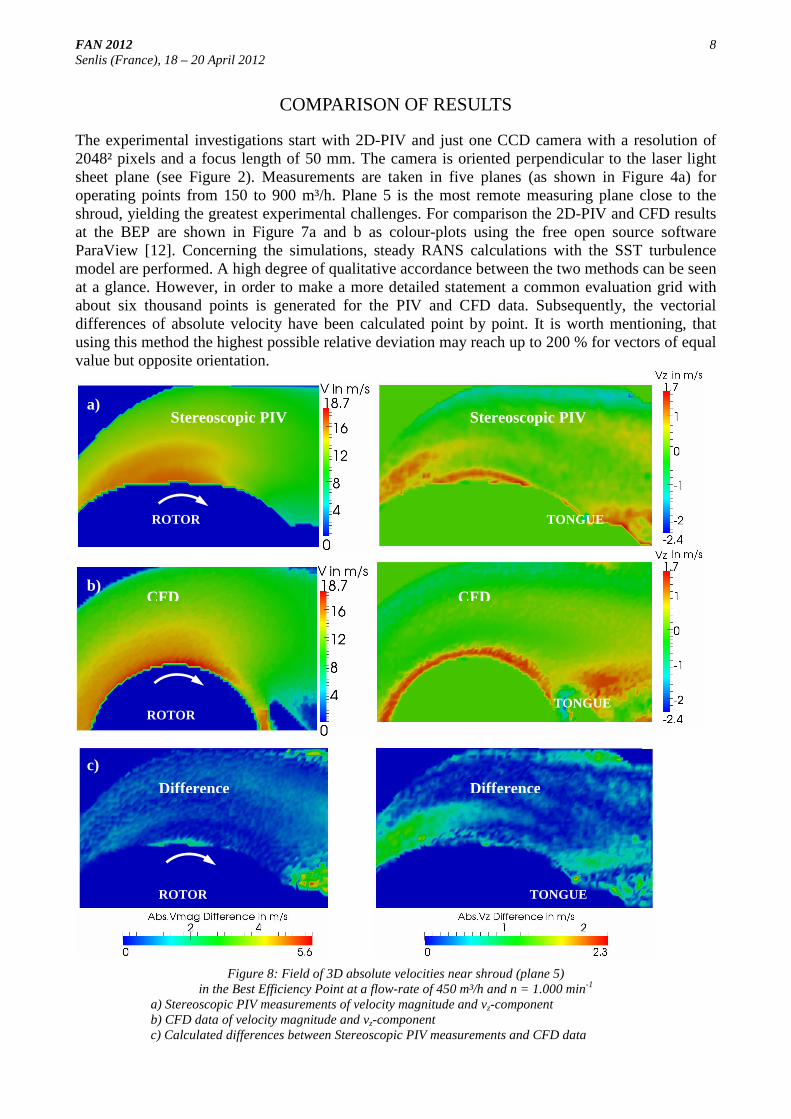
Figure 8: Field of 3D absolute velocities near shroud (plane 5) in the Best Efficiency Point at a flow-rate of 450 m³/h and n = 1.000 min-1
a) Stereoscopic PIV measurements of velocity magnitude and vz-component b) CFD data of velocity magnitude and vz-component c) Calculated differences between Stereoscopic PIV measurements and CFD data
ROTOR TONGUE
a)
b)
c)
ROTOR TONGUE
ROTOR TONGUE
Stereoscopic PIV
CFD CFD
Difference Difference
Stereoscopic PIV

FAN 2012 9 Senlis (France), 18 – 20 April 2012
As it can be seen from Figure 7c, there is a high quantitative consistency between experimental and simulated values in the core region of the flow. Areas with significantly higher deviations can be distinguished into two zones: On the one hand, these are boundary areas close to either the scroll wall (A) and (B) or the rotor (C), where directly reflected laser light is obviously a source of error. On the other hand, higher deviations can be found downstream of the tongue (D). It is assumed that these deviations arise mainly from the comparison of "Moving Reference Frame" results for the CFD and averaged PIV results (concerning the rotor position). A possible remedy is taking PIV measurements for correlated rotor positions only.
Subsequently Stereoscopic PIV measurements are performed using two CCD cameras (Figures 2 and 3). The cameras can be mounted on a rigid x,y,z-traverse, whereas the optics for the laser light-sheet is mounted on a z-traverse. Thus, cameras and light sheet can be moved simultaneously in the z-direction (i.e. direction of the scroll width) without re-adjusting the focus, once the correct setting has been found. The CCD cameras are positioned at an angle of 20 to 25° to the normal of the light-sheet plane. Because of that motorized Scheimpflug tilt devices have to be used in order to keep the whole measurement plane in focus (see Figure 2). In principle, the ideal angle between each camera and the normal of the light-sheet plane is 45°. However, for this kind of internal flow, the maximum angle is restricted to about 25°. Otherwise, too large portions of the field of interest can not be evaluated, since they are shadowed either by the scroll, the rotor or the tongue. This applies especially to the most remote measurement plane 5. The light sheet has a max. thickness of 5 mm, and again 100 double frames at five Hz are taken for each plane and operating point, respectively.
Figure 9: Secondary flow (double vortex) in the scroll right above rotor axis as simulated by CFD
Figure 8a shows the z-component of absolute velocity for the Stereoscopic PIV measurements. Only those areas can be evaluated that are common to both cameras. Unfortunately, some potential areas of interest, such as the zone directly downstream of the tongue, are excluded from the stereoscopic evaluation. It can be noticed that the z-component is especially high close to the scroll (negative z-values) and to the rotor (positive z-values), but relatively low in the core flow. Again, comparison with the respective simulated values exhibit a high degree of accordance (Figure 8b and 8c). The pronounced vz-component adjacent to the scroll and the rotor indicates a secondary flow in form of a vortex. Roth [2] has already reported such double vortex systems using hot-wire anemometry. The respective CFD data for the current investigation is depicted in Figure 9 and exhibits the same phenomenon. The present results document the suitability of Stereoscopic PIV for these kinds of internal flows. In addition to the 2D-PIV results even secondary vortex flows have been detected. It can be concluded, that the quality of the experimental data used for the evaluation of CFD simulations has been improved significantly.
PLANE 5

FAN 2012 10 Senlis (France), 18 – 20 April 2012
NUMERICAL OPTIMZATION
The possibilities for numerical optimization of Sirocco type fans are shown for a special application: Based on the experiences made beforehand the Sirocco fan system of a home appliance shall be optimized using numerical methods. In this case study, ANSYS CFX [14] is applied using structured ICEM meshes. The geometry is based on the original CAD model (Figure 10a). The simulations use RANS equations and the SST turbulence model with a highly resolved grid (hexahedral cells with about five million node points). Starting from a reference configuration, which is based on previous designs, various new design variants are investigated in detail. Main variations concern the rotor outlet diameter D2 and the scroll width W (compare Figure 1).
Figure 10: Sirocco fan system for a home appliance a) Structured ICEM mesh of the reference geometry with about five million node points b) Simulated velocity distributions for the reference geometry (left) and the optimized variant (right)
For evaluation purposes, the reference geometry has been set-up and tested on a chamber test rig, yielding deviations of less than five per cent between experiment and simulation. The CFD calculations show that a smaller, yet slightly eccentrically positioned rotor [13] generates a much more homogeneous velocity distribution in the scroll (Figure 10b, left). Contrary to the optimized variant (left) the reference geometry (right) exhibits a pronounced vortex and recirculation zone around and downstream of the tongue. The downstream developing velocity profiles in the scroll and the subsequent air channel are depicted in Figure 11. Again the velocity distribution is more homogeneous in the optimized version. For about the same pressure rise, flow-rate and rotational speed the optimized geometry is equipped with a twelve per cent smaller outlet diameter D2 than the reference case. This leads to a reduction of shaft power of about 30 % at BEP and thus to a considerable gain in system efficiency by about 25 percentage points. Table 4 compares the non-dimensional coefficients between the reference and the optimized variant. Finally, the coefficients are closer to the optimum values for max. efficiency as given in Table 1. This means as well, that there still could be potential for further improvement of the efficiency, given that the required design changes can be realized in a production home appliance.
a) b)
Tongue Recirculation Zone

FAN 2012 11 Senlis (France), 18 – 20 April 2012
Figure 11: Velocity distribution in the air channel. Top: reference geometry. Bottom: Optimized Version
Table 4: Coefficients and non-dimensional numbers for different design variants
Name Reference Optimized
Flow coefficient ϕ 0,14 0,21
Flow coefficient ϕw (based on rotor width w) 0,13 0,16
Static pressure coefficient ψ 1,1 1,4
Non-dimensional diameter δ 2,7 2,3
Non-dimensional speed σ 0,36 0,35
Circumferential Reynolds number Reu ≈ 2,1 ⋅ 105
CONCLUSIONS
The performance of Sirocco type fans can be tested on conventional chamber test rigs with low uncertainties concerning flow-rate, pressure rise and efficiency. However, the conventional optimization of these systems require a lot of experimental effort and is very time consuming. Hence, optimization by numerical means such as Computational Fluid Dynamics would be favourable. In order to do so a reliable data base for the assessment of numerical results has to be provided. 2D Particle Image Velocimetry measurements can be performed with relatively low experimental effort, given that an optical access for the laser light-sheet and the CCD camera can be realized. Problems due to the necessary seeding of the flow and direct reflections of laser-light can be overcome. Comparison between velocity fields from experiment and simulation are already quite consistent. However, the third, out-of-plane velocity component remains undetected in principle. Hence, Stereoscopic Particle Image Velocimetry is applied that provides instantaneous 3D velocity fields in the measurement plane. Thus, besides the main flow the secondary vortex flow can be detected and the overall quality of measurement increases significantly. However, this is at the cost of a higher experimental effort. Furthermore, for this kind of internal flow not the whole velocity field of interest can be evaluated due to the shadowing of the scroll, the tongue and the rotor. Nevertheless, data is obtained that could not be achieved otherwise.

FAN 2012 12 Senlis (France), 18 – 20 April 2012
Numerical calculations are performed using steady RANS equations with SST turbulence model and highly resolved grids. Both structured and unstructured grids with hexahedral and polyhedral cells respectively can be applied. For a cell based solver and a comparable number of elements, both mesh types will yield equally good results at a similar numerical effort. However, mesh generation is much more flexible and significantly faster with unstructured grids. Comparison between numerical and experimental data shows deviations of less than five per cent for pressure rise and efficiency for a wide operating range. Direct and point wise comparison of the velocity fields show a high degree of consistency between the two methods. Once the numerical method has been established and proved to be accurate it can be used for the virtual optimization of e.g. Sirocco fans before building prototypes. Starting from a previous design an optimized design variant could be developed, that has a considerably smaller size and yields a much higher static efficiency at the best efficiency point. Therefore, Computational Fluid Dynamics in conjunction with Particle Image Velocimetry is a useful way to reliably improve Sirocco type fans.
ACKNOWLEDGEMENTS
The investigations have been sponsored by the German Federal Ministry of Education and Research (BMBF) under contract numbers NUBAT FKZ 17N1507 and NEGOT FKZ 17067X10 (project coordination by Arbeitsgemeinschaft industrieller Forschung AiF). The laboratory equipment has partly been sponsored by the European Fund for Regional Development (EFRE IMPACT). The main author was able to carry out some of the investigations in a research semester in winter 2010/11 granted by his university. All research support is gratefully acknowledged!
BIBLIOGRAPHY
[1] Eck, B. - Fans, Pergamon Press, 1973
[2] Roth, H.W. - Optimization of Sirocco Type Fans (in German), PhD Thesis, TH Karlsruhe, 1980
[3] Teres Duaso, R. - Experimental investigation on the influence of the scroll housing on the per-formance of Sirocco type fans. Final Project Thesis, Universidad de Zaragoza / HTW Berlin, 2011
[4] Raffel., M.; Willert, C.; Werely, S.; Kompenhans - Particle Image Velocimetry, Springer, 2007
[5] Stuchlik, A.; Frank, S. - Numerical Calculation and Design of Sirocco Type Fans (in German). Final Report BMBF/AiF-Research Project FKZ 17N1507. HTW Berlin, 2011
[6] VidPIV 4.6 Manual. ILA GmbH, Jülich/Germany
[7] Ferziger, J.H.; Peric, M. - Computational Methods for Fluid Dynamics, Springer, 2002
[8] Star CCM+ 5.04 User Manual. CD Adapco Ltd.
[9] Stuchlik, A.; Frank, S. - Performance Investigations of Sirocco Fans by means of Computational Fluid Dynamics. Proc. of ISROMAC 13, Hawaii, USA, 2010
[10] Darvish, M. - Numerical Investigations on the Performance Characteristics of Radial Fans with Forward Curved Blades by means of CFD. Master Thesis, HTW Berlin, 2010
[11] Darvish, M.; Frank, S. - Sirocco Fan Modelling: from Selecting a Proper Turbulence Model to the Influence of the Cell Shape. fan2012, Paper 073, 2012
[12] ParaView User's Guide (V. 3.10)
[13] Stuchlik, A.; Frank, S. - Eccentrical Rotor Position as a Means of Optimization of Sirocco Type Fans (in German). HLH, Bd. 62 Nr. 2, 2011
[14] Ansys Inc., "CFX User Guide", Version 12