design of a background air quality monitoring station
TRANSCRIPT
This document has been prepared on behalf of NSW Government Office of Environment
and Heritage by:
Northstar Air Quality Pty Ltd,
Suite 1504, 275 Alfred Street, North Sydney, NSW 2060
www.northstarairquality.com | Tel: +61 (02) 9071 8600
Design of a background air quality monitoring station
Addressee(s): NSW Government Office of Environment and Heritage
Report Reference: 19.1055.FR1V2
Date: 22 May 2019
19.1055.FR1V2 Page ii
Quality Control
Study Status Prepared by Checked by Authorised by
NON-TECHNICAL SUMMARY Final Northstar Air Quality MD, GCG, OEH MD
INTRODUCTION Final Northstar Air Quality MD, GCG, OEH MD
AUSTRALIA Final Northstar Air Quality MD, GCG, OEH MD
UNITED STATES Final Northstar Air Quality MD, GCG, OEH MD
EUROPEAN UNION Final Northstar Air Quality MD, GCG, OEH MD
CANADA Final Northstar Air Quality MD, GCG, OEH MD
SUMMARY AND CONCLUSIONS Final Northstar Air Quality MD, GCG, OEH MD
REFERENCES Final Northstar Air Quality MD, GCG, OEH MD
Report Status
Northstar References Report Status Report Reference Version
Year Job Number (Draft: Final) (Rx) (Vx)
19 1055 F R1 V2
Based upon the above, the specific reference for this version of the report is: 19.1055.FR1V2
Final Authority
This report must by regarded as draft until the above study components have been each marked as final, and the
document has been signed and dated below.
Martin Doyle 22nd May 2019
© Northstar Air Quality Pty Ltd 2019
Copyright in the drawings, information and data recorded in this document (the information) is the property of Northstar Air Quality Pty
Ltd. This report has been prepared with the due care and attention of a suitably qualified consultant. Information is obtained from
sources believed to be reliable but is in no way guaranteed. No guarantee of any kind is implied or possible where predictions of future
conditions are attempted. This report (including any enclosures and attachments) has been prepared for the exclusive use and benefit
of the addressee(s) and solely for the purpose for which it is provided. Unless we provide express prior written consent, no part of this
report should be reproduced, distributed or communicated to any third party. We do not accept any liability if this report is used for an
alternative purpose from which it is intended, nor to any third party in respect of this report.
DISCLAIMER This report was prepared by Northstar Air Quality Pty Ltd in good faith exercising all due care and attention, but no representation or warranty, express or implied, is made as to the relevance, accuracy, completeness or fitness for purpose of this document in respect of any particular user’s circumstances. Users of this document should satisfy themselves concerning its application to, and where necessary seek expert advice in respect of, their situation. The views expressed within are not necessarily the views of the Office of Environment and Heritage (OEH) and may not represent OEH policy.© Copyright State of NSW and the Office of Environment and Heritage

19.1055.FR1V2 Page iii
Non-Technical Summary
NSW Government Office of Environment and Heritage has engaged Northstar Air Quality Pty Ltd to perform
a review of international best practice or guidance in the design of a background air quality monitoring station.
This review will be used, in conjunction with numerous other studies and considerations, by the Office of
Environment and Heritage as due diligence for the scope, design, siting and performance of background air
quality monitoring stations in NSW.
The review has examined documentation associated with the development of air quality monitoring network
in Australia, the European Union, the United States and Canada, concentrating on the relevant components
of that documentation in relation to background air quality monitoring.
A review of the definitions, purposes, scales, scope, site selection criteria, and technology used in background
air quality monitoring networks across the jurisdictions has been performed.
Several points of consistency can be identified between the definitions of background monitoring including:
• The reference to homogeneous land use and geographies (Australia and United States);
• The distance from large pollutant sources (United State, European Union and Canada); and,
• Scales of 10’s to 100’s of kilometres (United States and European Union).
Population density is not specifically mentioned in relation to background air quality monitoring apart from
in European Union definitions (where lower population density is discussed) and briefly in US EPA regulations
(where regional scale measurements of PM2.5 should be applicable to “sparsely populated areas”). No specific
values of population densities have been identified in any guidance which would relate to background air
quality monitoring.
In relation to the purposes of background air quality monitoring (BAQM), stations can be used to assess
compliance, although are more often used to inform the potential contribution from long range transport of
pollutants (especially fine particulate [often speciated], and O3), and to support source apportionment analysis
and management. It can also be used to determine the influence of natural events from other sources for
the assessment of criteria achievement.
In terms of siting, several points of interest have been identified.
• All jurisdictions require that the stations are located so as to provide information representative of the
broader location in which they are situated. This requires placement away from local sources of
pollutants being monitored.
19.1055.FR1V2 Page iv
• Regional scale measurements of PM2.5 (speciated) and O3 are most commonly discussed in reference to
that spatial scale, and in the case of potential precursor transportation (PM2.5 and O3), Canada also
requires measurements of NO, all oxidized nitrogen compounds (NOY), NH3, SO2 and VOC (including
speciation).
• When siting an O3 monitor for regional scale background measurements, the US EPA requires that
meteorological analysis of trajectories and emission patterns be performed to assist that determination.
• When siting a BAQM, a hierarchical approach is likely to be the most successful, with the determination
of the purpose of the background monitoring being the key consideration. Site selection criteria,
including the macro and micro scale criteria presented within this review, should be considered according
to the purpose, with station and plot design being an important but lower order consideration when
compared to the overall purpose of monitoring.
• Spacing from trees is specified as being required as:
▪ 10 m from the drip line (US EPA)
▪ 20 km from the tree canopy (Canada)
▪ Clear sky angles (various) (Australia, EU)
This is a significant difference in the required spacing from trees in the different jurisdictions reviewed.
• Micro scale siting criteria are generally similar between jurisdictions and do not have any varying
requirements depending on station type (i.e. BAQMS or other).
• No discussion of any variation in monitoring techniques from urban through to background scales is
provided within any of the documentation reviewed. A more detailed review of the technical
specifications of monitoring techniques which are currently approved for use within NSW, and selection
of those with a broader range, or lower minimum threshold could be investigated.
• No specific requirements for the measurement of meteorological parameters at BAQMS is provided
within any of the literature reviewed. As outlined within the case studies, some sites do not measure
these parameters at all, some do, and some rely on modelled data. The implementation of
meteorological monitoring should be aligned with the purpose of the BAQM.
• It is clear from this review that a particular monitoring station does not have to meet the requirements
of ‘background’ for all pollutants. Often, a station will be representative of background or regional
conditions for one pollutant, but be representative of a completely different scale for another. A good
example of this is the Colusa-Sunrise Blvd site in the Colusa District of California, USA. The site is classified
as a general background type for O3, for PM10 is a highest concentration and population exposure type
site and for PM2.5 is a population exposure type site. O3 measurements at that site are reflective of the
regional scale, whereas measurements of PM10 and PM2.5 are reflective of the neighbourhood scale.
19.1055.FR1V2 Page v
Further to the above, from review of the reference material for all jurisdictions, a background monitoring
station can be pollutant-specific, or monitor multiple pollutants, so long as the siting criteria are achieved.
Adopting a common rationale may conclude that an existing station in the NSW Office of Environment and
Heritage network may be suitable for background monitoring purposes, although analysis (especially of
sources of emissions and meteorology) should be performed prior to that designation.
As may be expected, no pre-determination is provided in the reviewed guidance prescribing a concentration
of air pollutants that may be considered to represent a ‘background’ condition. This is expected as the
background will be determined by the geography, source strength and location and a variety of other factors
including topography, distance between agglomerations etcetera.

19.1055.FR1V2 Page vi
This page has been left intentionally blank
19.1055.FR1V2 Page vii
Table of Contents
1. INTRODUCTION ................................................................................................................................. 11
Purpose of the Report ...................................................................................................................... 11
Study Outline ...................................................................................................................................... 11
Selection of International Case Studies ...................................................................................... 12
General Definitions ........................................................................................................................... 14
2. AUSTRALIA ......................................................................................................................................... 17
Site Selection Criteria ....................................................................................................................... 18
2.1.1 Macro Scale ......................................................................................................................................................... 18
2.1.2 Micro Scale .......................................................................................................................................................... 18
Technology and Systems ................................................................................................................ 22
3. UNITED STATES ................................................................................................................................. 23
Definitions and Classifications ...................................................................................................... 23
Purposes .............................................................................................................................................. 24
Scales ................................................................................................................................................... 25
Scope ................................................................................................................................................... 26
Site Selection Criteria ....................................................................................................................... 27
3.5.1 Macro Scale ......................................................................................................................................................... 27
3.5.2 Micro Scale .......................................................................................................................................................... 29
Technology and Systems ................................................................................................................ 34
Case study: Background air quality monitoring in California ............................................... 39
4. EUROPEAN UNION ........................................................................................................................... 41
Definitions and Classifications ...................................................................................................... 41
Purposes .............................................................................................................................................. 42
Scales ................................................................................................................................................... 42
Scope ................................................................................................................................................... 44
Site Selection Criteria ....................................................................................................................... 46
4.5.1 Macro Scale ......................................................................................................................................................... 46
4.5.2 Micro Scale .......................................................................................................................................................... 46
19.1055.FR1V2 Page viii
Technology and Systems ................................................................................................................ 46
Case study: Background air quality monitoring in the United Kingdom ........................... 48
5. CANADA .............................................................................................................................................. 51
Definitions and Classifications ...................................................................................................... 51
Purposes .............................................................................................................................................. 51
Scales ................................................................................................................................................... 52
Scope ................................................................................................................................................... 53
Site Selection Criteria ....................................................................................................................... 54
5.5.1 Macro Scale ......................................................................................................................................................... 54
5.5.2 Micro Scale .......................................................................................................................................................... 56
Technology and Systems ................................................................................................................ 56
6. SUMMARY AND CONCLUSIONS .................................................................................................. 59
7. REFERENCES ....................................................................................................................................... 67
19.1055.FR1V2 Page ix
Tables
Table 1 Summary of potential study air quality monitoring networks 12
Table 2 Selection of the study network jurisdiction 13
Table 3 List of acronyms used throughout report 14
Table 4 Recommended sampling inlet positioning criteria (AS/NZS 3580.1.1:2016) 19
Table 5 Recommended minimum distances between neighbourhood and background stations
and roads (AS/NZS 3580.1.1:2016) 21
Table 6 Approved methods for air quality monitoring under the AAQ NEPM 22
Table 7 Relationship between site types and scales of representativeness 25
Table 8 Summary of spatial scales for SLAMS, NCore, PAMS and Open Path (OP) sites 26
Table 9 Approved methods for air quality monitoring under the US CAA 35
Table 10 Operational criteria for FRM 36
Table 11 Macroscale siting classification – CAFE Directive 43
Table 12 CAFÉ Directive - data quality objectives 47
Table 13 Monitoring strategy for the CWS for PM and ozone (CCME, 2011) 52
Table 14 CAPMoN network requirements (precipitation constituents and ozone) 53
Table 15 CAPMoN station and probe siting criteria (CCME, 2011) 55
Table 16 NAPS network sample probe siting criteria (CCME, 2011) 56
Table 17 Comparison of definitions 62
Table 18 Comparison of purposes 63
Table 19 Comparison of macro scale siting criteria 64
Table 20 Comparison of micro scale siting criteria 65
Table 21 Comparison of monitoring methods 66

19.1055.FR1V2 Page x
This page has been left intentionally blank
19.1055.FR1V2 INTRODUCTION Page 11
1. INTRODUCTION
NSW Government Office of Environment and Heritage (OEH) has engaged Northstar Air Quality Pty Ltd
(Northstar) to perform a review of international best practice or guidance in the design of a background air
quality monitoring station (BAQMS) (ref: OEH-CAS01-2019). This review will be used, in conjunction with
numerous other studies and considerations, by OEH as due diligence for the scope, design, siting and
performance of BAQMS in NSW.
Purpose of the Report
As advised by OEH:
“In July 2017, the NSW Environment Minister announced that NSW Government will establish background air quality monitoring as part of the NSW Government’s Clean Air Summit commitments. OEH are commencing the design and site selection for a background station. To provide assurance that our design criteria are like or exceed international best practice, the OEH requires a best practice review of background air quality monitoring station design.
An OEH project group is tasked to oversee this tender, which seeks to review international best practice or
guidance in background air quality monitoring network (AQMN) design and covering monitoring scope
(pollutants, purpose, extent of monitoring, etc.).”
Study Outline
The scope of the study is required to consider:
“(1) what is done elsewhere…; (2) pollutants monitored in addition to NEPM criteria pollutants, and meteorological parameters measured; (3) monitoring purposes other than compliance and trend reporting; (4) criteria for site selection; and, (5) monitoring systems and technologies available for background monitoring purposes, if any.”
The review is to be performed in consideration of, but not limited to, the following:
• European Commission legislation;
• US EPA Monitoring Regulation;
• National Environment Protection (Ambient Air Quality) Measure (2015);
• Peer Review Committee of the National Environment Protection (Ambient Air Quality) Measure Technical
Papers; and
• OEH Scientific Rigour Position Statement.
The review is to include guidelines from:
• United States Environmental Protection Agency (US EPA);
• European Union (EU); and
• One other Organisation for Economic Co-operation and Development (OECD) country.
19.1055.FR1V2 INTRODUCTION Page 12
Selection of International Case Studies
The scope of work requires the assessment to review the monitoring networks implemented by the United
States Environmental Protection Authority (US EPA), the European Union (EU) and a third (unspecified)
monitoring network operated by an Organisation for Economic Co-operation and Development (OECD)
member country.
As the objective of this study is to review best practice and guidance for BAQMS, and understand how it can
be implemented to air quality monitoring network review and design in Australia (and specifically NSW), the
selection of the third study area needs to be relevant to the situation as exists in NSW in terms of scope, size,
application and serving a population with similar characteristics to NSW.
A number of options were identified including the monitoring networks in Canada, Japan, South Africa and
Singapore.
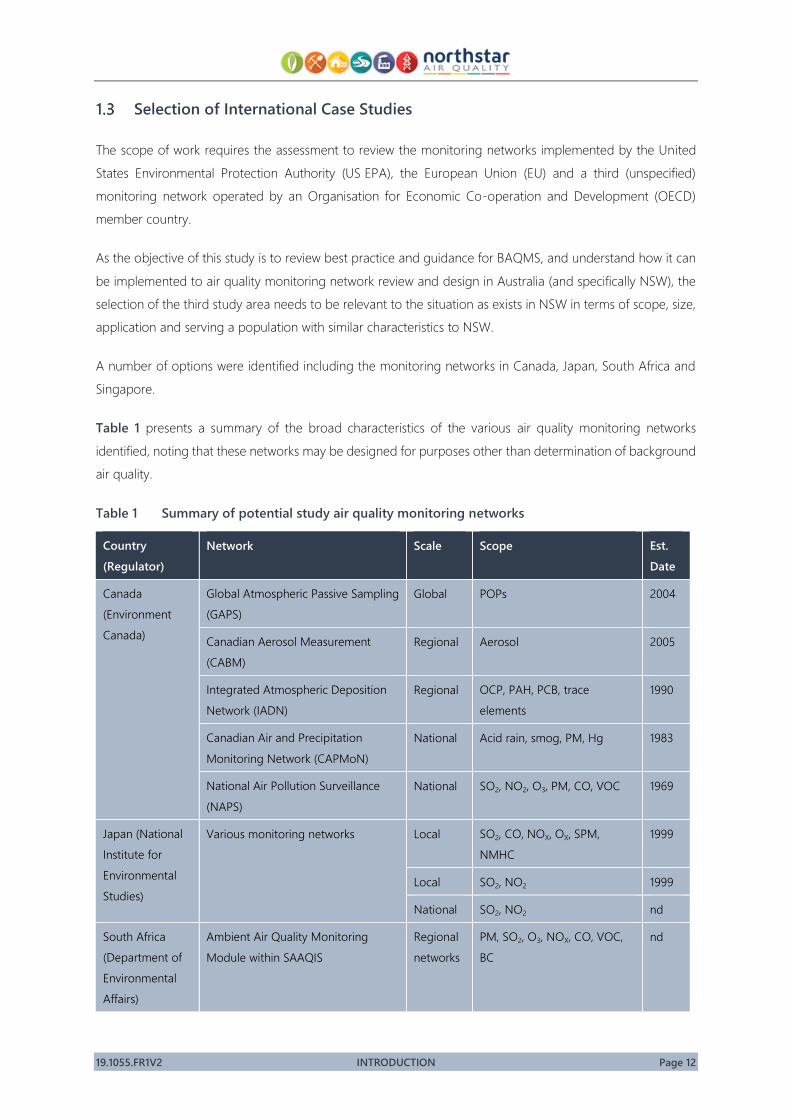
Table 1 presents a summary of the broad characteristics of the various air quality monitoring networks
identified, noting that these networks may be designed for purposes other than determination of background
air quality.
Table 1 Summary of potential study air quality monitoring networks
Country
(Regulator)
Network Scale Scope Est.
Date
Canada
(Environment
Canada)
Global Atmospheric Passive Sampling
(GAPS)
Global POPs 2004
Canadian Aerosol Measurement
(CABM)
Regional Aerosol 2005
Integrated Atmospheric Deposition
Network (IADN)
Regional OCP, PAH, PCB, trace
elements
1990
Canadian Air and Precipitation
Monitoring Network (CAPMoN)
National Acid rain, smog, PM, Hg 1983
National Air Pollution Surveillance
(NAPS)
National SO2, NO2, O3, PM, CO, VOC 1969
Japan (National
Institute for
Environmental
Studies)
Various monitoring networks Local SO2, CO, NOX, OX, SPM,
NMHC
1999
Local SO2, NO2 1999
National SO2, NO2 nd
South Africa
(Department of
Environmental
Affairs)
Ambient Air Quality Monitoring
Module within SAAQIS
Regional
networks
PM, SO2, O3, NOX, CO, VOC,
BC
nd
19.1055.FR1V2 INTRODUCTION Page 13
Country
(Regulator)
Network Scale Scope Est.
Date
Singapore
(National
Environment
Agency)
Various monitoring networks SO2, NOX, CO, O3, HC, PM10 nd
VOCs nd
Notes: See Table 3
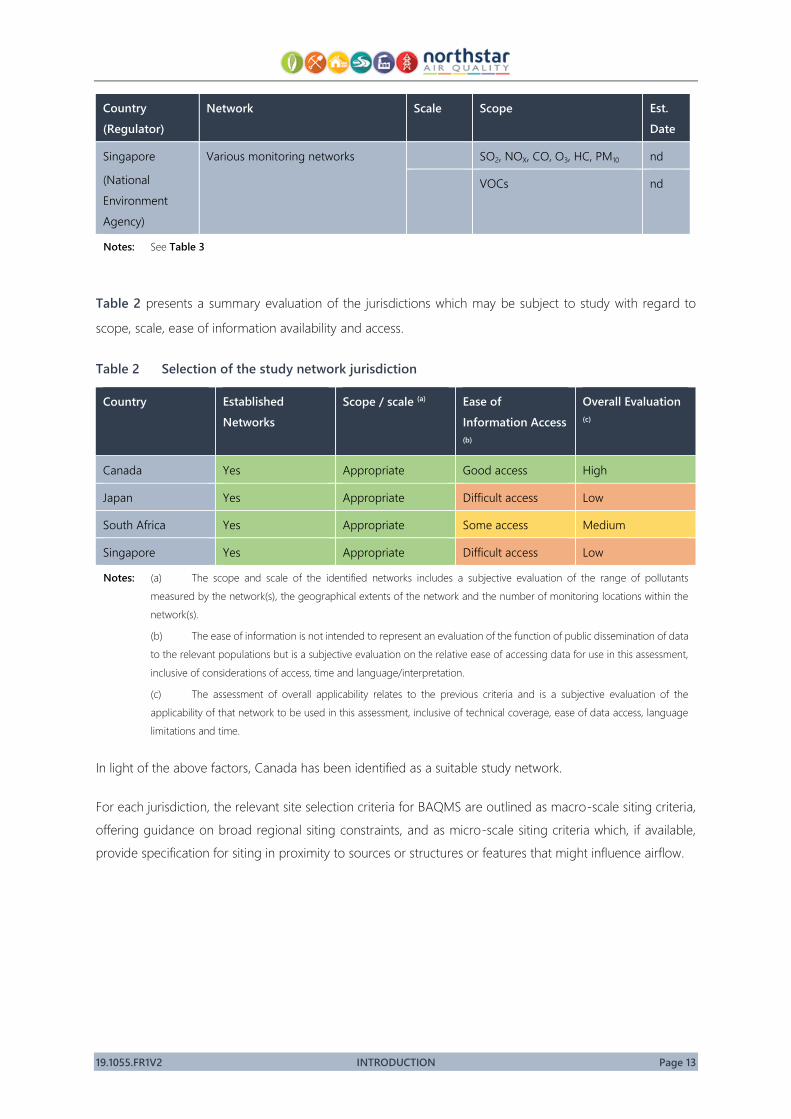
Table 2 presents a summary evaluation of the jurisdictions which may be subject to study with regard to
scope, scale, ease of information availability and access.
Table 2 Selection of the study network jurisdiction
Country Established
Networks
Scope / scale (a) Ease of
Information Access
(b)
Overall Evaluation
(c)
Canada Yes Appropriate Good access High
Japan Yes Appropriate Difficult access Low
South Africa Yes Appropriate Some access Medium
Singapore Yes Appropriate Difficult access Low
Notes: (a) The scope and scale of the identified networks includes a subjective evaluation of the range of pollutants
measured by the network(s), the geographical extents of the network and the number of monitoring locations within the
network(s).
(b) The ease of information is not intended to represent an evaluation of the function of public dissemination of data
to the relevant populations but is a subjective evaluation on the relative ease of accessing data for use in this assessment,
inclusive of considerations of access, time and language/interpretation.
(c) The assessment of overall applicability relates to the previous criteria and is a subjective evaluation of the
applicability of that network to be used in this assessment, inclusive of technical coverage, ease of data access, language
limitations and time.
In light of the above factors, Canada has been identified as a suitable study network.
For each jurisdiction, the relevant site selection criteria for BAQMS are outlined as macro-scale siting criteria,
offering guidance on broad regional siting constraints, and as micro-scale siting criteria which, if available,
provide specification for siting in proximity to sources or structures or features that might influence airflow.
19.1055.FR1V2 INTRODUCTION Page 14
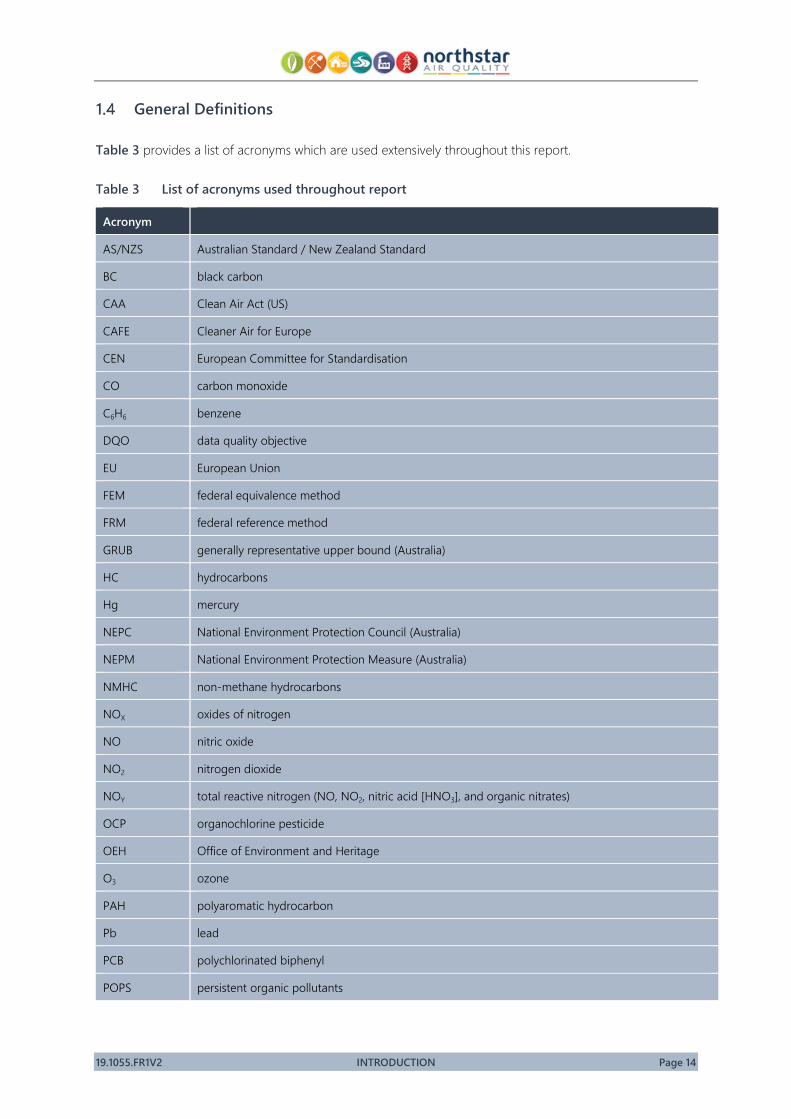
General Definitions
Table 3 provides a list of acronyms which are used extensively throughout this report.
Table 3 List of acronyms used throughout report
Acronym
AS/NZS Australian Standard / New Zealand Standard
BC black carbon
CAA Clean Air Act (US)
CAFE Cleaner Air for Europe
CEN European Committee for Standardisation
CO carbon monoxide
C6H6 benzene
DQO data quality objective
EU European Union
FEM federal equivalence method
FRM federal reference method
GRUB generally representative upper bound (Australia)
HC hydrocarbons
Hg mercury
NEPC National Environment Protection Council (Australia)
NEPM National Environment Protection Measure (Australia)
NMHC non-methane hydrocarbons
NOX oxides of nitrogen
NO nitric oxide
NO2 nitrogen dioxide
NOY total reactive nitrogen (NO, NO2, nitric acid [HNO3], and organic nitrates)
OCP organochlorine pesticide
OEH Office of Environment and Heritage
O3 ozone
PAH polyaromatic hydrocarbon
Pb lead
PCB polychlorinated biphenyl
POPS persistent organic pollutants

19.1055.FR1V2 INTRODUCTION Page 15
Acronym
PM particulate matter
PM2.5 particulate matter with an aerodynamic diameter of less than 2.5 microns
PM10 particulate matter with an aerodynamic diameter of less than 10 microns
PM10-2.5 coarse particulate matter
SPM suspended particulate matter
TSP total suspended particulate
VOC volatile organic compound

19.1055.FR1V2 INTRODUCTION Page 16
This page has been left intentionally blank

19.1055.FR1V2 AUSTRALIA Page 17
2. AUSTRALIA
In Australia, the National Environment Protection (Ambient Air Quality) Measure (AAQ NEPM) requires air
quality monitoring within regions with a population of greater than (>) 25 000 persons, although it does not
restrict monitoring in regions with lower populations. Stations are categorised as Performance Monitoring
Stations (PMS) to measure pollutants which may be experienced by the large majority of the population. A
subset of PMS can be classified as:
a) Generally Representative Upper Bound (GRUB) stations to measure pollutants at the upper bounds of
the concentrations which may be likely to be experienced within a region.
b) Population average sites to measure air quality experienced by large portions of the populated area
and of the total population within a region.
c) Trend stations sufficient to monitor and assess long term changes in ambient air quality in different
parts of the jurisdiction. Trend stations must be operated for one or more decades.
Given the above categorisations, and the requirement of air quality monitoring for the purposes of the AAQ
NEPM to be representative of populated areas, no monitoring of ‘background’ or ‘regional’ air quality
concentrations are required.
For the purposes of some studies (such as the Port Hedland Air Quality Health Risk Assessment (Government
of Western Australia Department of Health, 2016)), monitoring stations representing ‘regional background’
have been commissioned. The background nature of such stations is often justified by the distance to
industrial activities and populations although no criteria are provided for the siting and commissioning of such
stations.
Australian/New Zealand Standard (AS/NZS) 3580.1.1:2016 - Methods for sampling and analysis of ambient air
– Part 1.1: Guide to siting air monitoring equipment outlines the methodology for siting ambient air monitoring
equipment. Some of the material in the Standard is derived from 40 CFR Part 58 (see Section 3).
Within AS/NZS 3580.1.1:2016, monitoring site are noted as being classifiable as one of the following definitions:
1. Peak site
Peak sites are located where the highest concentrations and exposure are expected to occur, e.g. near roads, in the CBD or near industrial sources. These sites are especially useful for air quality compliance monitoring and source monitoring.
2. Neighbourhood site
Neighbourhood sites are located in areas which typify a broad area of uniform land use, e.g. residential, industrial and commercial. These sites are especially useful for determining urban air quality trends, compliance with air quality standards and effects of major, non-localised sources of pollutants.
3. Background site
19.1055.FR1V2 AUSTRALIA Page 18
Background sites are located in urban or rural areas to provide information on background levels. Background sites are usually in areas of homogeneous land use and geography. These sites can be especially useful for assessing transportation of pollutants into a region.
These site classifications are described based on functional requirements rather than any requirements in the
Australian National Environment Protection Council (NEPC), US EPA and New Zealand Ministry for the
Environment classifications.
In NSW, no formal categorisation of air quality monitoring stations is performed or required at the present
time. Therefore, no discussion can be provided on the purposes, scales and scope of that monitoring.
Site Selection Criteria
Australian/New Zealand Standard (AS/NZS) 3580.1.1:2016 - Methods for sampling and analysis of ambient air
– Part 1.1: Guide to siting air monitoring equipment outlines the methodology for siting ambient air monitoring
equipment. Some of the material in the Australian Standard is derived from 40 CFR Part 58 (see Section 3).
All of the requirements presented below are applicable to BAQMS. AS/NZS 3580.1.1:2016 does not generally
differentiate between types of monitoring stations, apart from the slight variations in macro scale criteria
outlined in Section 2.1.1.
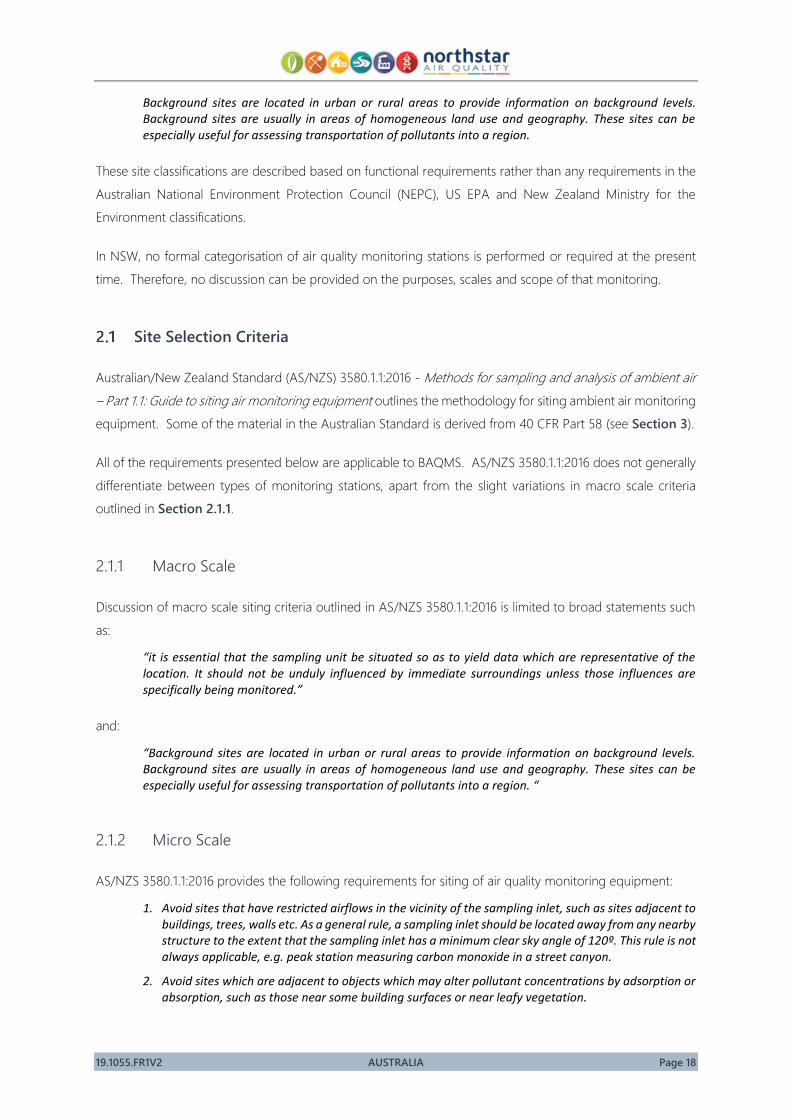
2.1.1 Macro Scale
Discussion of macro scale siting criteria outlined in AS/NZS 3580.1.1:2016 is limited to broad statements such
as:
“it is essential that the sampling unit be situated so as to yield data which are representative of the location. It should not be unduly influenced by immediate surroundings unless those influences are specifically being monitored.”
and:
“Background sites are located in urban or rural areas to provide information on background levels. Background sites are usually in areas of homogeneous land use and geography. These sites can be especially useful for assessing transportation of pollutants into a region. “
2.1.2 Micro Scale
AS/NZS 3580.1.1:2016 provides the following requirements for siting of air quality monitoring equipment:
1. Avoid sites that have restricted airflows in the vicinity of the sampling inlet, such as sites adjacent to buildings, trees, walls etc. As a general rule, a sampling inlet should be located away from any nearby structure to the extent that the sampling inlet has a minimum clear sky angle of 120º. This rule is not always applicable, e.g. peak station measuring carbon monoxide in a street canyon.
2. Avoid sites which are adjacent to objects which may alter pollutant concentrations by adsorption or absorption, such as those near some building surfaces or near leafy vegetation.
19.1055.FR1V2 AUSTRALIA Page 19
3. Avoid sites where chemical interference with the pollutant being measured may occur, e.g. emissions from motor vehicles may interfere with ozone measurements, ammonia from a refrigeration plant may interfere with acid gases measurements.
4. Avoid sites where physical interference may produce atypical results, e.g. measuring particulate matter near domestic or commercial incinerators, electrical interference to sampling equipment from nearby high voltage power lines.
5. Ground level sampling sites (sample inlet less than 5 m above ground level) are generally preferable in low or sparsely built up areas. Elevated sampling sites may be acceptable for a number of purposes in moderate to high density areas (in terms of structures).
6. Sampling sites should not be affected by extraneous local emissions.
7. Local activities around a sampling site may change its suitability as a site, either temporarily or permanently, e.g. demolition or construction activities, re-routing of motor vehicle traffic.
Other considerations are as follows:
i. Seek sites that are secure and have low potential for vandalism.
ii. Seek sites that have adequate access for transporting equipment, e.g. instruments, cylinders of calibration gas.
iii. Seek sites that have adequate and reliable electricity supply.
iv. Seek sites that are not prone to natural disasters, e.g. flooding.
v. Seek sites that have adequate and reliable communication services.
vi. Seek sites where noise levels generated by pumps or air conditioners or maintenance and calibration activities do not impose on the local residents/population.
vii. Seek sites where access times are aligned with the intended capture rates.
viii. Seek site where personnel will be able to perform their activities in a safe and secure environment in accordance with OHS regulatory requirements.
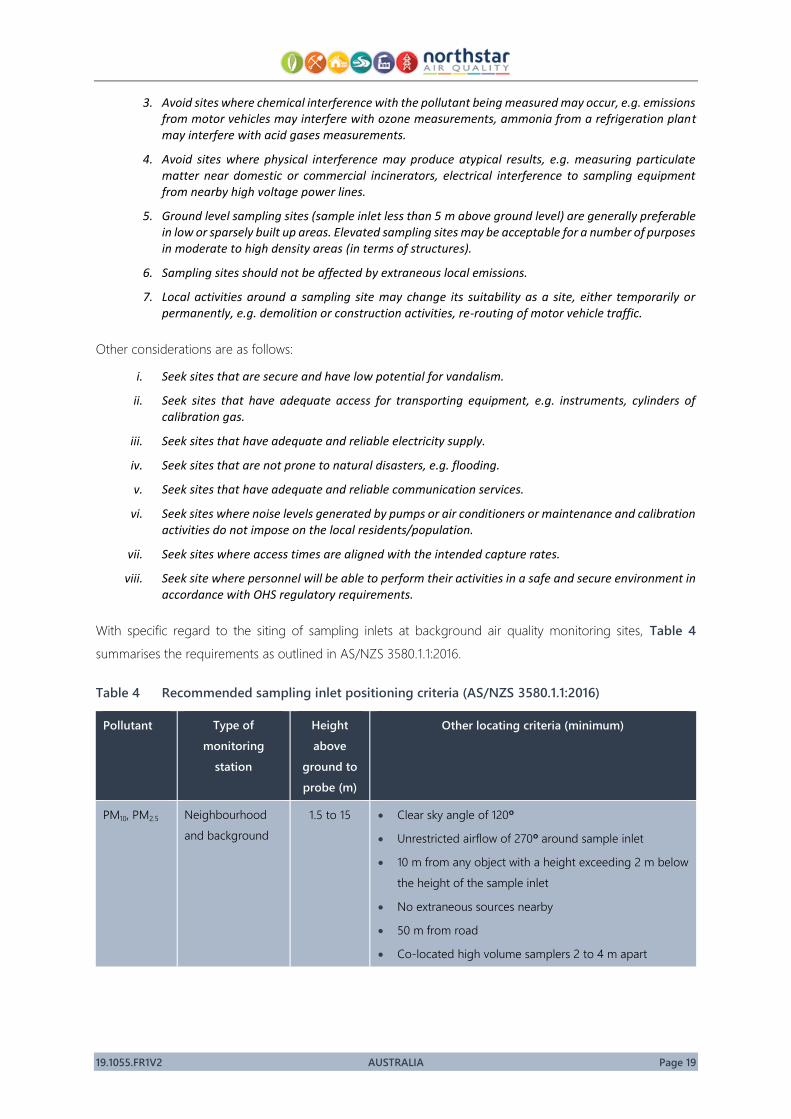
With specific regard to the siting of sampling inlets at background air quality monitoring sites, Table 4
summarises the requirements as outlined in AS/NZS 3580.1.1:2016.
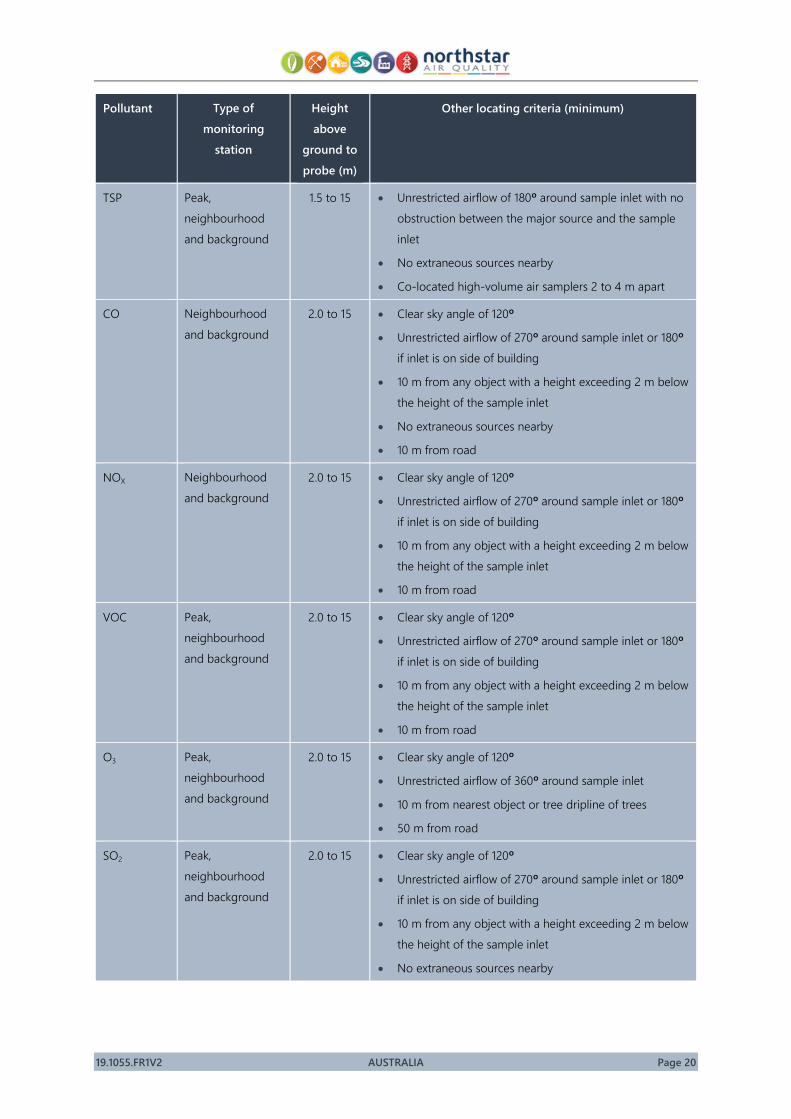
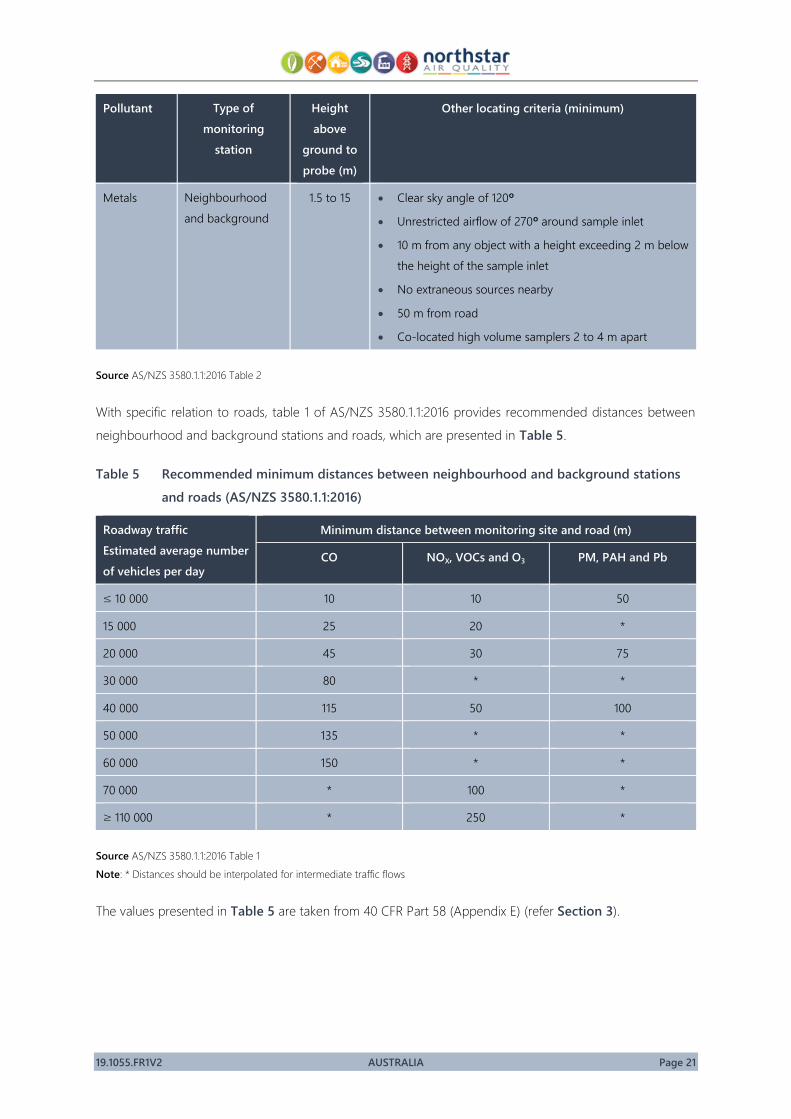
Table 4 Recommended sampling inlet positioning criteria (AS/NZS 3580.1.1:2016)
Pollutant Type of
monitoring
station
Height
above
ground to
probe (m)
Other locating criteria (minimum)
PM10, PM2.5 Neighbourhood
and background
1.5 to 15 • Clear sky angle of 120º
• Unrestricted airflow of 270º around sample inlet
• 10 m from any object with a height exceeding 2 m below
the height of the sample inlet
• No extraneous sources nearby
• 50 m from road
• Co-located high volume samplers 2 to 4 m apart
19.1055.FR1V2 AUSTRALIA Page 20
Pollutant Type of
monitoring
station
Height
above
ground to
probe (m)
Other locating criteria (minimum)
TSP Peak,
neighbourhood
and background
1.5 to 15 • Unrestricted airflow of 180º around sample inlet with no
obstruction between the major source and the sample
inlet
• No extraneous sources nearby
• Co-located high-volume air samplers 2 to 4 m apart
CO Neighbourhood
and background
2.0 to 15 • Clear sky angle of 120º
• Unrestricted airflow of 270º around sample inlet or 180º
if inlet is on side of building
• 10 m from any object with a height exceeding 2 m below
the height of the sample inlet
• No extraneous sources nearby
• 10 m from road
NOX Neighbourhood
and background
2.0 to 15 • Clear sky angle of 120º
• Unrestricted airflow of 270º around sample inlet or 180º
if inlet is on side of building
• 10 m from any object with a height exceeding 2 m below
the height of the sample inlet
• 10 m from road
VOC Peak,
neighbourhood
and background
2.0 to 15 • Clear sky angle of 120º
• Unrestricted airflow of 270º around sample inlet or 180º
if inlet is on side of building
• 10 m from any object with a height exceeding 2 m below
the height of the sample inlet
• 10 m from road
O3 Peak,
neighbourhood
and background
2.0 to 15 • Clear sky angle of 120º
• Unrestricted airflow of 360º around sample inlet
• 10 m from nearest object or tree dripline of trees
• 50 m from road
SO2 Peak,
neighbourhood
and background
2.0 to 15 • Clear sky angle of 120º
• Unrestricted airflow of 270º around sample inlet or 180º
if inlet is on side of building
• 10 m from any object with a height exceeding 2 m below
the height of the sample inlet
• No extraneous sources nearby
19.1055.FR1V2 AUSTRALIA Page 21
Pollutant Type of
monitoring
station
Height
above
ground to
probe (m)
Other locating criteria (minimum)
Metals Neighbourhood
and background
1.5 to 15 • Clear sky angle of 120º
• Unrestricted airflow of 270º around sample inlet
• 10 m from any object with a height exceeding 2 m below
the height of the sample inlet
• No extraneous sources nearby
• 50 m from road
• Co-located high volume samplers 2 to 4 m apart
Source AS/NZS 3580.1.1:2016 Table 2
With specific relation to roads, table 1 of AS/NZS 3580.1.1:2016 provides recommended distances between
neighbourhood and background stations and roads, which are presented in Table 5.
Table 5 Recommended minimum distances between neighbourhood and background stations
and roads (AS/NZS 3580.1.1:2016)
Roadway traffic
Estimated average number
of vehicles per day
Minimum distance between monitoring site and road (m)
CO NOX, VOCs and O3 PM, PAH and Pb
≤ 10 000 10 10 50
15 000 25 20 *
20 000 45 30 75
30 000 80 * *
40 000 115 50 100
50 000 135 * *
60 000 150 * *
70 000 * 100 *
≥ 110 000 * 250 *
Source AS/NZS 3580.1.1:2016 Table 1
Note: * Distances should be interpolated for intermediate traffic flows
The values presented in Table 5 are taken from 40 CFR Part 58 (Appendix E) (refer Section 3).
19.1055.FR1V2 AUSTRALIA Page 22
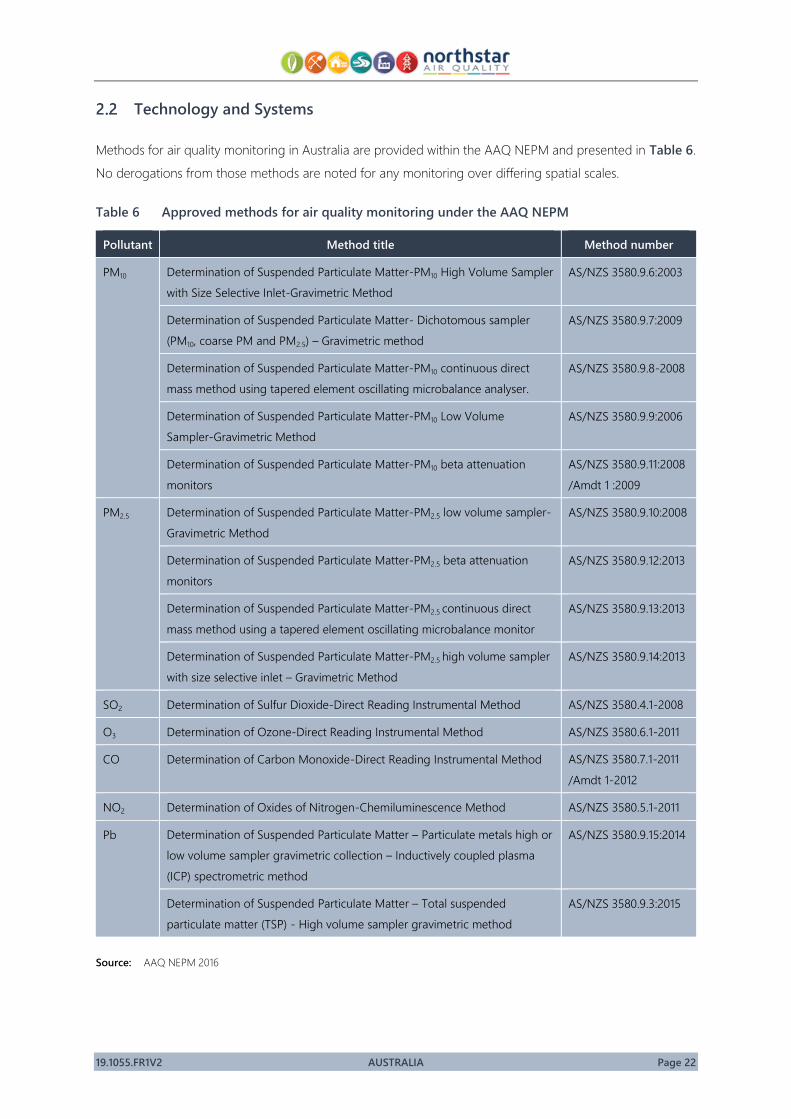
Technology and Systems
Methods for air quality monitoring in Australia are provided within the AAQ NEPM and presented in Table 6.
No derogations from those methods are noted for any monitoring over differing spatial scales.
Table 6 Approved methods for air quality monitoring under the AAQ NEPM
Pollutant Method title Method number
PM10 Determination of Suspended Particulate Matter-PM10 High Volume Sampler
with Size Selective Inlet-Gravimetric Method
AS/NZS 3580.9.6:2003
Determination of Suspended Particulate Matter- Dichotomous sampler
(PM10, coarse PM and PM2.5) – Gravimetric method
AS/NZS 3580.9.7:2009
Determination of Suspended Particulate Matter-PM10 continuous direct
mass method using tapered element oscillating microbalance analyser.
AS/NZS 3580.9.8-2008
Determination of Suspended Particulate Matter-PM10 Low Volume
Sampler-Gravimetric Method
AS/NZS 3580.9.9:2006
Determination of Suspended Particulate Matter-PM10 beta attenuation
monitors
AS/NZS 3580.9.11:2008
/Amdt 1 :2009
PM2.5 Determination of Suspended Particulate Matter-PM2.5 low volume sampler-
Gravimetric Method
AS/NZS 3580.9.10:2008
Determination of Suspended Particulate Matter-PM2.5 beta attenuation
monitors
AS/NZS 3580.9.12:2013
Determination of Suspended Particulate Matter-PM2.5 continuous direct
mass method using a tapered element oscillating microbalance monitor
AS/NZS 3580.9.13:2013
Determination of Suspended Particulate Matter-PM2.5 high volume sampler
with size selective inlet – Gravimetric Method
AS/NZS 3580.9.14:2013
SO2 Determination of Sulfur Dioxide-Direct Reading Instrumental Method AS/NZS 3580.4.1-2008
O3 Determination of Ozone-Direct Reading Instrumental Method AS/NZS 3580.6.1-2011
CO Determination of Carbon Monoxide-Direct Reading Instrumental Method AS/NZS 3580.7.1-2011
/Amdt 1-2012
NO2 Determination of Oxides of Nitrogen-Chemiluminescence Method AS/NZS 3580.5.1-2011
Pb Determination of Suspended Particulate Matter – Particulate metals high or
low volume sampler gravimetric collection – Inductively coupled plasma
(ICP) spectrometric method
AS/NZS 3580.9.15:2014
Determination of Suspended Particulate Matter – Total suspended
particulate matter (TSP) - High volume sampler gravimetric method
AS/NZS 3580.9.3:2015
Source: AAQ NEPM 2016
19.1055.FR1V2 UNITED STATES Page 23
3. UNITED STATES
The key legislation in the United States of America regarding the design of ambient air quality monitoring
networks is the Clean Air Act (CAA) (2004).
State air pollution control agencies, owners or operators of sources are required to operate air quality
monitoring networks as per the requirements of Title 40, Chapter I, Subchapter C, Part 58 (40 CFR Part 58)
‘Ambient Air Quality Surveillance’. 40 CFR Part 58 contains requirements for measuring and reporting ambient
air quality and related information, including:
• Appendix C of 40 CFR Part 58 specifies the criteria pollutant monitoring methods which must be used in
the ‘SLAMS’ AQMN and ‘NCore’ AQMN stations (see Section 3.2). NCore is noted as a subset of the
SLAMS network.
• Appendix D of 40 CFR Part 58 provides a useful summary of the design criteria for the various monitoring
components of the AQMNs. These criteria are discussed in detail in Section 3.2.
• Appendix E of 40 CFR Part 58 provides specific location criteria applicable to SLAMS, NCore and PAMS
air quality monitoring stations. These criteria are discussed in detail in Section 3.5.
Definitions and Classifications
The various monitoring networks under the CAA (refer to Section 3.2) must be designed to deliver the
objectives for the monitoring which may include providing information to communities, reporting compliance
with ambient air quality standards, emission control programs and providing data for research on human
health and environmental management. To that end, the requirements of the collected data may directly
influence the AQMN to include:
1. Sites located to determine the highest concentrations expected to occur in the area covered by the network;
2. Sites located to measure typical concentrations in areas of high population density;
3. Sites located to determine the impact of significant sources or source categories on air quality;
4. Sites located to determine general background concentration levels;
5. Sites located to determine the extent of regional pollutant transport among populated areas; and in support of secondary standards; and,
6. Sites located to measure air pollution impacts on visibility, vegetation damage, or other welfare-based impacts.”
It is noted that US EPA also utlise the terminology of Policy Relevant Background (PRB), which they define as
(in the case of O3):
"the distribution of O3 concentrations that would be observed in the U.S. in the absence of anthropogenic (man-made) emissions of precursor emissions (e.g., VOC, NOX, and CO) in the U.S., Canada, and Mexico."
19.1055.FR1V2 UNITED STATES Page 24
The purpose of this review is not to provide information to allow the location of operation of a ‘baseline’
monitoring station (e.g. Cape Grimm) and therefore the definitions of ‘background’ are taken from the CAA
and associated documentation.
Purposes
Air quality monitoring is required under 40 CFR Part 58 to assess compliance against the National Ambient
Air Quality Standards (NAAQS), emergency control, real time reporting, trends analysis, and research. Several
monitoring networks provide data to assess compliance and these include:
• SLAMS: A network of State or Local Air Monitoring Stations (SLAMS). The SLAMS make up the ambient
air quality monitoring sites that are primarily needed for NAAQS comparisons, but may serve other /
further purposes. SLAMS exclude special purpose monitor (SPM) stations and include NCore, PAMS, and
all other State or locally operated stations that have not been designated as SPM stations.
• NCore: National Core multipollutant monitoring stations (NCore). This network measures particles (PM2.5,
speciated PM2.5, PM10-2.5), O3, SO2, CO, (NO/NO2/NOY), Pb, and basic meteorology. NCore measures
multiple pollutants in order to provide support to integrated air quality management data needs. NCore
sites include both ‘neighbourhood’ and ‘urban’ scale measurements (see Table 7) in general, in a
selection of metropolitan areas and a limited number of more rural locations. Continuous monitoring
methods are to be used at the NCore sites when available for a pollutant to be measured, as it is important
to have data collected over common time periods for integrated analyses. NCore multipollutant sites are
intended to be long-term sites useful for a variety of applications including air quality trends analyses,
model evaluation, and tracking metropolitan area statistics. As such, the NCore sites are required to be
placed away from direct emission sources that could substantially impact the ability to detect area-wide
concentrations.
• PAMS: Photochemical Assessment Monitoring Stations. These are required in serious, severe and
extreme O3 nonattainment areas.
• PM2.5 Chemical Speciation Network (CSN) consists of the Speciation Trends Network (STN) sites
and supplemental speciation sites which, in part, aid in the interpretation of health studies by linking
effects to PM2.5 constituents.
• National Air Toxic Trend Stations (NATTS): These stations monitor hazardous air pollutants or air
toxics.
• Special Purpose Monitors: (SPM) stations are designated as a special purpose monitor station in the US
EPAs monitoring network plan and in the Air Quality System, and which the US EPA does not count when
showing compliance with the minimum requirements of this subpart for the number and siting of
monitors of various types.
Under 40 CFR Part 51.308, States are required to address the ‘regional haze program requirements’ through
the submission of a monitoring strategy for measuring, characterising, and reporting of regional haze visibility
impairment (‘the Regional Haze Rule’).
19.1055.FR1V2 UNITED STATES Page 25
Scales
Given the focus of this review is the experience of other jurisdictions in implementing ‘background’ air quality
monitoring, those sites which are located to determine highest concentrations, typical concentrations in areas
of high population density, and significant source impacts are not considered further. The review focusses on
those sites located to measure background air pollutant concentrations, and the extent of regional transport.
40 CFR Part 58 (Appendix D) provides a description of the ‘scales of representativeness’ for the monitoring
sites described in Section 3.1:
1. Microscale—Defines the concentrations in air volumes associated with area dimensions ranging from several meters up to about 100 meters (m).
2. Middle scale—Defines the concentration typical of areas up to several city blocks in size with dimensions ranging from about 100 m to 0.5 kilometers (km).
3. Neighbourhood scale—Defines concentrations within some extended area of the city that has relatively uniform land use with dimensions in the 0.5 km to 4.0 km range. The neighbourhood and urban scales listed below have the potential to overlap in applications that concern secondarily formed or homogeneously distributed air pollutants.
4. Urban scale—Defines concentrations within an area of city-like dimensions, on the order of 4 km to 50 km. Within a city, the geographic placement of sources may result in there being no single site that can be said to represent air quality on an urban scale.
5. Regional scale—Defines usually a rural area of reasonably homogeneous geography without large sources, and extends from tens to hundreds of kilometres.
6. National and global scales—These measurement scales represent concentrations characterizing the nation and the globe as a whole.
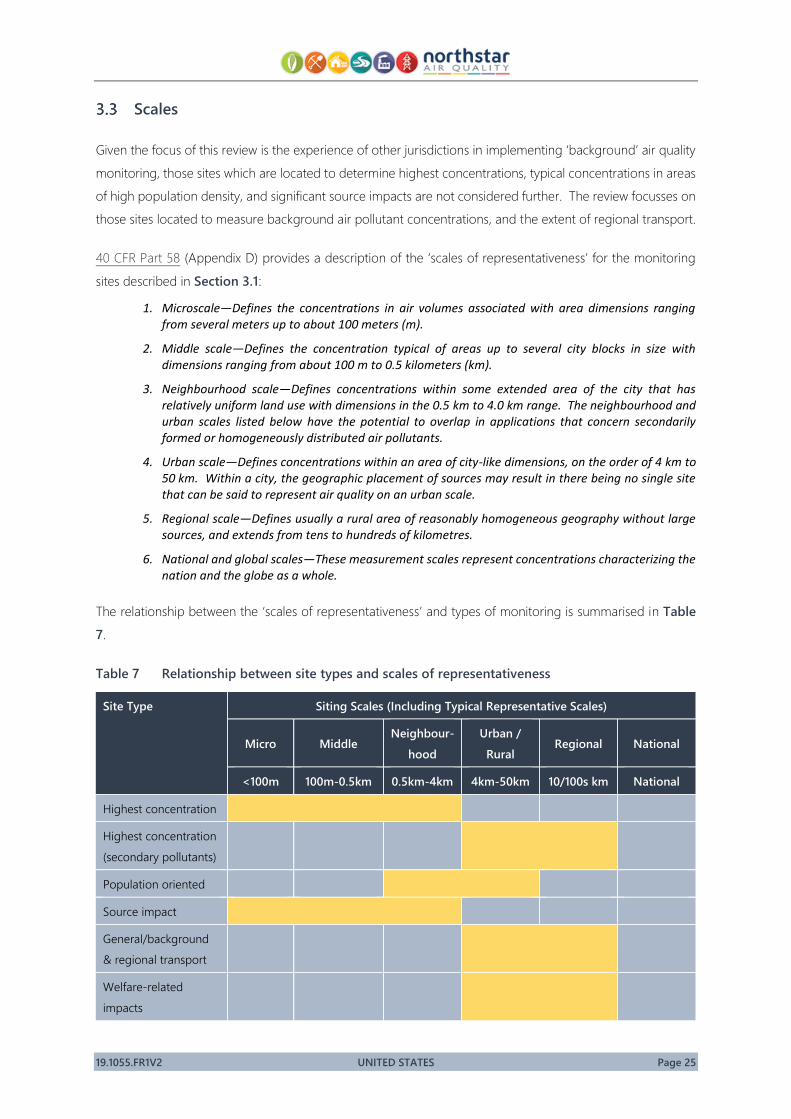
The relationship between the ‘scales of representativeness’ and types of monitoring is summarised in Table
7.
Table 7 Relationship between site types and scales of representativeness
Site Type Siting Scales (Including Typical Representative Scales)
Micro Middle Neighbour-
hood
Urban /
Rural Regional National
<100m 100m-0.5km 0.5km-4km 4km-50km 10/100s km National
Highest concentration
Highest concentration
(secondary pollutants)
Population oriented
Source impact
General/background
& regional transport
Welfare-related
impacts
19.1055.FR1V2 UNITED STATES Page 26
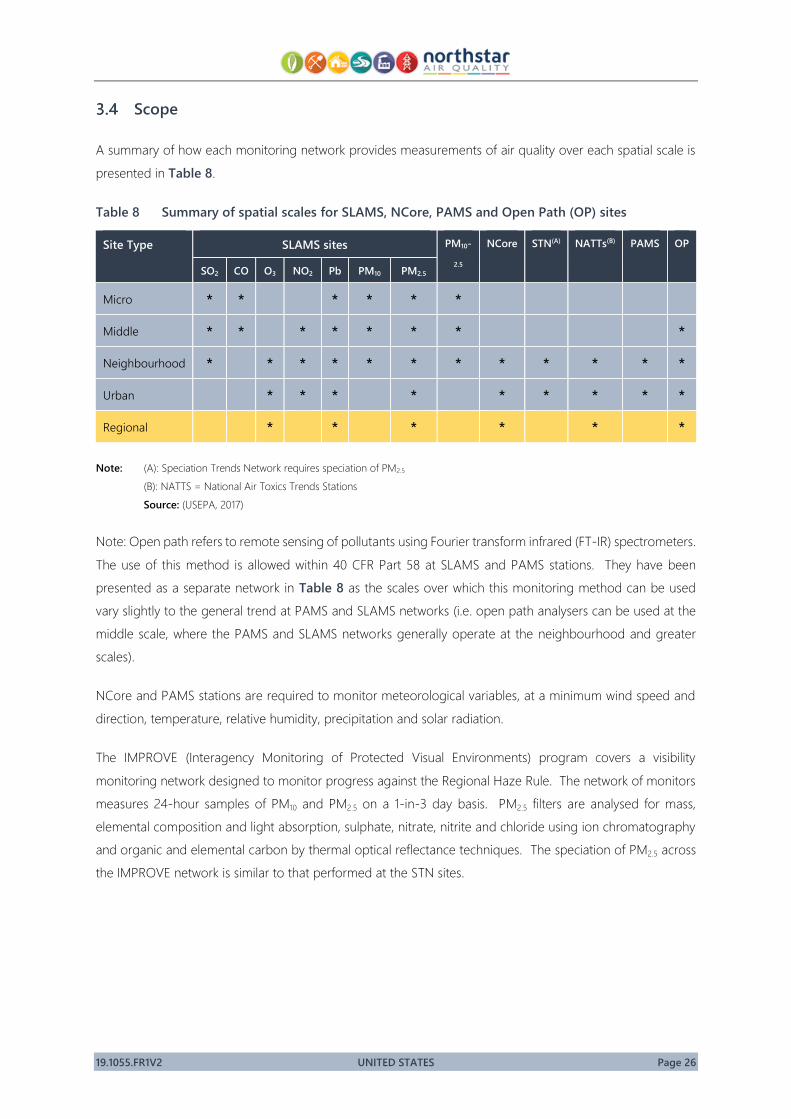
Scope
A summary of how each monitoring network provides measurements of air quality over each spatial scale is
presented in Table 8.
Table 8 Summary of spatial scales for SLAMS, NCore, PAMS and Open Path (OP) sites
Site Type SLAMS sites PM10-
2.5
NCore STN(A) NATTs(B) PAMS OP
SO2 CO O3 NO2 Pb PM10 PM2.5
Micro * * * * * *
Middle * * * * * * * *
Neighbourhood * * * * * * * * * * * *
Urban * * * * * * * * *
Regional * * * * * *
Note: (A): Speciation Trends Network requires speciation of PM2.5
(B): NATTS = National Air Toxics Trends Stations
Source: (USEPA, 2017)
Note: Open path refers to remote sensing of pollutants using Fourier transform infrared (FT-IR) spectrometers.
The use of this method is allowed within 40 CFR Part 58 at SLAMS and PAMS stations. They have been
presented as a separate network in Table 8 as the scales over which this monitoring method can be used
vary slightly to the general trend at PAMS and SLAMS networks (i.e. open path analysers can be used at the
middle scale, where the PAMS and SLAMS networks generally operate at the neighbourhood and greater
scales).
NCore and PAMS stations are required to monitor meteorological variables, at a minimum wind speed and
direction, temperature, relative humidity, precipitation and solar radiation.
The IMPROVE (Interagency Monitoring of Protected Visual Environments) program covers a visibility
monitoring network designed to monitor progress against the Regional Haze Rule. The network of monitors
measures 24-hour samples of PM10 and PM2.5 on a 1-in-3 day basis. PM2.5 filters are analysed for mass,
elemental composition and light absorption, sulphate, nitrate, nitrite and chloride using ion chromatography
and organic and elemental carbon by thermal optical reflectance techniques. The speciation of PM2.5 across
the IMPROVE network is similar to that performed at the STN sites.
19.1055.FR1V2 UNITED STATES Page 27
Site Selection Criteria
3.5.1 Macro Scale
Rural NCore stations are required to be located to the maximum extent practicable at a regional or larger
scale away from any large local emissions source, so that they represent ambient concentrations over an
extensive area.
The following outlines macro scale pollutant specific siting criteria contained within 40 CFR Part 58. Siting
criteria associated with regional measurement f particulate through the IMPROVE program are also indicated
where relevant.
Fine particulate matter (PM2.5)
In Appendix D of 40 CFR Part 58, the maximum scale of which PM2.5 monitoring is discussed is at the regional
scale (10’s to 100’s of kilometres). Using representative conditions for an area implies a level of homogeneity
in that area and for that reason, regional scale measurements are applicable to generally sparsely populated
areas. Data collected on this scale would provide information on larger scale processes of particulate
emissions, losses and transport.
Appendix D of 40 CFR Part 58 states that the development of effective pollution control strategies requires
an understanding at regional geographic scales of the emission sources and atmospheric processes that are
responsible for elevated PM2.5 levels and may also be associated with elevated O3 and regional haze.
Data is required at this scale to provide information regarding trends and compliance with standards given
that they represent areas where people commonly live and work for extended periods.
Regional PM2.5 measurements are made at IMPROVE sites across the US (refer Section 3.4). The standard
operating procedure (UCDavis, 2017a) for IMPROVE sites outlines the site requirements associated with macro
scale siting criteria as:
“The site must:
..
• be located at a site where aerosols are representative of regional, not local, visibility conditions.
..”
Ozone
Regional scale measurements of O3 are used to typify concentrations over large portions of a metropolitan
areas and even larger areas with dimensions of as much as 100’s of kilometres (i.e. regional scale). Such
measurements are useful in determining the O3 which is transported into and out of a metropolitan area, as
well as background concentrations. Regional scale sites can also be maximum concentration locations when
considering very large metropolitan areas.
19.1055.FR1V2 UNITED STATES Page 28
The determination of a location for a regional scale background O3 monitoring location should be performed
through meteorological analysis and analysis of trajectories and emission patterns.
Regional scale sites may be located to provide data on O3 transport between cities, as background sites, or
for other data collection purposes.
Measurements are required to be made year-round.
Carbon monoxide
In Appendix D of 40 CFR Part 58, the maximum scale of which CO monitoring is discussed is at the
neighbourhood scale (0.5 km to 4 km). Data is required at this scale to support health and scientific research
and for use in modelling.
Lead
In Appendix D of 40 CFR Part 58, the maximum scale of which Pb monitoring is discussed is at the
neighbourhood scale (0.5 km to 4 km). Where a site is located away from immediate Pb sources, the site may
be useful in representing typical air quality values for a larger residential area, and therefore suitable for
population exposure and trends analyses.
Nitrogen dioxide
In Appendix D of 40 CFR Part 58, the maximum scale of which NO2 monitoring is discussed is at the urban
scale (4 km to 50 km). Data is required at this scale to assess trends in area-wide air quality and the
effectiveness of large-scale air pollution control strategies.
Sulphur dioxide
In Appendix D of 40 CFR Part 58, the maximum scale of which SO2 monitoring is discussed is at the urban
scale (4 km to 50 km). Data is required at this scale to estimate concentrations over large portions of an urban
area, to assess trends in area-wide air quality and the effectiveness of large-scale air pollution control
strategies.
Urban scale sites may also support other monitoring objectives such as identifying background concentrations
when monitors are located upwind of local sources.
Particulate matter (PM10)
In Appendix D of 40 CFR Part 58, the maximum scale of which PM10 monitoring is discussed is at the
neighbourhood scale (0.5 km to 4 km). Data is required at this scale to provide information regarding trends
and compliance with standards given that they represent areas where people commonly live and work for
extended periods.
19.1055.FR1V2 UNITED STATES Page 29
Coarse particulate matter (PM10-2.5)
In Appendix D of 40 CFR Part 58, the maximum scale of which coarse particulate monitoring is discussed is at
the neighbourhood scale (0.5 km to 4 km) which would represent conditions throughout some reasonably
homogeneous urban sub-region. Homogeneity refers to particulate matter concentrations as well as the land
use and surface characteristics.
3.5.2 Micro Scale
40 CFR Part 58 (Appendix E) contains siting criteria for probe and monitoring paths. The pollutant-specific
probe and monitoring path siting criteria generally apply to all spatial scales except where noted otherwise.
Horizontal and vertical placement
The probe or at least 80 % of the monitoring path must be located between 2 m and 15 m above ground
level for all O3 and SO2 monitoring sites, and for neighbourhood or larger spatial scale Pb, PM10, PM2.5, NO2,
and CO sites.
Spacing from minor sources
The plume from the local minor sources should not be allowed to inappropriately impact the air quality data
collected at a site. Particulate matter sites should not be located in an unpaved area unless there is vegetative
ground cover year-round, so that the impact of windblown dusts will be kept to a minimum.
Similarly, local sources of nitric oxide (NO) and ozone-reactive hydrocarbons can have a scavenging effect
causing unrepresentatively low concentrations of O3 in the vicinity of probes and monitoring paths for O3. To
minimise these potential interferences, the probe or at least 90 % of the monitoring path must be away from
furnace or incineration flues or other minor sources of SO2 or NO. The separation distance should take into
account the heights of the flues, type of waste or fuel burned, and the sulphur content of the fuel.
Spacing from obstructions
Buildings and other obstacles may possibly scavenge SO2, O3, or NO2, and can act to restrict airflow for any
pollutant. To avoid this interference, the probe, inlet, or at least 90 % of the monitoring path must have
unrestricted airflow and be located away from obstacles. The distance from the obstacle to the probe, inlet,
or monitoring path must be at least twice the height that the obstacle protrudes above the probe, inlet, or
monitoring path.
Special consideration must be given to the use of open path analysers due to their inherent potential sensitivity
to certain types of interferences, or optical obstructions. A monitoring path must be clear of all trees, brush,
buildings, plumes, dust, or other optical obstructions, including potential obstructions that may move due to
wind, human activity, growth of vegetation, etc.
19.1055.FR1V2 UNITED STATES Page 30
Temporary optical obstructions, such as rain, particles, fog, or snow, should be considered when siting an
open path analyser. Any of these temporary obstructions that are of sufficient density to obscure the light
beam will affect the ability of the open path analyser to continuously measure pollutant concentrations.
Transient, but significant obscuration of especially longer measurement paths could occur as a result of certain
meteorological conditions (e.g., heavy fog, rain, snow) and/or aerosol levels that are of a sufficient density to
prevent the open path analyser’s light transmission. If certain compensating measures are not otherwise
implemented at the onset of monitoring (e.g., shorter path lengths, higher light source intensity), data
recovery during periods of greatest primary pollutant potential could be compromised. For instance, if heavy
fog or high particulate levels are coincident with periods of projected NAAQS-threatening pollutant potential,
the representativeness of the resulting data record in reflecting maximum pollutant concentrations may be
substantially impaired despite the fact that the site may otherwise exhibit an acceptable, even exceedingly
high overall valid data capture rate.
Spacing from trees
Trees can provide surfaces for SO2, O3, or NO2 adsorption or reactions, and surfaces for particle deposition.
Trees can also act as obstructions in cases where they are located between the air pollutant sources or source
areas and the monitoring site, and where the trees are of a sufficient height and leaf canopy density to
interfere with the normal airflow around the probe, inlet, or monitoring path.
To reduce this possible interference/obstruction, the probe, inlet, or at least 90 % of the monitoring path must
be at least 10 m or further from the drip line of trees.
The scavenging effect of trees is greater for O3 than for other criteria pollutants. Monitoring agencies are
required to take steps to consider the impact of trees on ozone monitoring sites and take steps to avoid this
problem.
Spacing from roadways
In siting an O3 analyser, it is important to minimise destructive interferences form sources of NO, since NO
readily reacts with O3. A sampling site having a point analyser probe located closer to a roadway Table 5
(replicated from US EPA requirements) should be classified as microscale or middle scale, rather than
neighbourhood or urban scale, since the measurements from such a site would more closely represent the
middle scale.
In siting NO2 monitors for neighbourhood and larger scale monitoring, it is important to minimise near-road
influences. A sampling site having a point analyser probe located closer to a roadway than allowed by the
requirements in Table 5 (replicated from US EPA requirements) should be classified as microscale or middle
scale rather than neighbourhood or urban scale.
19.1055.FR1V2 UNITED STATES Page 31
In siting PM monitors, since emissions associated with the operation of motor vehicles contribute to urban
area particulate matter ambient levels, spacing from roadway criteria are necessary for ensuring national
consistency in PM sampler siting. If the sample is 20 m from the same road, it will be classified as middle
scale; if 40 m, neighbourhood scale; and if 110 m, an urban scale.
Cost benefits, historical trends, and other factors may be used to add support to the site selection criteria,
however, they in themselves, will not be acceptable reasons for granting a waiver.
In specific relation to particulate matter, section 2.2.4 of (USEPA, 1997) provides guidance for the siting of PM10
and PM2.5 monitoring equipment for the purposes of background monitoring.
“Background and Regional Transport Monitoring Background and regional transport (or boundary) monitors are located outside of local air quality jurisdictions to determine how much of the PM at community-oriented sites derives from external sources. Background sites are intended to quantify regionally representative PM2.5 for sites located away from populated areas and other significant emission sources. Transport sites are intended to measure fine particle contributions from upwind source areas, or mixtures of source areas, that move into a planning area.
Most planning areas contain at least one substantial metropolitan area. Several of these also include industrial sources, either concentrated in one or a few districts or dispersed throughout the planning area. Air quality planning areas also contain less developed areas that may be distant from the densely populated centers and industrial emitters. These may include agricultural areas, dormant lands, large parks, wildlife and nature preserves, large military bases, etc.
Transport sites should be located upwind of planning area boundaries, outside of the urban-scale zone of influence. For the most part, transport sites are between planning areas, or between districts containing large emitters (e.g., industrial complexes, isolated point sources) and a planning area. Measurements from transport sites represent transport into the planning area only during periods when the wind is from the direction of the external source area toward the planning area. During other periods, the transport site may also serve the purposes of a background site, or as a transport site for another planning area. For this reason, transport site locations are selected to achieve multiple purposes.
Meteorological data needed to evaluate which purposes are being served should be available along with the PM2.5 measurements. Background monitors are intended to measure PM2.5 concentrations that are not dependent on upwind sources, although the particles they quantify will be a mixture of natural and manmade source material. These stations should be distant from identified emitters, and may be at higher elevations than the urban-scale community exposure monitors.
Current IMPROVE (Interagency Monitoring of Protected Visual Environments) PM2.5 monitoring in National Parks and Wilderness Areas (Eldred et al., 1990) provides the best examples of background monitoring sites, but there is a dearth of these sites in the non-western states.
Properly sited background stations should measure PM2.5 typical of the lowest ambient concentrations in a state or region. These sites should not be along transport pathways, though in densely populated or industrialised regions (such as the northeast corridor) a given sample may or may not be along such a pathway depending on which way the wind is blowing. Several background sites may be needed in large and geographically diverse states, such as California and others in the west, where terrain produces major barriers to atmospheric flow. Regions lacking IMPROVE monitors should determine the proximity of National Parks, Wilderness Areas, and State Preserves as candidates for background sites. Background monitors also contribute to regional visibility goals that are part of other air quality regulations.”
19.1055.FR1V2 UNITED STATES Page 32
Regional PM2.5 measurements are made at IMPROVE sites across the US (refer Section 3.4). The standard
operating procedure (UCDavis, 2017a) for IMPROVE sites outlines the site requirements associated with micro
scale siting criteria as:
“The site must:
• be removed from local sources, such as diesel, wood smoke, automobile emissions, road dust, or construction
• adhere to siting requirements conducive to regional aerosol sampling, including inlet height, an
absence of interference in air flow from trees or buildings in a 30º cone above the sampler, and a
minimum of 270º of free air flow around the sampler
• be secure from potential vandalism
• have an operator available to service the site
• be accessible during all months of the year”
The standard operating procedure (UCDavis, 2017a) for IMPROVE sites also provides general advice in the
location of prospective sites which is relevant to the selection of BAQMS:
“Site selection begins with the process of locating potential sites in the monitoring area of interest. Specific siting criteria should be obtained from the project manager, and this information may include regional or site-specific program objectives and meteorological conditions of the monitoring area, as well as other considerations. Potential sites may be located from maps and through consultation with a local contact familiar with the monitoring area of interest.
The site should not be located in areas subject to unusual aerosol transport conditions. There should be no local pollution sources or unusual meteorology. The aerosol at the site should be representative of the regional air mass.
The site criteria fall into three categories:
(1) the site must represent nearby Class I areas [Regional Haze Rule applies to Class I areas such as
national parks, wilderness areas etc];
(2) the site should be regionally representative, avoiding local pollution sources or areas with unusual meteorology; and
(3) the site must avoid nearby obstacles that could affect sample collection. In most cases, the criteria are based on EPA guidelines. The criteria are not absolutes. A site that falls slightly outside a criterion may be the best choice. Significant variances from any criterion should be well documented and will be reviewed by the IMPROVE steering committee before the site is installed.
The following criteria should be used as guidelines in selecting the specific location of a sampling site.
(1) If a site is intended to represent Class I areas, it must meet the following criteria:
a. The distance between the site and the closest portion of all Class I areas should not be greater than 100 km. A smaller distance would be desirable. Note that the closest site may not be the best site.
b. The elevation of the site should lie between the highest and lowest elevations of all Class I areas to be represented. Exceedances of 100 feet or 10% are considered to be meeting this criterion. Larger exceedances are permitted if agreed to by the states and FLMs.
(2) The site must avoid small valleys with non-representative meteorology. Valleys with towns or other emission sources are definitely to be avoided. Valleys without emission sources, but with significant inversions, should also be avoided. The site should not be located on barren ground that is not typical of the region.
19.1055.FR1V2 UNITED STATES Page 33
(3) The site must avoid all local sources of pollution.
a. automotive sources
b. combustion sources
Avoid any areas influenced by diesel generator emissions, wood smoke, or incinerators.
c. dust sources
At least 400m from a large potential source of dust, such as a landfill, agricultural operations, or an unpaved road with more than 400 cars per day.
(4) The site must not have large obstructions such as trees or buildings that would hinder the sampling of regional representative aerosols. If necessary, the sampler could be placed on a platform to clear obstructions or to stay above any snow pack.
a. There should be unrestricted airflow for an arc of at least 270. The predominant wind
direction must be in the unrestricted 270. In practice, having unrestricted flow in all directions is preferable.
b. Within 10m of the sampler, any solid barriers or trees should be at least 1m below the inlet,
as shown on the left side of [sic]
c. Figure 5. In general, a pole or meteorological tower will not be a solid barrier. We will set as
a guideline that a solid barrier is any object that subtends more than 10. (Example: Hold a ruler at arm’s length [24 inches]; if the object subtends more than four inches, it is a solid
barrier.) [sic]
d. Beyond 10m of the sampler, the solid barriers or trees should not be higher than 30 above the horizontal with respect to the inlet, as shown on the right side of Figure 5. (Example: Hold
a ruler at arm’s length [24 inches]; 30 is a height of 14 inches.)
(5) If possible, all other samplers located at the site should use brushless pump motors (i. e., high-volume samplers often use motors with brushes that can result in high copper emissions). If brush pumps exist, the Project Manager should be notified and provided with the sampler specifications and the sampling schedule. The Project Manager will devise a site-specific approach for minimizing the effects of pump emissions.
(6) The site must have electrical power (2 circuits; 120 volt, 60 hertz, 20 Amperes). If new power must be installed it is anticipated that the local FLM will be able to obtain the necessary financial resources. The Steering Committee will consider exceptions.
(7) The site must be accessible for a weekly sample change in all but the most severe weather conditions
(8) The site should be located near existing particulate monitoring stations to provide continuity to the data set whenever possible.
(9) The sampler inlets must be located between 3 and 4 meters above the ground, and at least 1 meter above the shelter roof or above any other obstruction within 10 meters of the inlets. The spacing between inlet stacks must be at least 24 inches
(10) There must be an available and reliable site operator.
(11) The site should be secure from potential vandalism.
(12) If possible, the sampler should be located in an open-air shelter.
(13) There should be local land manager or landowner cooperation.
19.1055.FR1V2 UNITED STATES Page 34
Technology and Systems
Data collected from Federal Reference Methods (FRM), Federal Equivalent Methods (FEM) and Approved
Regional Methods (ARM) are used by the US EPA to compare measured values against the NAAQS. The
SLAMS and NCore stations are used to validate regional air quality management assumptions / modelling.
Section 2.2.6 of (USEPA, 2017) provides guidance on the measurement methods in PM2.5 monitoring networks:
“Measurement methods applied in PM networks are ground-based and are divided into three categories: Federal Reference Method (FRM) samplers, Federal Equivalent Method (FEM) samplers, and other samplers. The non-FRM samplers are distinguished by their level of similarity in design to Federal Reference Methods (FRM). The further from the FRMs in design, the more stringent are the requirements for designation of an instrument as an equivalent method. ·
Federal Reference Methods: Federal Reference Methods for PM2.5 are methods that have been designated as such under CFR 40 Chapter 1 Part 53, having met design and performance characteristics described in Part 50, Appendix L; Part 53, Subpart E; and Part 58, Appendix A. Reference method instruments acquire deposits over 24-hour periods on Teflon-membrane filters from air drawn at a controlled flow rate through a tested PM2.5 inlet. The inlet and size separation components are specified by design, with drawings and manufacturing tolerances published in the Code of Federal Regulations. Most of the other measurement components and procedures are specified by performance characteristics, with specific test methods to assess that performance. ·
Class I Equivalent Methods: Class I equivalent method instruments maintain the same measurement principles as reference method instruments, but with minor design changes. Class I instruments are intended to provide for sequential sampling without operator intervention at measurement sites that sample every day. Testing of design and performance characteristics for Class I instruments is given in Part 53, Subpart E. ·
Class II Equivalent Methods: Class II equivalent method instruments include all other instruments based on a 24-hour integrated filter sample with subsequent moisture equilibration and gravimetric mass analysis, but differ substantially in design from the reference method instruments. More extensive performance testing is required for a Class II equivalent instrument than for reference or Class I equivalent instruments. Testing of design and performance characteristics for Class II methods is given in Part 53, Subpart F. ·
Class III Equivalent Methods: Class III equivalent method instruments include any candidate instruments that cannot qualify as Class I or Class II instruments. These may either be filter-based integrated samplers not meeting Class I or Class II criteria, or filter or non-filter based continuous or semi-continuous samplers. Test procedures and performance requirements for Class III candidate method instruments will be determined on a case-by-case basis. The testing for these instruments will be the most stringent, because equivalency to reference methods must be demonstrated over a wide range of particle size distributions and aerosol compositions. Other methods include all non-FRM or non-equivalent measurement methods capable of characterizing fine particles that may not be or have not yet been classified as an equivalent method. Existing manual and continuous analyzers are in this category and potentially include the dichotomous sampler, IMPROVE samplers, nephelometers, beta attenuation monitors, and Tapered Element Oscillating Microbalances (TEOMs). Such instruments are not precluded from becoming equivalent on a site-specific, regional or national basis.”
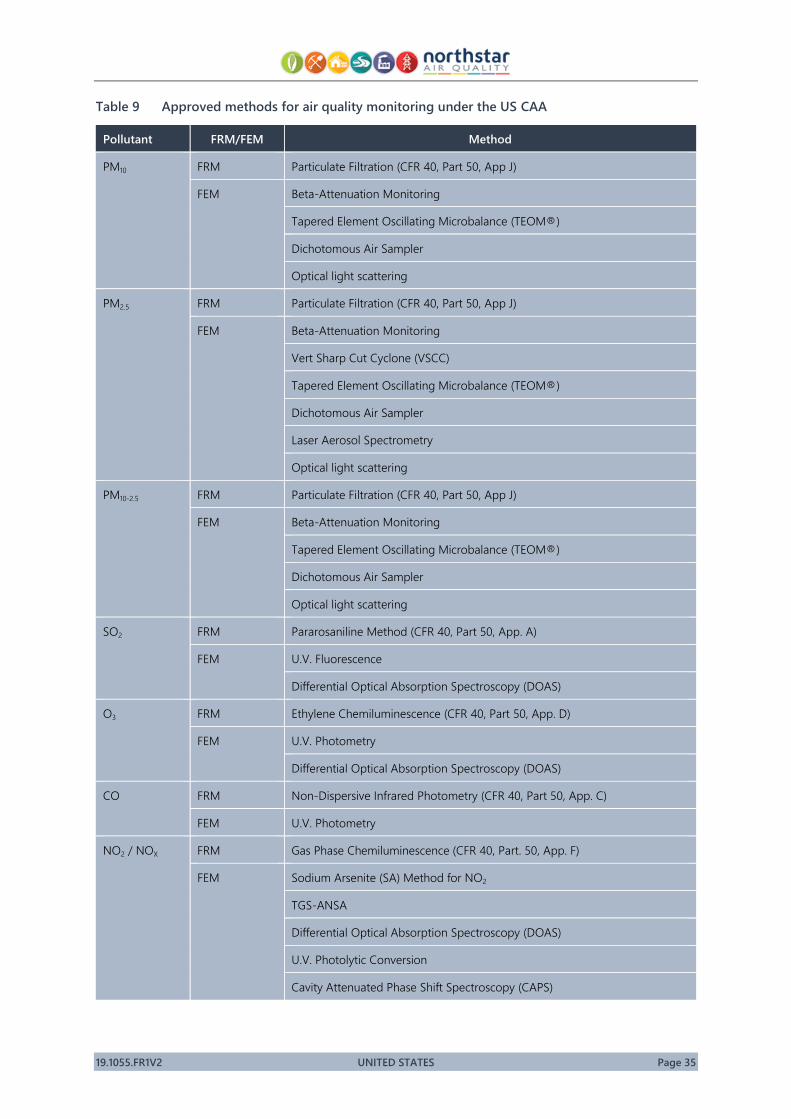
A description of the FRM and FEM systems used to monitor the six criteria air pollutants for assessment of
compliance with the NAAQS is presented in (USEPA, 2018) and (Gilliam & Hall, 2016). A summary of those
methods is presented in Table 9. Note that no derogations from those FRM and FEM systems are noted for
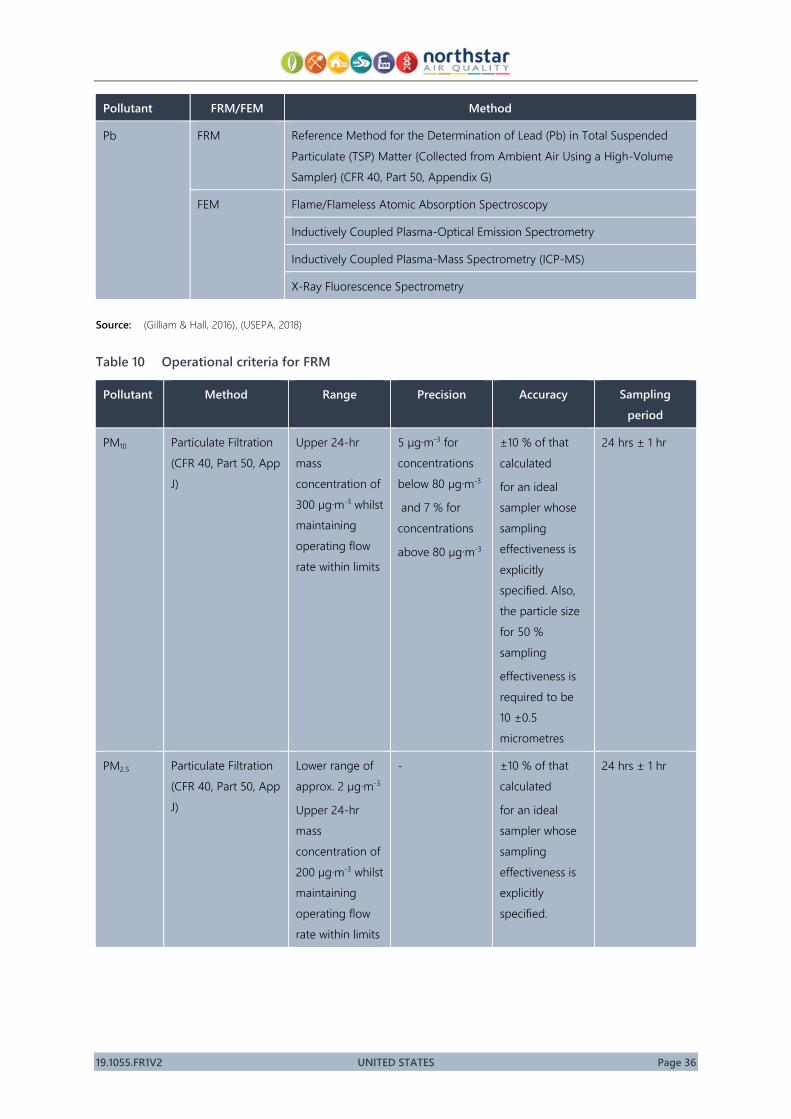
any monitoring over differing spatial scales. The criteria relating to the range, precision, accuracy and
sampling period associated with each FRM method are presented in Table 10.
19.1055.FR1V2 UNITED STATES Page 35
Table 9 Approved methods for air quality monitoring under the US CAA
Pollutant FRM/FEM Method
PM10 FRM Particulate Filtration (CFR 40, Part 50, App J)
FEM Beta-Attenuation Monitoring
Tapered Element Oscillating Microbalance (TEOM®)
Dichotomous Air Sampler
Optical light scattering
PM2.5 FRM Particulate Filtration (CFR 40, Part 50, App J)
FEM Beta-Attenuation Monitoring
Vert Sharp Cut Cyclone (VSCC)
Tapered Element Oscillating Microbalance (TEOM®)
Dichotomous Air Sampler
Laser Aerosol Spectrometry
Optical light scattering
PM10-2.5 FRM Particulate Filtration (CFR 40, Part 50, App J)
FEM Beta-Attenuation Monitoring
Tapered Element Oscillating Microbalance (TEOM®)
Dichotomous Air Sampler
Optical light scattering
SO2 FRM Pararosaniline Method (CFR 40, Part 50, App. A)
FEM U.V. Fluorescence
Differential Optical Absorption Spectroscopy (DOAS)
O3 FRM Ethylene Chemiluminescence (CFR 40, Part 50, App. D)
FEM U.V. Photometry
Differential Optical Absorption Spectroscopy (DOAS)
CO FRM Non-Dispersive Infrared Photometry (CFR 40, Part 50, App. C)
FEM U.V. Photometry
NO2 / NOX FRM Gas Phase Chemiluminescence (CFR 40, Part. 50, App. F)
FEM Sodium Arsenite (SA) Method for NO2
TGS-ANSA
Differential Optical Absorption Spectroscopy (DOAS)
U.V. Photolytic Conversion
Cavity Attenuated Phase Shift Spectroscopy (CAPS)
19.1055.FR1V2 UNITED STATES Page 36
Pollutant FRM/FEM Method
Pb FRM Reference Method for the Determination of Lead (Pb) in Total Suspended
Particulate (TSP) Matter {Collected from Ambient Air Using a High-Volume
Sampler} (CFR 40, Part 50, Appendix G)
FEM Flame/Flameless Atomic Absorption Spectroscopy
Inductively Coupled Plasma-Optical Emission Spectrometry
Inductively Coupled Plasma-Mass Spectrometry (ICP-MS)
X-Ray Fluorescence Spectrometry
Source: (Gilliam & Hall, 2016), (USEPA, 2018)
Table 10 Operational criteria for FRM
Pollutant Method Range Precision Accuracy Sampling
period
PM10 Particulate Filtration
(CFR 40, Part 50, App
J)
Upper 24-hr
mass
concentration of
300 µg·m-3 whilst
maintaining
operating flow
rate within limits
5 µg·m-3 for
concentrations
below 80 µg·m-3
and 7 % for
concentrations
above 80 µg·m-3
±10 % of that
calculated
for an ideal
sampler whose
sampling
effectiveness is
explicitly
specified. Also,
the particle size
for 50 %
sampling
effectiveness is
required to be
10 ±0.5
micrometres
24 hrs ± 1 hr
PM2.5 Particulate Filtration
(CFR 40, Part 50, App
J)
Lower range of
approx. 2 µg·m-3
Upper 24-hr
mass
concentration of
200 µg·m-3 whilst
maintaining
operating flow
rate within limits
- ±10 % of that
calculated
for an ideal
sampler whose
sampling
effectiveness is
explicitly
specified.
24 hrs ± 1 hr
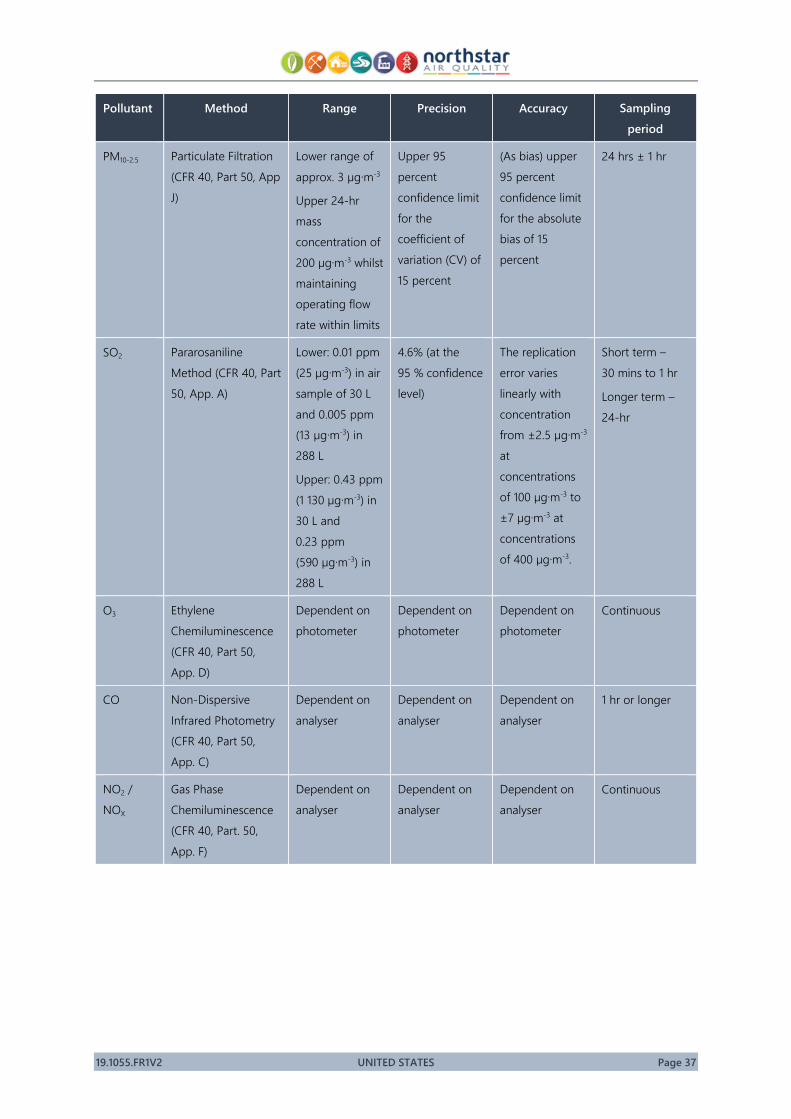
19.1055.FR1V2 UNITED STATES Page 37
Pollutant Method Range Precision Accuracy Sampling
period
PM10-2.5 Particulate Filtration
(CFR 40, Part 50, App
J)
Lower range of
approx. 3 µg·m-3
Upper 24-hr
mass
concentration of
200 µg·m-3 whilst
maintaining
operating flow
rate within limits
Upper 95
percent
confidence limit
for the
coefficient of
variation (CV) of
15 percent
(As bias) upper
95 percent
confidence limit
for the absolute
bias of 15
percent
24 hrs ± 1 hr
SO2 Pararosaniline
Method (CFR 40, Part
50, App. A)
Lower: 0.01 ppm
(25 µg·m-3) in air
sample of 30 L
and 0.005 ppm
(13 µg·m-3) in
288 L
Upper: 0.43 ppm
(1 130 µg·m-3) in
30 L and
0.23 ppm
(590 µg·m-3) in
288 L
4.6% (at the
95 % confidence
level)
The replication
error varies
linearly with
concentration
from ±2.5 µg·m-3
at
concentrations
of 100 µg·m-3 to
±7 µg·m-3 at
concentrations
of 400 µg·m-3.
Short term –
30 mins to 1 hr
Longer term –
24-hr
O3 Ethylene
Chemiluminescence
(CFR 40, Part 50,
App. D)
Dependent on
photometer
Dependent on
photometer
Dependent on
photometer
Continuous
CO Non-Dispersive
Infrared Photometry
(CFR 40, Part 50,
App. C)
Dependent on
analyser
Dependent on
analyser
Dependent on
analyser
1 hr or longer
NO2 /
NOX
Gas Phase
Chemiluminescence
(CFR 40, Part. 50,
App. F)
Dependent on
analyser
Dependent on
analyser
Dependent on
analyser
Continuous
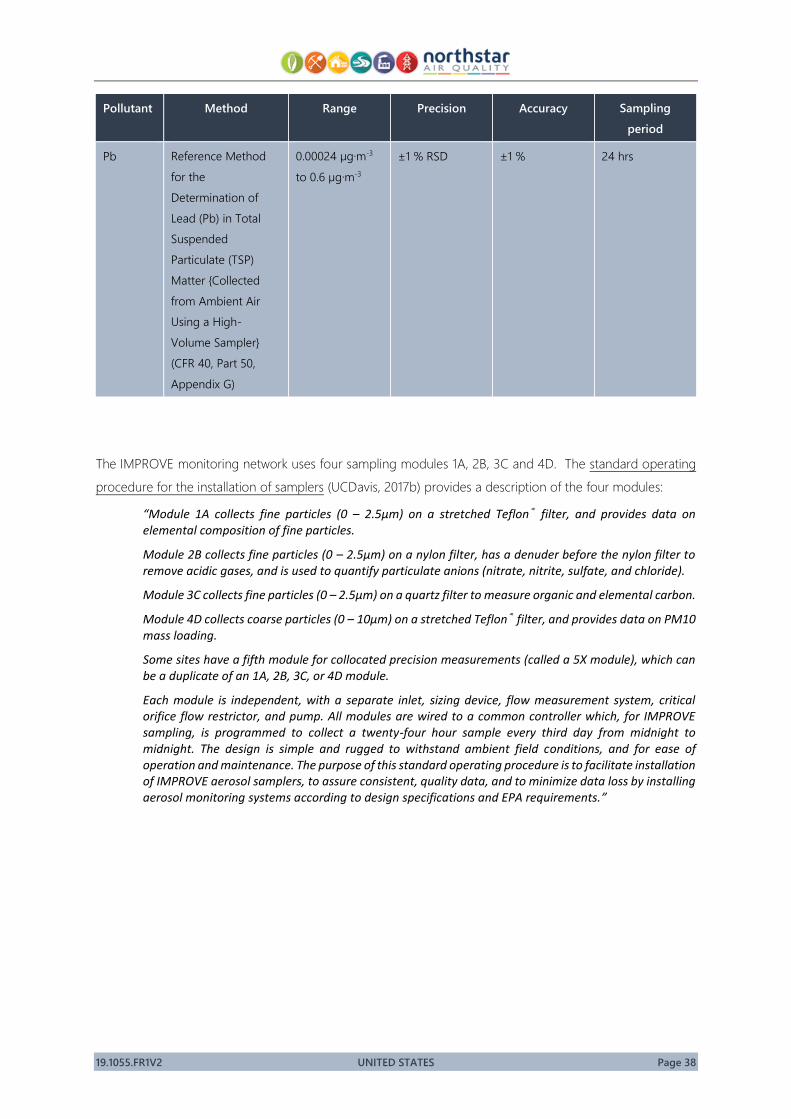
19.1055.FR1V2 UNITED STATES Page 38
Pollutant Method Range Precision Accuracy Sampling
period
Pb Reference Method
for the
Determination of
Lead (Pb) in Total
Suspended
Particulate (TSP)
Matter {Collected
from Ambient Air
Using a High-
Volume Sampler}
(CFR 40, Part 50,
Appendix G)
0.00024 µg·m-3
to 0.6 µg·m-3
±1 % RSD ±1 % 24 hrs
The IMPROVE monitoring network uses four sampling modules 1A, 2B, 3C and 4D. The standard operating
procedure for the installation of samplers (UCDavis, 2017b) provides a description of the four modules:
“Module 1A collects fine particles (0 – 2.5µm) on a stretched Teflon® filter, and provides data on elemental composition of fine particles.
Module 2B collects fine particles (0 – 2.5µm) on a nylon filter, has a denuder before the nylon filter to remove acidic gases, and is used to quantify particulate anions (nitrate, nitrite, sulfate, and chloride).
Module 3C collects fine particles (0 – 2.5µm) on a quartz filter to measure organic and elemental carbon.
Module 4D collects coarse particles (0 – 10µm) on a stretched Teflon® filter, and provides data on PM10 mass loading.
Some sites have a fifth module for collocated precision measurements (called a 5X module), which can be a duplicate of an 1A, 2B, 3C, or 4D module.
Each module is independent, with a separate inlet, sizing device, flow measurement system, critical orifice flow restrictor, and pump. All modules are wired to a common controller which, for IMPROVE sampling, is programmed to collect a twenty-four hour sample every third day from midnight to midnight. The design is simple and rugged to withstand ambient field conditions, and for ease of operation and maintenance. The purpose of this standard operating procedure is to facilitate installation of IMPROVE aerosol samplers, to assure consistent, quality data, and to minimize data loss by installing aerosol monitoring systems according to design specifications and EPA requirements.”
19.1055.FR1V2 UNITED STATES Page 39
Case study: Background air quality monitoring in California
The California Air Resources Board (CARB) operates an extensive air quality monitoring network of over 250
sites in the southwest of the United States. Similar to NSW, many regions in California are characterised by
complex terrain, variable meteorological conditions and diverse emissions sources. The network is designed
to assess compliance against National Air Quality Standards, and also standards applicable in California, set
by CARB.
The monitoring objectives and spatial scales associated with air quality monitoring in California align with
those set out by the US EPA and which are presented in Table 7 (micro, middle, neighbourhood, urban and
regional scales). The objectives are also aligned between California and the broader US with those being the
monitoring of highest concentrations or source impacts, concentrations associated with high population
densities, and those associated with background concentrations, regional transport, or impacts on visibility,
vegetation and other welfare-based impacts.
Federal regulations require state and local agencies that conduct ambient air quality monitoring for regulatory
purposes to submit an Annual Network Plan to the US EPA. The 2018 Annual Monitoring Network Report for
California covers 25 of the 35 air districts in California, with the remainder choosing to submit their own plans.
Of the 77 stations covered by the network report, 15 are classified as ‘general background’ sites for one or
more pollutants, on spatial scales associated with the ‘neighbourhood’, ‘urban’ and ‘regional’ scales.
It is notable that sites which are classified as general background for one or more pollutants can often be
classified in a different manner for other pollutants. For example, the Red Bluff-Walnut site in the Tehama
District monitors O3, PM10 and PM2.5. For O3, the site is classified as a population exposure type, for PM10 is a
highest concentration type site and for PM2.5 is a general background type site. All pollutant measurements
are reflective of the neighbourhood scale at this site.
Another example may be those sites which monitor certain pollutants reflective of the regional scale. The
Colusa-Sunrise Blvd site in the Colusa District also monitors O3, PM10 and PM2.5. For O3, the site is classified
as a general background type, for PM10 is a highest concentration and population exposure type site and for
PM2.5 is a population exposure type site. O3 measurements are reflective of the regional scale, whereas
measurements of PM10 and PM2.5 are reflective of the neighbourhood scale.
These examples are provided to demonstrate that the classification of a site type is in large part a function of
its location in relation to sources of air pollutants which can vary pollutant to pollutant.
No meteorological measurements are made at the Red Bluff-Walnut site but are made at the Colusa-Sunrise
Blvd sites. Those measurements are temperature, relative humidity, wind direction and wind speed.

19.1055.FR1V2 UNITED STATES Page 40
This page has been left intentionally blank
19.1055.FR1V2 EUROPEAN UNION Page 41
4. EUROPEAN UNION
The “Air Quality Framework Directive” on ambient air quality assessment and management (96/62/EC) was
adopted by the European Council on 27 September 1996. Supplementing the Air Quality Framework Directive
were a series of ‘daughter’ directives:
• Directive 1999/30/EC of the European Parliament and of the Council relating to limit values for sulphur
dioxide, nitrogen dioxide and oxides of nitrogen, particulate matter and lead in ambient air (First
Daughter Directive).
• Directive 2000/69/EC of the European Parliament and of the Council relating to limit values for benzene
and carbon monoxide in ambient air (Second Daughter Directive).
• Directive 2002/3/EC of the European Parliament and of the Council relating to ozone in ambient air
(Third Daughter Directive).
• Directive 2004/107/EC of the European Parliament and of the Council relating to arsenic, cadmium,
mercury, nickel and polycyclic aromatic hydrocarbons in ambient air (Fourth Daughter Directive).
Subsequently, the Air Quality Framework Directive and the subsequent daughter directives have been brought
together under the Ambient Air Quality and Cleaner Air for Europe (CAFE) Directive (2008/50/EC) (the CAFE
Directive).
Definitions and Classifications
Directive 2008/50/EC, Chapter I, Article 2 provides definitions used in the Directive. Clause 1 provides the
following definition of “contributions from natural sources”:
“ ’contributions from natural sources’ shall mean emissions of pollutants not caused directly or indirectly by human activities, including natural events such as volcanic eruptions, seismic activities, geothermal activities, wild-land fires, high-wind events, sea sprays or the atmospheric re-suspension or transport of natural particles from dry regions”
The following definition for “urban background locations”:
“ ‘urban background locations’ shall mean places in urban areas where levels are representative of the exposure of the general urban population”
No other definitions relating to background air quality on other scales / localities are outlined within the CAFE
Directive.
Reference is however made within the CAFE Directive to ‘rural background’, specifically in relation to
measurements of fine particulate matter (Clause 8):
“Detailed measurements of fine particulate matter at rural background locations should be made in order to understand better the impacts of this pollutant and to develop appropriate policies. Such measurements should be made in a manner consistent with those of the cooperative programme for monitoring and evaluation of the long range transmission of air pollutants in Europe (EMEP) set up under the 1979 Convention on Long-range Transboundary Air Pollution approved by Council Decision 81/462/EEC of 11 June 1981”
19.1055.FR1V2 EUROPEAN UNION Page 42
Further information relating to ‘rural background’ is provided in Section 4.4.
Although no specific definition of other site ‘types’ are provided in the CAFE Directive, mention is made of
‘traffic’ (Annex III, B 1 (b)), ‘industrial’ (Annex I, A) and ‘suburban’ (Annex VIII, A) sites.
The system of site classification adopted by the UK (an EU member) Department for Environment, Food and
Rural Affairs (DEFRA) in the Automatic Urban and Rural Network (AURN) is based on two criteria:
• the nature of the surrounding area (which may be urban, suburban or rural); and,
• the types of pollution sources involved (which may be traffic, industrial emissions, or “background”
i.e. not located close to any specific emission source).
As detailed within the Site Operator’s Manual for the AURN (Ricardo AEA, 2012) (page 30):
“So, a site could be described as (for example) “urban traffic” – in an urban area, and close to a busy road where local concentrations of pollutants are dominated by vehicle emissions, “urban background” – in an urban area but well away from major roads and specific industrial emission sources, or “rural background” if it is in a rural area well away from emission sources. Any combination is possible, although some (such as “rural traffic” or “rural industrial”, are likely to be rare).”
With specific reference to ‘background’ stations (Ricardo AEA, 2012) states that they should be:
“Located such that its pollution level is not influenced significantly by any single source or street, but rather by the integrated contribution from all sources upwind of the station e.g. by all traffic, combustion sources etc. upwind of the station in a city, or by all upwind source areas (cities, industrial areas) in a rural area. These sampling points shall, as a general rule, be representative for several square kilometres. At rural background sites, the sampling point should not be influenced by agglomerations or industrial sites in its vicinity, i.e. sites closer than five kilometres.”
Purposes
Annex IV (Measurements at background locations irrespective of concentration) provides a summary of the
definitions for background monitoring as prescribed under the CAFE Directive. The objectives are defined as:
“The main objectives of such measurements are to ensure that adequate information is made available on levels in the background. This information is essential to judge the enhanced levels in more polluted areas (such as urban background, industry related locations, traffic related locations), assess the possible contribution from long-range transport of air pollutants, support source apportionment analysis and for the understanding of specific pollutants such as particulate matter. It is also essential for the increased use of modelling also in urban areas.”
Scales
The macroscale siting classification of monitoring sites is defined by Annex VIII and is presented in Table 11.

19.1055.FR1V2 EUROPEAN UNION Page 43
Table 11 Macroscale siting classification – CAFE Directive
Type of
station
Objectives of measurement Representativeness(a) Macroscale siting criteria
Urban Protection of human health:
• To assess the exposure of the
urban population to ozone, i.e.
where population density and
ozone concentration are
relatively high and
representative of the exposure
of the general population
A few km2 • Away from the influence of local
emissions such as traffic, petrol stations,
etc.;
• Vented locations where well mixed levels
can be measured;
• Locations such as residential and
commercial areas of cities, parks (away
from the trees), big streets or squares
with very little or no traffic, open areas
characteristic of educational, sports or
recreation facilities
Suburban Protection of human health
and vegetation:
to assess the exposure of the
population and vegetation
located in the outskirts of the
agglomeration, where the
highest ozone levels, to which
the population and vegetation
are likely to be directly or
indirectly exposed occur
Some tens of km2 • At a certain distance from the area of
maximum emissions, downwind
following the main wind
direction/directions during conditions
favourable to ozone formation;
• Where population, sensitive crops or
natural ecosystems located in the outer
fringe of an agglomeration are exposed
to high ozone levels;
• Where appropriate, some suburban
stations also upwind of the area of
maximum emissions, in order to
determine the regional background
levels of ozone
Rural Protection of human health
and vegetation:
to assess the exposure of
population, crops and natural
ecosystems to sub-regional
scale ozone concentrations
Sub-regional levels
(some hundreds of km2)
• Stations can be located in small
settlements and/or areas with natural
ecosystems, forests or crops;
• representative for ozone away from the
influence of immediate local emissions
such as industrial installations and roads;
• at open area sites, but not on summits of
higher mountains
19.1055.FR1V2 EUROPEAN UNION Page 44
Type of
station
Objectives of measurement Representativeness(a) Macroscale siting criteria
Rural
background
Protection of vegetation and
human health:
to assess the exposure of crops
and natural ecosystems to
regional-scale ozone
concentrations as well as
exposure of the population
Regional/ national/
continental levels
(1,000 to 10,000 km2)
• Station located in areas with lower
population density, e.g. with natural
ecosystems, forests, at a distance of at
least 20 km from urban and industrial
areas and away from local emissions;
• Avoid locations which are subject to
locally enhanced formation of near-
ground inversion conditions, also
summits of higher mountains;
• Coastal sites with pronounced diurnal
wind cycles of local character are not
recommended
Note: (a) Sampling points should, where possible, be representative of similar locations not in their immediate vicinity.
Scope
Chapter II (Assessment of Air Quality), Article 6 (Assessment criteria), Clause 5 states:
“In addition to the assessments referred to in paragraphs 2, 3 and 4, measurements shall be made, at rural background locations away from significant sources of air pollution, for the purposes of providing, as a minimum, information on the total mass concentration and the chemical speciation concentrations of fine particulate matter (PM2,5) on an annual average basis and shall be conducted using the following criteria:
(a) one sampling point shall be installed every 100 000 km2;
(b) each Member State shall set up at least one measuring station or may, by agreement with adjoining Member States, set up one or several common measuring stations, covering the relevant neighbouring zones, to achieve the necessary spatial resolution;
(c) where appropriate, monitoring shall be coordinated with the monitoring strategy and measurement programme of the Cooperative Programme for Monitoring and Evaluation of the Long-range Transmission of Air Pollutants in Europe (EMEP)”
Annex IV (Measurements at rural background locations irrespective of concentration) provides a succinct
summary of the definitions for background monitoring as prescribed under the CAFE Directive. The following
guidance is provided:
“Measurement of PM2,5 must include at least the mass concentration and appropriate compounds to characterise its chemical composition. At least the list of chemical species given below shall be included.
SO42- Na+ NH4
+ Ca2+ elemental carbon (EC)
NO3- K+ Cl- Mg2
+ organic carbon (OC)
Guidance for other pollutants is not addressed in Annex IV.
19.1055.FR1V2 EUROPEAN UNION Page 45
Annex V (Criteria for determining minimum numbers of sampling points for fixed measurement of
concentrations of sulphur dioxide, nitrogen dioxide and oxides of nitrogen, particulate matter (PM10, PM2,5),
lead, benzene and carbon monoxide in ambient air) provides the following requirements for BAQMS. The
minimum requirement for NO2, PM, C6H6 and CO as at least one (1) urban background monitoring station
and that the number of BAQMS cannot vary by a factor of 2 from the number of ‘traffic orientated’ AQMS.
Corresponding, Annex VIII (criteria for classifying and locating sampling points for assessment of O3
concentrations) provides the following criteria for the siting of rural BAQMS with regard to O3 measurements:
• Objective: Protection of vegetation and human health: to assess the exposure of crops and natural
ecosystems to regional-scale ozone concentrations as well as exposure of the population
• Representativeness: Regional/national/continental levels (1 000 to 10 000 km2)
• Macroscale siting criteria: Station located in areas with lower population density, e.g. with natural
ecosystems, forests, far removed from urban and industrial areas and away from local emissions; Avoid
locations which are subject to locally enhanced formation of near-ground inversion conditions, also
summits of higher mountains; Coastal sites with pronounced diurnal wind cycles of local character are
not recommended.
As a footnote, Annex VIII states:
“For rural and rural background stations the location shall, where appropriate, be coordinated with the monitoring requirements of Commission Regulation (EC) No 1737/2006 of 7 November 2006 laying down detailed rules for the implementation of Regulation (EC) No 2152/2003 of the European Parliament and of the Council concerning monitoring of forests and environmental interactions in the Community.”
A review of EC 1091/941 indicates that the siting criteria should be conversant with the selection of arboreal
‘reference’ plots which are used to measure flora degradation / loss due to air pollution.
Annex IX (criteria for determining the minimum number of sampling points for fixed measurement of
concentrations of ozone) states that one (1) rural BAQMS should be provided per 50 000 km2, as an average
density over all zones, and one (1) per 25 000 km2 in areas of complex terrain.
Chapter II, Section 1, Article 10, Clause 3 provides specifications for the monitoring of ozone states:
“Nitrogen dioxide shall be measured at a minimum of 50 % of the ozone sampling points required under Section A of Annex IX. That measurement shall be continuous except at rural background stations, as referred to in Section A of Annex VIII, where other measurement methods may be used.”
1 https://publications.europa.eu/en/publication-detail/-/publication/cf2c9abb-3442-42a9-b853-4b59053da3fd/language-en
19.1055.FR1V2 EUROPEAN UNION Page 46
Site Selection Criteria
4.5.1 Macro Scale
Macroscale siting requirements for urban background monitoring stations is described in Annex III, B 1(c):
3(c) Urban background locations shall be located so that their pollution level is influenced by the integrated contribution from all sources upwind of the station. The pollution level should not be dominated by a single source unless such a situation is typical for a larger urban area. Those sampling points shall, as a general rule, be representative for several square kilometres
Macroscale siting requirements for rural background monitoring stations is described in Annex III, B 1 (d-e):
(d) Where the objective is to assess rural background levels, the sampling point shall not be influenced by agglomerations or industrial sites in its vicinity, i.e. sites closer than five kilometres
(e) Where contributions from industrial sources are to be assessed, at least one sampling point shall be installed downwind of the source in the nearest residential area. Where the background concentration is not known, an additional sampling point shall be situated within the main wind direction
4.5.2 Micro Scale
Microscale Siting is described in Annex III C as:
In so far as is practicable, the following shall apply:
• the flow around the inlet sampling probe shall be unrestricted (free in an arc of at least 270°) without any obstructions affecting the airflow in the vicinity of the sampler (normally some metres away from buildings, balconies, trees and other obstacles and at least 0,5 m from the nearest building in the case of sampling points representing air quality at the building line),
• in general, the inlet sampling point shall be between 1,5 m (the breathing zone) and 4 m above the ground. Higher positions (up to 8 m) may be necessary in some circumstances. Higher siting may also be appropriate if the station is representative of a large area,
• the inlet probe shall not be positioned in the immediate vicinity of sources in order to avoid the direct intake of emissions unmixed with ambient air,
• the sampler’s exhaust outlet shall be positioned so that recirculation of exhaust air to the sampler inlet is avoided,
The following factors may also be taken into account:
• interfering sources; security; access; availability of electrical power and telephone communications; visibility of the site in relation to its surroundings; safety of the public and operators; the desirability of co-locating sampling points for different pollutants; planning requirements.
Technology and Systems
In terms of specified technology, the CAFE Directive makes reference to ‘fixed measurement’ at BAQMS (see
Section 4.1).
19.1055.FR1V2 EUROPEAN UNION Page 47
Chapter I, Article 2(23) provides the following definition which is relevant:
“fixed measurement” shall mean measurements taken at fixed sites, either continuously or by random sampling to determine the levels in accordance with the required data quality objectives
Further to the above, Annex I provides the following data quality objectives (DQO):
Table 12 CAFÉ Directive - data quality objectives
Fixed measurements(A)
SO2, NO2, NOX,
CO
C6H6 PM10, PM2.5, Pb O3 (and related
NO and NO2)
Uncertainty 15 % 25 % 25 % 15 %
Minimum data capture 90 % 90 % 90 % 90 % (summer)
75 % (winter)
Minimum time coverage -- 35 % -- --
Urban background and trend -- 90 % -- --
Notes: (A): Member States may apply random measurements instead of continuous measurements for benzene and particulate
matter if they can demonstrate to the Commission that the uncertainty, including the uncertainty due to random sampling,
meets the quality objective of 25 % and the time coverage is still larger than the minimum time coverage for indicative
measurements. Random sampling must be evenly distributed over the year in order to avoid skewing of results. The
uncertainty due to random sampling can be determined by the procedure laid down in ISO 11222 (2002) “Air Quality –
Determination of the Uncertainty of the Time Average of Air Quality Measurements”. If random measurements are used to
assess the number of exceedances (N[estimate]) of the PM10 daily limit value, the following correction should be applied:
N[estimate] = N[measurement] x 365 days / number of measured days.
The European Committee for Standardisation (CEN) has produced centralised and standardised monitoring
methods for the performance of the CAFE Directive that achieve the DQO set out above. The current
prescribed methods are:
• Oxides of nitrogen: EN14211:2012: Ambient air. Standard method for the measurement of the
concentration of nitrogen dioxide and nitrogen monoxide by chemiluminescence
• Sulphur dioxide: EN14212:2012: Ambient air. Standard method for the measurement of the
concentration of sulphur dioxide by ultraviolet fluorescence
• Ozone: EN14625:2012: Ambient air. Standard method for the measurement of the
concentration of ozone by ultraviolet photometry
• Carbon monoxide: EN14626:2012: Ambient air. Standard method for the measurement of the
concentration of carbon monoxide by non-dispersive infrared spectroscopy
• Particulate: EN12341:2014: Ambient air. Standard gravimetric measurement method for the
determination of the PM10 or PM2.5 mass concentration of suspended particulate
matter
• Benzene: EN14662-1:2005: Ambient air. Standard method for the measurement of
benzene concentrations. Automated pumped sampling with in situ gas

19.1055.FR1V2 EUROPEAN UNION Page 48
chromatography
EN14662-3:2015: Ambient air. Standard method for the measurement of
benzene concentrations. Automated pumped sampling with in situ gas
chromatograph
• Lead EN12902:2005: Ambient air quality. Standard method for the measurement of
Pb, Cd, AS, and Ni in the PM10 fraction of suspended particulate matter
Case study: Background air quality monitoring in the United
Kingdom
Site: Lullington Heath
Environment Type: Rural Background
Environment: Located on a high plateau surrounded by heath land. 1.5 km from nearest road.
The Lullington Heath rural background monitoring station is located on the south coast of the UK, northeast
of Brighton and approximately 5 km from the English Channel. The data collected at the monitoring station
is used in ecosystem and air quality management. The station is one of 22 stations classified as Rural
Background in the Automatic Urban and Rural Network (AURN). There is a total of 170 monitoring stations in
the AURN at the time of writing.
The station was commissioned as part of the AURN in 1986, measuring only background O3 at that time. In
1988, measurements of NO, NO2, NOX and SO2 were added. Particulates are not measured as part of the
AURN at Lullington Heath, although speciated particulate and some gaseous pollutants are measured as part
of the Acid Gas and Aerosol Network (AGANet), measurements which commenced in 2017. A number of
pollutants in precipitation are also monitored at Lullington Heath as part of the United Kingdom Eutrophying
& Acidifying Network (UKEAP) Precipitation Network (PrecipNet), and NO2 diffusion tube network (NO2-Net)
which commenced at Lullington Heath in 2016 and 2017, respectively.
The use of the Lullington Heath site has evolved over time and reviews (e.g. DEFRA, 2013) continue to
recognise the importance of data collected at this location to inform large scale ecosystem and air quality
management. Although no specific document outlining the rationale for siting individual stations is publicly
available, the Site Operator’s Manual (Ricardo AEA, 2012) defines the two criteria which make up the
classification of ‘Rural’ + ‘Background’ as:
“Rural area (R)
Sampling points targeted at the protection of vegetation and natural ecosystems shall be sited more than 20 km away from agglomerations and more than 5 km away from other built-up areas, industrial installations or motorways or major roads, so that the air sampled is representative of air quality in a surrounding area of at least 1000 km2. Stations can be located in small settlements and/or areas with natural ecosystems, forests or crops.
19.1055.FR1V2 EUROPEAN UNION Page 49
Background station (B)
Located such that its pollution level is not influenced significantly by any single source or street, but rather by the integrated contribution from all sources upwind of the station e.g. by all traffic, combustion sources etc. upwind of the station in a city, or by all upwind source areas (cities, industrial areas) in a rural area. These sampling points shall, as a general rule, be representative for several square kilometres. At rural background sites, the sampling point should not be influenced by agglomerations or industrial sites in its vicinity, i.e. sites closer than five kilometres.”
Site operators within the UK are also encouraged to take into account more practical considerations which
are included within the Site Operator’s Manual (Ricardo AEA, 2012):
• It should be practical for power and telephone connections to be made at the site;
• The site should be accessible for a lorry to deliver the housing (if necessary)
• It should be reasonably easy for gas cylinders to be delivered close to the site and transferred to the housing (or the building in which the site is located).
• The LSO should be able to gain access to the site whenever necessary.
• The site should be in an area where the risks of vandalism are minimal.
• Account should be taken of visual impact of the housing.
No derogations from the selection of instrumentation used across the AURN is required when operating a
BAQMS, or indeed any classification of AQMS.
The measurement methods used across the AURN are as follows (table 7-1 of (Ricardo AEA, 2012)):
• O3 UV Absorption
• NO/NO2 Chemiluminescence
• SO2 UV Fluorescence
• CO IR Absorption
• PM10/PM2.5 FDMS, BAM, Gravimetric Sampler
The techniques used are ‘state-of-the-art’ for automated monitoring networks and conform to the National
Measurement System (NMS). As stated in (Ricardo AEA, 2012):
“Essential requirements for conformity with the NMS are as follows:
• Measurement methods used must be of known performance and defined scope of application;
• All calibrations must be traceable through an unbroken chain to international standards (the SI system);
• Measurements should be made within a documented quality system;
• Where possible, measurements should be harmonised with those made by organisations both within and outside UK.”
Meteorological parameters are not measured at Lullington Heath (apart from rainfall used in the PrecipNet
measurements), rather modelled wind direction, wind speed and temperature are adopted.

19.1055.FR1V2 EUROPEAN UNION Page 50
This page has been left intentionally blank
19.1055.FR1V2 CANADA Page 51
5. CANADA
Definitions and Classifications
In Canada, a number of pollutants are managed by the establishment of Canadian Ambient Air Quality
Standards (CAAQS) under the Canadian Council of Ministers of the Environment (CCME) Environmental
Standards Sub-Agreement. The agreed CAAQS are implemented agreement of the CCME under the Air
Quality Management System (AQMS) and replaces the Canada-wide Standards (CWS) for Particulate matter
and Ozone.
As stated in the Guidance Document for the Achievement Determination (GDAD) for the Canadian Ambient
Air Quality Standards for Fine Particulate Matter and Ozone:
“Under the CWS for PM and Ozone, background concentrations were included as one of the possible pollution origins that could contribute to the non achievement of the CWS. The CWS GDAD provided a definition of background concentrations which is similar to the EPA policy-relevant background concentration definition: “Background concentrations are the ambient levels resulting from anthropogenic and natural emissions outside North America and natural sources within North America”. There is also a scientific definition of “background concentrations”, where the levels originate from natural sources only.
Because of the challenge in defining and quantifying background contributions, the CAAQS GDAD does not explicitly mention background concentrations as a possible cause for the nonachievement of a given standard. However, some of the given examples for EE (‘exceptional event’) implicitly capture any “background” contribution.”
Purposes
Canada operates a number of air quality monitoring networks for a variety of purposes, including:
• National Air Pollution Surveillance (NAPS) Network2: The NAPS network is a collaborative
monitoring network operated jointly by federal, provincial, territorial and municipal governments. It
provides long-term data on the ambient concentrations of SO2, NO2, O3, PM and CO. The data is used
by the provinces to report to the Air Quality Index (AQI) and by Environment Canada to report to the
Air Quality Health Index (AQHI).
• Canadian Air and Precipitation Monitoring Network (CAPMoN): CAPMoN is operated by
Environment Canada, is designed to study the regional patterns and trends of atmospheric pollutants
such as acid rain, smog, particulate matter and mercury, in both air and precipitation. Its initial purpose
was to manage acid rain, but has expanded to include NOX, PM, Hg and O3. Of relevance to this report,
CAPMoN data is used to assess regional background and the long-term transport of pollutants.
2 https://open.canada.ca/data/en/dataset/1b36a356-defd-4813-acea-47bc3abd859b
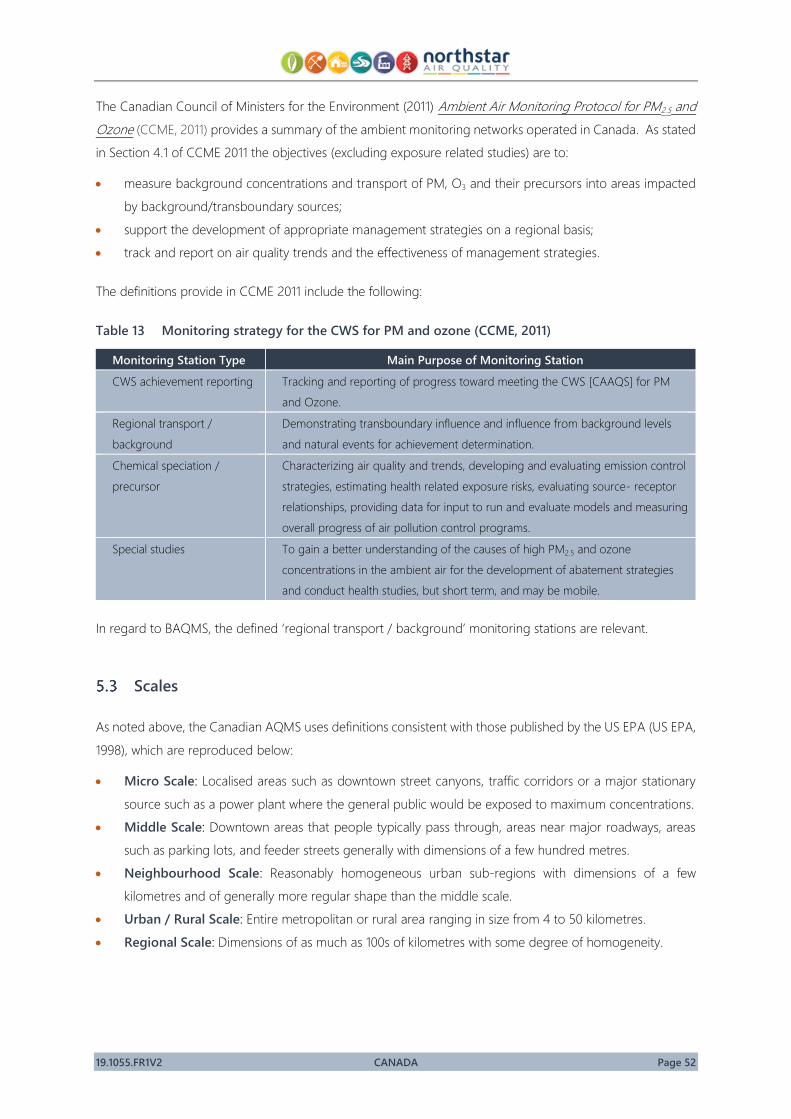
19.1055.FR1V2 CANADA Page 52
The Canadian Council of Ministers for the Environment (2011) Ambient Air Monitoring Protocol for PM2.5 and
Ozone (CCME, 2011) provides a summary of the ambient monitoring networks operated in Canada. As stated
in Section 4.1 of CCME 2011 the objectives (excluding exposure related studies) are to:
• measure background concentrations and transport of PM, O3 and their precursors into areas impacted
by background/transboundary sources;
• support the development of appropriate management strategies on a regional basis;
• track and report on air quality trends and the effectiveness of management strategies.
The definitions provide in CCME 2011 include the following:
Table 13 Monitoring strategy for the CWS for PM and ozone (CCME, 2011)
Monitoring Station Type Main Purpose of Monitoring Station
CWS achievement reporting Tracking and reporting of progress toward meeting the CWS [CAAQS] for PM
and Ozone.
Regional transport /
background
Demonstrating transboundary influence and influence from background levels
and natural events for achievement determination.
Chemical speciation /
precursor
Characterizing air quality and trends, developing and evaluating emission control
strategies, estimating health related exposure risks, evaluating source- receptor
relationships, providing data for input to run and evaluate models and measuring
overall progress of air pollution control programs.
Special studies To gain a better understanding of the causes of high PM2.5 and ozone
concentrations in the ambient air for the development of abatement strategies
and conduct health studies, but short term, and may be mobile.
In regard to BAQMS, the defined ‘regional transport / background’ monitoring stations are relevant.
Scales
As noted above, the Canadian AQMS uses definitions consistent with those published by the US EPA (US EPA,
1998), which are reproduced below:
• Micro Scale: Localised areas such as downtown street canyons, traffic corridors or a major stationary
source such as a power plant where the general public would be exposed to maximum concentrations.
• Middle Scale: Downtown areas that people typically pass through, areas near major roadways, areas
such as parking lots, and feeder streets generally with dimensions of a few hundred metres.
• Neighbourhood Scale: Reasonably homogeneous urban sub-regions with dimensions of a few
kilometres and of generally more regular shape than the middle scale.
• Urban / Rural Scale: Entire metropolitan or rural area ranging in size from 4 to 50 kilometres.
• Regional Scale: Dimensions of as much as 100s of kilometres with some degree of homogeneity.
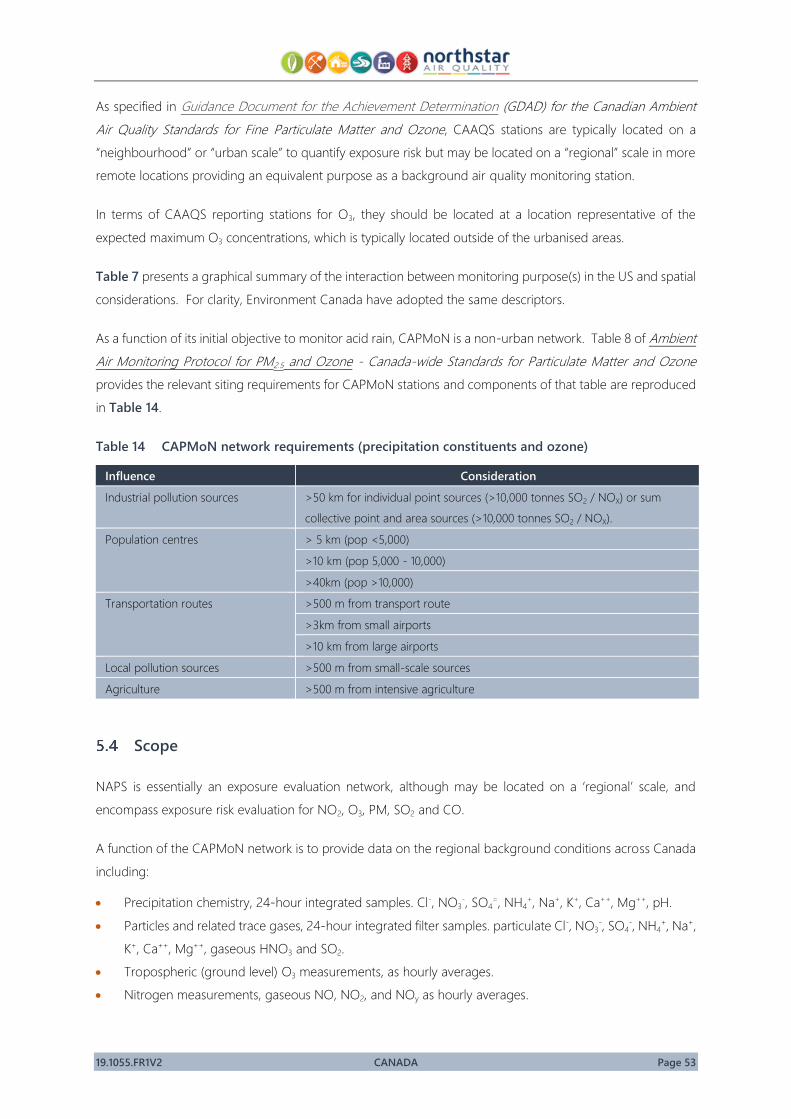
19.1055.FR1V2 CANADA Page 53
As specified in Guidance Document for the Achievement Determination (GDAD) for the Canadian Ambient
Air Quality Standards for Fine Particulate Matter and Ozone, CAAQS stations are typically located on a
“neighbourhood” or “urban scale” to quantify exposure risk but may be located on a “regional” scale in more
remote locations providing an equivalent purpose as a background air quality monitoring station.
In terms of CAAQS reporting stations for O3, they should be located at a location representative of the
expected maximum O3 concentrations, which is typically located outside of the urbanised areas.
Table 7 presents a graphical summary of the interaction between monitoring purpose(s) in the US and spatial
considerations. For clarity, Environment Canada have adopted the same descriptors.
As a function of its initial objective to monitor acid rain, CAPMoN is a non-urban network. Table 8 of Ambient
Air Monitoring Protocol for PM2.5 and Ozone - Canada-wide Standards for Particulate Matter and Ozone
provides the relevant siting requirements for CAPMoN stations and components of that table are reproduced
in Table 14.
Table 14 CAPMoN network requirements (precipitation constituents and ozone)
Influence Consideration
Industrial pollution sources >50 km for individual point sources (>10,000 tonnes SO2 / NOX) or sum
collective point and area sources (>10,000 tonnes SO2 / NOX).
Population centres > 5 km (pop <5,000)
>10 km (pop 5,000 - 10,000)
>40km (pop >10,000)
Transportation routes >500 m from transport route
>3km from small airports
>10 km from large airports
Local pollution sources >500 m from small-scale sources
Agriculture >500 m from intensive agriculture
Scope
NAPS is essentially an exposure evaluation network, although may be located on a ‘regional’ scale, and
encompass exposure risk evaluation for NO2, O3, PM, SO2 and CO.
A function of the CAPMoN network is to provide data on the regional background conditions across Canada
including:
• Precipitation chemistry, 24-hour integrated samples. Cl-, NO3-, SO4
=, NH4+, Na+, K+, Ca++, Mg++, pH.
• Particles and related trace gases, 24-hour integrated filter samples. particulate Cl-, NO3-, SO4
-, NH4+, Na+,
K+, Ca++, Mg++, gaseous HNO3 and SO2.
• Tropospheric (ground level) O3 measurements, as hourly averages.
• Nitrogen measurements, gaseous NO, NO2, and NOy as hourly averages.
19.1055.FR1V2 CANADA Page 54
• Size-selective particulate matter, 24-hour integrated samples PM2.5, PM10 and coarse fraction mass.
• Total gaseous mercury, hourly averages.
• Hg in precipitation, weekly integrated samples.
Site Selection Criteria
5.5.1 Macro Scale
CCME 2011 provides the following on the siting of regional transport / background stations:
“Regional transport/background monitoring is used to determine the upwind concentration of PM2.5 and
ozone for communities that may be significantly influenced by pollution from transboundary source
regions or high background levels. Regional scale stations (see Section 5.3) are typically appropriate for
this objective. The GDAD (Guidance Document on Achievement Determination) provides the following
recommendations regarding the siting of regional transport and background monitors for demonstrating
transboundary influence and high background levels.
Transboundary Influence
• Jurisdictions should identify one or more monitoring sites upwind of the non-compliant community in
question, located between the community and the major source area that may be affecting it.
• In the case of a community adjacent to… a border with another province/territory, the measurement
site may have to be at a near-border location within the community, upwind of the community core.
Similarly, for a community on the shores of a border water body, the measurement site should be sited
within the community near the shoreline, upwind of the community core.
• Jurisdictions should measure PM2.5 (including chemical speciation for major inorganic ions as a
minimum), ozone and local winds at this site using standard methods accepted by the National Air
Pollution Surveillance (NAPS) Monitoring Network or the Canadian Air and Precipitation Monitoring
Network (CAPMoN).
• If it is likely that precursor pollutants are being transported from the upwind jurisdiction and are
contributing to PM2.5 or ozone levels in the community, then jurisdictions should measure ambient
concentrations of NO, all oxidized nitrogen compounds (NOY), NH3, SO2 and VOC (including speciation).
Influence from Background or Natural Events
• Jurisdictions should identify one or more monitoring sites upwind of the non-compliant community in
question and in a location that is not downwind of any major anthropogenic source area.
• Depending on the pollutant in question, jurisdictions should measure PM2.5 (including chemical
speciation for major inorganic ions as a minimum), ozone and local winds at this site using standard
methods accepted by NAPS or CAPMoN.
• Jurisdictions should also measure ambient concentrations of VOC, including isoprene and terpenes.
Isoprene is a primary precursor of ozone, and terpenes are important precursors of the organic
component of PM2.5.
Table 8 of (CCME, 2011) provides the specification for CAPMoN station siting, which is reproduced below:
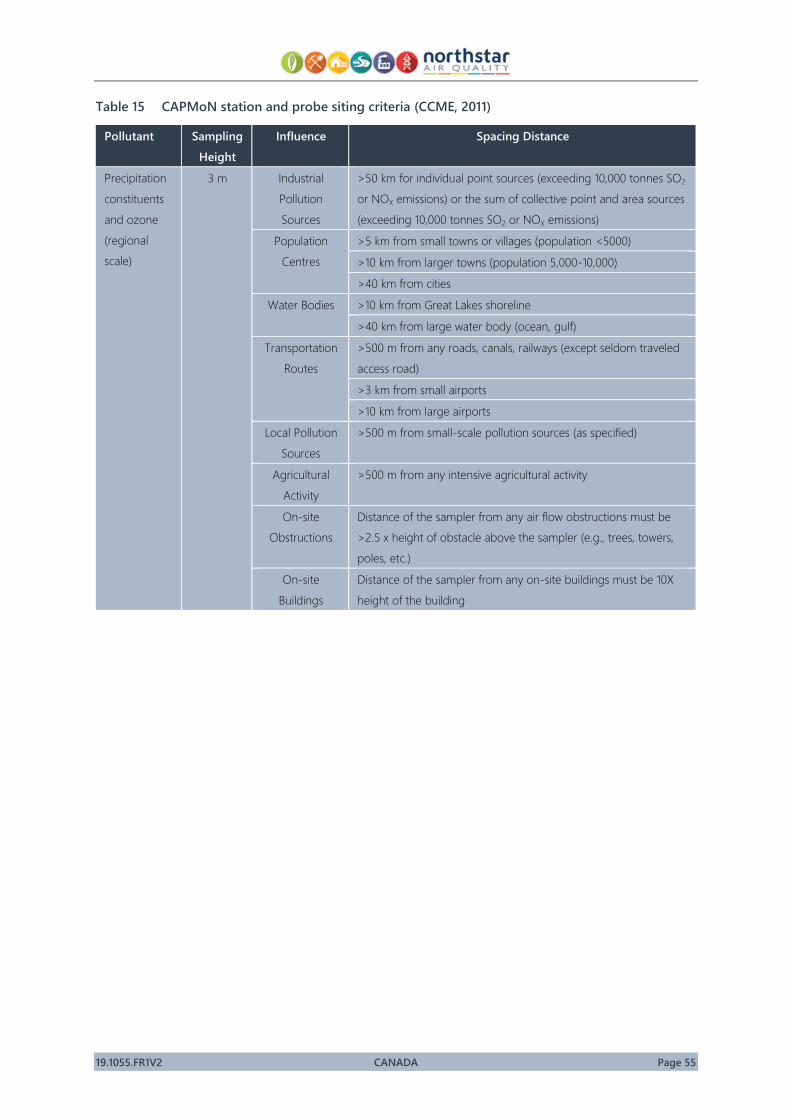
19.1055.FR1V2 CANADA Page 55
Table 15 CAPMoN station and probe siting criteria (CCME, 2011)
Pollutant Sampling
Height
Influence Spacing Distance
Precipitation
constituents
and ozone
(regional
scale)
3 m Industrial
Pollution
Sources
>50 km for individual point sources (exceeding 10,000 tonnes SO2
or NOX emissions) or the sum of collective point and area sources
(exceeding 10,000 tonnes SO2 or NOX emissions)
Population
Centres
>5 km from small towns or villages (population <5000)
>10 km from larger towns (population 5,000-10,000)
>40 km from cities
Water Bodies >10 km from Great Lakes shoreline
>40 km from large water body (ocean, gulf)
Transportation
Routes
>500 m from any roads, canals, railways (except seldom traveled
access road)
>3 km from small airports
>10 km from large airports
Local Pollution
Sources
>500 m from small-scale pollution sources (as specified)
Agricultural
Activity
>500 m from any intensive agricultural activity
On-site
Obstructions
Distance of the sampler from any air flow obstructions must be
>2.5 x height of obstacle above the sampler (e.g., trees, towers,
poles, etc.)
On-site
Buildings
Distance of the sampler from any on-site buildings must be 10X
height of the building
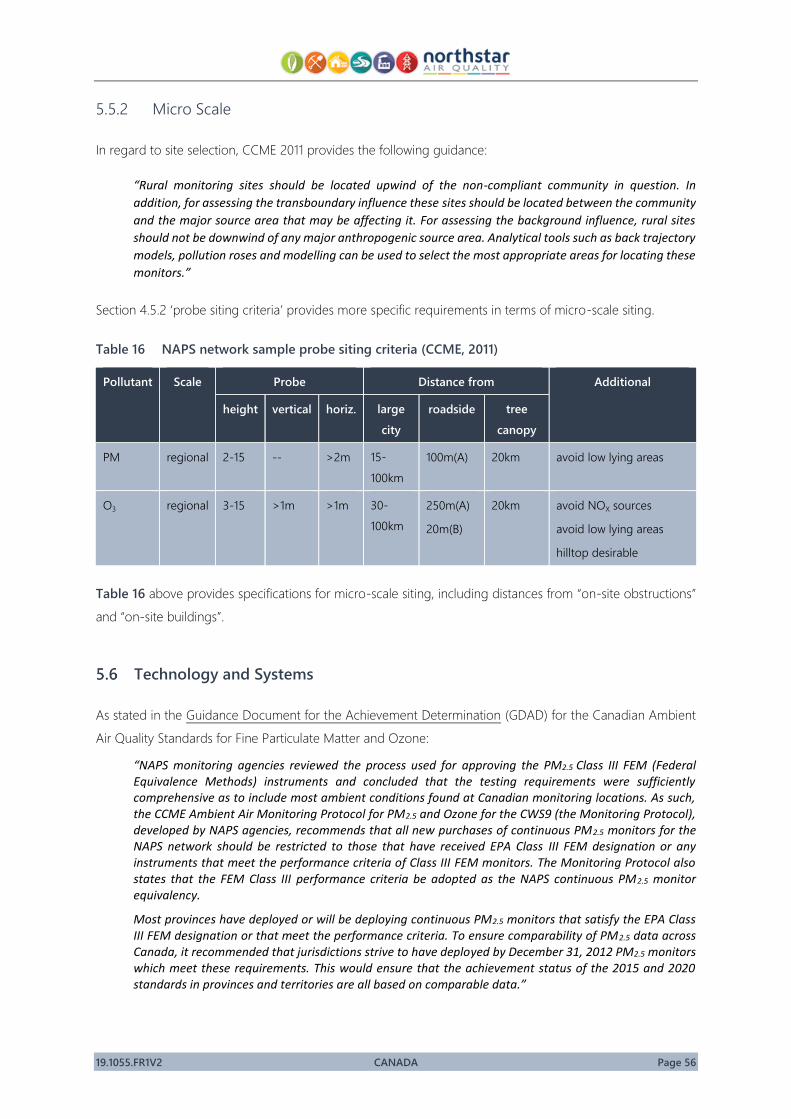
19.1055.FR1V2 CANADA Page 56
5.5.2 Micro Scale
In regard to site selection, CCME 2011 provides the following guidance:
“Rural monitoring sites should be located upwind of the non-compliant community in question. In
addition, for assessing the transboundary influence these sites should be located between the community
and the major source area that may be affecting it. For assessing the background influence, rural sites
should not be downwind of any major anthropogenic source area. Analytical tools such as back trajectory
models, pollution roses and modelling can be used to select the most appropriate areas for locating these
monitors.”
Section 4.5.2 ‘probe siting criteria’ provides more specific requirements in terms of micro-scale siting.
Table 16 NAPS network sample probe siting criteria (CCME, 2011)
Pollutant Scale Probe Distance from Additional
height vertical horiz. large
city
roadside tree
canopy
PM regional 2-15 -- >2m 15-
100km
100m(A) 20km avoid low lying areas
O3 regional 3-15 >1m >1m 30-
100km
250m(A)
20m(B)
20km avoid NOX sources
avoid low lying areas
hilltop desirable
Table 16 above provides specifications for micro-scale siting, including distances from “on-site obstructions”
and “on-site buildings”.
Technology and Systems
As stated in the Guidance Document for the Achievement Determination (GDAD) for the Canadian Ambient
Air Quality Standards for Fine Particulate Matter and Ozone:
“NAPS monitoring agencies reviewed the process used for approving the PM2.5 Class III FEM (Federal Equivalence Methods) instruments and concluded that the testing requirements were sufficiently comprehensive as to include most ambient conditions found at Canadian monitoring locations. As such, the CCME Ambient Air Monitoring Protocol for PM2.5 and Ozone for the CWS9 (the Monitoring Protocol), developed by NAPS agencies, recommends that all new purchases of continuous PM2.5 monitors for the NAPS network should be restricted to those that have received EPA Class III FEM designation or any instruments that meet the performance criteria of Class III FEM monitors. The Monitoring Protocol also states that the FEM Class III performance criteria be adopted as the NAPS continuous PM2.5 monitor equivalency.
Most provinces have deployed or will be deploying continuous PM2.5 monitors that satisfy the EPA Class III FEM designation or that meet the performance criteria. To ensure comparability of PM2.5 data across Canada, it recommended that jurisdictions strive to have deployed by December 31, 2012 PM2.5 monitors which meet these requirements. This would ensure that the achievement status of the 2015 and 2020 standards in provinces and territories are all based on comparable data.”

19.1055.FR1V2 CANADA Page 57
Quality Assurance/Quality Control (QA/QC) and data management standards are important elements of any
monitoring program. The Monitoring Protocol identifies NAPS procedures as the standards to be applied to
ambient monitoring of PM2.5 and O3. As a minimum, participating networks should meet NAPS Quality
Assurance and Quality Control Guidelines (EC, 2004).
Continuous samplers permitted under the Monitoring Protocol include:
• TEOM, TEOM-FDMS
• BAM-1020
• GRIMM particle monitor
• Synchronised hybrid ambient real-time particulate (SHARP) monitor
Due to the requirement for PM2.5 speciation, PM2.5 sampling using non-continuous sampling methods is also
permitted. The Monitoring Protocol permits the following gravimetric determinations for PM2.5:
• Dichotomous samplers, complying with US EPA Class II FEMs
• US Federal Reference Method (FRM)
Further details may be accessed directly from the Monitoring Protocol3.
3 https://www.ccme.ca/files/Resources/air/pm_ozone/pm_oz_cws_monitoring_protocol_pn1456_e.pdf

19.1055.FR1V2 CANADA Page 58
This page has been left intentionally blank
19.1055.FR1V2 SUMMARY AND CONCLUSIONS Page 59
6. SUMMARY AND CONCLUSIONS
A summary of the definitions, purposes, macro and micro scale siting criteria as identified and discussed in
the report are provided in the following:
Table 17 Comparison of definitions
Table 18 Comparison of purposes
Table 19 Comparison of macro scale siting criteria
Table 20 Comparison of micro scale siting criteria
Table 21 Comparison of monitoring methods
Several points of consistency can be identified between the definitions of background monitoring including:
• The reference to homogeneous land use and geographies (Australia and United States);
• The distance from large pollutant sources (United State, European Union and Canada); and,
• Scales of 10’s to 100’s of kilometres (United States and European Union).
Population density is not specifically mentioned apart from in European Union definitions (lower population
density) and briefly in US EPA regulations where regional scale measurements of PM2.5 should be applicable
to “sparsely populated areas”. No specific values of population densities have been identified in any guidance.
In relation to the purposes of background air quality monitoring, these stations can be used to assess
compliance, although are more often used to inform the potential contribution from long range transport of
pollutants (especially fine particulate [often speciated], and O3), and to support source apportionment analysis
and management, which is the case in the US IMPROVE network. It can also be used to determine the
influence of natural events from other sources for the assessment of criteria achievement.
In terms of siting, several points of commonality have been identified.
• All jurisdictions require that the stations are located so as to provide information representative of the
broader location in which they are situated which requires placement away from local sources of
pollutants being monitored.
• Regional scale measurements of PM2.5 (speciated) and O3 are most commonly discussed in reference
to that spatial scale, and in the case of potential precursor transportation (PM2.5 and O3), Canada also
requires measurements of NO, all oxidised nitrogen compounds (NOY), NH3, SO2 and VOC (including
speciation).
19.1055.FR1V2 SUMMARY AND CONCLUSIONS Page 60
• When siting an O3 monitor for regional scale background measurements, the US EPA requires that
meteorological analysis of trajectories and emission patterns be performed to assist that determination.
• When siting a BAQM, a hierarchical approach is likely to be the most successful, with the determination
of the purpose of the background monitoring being the key consideration. Site selection criteria,
including the macro and micro scale criteria presented within this review, should be considered according
to the purpose, with station and plot design being an important but lower order consideration when
compared to the overall purpose of monitoring.
• Spacing from trees is specified as being required as:
▪ 10 m from the drip line (US EPA)
▪ 20 km from the tree canopy (Canada)
▪ Clear sky angles (various) (Australia, EU)
This is a significant difference in the required spacing from trees in the different jurisdictions reviewed.
• Micro scale siting criteria are generally similar between jurisdictions and do not have any varying
requirements depending on station type (i.e. BAQMS or other).
• No discussion of any variation in monitoring techniques from urban through to background scales is
provided within any of the documentation reviewed. A more detailed review of the technical
specifications of monitoring techniques which are currently approved for use within NSW, and selection
of those with a broader range, or lower minimum threshold could be investigated.
• No specific requirements for the measurement of meteorological parameters at BAQMS is provided
within any of the literature reviewed. As outlined within the case studies, some sites do not measure
these parameters at all, some do, and some rely on modelled data. The implementation of
meteorological monitoring should be aligned with the purpose(s) of the BAQM.
• It is clear from this review that any specific monitoring station does not have to meet the requirements
appropriate for ‘background’ for all pollutants. Often (see case study for California in Section 3), a
station will be representative of background or regional conditions for one pollutant, but be
representative of a completely different scale for another. In the case study for the UK in Section 4
however, the station reviewed is located appropriately to be representative of background conditions
for all pollutants monitored.
19.1055.FR1V2 SUMMARY AND CONCLUSIONS Page 61
Further to the above, from review of the reference material for all jurisdictions, a background monitoring
station can be pollutant-specific, or monitor multiple pollutants, so long as the relevant siting criteria are
satisfied. Adopting a common rationale may conclude that an existing station in the NSW OEH network may
be suitable for background monitoring purposes for a specific pollutant, although analysis (especially of
sources of emissions and meteorology) should be performed prior to that designation.
As may be expected, no pre-determination is provided in the reviewed guidance prescribing a concentration
of air pollutants that may be considered to represent a ‘background’ condition. This is expected as the
background will be determined by the geography, source strength and location and a variety of other factors
including topography, distance between agglomerations etcetera.

19.1055.FR1V2 SUMMARY AND CONCLUSIONS Page 62
Table 17 Comparison of definitions
Jurisdiction Definition Source
Australia “Background sites are located in urban or rural areas to provide information on background levels. Background sites are usually
in areas of homogeneous land use and geography. These sites can be especially useful for assessing transportation of pollutants
into a region.”
AS/NZS 3580.1.1:2016
United States “Regional scale—Defines usually a rural area of reasonably homogeneous geography without large sources, and extends from
tens to hundreds of kilometres.”
40 CFR Part 58
European Union “ ‘urban background locations’ shall mean places in urban areas where levels are representative of the exposure of the general
urban population”
Rural background station - “Station located in areas with lower population density, e.g. with natural ecosystems, forests, at a
distance of at least 20 km from urban and industrial areas and away from local emissions;
avoid locations which are subject to locally enhanced formation of near-ground inversion conditions, also summits of higher
mountains;
coastal sites with pronounced diurnal wind cycles of local character are not recommended”
Further site ‘types’ are provided in the CAFE Directive including ‘traffic’, ‘industrial’ and ‘suburban’.
The UK DEFRA have adopted these site classifications to represent the nature of the surrounding area (urban, suburban, or rural)
and the type of pollution sources involved (traffic, industrial, or background [i.e. not located close to any specific emission
source]). Sites can then be described as (for example) urban traffic, or rural background.
Directive 2008/50/EC
Canada “Background concentrations are the ambient levels resulting from anthropogenic and natural emissions outside North America
and natural sources within North America”. There is also a scientific definition of “background concentrations”, where the levels
originate from natural sources only.”
GDAD for the CAAQS
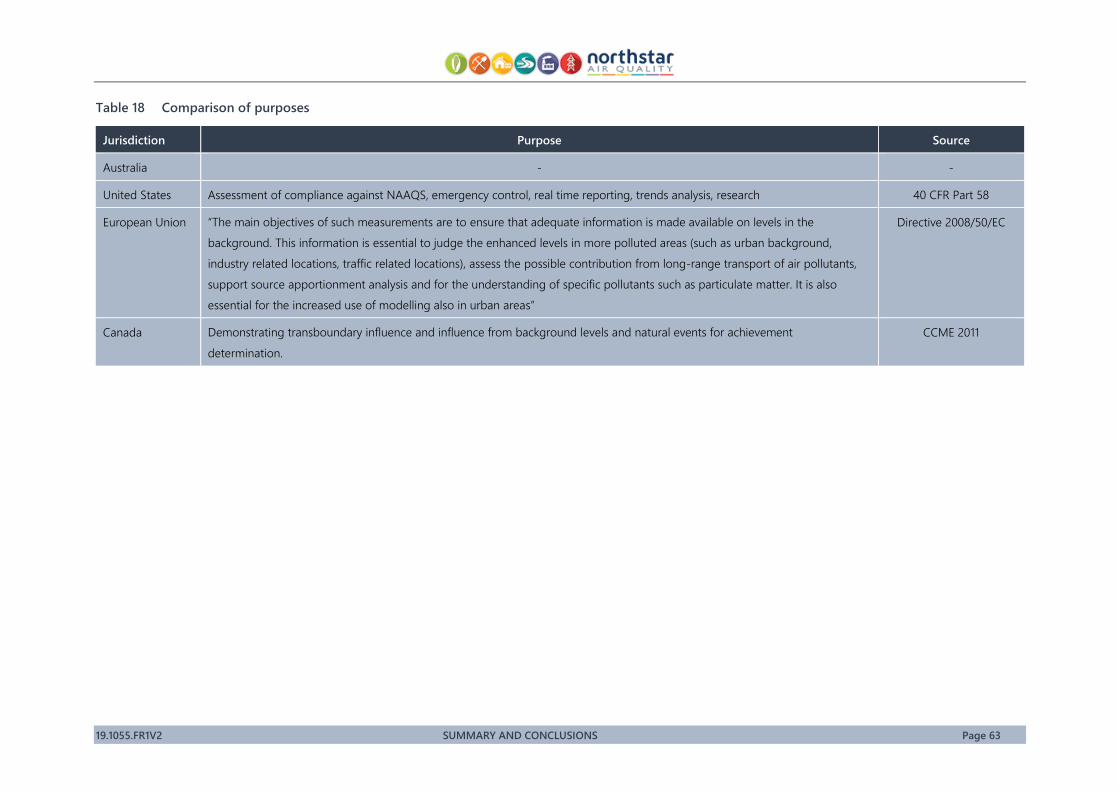
19.1055.FR1V2 SUMMARY AND CONCLUSIONS Page 63
Table 18 Comparison of purposes
Jurisdiction Purpose Source
Australia - -
United States Assessment of compliance against NAAQS, emergency control, real time reporting, trends analysis, research 40 CFR Part 58
European Union “The main objectives of such measurements are to ensure that adequate information is made available on levels in the
background. This information is essential to judge the enhanced levels in more polluted areas (such as urban background,
industry related locations, traffic related locations), assess the possible contribution from long-range transport of air pollutants,
support source apportionment analysis and for the understanding of specific pollutants such as particulate matter. It is also
essential for the increased use of modelling also in urban areas”
Directive 2008/50/EC
Canada Demonstrating transboundary influence and influence from background levels and natural events for achievement
determination.
CCME 2011
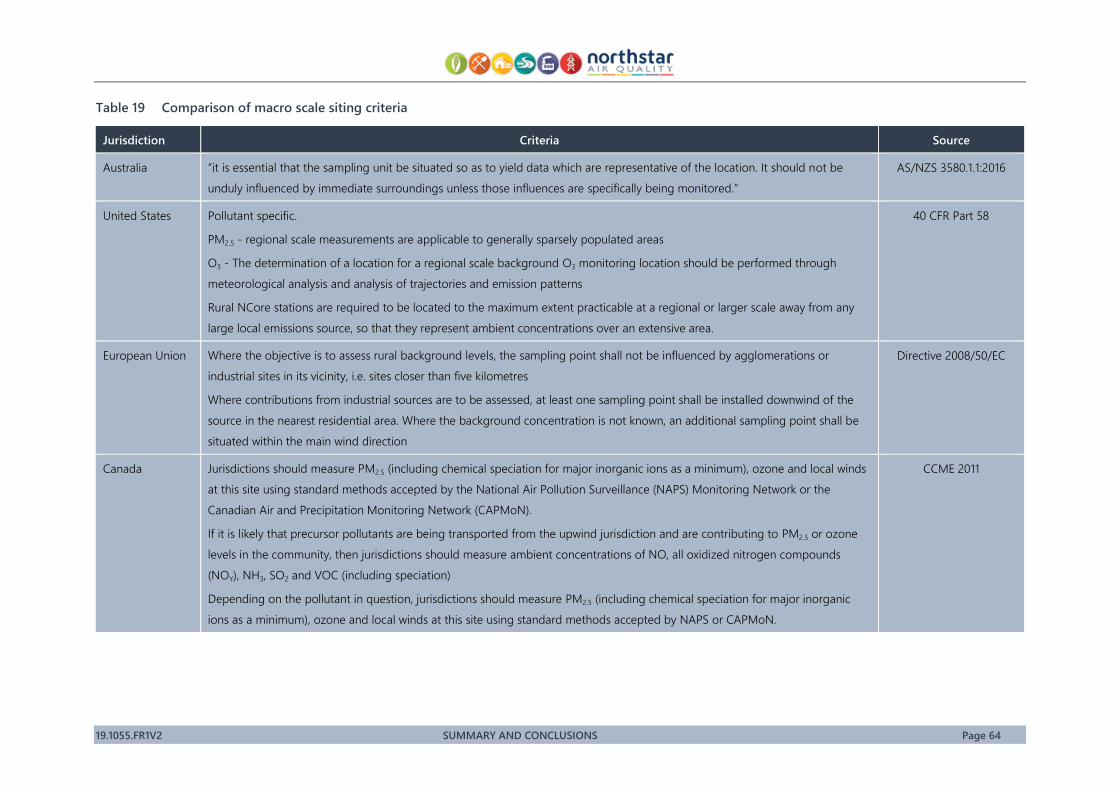
19.1055.FR1V2 SUMMARY AND CONCLUSIONS Page 64
Table 19 Comparison of macro scale siting criteria
Jurisdiction Criteria Source
Australia “it is essential that the sampling unit be situated so as to yield data which are representative of the location. It should not be
unduly influenced by immediate surroundings unless those influences are specifically being monitored.”
AS/NZS 3580.1.1:2016
United States Pollutant specific.
PM2.5 - regional scale measurements are applicable to generally sparsely populated areas
O3 - The determination of a location for a regional scale background O3 monitoring location should be performed through
meteorological analysis and analysis of trajectories and emission patterns
Rural NCore stations are required to be located to the maximum extent practicable at a regional or larger scale away from any
large local emissions source, so that they represent ambient concentrations over an extensive area.
40 CFR Part 58
European Union Where the objective is to assess rural background levels, the sampling point shall not be influenced by agglomerations or
industrial sites in its vicinity, i.e. sites closer than five kilometres
Where contributions from industrial sources are to be assessed, at least one sampling point shall be installed downwind of the
source in the nearest residential area. Where the background concentration is not known, an additional sampling point shall be
situated within the main wind direction
Directive 2008/50/EC
Canada Jurisdictions should measure PM2.5 (including chemical speciation for major inorganic ions as a minimum), ozone and local winds
at this site using standard methods accepted by the National Air Pollution Surveillance (NAPS) Monitoring Network or the
Canadian Air and Precipitation Monitoring Network (CAPMoN).
If it is likely that precursor pollutants are being transported from the upwind jurisdiction and are contributing to PM2.5 or ozone
levels in the community, then jurisdictions should measure ambient concentrations of NO, all oxidized nitrogen compounds
(NOY), NH3, SO2 and VOC (including speciation)
Depending on the pollutant in question, jurisdictions should measure PM2.5 (including chemical speciation for major inorganic
ions as a minimum), ozone and local winds at this site using standard methods accepted by NAPS or CAPMoN.
CCME 2011
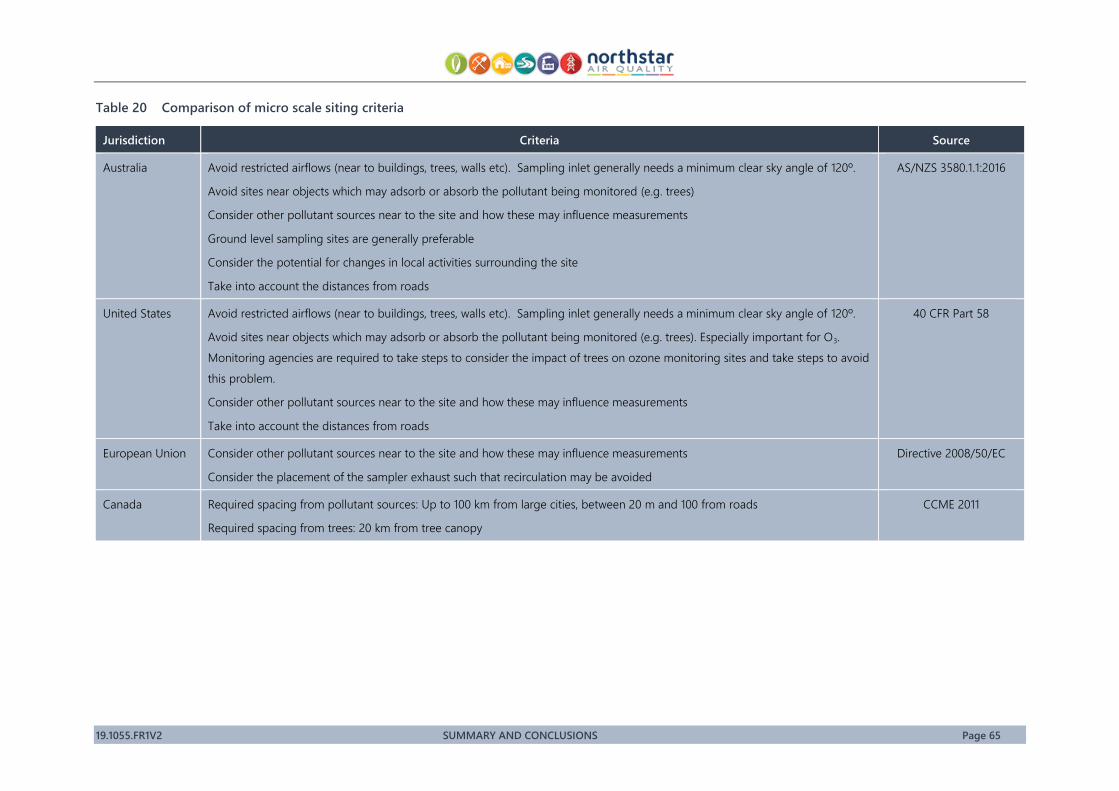
19.1055.FR1V2 SUMMARY AND CONCLUSIONS Page 65
Table 20 Comparison of micro scale siting criteria
Jurisdiction Criteria Source
Australia Avoid restricted airflows (near to buildings, trees, walls etc). Sampling inlet generally needs a minimum clear sky angle of 120º.
Avoid sites near objects which may adsorb or absorb the pollutant being monitored (e.g. trees)
Consider other pollutant sources near to the site and how these may influence measurements
Ground level sampling sites are generally preferable
Consider the potential for changes in local activities surrounding the site
Take into account the distances from roads
AS/NZS 3580.1.1:2016
United States Avoid restricted airflows (near to buildings, trees, walls etc). Sampling inlet generally needs a minimum clear sky angle of 120º.
Avoid sites near objects which may adsorb or absorb the pollutant being monitored (e.g. trees). Especially important for O3.
Monitoring agencies are required to take steps to consider the impact of trees on ozone monitoring sites and take steps to avoid
this problem.
Consider other pollutant sources near to the site and how these may influence measurements
Take into account the distances from roads
40 CFR Part 58
European Union Consider other pollutant sources near to the site and how these may influence measurements
Consider the placement of the sampler exhaust such that recirculation may be avoided
Directive 2008/50/EC
Canada Required spacing from pollutant sources: Up to 100 km from large cities, between 20 m and 100 from roads
Required spacing from trees: 20 km from tree canopy
CCME 2011
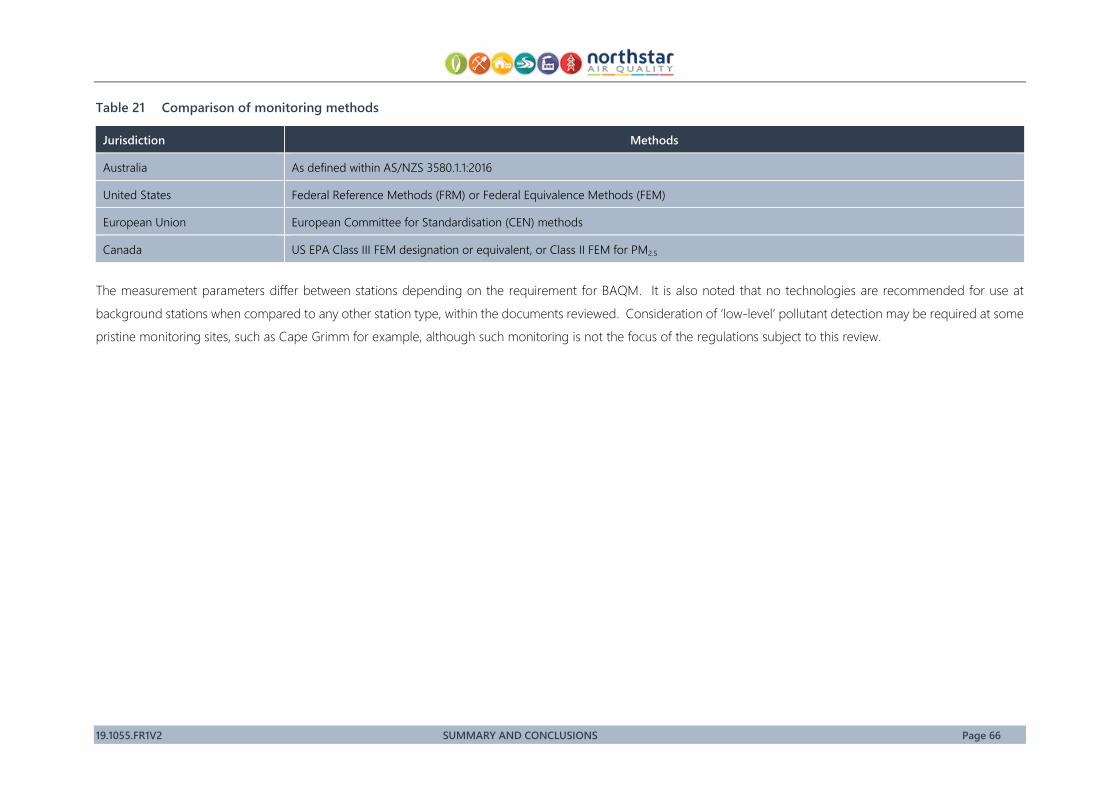
19.1055.FR1V2 SUMMARY AND CONCLUSIONS Page 66
Table 21 Comparison of monitoring methods
Jurisdiction Methods
Australia As defined within AS/NZS 3580.1.1:2016
United States Federal Reference Methods (FRM) or Federal Equivalence Methods (FEM)
European Union European Committee for Standardisation (CEN) methods
Canada US EPA Class III FEM designation or equivalent, or Class II FEM for PM2.5
The measurement parameters differ between stations depending on the requirement for BAQM. It is also noted that no technologies are recommended for use at
background stations when compared to any other station type, within the documents reviewed. Consideration of ‘low-level’ pollutant detection may be required at some
pristine monitoring sites, such as Cape Grimm for example, although such monitoring is not the focus of the regulations subject to this review.
19.1055.FR1V2 REFERENCES Page 67
7. REFERENCES
Amaral, S. C. (2015). An Overview of Particulate Matter Measurement Instruments. Atmsophere, 6, 1327-
1345.
Canadian Council of Ministers of the Environment (CCME). (2012). Guidance Document on Achievement
Determination Canadian Ambient Air Quality Standards for Fine Particulate Matter and Ozone.
CCME. (2011). Ambient Air Monitoring Protocol for PM2.5 and Ozone.
CCME. (2011). Ambient Air Monitoring Protocol For PM2.5 and Ozone - Canada-wide Standards for
Particulate Matter and Ozone.
DEFRA. (2013). Air Quality Assessment Regime Review for the Ambient Air Quality Directive 2008/50/EC.
Gilliam, J., & Hall, E. (2016). Reference and Equivalent Methods Used to Measure National Ambient Air
Quality Standards (NAAQS) Criteria Air Pollutants - Volume I. U.S. Environmental Protection
Agency, Washington, DC, EPA/600/R-16/139.
Government of Western Australia Department of Health. (2016). Port Hedland Air Quality Health Risk
Assessment for Particulate Matter, Environmental Health Directorate, January 2016.
NEPC. (2010, July). Review of National Environment Protection (Ambient Air Quality) Measure, Discussion
Paper, Air Quality Standards.
NEPC. (2014, July). Draft Variation to the National Environment Protection (Ambient Air Quality) Measure,
Impact Statement, prepared for National Environment Protection Council.
Ricardo AEA. (2012). Automatic Urban and Rural Network: Site Operator's Manual, Defra and the Devolved
Adminisations.
UCDavis. (2017a). UCD IMPROVE Standard Operating Procedure #126 Site Selection Version 2.2.
UCDavis. (2017b). UCD IMPROVE Standard Operating Procedure #151 Installation of Samplers.
US EPA. (1998). Guideline for Ozone Monitoring Site Selection (Report No. EPA-454/R-98-002).
USEPA. (1997). Guidance for Network Design and Optimum Site Exposure for PM2.5 and PM10.
USEPA. (2017). QA Handbook for Air Pollution Measurement Systems Volume 2 Section 6.
USEPA. (2018). List of Designated Reference and Equivalent Methods, Issue Date - December 15 2018.