design of a hydraulic nozzle with a narrow droplet size ... · design of a hydraulic nozzle with a...
TRANSCRIPT
i
COMMUNAUTÉ FRANÇAISE DE BELGIQUE
UNIVERSITÉ DE LIÈGE - GEMBLOUX AGRO BIO-TECH
DESIGN OF A HYDRAULIC NOZZLE WITH A
NARROW DROPLET SIZE DISTRIBUTION
Nicolas DE COCK
A dissertation presented for the degree of Doctor of Philosophy in Agricultural Sciences andBiological Engineering
Supervisors: Frédéric LebeauBenoit MercatorisMaria Rosaria Vetrano
2017

ii

iii
COMMUNAUTÉ FRANÇAISE DE BELGIQUE
UNIVERSITÉ DE LIÈGE - GEMBLOUX AGRO BIO-TECH
DESIGN OF A HYDRAULIC NOZZLE WITH A
NARROW DROPLET SIZE DISTRIBUTION
Nicolas DE COCK
A dissertation presented for the degree of Doctor of Philosophy in Agricultural Sciences andBiological Engineering
Supervisors: Frédéric LebeauBenoit MercatorisMaria Rosaria Vetrano


Copyright. Aux termes de la loi belge du 30 juin 1994, sur le droit d’auteur et les droitsvoisins, seul l’auteur a le droit de reproduire partiellement ou complètement cet ouvrage dequelque façon et forme que ce soit ou d’en autoriser la reproduction partielle ou complète dequelque maniére et sous quelque forme que ce soit. Toute photocopie ou reproduction sous
autre forme est donc faite en violation de la dite loi et de des modifications ultérieures.


Acknowledgements
First of all, I would like to thanks the F.R.N.S for the funding of my PhD with a FRIA grant.
I would like to thanks Frédéric for his strong support during these years. You helped meto improve and challenge myself. Your ability to always see the bright side of things andyour passion for research brought me the motivation to realize this PhD. I also thanks themembers of my thesis Jury for the comments and advises they provide to me during thesefours years: Denis Terwagne, Benoit Mercatoris, Maria Rosaria Vetrano, Pieter Verboven,Stéphane Dorbolo and Philippe Lejeune.
I have a thought for my PhD colleague and friends from VKI: Nuno, Giusseppe, Sara,Julien, Roberto, Aude,... Sharing this experience together help me to keep motivate duringthese years !
Merci à Mathieu de m’avoir fait grandement progressé au ping pong et surtout pour cessuper années à partager le bureau. A remercierement particulier à Rudy Schartz pour son aideprécieuse et surtout sa patience. Une pensée également pour mes autres collègues, Sofiene,Benjamin, Benoît, Vincent, Jean-François, Françoise, Arnaud, Alwin, Éric.
Je remercie également ma famille sans qui je n’en serais pas arrivé là. Merci à mesparents et beaux parents pour leur soutien et encouragement pendant ces années ! Merci àames frères et soeurs.
Une pensée aussi pour mes amis qui ne pensaient pas qu’on pouvait vraiment faire undoctorat sur les gouttes... Pourtant les 4 années sont passées bien vite ! Merci pour votresupport, Tanguy, Kacem, William, Hélène, Polé, Tony, Julien, ...
Il faut garder le meilleur pour la fin, merci à toi Anne-Sophie pour ton amour et tonsupport durant ces années. Une pensée particulière à ta patience pendant la période derédaction !


Summary
Nowadays, pesticides use is necessary to satisfy the growing demand for agricultural products.During pesticide spray application, the agricultural mixture containing the active ingredientis fragmented to a cloud of droplets of various sizes and speeds. The droplet size distributionwithin the spray affects the efficiency of the treatment. According to the target, a specificdroplet size should be used. However, hydraulic nozzles usually used in field applicationproduce sprays with a wide droplet size distribution containing an important proportion ofsmall or too large droplets. This results in non-optimal application and therefore losses ofproduct into the environment. This statement conducted the research as early as in the 60’sto create the rotary atomizer. This device is able to produce narrow droplet size distributionusing Plateau-Rayleigh break up mechanism. The characteristics of the produced spray bythe rotary atomizer can be tuned by adjusting the rotational speed and the volumetric flowrate. Although offering agronomic and environmental qualities this has not met success forthe application of plant protection products in field crops because of their cost, size andcomplexity. The aim of the thesis was the design of a hydraulic nozzle with the rotary atomizerqualities and without the constraints of rotating parts. Unlike the rotary atomizer which hastwo control variables, the developed hydraulic nozzle will have a narrower operating range,thus a specific geometry has to be design for each kind of treatment. The new hydraulicnozzle design is composed by an inlet pipe ending perpendicularly on a plate. There is a thinopening at the junction between the pipe and the plate. The edge of the plate is constitutedof channels formed by structures. These channels aim to divide the liquid sheet in multiplejets. The breakup of these jets into droplets generate a narrow droplet size distribution. Thethesis can been seen as a road-map providing design tools at each step starting from thedetermination of an optimal droplet size according to the kind of treatment and ending with anozzle geometry.
The optimization of both spray deposition and retention leads to a dilemma: shouldsmall droplets be used to increase retention or large droplets be preferred to avoid drift?An ideal droplet should have a short time of flight to minimize its distance traveled whileimpacting the target with a moderate kinetic energy. The prediction of the optimal dropletsize according to the treatment was done using integrated modeling approach of the spray

x
transport and retention by the plant. The main parameters of spray deposition and retentionmodels were systematically varied and the effects on drift potential and droplet impactionoutcomes are discussed. The results of the numerical simulations showed that droplets withdiameter ranging between 200 µm and 250 µm offer high control of deposition by combininga low drift potential and a moderate kinetic energy at top of the canopy. A fourfold reductionof the volume drifting further than 2 m from the nozzle was observed for a spray with avolume median diameter of 225 µm when the relative span factor of the droplet spectrum wasreduced from 1.0 to 0.6. In the latter scenario, an increase from 63 to 67% of the volumetricproportion of droplets adhering to the wheat leaf was observed. Therefore, strategies forcontrolling the droplet size distribution may offer promising solutions for reducing adverseimpact of spray applications on environment.
The experimental characterization of agricultural sprays is usually performed usingoptical techniques. At present, the relevance of different characterization techniques remainscontroversial since discrepancies may be significant between measurements performedin different laboratories. A digital image acquisition technique and analysis algorithmhas been developed for droplet size and velocimetry measurements as an alternative towell-established techniques such as the Phase Doppler Particle Analyzer (PDPA) or laserdiffraction spectrometry (LDS). The algorithm requires double exposed shadow imagesacquired in a back-lighted arrangement with a Particle Image Velocimetry (PIV) cameraand a pulsed light emitting diode (LED). Spatial illumination heterogeneities are correctedby subtracting from each image a mean background acquired on several images withoutany particle. The algorithm accuracy is ensured by the rejection of out-of-focus particlesusing a focus parameter depending on gradient intensity at the particle edges. Thresholds forfocus particle selection were determined by studying the evolution of the focus parameterand the error on particle size measurements from images containing droplets with uniformsize at various distance of the object plane. Selected droplets were identified on both pairsof images to determine their size and velocity. Droplet size distributions were correctedto account for the uneven sampling probability caused by the volumetric method. Dropletsize distributions of a set of reference nozzle/pressure combinations defined in the ISO/DIS25358 were measured. The image technique was able to distinguish each of the referencesprays well. Comparison with PDPA measurements showed that the imaging techniquetends to measure an equivalent Dv50, a lower Dv10 and a higher Dv90 leading therefore to ahigher relative span factor. Velocity measurements showed good agreement between bothtechniques except for one nozzle/pressure combination.
The analytical description of the flow on the nozzle plate is based on an extension of theanalytical solution of the radial spread of a liquid jet over a horizontal surface. When the

xi
gap, H, between the jet nozzle and the plate is reduced the discharging area may be smallerthan the inlet area leading to an increase of the main flow velocity downstream of the thincylindrical opening. This increase of velocity, defined here as 1
α, can be related to the relative
gap of the nozzle HR with R the nozzle pipe radius. The development of this analytical model
is based on Computational Fluid Dynamics (CFD) simulations using a Volume of Fluid model(VoF). Numerical computations were realized with for H
R ranging from 0.2 to 3 and with flowrates Q of 3 and 6 ℓmin−1. The results of these computations allowed to express α in respectof H
R . Taking into account the flow acceleration allowed to extend the set of equation fromthe jet impacting flow to the thin cylindrical opening flow. The liquid layer thickness and thesurface velocity differ with a maximum error of 4 % between the flow predicted by the modeland computations. Main discrepancies appear in the region close to the inlet exit where theanalytical model assumption of a constant velocity outside the boundary layer is not valid.However, further downstream the model and the computations are in good agreement. OtherCFD simulations have been realized to investigate the sensitivity of a splash plate nozzle flowto the inlet geometry and the inlet flow rate. The sensitivity study of the nozzle geometryand the inlet flow rate on the downstream flow allowed us to see a strong effect of bothparameters. The flow rate increase lead to a more homogeneous flow for most of the cases.The inlet shape affects significantly the downstream flow. The 140◦ circular segment inletseems suitable for our objective of generating a homogeneous flow on the nozzle plate.
Finally, using the latter model, a theoretical nozzle design has been established in order toproduce a spray with droplets with diameter of 225 µm (§ 6). The prototyping of this designcouldn’t be achieved because of its small dimension. However, the design methodology hasbeen validated on a upscale nozzle model. The spray generated by the upscale nozzle hasbeen characterized using high-speed imaging showing a narrow droplet size distribution.


Résumé
De nos jours, les pesticides sont largement utilisés pour satisfaire la demande croissanteen produits agricoles. Lors de l’application de produits phytosanitaires, la bouillie agricolecontenant la matière active est fragmentée en un nuage de gouttelettes de tailles et vitessesvariées. La distribution granulométrique au sein de ce nuage ou pulvérisation agricole affectesignificativement l’efficacité du traitement. Selon la cible traitée, une taille de gouttelettespécifique doit être priviliégée. L’application en champs est généralement réalisée en utilisantdes buses à travers lequel la bouillie est éjectée sous pression. Ce type de buse appelébuse hydraulique génère des pulvérisation agricoles avec une large distribution de taillede gouttelettes. Par conséquent, cela entraine une application non optimale et donc despertes de produit dans l’environnement. Cette observation au developpement de nouveaudispostif tel que l’atomiseur rotatif. Cet actionneur est capable de produire une distributionde taille de gouttelettes étroite en utilisant le mécanisme de rupture de Plateau-Rayleigh.Les caractéristiques de la pulvérisation produite par l’atomiseur rotatif peuvent être régléesen ajustant la vitesse de rotation et le débit volumétrique. Bien qu’offrant des qualitésagronomiques et environnementales indéniables, ce dispositif n’a pas été un succès pourl’application de produits phytophasanitaires en grandes cultures en raison de son coût, de sataille et de sa complexité. Le but de cette thèse était la conception d’une buse hydrauliquepossédant les qualités de l’atomiseur rotatif et sans les contraintes des pièces en rotation.Contrairement à l’atomiseur rotatif qui a deux variables de contrôle (vitesse de rotation etdébit), la nouvelle buse hydraulique développée naura une plage de fonctionnement plusétroite, une géométrie spécifique doit être conçue pour chaque type de traitement. Cettenouvelle buse hydraulique est composée d’une tuyère se terminant perpendiculairement surune plaque. À la jonction entre le tuyau et la plaque, il y a une mince ouverture. Le bord dela plaque est constitué de canaux. Ces canaux visent à diviser la nappe liquide en plusieursjets. La rupture de ces jets en gouttelettes génère une distribution de taille de gouttelettesétroite. La thèse se présente comme une feuille de route fournissant des outils de conceptionà chaque étape à débutant par la détermination d’une taille de gouttelette optimale en fonctiondu type de traitement et se terminant par une géométrie de buse.

xiv
L’optimisation du dépôt et de la rétention de la pulvérisation agricole conduit à undilemme: faut-il utiliser de petites gouttelettes pour augmenter la rétention ou préférer degrosses gouttelettes pour éviter la dérive? Une gouttelette idéale devrait avoir une courtedurée de vol pour minimiser sa distance parcourue tout en affectant la cible avec une énergiecinétique modérée. La prédiction de la taille optimale des gouttelettes en fonction dutraitement a été faite en utilisant une approche de modélisation intégrée du transport parpulvérisation et de la rétention par la plante. Les principaux paramètres des modèles de dépôtet de rétention de pulvérisation ont été systématiquement modifiés et les effets sur le potentielde dérive et les résultats de la rétention des gouttelettes ont été discutés. Les résultats dessimulations numériques ont montré que les gouttelettes de diamètre compris entre 200 µm et250 µm offrent un contrôle élevé des dépôts en combinant un faible potentiel de dérive etune énergie cinétique modérée lorsqu’elles atteignent la canopée. On a observé une divisionpar quatre du volume de la dérive à plus de 2 m de la buse pour une pulvérisation ayant undiamètre médian en volume de 225 µm lorsque le facteur relatif d’étendue du spectre degouttelettes était réduit de 1,0 à 0,6 . Dans ce dernier cas, une augmentation de 63 à 67% dela proportion volumétrique de gouttelettes adhérant à la feuille de blé a été observée. Parconséquent, les stratégies de contrôle de la distribution de la taille des gouttelettes peuventoffrir des solutions prometteuses pour réduire l’impact négatif des applications de produitsphytosanitaires sur l’environnement.
La caractérisation expérimentale des pulvérisations agricoles est généralement réalisée àl’aide de techniques optiques. À l’heure actuelle, la pertinence des différentes techniques decaractérisation reste controversée puisque les écarts peuvent être importants entre les mesureseffectuées dans différents laboratoires. Une technique d’acquisition d’images numériques etun algorithme d’analyse ont été développés pour mesurer la taille et la vitesse des gouttelettescomme alternative aux techniques bien établies tel que l’analyseur de particules à phaseDoppler (PDPA) ou la spectrométrie de diffraction laser (LDS). Le suivi des gouttes estréalisée sur base de paire d’images acquises dans un court laps de temps. La pulvérisationétant rétro-éclairé, les gouttes apparaissent sous forme d’ombre au niveau de l’image. Cesimages sont ensuite traitées et puis analaysées. Dans un premier temps, les hétérogénéitésd’illumination spatiale sont corrigées en soustrayant de chaque image un arrièrre fond moyenacquis sur plusieurs images sans aucune particule. La précision de l’algorithme est assuréepar le rejet des particules défocalisées en utilisant un paramètre de focalisation dépendant del’intensité du gradient aux bords des particules. Les seuils de sélection des particules nettesont été déterminés en étudiant l’évolution du paramètre de focalisation et l’erreur sur lesmesures de taille de particules à partir d’images contenant des gouttelettes de taille uniformeà différentes distances du plan focal. Les gouttelettes sélectionnées ont été identifiées sur

xv
les deux paires d’images pour déterminer leur taille et leur vitesse. Les distributions de lataille des gouttelettes ont été corrigées pour tenir compte de la probabilité d’échantillonnageinégale causée par la méthode volumétrique. Les distributions de la taille des gouttelettes d’unensemble de combinaisons buse / pression de référence définies dans l’ISO / DIS 25358 ontété mesurées. La technique de l’image a permis de bien distinguer chacune des pulvérisationsde référence. La comparaison avec les mesures PDPA a montré que la technique d’imagerietend à mesurer un Dv50 équivalent, un Dv10 inférieur et un Dv90 supérieur conduisant ainsi àun facteur de portée relative plus élevé. Les mesures de vitesse ont montré un bon accordentre les deux techniques, à l’exception d’une combinaison buse / pression.
La description analytique de l’écoulement sur la plaque de la buse est basée sur uneextension de la solution analytique de la dispersion radiale d’un jet liquide sur une surfacehorizontale. Lorsque l’ouverture H à la jonction entre la plaque et la tuyère est réduite, lazone de décharge peut être plus petite que la zone d’entrée, ce qui conduit à une augmentationde la vitesse de l’écoulement en aval de l’ouverture. Cette augmentation de la vitesse, définieici comme 1
α, peut être liée à l’écart relatif de la buse H
R avec R le rayon du tuyau de buse.Le développement de ce modèle analytique a été basé sur des simulations de mécaniquedes fluides numérique (MFN) utilisant un modèle de volume de fluide (VoF). Les calculsnumériques ont été réalisés pour H
R allant de 0.2 à 3 et pour des débits Q de 3 et 6 ℓmin−1.Les résultats de ces calculs ont permis d’exprimer α par rapport à H
R . L’épaisseur de lacouche liquide et de la vitesse de surface diffèrent avec une erreur maximale de 4 % entre lemodèle et les calculs numériques. Les principales divergences apparaissent dans la régionproche de la sortie d’entrée où l’hypothèse du modèle analytique d’une vitesse constanteen dehors de la couche limite n’est pas valide. Cependant, plus en aval, le modèle et lescalculs fournissent des résultats similaires. D’autres simulations MFN ont été réalisées pourétudier la sensibilité d’un écoulement au niveau de la plaque à la géométrie de la tuyère etau débit d’entrée. L’étude de sensibilité de la géométrie de la buse et du débit d’entrée surl’écoulement aval a permis de constater un fort effet de ces deux paramètres. L’augmentationdu débit conduit à un écoulement plus homogène pour la plupart des cas. La forme del’entrée affecte significativement l’écoulement en aval. L’entrée du segment circulaire de140◦ semble convenir à notre objectif de générer un écoulement homogène sur la plaque debuse.
Finalement, en utilisant ce dernier modèle, un design de buse théorique a été établie afinde produire une pulvérisation avec des gouttelettes de diamètre 225 µm. Le prototypagede cette géométrie n’a pas pu être réalisé en raison de sa petite dimension. Cependant,la méthodologie de conception a été validée sur un modèle de buse haut de gamme. La

xvi
pulvérisation générée par la buse haut de gamme a été caractérisée en utilisant une imagerieà haute vitesse montrant une distribution de taille de gouttelettes étroite.
Table of contents
List of figures xxi
List of tables xxv
1 General introduction 11.1 Crop protection . . . . . . . . . . . . . . . . . . . . . . . . . . . . . . . . 11.2 Droplet size distribution of agricultural sprays . . . . . . . . . . . . . . . . 41.3 Rayleigh-Plateau breakup . . . . . . . . . . . . . . . . . . . . . . . . . . . 51.4 Thesis goals . . . . . . . . . . . . . . . . . . . . . . . . . . . . . . . . . . 71.5 Thesis organization . . . . . . . . . . . . . . . . . . . . . . . . . . . . . . 8
2 Investigation on optimal spray properties using modeling approach 92.1 Preamble . . . . . . . . . . . . . . . . . . . . . . . . . . . . . . . . . . . 92.2 Introduction . . . . . . . . . . . . . . . . . . . . . . . . . . . . . . . . . . 92.3 Materials and methods . . . . . . . . . . . . . . . . . . . . . . . . . . . . 12
2.3.1 Droplet deposition model . . . . . . . . . . . . . . . . . . . . . . . 122.3.2 Droplet retention model . . . . . . . . . . . . . . . . . . . . . . . 152.3.3 Numerical procedure . . . . . . . . . . . . . . . . . . . . . . . . . 162.3.4 Parameter sensitivity study . . . . . . . . . . . . . . . . . . . . . . 17
2.4 Results . . . . . . . . . . . . . . . . . . . . . . . . . . . . . . . . . . . . . 192.4.1 Sensitivity analysis of a population of monodisperse droplets . . . . 192.4.2 Polydisperse sprays . . . . . . . . . . . . . . . . . . . . . . . . . . 26
2.5 Discussion . . . . . . . . . . . . . . . . . . . . . . . . . . . . . . . . . . . 262.6 Conclusion . . . . . . . . . . . . . . . . . . . . . . . . . . . . . . . . . . 29
3 Characterization of droplet size and speed using high-speed imaging 333.1 Preamble . . . . . . . . . . . . . . . . . . . . . . . . . . . . . . . . . . . 333.2 Introduction . . . . . . . . . . . . . . . . . . . . . . . . . . . . . . . . . . 343.3 Materials and methods . . . . . . . . . . . . . . . . . . . . . . . . . . . . 36

xviii Table of contents
3.3.1 Experimental set-up . . . . . . . . . . . . . . . . . . . . . . . . . 363.3.2 Image processing . . . . . . . . . . . . . . . . . . . . . . . . . . . 373.3.3 Particle tracking velocimetry (PTV) . . . . . . . . . . . . . . . . . 403.3.4 Droplet size distribution . . . . . . . . . . . . . . . . . . . . . . . 413.3.5 Image processing implementation . . . . . . . . . . . . . . . . . . 423.3.6 Reference nozzles-pressure combinations . . . . . . . . . . . . . . 423.3.7 Measuring protocol . . . . . . . . . . . . . . . . . . . . . . . . . . 43
3.4 Results and discussion . . . . . . . . . . . . . . . . . . . . . . . . . . . . 453.4.1 Droplet measurement . . . . . . . . . . . . . . . . . . . . . . . . . 453.4.2 Effect of the correcting factor . . . . . . . . . . . . . . . . . . . . 463.4.3 Droplet size distribution . . . . . . . . . . . . . . . . . . . . . . . 463.4.4 Droplet velocity distribution . . . . . . . . . . . . . . . . . . . . . 50
3.5 Conclusion . . . . . . . . . . . . . . . . . . . . . . . . . . . . . . . . . . 523.6 Aknowledgments . . . . . . . . . . . . . . . . . . . . . . . . . . . . . . . 53
4 Numerical modelling of the effect of a splash plate nozzle inlet shape 554.1 Preamble . . . . . . . . . . . . . . . . . . . . . . . . . . . . . . . . . . . 554.2 Introduction . . . . . . . . . . . . . . . . . . . . . . . . . . . . . . . . . . 564.3 Materials and methods . . . . . . . . . . . . . . . . . . . . . . . . . . . . 57
4.3.1 Numerical model . . . . . . . . . . . . . . . . . . . . . . . . . . . 574.3.2 Validition case . . . . . . . . . . . . . . . . . . . . . . . . . . . . 584.3.3 Splash plate nozzle . . . . . . . . . . . . . . . . . . . . . . . . . . 59
4.4 Results . . . . . . . . . . . . . . . . . . . . . . . . . . . . . . . . . . . . . 614.4.1 Validation case . . . . . . . . . . . . . . . . . . . . . . . . . . . . 614.4.2 Splash plate nozzle . . . . . . . . . . . . . . . . . . . . . . . . . . 62
4.5 Conclusion . . . . . . . . . . . . . . . . . . . . . . . . . . . . . . . . . . 62
5 Dynamics of a thin radial liquid flow 675.1 Preamble . . . . . . . . . . . . . . . . . . . . . . . . . . . . . . . . . . . 675.2 Introduction . . . . . . . . . . . . . . . . . . . . . . . . . . . . . . . . . . 675.3 Theoretical developments . . . . . . . . . . . . . . . . . . . . . . . . . . . 70
5.3.1 Flow created by a round liquid jet impacting on a horizontal plate . 705.3.2 Radial flow of a thin liquid film . . . . . . . . . . . . . . . . . . . 72
5.4 Numerical modelling . . . . . . . . . . . . . . . . . . . . . . . . . . . . . 745.4.1 Computational domain . . . . . . . . . . . . . . . . . . . . . . . . 745.4.2 Computational parameters . . . . . . . . . . . . . . . . . . . . . . 745.4.3 Boundary conditions . . . . . . . . . . . . . . . . . . . . . . . . . 75

Table of contents xix
5.4.4 Numerical method . . . . . . . . . . . . . . . . . . . . . . . . . . 755.4.5 Post processing . . . . . . . . . . . . . . . . . . . . . . . . . . . . 755.4.6 Model quality . . . . . . . . . . . . . . . . . . . . . . . . . . . . . 76
5.5 Results and discussion . . . . . . . . . . . . . . . . . . . . . . . . . . . . 765.6 Conclusion . . . . . . . . . . . . . . . . . . . . . . . . . . . . . . . . . . 78
6 Nozzle with narrow droplet size distribution 816.1 Introduction . . . . . . . . . . . . . . . . . . . . . . . . . . . . . . . . . . 816.2 Nozzle geometry . . . . . . . . . . . . . . . . . . . . . . . . . . . . . . . 816.3 Design methodology . . . . . . . . . . . . . . . . . . . . . . . . . . . . . 826.4 Theoretical design . . . . . . . . . . . . . . . . . . . . . . . . . . . . . . . 846.5 Proof of concept . . . . . . . . . . . . . . . . . . . . . . . . . . . . . . . . 846.6 Conclusion . . . . . . . . . . . . . . . . . . . . . . . . . . . . . . . . . . 85
7 Conclusions and perspectives 89
References 91


List of figures
1.1 Sketch of the application of a systemic herbicide, from the droplet formationto the plant vascular system. . . . . . . . . . . . . . . . . . . . . . . . . . 3
1.2 Possible impact outcomes of a droplet hitting a superhydrophobic surface,depending on leaf hydrophobicity and droplet impact velocity (adapted fromBoukhalfa et al. (2014)). . . . . . . . . . . . . . . . . . . . . . . . . . . . 3
1.3 Illustration of the two breakup modes occurring at the exit of a rotary atomizer(a) and a hydraulic nozzle (b). . . . . . . . . . . . . . . . . . . . . . . . . 5
1.4 Breakup regimes of a cylindrical water jet in still air at atmospheric pressure. 61.5 Illustration of the nozzle with the three main regions: the nozzle pipe (1), the
disk (2), the disk structures (3). . . . . . . . . . . . . . . . . . . . . . . . . 7
2.1 Flow chart of the droplet transport model. . . . . . . . . . . . . . . . . . . 132.2 Initial configuration of the deposition model. . . . . . . . . . . . . . . . . . 162.3 Cumulative droplet size distribution of the virtual sprays for the six Dv50 and
the two RSF . . . . . . . . . . . . . . . . . . . . . . . . . . . . . . . . . . 182.4 Median vertical and horizontal velocity with respect to the droplet vertical
location. . . . . . . . . . . . . . . . . . . . . . . . . . . . . . . . . . . . . 192.5 Droplet trajectories under a wind of 2 m s−1 according to their sizes. . . . . 202.6 Effect of the release height, wind speed, release velocity and release angle
on the average of the log-normal fit arithmetic mean E.x . . . . . . . . . . 212.7 Effect of the release height, wind speed, release velocity and release angle
on the distance above which 95 % of the droplets have reach the top canopylevel X95. . . . . . . . . . . . . . . . . . . . . . . . . . . . . . . . . . . . 23
2.8 Droplet velocity and angle at top canopy level . . . . . . . . . . . . . . . . 242.9 Evolution of the relative volume evaporate in respect to the relative humidity
and the wind speed. . . . . . . . . . . . . . . . . . . . . . . . . . . . . . . 252.10 Volume of airborne spray in respect with distance. . . . . . . . . . . . . . . 272.11 Droplet impact outcome predictions at top canopy level. . . . . . . . . . . . 28

xxii List of figures
3.1 Shadowgraphy set-up used for the image acquisitions. . . . . . . . . . . . . 373.2 Main steps of the droplet sizing algorithm illustrated with the example of the
selection of droplets starting from a raw image. . . . . . . . . . . . . . . . 383.3 Oblique shoot of 111, 351 and 516 µm droplet streams (a). Focus parameter
(b) and relative error on the diameter measurement (c) in respect to thedistance from the focal plane. . . . . . . . . . . . . . . . . . . . . . . . . . 40
3.4 Depth of field for the different droplet diameters according to the focusparameter. The dashed lines correspond to linear regressions. . . . . . . . . 41
3.5 Droplet tracking principle using a search area based on the size conservationof the droplet and a priori knowledge of the flow direction in order to retrievethe same droplet on two successive frames. . . . . . . . . . . . . . . . . . 42
3.6 Illustration of the corrected field of view (FOVcor) in dashed line which isdefined as the area on the first image wherein the droplet center must belocated in order to be measured. To be measured a droplet cannot be croppedby the image edge and has to fully appear on the second image. . . . . . . . 43
3.7 Scanning pattern used for the characterization of the sprays. . . . . . . . . 443.8 Spatial distribution of the rejected and the accepted droplets on the field of
view. The droplets from all the imaging measurements have been used tobuild this spatial distribution. . . . . . . . . . . . . . . . . . . . . . . . . . 47
3.9 Relative number of droplet and relative cumulative volume in respect to thedroplet diameter for PDPA and imaging techniques. . . . . . . . . . . . . . 47
3.10 Relative value of the different correcting factors in respect to the dropletdiameter for the F/M case. . . . . . . . . . . . . . . . . . . . . . . . . . . 48
3.11 Cumulative volumetric droplet size distribution for the 6 spray class boundaries 493.12 Dv10, Dv50 and Dv90 [µm] for the 6 reference sprays. Imaging technique
and PDPA are represent by full lines with circles and the dashed lines withsquares respectively. . . . . . . . . . . . . . . . . . . . . . . . . . . . . . 50
3.13 Average velocity measured per diameter class of 50 µm with both techniques.The error bars indicate the standard error on the mean. . . . . . . . . . . . 51
3.14 Cumulative volumetric droplet velocity distribution for the 6 different nozzle-pressure combinations. Imaging technique and PDPA are represented by thecircle with full lines and the square with the dashed lines respectively. . . . 52
4.1 Example of C field, the blue shape indicates the real liquid contour. . . . . . 574.2 Illustration of the flow created by a round jet impacting a flat surface . . . . 584.3 Numerical domain of the test case with the associated boundary conditions. 604.4 Numerical domain of the geometry 1 with the associated boundary conditions. 61

List of figures xxiii
4.5 Flow on the plate after 0, 2 and 4 ms respectively for the 140◦ pipe with aninlet flow of 2 ℓmin−1. . . . . . . . . . . . . . . . . . . . . . . . . . . . . 61
4.6 Analytical and numerical solutions of the water thickness h and the interfacevelocity U in respect with the radial distance to the jet center r. . . . . . . . 62
4.7 Spatial distribution over the plate of the normalized flow rate. . . . . . . . . 634.8 Error on the estimation of the flow rate in respect with cell number. . . . . . 65
5.1 Half radial cut of the radial flow created by a impact of a round jet on ahorizontal plate and thin cylindrical opening. . . . . . . . . . . . . . . . . 68
5.2 Computational domain used to simulate the flow generated by a thin cylin-drical opening with the associated boundary conditions. . . . . . . . . . . . 73
5.3 Example of mesh for a nozzle with a radius of 1 mm and a height of 1 mm.The dimensions are given in meters. . . . . . . . . . . . . . . . . . . . . . 74
5.4 Comparison of the value of α retrieved from the post processing or found inthe literature in respect with the relative gap. . . . . . . . . . . . . . . . . . 77
5.5 Comparison between between the numerical data from all the cases and themodel prediction for the surface velocity and liquid thickness in respect withthe radial distance. . . . . . . . . . . . . . . . . . . . . . . . . . . . . . . 78
5.6 NRMSD on the interface velocity (top) and the liquid sheet thickness (bot-tom) predictions in respect with the relative opening ratio. . . . . . . . . . 79
6.1 Summary of the nozzle design procedure. . . . . . . . . . . . . . . . . . . 826.2 Geometry of the design nozzle . . . . . . . . . . . . . . . . . . . . . . . . 836.3 Average liquid sheet velocity in respect to the radial distance from the nozzle
center for three nozzle configurations. . . . . . . . . . . . . . . . . . . . . 846.4 Iso contour of the average liquid sheet velocity. a) constant R = 1 mm was
considered. b) constant r = 15.25 mm was considered. . . . . . . . . . . . . 856.5 Dimensions of the upscale nozzle model. . . . . . . . . . . . . . . . . . . . 866.6 High-speed imaging measurements at the exit of the nozzle . . . . . . . . . 866.7 Cumulative droplet size distribution measured at 50 mm downstream of the
disk edge. . . . . . . . . . . . . . . . . . . . . . . . . . . . . . . . . . . . 87

List of tables
2.2 Simulation constants. The air and water temperature properties were takenboth for 15 ◦C. Subscript g and l refer to gaseous and liquid phases respectively. 17
2.3 Range of variation of the simulation parameters. The standard values arehighlighted in bold. . . . . . . . . . . . . . . . . . . . . . . . . . . . . . . 18
2.4 Airborne spray reduction [%] induced by a RSF reduction from 1.0 to 0.6.The airborne spray reduction is given for each Dv50 at 5 distances from therelease point. . . . . . . . . . . . . . . . . . . . . . . . . . . . . . . . . . 27
3.2 Combination of nozzle and pressure defining the different spray class bound-aries with the respective nominal flow rate. . . . . . . . . . . . . . . . . . . 43
3.3 Number of droplets measured and rejected with both technique for eachnozzle-pressure combinations. . . . . . . . . . . . . . . . . . . . . . . . . 45
3.4 Average, standard deviation and coefficient of variation of the differencebetween following spray class boundary. . . . . . . . . . . . . . . . . . . . 49
3.5 Relative span factor measured for each spray class boundaries for PDPA andimaging technique. . . . . . . . . . . . . . . . . . . . . . . . . . . . . . . 50
4.2 Mesh characteristics for the three cases studied. . . . . . . . . . . . . . . . 594.3 Summary of the numerical simulations parameters. . . . . . . . . . . . . . 60
6.1 Reduced parameters of the droplet size distribution measured at 50 mmdownstream of the disk edge for the three flow rates. . . . . . . . . . . . . 85


Chapter 1
General introduction
1.1 Crop protection
Modern agriculture has to ensure high yield in order to satisfy the growing demand foragricultural goods. One cornerstone of modern agriculture is the protection of crops againstplant diseases, weeds and animals (insects, mites, nematodes, birds, snails, etc.) which arecalled pest. Oerke (2006) estimates that crop protection prevents a loss of 45% of the worldfood production. The control of pests can be realized using physical (mechanical weeding,etc.), biological (cultivar choice, crop rotation, etc.) and chemical treatment (pesticides). Theuse of pesticides is an integral part of modern agriculture and contributes to the productivityand the quality of the cultivated crop. During the pesticide application, the agriculturalmixture containing the active ingredient flows through a nozzle, generating a cloud ofdroplets of various sizes and speeds. The droplets can be airborne outside the targeted areaby airflow or penetrate in the soil. The downwind movement of airborne spray outside thetargeted area is defined as spray drift (Stephenson et al., 2006). Pesticide exposure caused bydrift leads to potential pesticides contamination in air, water and soil (Reichenberger et al.,2007). The public is increasingly concerned about the hazards of being exposed to pesticideas bystanders or residents. European legal framework (2009/128/CE) becomes increasinglyconstraining about available products, application techniques and environmental safety. Tomeet these requirements, the spray application technique should be chosen for maximizingthe dose delivered at action site while limiting environmental contamination and operatorexposure.
The application of a pesticide can be divided into four successive stages: deposition,retention, uptake and translocation (Zabkiewicz, 2007) as illustrated on Figure 1.1. Depositioncorresponds to droplet transport from the nozzle to the target (weeds, insects, plant pathogens,etc.) or the amount of pesticide directed within the target area. Deposition efficiency is

2 General introduction
then defined as the ratio between the volume of droplet that reaches the target and thetotal volume sprayed. Deposition is optimized when the probability of a droplet to collidewith the target is maximal considering the whole droplet size and velocity distributions.Retention is the part of the deposited volume effectively retained by the plant. Its efficiency isdetermined by the outcome of each spray droplet at impaction on the target (Massinon et al.,2015). Droplet behaviour at impaction is mainly governed by the droplet kinetic energy, theliquid surface tension and the surface wetability (Josserand and Thoroddsen, 2016; Yarin,2006). Flying insect control, such as mosquitoes, requires small droplets (≤ 50 µm) formaximizing retention but are, however, airborne for a longer time than large droplets. Forsystemic pesticides, the product has to be transported through the plant vascular system. Theuptake is the amount of pesticide taken up into the plant foliage. This process is affected byenvironmental factors (rain, wind, relative humidity) as well as the leaf surface properties.Specific spray adjuvants are generally used in the formulation to overcome the effect ofleaf waxes and the cuticle. Finally, the translocation is the transport of the active ingredientfrom the absorption site, e.g. the leaf, to the plant vascular system. The efficiency of thewhole application process results from the efficiency of each step. Regardless environmentalconditions, the retention and the deposition efficiencies are mostly determined by the dropletscharacteristics (size, velocity) whilst the uptake and translocation stages are affected by thechemical interactions between the agricultural mixture and the plant cells. The present workfocuses on the retention and deposition stages.
The environmental contamination by spray drift has been extensively studied during thepast decades. It appears clearly that the main parameters governing the drift are dropletsize, release height and meteorological conditions (Baetens et al., 2007; Hobson et al., 1993;Nuyttens et al., 2007b). Longer a droplet remains airborne, higher it may be carried awayby the wind (de Ruiter et al., 2003). The amount of spray drift is usually related to thepercentage of fine spray droplets within the spray. The smaller a droplet, the longer it remainsairborne and the higher the possibility for it to be carried away by crosswind from the targetarea. Droplets with diameter ≤ 100 µm contribute significantly to drift losses (Hobson et al.,1993; Holterman, 2003). Al Heidary et al. (2014) showed that spray drift decreases with thedroplet kinetic energy following a power law.
The amount of spray remaining on a plant after impact is determined by the sum of eachdroplet impact outcomes (adhesion, bounce or shatter). Massinon and Lebeau (2012) studiedretention on a synthetic superhydrophobic surface of droplets from a moving agriculturalspray. Their experiments showed that the droplet Weber number can be used as a thresholdbetween the droplet outcomes. Slow and small droplets were adhering on the surface. Thendroplets with intermediate kinetic energy were bouncing. Finally, fast and large droplets

1.1 Crop protection 3
Epicuticular wax
Cuticule + waxEpidermis
4. Translocation
3. Uptake
Plant vascular
system
1. Deposition
Fig. 1.1 Sketch of the application of a systemic herbicide, from the droplet formation to theplant vascular system.
were shattering. The figure 1.2 summarizes the transition between each droplet outcomes ina phase diagram.
Hydro
phobic
ity
Impact velocity
Partial rebound Partial shatteringAdhesion
Adhesion Rebound Shattering
Fig. 1.2 Possible impact outcomes of a droplet hitting a superhydrophobic surface, dependingon leaf hydrophobicity and droplet impact velocity (adapted from Boukhalfa et al. (2014)).

4 General introduction
1.2 Droplet size distribution of agricultural sprays
An agricultural spray is often characterized by its volume mean droplet diameter (V MDor Dv50). The V MD is the midpoint droplet size, where half of the volume of spray isconstituted of smaller droplets, and half of the volume is constituted of larger droplets.American Society of Agricultural Engineers classified agricultural spray according to theV MD as: very fine (≤100 µm), fine (100-175 µm), medium (175-250 µm), coarse (250-375µm), very coarse (375-450 µm), or extremely coarse (≥450 µm). Additional statisticaldescription of the droplet size distribution is provided by the relative span factor (RSF)defined as RSF = Dv90−Dv10
Dv50with Dv10, Dv50 and Dv90 corresponding to the maximum
droplet diameter below which 10 %, 50 % and 90 % of the volume of the sample exists,respectively. Agricultural sprays produced by hydraulic nozzles have a RSF around 1. Then,a spray with a Dv50 of 200 µm has a Dv10 of 100 µm and a Dv90 of 300 µm.
One common approach to reduce drift is to shift the droplet spectrum towards coarserdroplets using low-drift nozzle or by adding spray additives. However, coarse dropletspresent a relatively low degree of surface coverage and may bounce or shatter on the target(Hilz and Vermeer, 2013; Massinon et al., 2017). An other solution is to narrow the dropletsize distribution towards an intermediate range of droplet size. This idea stimulated thedevelopment of alternative devices for spray generation using centrifugal forces such as therotary atomizers (Bals, 1970). Liquid is fed near the center of a rotating surface so thatcentrifugal force spreads the liquid to the edge of the disk. At low flow rates, large singledroplets are emitted from the disk. As the flow rate increases ligaments are formed whichin turn break into smaller droplets. The increase of the disk rotational speed decreases thesize of the droplets. These atomizers deliver a spray with a significantly narrower dropsize distribution than the hydraulic nozzles usually used in field treatment (Hewitt, 2005;Qi et al., 2008). Measurements of the droplet size distribution of rotary atomizers showsa RSF around 0.6. Field experiments showed that rotary atomizers could substantiallyreduce the potential for exposure to fine droplets in comparison with conventional hydraulicnozzles, 50 m downwind of the spray line (Gilbert and Bell, 1988). Despite the quality of theproduced sprays, the rotary atomizers are not hardly used for field spray application becauseof their bulkiness. However, they remain an interesting study case as a way to producesprays with narrow drop size distribution. The contrast in term of droplet size distributionbetween the hydraulic nozzles and the rotary atomizers derives from the different breakupmodes occurring with the two atomizers types. Rotary atomizers produce round liquid jetsof uniform sizes at the exit of the rotating part, then these jets break in droplets by theRayleigh-Plateau mode (Fig. 1.3 a). Whilst, the hydraulic nozzles produce a liquid sheet thatbreakup in ligaments which, in turn, breakup in to droplets of various sizes (Fig. 1.3 b).

1.3 Rayleigh-Plateau breakup 5
a) b)
Fig. 1.3 Illustration of the two breakup modes occurring at the exit of a rotary atomizer (a)and a hydraulic nozzle (b).
1.3 Rayleigh-Plateau breakup
When a liquid jet flows in the air, deformations appear on the gas-liquid interface. Thesedeformations grow in space and time leading to the formation of droplets. The figure 1.4shows the 5 possible breakup regimes of a liquid round jet exiting a nozzle for an increasingjet velocity. At low jet velocity, the liquid gathers at the tip of the nozzle until a droplet drips,it’s the dripping regime. In the Rayleigh-Plateau regime, a liquid column is formed at theexit of the nozzle. In this regime, axi-symmetrical perturbations are amplified by capillarity.Theoretical developments realized by Rayleigh (1878) showed that the growth of the mostunstable perturbation breaks the jet in droplets with a diameter in average equal to 1.89times the jet diameter. When the velocity of the jet increases, the shear forces between theliquid and the surrounding gas becomes significant, it’s the 1st wind induced regime. Thejet breakup is controlled by the growth of an axi-symmetric capillary perturbation and anaxi-asymmetric aerodynamic perturbation. The droplet size distribution is wider than in theRayleigh-Plateau due to the presence of satellite droplets. In the 2nd air induced mode, theaerodynamic interactions are dominating. Near the nozzle, some droplets can be peeled offat the air-gas interface. Further, the jet is breaking in ligaments which in turn break in todroplets of various sizes. This regime is rather chaotic and produces droplet of various sizes.Finally in the atomization regime, the droplets are formed directly at the nozzle exit. Thedroplets diameter are much less than the jet diameter.
The transitions between each regime can be described using liquid and gaseous We-ber numbers which express the ratio of the inertia forces on the surface tension forces

6 General introduction
WeL > 8 Weg > 0.4 Weg > 13 Weg > 40.3
Outlet velocity
Dripping Rayleigh-Plateau 1st Wind induced 2nd Wind induced Atomization
Axis-symmetric Axis-asymmetric
Bre
akup lenght
a)
10-4
10-3
10-2
Jet diameter [m]
100
101
102
Jetvelocity[m/s]
Dripping
Rayleigh-Plateau
1 st wind induced
2 nd wind induced
Atomization
b)
Fig. 1.4 Breakup regimes of a cylindrical water jet in still air at atmospheric pressure.a) Illustration of the breakup regime according to the jet velocity. Figure adapted fromBonhoeffer et al. (2017). b) Breakup regime limits for a water jet in still air. The limits havebeen computed using the equations 1.1 and 1.2.
(Dumouchel, 2008):
WeL =ρLU2d jet
σ(1.1)
WeG =ρGU2d jet
σ(1.2)
with ρL and ρg the liquid and the gas density respectively [kg m−3], U the jet velocity[m s−1], d jet the jet diameter [m] and σ the liquid surface tension [N m−1]. The criticalWeber numbers between each regime are indicated on the Figure 1.4 a. For the Rayleigh-Plateau regime (Dumouchel, 2008), the WeL has to be higher than 8 and the gaseous Webernumber WeG has to be lower than 0.4. Using the equations 1.1 1.2, the domain of existenceof each breakup regime can be described in respect to the jet diameter and velocity as shownon the Figure 1.4 b.

1.4 Thesis goals 7
Fig. 1.5 Illustration of the nozzle with the three main regions: the nozzle pipe (1), the disk(2), the disk structures (3).
1.4 Thesis goals
The present PhD thesis aimed to design a hydraulic nozzle producing a spray with a narrowdroplet size distribution. The nozzle design was similar to a splash plate nozzle for whichthe plate will be modified in order to split the liquid sheet formed on the plate into multiplejets at its end as shown on Figure 1.5. Three main regions of the nozzle can be distinguished:the nozzle pipe end, the disk, the disk border. In the two first regions the objective will beto generate a homogeneous flow in term of speed and thickness. Then at the disk borderchannels will be used in order to separate the liquid sheet in to multiple jets. In order toachieve a narrow droplet size distribution, the jets should breakup in the Rayleigh-Plateauregime. Unlike the rotary atomizer, the hydraulic nozzle will not have any rotating part. Thedroplet size distribution of the spray will be determined by the jet speed and size emitted atthe edge of the plate. Therefore, according the targeted diameter and flow rate, a specificgeometry has to be designed. The design procedure ends by the experimental characterizationof the droplet size distribution generated by a prototype. The thesis has three main goals:
• Determination of an optimum range of droplet sizes for drift tolerant herbicide applica-tion.
• The analytical description of the flow on the nozzle plate according to the inlet geome-try.
• The development of an experimental technique for the characterization of agriculturalsprays.

8 General introduction
1.5 Thesis organization
Chapter 2 aims to determine an optimum range of droplet sizes for boom-sprayer applyingherbicide using a modeling approach. The main parameters of spray deposition and retentionmodels are systematically varied and the effects on drift potential and droplet impactionoutcomes are discussed. In chapter 3, an optical technique developed to characterize agri-cultural sprays is presented. The droplet size and speed are measured using high speedimaging set-up. This technique has been used to assess a nozzle prototype. Chapters 4 and5 aim to describe analytically the flow on the nozzle plate. The Chapter 4 presents andassess the numerical method which will be used in Chapter 5 to build the analytical model.This analytical model provides the liquid sheet thickness and velocity according the radialdistance from the nozzle center. Finally, using the latter model and the droplet size objectivea nozzle design is established in the chapter 6. An upscale nozzle prototype, is assessedexperimentally using the high speed imaging technique developed earlier.
The chapters 2, 5 and 3 are constituted of publish peer-reviewed paper. The chapter 4 is aconference paper and the chapter 6 is an original contribution.

Chapter 2
Investigation on optimal spray propertiesfor ground based agriculturalapplications using deposition andretention models
2.1 Preamble
The optimal droplet size distribution for weed control has to be a balance between the dropletdrift by the wind and the droplet kinetic energy when it reaches the target. Let’s considera droplet falling from a given height with an initial velocity through a horizontal air flow.During its flight, the droplet velocity is evolving toward an equilibrium with the surroundingair flow. The equilibrium state corresponds to the settling velocity in the vertical axis and thewind velocity in the horizontal axis. The droplet time of flight is linked to the initial dropletproperties, i.e. its size, velocity and release height. The work presented in the present chapterassess the sensitivity of the initial droplet properties on the drift and retention potentials.This work has been published in a peer reviewed journal. The details of the publication arepresented in the Table 2.1.
2.2 Introduction
Spray application is a key process in crop protection to ensure high yields whilst minimizingthe adverse environmental and health impact of plant protection products. During thisprocess, the agricultural mixture is usually atomized by passage through a nozzle generating

10 Investigation on optimal spray properties using modeling approach
Table 2.1 Summary of the appended publication.
Authors: De Cock, Nicolas & Massinon, Mathieu& Ouled Taleb Salah, Sofiene & Lebeau, Frédéric
Year: 2017Title: Investigation on optimal spray properties for ground based
agricultural applications using deposition and retention modelsStatus: In pressPeer reviewed: YesJournal: Biosystem engineeringURL: Not available yet
a liquid sheet that further breaks up in a cloud of droplets. A herbicide application can bedivided in four successive stages: deposition (initial spray amount minus off-target losses),retention (amount remaining on the plant after impaction), uptake (amount of active ingredienttaken into the plant foliage) and translocation (amount of absorbed material translocated)(Zabkiewicz, 2007). This paper focuses on deposition and retention stages.
It has been shown that the droplet size distribution of the spray significantly affects thedeposition (Hilz and Vermeer, 2013; Nuyttens et al., 2007b; Stainier et al., 2006; Tayloret al., 2004). Al Heidary et al. (2014) showed that spray drift decreases with the dropletkinetic energy following a power law. Indeed, finer droplets are more prone to drift leadingto potential product losses in the air, water and soil (Reichenberger et al., 2007). Modelingof deposition under field conditions has been realized using several approaches: Gaussianplume model (Baetens et al., 2009; Lebeau et al., 2011; Raupach et al., 2001), Lagrangianmodels (Butler Ellis and Miller, 2010; Holterman et al., 1997; Mokeba et al., 1997; Teskeet al., 2002; Walklate, 1987), computational fluid dynamics (CFD) (Baetens et al., 2007;Weiner and Parkin, 1993). Here a Lagrangian stochastic model will be used. Lagrangianstochastic models compute the droplet movement through an airflow using discrete time steps.The airflow turbulence is taken into account by superposing a time correlated fluctuatingcomponent onto a mean component. Dispersal statistics can be retrieved by tracking a largenumber of droplets.
The amount of spray remaining on a plant after impact is determined by the sum of eachdroplet impact outcomes (adhesion, bounce or shatter). Droplet behavior after impact ismainly governed by droplet kinetic energy, liquid surface tension and the surface wetability(Josserand and Thoroddsen, 2016; Yarin, 2006). When a droplet hits a solid surface, it spreadsradially producing a thin liquid layer. If the droplet kinetic energy at impact overcomescapillary forces, the droplet shatters in smaller droplets. Otherwise, the spreading driven bythe initial kinetic energy of the droplet is decelerated by viscous forces and surface tension,

2.2 Introduction 11
Nomenclature
Greek Symbolsβ Droplet release angle [◦]∆t Time step [s]η , ε Random value from a standard normal distri-
bution [-]γ Surface tension [Nm−1]κ von Karman constant [-]λ ,K Weibull distribution parameter [-]µ Dynamic viscosity [N s m−2]ν Kinematic viscosity [m s−2]ρ Volumetric mass [kg m−3]σx,z Velocity RMS [m s−1]τL Lagrangian time scale of turbulence [s]τ∗L Modified Lagrangian timescale [s]θ Static contact angle [◦]Roman Symbolsm Mass flux [kg s−1]CD Drag coefficient [-]CDF Cumulative density function [-]d Droplet diameter [m]d0 Zero plane displacement [m]dm Maximum spread diameter [m]E Arithmetic mean of droplet traveled distance
[m]
g Gravity acceleration [m s−2]
hc Crop height [m]
hr Release height [m]
k Liquid to gas dynamic viscosity ratio [-]
L Monin-Obukhov length [m]
m Droplet mass [kg]
Re Reynolds number [-]
RSF Relative span factor [-]
ToF Time of flight [s]
U Air flow velocity [m s−1]
u Droplet velocity [m s−1]
U∗ Friction velocity [m s−1]
u0 Release velocity [m s−1]
Vr Relative droplet velocity [m s−1]
We Weber number [-]
x Horizontal position [m]
z Vertical position [m]
z0 Surface roughness [m]
Subscripts
g Gaseous
l Liquid
until radial dispersion stops. Thereafter, the liquid layer can remain pinned on the surfaceor retract. If the droplet surface energy is sufficient, the droplet may detach itself from thesurface leading to a bounce (Attané et al., 2007). Otherwise, the droplet adheres on thesurface. Massinon et al. (2015) proposed an empirical probabilistic model using dropletWeber number to model droplet outcomes on plant leaves. Deterministic models of impactoutcomes based on energy balance of the impacting droplet are also available (Dorr et al.,2015; Mao et al., 1997; Mundo et al., 1995).

12 Investigation on optimal spray properties using modeling approach
One common approach to reduce drift is to shift the droplet spectrum towards coarserdroplets using low-drift nozzle or by adding spray additives. However, coarse dropletspresent a relatively low degree of surface coverage and may bounce or shatter on the target(Hilz and Vermeer, 2013; Massinon et al., 2017). An other solution, is to narrow the dropletsize distribution towards an intermediate range of droplet size.
The goal of the present paper is to determine an optimum range of droplet size for boom-sprayer based herbicide applications using a modelling approach. A deposition model basedon a stochastic Lagrangian approach is presented in the section 2.3.1. The mathematicalmodels determining the droplet outcomes at canopy level are presented in the section 2.3.2.Deposition and retention models are used to realize a sensitivity analysis on initial dropletparameters (diameter, release height, release velocity) and environmental characteristics(wind speed, relative humidity) in the agricultural range detailed in section 2.3.4. Finally, theaerial transport and the retention of sprays with different volumetric median diameter andrelative span factor are assessed in section 2.3.4.
2.3 Materials and methods
2.3.1 Droplet deposition model
General overview of the droplet transport model
Figure 2.1 shows the flow chart of the model. The simulation starts by initializing the dropletcharacteristics, e.g. its initial location, velocity and size. The acceleration and the evaporationof the droplet is then computed at each time step. In order to solve the aerodynamic balanceof the droplet, the air flow characteristics are computed as well at each droplet location takinginto account atmospheric turbulence. The simulation ends when the droplet either loosesall its mass or reaches the crop level canopy where the droplet is stated to be captured. Airentrainment from the spray nozzle is not taken in account in the present model because of alow drop/air mass ratio is assumed which is typical of low application volume/high speedapplications (Lebeau, 2004).
Droplet motion
Equations of droplet motion are taken from the saltation model of Kok and Renno (2009),which takes into account the particle inertia. The droplet transport model uses a Lagrangiandescription of the droplet motion. The displacement of the droplet after a time t is given bythe numerical integration of the droplet velocity over time:

2.3 Materials and methods 13
∂mdt
Eq 2.6
∂udt
Eq 2.9Eq 2.2
Uz,iUx,i
Fig. 2.1 Flow chart of the droplet transport model.
∆xi =n
∑i
ux,i ∆ti & ∆zi =n
∑i
uz,i ∆ti (2.1)
The variation of the droplet velocity is retrieved using Newton’s second law of motion takingin account the effects of drag and gravity while neglecting the buoyancy.
∂uxdt =
3CD ρgVr(Ux−ux)4ρl d
∂uzdt =
3CD ρgVr(Uz−uz)4ρl d −g
(2.2)
with m the droplet mass [kg], u the droplet velocity [m s−1], t the time [s], CD the dragcoefficient [-], ρl and ρg the density of the liquid and gaseous phases respectively [kg m−3],A the droplet cross section area [m2], d the droplet diameter [m], U and u are the air and thedroplet velocity respectively [m s−1], Vr is the relative velocity between the droplet and theairflow defined as Vr =| u−U | [m s−1], and g is the gravitational acceleration rounded to9.81 [m s−2].
For Re≤ 400 the drag coefficient of a sphere in a gas flow can be expressed using thefollowing expression (Saboni et al., 2004):

14 Investigation on optimal spray properties using modeling approach
Cd =
(k(
24Re +
4Re0.36
)+ 15
Re0.82 −0.02 kRe0.5
1+k
)Re2 +403k+2
Re +15k+10
(1+ k)(5+0.95Re2)(2.3)
with k equal to the ratio of the liquid to the gas viscosity, k = µlµg
, and Re the droplet Reynolds
number defined as: Re = Vrdνg
. Other Cd expressions for a sphere can be found in the literature(Barati et al., 2014; Langmuir and Blodgett, 1949).
Description of the air flow
The velocity profile generated by a wind above crop is made up of a random part sum onto amean component. Assuming the vertical mean flow equal to zero, the general formulation isreduced to:
Ux =Ux +U ′x ; Uz =U ′
z (2.4)
The average part of the horizontal velocity U(zi) is described by a logarithmic velocityprofile:
U(zi) =U∗
κlog(
z−d0
z0
)(2.5)
with κ the von Karman constant equals to 0.41 [-], U∗ the friction velocity [m s−1], zthe distance above the ground [m], d0 the zero plane displacement [m] and z0 the surfaceroughness [m]. The values d0 and z0 can be related to crop height using z0 = 0.1 hc and d0 =0.63 hc with hc the crop height (Butler Ellis and Miller, 2010).
For homogeneous isotropic turbulence, the velocity fluctuations U ′ of an air particlemoving with the flow can be statically described by the following set of equations (Kok andRenno, 2009) (Wilson and Sawford, 1996):
U ′x,i+1 =U ′
x,i e− ∆t
τ∗Lx + ε σx√
2
1− e
(−√
∆tτ∗Lx
)U ′
z,i+1 =U ′z,i e
− ∆tτ∗Lz +η σz
√2
1− e
(−√
∆tτ∗Lz
)(2.6)
with τ∗L the modified Lagrangian time scale [s], ∆t is the time step [s], η and ε are randomvariables from a standard normal distribution [-], σx and σz are the horizontal and the vertical

2.3 Materials and methods 15
velocity fluctuations [m s−1]. For near neutral atmospheric conditions: σx = 2.3U∗ andσz = 1.3U∗ (Panofsky et al., 1977).
The Lagrangian timescale represents the approximate timescale over which the velocitiesexperienced by an air particle are statically related. Since the droplets move through the aireddies, the Lagrangian timescale perceived by the droplets is shorter. A modified formulationof the Lagrangian timescale for the horizontal and the vertical directions was proposed by(Sawford and Guest, 1991):
τ∗Lx =τLx√
1+(2 Vrσx )
2
τ∗Lz =τLz√
1+(
Vrσz
)2
(2.7)
with τL defined as (Butler Ellis and Miller, 2010):
τL = κU∗ (z−d0)
σ2z
√1−(
16(z−d0)
L
)(2.8)
with L the Monin-Obukhov length [m], which characterises atmospheric stability.
Droplet evaporation
Droplet evaporation in the model was based on Guella et al. (2008). The set of equationsused are described in the Appendix A. In this model, the air has a constant vapor fraction andtemperature. The loss of droplet volume is computed after each time step as:
∆V =mρl
∆t (2.9)
2.3.2 Droplet retention model
Mathematical models have been developed to predict the outcome of impacting dropletsbased on an energy balance approach(Dorr et al., 2015; Mao et al., 1997; Mundo et al., 1995).In these models, three impact outcomes are considered: adhesion, bounce or shatter. Shatteroccurs when the inertial forces at impacting overcome the capillary forces. The dropletshatter threshold may be predicted based on droplet Reynolds number and Weber number(Mundo et al., 1995):
K =We0.5Re0.25I (2.10)
16 Investigation on optimal spray properties using modeling approach
d
β
hc
hr
z
x
Ux u0
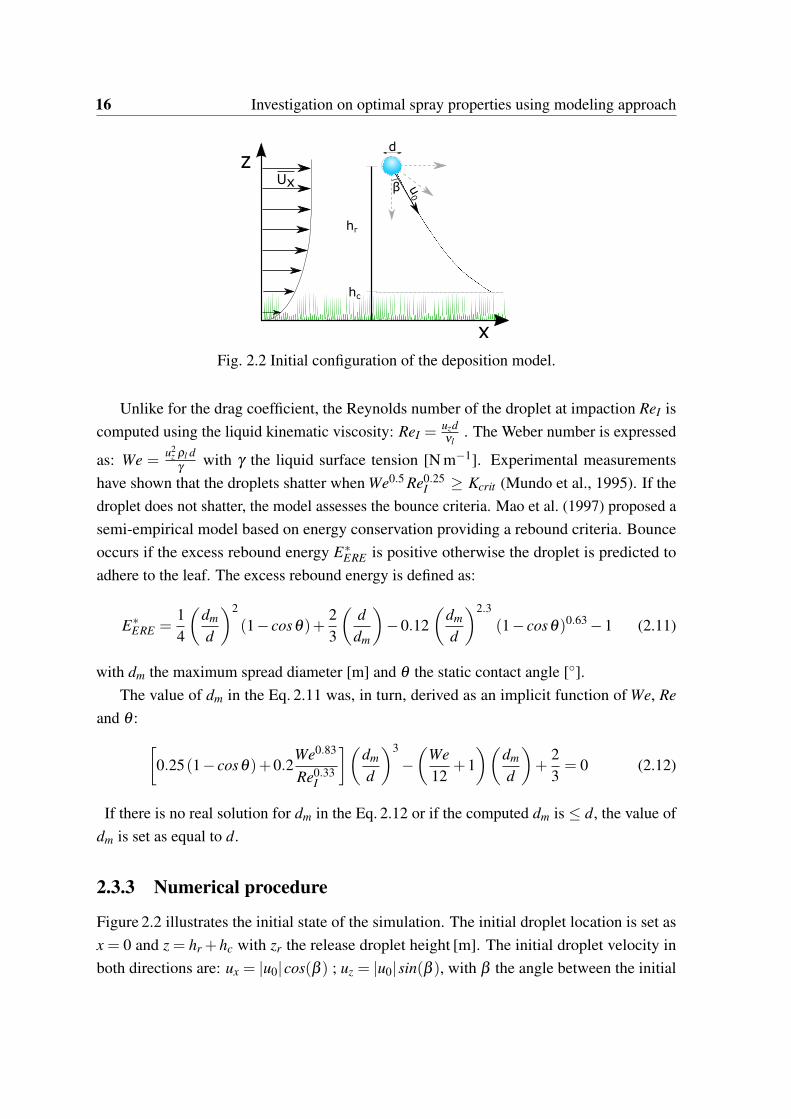
Fig. 2.2 Initial configuration of the deposition model.
Unlike for the drag coefficient, the Reynolds number of the droplet at impaction ReI iscomputed using the liquid kinematic viscosity: ReI =
uzdνl
. The Weber number is expressed
as: We =u2
z ρl dγ
with γ the liquid surface tension [N m−1]. Experimental measurementshave shown that the droplets shatter when We0.5 Re0.25
I ≥ Kcrit (Mundo et al., 1995). If thedroplet does not shatter, the model assesses the bounce criteria. Mao et al. (1997) proposed asemi-empirical model based on energy conservation providing a rebound criteria. Bounceoccurs if the excess rebound energy E∗
ERE is positive otherwise the droplet is predicted toadhere to the leaf. The excess rebound energy is defined as:
E∗ERE =
14
(dm
d
)2
(1− cosθ)+23
(d
dm
)−0.12
(dm
d
)2.3
(1− cosθ)0.63 −1 (2.11)
with dm the maximum spread diameter [m] and θ the static contact angle [◦].The value of dm in the Eq. 2.11 was, in turn, derived as an implicit function of We, Re
and θ : [0.25(1− cosθ)+0.2
We0.83
Re0.33I
](dm
d
)3
−(
We12
+1)(
dm
d
)+
23= 0 (2.12)
If there is no real solution for dm in the Eq. 2.12 or if the computed dm is ≤ d, the value ofdm is set as equal to d.
2.3.3 Numerical procedure
Figure 2.2 illustrates the initial state of the simulation. The initial droplet location is set asx = 0 and z = hr +hc with zr the release droplet height [m]. The initial droplet velocity inboth directions are: ux = |u0|cos(β ) ; uz = |u0|sin(β ), with β the angle between the initial

2.3 Materials and methods 17
Table 2.2 Simulation constants. The air and water temperature properties were taken both for15 ◦C. Subscript g and l refer to gaseous and liquid phases respectively.
Parameter Value Unitsµg 1.85e-5 Pa sµl 1.15e-3 Pa sρg 1.2 kg m−3
ρl 1000 kg m−3
hc 0.1 mL -1000 m
droplet direction and the vertical direction [◦] and u0 the release velocity [m s−1]. Liquid andair properties used for the computations are shown in the Table 2.2. The time step ∆t wascomputed as: min
(0.1hVr
, τL10
)[s].
2.3.4 Parameter sensitivity study
Monosized droplets
A sensitivity analysis was performed to highlight the effect of the droplet diameter d, windspeed at a height of 2 m U(2), droplet release velocity u0, release angle β , the release heightabove crop hr and relative humidity Hr may have on the deposition and retention steps. Thevariation of these parameters are shown in the Table 2.3. For each instance, the trajectories of15 000 droplets with the same initial conditions were computed. Random wind fluctuationsexperienced by the droplets during their flights lead to a variety of trajectories that werecharacterized by statistical parameters such as mean, 5th, 50th (median) and 95th percentiles.Later in the paper, if the value of one parameter is not specified, the standard values indicatedin bold in Table 2.3 were used.
The impact outcomes were evaluated on a wheat leaf with water which has a staticcontact angle of 132 ◦ and a Kcrit of 69 (Forster et al., 2010). Water has a surface tension γ of0.072 N m−1.
Polydisperse sprays
The aerial transport of polydisperse sprays of droplets are simulated in order to predict theeffect of the droplet size distribution on the overall deposition and retention. Each spraycloud was simulated by 100 000 droplets randomly drawn from a Weibull distribution in
volumetric cumulative distribution (CDF) defined as: CDF = 1− e−(−xλ)
K
(Babinsky andSojka, 2002; Rosin and Rammler, 1933). The two Weibull distribution parameters were set to

18 Investigation on optimal spray properties using modeling approach
Table 2.3 Range of variation of the simulation parameters. The standard values are highlightedin bold.
Variable Tested values Unitsd 100;125;150;175;200;250;300;350;400 µm
U(2) 0;2;4;6;8 m s−1
|u0| 5;10;15 m s−1
β 0;15;30;45;60;75;90 ◦
hr 0.25;0.5;0.75;1 mHr 40;60;80 %
0 100 200 300 400 500 600
Diameter [µm]
0
10
20
30
40
50
60
70
80
90
100
Cum
ula
tive v
olu
me p
roport
ion [%
]
Span = 0.6 VMD = 150 µm
Span = 0.6 VMD = 200 µm
Span = 0.6 VMD = 225 µm
Span = 0.6 VMD = 250 µm
Span = 0.6 VMD = 300 µm
Span = 0.6 VMD = 350 µm
Span = 1.0 VMD = 150 µm
Span = 1.0 VMD = 200 µm
Span = 1.0 VMD = 225 µm
Span = 1.0 VMD = 250 µm
Span = 1.0 VMD = 300 µm
Span = 1.0 VMD = 350 µm
Fig. 2.3 Cumulative droplet size distribution of the virtual sprays for the six Dv50 and thetwo RSF .
achieve a specific relative span factor RSF and volumetric mean diameter Dv50. The relativespan factor is defined as RSF = Dv90−Dv10
Dv50with Dv10, Dv50 and Dv90 corresponding to the
maximum droplet diameter below which 10 %, 50 % and 90 % of the volume of the sampleexists, respectively. Six different values of Dv50 (150, 200, 225, 250, 300, 350 µm) and twoRSF (0.6, 1) were simulated resulting in twelve different simulations. The twelve simulateddroplet size distributions are shown in Fig.2.3.
Sprays characterized with a RSF of 0.6 and 1 are representative of the narrow spraydroplet size distributions produced by rotary atomizers (Qi et al., 2008) and flat fan nozzlesrespectively (De Cock et al., 2016; Nuyttens et al., 2007a). A Dv50 of 250 µm with a RSF of1 is similar to a spray generated by a flat fan nozzle 110-03 operating at at 300 kPa. For allthese cases, simulation parameters were set to standard values (Table 2.3).

2.4 Results 19
0.1 0.15 0.2 0.25 0.3 0.35 0.4 0.45 0.5 0.55 0.6
Vertical position [m]
-10
-9
-8
-7
-6
-5
-4
-3
-2
-1
0
uz [m
s-1
]
1.7
9 s
0.70 s 0.31 s 0.16 s 0.10 s
0.08 s
100 µm
150 µm
200 µm
250 µm
300 µm
400 µm
a)
0.1 0.15 0.2 0.25 0.3 0.35 0.4 0.45 0.5 0.55 0.6
Vertical position [m]
0
0.5
1
1.5
ux [
m s
-1]
100 µm
150 µm
200 µm
250 µm
300 µm
400 µm
Wind profile
b)
Fig. 2.4 Dynamics of droplet velocity during its flight. a) Median vertical velocity withrespect to the droplet vertical location. The median time of flight to travel from the releasepoint to the crop top canopy for each droplet size is indicated above each corresponding line.b) Median horizontal velocity with respect to the droplet vertical location. The average windvelocity profile defined by the Eq.2.5 for a reference wind of 2 m s−1 at 2 m is illustrated bythe black curve.
2.4 Results
2.4.1 Sensitivity analysis of a population of monodisperse droplets
Effect of droplet size on velocity dynamics
Figure 2.4 a shows the evolution of the vertical median droplet velocity with respect to thedroplet vertical position. The droplets are released 0.6 m above a crop of 0.1 m high with aninitial horizontal velocity ux of 0 m s−1 and an initial vertical velocity uz of -10 m s−1. Thedroplets were decelerating in the vertical direction approaching their settling velocity whilst,in the horizontal direction, the droplets were accelerating towards the wind velocity. Thedroplets with a diameter≥ 250 µm reached the crop canopy with a vertical velocity abovetheir settling velocity. The median time of flight (ToF) for each droplet size is shown nextto each line. The ToF is the time between the droplet release and its deposit on the canopy.Droplet ToF is shown decreasing with increasing droplet size. The 100 µm diameter dropletshad, on average, 20 times longer ToF than 400 µm diameter droplets. The ToF ratio betweenthe 250 µm and the 400 µm diameter droplets was around 2.
Figure 2.4 b shows the evolution of the horizontal median droplet velocity with respect tothe droplet vertical position. All droplet sizes reached the top canopy level at a horizontalvelocity approximately equal to the average wind velocity. An overshoot of the wind velocitywas observed for larger droplets due to their inertia, e.g. 250 µm droplets are faster than thewind at z≤ 0.2 m.

20 Investigation on optimal spray properties using modeling approach
10-3
10-2
10-1
100
101
Horizontal position [m]
0.1
0.15
0.2
0.25
0.3
0.35
0.4
0.45
0.5
0.55
0.6
Ve
rtic
al po
sitio
n [
m]
100 µm
150 µm
200 µm
250 µm
300 µm
400 µm
a) b)
Fig. 2.5 Droplet deposition trajectories under a wind of 2 m s−1. a) 5th percentile, medianand 95th percentile trajectories for 6 different droplet sizes under standard conditions. b)Deposition pattern of 15 000 droplets with the same size under standard conditions. The linewith the bullets represents the simulated data and the full lines represents the log-normal fit.The log-normal distribution arithmetic mean and the arithmetic variance are displayed aboveeach curves. Details on these parameters are available in the Appendix B.
Droplet trajectories
The random wind fluctuations experienced by the droplets lead to a variability of trajectoriesamong the simulations. Figure 2.5 a shows the 5th, 50th (median) and 95th percentile of thetrajectories of 15 000 droplets under reference conditions (cf Table 2.3). The median isrepresented by the solid line. The 5th and 95th percentile are represented by the left and theright dashed line respectively. The coarser the droplet, the shorter the horizontal distancetravelled and the dispersion of the traveled distance. The droplets with diameter larger than200 µm reached the canopy within 1 m from the release position with a dispersion shorterthan 0.1 m.
The 95th percentile curve for the 100 µm droplet features a plateau between 0.1 m and1 m. This plateau arises from a succession of random velocity fluctuations directed upwards.At a wind speed of 2 m s−1 at 2 m height, the vertical velocity fluctuations are equal tou′z = 0.284ε with ε a random standard Gaussian value which is in the same range than thesettling velocity of droplet of 100 µm (i.e. 0.29 m s−1). Computations (not displayed here forbrevity) showed that with a higher wind speeds, the plateau forms a bell shape due to theincrease in the strength of the vertical velocity fluctuations.
The simulated relative deposition patterns over distance is shown in Figure 2.5 b bydashed with bullets. The full line represents the log-normal fit on the simulated data. Thefitted and simulated data are in good agreement. The next subsection assess the effect of the

2.4 Results 21
100 µm 125 µm 150 µm 175 µm 200 µm 250 µm 300 µm 350 µm 400 µm
0.2 0.3 0.4 0.5 0.6 0.7 0.8 0.9 1
Release height [m]
0
1
2
3
4
5
6
E [
m] 0.2 0.4 0.6 0.8 1
Release height [m]
0
0.2
0.4
0.6
0.8
1
E [
m]
a)
0 1 2 3 4 5 6 7 8
Wind Speed [m s-1]
0
1
2
3
4
5
6
7
8
9
10
E [
m] 0 2 4 6 8
Wind Speed [m s-1
]
0
0.2
0.4
0.6
0.8
E [
m]
b)
5 6 7 8 9 10 11 12 13 14 15
Release velocity [m s-1]
0
0.5
1
1.5
2
2.5
3
E [m
]
c)
0 10 20 30 40 50 60 70 80 90
Release angle β [°]
0
0.5
1
1.5
2
2.5
3
E [m
]d)
Fig. 2.6 Effect of the release height, wind speed, release velocity and release angle on theaverage of the log-normal fit arithmetic mean E.x
wind speed and the release parameters on the arithmetic mean of the log-normal distribution.The value of the arithmetic mean has been retrieved with a least square fitting of the log-normal parameters on the numerical data using Matlab (MATLAB 9.0, The MathWorksInc., Natick, MA, USA). More details about the log-normal distribution and the reducedparameters are furnished in the Appendix B.
Average droplet transport
The results of the arithmetic mean E [m] with respect to variation of the ejection height,ejection angle, wind speed and ejection velocity are presented in Fig.2.6. The horizontaldistance traveled by a droplet was correlated with droplet ToF and wind speed. ToF decreasedwith decreasing release velocity and increasing droplet settling velocity. The release height

22 Investigation on optimal spray properties using modeling approach
increased the average displacement, mainly for droplet smaller than 250 µm. For fine droplets,the release height was roughly proportional to the ToF since the droplets quickly reachedtheir settling velocities, leading to a linear relationship between traveled distance and releaseheight. For droplets coarser than 200 µm, the latter relationship was not linear because largerdroplets adecelerate during their fall. The traveled distance linearly increased with increasingwind speed. Finer droplets were more sensitive to wind speed, resulting in steeper slopes inthe graph of Fig.2.6 b. Increase in the release velocity slightly decreased the traveled distancefor the finer droplets (- 20% for 100 µm 5-15ms−1) whilst the decrease was substantial forcoarse droplets (- 80% for 400 µm 5-15 m s−1) which relates to droplet inertia.The effect ofthe release angle β is shown in Fig.2.6 d. For each angle, the average displacement withoutwind was subtracted to consider the effect of these angles. The increase of β leads to adecrease in initial vertical velocity and an increase of the initial horizontal velocity, increasingthe averaged traveled distance. Droplets with diameter ≥ 200 µm had an average horizontaldisplacement shorter than 0.5 m for release angle ≤ 60◦.
Droplet transport of 95th percentile
X95 represents the downwind distance by which 95 % of the spray volume has reached theground. It corresponds to the final position of the 95th percentile trajectories shown inFig.2.5 a. This parameter was responsive to the average transport of the droplet spray anddeposition dispersion. The effect of the main parameters on the X95 is shown in Fig.2.7. Theincrease of release height was linear with increasing X95, similarly to Fig.2.6 a. However,the decrease of the slope with increasing droplet size was stronger than for the averagedisplacement since the increase of height also enhanced the deposition variability. Theincrease of wind speed generated a quadratic increase of the X95. This can be explained by anincrease in the random wind fluctuations which in turn enhanced the variability of the droplettrajectories. Therefore, the log-normal curves representing the volume distribution overdistance were strongly flattened.At wind speeds of 8 m s−1, more than 5 % of the dropletsof 100 µm traveled further than 100 m. This distance dropped below 1 m for droplets withdiameter ≥ 250 µm. The increase of the release velocity led to a moderate decrease of X95.Thus, acting solely on the release velocity does not significantly affect drift. The increaseof β led to an increase of X95, especially for coarser droplets at release angles from 60◦ to90◦. At an angle of 60◦, less than 5 % of the droplets with diameter ≥ 200 µm were airbornefurther than 1 m. X95 was strongly influence by droplet size due to the higher depositionvariability and higher average displacement for finer droplets. This means that dropletsdiameter ≤ 150 µm should be minimized within the spray since a significant proportionwill travel several metres. E and X95 were close to each other for droplets with diameter

2.4 Results 23
100 µm 125 µm 150 µm 175 µm 200 µm 250 µm 300 µm 350 µm 400 µm
0.2 0.3 0.4 0.5 0.6 0.7 0.8 0.9 1
Release height [m]
0
2
4
6
8
10
12
14
16
18
20
X95 [m
]
0.2 0.4 0.6 0.8 1
Release height [m]
0
0.5
1
1.5
2
2.5
3
X9
5 [m
]
a)
0 1 2 3 4 5 6 7 8
Wind Speed [m s-1]
0
20
40
60
80
100
120
X9
5 [
m]
0 2 4 6 8
Wind Speed [m s-1
]
0
1
2
3
4
5
6
7
X9
5 [m
]
b)
5 6 7 8 9 10 11 12 13 14 15
Release velocity [m s-1]
0
1
2
3
4
5
6
7
X95 [
m]
c)
0 10 20 30 40 50 60 70 80 90
Release angle β [°]
0
1
2
3
4
5
6
7
X95 [
m]
d)
Fig. 2.7 Effect of the release height, wind speed, release velocity and release angle on thedistance above which 95 % of the droplets have reach the top canopy level X95.

24 Investigation on optimal spray properties using modeling approach
100 150 200 250 300 350 400
Droplet diameter [µm]
0
5
10
15
uz a
t cro
p c
an
op
y [
m s
-1]
Shatter limit
Bounce limit
0.25 m at 5 m s -1
0.25 m at 10 m s -1
0.25 m at 15 m s -1
0.50 m at 5 m s -1
0.50 m at 10 m s -1
0.50 m at 15 m s -1
0.75 m at 5 m s -1
0.75 m at 10 m s -1
0.75 m at 15 m s -1
Settling velocity
a)
100 150 200 250 300 350 400
Droplet diameter [µm]
-90
-80
-70
-60
-50
-40
-30
-20
-10
0
Angle
with the h
orizonta
l direction [°]
0.25 m at 5 m s -1
0.25 m at 10 m s -1
0.25 m at 15 m s -1
0.50 m at 5 m s -1
0.50 m at 10 m s -1
0.50 m at 15 m s -1
0.75 m at 5 m s -1
0.75 m at 10 m s -1
0.75 m at 15 m s -1
b)
Fig. 2.8 Droplet velocity and angle at top canopy level. a) Average impact velocity in respectto the droplet diameter for three release heights and three release velocities. The dashed lineshows the velocity above which a droplet would shatter or bounce while impact a wheat leafusing the adhesion model described in section 2.3.2. b) Average droplet trajectory angle atthe crop top canopy level with the horizontal direction. The other simulation parameterswere set at standard values (cf Table 2.3).
≥ 250 µm showing a low dispersion of droplet trajectories. This low dispersion can beexplained by their shorter ToF relatively to finer droplets.
Droplet velocity at top canopy level
Figure 2.8 a shows the average droplet vertical velocity at crop height for three release heightsand three release velocities. The coarser the droplet, the shorter is the traveled distance andthe faster it may impact on the target. The black line shows experimental measurements ofsettling velocities (Gunn and Kinzer, 1949). At a release height of 0.5 m, droplets smallerwith diameter ≤ 200 µm reached their settling velocity. At 350 µm diameter, the 0.25 m and10 m s−1 line crosses the 0.5 m 15 m s−1 line showing that the increase of release velocityovercomes the increase in flight distance for droplets with higher inertia. The black dashedline shows the thresholds for droplet bounce and shatter on a wheat leaf predicted for water(Dorr et al., 2015). For the whole range of droplet size studied, shatter occurs when thedroplets move faster than their settling velocity. For standard simulation conditions (i.e.0.5 m and 10 m s−1) droplets larger than 400 µm shattered and droplets between 270 and400 µm bounced. The mitigation of bounce and shatter can be done by increasing the releaseheight or by decreasing the release velocity. Nevertheless, decreasing the release velocitywas predicted as being less detrimental for the spray drift as shown in Fig.2.6 a,c.
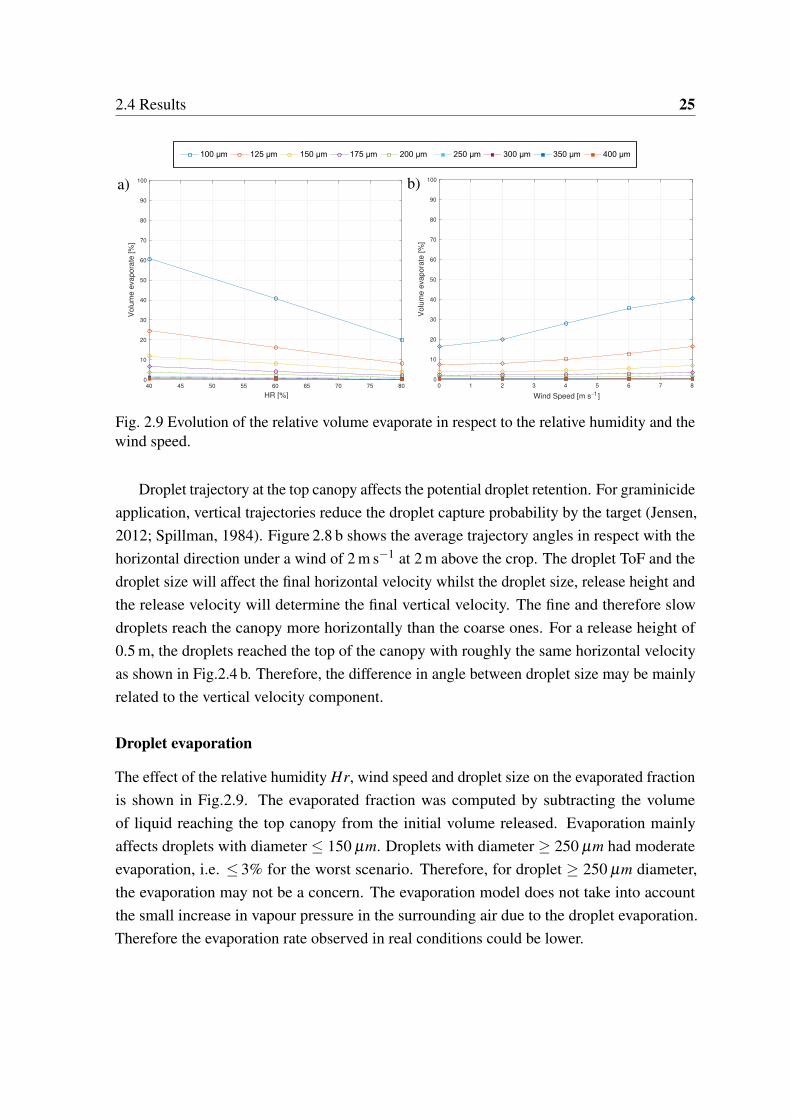
2.4 Results 25
100 µm 125 µm 150 µm 175 µm 200 µm 250 µm 300 µm 350 µm 400 µm
40 45 50 55 60 65 70 75 80
HR [%]
0
10
20
30
40
50
60
70
80
90
100
Vo
lum
e e
va
po
rate
[%
]
a)
0 1 2 3 4 5 6 7 8
Wind Speed [m s -1 ]
0
10
20
30
40
50
60
70
80
90
100
Volu
me e
vapora
te [%
]
b)
Fig. 2.9 Evolution of the relative volume evaporate in respect to the relative humidity and thewind speed.
Droplet trajectory at the top canopy affects the potential droplet retention. For graminicideapplication, vertical trajectories reduce the droplet capture probability by the target (Jensen,2012; Spillman, 1984). Figure 2.8 b shows the average trajectory angles in respect with thehorizontal direction under a wind of 2 m s−1 at 2 m above the crop. The droplet ToF and thedroplet size will affect the final horizontal velocity whilst the droplet size, release height andthe release velocity will determine the final vertical velocity. The fine and therefore slowdroplets reach the canopy more horizontally than the coarse ones. For a release height of0.5 m, the droplets reached the top of the canopy with roughly the same horizontal velocityas shown in Fig.2.4 b. Therefore, the difference in angle between droplet size may be mainlyrelated to the vertical velocity component.
Droplet evaporation
The effect of the relative humidity Hr, wind speed and droplet size on the evaporated fractionis shown in Fig.2.9. The evaporated fraction was computed by subtracting the volumeof liquid reaching the top canopy from the initial volume released. Evaporation mainlyaffects droplets with diameter ≤ 150 µm. Droplets with diameter ≥ 250 µm had moderateevaporation, i.e. ≤ 3% for the worst scenario. Therefore, for droplet ≥ 250 µm diameter,the evaporation may not be a concern. The evaporation model does not take into accountthe small increase in vapour pressure in the surrounding air due to the droplet evaporation.Therefore the evaporation rate observed in real conditions could be lower.

26 Investigation on optimal spray properties using modeling approach
2.4.2 Polydisperse sprays
Deposition
Figure 2.10 a shows the volume of spray airborne with respect to the distance from the nozzlefor twelve simulations with different Dv50 and RSF . As expected, increasing Dv50 reducesthe volume of airborne spray. Increasing Dv50 from 150 µm to 350 µm reduces the airbornespray at 2 m from 20 % to 2 %. Comparison of sprays with the same Dv50 shows that lowerthe RSF can reduce drift. For a Dv50 of 150 µm, decreasing of RSF from 1 to 0.6 produces areduction from 20 % to 12 % of the airborne spray at 2 m. Table 2.4 summarizes the airbornespray reduction at several distances induced by reducing the RSF from 1.0 to 0.6 computedas: 100Drift0.6
Drift1.0. The drift reduction produced by the RSF reduction increased with the Dv50
because the coarser the spray, the greater the relative reduction of the fine droplets. For thespray with a Dv50 of 250 µm, drift reduction was around 80 % which corresponds to a threestar rating in the LERAP scheme (Butler Ellis et al., 2017). For each Dv50 the drift reductionappeared to be roughly constant over distance.
Retention
Figure 2.11 shows the relative volume of each droplet impact for the twelve simulated sprayson a wheat leaf. For a given RSF , the increase of Dv50 leads to a monotonic decrease ofadhesion and the emergence of bounce and shatter due to a progressive increase of largerdroplet proportion. Reduction of RSF enhanced one outcome according to the Dv50, forDv50 ≤ 250 µm there was an increase of the adhesion whilst bounce increased for Dv50 ≥300 µm. For standard conditions, the diameter threshold between adhesion and bounce isaround 270 µm as shown in Fig.2.8 a. Therefore, a RSF reduction may be detrimental if theDv50 is not in the adequate range as has already been noted in previous theoretical work(Massinon et al., 2016).
2.5 Discussion
The study of the droplet transport dynamic has shown that the size of a droplet affectsits trajectory. The finer the droplet longer its time in the air making it more sensitive toevaporation and drift. The droplet ToF can be shortened by decreasing the release height orby increasing the release velocity. Release angle and release velocity have moderate effectson fine droplets. However for coarse droplets, increasing the release velocity increases thedroplet velocity at the canopy and thus its outcome during impaction. The change of therelease angle from vertical to horizontal direction leads to an increase in the traveled distance
2.5 Discussion 27
0 2 4 6 8 10 12 14 16 18 20
Distance [m]
10-4
10-3
10-2
10-1
100
101
102
Spra
y a
irbone [%
]
Span = 0.6 VMD = 150 µm
Span = 0.6 VMD = 200 µm
Span = 0.6 VMD = 225 µm
Span = 0.6 VMD = 250 µm
Span = 0.6 VMD = 300 µm
Span = 0.6 VMD = 350 µm
Span = 1.0 VMD = 150 µm
Span = 1.0 VMD = 200 µm
Span = 1.0 VMD = 225 µm
Span = 1.0 VMD = 250 µm
Span = 1.0 VMD = 300 µm
Span = 1.0 VMD = 350 µm
Fig. 2.10 Volume of airborne spray in respect with the distance. Twelve sprays were simulatedwith different Dv50 and RSF values. The outcomes have been determined at the top canopylevel using the models described in the section 2.3.2 for a release height of 0.5 m, a releasespeed of 10 m s−1 and 2 m s−1 wind speed.
Table 2.4 Airborne spray reduction [%] induced by a RSF reduction from 1.0 to 0.6. Theairborne spray reduction is given for each Dv50 at 5 distances from the release point.
Distance [m]2 4 6 8 10
Dv
50[µ
m]
150 43.4 56.0 55.7 49.2 42.9200 67.3 76.1 76.0 73.5 70.8225 74.2 81.3 81.2 79.9 77.2250 80.3 85.4 85.4 83.5 80.4300 87.0 90.6 90.0 88.3 87.0350 90.6 93.1 93.4 93.1 92.7
28 Investigation on optimal spray properties using modeling approach
0
0.2
0.4
0.6
0.8
1
Re
lative
vo
lum
e
0
0.2
0.4
0.6
0.8
1
0
0.2
0.4
0.6
0.8
1
0
0.2
0.4
0.6
0.8
1
0
0.2
0.4
0.6
0.8
1
0
0.2
0.4
0.6
0.8
1
0
0.2
0.4
0.6
0.8
1
Re
lative
vo
lum
e
0
0.2
0.4
0.6
0.8
1
0
0.2
0.4
0.6
0.8
1
0
0.2
0.4
0.6
0.8
1
0
0.2
0.4
0.6
0.8
1
0
0.2
0.4
0.6
0.8
1
150 200 225 250 300 350
0.6
1.0
Dv50 [µm]
RS
F [-]
A SB A SB A SB A SB A SBA SB
A SB A SB A SB A SB A SBA SB
Fig. 2.11 Droplet impact outcome predictions at top canopy level expressed in relativevolume. A, B and S correspond to adhesion, bounce and shatter respectively.
2.6 Conclusion 29
arising from both the initial horizontal velocity and the increase in ToF. An optimum valuemay be around 60◦. The wind speed is enhances the average droplet traveled distance linearlyand the maximum distance quadratically. However, with droplets of 250 µm, and 8 m s−1
wind speed 95 % of the spray reached canopy top level below 1 m from the release point.The shatter threshold on a wheat leaf was reached by droplets larger than 400 µm when therelease height is at 0.5 m and the release speed at 10 m s−1. With these initial conditions,bounce occurs for droplet between 270 and 400 µm. Therefore, droplets with a diameterfrom 200 to 270 µm have a low drift potential and may not shatter or bounce on a wheat leaf.
For a polydisperse sprays, the overall behavior can be seen as the combination of dropsize distribution and the properties of each droplet size. Drift and the volume of dropletadhesion decrease with increasing Dv50. Narrowing the RSF of the spray may solve thisproblem. A spray with a Dv50 of 225 µm and a RSF of 0.6 released at 0.5 m at 10 m s−1
above the crop produces low drift with moderate kinetic energy at the crop canopy level.Using a Weibull distribution, this spray would have a Dv10 of 152 µm, Dv90 of 288 µmwith 1.4 % of the droplet volume ≤ 100 µm diameter and 9.5 % ≤ 150 µm diameter. Thenarrowing of the spray drift may be detrimental when the Dv50 is too small or too large whichwould enhanced drift or decreases retention.
2.6 Conclusion
A combined Lagrangian droplet transport and retention models has been presented. Thedeposition over distance had a log-normal distribution with a dispersion and average distancelarger for finer droplets. The results of numerical simulations showed that droplets with diam-eters ranging between 200 µm and 250 µm offered high control of deposition by combininga low drift potential and moderate kinetic energy at the top of the canopy. The reduction ofthe RSF from 1.0 to 0.6 is an effective way to mitigate deposition and retention losses. Afourfold reduction of the drift volume at a distance of 2 m from the nozzle was observed for aspray with a Dv50 = 225 µm when the RSF was reduced from 1.0 to 0.6. Under this scenario,an increase in the volumetric proportion of adhering droplets on a wheat leaf from 63 to 78%was shown. Therefore, strategies to control the droplet size distribution in terms of Dv50 andRSF may offer promising solutions for reducing adverse impacts on environment of sprayapplications.
Further work should be carried out on the experimental assessment of the performance ofsuch sprays in term of drift reduction and retention on target. Sprays with a RSF around 0.6and a Dv50 of 225 µm appear to feasible using rotary atomizers (Qi et al., 2008).

30 Investigation on optimal spray properties using modeling approach
Acknowledgments
This work was supported by the Fonds De La Recherche Scientifique - FNRS, under theFRIA grant n◦ 97 364.
Appendix A
The mass flux is given by:
m = AShgDg
dρg(Yv,s −Ys,∞) (2.13)
with A the droplet area [m2], d the droplet diameter, Shg the gaseous Sherwood number[-], Dg the molecular diffusion [m s−2], Yv,s and Yv,∞ are the vapor mass fractions at thedroplet interface and far from the droplet respectively [-]. For a diameters less than 5 mm,Shg can be computed as:
Shg = 1.61+0.718Re0.5Sc0.33g (2.14)
with Scg the Schmidt number for the gaseous phase [-] expressed by: Scg =ν
Dg.
The molar fraction at the droplet surface Yv,s is computed as:
Yv,s = yvlMl
Mt(2.15)
with yvl =
PsatPtot
and Mt = yvl Ml +(1− yv
l )Mg. Ml and Mg are the molar mass of the liquidand the gaseous phase respectively [g mol−1]. Therefore, at atmospheric pressure the vapormass fraction at the droplet interface neighborhood, Yv,s, reads:
Yv,s =Psat
Psat +(Ptot −Psat)MgMl
(2.16)
The mass fraction in the far field is computed using the relative humidity Hr:
Yv,∞ = HrPsat
HrPsat +(Ptot −HrPsat)(
MgMl
) (2.17)
The droplet exchanges heat with the air by convection. The heat flux between the dropletsurface and the surrounding air Qd [J s−1] reads:
Qd = SlNugλg
d(Tinf −Tl) (2.18)

2.6 Conclusion 31
with Tl , Tin f the temperature of the droplet and far from the droplet interface respectively[K], λg the thermal conductivity of the gaseous phase [W m−1 K−1]. The gaseous Nusseltnumber Nug [-] is a function of the gaseous Reynolds and the gaseous Prandlt number Prg
[-]:
Nug = 1.61+0.718√
Re 3√
Prg (2.19)
with Prg =Cpµg
λg
The thermal balance is given by difference between the convection heat flux and thelatent heat flux:
Ql = Qd − mLv (2.20)
with Lv the vaporisation latent heat of water [J kg−1] can be expressed as a function ofthe reduced temperature Tr:
Lv = 52.05310e6 (1−Tr)0.3199−0.212Tr+0.25795T 2
r (2.21)
with Tr =Tl+273
Tcfor water Tc=647.13 K.
The temperature at each time step is retrieved by integrate:
VlρlCp∂dTl
dt= Sl
Nugλg
d(Tinf −Tl)−Lvm (2.22)
Cp the heat capacity [J K−1]. For water, the heat capacity is given by:
Cp = 276730−2090.1T +8.125T 2 −0.014116T 3 +9.3701e−6T 4 (2.23)
Appendix B
The cumulative distribution function (CDF) of a log-normal distribution is defined as:
CDF =1
xσn√
2πe− (ln(x)−µn)2
2σ2n (2.24)
with σn and µn the two log-normal distribution parameters. From these parameters reducedvariables can be extracted: the arithmetic mean E = eµn+0.5σ2
n and the arithmetic varianceVar = e2µn+2σ2
n
(eσ2
n −1)
.


Chapter 3
Characterization of droplet size andspeed using high-speed imaging
3.1 Preamble
In the previous chapter, the modeling of deposition and retention highlights the importance ofthe droplet size distribution in agricultural sprays. The experimental characterization of thedroplet distribution is generally performed performed with optical techniques. At present, therelevance of different characterization techniques remains controversial since discrepanciesmay be significant between measurements performed in different laboratories. Therefore, adigital image acquisition technique and analysis algorithm has been developed for dropletsize and velocimetry measurements. This chapter presents the technique and a comparisonwith an other method the Phase Doppler Particle Analyzer (PDPA). This work has beenhas been published in a peer reviewed journal, the publication details can be found in theTable 3.1).
Table 3.1 Summary of the appended publication.
Authors: De Cock, Nicolas and Massinon, Mathieu and Nuyttens, David and Dekeyser,Donald and Lebeau, Frédéric
Year: 2016Title: Measurements of reference ISO nozzles by high-speed imagingStatus: PublishedPeer reviewed: YesJournal: Crop protectionURL: http://hdl.handle.net/2268/200879

34 Characterization of droplet size and speed using high-speed imaging
3.2 Introduction
Droplet size and velocity distributions determine the overall treatment efficiency as theyinfluence two specific steps of the pesticide application process, namely deposition andretention (Zabkiewicz, 2007). Deposition corresponds to the droplet transport from thenozzle to the target (weeds, insects, plant pathogens, etc.) or the amount of pesticide directedwithin the target area. Deposition efficiency is then defined as the ratio between the volumeof droplet that reaches the target and the total volume sprayed. Deposition is optimizedwhen the probability of a droplet to collide with the target is maximal considering the wholedroplet size and velocity distributions. Physical transport of droplets (Walklate, 1987; Wanget al., 1995) and spray drift potential (Holterman et al., 1997; Lebeau et al., 2011; Teske et al.,2002) have been investigated and modeled intensively based on spray characteristics (dropletsize and velocity distributions) and environmental conditions (release height, meteorologicalconditions, etc.) to improve deposition. Retention is the part of the deposited volumeeffectively retained by the plant. Its efficiency is determined by the contribution of each spraydroplet during impact on the target (Massinon et al., 2015). The impact behavior dependson droplet and surface properties (Rein, 1993). Flying insect control, such as mosquitoes,requires small droplets (≤ 50 µm) for maximizing retention but are, however, airborne for alonger time than large droplets. Herbicide treatment usually involves larger droplets (200-300 µm) which are less sensitive to drift than small droplets but leading to droplet reboundand fragmentation during impact on the target. Nozzle classification according to dropletspectrum is an indicator for the most appropriated treatment for a given product and target.
The first nozzle classification was developed by the British Crop Protection Council(BCPC) in 1985. Droplet size distributions of test nozzles are compared to those of aset of reference nozzles which delimit the midpoint between five size classes, from veryfine to very coarse. The classification was improved to include spray drift potential andreference classification curves were changed from midpoints to thresholds (Southcombeet al., 1998). The American Society of Agricultural Engineers (ASAE) further expandedthis classification with an additional extra-coarse class for anti-drift nozzles (Hewitt et al.,1998). Inter-laboratory (round-robin) evaluations are often performed using the same set ofreference nozzles to compare spray quality classification between methods (Fritz et al., 2012)and to account to the weak uniformity in the manufacturing of commercial nozzles (Womac,2000). These measurements showed considerable differences between methods.
Aside agriculture, measurement of particle size and velocity is common in variousdomains including fire safety (Widmann, 2001; Zhou et al., 2012), pharmaceutical delivery(Liu et al., 2010), engine technology (Li et al., 2011), geomorphology (Kang et al., 2008),painting (Snyder et al., 1989) and food technology (Kwak et al., 2009). This resulted in many
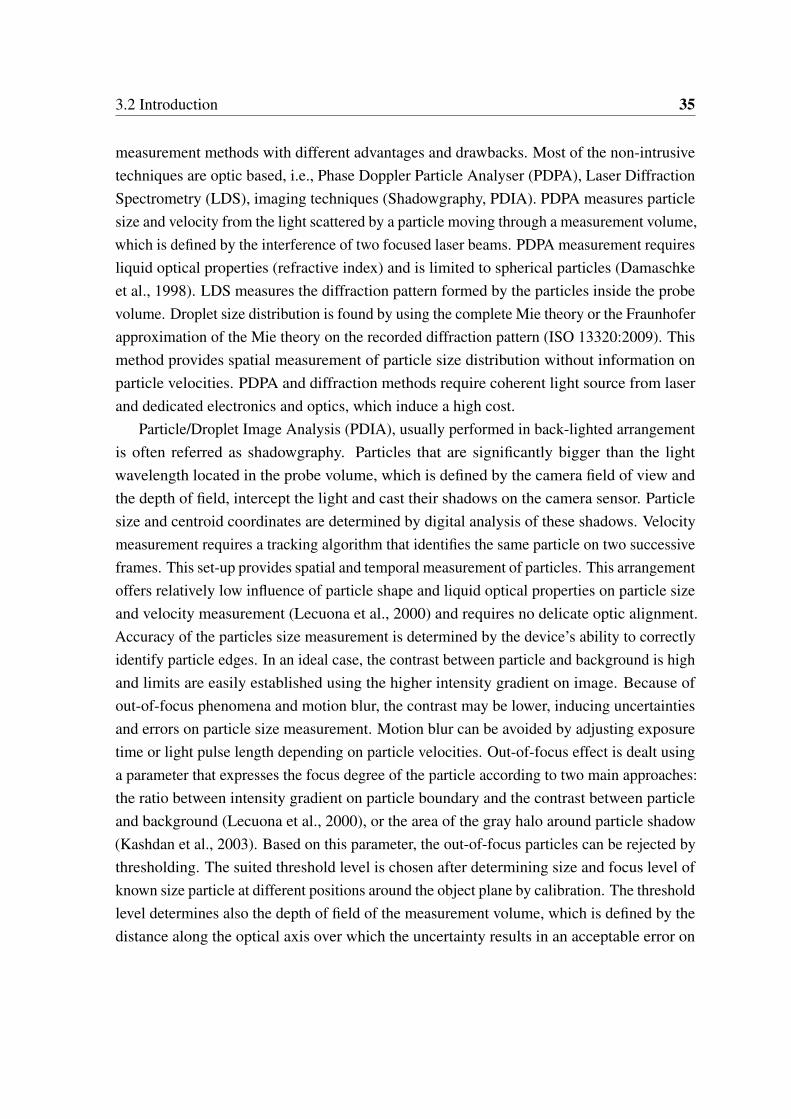
3.2 Introduction 35
measurement methods with different advantages and drawbacks. Most of the non-intrusivetechniques are optic based, i.e., Phase Doppler Particle Analyser (PDPA), Laser DiffractionSpectrometry (LDS), imaging techniques (Shadowgraphy, PDIA). PDPA measures particlesize and velocity from the light scattered by a particle moving through a measurement volume,which is defined by the interference of two focused laser beams. PDPA measurement requiresliquid optical properties (refractive index) and is limited to spherical particles (Damaschkeet al., 1998). LDS measures the diffraction pattern formed by the particles inside the probevolume. Droplet size distribution is found by using the complete Mie theory or the Fraunhoferapproximation of the Mie theory on the recorded diffraction pattern (ISO 13320:2009). Thismethod provides spatial measurement of particle size distribution without information onparticle velocities. PDPA and diffraction methods require coherent light source from laserand dedicated electronics and optics, which induce a high cost.
Particle/Droplet Image Analysis (PDIA), usually performed in back-lighted arrangementis often referred as shadowgraphy. Particles that are significantly bigger than the lightwavelength located in the probe volume, which is defined by the camera field of view andthe depth of field, intercept the light and cast their shadows on the camera sensor. Particlesize and centroid coordinates are determined by digital analysis of these shadows. Velocitymeasurement requires a tracking algorithm that identifies the same particle on two successiveframes. This set-up provides spatial and temporal measurement of particles. This arrangementoffers relatively low influence of particle shape and liquid optical properties on particle sizeand velocity measurement (Lecuona et al., 2000) and requires no delicate optic alignment.Accuracy of the particles size measurement is determined by the device’s ability to correctlyidentify particle edges. In an ideal case, the contrast between particle and background is highand limits are easily established using the higher intensity gradient on image. Because ofout-of-focus phenomena and motion blur, the contrast may be lower, inducing uncertaintiesand errors on particle size measurement. Motion blur can be avoided by adjusting exposuretime or light pulse length depending on particle velocities. Out-of-focus effect is dealt usinga parameter that expresses the focus degree of the particle according to two main approaches:the ratio between intensity gradient on particle boundary and the contrast between particleand background (Lecuona et al., 2000), or the area of the gray halo around particle shadow(Kashdan et al., 2003). Based on this parameter, the out-of-focus particles can be rejected bythresholding. The suited threshold level is chosen after determining size and focus level ofknown size particle at different positions around the object plane by calibration. The thresholdlevel determines also the depth of field of the measurement volume, which is defined by thedistance along the optical axis over which the uncertainty results in an acceptable error on

36 Characterization of droplet size and speed using high-speed imaging
the measured diameter. Depth of field grows typically with the particle size (Kashdan et al.,2003).
The rapid development of imaging equipment during the last decade makes shadowgraphyan even easier to use and a cheaper alternative to scatter or diffraction based measurementmethods for micro-metric particles. A digital Particle Image Velocimetry (PIV) cameracombined with standard optics and pulsed Light Emitting Diodes (LED) arrays as lightsource provide a relatively low cost acquisition system. This multipurpose equipment canalso be used for qualitative observations such as liquid sheet break-up (Cousin et al., 2012)or agricultural spray impact retention (Massinon et al., 2014; Massinon and Lebeau, 2012),what results in a very versatile tool for laboratories involved in spray application processes.
The aim of this paper is to gather recent developments in shadow image processingneeded to develop an accurate, versatile and low-cost tool to characterize agricultural sprayquality. The technique was evaluated with a high-speed PIV camera combined with a pulsedLED array back-light source. The developed tool was assessed by characterizing the dropletsize distribution of the 6 spray quality boundaries defined by in ISO/DIS 25358 standardfor the classification of droplet size spectra from atomizers. The results obtained with theimaging technique were compared with PDPA measurements.
3.3 Materials and methods
3.3.1 Experimental set-up
Shadowgraphy involved a back-lighted arrangement for image acquisition (Figure 3.1). APIV camera (X-Stream™ XS-3, Integrated Design Tools, Tallahassee, FL, USA) coupled withhigh magnification optics provides a field of view of 10 mm x 12 mm at a working distanceof 130 mm. The spatial resolution is equal to 9.7 µm pixel−1. With this magnification factor,droplets with a diameter ranging from 40 to 3500 µm can be measured. A custom made72 W LED array (24 Luxeon III Star White) was placed 500 mm from the camera. A LED-controller (PP600F, Gardasoft Vision, Cambridge, UK) provided repeatable intensity controlof the LED lighting. Possible shortest pulse length provided by the illumination systemwas 1 µs and was triggered by the image acquisition. Digital images were 1024 x 1280matrices in which each value is the light intensity recorded by a camera pixel. In order toavoid motion blur a short exposure time was used (3 µs). Using the double exposure mode ofthe PIV camera, two consecutive images were acquired within a short time (38 µs) allowingthe computation of the droplet displacements and subsequently the droplet velocities. Theprobe volume of this technique corresponds to the volume in which the droplets appear sharp

3.3 Materials and methods 37
LED
arra
y
LED controller
ComputerImages
Trigger
Probe
volume
Nozzle
Fig. 3.1 Shadowgraphy set-up used for the image acquisitions.
enough to be measured with an acceptable error (≤ 5 %). A droplet has to appear in bothframes of a pair of images to be taken in account. Hence the size of the probe volume isdecreasing with the droplet speed. Calibrations showed that this volume is a rectangularparallelepiped with a maximum size of 10 x 12 x 1 mm3.
3.3.2 Image processing
Figure 3.2 presents the main steps for image processing starting from the raw image. Inthe first step, raw image quality is improved by background subtraction (§3.3.2). As thebackground changes with optics alignment and camera settings, the background imageshave to be taken with the exact same set-up. In a second step, the image segmentation isperformed in two phases. Firstly, the droplets present on the images are identified and isolatedin sub-images (§3.3.2). Secondly, each droplet is individually segmented from the localbackground using by the Canny edge detection algorithm (Canny, 1986) (§3.3.2). Finally,the out-of-focus particles are rejected on the basis of a focus parameter in order to ensure anaccurate sizing (§3.3.2).
Background subtraction
Correction for the spatial illumination heterogeneity consists of subtracting the backgroundfrom each image. A composite background is then generated from the 80 percentile of eachpixel intensity on a set of 50 images. Finally, after the background subtraction the image graylevel is rescaled in a way that 1 % of pixels are saturated (i.e. equal to 0 or 255) to maximizeimage contrast, independently of the acquisition conditions.

38 Characterization of droplet size and speed using high-speed imaging
Raw image
Background
substraction
Out of focus
droplet rejection
Process Illustration
Droplet
localization
Droplet
sizing
Process Illustration
Fig. 3.2 Main steps of the droplet sizing algorithm illustrated with the example of the selectionof droplets starting from a raw image.
Droplet localization
The droplet shadows present a variable gray level depending on the droplet size, degreeof focus and local illumination. Consequently, there is no unique threshold adapted for anaccurate segmentation of all droplets. Therefore, each droplet is analyzed individually inorder to take into account the local image context. The first localization step of the dropletsis achieved by computing the light intensity gradient on the whole image using Sobel’s filters.The highest intensity gradients generally correspond to object boundaries. Therefore, thechosen threshold should be sufficiently low to detect all droplet boundaries, but high enoughto limit the noise effect. Objects are then defined as the surface delimited by boundaries.Objects smaller than 4 pixels width and objects truncated by the edge of the image arerejected because of the weak measurement accuracy. Centroid coordinates are computed forthe retained objects, which are isolated in sub-images for subsequent object sizing.
Droplet sizing
Segmentation of sub-images is realized by the Canny edge detector (Canny, 1986). Thismethod finds object edges based on the maxima of the local gradient values. It provides a1 pixel thin continuous response corresponding to highest values of local gradient maxima.Making the hypothesis that this response corresponds to droplet shadow boundaries, dropletsize is determined by computing the inner area defined by the edge.
Out-of-focus droplet rejection
Rejection of out-of-focus particles is essential for an accurate particle sizing. Droplet degreeof focus is related to the distance between the particle and the focal plane. Selection of

3.3 Materials and methods 39
particles with a minimal degree of focus determines the depth of field measurement and,consequently, the sampling volume. A well-focused object exhibits a sharp transition withthe background at its boundaries, while the degree of focus decreases as a droplet movesaway from the focal plan and a larger gray halo appears around the object. Gradient intensityat particle boundaries increases with particle degree of focus. Based on this observation, afocus parameter adapted from the in-focus parameter of (Lecuona et al., 2000) is proposed:
Focus parameter =gradbound
Iob ject − Iback(3.1)
where gradbound is the intensity gradient value on the object boundaries, Iob ject and Iback
are gray levels of the object and the background, respectively. To avoid effect of noise orthe bright spot caused by light scattering, these last values are obtained with a rank orderfilter such as median value. This focus parameter is less sensitive to local illuminationvariations since it is based on the contrast between the object and the local background.Thresholds for focused particle selection were determined by studying the evolution of thefocus parameter and the error on particle size measurement from images containing uniformdroplets with a known size at various distance of the object plane. This was achieved usinga custom-made droplet generator that produces a continuous stream of equally spaced andmono-sized droplets. The generator produce a round jet which is broken into droplets bystimulating the Plateau-Rayleigh instability at an optimal frequency by mechanical vibrations(Sirignano and Mehring, 2000). Five glass nozzles producing droplets of 111, 157, 208,351 and 516 µm were used. The droplet diameters at optimal perturbation frequency werecalculated by the following equation:
d = 3
√6Qπ f
(3.2)
where d is the droplet diameter [m], Q is the flow rate measured by bucket method [m3 s−1]and f is the perturbation frequency [Hz]. The stream of droplets was shoot with an obliquedirection in respect to the focal plane. Examples of oblique droplet streams are presentedin the Figure 3.3a. By recording around hundred pictures, a continuous expression of thefocus parameter and the relative error on the droplet size measurements could be expressedin respect to the focal plane distance (Figures 3.3b and c). Thresholds of the focus parameterwere then chosen to have both an error less than 5 % on size measurement and a depth offield as large as possible. Figure 3.4 shows the relation between the depth of field and thedroplet diameter. A threshold of the focus parameter equal to 0.23 was chosen giving thefollowing linear relationship between the depth of field (DOF) and the droplet diameter (d)
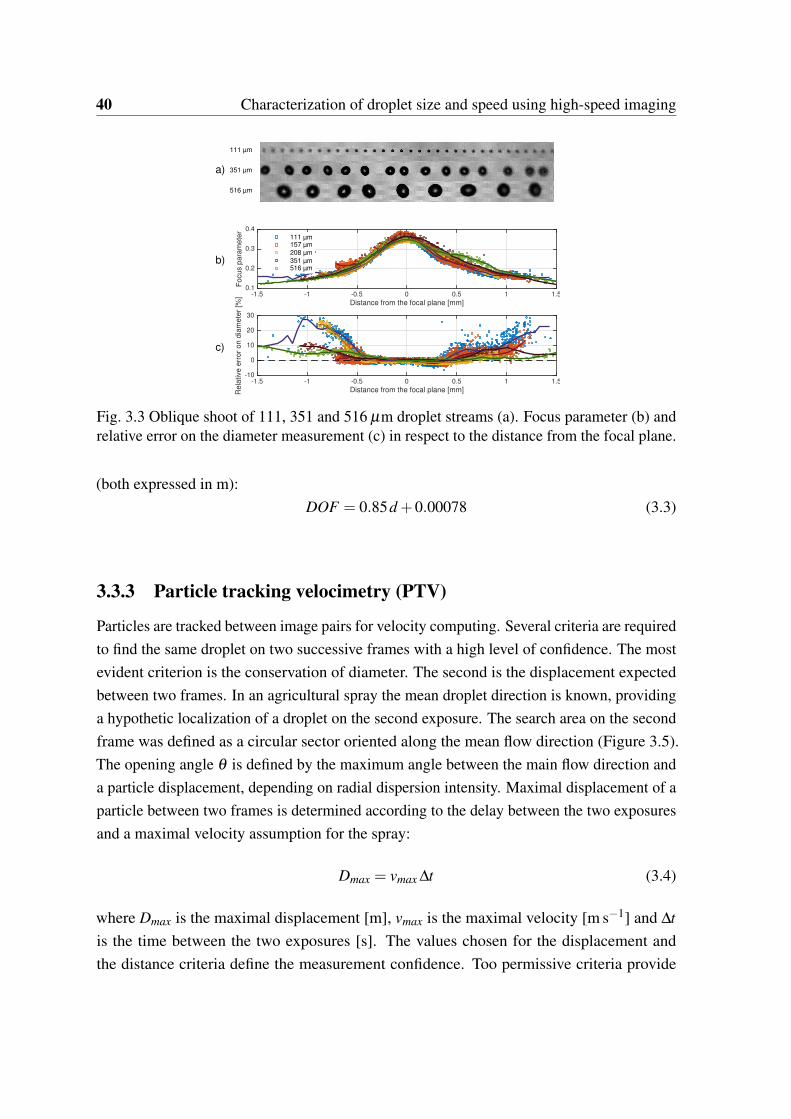
40 Characterization of droplet size and speed using high-speed imaging
Distance from the focal plane [mm]-1.5 -1 -0.5 0 0.5 1 1.5
Focus p
ara
mete
r
0.1
0.2
0.3
0.4
111 µm 157 µm
208 µm
351 µm 516 µm
Distance from the focal plane [mm]-1.5 -1 -0.5 0 0.5 1 1.5
Rela
tive e
rror
on d
iam
ete
r [%
]
-10
0
10
20
30
111 µm
351 µm
516 µm
a)
b)
c)
Fig. 3.3 Oblique shoot of 111, 351 and 516 µm droplet streams (a). Focus parameter (b) andrelative error on the diameter measurement (c) in respect to the distance from the focal plane.
(both expressed in m):DOF = 0.85d +0.00078 (3.3)
3.3.3 Particle tracking velocimetry (PTV)
Particles are tracked between image pairs for velocity computing. Several criteria are requiredto find the same droplet on two successive frames with a high level of confidence. The mostevident criterion is the conservation of diameter. The second is the displacement expectedbetween two frames. In an agricultural spray the mean droplet direction is known, providinga hypothetic localization of a droplet on the second exposure. The search area on the secondframe was defined as a circular sector oriented along the mean flow direction (Figure 3.5).The opening angle θ is defined by the maximum angle between the main flow direction anda particle displacement, depending on radial dispersion intensity. Maximal displacement of aparticle between two frames is determined according to the delay between the two exposuresand a maximal velocity assumption for the spray:
Dmax = vmax ∆t (3.4)
where Dmax is the maximal displacement [m], vmax is the maximal velocity [m s−1] and ∆tis the time between the two exposures [s]. The values chosen for the displacement andthe distance criteria define the measurement confidence. Too permissive criteria provide

3.3 Materials and methods 41
Fig. 3.4 Depth of field for the different droplet diameters according to the focus parameter.The dashed lines correspond to linear regressions.
mismatching and finally error in computed velocity. Inversely, too restrictive criteria limit thepair matching and result in a misleading velocity measurement. These errors can be removedby post processing or by adjusting the maximum displacement to the droplet diameteraccording to an iterative procedure thanks to the high velocity-size correlation into sprays(Lefebvre, 1988).
3.3.4 Droplet size distribution
Droplets do not have an equal probability to be measured due to the volumetric samplingmethod. Sampling probability is depending both on the size of the probe volume and on theresidence time of the droplets into this volume, which depends on droplet velocity and size.A slow droplet remains longer in the probe volume and in turn is more likely to be recordedon the subsequent frame than a fast droplet.
Furthermore, the larger the droplet, the higher the probability to touch the image edgesand to be rejected during the object localisation step. Droplet size distribution is establishedby weighting the volumetric contribution of the accepted droplets by a correcting factor (CF),which is defined as follows:
CF =v
FOVcor DOF(3.5)
where v is the droplet velocity [m s−1], DOF is the optical set-up depth of field [m] expressedby equation 3.3 in respect to the droplet diameter and FOVcor is the corrected camera field ofview [m2], which is the image area in which a droplet must occur in the first acquisition to be

42 Characterization of droplet size and speed using high-speed imaging
Flow direction First exposure
Second exposureSearch area
θ
Dm
ax
Fig. 3.5 Droplet tracking principle using a search area based on the size conservation of thedroplet and a priori knowledge of the flow direction in order to retrieve the same droplet ontwo successive frames.
measured (Figure 3.6) and is determined as follows:
FOVcor =[(l −d)− (v∆t)
](L−d) (3.6)
where L and l are the length and the width of the image respectively [m], d is the dropletdiameter [m] and ∆t is the time between two exposures [s]. It is assumed that the verticalcomponent of the droplet velocity is much larger than the horizontal one, which means thatthe algorithm does not take into account the possible exit of a droplet from the side of theimage.
3.3.5 Image processing implementation
Matlab R2013a with image processing toolbox was chosen as technical computing languageto implement the above image processing and analysis. The Matlab routines are availablewith an example at the permanent URL: http://hdl.handle.net/2268/150929.
3.3.6 Reference nozzles-pressure combinations
Spray characterization was performed on a set of reference nozzles using the imagingtechnique and compared with the PDPA laser technique. Six stainless steel flat fan nozzles(Sprayings Systems Co., Wheaton, USA) are currently used in round-robin tests in theframework of the ISO/DIS 25358 ”Crop protection equipment - Droplet-size spectra fromatomizers - Measurement and classification”, to define boundaries for nozzle classification:Very Fine (V F), Fine (F), Medium (M), Coarse (C), Very Coarse (VC), Ultra Coarse (UC)

3.3 Materials and methods 43
1
3
L
l
v �t
FOVcor
d
2
d
2
d
2
d
2
Fig. 3.6 Illustration of the corrected field of view (FOVcor) in dashed line which is defined asthe area on the first image wherein the droplet center must be located in order to be measured.To be measured a droplet cannot be cropped by the image edge and has to fully appear on thesecond image.
Table 3.2 Combination of nozzle and pressure defining the different spray class boundarieswith the respective nominal flow rate.
Spray classboundary Nozzle Pressure [bar] Nominal
flow rate [ℓmin−1]V F/F Teejet TP 110 01 4.5 0.48F/M Teejet TP 110 03 3 1.18M/C Teejet TP 110 06 2.5 2.16
C/VC Teejet TP 80 08 2.5 2.88VC/UC Teejet TP 65 10 1.5 2.80UC/XC Teejet TP 65 15 1.5 4.18
and Extremely Coarse (XC). The six nozzle/pressure combinations are presented in Table3.2. Tap water was used as liquid and the spray pressure was set with a maximum relativeerror of 3 %.
3.3.7 Measuring protocol
Imaging technique
For the imaging technique, the measurements were realized 0.5 m below the nozzle andcovered 1/4th of the whole spray assuming the spray to be symmetrical (Figure 3.7). Thescan of the spray was realized by recordings 1500 pair of images per line on 8 lines of0.85 m spaced by 0.001 m. During the recording of the images, the nozzle was moving at0.0425 m s−1 along the spray major axis. Finally, the droplet size distribution was retrievedby gathering the data from each scanning line. For the coarser nozzle-pressure combination

44 Characterization of droplet size and speed using high-speed imaging
Fig. 3.7 Scanning pattern used for the characterization of the sprays.
(UC/XC), 2250 pairs of images per line have been taken in order to have sufficient amountof droplets.
PDPA
A TSI/Aerometrics PowerSight solid state laser-based PDPA system was used (Nuyttenset al., 2007a). The system comprises an Argon-Ion laser, a fiber-optic transmitter and receiver,a signal analyzer, and FlowSizer-software. By means of the fiber-optic transmitter the laserbeams are focused to cross over at a distance equal to the focal length (500 mm) of thetransmitter lens. The sampling area is formed by the intersecting beams and has the shapeof an ellipsoid. When a droplet passes the sampling area, the laser light is scattered. Thefiber-optic receiver collects the scattered laser light. The light is directed by a prism pack tothree photomultiplier tubes (PMT’s) which convert the light signals into electrical signals tobe processed for velocity and size information by the signal analyzer. Each PMT producesa signal with a frequency proportional to the particle velocity taken perpendicularly to thesampling area. Therefore, the measured velocity corresponds to the vertical componentof the droplet velocity. The phase shift between the signals from two different PMT’s isproportional to the size of the spherical particles. Measurement ranges for velocity anddiameter can be changed through variations in the optical equipment, laser beam separation,and lens focal lengths of the transmitting and receiving optics. Settings on the instrumentwere chosen to cover a size range of 3 to 1113 µm. A cross-section average sample wasobtained across the spray plume at 0.5 m distances from the nozzle outlet by moving thenozzle on a scan pattern. For the PDPA measurements, the full spray pattern was sampledby scanning 9 lines. In general, a different scan trajectory was programmed depending on

3.4 Results and discussion 45
Table 3.3 Number of droplets measured and rejected with both technique for each nozzle-pressure combinations.
Number of Relative number ofmeasured droplets rejected droplets [%]Imaging PDPA Imaging PDPA
VF/F 96 918 75 205 10.2 5.1F/M 47 322 79 191 9.1 2.9M/C 40 720 77 909 9.2 3.8
C/VC 35 573 85 630 14.9 4.5VC/UC 15 998 69 821 9.0 6.8UC/XC 20 682 55 095 8.5 4.1
the type of nozzle. Scanning speed was set that each scan yielded data for at least 10 000droplets with the PDPA.
3.4 Results and discussion
3.4.1 Droplet measurement
The post processing of the 12 000 pairs of images per nozzle-pressure combination tookin average 100 minutes. Matlab R2013a was used on a desktop computer with a processorIntel i7-4930k and 16 Go of ram. The table 3.3 presents the number of droplets for eachnozzle-pressure combinations. For the imaging technique, 15 000 to 95 000 droplets wererecorded at the end of the whole scan. In order to have more than 15 000 droplets, extravideos have been recorded for the UC/XC spray. For the PDPA, from 50 000 up to 85 000droplets were measured during the scanning process. The rejected droplets for the imagingcorrespond to the droplets detected on the first frame which couldn’t be track on the secondframe. The rejected droplets for the PDPA are due to three reasons. Firstly, there is asize-intensity validation, a certain droplet size should have a certain range of intensity ofthe scattered light. Secondly, extreme values are rejected by putting some ranges (this isrejecting only 1 or a few droplets per scan). Thirdly, only droplets where we have valuesfor size and velocity are kept. PDPA presents lower amount of rejected droplets, howeverrejection arise from different origin so it’s difficult to compare.
The spatial distribution of the accepted and the rejected droplets for the imaging techniquecan be displayed over the field of view. The figure 3.8 aggregated the accepted and the rejecteddroplets from all the nozzle-pressure combinations measurements. Each pixel of the figurecorresponds to a square of 500 µm x 500 µm on the field of view. The accepted droplets

46 Characterization of droplet size and speed using high-speed imaging
are quite uniformly distributed, except on the sides of the field of view were less dropletshave been measured because in this area the droplets are more prone to exit the field of viewon the second frame or to be cropped by the image border. A large volume of the rejecteddroplets (65 %) is located in the lower 1 mm of the field of view. Since the droplets arecrossing the field of view from the top to the bottom, this high rejection rate is due to theexit of the droplet from the field of view between the first and the second frame. The dropletrejected on the sides of the field of view (1 mm from the side and neglecting the lower 1 mm)represent 9.4 % of the overall rejected volume. There is a higher droplet rejection (5.4 %) onthe right side of the field view than on the left side (4 %). This dissymmetry is explained bythe fact that only the right half side of the spray triangle is scanned. Therefore, it correspondsto the droplet on the edge of the spray which have a higher horizontal velocity. The exit ofthe field of view by the droplets are mainly occurring at the bottom side as supposed by thefield of view correction which has been proposed in §3.3.4. The other rejected droplets maycome from droplet merging, exit of the probe volume by the third axis or fail of the imageprocessing on the first or second frame.
3.4.2 Effect of the correcting factor
The figure 3.9a presents the relative number of measured droplet in respect to the dropletdiameter with both techniques. Only the F/M case is showed since the six cases presentedsimilar trends. The results of the imaging technique are presented before and after thecorrection of the sampling inhomogeneity detailed in the section §3.3.4. The correctiondecreases the peak located around 75 µm and increases the proportion of droplets largerthan 150 µm. The figure 3.9b shows the relative cumulative volume in respect to the dropletdiameter. On this representation, the coarsening effect of the correction is highlighted. Withthe correction the imaging results are closer to the PDPA data. An example of the relativevariation of each component of the correcting factor according to the droplet diameter ispresented on the figure 3.10. The depth of field and the correction of the field of view have alow range of variation equal to 1.54 and 1.15 respectively whilst the velocity has a range ofvariation of 7. This shows the preponderance of the velocity in the value of the correctionfactor. Since the velocity is increasing with the diameter, the correction is increasing therelative proportion of large droplets.
3.4.3 Droplet size distribution
Figure 3.11 compares the cumulative volumetric droplet size distribution between the PDPAand the imaging technique for the 6 reference nozzle-pressure combinations. Concerning

3.4 Results and discussion 47
Relative number
[mm]
2 4 6 8
[mm
]
2
4
6
8
10
[%]
0
0.5
1
1.5
2Relative volume
[mm]
5 10 15 20
[mm
]
2
4
6
8
10
[%]
0
0.5
1
1.5
2
(a) Accepted droplets
Relative number
[mm]
2 4 6 8
[mm
]
2
4
6
8
10
[%]
0
0.5
1
1.5
2Relative volume
[mm]
5 10 15 20
[mm
]2
4
6
8
10
[%]
0
0.5
1
1.5
2
(b) Rejected droplets
Fig. 3.8 Spatial distribution of the rejected and the accepted droplets on the field of view. Thedroplets from all the imaging measurements have been used to build this spatial distribution.
Droplet diameter [µm] 0 100 200 300 400 500 600
Rela
tive n
um
ber
of dro
ple
t [%
]
0
10
20
30
Imaging without correction Imaging with correction PDPA
(a) Relative number
Droplet diameter [µm] 0 100 200 300 400 500 600
Rela
tive c
um
ula
tive v
olu
me [%
]
0
20
40
60
80
100
Imaging without correction Imaging with correction PDPA
(b) Cumulative volume
Fig. 3.9 Relative number of droplet and relative cumulative volume in respect to the dropletdiameter for both techniques for the F/M case. The imaging results are given before andafter the correction of the sampling inhomogeneity.

48 Characterization of droplet size and speed using high-speed imaging
Droplet diameter [µm] 0 100 200 300 400 500 600
Re
lative v
alu
e
1
2
3
4
5
6
7
FOVCor
-1
DOF-1
Velocity Correcting factor
Fig. 3.10 Relative value of the different correcting factors in respect to the droplet diameterfor the F/M case.
the imaging technique, the 6 droplet size distributions are well differentiated showing thatthe imaging technique is able to measure small and coarse droplets with the same set-up. The smallest measured droplet had a diameter of 40 µm and the largest droplet hada diameter of 1300 µm. The coarser sprays present less smooth curves because of thelower number of droplets recorded. The comparison between imaging technique and PDPAmeasurement provides some general trends. For the finest sprays (V F/F and F/M), bothtechniques measured similar droplet size distributions. Whilst for the coarser sprays, there isa significative difference: for the M/C and C/VC sprays, the imaging technique measured afiner droplet size distribution and for the VC/XC and XC/UC sprays the imaging techniquemeasured coarser droplet size distribution.
The Figure 3.12 compares the measurements of Dv10, Dv50 and Dv90 obtained withboth techniques. Dv10, Dv50 and Dv90 are corresponding to the maximum particle diameterbelow which 10 %, 50 % and 90 % of the sample volume exists, respectively. For all thesprays, the imaging technique gave a lower Dv10 than the PDPA. The difference betweenboth measurements is roughly increasing with the droplet size spectrum. This observationis surprising since the imaging technique does not take into account the droplets smallerthan 40 µm, so it was expected to overestimate the Dv10. The Dv50 measurements werequite similar between both techniques except for the M/C case for which the difference issignificant (62 µm). The error bars show the standard error on the average. This error hasbeen computed by considering the three scans as independent. The error is low for the most ofthe cases, except for the Dv90 measurements of the coarse nozzle with the imaging technique.

3.4 Results and discussion 49
Fig. 3.11 Cumulative volumetric droplet size distribution for the 6 spray class boundaries.Imaging technique and PDPA are represented by the circle with full lines and the square withthe dashed lines respectively.
Table 3.4 Average, standard deviation and coefficient of variation of the difference betweenfollowing spray class boundary.
∆Dv10 ∆Dv50 ∆Dv90Avg Std CV Avg Std CV Avg Std CV[µm] [µm] [%] [µm] [µm] [%] [µm] [µm] [%]
Imaging 27.3 6.1 22.3 76.5 18.1 23.7 139.6 43.1 30.1PDPA 38.2 12.2 31.9 72.4 28.4 39.2 96.0 53.3 55.5
This relatively high error can be explained by the low amount of large droplet recordedbecause of their lower presence and their lower sampling probability with the imagingtechnique. The Dv90 comparison shows large discrepancies for the coarser sprays (VC/UCand UC/XC). In these coarse sprays, the imaging technique recorded large (≥1 mm) and fast(≥13 m s−1) droplets which have a significant contribution on the final volumetric droplet sizedistribution. These droplets may not have been detected by the PDPA system because theirdiameter exceeded the maximum detectable diameter or because of their non sphericity. Table3.4 presents the average and the standard deviation of the difference in term of Dv10, Dv50
and Dv90 between two neighboring spray classes i.e. ∆Dv10i = (Dv10i+1 −Dv10i). Imagingtechnique presents a higher spacing uniformity between each reference spray.
Table 3.5 presents for each technique the measured relative span factor (RSF) computedas: RSF =(Dv90-Dv10)/Dv50. For most of the sprays, the imaging technique presents a largervalue of RSF with RSF values of 1.2 to 1.3 whilst PDPA measured almost constant RSF

50 Characterization of droplet size and speed using high-speed imaging
Spray class boundaries VF/F F/M M/C C/VC VC/UC UC/XC
Dro
ple
t dia
mete
r [µ
m]
0
100
200
300
400
500
600
700
800
900
1000
119
148
140
193
168
212
203
248
224
291
88
100155
172
233
262
240
273304
366
379
394
481
465
537
534
789
702
929
742
613
605
537
560
415
413
Dv10 Imaging
Dv10 PDPA
Dv50 Imaging
Dv50 PDPA
Dv90 Imaging
Dv90 PDPA
Fig. 3.12 Dv10, Dv50 and Dv90 [µm] for the 6 reference sprays. Imaging technique and PDPAare represent by full lines with circles and the dashed lines with squares respectively.
Table 3.5 Relative span factor measured for each spray class boundaries for PDPA andimaging technique.
VF/F F/M M/C C/VC VC/UC UC/XCImaging 0.94 1.22 1.31 1.18 1.22 1.31PDPA 0.94 0.97 1.00 1.00 0.98 0.85
ranging around 1. For the coarsest spray, PDPA measured a surprisingly low value of RSFwhich may be explained by the difficulty of the PDPA to measure coarse droplet leading toan underestimation of the Dv90.
3.4.4 Droplet velocity distribution
In the present section, the comparisons are realized for the droplet vertical velocity sinceit’s the only velocity component measured by the PDPA. The figure 3.13 shows the averagevelocity measured according to the droplet diameter class for both techniques. The averagevelocity has been computed with diameter classes of 50 µm for bins having at least 25 droplets.Discrepancies between both techniques mainly appears for larger droplets. The source ofthese differences may be a combination of an error on size and velocity measurement, a toosmall sample or a difference in the operating conditions.
The figure 3.14 shows the cumulative volumetric droplet velocity distribution for the 6different nozzle-pressure combinations. The droplet velocity is ranging from 0 to 20 m s−1.For the finer sprays, the velocity is increasing with the droplet size. The highest speeds were
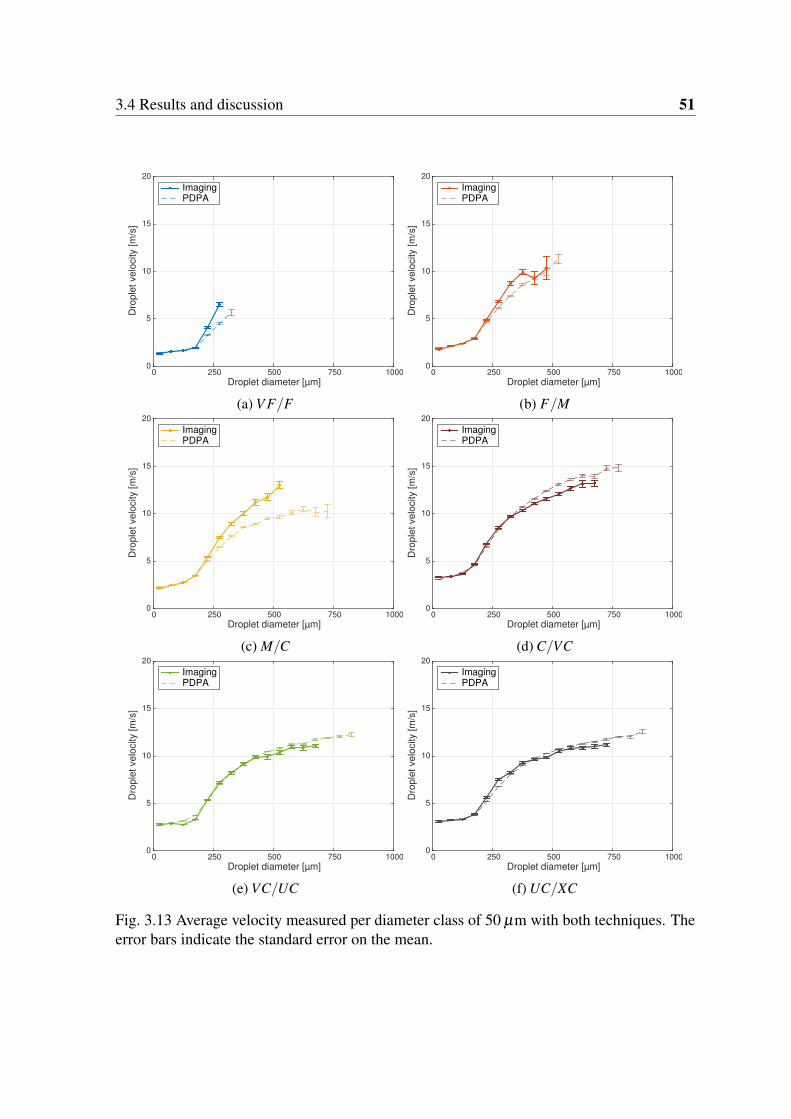
3.4 Results and discussion 51
Droplet diameter [µm] 0 250 500 750 1000
Dro
ple
t ve
locity [
m/s
]
0
5
10
15
20
Imaging PDPA
(a) V F/F
Droplet diameter [µm] 0 250 500 750 1000
Dro
ple
t ve
locity [
m/s
]
0
5
10
15
20
Imaging PDPA
(b) F/M
Droplet diameter [µm] 0 250 500 750 1000
Dro
ple
t ve
locity [
m/s
]
0
5
10
15
20
Imaging PDPA
(c) M/C
Droplet diameter [µm] 0 250 500 750 1000
Dro
ple
t ve
locity [
m/s
]
0
5
10
15
20
Imaging PDPA
(d) C/VC
Droplet diameter [µm] 0 250 500 750 1000
Dro
ple
t ve
locity [
m/s
]
0
5
10
15
20
Imaging PDPA
(e) VC/UC
Droplet diameter [µm] 0 250 500 750 1000
Dro
ple
t ve
locity [
m/s
]
0
5
10
15
20
Imaging PDPA
(f) UC/XC
Fig. 3.13 Average velocity measured per diameter class of 50 µm with both techniques. Theerror bars indicate the standard error on the mean.

52 Characterization of droplet size and speed using high-speed imaging
Droplet velocity [m/s]0 2 4 6 8 10 12 14 16 18 20
Cum
ula
tive r
ela
tive v
olu
me [
%]
0
10
20
30
40
50
60
70
80
90
100
VF/F F/M M/C C/VC VC/XC XC/UC
Fig. 3.14 Cumulative volumetric droplet velocity distribution for the 6 different nozzle-pressure combinations. Imaging technique and PDPA are represented by the circle with fulllines and the square with the dashed lines respectively.
found for the C/VC nozzle-pressure combination. This high speed may justify the relativelyhigher percentage of rejected droplets observed for this nozzle-pressure combination withthe imaging technique. The differences observed between both techniques mainly arise fromthe difference in term of droplet size measurements since the size/velocity behavior is similarwith both technique.
3.5 Conclusion
A digital image acquisition technique and analysis algorithm was proposed for droplet sizeand velocimetry measurements. The image acquisition set-up and the image processingmethod has been detailed. The droplet size distributions of a set of reference sprays defined inthe ISO/DIS 25358 were measured using the proposed imaging technique and a PDPA laser.Concerning the imaging technique, the 6 sprays droplet size distributions were differentiatedwell. The smallest droplet measured had a diameter of 40 µm and the largest dropletmeasured had a diameter of 1300 µm. The comparison between imaging technique and PDPAmeasurement provided some global trends. For the finest spray (V F/F), both techniquesmeasured a similar droplet size distributions. Whilst for the coarser sprays, there is asignificant difference: for the F/M and M/C sprays, the imaging measured a finer droplet sizedistribution and for the C/VC, VC/XC and XC/UC sprays the imaging technique measuredcoarser droplet size distribution. PDPA measurements tend to measure an equivalent Dv50, a

3.6 Aknowledgments 53
higher Dv10 and a lower Dv90 than the imaging technique leading therefore to a lower relativespan factor. Velocity measurements showed good agreement between both techniques exceptfor one nozzle/pressure combination. Therefore, comparison of two measurements realizedwith each method should be realized carefully knowing these differences. The Dv50 seems tobe the best parameter for comparisons since both techniques provide similar value.
3.6 Aknowledgments
This work was supported by the Fonds de la Recherche Scientifique - FNRS under the FRIAgrant n◦ 97364.


Chapter 4
Numerical modelling of the effect of asplash plate nozzle inlet shape
4.1 Preamble
The development of an analytical model of the flow on the nozzle plate has been realizedusing Computational Fluid Dynamics simulations using a volume of fluid model. Thedevelopment of the model is presented in the next chapter. The present chapter introducesthe numerical model and assess its capability to simulate the spreading of a liquid sheet on asolid surface. The following work has been presented in the ASABE meeting 2014, detailscan be found in the Table 4.1. The paper has been partly modified in order to improve itsclarity.
Table 4.1 Summary of the appended publication.
Authors: De Cock, Nicolas and Massinon, Mathieu and Mercatoris, Benoit andand Lebeau, Frédéric
Year: 2014Title: Numerical modelling of mirror nozzle flowStatus: Conference proceedingPeer reviewed: NoEvent name: Asabe meeting 2014URL: http://hdl.handle.net/2268/169750

56 Numerical modelling of the effect of a splash plate nozzle inlet shape
4.2 Introduction
The use of plant protection products is required to satisfy the demand for high quality andhigh production of agricultural products. Typically liquid sprays are applied to the growingplants at different growth stages. These protect the crops from pest and disease damage toprovide increased yield and quality. This is achieved by atomizing the agricultural spraymixture through a nozzle to generate a cloud of droplets. It has been proven that droplet sizenot only has a significant effect on the global deposition process efficiency (Matthews, 2008)but also, smaller droplets have a higher drift potential (Taylor et al., 2004) leading to potentialproduct losses to the air, water and soil (Reichenberger et al., 2007). Larger droplets, with ahigher kinetic energy, are more prone to shatter while which may reduce the plant retentionefficiency (Massinon and Lebeau, 2012). The droplet sizes and their speeds in a spraycloud result from the interactions between the physical properties of the liquid, the nozzleoperating conditions and the nozzle geometry (Miller and Butler Ellis, 2000). During the pastdecades, there have been multiple researches on the effect of the liquid physical properties(Butler Ellis et al., 1997, 2001; Holloway et al., 2000) as well as the nozzle type (Nuyttenset al., 2007a). However, to our knowledge, few specific works focused on the relationshipbetween nozzle geometry parameters and the spray produced. The numerical studies realizedon black liquor nozzles provided promising results for nozzle design (Fard et al., 2007). Thepresent effort is the first step of a work which aims at optimizing the design of a splashplate nozzle producing a spray with a narrow drop size distribution, in order to increase theagricultural spray application efficiency. Splash plate nozzles, which generate sprays by theimpact of a liquid jet onto a solid surface, have a low susceptibility to clogging and a highcustomization potential. The plate of the nozzle will end with structure splitting the liquidsheet into multiple jets. Here, emphasis is put on the liquid flow homogeneity on the platewhich is a prerequisite for the production of jets with uniform properties. This chapter isdivided into three parts. The first part is dedicated to the description of the numerical modelused for the simulations. The second part is the assessment of the OpenFoam multiphasesolver by computing the impact of a round liquid jet on a horizontal solid surface. This flowhas an analytical solution proposed by Watson (1964). The third part presents a study of pipeshape and inlet flow rate effects on the flow homogeneity on the plate.

4.3 Materials and methods 57
1
1
1
0.6
0.05
1
1
1
1
0.35
1
1
1
1
0.8
1
1
1
1
0.95
0.8
0
0.05
0.35
1Fig. 4.1 Example of C field, the blue shape indicates the real liquid contour.
4.3 Materials and methods
4.3.1 Numerical model
The InterFoam solver from the OpenFoam C++ toolbox has been used which is a Volume OfFluid (VOF) solver for incompressible two-phase flow. The VOF method is used to trackand locate the liquid-air interface. It requires an Eulerian grid and the use of an additionalvariable, C. This extra variable defines the liquid fraction inside each cell; its value is equalto 1 for a cell full of water and 0 for the cell with air, and values range between 0 and 1while the cell is located at the interface (Figure 4.1). The Figure 4.1 presents an exampleof distribution of C at a liquid-gas interface. Then, the interface location is retrieved basedon the liquid fraction distribution. This implicit interface capturing method is less accuratethan explicit method as level-set but it has the advantage to be mass conservative (Deshpandeet al., 2012).
Here, all the cases are considered as in a laminar mode. Therefore, no extra turbulencemodel has been used. The main equations solved are detailed below, more details aboutthis solver can be found in the paper of Deshpande et al. (2012). The mass conservation forincompressible flow is given by:
∇ ·U = 0 (4.1)
where U is the velocity [m s−1]. The liquid fraction transport equation is:
∂C∂ t
+∇ · (UC) = 0 (4.2)
where C is the liquid fraction [-] and the momentum conservation equation consists of:
∂ρU∂ t
+∇ · (ρU U)−µ∆U −ρg−FST +∇p = 0 (4.3)
where ρ is the density [kg m−3], t is the time [s], ν is the dynamic viscosity [Pa s], gis the gravity [m s−2], FST is the surface tension force per unit of volume [N m−3] and p is

58 Numerical modelling of the effect of a splash plate nozzle inlet shape
a
h(r)
U(r)
U0
Air
Water
r
Fig. 4.2 Flow illustration, where a is the jet radius [m], U0 is the initial velocity [m s−1], hthe water thickness [m], U the velocity magnitude at the water/air interface [m s−1] and r thedistance to the jet center [m].
the pressure [Pa]. The density and the viscosity are computed by weighting the two fluidproperties by the liquid fraction as follows
ρ = ∑ρiCi (4.4)
µ = ∑µiCi (4.5)
4.3.2 Validition case
Flow description
The case studied is the flow created by the impact of a round water jet onto an infinite smoothsolid surface (Figure 4.2). This two-phase flow is similar to the flow developing on the plateof a splash plate nozzle flow. The flow is axi-symmetric, with the liquid sheet height h andthe surface velocity U are related to the initial jet characteristics and the radial distance rfrom the jet center. Watson (1964) used the boundary-layer theory to provide an analyticalsolution for the free surface height and velocity depending on the jet center distance. Theequations of Watson’s model are fully detailed in the next chapter. This reference case willbe used to assess the capability of the solver to provide a realistic solution for this type offlow.
For the present study, the initial jet velocity U0 and the jet radius a are fixed at 3 m s−1
and 0.4 mm respectively. The jet Reynolds number is computed as follows:
Re =Qν a
(4.6)
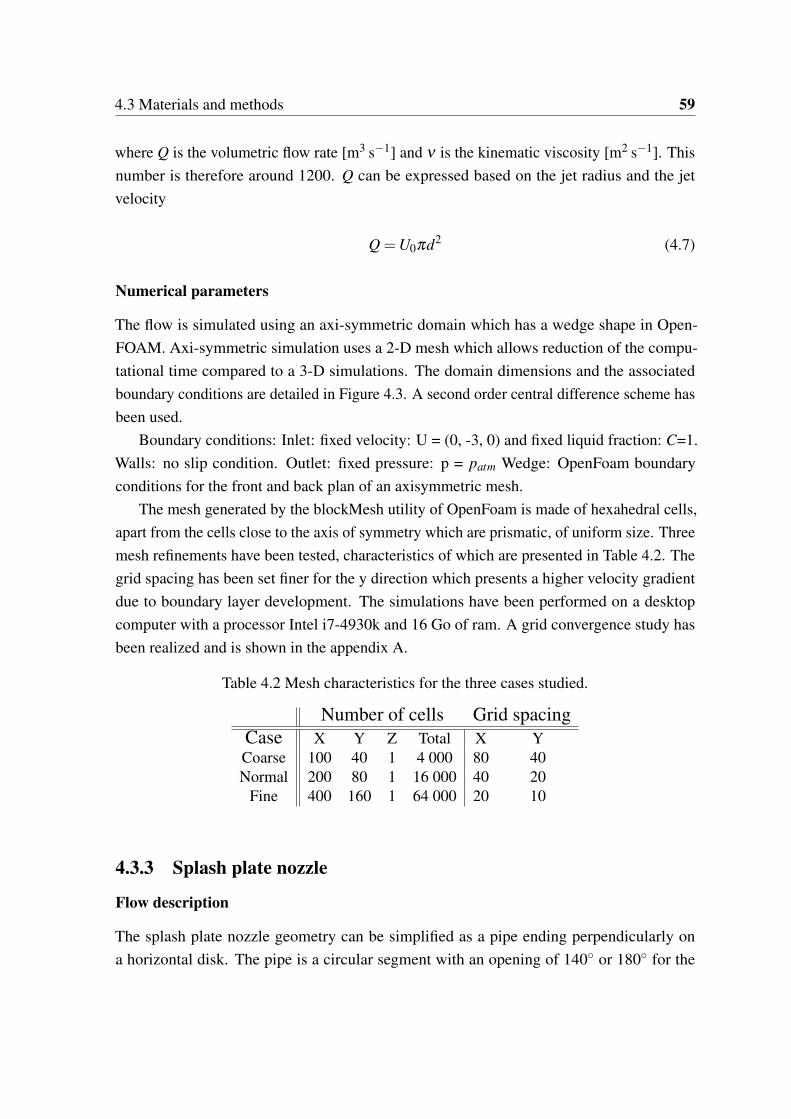
4.3 Materials and methods 59
where Q is the volumetric flow rate [m3 s−1] and ν is the kinematic viscosity [m2 s−1]. Thisnumber is therefore around 1200. Q can be expressed based on the jet radius and the jetvelocity
Q =U0πd2 (4.7)
Numerical parameters
The flow is simulated using an axi-symmetric domain which has a wedge shape in Open-FOAM. Axi-symmetric simulation uses a 2-D mesh which allows reduction of the compu-tational time compared to a 3-D simulations. The domain dimensions and the associatedboundary conditions are detailed in Figure 4.3. A second order central difference scheme hasbeen used.
Boundary conditions: Inlet: fixed velocity: U = (0, -3, 0) and fixed liquid fraction: C=1.Walls: no slip condition. Outlet: fixed pressure: p = patm Wedge: OpenFoam boundaryconditions for the front and back plan of an axisymmetric mesh.
The mesh generated by the blockMesh utility of OpenFoam is made of hexahedral cells,apart from the cells close to the axis of symmetry which are prismatic, of uniform size. Threemesh refinements have been tested, characteristics of which are presented in Table 4.2. Thegrid spacing has been set finer for the y direction which presents a higher velocity gradientdue to boundary layer development. The simulations have been performed on a desktopcomputer with a processor Intel i7-4930k and 16 Go of ram. A grid convergence study hasbeen realized and is shown in the appendix A.
Table 4.2 Mesh characteristics for the three cases studied.
Number of cells Grid spacingCase X Y Z Total X YCoarse 100 40 1 4 000 80 40Normal 200 80 1 16 000 40 20
Fine 400 160 1 64 000 20 10
4.3.3 Splash plate nozzle
Flow description
The splash plate nozzle geometry can be simplified as a pipe ending perpendicularly ona horizontal disk. The pipe is a circular segment with an opening of 140◦ or 180◦ for the

60 Numerical modelling of the effect of a splash plate nozzle inlet shape
Inlet
Walls
Outlet
Wedge
Outlet
5°
Y
X
Axis of symmetry
0.4 mm
7.6 mm
1.6 mm
Fig. 4.3 Numerical domain of the test case with the associated boundary conditions. Thedomain is as a wedge shape corresponding to OpenFOAM axisymmetric case.
Table 4.3 Summary of the numerical simulations parameters.
Case Geometry Flow rate [ℓmin−1] Inlet velocity [m s−1]1 180° 0.5 1.052 180° 1 2.13 180° 2 4.24 140° 0.5 1.355 140° 1 2.76 140° 2 5.4
geometry 1 or 2 respectively. For both geometries, three flow rates are tested: 0.5, 1 and 2ℓmin−1 (Table 4.3). The flow will create a liquid sheet on the plate. The goal of the splashplate nozzle design is to obtain at the edge of the plate a homogeneous liquid sheet makingan angle of ~140◦. Over 140◦, there is a gap of 0.3 mm between the plate and the pipe. Thisopening guides the flow parallel to the plate. The effect of two different inlet geometrieswere tested on the downstream flow homogeneity at various flow rate is assessed.
Numerical simulations
The Figure 4.4 presents the numerical domain for the geometry 1 with the boundary condi-tions used for all the cases. 3-D meshed have been used. All the simulations were ran asunsteady with the InterFoam solver. At the beginning of the simulations, the flow presentsa transient phase during which the plate is progressively wet as shown in Figure 4.5. Theduration of this phase ranges from 10-40 ms according to the initial flow rate in the pipe. Thisphase is followed by an almost steady phase. The example presented has the time average ofthe numerical solution during the steady phase.
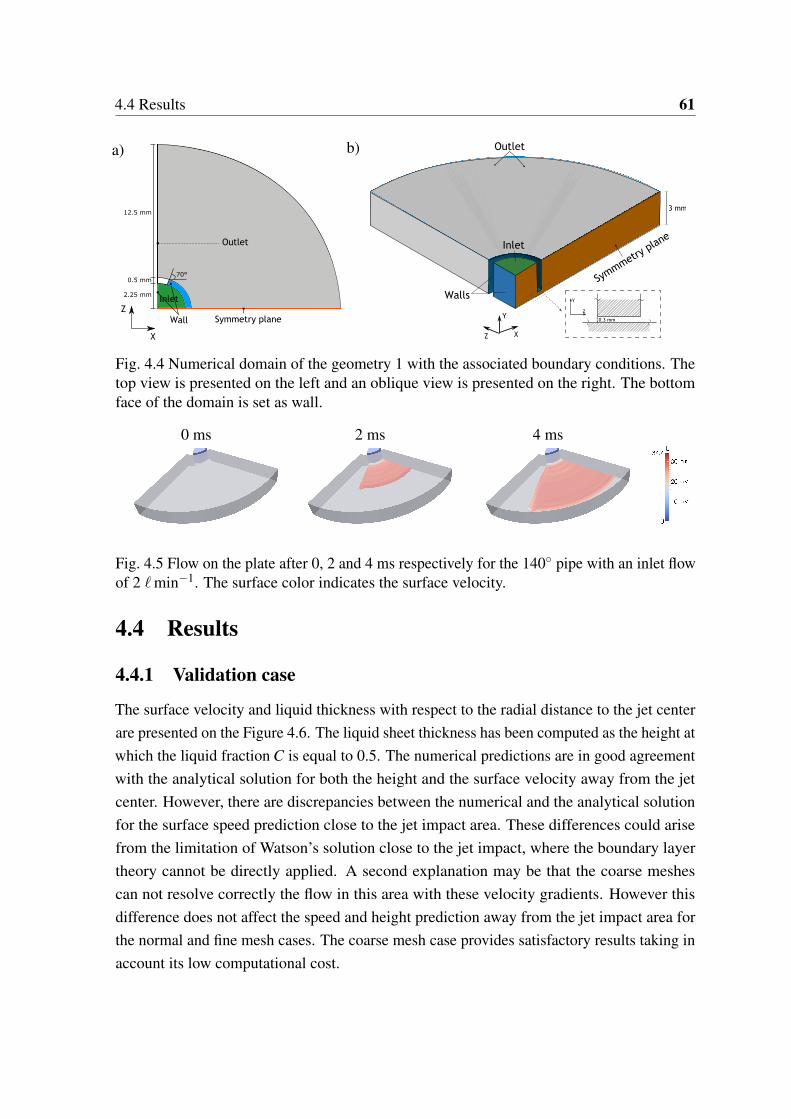
4.4 Results 61
Outlet
Inlet
Symmetry planeWall
70°
Z
X
0.5 mm
2.25 mm
12.5 mm
a)
Inlet
Outlet
Walls
Symmmetry
plane
XZ
Y0.3 mm
Z
Y
3 mm
b)
Fig. 4.4 Numerical domain of the geometry 1 with the associated boundary conditions. Thetop view is presented on the left and an oblique view is presented on the right. The bottomface of the domain is set as wall.
0 ms 2 ms 4 ms
Fig. 4.5 Flow on the plate after 0, 2 and 4 ms respectively for the 140◦ pipe with an inlet flowof 2 ℓmin−1. The surface color indicates the surface velocity.
4.4 Results
4.4.1 Validation case
The surface velocity and liquid thickness with respect to the radial distance to the jet centerare presented on the Figure 4.6. The liquid sheet thickness has been computed as the height atwhich the liquid fraction C is equal to 0.5. The numerical predictions are in good agreementwith the analytical solution for both the height and the surface velocity away from the jetcenter. However, there are discrepancies between the numerical and the analytical solutionfor the surface speed prediction close to the jet impact area. These differences could arisefrom the limitation of Watson’s solution close to the jet impact, where the boundary layertheory cannot be directly applied. A second explanation may be that the coarse meshescan not resolve correctly the flow in this area with these velocity gradients. However thisdifference does not affect the speed and height prediction away from the jet impact area forthe normal and fine mesh cases. The coarse mesh case provides satisfactory results taking inaccount its low computational cost.

62 Numerical modelling of the effect of a splash plate nozzle inlet shape
0 1 2 3 4 5 6 7 8Radial distance from jet center [m] ×10-3
0
0.5
1
1.5
2
2.5
3
Surfa
ce v
eloc
ity [m
/s]
Coarse MeshNormal MeshFine MeshAnalytical solution
a)
0 1 2 3 4 5 6 7 8Radial distance from jet center [m] ×10-3
0
0.5
1
1.5
2
2.5
3
Liqu
id s
heet
thic
knes
s [m
]
×10-4
Coarse MeshNormal MeshFine MeshAnalytical solution
b)
Fig. 4.6 a) Analytical and numerical solutions of the water thickness h in respect to the radialdistance from the jet center r. b) Analytical and numerical solutions of the interface velocityU in respect of the radial distance from the jet center r. The numerical results with threemesh refinements are shown using different symbols.
4.4.2 Splash plate nozzle
Figure 4.7 presents the spatial distribution of the normalized water flow rate in the radialdirection. The flow is normalized at each position by the inlet flow and the distance from theinlet center. Therefore, for an ideal case the flow rate would be 1 between -70 and 70◦.
For all the cases, the water flows radially in respect to the inlet. The 140◦ geometrypresents a more homogeneous flow rate distribution than the 180◦ geometry for the 1 and 2ℓmin−1 cases. The increase in flow rate produces different effects for each geometry. In the140◦ case, the flow becomes more homogeneous, leading to an increase in the flow angle. Inthe 180◦ case, at 1 and 2 ℓmin−1 the flow becomes less homogeneous causing a decrease ofthe flow angle.
4.5 Conclusion
The InterFoam solver assessment with an analytical solution provides satisfactory results. Thepredictions for both liquid sheet height and interface velocity were in good agreement withthe analytical solution for the region away from the jet impact location. The discrepanciesobserved in the region close to the impact could arise from the limitation of the analyticalsolution close to the jet impact. The sensitivity study of the nozzle geometry and the inletflow rate on the downstream flow allowed us to see a strong effect due to both parameters.The flow rate increase led to a more homogeneous flow in most of the cases. The inlet shape

4.5 Conclusion 63
180◦
0.5 ℓmin−1
140◦
1 ℓmin−1
2 ℓmin−1
Fig. 4.7 Spatial distribution over the plate of the normalized flow rate for each case. Thecolors correspond to the normalized flow rate in the radial direction and the vectors to theaverage velocity in the liquid phase.

64 Numerical modelling of the effect of a splash plate nozzle inlet shape
affects the downstream flow significantly. The 140◦ circular segment inlet seems suitable forour objective of generating a homogeneous flow on the nozzle plate.

4.5 Conclusion 65
Appendix A
Grid convergence
The use of three mesh refinements for the validation case study allows us to assess thediscretization error. The relative error on the mean flow rate prediction away from the jetimpact point (whilst r ≥ 10 a) is presented in the Figure 4.8 for each case. The predicted flowrate shows a monotonic convergence with the increase of cells. The computation of the orderof the scheme leads to an order of accuracy of 1.73 which is lower than the theoretical
p =log(
φ4h−φ2hφ2h−φh
)log(r)
(4.8)
where, r is the refinement factor equal to 2 in this case and are respectively for the fine,normal and coarse meshes.
0 1 2 3 4 5 6 7
Number of cells #104
1
2
3
4
5
6
7
8
9
10
Rel
ativ
e er
ror
on fl
ow r
ate
com
puta
tion
[%]
Fig. 4.8 Error on the estimation of the flow rate in respect with cell number.


Chapter 5
Dynamics of a thin radial liquid flow
5.1 Preamble
The analytical description of the flow on the nozzle plate is based on an extension of theanalytical solution of the radial spread of a liquid jet over a horizontal surface. The fitting ofthe model parameters has been done using Computational Fluid Dynamics simulations. Thepresent chapter has been published in a peer reviewed journal, the publication’s details areshown in Table 5.1).
5.2 Introduction
The radial spread of a liquid film created by a round jet impact on a surface (figure 5.1a)occurs in numerous applications including mass and heat transfer. Surface cooling usingan impinging water jet has been studied (Hosain et al., 2015; Ishigai et al., 1977; Liu et al.,1991). Spray formation by fire sprinkler (Aghajani et al., 2014; Marshall and Di Marzo,
Table 5.1 Summary of the appended publication.
Authors: De Cock, Nicolas & Massinon, Mathieu & Ouled Taleb Salah, Sofiene& Mercatoris, Benoit & Vetrano, Maria Rosaria & Lebeau, Frédéric
Year: 2016Title: Dynamics of a thin radial liquid flowStatus: PublishedPeer reviewed: YesJournal: Fire safety journalURL: http://hdl.handle.net/2268/200526

68 Dynamics of a thin radial liquid flow
R
h(r)
U0
Gas
Liquid
r
�(r)
r0 r01.43
z
a
R
h(r)
U0
Gas
Liquid�(r)
U1H
z
rr0 r01.43
b
Fig. 5.1 Half radial cut of the radial flow created by a impact of a round jet on a horizontalplate (top) and thin cylindrical opening (bottom). With r the radial distance, R the jet radius,H the distance between the nozzle and the plate, U0 jet mean velocity, U1 the main streamvelocity, h(r) the liquid film thickness, U(r) the interface velocity and δ (r) the boundarylayer thickness.
2004; Wu et al., 2007) or plate nozzle (De Cock et al., 2014; Fard et al., 2007; Gordillo et al.,2014) involves a liquid film as the first step of a spray formation. The governing parametersof the spray formation process are the thickness and the velocity of the liquid layer. (Wuet al., 2007) proposed a sprinkler spray model which combines a film flow dynamic modelbased on analytical solution of (Watson, 1964) with an atomization model. Since sprinklerare usually pressure based, one way to reduce the flow rate whilst keeping the same velocityis to constraint the liquid by bringing the nozzle closer to the plate (figure 5.1b). This way ofworking has the advantage that it does not require the modification of the orifice size.The hydrodynamics of the impact of an axi-symmetric liquid jet on a normal surface hasbeen theoretically studied by Watson (Watson, 1964) who provided an analytical solution ofthe liquid layer thickness h(r) and surface velocity U(r) in respect with the radial distancefrom the jet center r, the liquid kinematic viscosity ν , the jet volumetric flow rate Q andthe jet radius R. His solution is realized using a self similarity solution and the momentumintegral solutions. He distinguished three main regions in the flow. The first one begins atstagnation point where the boundary layer starts growing and it finishes at r = r0 where thewhole flow is within the boundary layer. In the second region, the boundary layer is fullydeveloped. The liquid layer thickness is controlled by both radial dispersion and viscous wall

5.2 Introduction 69
effects. The liquid layer thickness is decreasing until r = 1.43 r0 and then it increases.Measurements of the liquid layer thickness and the velocity profile realized by Azuma et al.(Azuma and Hoshino, 1984a,b,c) using needle probe and laser Doppler velocimeter show agood agreement with the solution proposed by Watson for flows with a Reynolds numberranging from 2.2 104 (Azuma and Hoshino, 1984b) to 1.7 105 (Azuma and Hoshino, 1984c).The laminar to turbulent transition defined by Azuma and Hoshino (1984a) as the presenceof sandpaper-like waves in more than 50 % of the peripheral direction. This transition occursfor a Re around 5 104.When the nozzle is close to the plate (figure 5.1b), the water is discharging through a thincylindrical opening creating a thin liquid layer spreading radially. At the inner corner ofthe constriction, the flow is separating leading to an actual discharging area smaller than2π RH. Lichtarowicz and Markland (1963) performed 2D numerical computations using thefree-streamline theory on right-angle elbows with geometrical ratio, upstream to downstreamchannel width, ranging from 0.01 to 1.2. They compute the contraction coefficient (Cc)defined as the ratio of the asymptotic stream width downstream of the corner to the upstreamchannel width. The Cc was decreasing with the geometrical ratio. Chu (2003) investigatedthe effect of the elbow angle on the contraction coefficient showing that Cc was decreasingwith the elbow angle. Their computations of the Cc has been validated by Hou et al. (2014)who solved the Euler equations of the flow at a corner using a Lagrangian model based onsmoothed particle hydrodynamics method.The goal of this paper is to provide an analytical description of the thickness and the velocityof a thin liquid layer generated by radial flow generated by a thin cylindrical opening. Thesolution combines the analytical solution given by Watson and a correlation expression theflow acceleration due to the flow separation in respect with the geometrical ratio. The paper isstructured as follows: in § 5.3.1 the theoretical development proposed by Watson for a roundjet spreading radially is summarized. The full description of the theoretical developmentscan be found in Watson’s paper (Watson, 1964); in § 5.3.2 presents the theoretical extensionto a radial flow of the Watson solution; in § 5.4 presents the numerical computations used tofind the relationship between the geometrical ratio and the flow acceleration; finally, in § 5.5the validity and the quality of the proposed model is discussed.

70 Dynamics of a thin radial liquid flow
5.3 Theoretical developments
5.3.1 Flow created by a round liquid jet impacting on a horizontalplate
Fully developed region: similarity solution
This axi-symmetric flow can be described as a thin layer by the following equations:
∂ (ru)∂ r
+∂ (rw)
∂ z= 0 (5.1)
u(
∂u∂ r
)+w
(∂u∂ z
)= ν
(∂ 2u∂ z2
)(5.2)
where r is the radial distance from the jet center [m], z is the distance upward from the plate[m], u and w are the corresponding velocity components [m s−1], ν is the kinematic viscosity[m2 s−1].
The hypothesis are: a no slip condition at the plate (eq. 5.3), the shear stress at the freesurface is negligible (eq. 5.4) and the flow rate along the radial axis is constant (eq. 5.5).
u = w = 0 at z = 0 (5.3)
∂u∂ z
= 0 on z = h(r) (5.4)
Q = 2πr∫ h(r)
0u dz (5.5)
The velocity profile in the axial direction u can be rewritten as function of the velocity atthe free surface U(r) and a similarity solution f (η):
u =U(r) f (η) with η =z
h(r)(5.6)
Then, the flow rate along the radial direction given by the equation 5.5 can be rewrittenas:
Q = 2πrUh∫ 1
0f (η)dη (5.7)
Watson used the integral method to retrieve the integral of the velocity profile over theliquid layer thickness equal to:
∫ 1
0f (η)dη =
2π
3√
3c2(5.8)

5.3 Theoretical developments 71
with c is a constant of integration equal to 1.402. Finally, the constant flow equation 5.7 canbe rewritten as:
rUh =3√
3c2Q4π2 (5.9)
Using the equations 5.2 and 5.9, U(r) and h(r) can be expressed as:
U(r) =27c2Q2
8π4ν(r3 + l3)(5.10)
h(r) =2π2ν(r3 + l3)
3√
3Qr(5.11)
where l is a constant length arising from the integration of ∂U∂ r in the equation 5.2. The value
of l will be determined later using the boundary development region equations knowing thath(r0) = δ .
Boundary development region: general approximate solution
In the first region, the boundary layer is not fully developed thus the velocity outside theboundary layer is considered as equal to the velocity of the jet U0 which is expressed as:
U0 =Q
πR2 (5.12)
Inside the boundary layer, the velocity profile is defined by the similarity function f (η):
u =U0 f( z
δ
)with u =U0 when z ≥ δ (r) (5.13)
The momentum integral equation is equal to:(ddr
+1r
)∫δ
0(U0 u−u2)dz = ν
(∂u∂ z
)z=0
(5.14)
Integration and rewriting of equation 5.14 gives:
δ =
√ √3c3νr(
π − c√
3)
U0(5.15)
The constant flow rate expression given by equation 5.5 can be rewritten as:
Q = 2πr(
U0δ
∫ 1
0f (η)dη +U0(h−δ )
)(5.16)

72 Dynamics of a thin radial liquid flow
From which h can be derived:
h(r) =R2
2r+
(1− 2π
3√
3c2
)δ (5.17)
Then, the expression of h is the sum of two effects: the radial dispersion of the flow andthe displacement thickness of the boundary layer. This expression is valid until the wholeflow is within the boundary layer, i.e. when r ≤ r0. The r0 value is determined by foundingthe location where the boundary layer volume flux is equal to the inlet volume flux:
r0U0δ (r0) =3√
3c2Q4π2 (5.18)
Using equation 5.15, r0 is equal to:
r0 = 0.3155 3
√QR2
ν(5.19)
Since U is equal to U0 when r = r0. Therefore the value of l can be found using equations5.9 and 5.19:
l = 0.5673 3
√QR2
ν(5.20)
Finally, the equations describing the liquid layer thickness are equations 5.17 when r ≤ r0
and 5.11 when r > r0. The surface velocity is equal to the initial velocity U0 when r ≤ r0
and then it is given by the equation 5.10 when r > r0.
5.3.2 Radial flow of a thin liquid film
When the gap, H, between the jet nozzle and the plate is reducing the discharging area maybe smaller than the inlet area leading to an increase of the main flow velocity downstreamof the thin cylindrical opening (figure 5.1b). Moreover, a flow separation is occurring atthe nozzle inner corner leading to the contraction of the streamline which consequentlydecrease the actual discharging area. The main flow velocity changes from U0 in the inletpipe to U1 downstream of the jet impact region. This increase of velocity is defined here as1α
. Therefore, U1 reads as:
α =U0
U1=
2HCC
R(5.21)
U1α =U0 (5.22)
The expression of α should lies between 0 and 1 and it should depends on HR , defined as
the opening ratio. Making the hypothesis that the downstream flow can be described by the
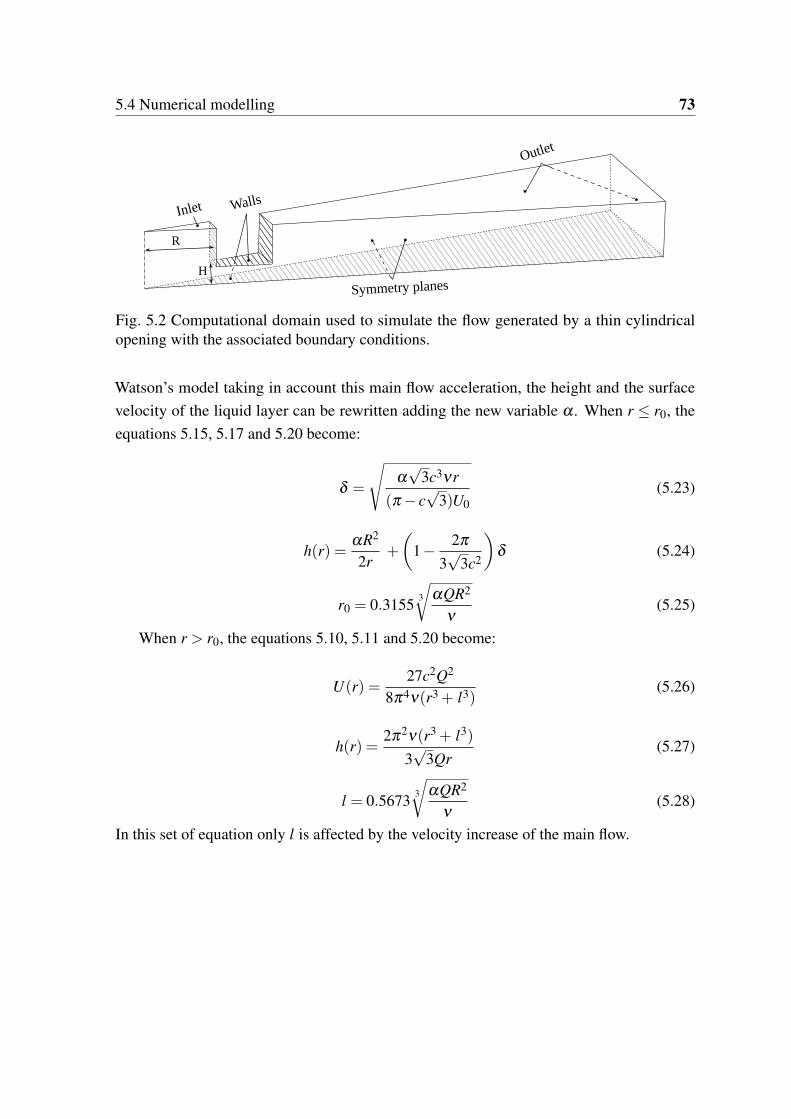
5.4 Numerical modelling 73
Inlet Walls
Outlet
Symmetry planes
R
H
Fig. 5.2 Computational domain used to simulate the flow generated by a thin cylindricalopening with the associated boundary conditions.
Watson’s model taking in account this main flow acceleration, the height and the surfacevelocity of the liquid layer can be rewritten adding the new variable α . When r ≤ r0, theequations 5.15, 5.17 and 5.20 become:
δ =
√α√
3c3νr(π − c
√3)U0
(5.23)
h(r) =αR2
2r+
(1− 2π
3√
3c2
)δ (5.24)
r0 = 0.3155 3
√αQR2
ν(5.25)
When r > r0, the equations 5.10, 5.11 and 5.20 become:
U(r) =27c2Q2
8π4ν(r3 + l3)(5.26)
h(r) =2π2ν(r3 + l3)
3√
3Qr(5.27)
l = 0.5673 3
√αQR2
ν(5.28)
In this set of equation only l is affected by the velocity increase of the main flow.
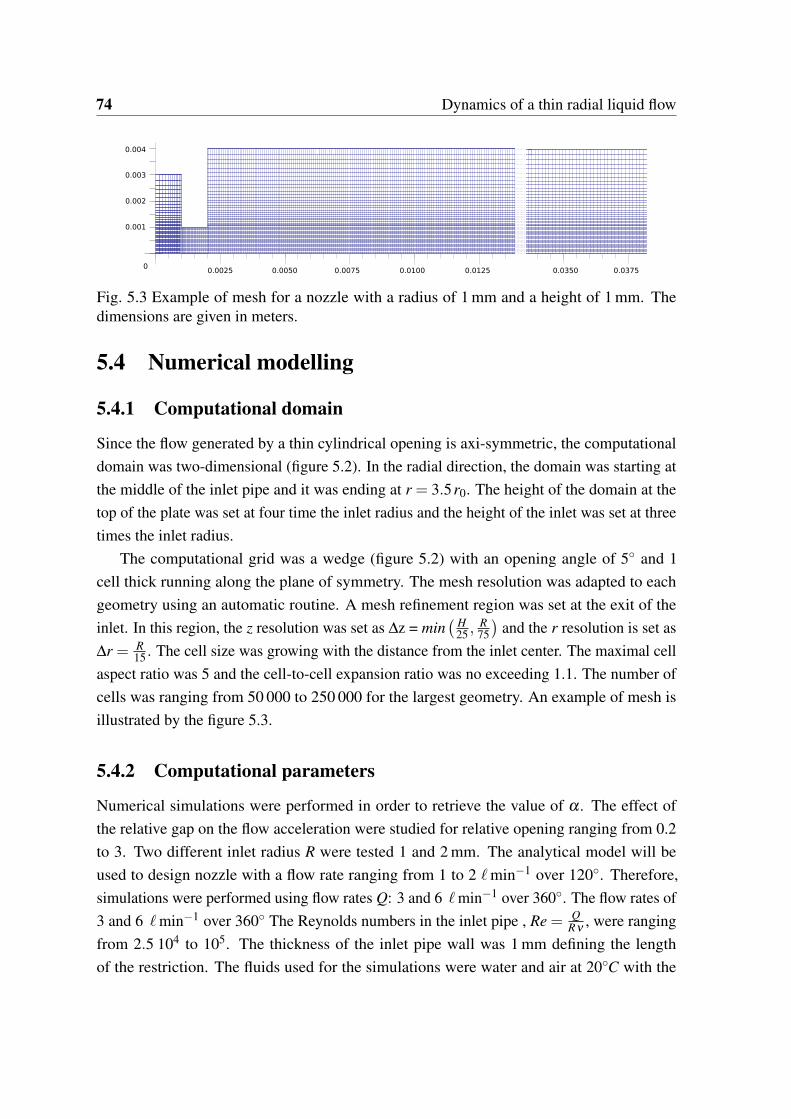
74 Dynamics of a thin radial liquid flow
0.0050
0.001
0.002
0.003
0.004
0.00250
0.0350 0.03750.0075 0.0100 0.0125
Fig. 5.3 Example of mesh for a nozzle with a radius of 1 mm and a height of 1 mm. Thedimensions are given in meters.
5.4 Numerical modelling
5.4.1 Computational domain
Since the flow generated by a thin cylindrical opening is axi-symmetric, the computationaldomain was two-dimensional (figure 5.2). In the radial direction, the domain was starting atthe middle of the inlet pipe and it was ending at r = 3.5r0. The height of the domain at thetop of the plate was set at four time the inlet radius and the height of the inlet was set at threetimes the inlet radius.
The computational grid was a wedge (figure 5.2) with an opening angle of 5◦ and 1cell thick running along the plane of symmetry. The mesh resolution was adapted to eachgeometry using an automatic routine. A mesh refinement region was set at the exit of theinlet. In this region, the z resolution was set as ∆z = min
( H25 ,
R75
)and the r resolution is set as
∆r = R15 . The cell size was growing with the distance from the inlet center. The maximal cell
aspect ratio was 5 and the cell-to-cell expansion ratio was no exceeding 1.1. The number ofcells was ranging from 50 000 to 250 000 for the largest geometry. An example of mesh isillustrated by the figure 5.3.
5.4.2 Computational parameters
Numerical simulations were performed in order to retrieve the value of α . The effect ofthe relative gap on the flow acceleration were studied for relative opening ranging from 0.2to 3. Two different inlet radius R were tested 1 and 2 mm. The analytical model will beused to design nozzle with a flow rate ranging from 1 to 2 ℓmin−1 over 120◦. Therefore,simulations were performed using flow rates Q: 3 and 6 ℓmin−1 over 360◦. The flow rates of3 and 6 ℓmin−1 over 360◦ The Reynolds numbers in the inlet pipe , Re = Q
Rν, were ranging
from 2.5 104 to 105. The thickness of the inlet pipe wall was 1 mm defining the lengthof the restriction. The fluids used for the simulations were water and air at 20◦C with the
5.4 Numerical modelling 75
following properties: ρwater = 998 kg1 m−3, νwater = 1 10−6 m2 s−1, ρair = 1.2 kg1 m−3
and νair = 15 10−6 m2s−1. The surface tension effects were neglected.
5.4.3 Boundary conditions
The inlet boundary was set with an uniform velocity equal to U0 =Q
πR2 , a normal gradient ofpressure equal to 0 and a liquid fraction φ equal to 1. The wall boundaries were set as noslip, zero normal gradients for φ and the pressure. The outlet was set at atmospheric pressurewith no liquid backflow. Axi-symmetric boundary conditions were set the for the front andback plans of the domain.
5.4.4 Numerical method
The InterFoam solver from the OpenFOAM C++ toolbox has been used to perform numericalsimulations. InterFoam is a Volume Of Fluid (VOF) solver for incompressible two-phase flow.This solver provided good results for inertia-dominated flows with large fluid density ratios(≥ 103), such as round jet impact (Deshpande et al., 2012). The governing equations arediscretized and solved using the finite volume method and the PISO algorithm respectively.The diffusion terms were discretized using a second order central difference scheme. All thecases were considered in a laminar mode since the range of simulation is close or below thelaminar to turbulence transition (Azuma and Hoshino, 1984b). Therefore, no extra turbulencemodel has been used. The computations were unsteady and the time step was controlled bythe Courant number set at 0.45. Consequently, the results presented in the next section are anaveraged solution of the flow over a certain time interval at the steady state.
5.4.5 Post processing
The liquid layer thickness h(r) was computed by integrating the liquid fraction φ over the zdirection: h(r) =
∫φ(r)dz. The surface velocity was computed at the location where φ = 0.5
using a linear interpolation. In order to present results in a concise way, the radial distance,the height and the surface velocity profiles are expressed in non dimensional way has been
adapted from Watson (1964): r∗ = r 3√
ν
αQR2 , h∗ = h(r) 3√
Qα2νR4 and U∗ = 10
(αU(r)
U0
).
αobs was computed using the equation 5.21. U1 was computed as the average of the mainflow velocity from r = 0 until r = r0. Moreover, three extra values of α were computedby fitting. The liquid sheet thickness equations 5.24 and 5.27 were reduced to two simplerexpressions depending on the radial distance r and on four coefficients a,b,d and e. For each

76 Dynamics of a thin radial liquid flow
case, the values of the four coefficients were retrieved by fitting the equation 5.29 on thethickness profile h(r) from the numerical data.
h(r) =
{ar +b
√r, r ≤ r0
d(r3+e)r , r > r0.
(5.29)
Then, from the equations 5.23, 5.24 and 5.28, three expressions of α were obtained:αa =
2aR2
αb =(
b√
U00.9955
√ν
)2
αe =eν
0.1826QR2
(5.30)
There is no expression for αd since d is independent of α . Finally, some flow accelerationfor similar flow available in the literature are used for comparison. Lichtarowicz andMarkland (1963) and Mankbadi and Zaki (1986) computed the contraction coefficient for a90◦ elbow with several ratios upstream to downstream. Azuma and Hoshino (1984a) realizedmeasurements of the flow velocity at the exit of a circular inlet for small opening ratios.
5.4.6 Model quality
The quality of the analytical model given by the equations 5.24 and 5.27 was assessed bycomputing the Normalized Root Mean Square Deviation (NRMSD) using the numerical dataas observed values. The NRMSD was computed as:
NRMSD =
√1n
n∑
i=1
(Yi −Yi
)2
(Ymax −Ymin)(5.31)
where n is the number of observation, Yi are the values predicted by the model, Yi are theobserved values and (Ymax −Ymin) is the amplitude of the variation within the dataset.
5.5 Results and discussion
Comparison of the different α in respect with the relative gap is presented on the figure 5.4.α is increasing with the opening ratio until the asymptotic value of 1 is reached. For most ofthe cases the different values of α are close to each other. Therefore, taking in account theflow acceleration allows to extend the set of equation from the jet flow to the thin cylindricalopening flow. When the opening ratio is small, i. e. < 1.5, there are discrepancies between

5.5 Results and discussion 77
0 0.5 1 1.5 2 2.5 30
0.2
0.4
0.6
0.8
1
�
Opening ratio
�a
�b
�e
�obs
Fit function
Lichtarowicz et al. (1963)
Mankbadi et al. (1986)
Azuma et al. (1984)0.4
0.4
0.5
0.6
1.8
0.9
1
Fig. 5.4 Comparison of the value of α retrieved from the post processing or found in theliterature in respect with the relative gap.
the different values of α and αb. αb is larger than the other values of α showing that thedisplacement thickness induced by the boundary layer development is larger than expected.For these cases, close to the inlet the velocity outside boundary layer is not equal to the freestream velocity everywhere. Indeed, the velocity is lower close to the liquid/air interface.Therefore, the liquid height is higher than expected to compensate this deficit of velocity.When the opening ratio is large, i.e. > 1.5, α is close to one, therefore the flow is close tothe free jet impact flow. The comparisons with the measurements of Azuma and Hoshino(1984a) show good agreement as well as the theoretical contraction coefficients computed byLichtarowicz and Markland (1963) and Mankbadi and Zaki (1986). From these results, α
can be expressed in respect with the opening ratio HR as:
α =
(1− e−1.82(H
R )1.11)
(5.32)
The figure 5.5 compares the numerical data from all the cases and the model predictionfor the surface velocity and liquid thickness in respect with the radial distance. The reductionto a non dimensional expression of U(r) and h(r) was realized using the expression of α
given by the equation 5.32. After, the reduction to the non dimensional expression all thecurves are really close to each other showing that the flow equations with α are describingon the downstream flow well the effect of the gap between the inlet and the plate. Whenr∗ < 0.1, the surface velocity is lower than the main stream velocity as illustrated by theinside graph. When 0.3 < r∗ < 0.4, the observed values are lower than the predicted onebecause the velocity profile was decreasing close to the interface liquid/air. For the liquidlayer thickness h(r), the prediction and the observed data are really close to each other. For

78 Dynamics of a thin radial liquid flow
0 0.2 0.4 0.6 0.8 10
2
4
6
8
10
r�
h
�
,U
�
U�h�
Analytical model
Numerical velocity
Numerical thickness10
0 1Z*
U* HR=0.4
HR=0.6
HR=1.0
HR=3.0
Fig. 5.5 Comparison between between the numerical data from all the cases and the modelprediction for the surface velocity and liquid thickness in respect with the radial distance.The inside graph gives the velocity profiles close at 1 mm from the nozzle exit for the caseswith R = 1 mm and H = 0.4, 0.6, 1 and 3 mm with z∗ = z
δ.
r∗ close to 1, some numerical instabilities are observed for both simulations creating wigglesin the solutions.
The NRMSD on the liquid sheet thickness and interface velocity prediction in respectwith the relative opening ratio are presented on the figure 5.6. For both the surface heightand the surface velocity, the NRMSD is larger when the opening ratio is smaller than 1.Then, when the opening ratio is larger than 1 the NRMSD is equal to 3 % for the surfacevelocity and to 2 % for the liquid layer thickness. There is no significant difference betweenthe different cases.
5.6 Conclusion
The present work proposed an extension of the existing analytical development on the radialspread of a liquid jet over a horizontal surface to the case of a laminar thin radial flow. Whenthe gap, H, between the jet nozzle and the plate is reduced the discharging area may besmaller than the inlet area leading to an increase of the main flow velocity downstream ofthe thin cylindrical opening. This increase of velocity, defined here as 1
α, can be related to
the relative gap of the nozzle HR . Numerical computations with a volume of fluid method
were realized for HR ranging from 0.2 to 3 and with Q of 3 and 6 ℓmin−1. The results of
these computations allowed to express α in respect of HR . α is increasing with the opening
ratio until the asymptotic value of 1 is reached. Taking in account the flow accelerationallowed to extend the set of equation from the jet impacting flow to the thin cylindricalopening flow. The liquid layer thickness and the surface velocity differ with a maximum

5.6 Conclusion 79
0 0.5 1 1.5 2 2.5 30
0.02
0.04
Opening ratio
NR
MS
E U
0 0.5 1 1.5 2 2.5 30
0.02
0.04
Opening ratio
NR
MS
E h
Fig. 5.6 NRMSD on the interface velocity (top) and the liquid sheet thickness (bottom)predictions in respect with the relative opening ratio. Each marker corresponds to a specificradius/flow rate combination: △- - - - - is for R = 1 mm & Q = 3 ℓmin−1, ◦ is for R =2 mm & Q = 6 ℓmin−1, ▲ is for is for R = 2 mm & Q = 3 ℓmin−1 and •- - - - - is for R = 2mm & Q = 6 ℓmin−1.
error of 4 % between the flow predicted by the model and computations. Main discrepanciesappear in the region close to the nozzle where the analytical model assumption of a constantvelocity outside the boundary layer is not valid. However, further downstream the model andthe computations are in good agreement. The present analytical model and correlation hasbeen done for laminar flow (Re < 105). The extension of this model to turbulent flow wouldrequired to take in account the extra mixing induced by the eddies and it may also requireto adapt the velocity profile. Further work will focus on the experimental validation of theproposed analytical solution.


Chapter 6
Nozzle with narrow droplet sizedistribution
6.1 Introduction
In field spray application, the hydraulic nozzle are often used at a constant flow rate. Theoptimal droplet size distribution changes according to the target. Using the analytical modeldeveloped in the previous chapter, a design methodology is presented. The Figure 6.1summarizes the main steps of the nozzle design. The design starts by defining the optimumin term of droplet size according the target. Then, the objective in term droplet diameter setthe jet properties (size and speed) in order to be in Rayleigh-Plateau regime. Next, using theanalytical model presented in the chapter 5 a nozzle geometry can be proposed. Finally, thespray produced by a nozzle prototype is assessed by using the high-speed imaging techniquepresented in the chapter 3.
6.2 Nozzle geometry
Figure 6.2 shows a design sketch of the nozzle. The nozzle is constituted of a inlet pipeending on a perpendicular plate. There is a thin opening at the junction between the pipe andthe plate. The inlet is characterized by 3 geometrical parameters: the thin opening heightH, the inlet pipe radius R and the opening angle. The effect of H and R on the downstreamflow has been investigated in the chapter 5. The edge of the plate is constituted of channelsformed by structures. These channels aim to divide the liquid sheet in multiple jets.

82 Nozzle with narrow droplet size distribution
Method
Identification of the optimal droplet
diameter
10-4 10-3 10-2
Jet diameter [µm]
100
101
102
Jet v
eloc
ity [m
/s]
Dripping
Rayleigh-Plateau
1 st wind induced
2 nd wind induced
Atomization
Determination of the jet velocity
and size
Deposition and transport model
d
u0
u0
Adhesion
Bounce
Shatter
Break-up regime limits
Step
Determination of the nozzle geometry
Analytical model
Assessment of the spray
produced by the nozzle
High-speed imaging
r
Gas
Liquid
U0
R
H U1
h(r)
r0 1.43 r0
Fig. 6.1 Summary of the nozzle design procedure.
6.3 Design methodology
Making the hypothesis of uniform jets, the number of jets N jet required to achieve theobjective flow rate is given by the ratio of the nozzle flow rate Qtot to the flow rate of a singlejet Q jet :
N jet =Qtot
Q jet(6.1)
Knowing that the overall flow rate the number of jets to achieve a specific droplet size,the flow rate of a single jet is given by:
Q jet =πU jetD2
jet
4(6.2)
The droplet diameter produced by the breakup of a jet in Rayleigh-Plateau regimeproduces droplet with a diameter equals to 1.89 time the jet diameter. Therefore, Ddrop is

6.3 Design methodology 83
r
C
R
H
Section A-A
Detail CScale 5:1
120°
A
A
Fig. 6.2 Nozzle geometry, top and side views. H, R and r are the gap between the inlet andthe plate, the inlet radius and the distance from the inlet center respectively. The blue contourin the 2D drawing indicates the surface wet by the liquid.
equal to:
Ddrop = 3.78
√Q
πN jetU jet(6.3)
The overall flow rate Qtot is fixed by the design goal, for agricultural nozzle a flow rate of1ℓmin−1, 1.6710−5m3 s−1, is considered. The jet velocity U jet is considered as the velocityof the liquid sheet at the exit of the plate. Neglecting the additional viscous dissipationinduced by the terminal structures, the jet velocity can be approximated by the averagevelocity of the liquid sheet provided by the analytical model developed in the chapter 5. Theequations describing the evolution h in respect to the radial distance are summarized in thesection 5.3.2. The average liquid sheet velocity U is a function of the liquid sheet height h,the radial distance r and the nozzle flow rate Qtot :
U =Qtot
2π hr(6.4)
The spatial evolution of U for three nozzles configurations with various H and R ispresented on Figure 6.3. The average velocity of the liquid sheet is decreasing with increasingdistance from the nozzle center because of viscous dissipation. The nozzle configurationaffects the initial liquid sheet velocity. r R and H affects the average velocity.

84 Nozzle with narrow droplet size distribution
0 0.005 0.01 0.015 0.02 0.025
r [m]
0
5
10
15
20
25
30
U [m
s-1
]
R = 1.00 mm & H = 0.50 mm
R = 1.00 mm & H = 0.75 mm
R = 1.50 mm & H = 0.75 mm
Fig. 6.3 Average liquid sheet velocity in respect to the radial distance from the nozzle centerfor three nozzle configurations.
6.4 Theoretical design
In the chapter 2, an optimum range of droplet with a diameter of 225 µm was found. There-fore, the jets should have a diameter of 120 µm. For a jet diameter of 120 µm the uppervelocity limit to remain in the Rayleigh regime is around 15 m s−1 (cf figure 1.4) giving Q jet
= 1.58 10−7 m s−3. Thus 98 jets are required to ensure a flow rate of 1 ℓmin−1. There aretwo design constraints, the flow has to be fast in order to have a reduce number of jets andthe plate should be large enough to support all the grooves generating the jets. The figure 6.4shows the iso contours of the average velocity in respect to r, H and R. One configurationwhich would fit this requirement is a nozzle with a inlet radius R of 1 mm, a gap H of 0.3 mmand a plate with a radius of 15.25 mm. At the edge of the disk the grooves of 0.12 mm wouldbe spread over 120◦ and separated of each other by 0.225 mm. A nozzle with such dimensionscouldn’t be properly prototyped by 3D printing, therefore the experimental assessment hasbeen done on a larger scale model as proof of concept.
6.5 Proof of concept
A nozzle design has been prototyped by 3D printing, the dimensions are presented on thefigure 6.5. The impactor ends with 30 channels over 180◦, the gap between the plate and theinlet is 0.4 mm, the inlet radius is 0.225 mm and the impactor radius is 15 mm. The figure6.6 a shows the liquid jets formed at the edge of the plate. The jets are well separated andhave uniform sizes. The velocity of these jets has been measured for various flow rate andcompared to the prediction of the analytical model as shown on Figure 6.6 b. The measuredvalues are slower than the predicted ones which may be linked to the grooves. This analytical

6.6 Conclusion 85
0 0.005 0.01 0.015 0.02 0.025
r [m]
2
4
6
8
10
12
14
H[m]
×10-4
5
5
10
10
10
15
15
15
20
20
25
25
30
30
35404550
15
15
15
a)
1 1.5 2 2.5 3
R [m] ×10-3
2
4
6
8
10
12
14
H[m]
×10-4
5
5
5
10
10
10
10
10
1515
b)
Fig. 6.4 Iso contour of the average liquid sheet velocity. a) constant R = 1 mm was considered.b) constant r = 15.25 mm was considered.
Table 6.1 Reduced parameters of the droplet size distribution measured at 50 mm downstreamof the disk edge for the three flow rates.
Flow rate Dv10 Dv50 Dv90 RSF[ℓmin−1] [µm] [µm] [µm] [-]
1.13 699 892 1120 0.471.38 720 923 1168 0.491.78 704 960 1192 0.50
model predicts the velocity and the height of a liquid sheet formed at the exit of a narrow slitsuch as the exit of the injector. The model does not take into account the presence of channelwhich would slow down the liquid sheet by increasing the friction between the liquid and thesolid. The velocity of the jets is increasing with the increase of the flow rate.
The jets breakup occurs after a dozen of mm downstream of the plate edge. Droplet sizedistribution measurements have been realized at 50 mm downstream of the disk edge. Thefigure 6.7 shows the cumulative droplet size distribution for three flow rates and the Table 6.1summaries the reduced parameters of the droplet size distributions. For each case, the dropletsize distribution have a RSF around 0.5. The increase of flow rate leads to an increase of theaverage droplet size expressed by the Dv50.
6.6 Conclusion
A design methodology has been presented and a theoretical design has been sized. This designcouldn’t be properly prototyped because its small dimensions. However, measurements on aupscale model shows good agreement with the analytical model in this regime. However,

86 Nozzle with narrow droplet size distribution
4.5
12 30
M
N
SectionM-M
0,40
17
9
5
Detail N
Scale 2:1
17.2
5
Fig. 6.5 Dimensions of the upscale nozzle model.
a)
1.1 1.2 1.3 1.4 1.5 1.6 1.7 1.8
Flow rate [l/min]
0
2
4
6
8
10
12
Uavera
ge [m
/s]
Model prediction
Measurements
b)
Fig. 6.6 High-speed imaging measurements at the exit of the nozzle. a) Shadowgraphy imageat the edge of the nozzle plate. b) Comparison of the average jet velocity measured at theedge of the plate and the analytical model predictions. The error bars correspond to thestandard error on 10 measurements.

6.6 Conclusion 87
0 500 1000 1500
Droplet diameter [µm]
0
0.1
0.2
0.3
0.4
0.5
0.6
0.7
0.8
0.9
1
Cum
ula
tive r
ela
tive v
olu
me [-]
1.13 l/min
1.38 l/min
1.78 l/min
Fig. 6.7 Cumulative droplet size distribution measured at 50 mm downstream of the diskedge.
at small scale the model prediction may diverge because of change in the flow nature fromlaminar to turbulent. Moreover, the jets splitting may be challenging at small dimensions.


Chapter 7
Conclusions and perspectives
Strategies to control the droplet size distribution in terms of Dv50 and RSF may offerpromising solutions for reducing adverse impacts on environment of spray applications.Indeed, numerical investigations using droplet transport and deposition numerical modelsshowed that droplets with diameters ranging between 200 µm and 250 µm offered highcontrol of deposition by combining a low drift potential and moderate kinetic energy at thetop of the canopy. An optimal spray with a Dv50 of 225 µm and a RSF of 0.6 has beenidentified for weed treatment (§ 2).
One way to produce a spray with a reduced droplet size distribution is by breaking upmultiple round jets in the Rayleigh-Plateau regime. The proposed nozzle is constituted by apipe ending perpendicularly on a disk. A liquid sheet is generated at the exit of a thin radialopening then the liquid sheet is split in multiple jets by structures located at the disk edge.The dynamics of the flow downstream of a thin radial opening has been modeled analytically.When the gap, H, between the jet nozzle and the plate is reduced the discharging area maybe smaller than the inlet area leading to an increase of the main flow velocity downstream ofthe thin cylindrical opening. This increase of velocity can be related to the relative gap of thenozzle H
R . Numerical computations with a volume of fluid method were realized in order toretrieve an analytical model of the flow downstream of the inlet opening (§ 5).
Using the latter model, a theoretical nozzle design has been established in order toproduce a spray with droplets with diameter of 225 µm (§ 6). The prototyping of this designcouldn’t be achieved because of its small dimension. However, the design methodology hasbeen validated on a upscale nozzle model. The spray generated by the upscale nozzle hasbeen characterized using high-speed imaging showing a reduced droplet size distribution.
This last conclusion opens new perspective in term of potential nozzle design. Followingthe methodology proposed in the chapter 6, a reduced span spray with custom characteristicsmay be produced in order to fit a specific application. At large scale, 3D printing can easily

90 Conclusions and perspectives
produce the prototype. Despite technical issues, the production of smaller droplets mayface two main problems. The flow generated flow on the disk could be turbulent whichmay require adjustment of the analytical model to take into account the turbulence. Then, alarge amount of jets would be necessary thus the jets would be less spaced and the designof the edge structures have to be adapted. Channels succeed to split the flow at low speedand with large spacing but it may fails when the space between them decreases. Currently,an experimental research is performed on the effect of structures type and dimension onthe downstream flow at the GRASP. This fundamental research explores original ways toseparate a liquid sheet into jets. For example, they observe that small pillar on the disk createsa wake. Under specific conditions, the wake turns into a dry area on the plate, splitting theliquid sheet into jets. This research, as probably others, shows that the constraint encounterwith the channels may be overcome by using other structures. The work on the nozzle designhas to be carry on.

References
Aghajani, H., Dembele, S., and Wen, J. X. (2014). Analysis of a semi-empirical sprinklerspray model. Fire Safety Journal, 64:1–11. cited By 0.
Al Heidary, M., Douzals, J. P., Sinfort, C., and Vallet, A. (2014). Influence of spraycharacteristics on potential spray drift of field crop sprayers: A literature review. CropProtection, 63:120–130.
Attané, P., Girard, F., and Morin, V. (2007). An energy balance approach of the dynamics ofdrop impact on a solid surface. Physics of Fluids, 19(1):012101.
Azuma, T. and Hoshino, T. (1984a). The radial flow of a thin liquid film: 1st report,laminar-turbulent transition. Bulletin of JSME, 27(234):2739–2746.
Azuma, T. and Hoshino, T. (1984b). The radial flow of a thin liquid film: 2nd report, liquidfilm thickness. Bulletin of JSME, 27(234):2747–2754.
Azuma, T. and Hoshino, T. (1984c). The radial flow of a thin liquid film: 3rd report, velocityprofile. Bulletin of JSME, 27(234):2755–2762.
Babinsky, E. and Sojka, P. E. (2002). Modeling drop size distributions. Progress in Energyand Combustion Science, 28(4):303–329.
Baetens, K., Ho, Q. T., Nuyttens, D., De Schampheleire, M., Melese Endalew, A., Hertog,M. L. A. T. M., Nicolai, B., Ramon, H., and Verboven, P. (2009). A validated 2-Ddiffusion–advection model for prediction of drift from ground boom sprayers. AtmosphericEnvironment, 43(9):1674–1682.
Baetens, K., Nuyttens, D., Verboven, P., De Schampheleire, M., Nicolai, B., and Ramon,H. (2007). Predicting drift from field spraying by means of a 3D computational fluiddynamics model. Computers and Electronics in Agriculture, 56(2):161–173.
Bals, E. J. (1970). The principles of and new developments in ultra low volume spraying.The principles of and new developments in ultra low volume spraying., 1:189–193.
Barati, R., Neyshabouri, S. A. A. S., and Ahmadi, G. (2014). Development of empiricalmodels with high accuracy for estimation of drag coefficient of flow around a smoothsphere: An evolutionary approach. Powder Technology, 257:11–19.
Bonhoeffer, B., Kwade, A., and Juhnke, M. (2017). Impact of formulation properties andprocess parameters on the dispensing and depositioning of drug nanosuspensions usingmicro-valve technology. Journal of pharmaceutical sciences, 106(4):1102–1110.

92 References
Boukhalfa, H., Massinon, M., Belhamra, M., and Lebeau, F. (2014). Contribution of spraydroplet pinning fragmentation to canopy retention. Crop Protection, 56:91–97.
Butler Ellis, M. C., Alanis, R., Lane, A. G., Tuck, C. R., Nuyttens, D., and van de Zande,J. C. (2017). Wind tunnel measurements and model predictions for estimating spray driftreduction under field conditions. Biosystems Engineering, 154:25–34.
Butler Ellis, M. C. and Miller, P. C. H. (2010). The Silsoe Spray Drift Model: A model ofspray drift for the assessment of non-target exposures to pesticides. Biosystems Engineer-ing, 107(3):169–177.
Butler Ellis, M. C., Tuck, C. R., and Miller, P. C. H. (1997). The effect of some adjuvants onsprays produced by agricultural flat fan nozzles. Crop Protection, 16(1):41 – 50.
Butler Ellis, M. C., Tuck, C. R., and Miller, P. C. H. (2001). How surface tension of surfactantsolutions influences the characteristics of sprays produced by hydraulic nozzles used forpesticide application. Colloids and Surfaces A: Physicochemical and Engineering Aspects,180(3):267 – 276.
Canny, J. (1986). A computational approach to edge detection. IEEE Transactions on PatternAnalysis and Machine Intelligence, 8(6):679–698.
Chu, S. S. (2003). Separated flow in bends of arbitrary turning angles, using the hodographmethod and kirchhoff’s free streamline theory. Journal of Fluids Engineering, 125(3):438–442.
Cousin, J., Berlemont, A., Ménard, T., and Grout, S. (2012). Primary breakup simulationof a liquid jet discharged by a low-pressure compound nozzle. Computers & Fluids,63:165–173.
Damaschke, N., Gouesbet, G., Gréhan, G., Mignon, H., and Tropea, C. (1998). Response ofphase Doppler anemometer systems to nonspherical droplets. Applied Optics, 37(10):1752–1761.
De Cock, N., Massinon, M., Mercatoris, B. C. N., and Lebeau, F. (2014). Numericalmodelling of mirror nozzle flow. In Proceedings of American Society of Agricultural andBiological Engineers Annual International Meeting, pages 3632–3640.
De Cock, N., Massinon, M., Nuyttens, D., Dekeyser, D., and Lebeau, F. (2016). Measure-ments of reference ISO nozzles by high-speed imaging. Crop Protection, 89:105–115.
de Ruiter, H., Holterman, H. J., Kempenaar, C., and van de Zande, J. (2003). Influence ofadjuvants and formulations on the emission of pesticides to the atmosphere: a literaturestudy for the dutch research programme pesticides and the environment (dwk) theme c-2.Technical report, Plant Research International.
Deshpande, S. S., Anumolu, L., and Trujillo, M. F. (2012). Evaluating the performance ofthe two-phase flow solver interFoam. Computational Science and Discovery, 5(1).
Dorr, G. J., Wang, S., Mayo, L. C., McCue, S. W., Forster, W. A., Hanan, J., and He, X.(2015). Impaction of spray droplets on leaves: influence of formulation and leaf characteron shatter, bounce and adhesion. Experiments in Fluids, 56(7):143.

References 93
Dumouchel, C. (2008). On the experimental investigation on primary atomization of liquidstreams. Experiments in Fluids, 45(3):371–422.
Fard, M. P., Levesque, D., Morrison, S., and Ashgriz, N. (2007). Characterization ofsplash-plate atomizers using numerical simulations. Atomization and Sprays, 17(4).
Forster, W. A., Mercer, G. N., and Schou, W. C. (2010). Process-driven models for spraydroplet shatter, adhesion or bounce. In Proceedings of the 9th International Symposium onAdjuvants for Agrochemicals, volume 16, page 20.
Fritz, B. K., Hoffmann, W. C., Czaczyk, Z., Bagley, W., Kruger, G., and Henry, R. (2012).Measurement and classification methods using the ASAE S572.1 reference nozzles. Jour-nal of Plant Protection Research, 52(4):447–457.
Gilbert, A. J. and Bell, G. J. (1988). Evaluation of the drift hazards arising from pesticidespray application. Aspects of Applied Biology.
Gordillo, J. M., Lhuissier, H., and Villermaux, E. (2014). On the cusps bordering liquidsheets. Journal of Fluid Mechanics, 754:R1.
Guella, S., Alexandrova, S., and Saboni, A. (2008). Evaporation d’une gouttelette en chutelibre dans l’air. International Journal of Thermal Sciences, 47(7):886–898.
Gunn, R. and Kinzer, G. D. (1949). The terminal velocity of fall for water droplets in stagnantair. Journal of Meteorology, 6(4):243–248.
Hewitt, A. (2005). International standards for drift reduction technology studies. Technicalreport, OECD Workshop.
Hewitt, A. J., Valcore, D. L., Teske, M. E., and Schick, R. J. (1998). Drop size classificationsfor agricultural sprays. In Proceedings of the 11th Annual conference on liquid atomizationand spray systems, May 1998, Sacramento, CA, USA.
Hilz, E. and Vermeer, A. W. P. (2013). Spray drift review: The extent to which a formulationcan contribute to spray drift reduction. Crop Protection, 44:75–83.
Hobson, P., Miller, P., Walklate, P., Tuck, C., and Western, N. (1993). Spray drift fromhydraulic spray nozzles: the use of a computer simulation model to examine factorsinfluencing drift. Journal of Agricultural Engineering Research, 54(4):293–305.
Holloway, P. J., Butler Ellis, M. C., Webb, D. A., Western, N. M., Tuck, C. R., Hayes,A. L., and Miller, P. C. H. (2000). Effects of some agricultural tank-mix adjuvants on thedeposition efficiency of aqueous sprays on foliage. Crop Protection, 19(1):27 – 37.
Holterman, H. (2003). Kinetics and evaporation of water drops in air.
Holterman, H. J., van de Zande, J. C., Porskamp, H. A. J., and Huijsmans, J. F. M. (1997).Modelling spray drift from boom sprayers. Computers and Electronics in Agriculture,19(1):1–22.
Hosain, M. L., Fdhila, R. B., and Daneryd, A. (2015). Heat transfer by liquid jets impingingon a hot flat surface. Applied Energy.

94 References
Hou, Q., Kruisbrink, A. C. H., Pearce, F. R., Tijsseling, A. S., and Yue, T. (2014). Smoothedparticle hydrodynamics simulations of flow separation at bends. Computers & Fluids,90:138–146.
Ishigai, S., Nakanishi, S., Mizuno, M., and Imamura, T. (1977). Heat transfer of the impinginground water jet in the interference zone of film flow along the wall. Bulletin of JSME,20(139):85–92.
Jensen, P. K. (2012). Increasing efficacy of graminicides with a forward angled spray. CropProtection, 32:17–23.
Josserand, C. and Thoroddsen, S. T. (2016). Drop impact on a solid surface. Annual Reviewof Fluid Mechanics, 48:365–391.
Kang, L., Guo, L., Gu, Z., and Liu, D. (2008). Wind tunnel experimental investigation ofsand velocity in aeolian sand transport. Geomorphology, 97(3–4):438–450.
Kashdan, J., Shrimpton, J., and Whybrew, A. (2003). Two-phase flow characterization byautomated digital image analysis. part 1: Fundamental principles and calibration of thetechnique. Particle & Particle Systems Characterization, 20(6):387–397.
Kok, J. F. and Renno, N. O. (2009). A comprehensive numerical model of steady statesaltation (COMSALT). Journal of Geophysical Research: Atmospheres, 114(D17).
Kwak, B.-M., Lee, J. E., Ahn, J.-H., and Jeon, T.-H. (2009). Laser diffraction particle sizingby wet dispersion method for spray-dried infant formula. Journal of Food Engineering,92(3):324–330.
Langmuir, I. and Blodgett, K. B. (1949). A mathematical investigation of water droplettrajectories. technical report no. rl225. , General Electric Schenectady, N.Y.
Lebeau, F. (2004). Modelling the dynamic distribution of spray deposits. BiosystemsEngineering, 89(3):255–265.
Lebeau, F., Verstraete, A., Stainier, C., and Destain, M. F. (2011). RTDrift: A real timemodel for estimating spray drift from ground applications. Computers and Electronics inAgriculture, 77(2):161–174.
Lecuona, A., Sosa, P. A., Rodríguez, P. A., and Zequeira, R. I. (2000). Volumetric characteri-zation of dispersed two-phase flows by digital image analysis. Measurement Science andTechnology, 11(8):1152–1161.
Lefebvre, A. (1988). Atomization and Sprays. Taylor & Francis.
Li, T., Nishida, K., and Hiroyasu, H. (2011). Droplet size distribution and evaporationcharacteristics of fuel spray by a swirl type atomizer. Fuel, 90(7):2367–2376.
Lichtarowicz, A. and Markland, E. (1963). Calculation of potential flow with separation in aright-angled elbow with unequal branches. Journal of Fluid Mechanics, 17:596–606.
Liu, X., Doub, W. H., and Guo, C. (2010). Evaluation of droplet velocity and size fromnasal spray devices using phase Doppler anemometry (PDA). International Journal ofPharmaceutics, 388(1–2):82–87.

References 95
Liu, X., Lienhard, J. H., and Lombara, J. S. (1991). Convective heat transfer by impingementof circular liquid jets. Journal of Heat Transfer, 113(3):571–582.
Mankbadi, R. and Zaki, S. (1986). Computations of the contract coefficient of unsymmetricalbends. AIAA Journal, 24(8):1285–1289.
Mao, T., Kuhn, D., and Tran, H. (1997). Spread and rebound of liquid droplets upon impacton flat surfaces. AIChE Journal, 43(9):2169–2179.
Marshall, A. W. and Di Marzo, M. (2004). Modelling aspects of sprinkler spray dynamics infires. Process Safety and Environmental Protection, 82(2):97–104.
Massinon, M., Boukhalfa, H., and Lebeau, F. (2014). The effect of surface orientation onspray retention. Precision Agriculture, 15(3):241–254.
Massinon, M., De Cock, N., Forster, W. A., Nairn, J. J., McCue, S. W., Zabkiewicz, J. A.,and Lebeau, F. (2017). Spray droplet impaction outcomes for different plant species andspray formulations. Crop Protection, 99:65–75.
Massinon, M., De Cock, N., Ouled Taleb Salah, S., and Lebeau, F. (2016). Reduced spanspray–part 1: Retention. Aspect of Applied Biology, International Advances in PesticideApplication, 132:323–330.
Massinon, M., Dumont, B., De Cock, N., Salah, S. O. T., and Lebeau, F. (2015). Study ofretention variability on an early growth stage herbaceous plant using a 3D virtual sprayingmodel. Crop Protection, 78:63–71.
Massinon, M. and Lebeau, F. (2012). Experimental method for the assessment of agriculturalspray retention based on high-speed imaging of drop impact on a synthetic superhydropho-bic surface. Biosystems Engineering, 112(1):56 – 64.
Matthews, G. (2008). Pesticide application methods. John Wiley & Sons.
Miller, P. C. H. and Butler Ellis, M. C. (2000). Effects of formulation on spray nozzleperformance for applications from ground-based boom sprayers. Crop Protection, 19(8–10):609 – 615. {XIVth} International Plant Protection Congress.
Mokeba, M., Salt, D., Lee, B., and Ford, M. (1997). Simulating the dynamics of spraydroplets in the atmosphere using ballistic and random-walk models combined. Journal ofWind Engineering and Industrial Aerodynamics, 67:923–933.
Mundo, C. H. R., Sommerfeld, M., and Tropea, C. (1995). Droplet-wall collisions: ex-perimental studies of the deformation and breakup process. International Journal ofMultiphase Flow, 21(2):151–173.
Nuyttens, D., Baetens, K., Schampheleire, M. D., and Sonck, B. (2007a). Effect of nozzletype, size and pressure on spray droplet characteristics. Biosystems Engineering, 97(3):333– 345.
Nuyttens, D., De Schampheleire, M., Baetens, K., and Sonck, B. (2007b). The influence ofoperator-controlled variables on spray drift from field crop sprayers. Transactions of theASABE, 50(4):1129–1140.

96 References
Oerke, E.-C. (2006). Crop losses to pests. The Journal of Agricultural Science, 144(1):31–43.
Panofsky, H. A., Tennekes, H., Lenschow, D. b. H., and Wyngaard, J. C. (1977). Thecharacteristics of turbulent velocity components in the surface layer under convectiveconditions. Boundary-Layer Meteorology, 11(3):355–361.
Qi, L., Miller, P. C. H., and Fu, Z. (2008). The classification of the drift risk of spraysproduced by spinning discs based on wind tunnel measurements. Biosystems Engineering,100(1):38–43.
Raupach, M. R., Briggs, P. R., Ford, P. W., Leys, J. F., Muschal, M., Cooper, B., and Edge,V. E. (2001). Endosulfan transport. Journal of Environmental Quality, 30(3):714–728.
Rayleigh, L. (1878). On the instability of jets. Proceedings of the London MathematicalSociety, 1(1):4–13.
Reichenberger, S., Bach, M., Skitschak, A., and Frede, H.-G. (2007). Mitigation strategies toreduce pesticide inputs into ground- and surface water and their effectiveness; a review.Science of The Total Environment, 384(1–3):1 – 35.
Rein, M. (1993). Phenomena of liquid drop impact on solid and liquid surfaces. FluidDynamics Research, 12(2):61–93.
Rosin, P. and Rammler, E. (1933). The laws governing the fineness of powdered coal. Journalof the Institute of Fuel, 7:29–36.
Saboni, A., Alexandrova, S., and Gourdon, C. (2004). Détermination de la trainée engendréepar une sphère fluide en translation. Chemical Engineering Journal, 98(1):175–182.
Sawford, B. L. and Guest, F. M. (1991). Lagrangian statistical simulation of the turbulentmotion of heavy particles. Boundary-Layer Meteorology, 54(1):147–166.
Sirignano, W. A. and Mehring, C. (2000). Review of theory of distortion and disintegrationof liquid streams. Progress in Energy and Combustion Science, 26(4):609–655.
Snyder, H. E., Senser, D. W., Lefebvre, A. H., and Coutinho, R. S. (1989). Drop sizemeasurements in electrostatic paint sprays. Industry Applications, IEEE Transactions on,25(4):720–727.
Southcombe, E. S. E., Miller, P. C. H., Ganzelmeier, H., van de Zande, J. C., Miralles, A.,and Hewitt, A. J. (1998). The International (BCPC) spray classification system including adrift potential factor. In Proceedings of the Brighton Crop Protection Conference-Weeds.
Spillman, J. J. (1984). Spray impaction, retention and adhesion: an introduction to basiccharacteristics. Pest Management Science, 15(2):97–106.
Stainier, C., Destain, M. F., Schiffers, B., and Lebeau, F. (2006). Droplet size spectra and drifteffect of two phenmedipham formulations and four adjuvants mixtures. Crop Protection,25(12):1238–1243.
Stephenson, G. R., Ferris, I. G., Holland, P. T., and Nordberg, M. (2006). Glossary ofterms relating to pesticides (iupac recommendations 2006). Pure and Applied Chemistry,78(11):2075–2154.
References 97
Taylor, W. A., Womac, A. R., Miller, P. C. H., and Taylor, B. P. (2004). An attempt torelate drop size to drift risk. In Proceedings of the International Conference on PesticideApplication for Drift Management, pages 210–223. Citeseer.
Teske, M. E., Bird, S. L., Esterley, D. M., Curbishley, T. B., Ray, S. L., and Perry, S. G.(2002). Agdrift : A model for estimating near-field spray drift from aerial applications.Environmental Toxicology and Chemistry, 21(3):659–671.
Walklate, P. J. (1987). A random-walk model for dispersion of heavy particles in turbulentair flow. Boundary-Layer Meteorology, 39(1):175–190.
Wang, Y., Miller, D. R., Anderson, D. E., and McManus, M. L. (1995). A Lagrangianstochastic model for aerial spray transport above an oak forest. Agricultural and ForestMeteorology, 76(3–4):277–291.
Watson, E. J. (1964). The radial spread of a liquid jet over a horizontal plane. Journal ofFluid Mechanics, 20:481–499.
Weiner, K. L. and Parkin, C. S. (1993). The use of computational fluid dynamic codefor modelling spray from a mistblower. Journal of Agricultural Engineering Research,55(4):313–324.
Widmann, J. F. (2001). Phase Doppler interferometry measurements in water sprays producedby residential fire sprinklers. Fire Safety Journal, 36(6):545–567.
Wilson, J. D. and Sawford, B. L. (1996). Review of Lagrangian stochastic models fortrajectories in the turbulent atmosphere. Boundary-Layer Meteorology, 78(1):191–210.
Womac, A. R. (2000). Quality control of standardized reference spray nozzles. Transactionsof the ASAE, 43(1):47–56.
Wu, D., Guillemin, D., and Marshall, A. W. (2007). A modeling basis for predicting theinitial sprinkler spray. Fire Safety journal, 42(4):283–294.
Yarin, A. L. (2006). Drop impact dynamics: splashing, spreading, receding, bouncing. . . .Annual Review of Fluid Mechanics, 38:159–192.
Zabkiewicz, J. A. (2007). Spray formulation efficacy - holistic and futuristic perspectives.Crop Protection, 26(3):312–319.
Zhou, X., D’Aniello, S. P., and Yu, H.-Z. (2012). Spray characterization measurements of apendent fire sprinkler. Fire Safety Journal, 54:36–48.
