design of a new stratotanker a project presented to … · 7.4 flaps ... figure7. 2 naca 641-212...
TRANSCRIPT

Design of a New Stratotanker
A Project
Presented to the Aerospace Engineering Faculty
San Jose State University
In Partial Fulfillment of the Requirements for the
Master of Science Degree in Aerospace Engineering
By
I-Chiang Wu
December 2011

© 2011
I-Chiang Wu
ALL RIGHT RESERVED

The undersigned faculty Committee Approves
Design of a New Stratotanker
By
I-Chiang Wu
APPROVED FOR THE DEPARTMENT OF
MECHANICAL AND AEROSPCE ENGINEERING
SAN JOSE STATE UNIVERSITY
December 2011
___________________________________________________________ Dr. Nikos J. Mourtos, Committee Chair Date ___________________________________________________________ Dr. Periklis Papadopoulos, Committee Member Date ___________________________________________________________ Dr. Sean Swei, Committee Member Date

I
Abstract
Design of a New Stratotanker
By I-Chiang Wu
In this project, a new stratotanker will be designed to replace the current KC-135
fleet of the U.S. Air force in East Asia. The new aircraft will be designed to support
three types of missions: aerial refueling, cargo transfer and medical evacuation. The
critical mission requirement is to have high cargo capacity and noise reduction during
takeoff and landing. A weight analysis was researched and fits all military
performance requirements. A stability and control analysis was done to calculate
appropriate tail area. The drag polar estimation based on Roskam’s method was
calculated. Finally, the takeoff weight of this new aircraft is 332,324 lbs and the wing
loading is 120 lb/ft2, thrust to weight ratio 0.23.

II
TABLE OF CONTENTS
Abstract ........................................................................................................................... I
TABLE OF CONTENTS ...................................................................................................... II
LIST OF FIGURES ............................................................................................................. V
LIST OF TABLES ............................................................................................................ VIII
Nomenclature ............................................................................................................... IX
1.0 Introduction ....................................................................................................... 1
2.0 Mission ............................................................................................................... 3
2.1 Mission Specification ........................................................................................... 3
2.2 Critical Mission Requirements............................................................................. 4
2.3 Mission Profile ..................................................................................................... 5
2.4 Comparative Study .............................................................................................. 6
3.0 configuration design .......................................................................................... 8
4.0 Weight Sizing .................................................................................................... 10
4.1 Mission Fuel Weight .......................................................................................... 11
4.2 Weight Estimation ............................................................................................. 12
4.3 Sensitivity Studies.............................................................................................. 13
4.4 Trade studies ..................................................................................................... 14

III
5.0 Performance Sizing .......................................................................................... 16
5.1 Zero Lift Drag Estimation ................................................................................... 16
5.2 Takeoff Distance Requirement .......................................................................... 18
5.3 Landing Distance Requirement ......................................................................... 19
5.4 One Engine Climb Requirement ........................................................................ 20
5.5 Cruise Speed Requirement ................................................................................ 21
5.6 Matching for All Requirements ......................................................................... 22
5.7 Thrust ................................................................................................................ 23
6.0 Fuselage ........................................................................................................... 25
6.1 Cabin .................................................................................................................. 25
6.2 Cockpit ............................................................................................................... 27
7.0 Wing ................................................................................................................. 29
7.1 Thickness ratio and sweep angle ....................................................................... 29
7.2 Airfoil ................................................................................................................. 31
7.3 CAD Model ........................................................................................................ 33
7.4 Flaps................................................................................................................... 34
7.5 Aileron ............................................................................................................... 36
7.6 Fuel Volume ....................................................................................................... 37
8.0 Empennage ...................................................................................................... 38

IV
8.1 Horizontal Stabilizer .......................................................................................... 39
8.2 Vertical Stabilizer ............................................................................................... 40
8.3 Elevator .............................................................................................................. 41
9.0 Weight and Balance ......................................................................................... 43
10.0 Landing Gear ................................................................................................ 45
11.0 Stability and Control Analysis ...................................................................... 47
11.1 Static Longitudinal Stability ............................................................................. 47
11.2 Static Directional Stability ............................................................................... 49
12.0 Drag Polar Estimation .................................................................................. 53
12.1 Zero Lift Drag ................................................................................................... 53
12.2 Drag Polar ........................................................................................................ 54
13.0 V-N Diagram ................................................................................................. 57
14.0 Conclusion .................................................................................................... 59
15.0 Reference ..................................................................................................... 60
Appendix A. Front, Side and Top Views of the KC-X .................................................... 61

V
LIST OF FIGURES
Figure2. 1 Beach of Okinawa ......................................................................................... 4
Figure2. 2 Beach of Guam .............................................................................................. 4
Figure2. 3 Aerial Refueling Mission Profile .................................................................... 5
Figure2. 4 Mission Profiles for Cargo Transfer Mission and Medical Evacuation
Mission .......................................................................................................... 5
Figure2. 5 KC-135R ......................................................................................................... 7
Figure2. 6 KC-767 ........................................................................................................... 7
Figure2. 7 KC-30 ............................................................................................................. 7
Figure2. 8 KC-10 ............................................................................................................. 7
Figure3. 1 Configuration Sketch ..................................................................................... 8
Figure3. 2 Configuration Sketch ..................................................................................... 9
Figure4. 1 Empty Weight VS Takeoff Weight Relationship for Tankers ........................ 10
Figure4. 2 Mission Profile............................................................................................. 11
Figure4. 3 Weight Estimation between Tentative and Numerical Empty Weight ....... 12
Figure4. 4 Payload VS Range Graph ............................................................................. 15
Figure5. 1 Equivalent Parasite Area VS Wetted Area ................................................... 17
Figure5. 2 Wetted Area VS Takeoff Weight .................................................................. 17

VI
Figure5. 3 Takeoff Distance Requirement for CLmax=1.4 ............................................ 18
Figure5. 4 Landing Distance Requirement for CLmax=1.8 ........................................... 19
Figure5. 5 One Engine Failure Climb Requirement ...................................................... 20
Figure5. 6 Cruise Speed Requirement for Aspect Ratio 10 .......................................... 21
Figure5. 7 Manual Performance Requirement Results ................................................ 22
Figure5. 8 AAA Performance Requirement Results ..................................................... 23
Figure5. 9 CF6-6 Engine ............................................................................................... 24
Figure6. 1 General Arrangement of the Fuselage ........................................................ 25
Figure6. 2 Cabin Top View ............................................................................................ 26
Figure6. 3 Cabin Cross Section ..................................................................................... 27
Figure6. 4 Visibilities for the Cockpit ........................................................................... 28
Figure7. 1 Thickness Ratio and Leading Edge sweep Angle Relation........................... 30
Figure7. 2 NACA 641-212 Airfoil .................................................................................. 31
Figure7. 3NACA 641-412 Airfoil ................................................................................... 32
Figure7. 4 Zero Angle of Attack Lift Distribution .......................................................... 32
Figure7. 5 5 Degrees Angle of Attack Lift Distribution ................................................. 33
Figure7. 6 CAD model of the Wing............................................................................... 34
Figure7. 7 Definition of flapped wing area .................................................................. 35
Figure7. 8 Section lift effectiveness parameter for fowler flap ................................... 35

VII
Figure7. 9 CAD model for the Flap ............................................................................... 36
Figure7. 10 CAD Model of Aileron ............................................................................... 36
Figure8. 1 Moment Arm for the Tail Volume Coefficient ............................................. 39
Figure8. 2 CAD Model for the Horizontal Stabilizer ..................................................... 40
Figure8. 3 CAD Model for the Vertical Stabilizer .......................................................... 41
Figure8. 4 CAD Model of elevator ................................................................................ 42
Figure9. 1 C.G Diagram for refueling mission .............................................................. 44
Figure9. 2 Empty Weight C.G Location ........................................................................ 44
Figure10. 1 Static Load Geometric for Tricycle Gears .................................................. 45
Figure11. 1 Longitudinal Stability X-Plot ...................................................................... 49
Figure11. 2 Directional Stability X-Plot ........................................................................ 50
Figure11. 3 Factor accounting for wing-fuselage interference with directional stability
.................................................................................................................... 51
Figure11. 4 Effect of fuselage Reynolds number on wing fuselage directional stability
.................................................................................................................... 52
Figure12. 1 CD vs CL ..................................................................................................... 55
Figure12. 2 L/D vs CL .................................................................................................... 55
Figure13. 1 V-N Diagram for the KC-X .......................................................................... 58

VIII
LIST OF TABLES
Table2. 1 Specification of similar aircraft ....................................................................... 6
Table4. 1 sensitivities to different parameters ............................................................ 14
Table5. 1 Properties of CF6-6 Engine ........................................................................... 24
Table7. 1 Similar Aircraft Aileron Area ......................................................................... 37
Table8. 1 Similar Aircraft Elevator Area ....................................................................... 42
Table9. 1 Component Weight ...................................................................................... 43
Table10. 1 Selected Wheel Data .................................................................................. 46
Table12. 1 Wetted area for different components ...................................................... 54

IX
Nomenclature
AR Aspect Ratio
b wingspan
β Mach Constant
c Chord Length
CD Drag Coefficient
CDo Zero-Lift Drag Coefficient
CL Lift Coefficient
CLαh Horizontal Tail Lift Curve Slope
CLαv Vertical Tail Lift Curve Slope
CLαw Wing Lift Curve Slope
CLαwf Wing-Fuselage Lift Curve Slope

X
Cnβ Yaw Sideslip Moment Coefficient
Cnβf Fuselage Yaw Sideslip Moment Coefficient
Cnβwf Wing-Fuselage Yaw Sideslip Moment Coefficient
df Equivalent Fuselage Diameter
e Oswald Efficiency Factor
εh Horizontal Downwash Gradient
k Lift Curve Slope Constant
KA Aspect Ratio Constant
Kh Horizontal Tail Constant
Kλ Taper Ratio Constant
Kn Factor Accounting for Wing-Fuselage Interference
Kwf Wing-Fuselage Constant
lf Fuselage Length
XI
ln Fuselage nose Length
λf Fuselage Length to Diameter Ratio
S Wing Area
Sv Vertical Tail Area
Swet,e Empennage Wetted Area
Swet,f Fuselage Wetted Area
Swet,fan Fan Cowling Wetted Area
Swet,gas Gas Generator Wetted Area
Swet,plug Plug Wetted Area
Swet,tot Total Aircraft Wetted Area
Swet,w Wing Wetted Area
V Aircraft Velocity
XacA Aerodynamic Center Location of Aircraft from Tip of Nose

XII
Xacwf Aerodynamic center Location of Wing-Fuselage
Combination from Tip of Nose

1
1.0 Introduction
As the turmoil in East Asia, North Korea plans to attack South Korea by lunching
nuclear bombs. The hypothetical battlefield of the next world war is in Korea. South
Korea is the largest DRAM and TFT-LCD producer in the world. Once the war begins,
the global economy and technology will be hurt seriously. As the leader of the United
Nations, The United States has the primary responsibility for the maintenance of
world peace.
The U.S. Air Force mainly positioned the Lockheed Martin F-22 in Guam and Okinawa.
The distance between Guam and South Korea is 1780 nautical miles and the distance
between Okinawa and South Korea is 705 nautical miles. The range of the F-22 is
about 1600 nautical miles. Therefore, more than one refueling is required for any
mission. In 2011, China had the first test flight for their new stealth fighter J-20.
Military capability of the Communist Party is threatening the whole of East Asia.
Currently the U.S. Air Force has the 909th air refueling squadron located in Okinawa
which has 15 Boeing KC-135R. Due to the low range and low cargo capacity, the U.S.
Air Force is planning to replace its KC-135R. According to the Request for Proposal[1]
put out by the USAF on March 15 2010, the new refueling aircraft has to satisfy range,
payload as good as the KC-135 and multi-point refueling capability.
In the past, the U.S. Air Force tried to use different engine to increase the range for

2
the KC-135. There are also many research studies to gain the use life of the KC-135.
Ishimitsu[2] tried to add winglets for the KC-135, the induced drag is decreased from
the experiment result. Gerontakos[3] experienced different dihedral angle for
winglets, the negative dihedral was more effective in reducing the induced drag.
Halpert[4] tried to add winglets, raked wingtips and a wingspan extension to increase
the range and endurance for the KC-135. A raked wingtip with 20° of additional
leading edge sweep could increase the most range and endurance. Gold[5] had an
experimental study about the dihedral on a raked wingtip. The result showed the
raked tip with the lower sweep angle exhibited a lower induced drag. Slofff[6] used
flap tip fence to improve the aerodynamic efficiency. An improvement of lift to drag
ratio and maximum lift coefficient up to 1%. A reduction of noise during landing is
about 7dB.

3
2.0 Mission
The objective of this project is to design a new military fuel transport aircraft for the
United State Air Force. According to the request, the USAF aims to replace its current
aerial refueling fleet which consists of Boeing KC-135Rs. Better range and payload
requirement is necessary for the new aircraft. Three different tasks competency is
also required which are aerial refueling, cargo transfer and medical evacuation. A
typical mission for the new aircraft can take off from Guam carrying military
personnel to South Korea, transfer military supplies from Guam to South Korea, or
take off from Okinawa to prepare for an aerial refueling mission near North Korean
airspace.
2.1 Mission Specification
As determined by the USAF, the mission requirement numbers are concerned:
• Passengers: 150 (125 Patients to 25 Medical Personnel; 5:1 ratio)
• Cargo: 18 x 464L Pallets (5,000 lbs/each)
• Crew: 3: Pilot, co-pilot, boom operator
• Fuel Capacity: 150,000 lbs
• Range: 1,500 nmi for aerial refuleing mission
1,800 nmi for cargo transfer and medical evacution missions
• Cruising Altitude: 40,000 ft
• Cruise Speed: 612.7mph (M=0.83)

4
2.2 Critical Mission Requirements
The KC-X has two critical mission requirements. The first is large cargo capacity. The
U.S. government is planning to move marine troop from Okinawa to Guam in 2014.
Large cargo capacity could assist transport large quantities of supplies. The second is
the reduction in noise during take-off and landing. Okinawa and Guam are both
popular sightseeing place. Noise could affect local residents and vibrations could
damage local landscape.
Figure2. 1 – Beach of Okinawa
Figure2. 2 – Beach of Guam

5
2.3 Mission Profile
Figure 2.3 shows a sketch of the aerial refueling mission profile of the KC-X. Firstly
taxi on the run way and take off then ascent to cruise altitude 40,000 feet. The KC-X
will refuel other aircraft at 40,000 feet then return fly back to the base. When
approach the base, the KC-X will do loiter for one hour and then do descent and
landing.
Figure2. 3 –Aerial refueling mission profile
Figure 2.4 shows the sketch of both cargo transfer mission and medical evacuation
mission. Taxi one the runway then takeoff climb to 40,000 feet. One hour loiter
before landing and then do descent and landing.
Figure2. 4 – Mission profiles for cargo transfer mission and medical evacuation mission

6
2.4 Comparative Study
This section will compare different refueling aircraft designs. Currently, there are four
different refueling jet powered aircrafts service around the world. They are KC-135R,
KC-767, KC-30 and KC-10. The KC-135R is the current fleet for the USAF. Figure 2.5 to
figure 2.8 shows these four aircrafts. Table 2.1 express specifications of these four
aircraft.
Table2. 1 – Specification of similar aircraft
KC-135R KC-767 KC-30 KC-10 Crew 3 3 3 4
Capacity 37 passenger+ 6 pallets
200passenger+ 19 pallets
380passenger+ 8 pallets
75 passenger+ 17 pallets
Length 136ft 3in 159ft 2in 193ft 181ft 7in Span 130ft 10in 156ft 1in 198ft 165ft 4.5in
Height 41ft 8in 52ft 57ft 58ft 1in Wing Area 2,433 ft² 3,050 ft² 3,900 ft² 3,958 ft² Empty Weight 98,466 lb 181,610 lb 275,600 lb 241,027 lb Takeoff Weight 322,500 lb 395,000 lb 514,000 lb 590,000 lb
Thrust 86,536 lbf 120,400 lbf 144,000 lbf 157,500 lbf Fuel Load 150,000 lb 160,660 lb 245,000 lb 353,180 lb
Max Speed 580mph(0.87M) 570mph(0.86M) 547mph(0.83M) 619mph(0.84M) Cruise Speed 530mph(0.8M) 530mph(0.8M) 534mph(0.8M) 560mph(0.76M)
Range 1,500 nmi 6,385 nmi 8,000 nmi 4,400 nmi Cruise Altitude 50,000 ft 40,100 ft 41,500 ft 42,000 ft
Thrust to Weight Ratio 0.268 0.304 0.28 0.266 Wing Loading 132.55 129.5 131.79 149.06

7
Figure2. 5 – KC-135R
Figure2. 6 – KC-767
Figure2. 7 – KC-30
Figure2. 8 – KC-10

8
3.0 configuration design
Combined configurations for existing designs, the KC-X will use the low wing
configuration, conventional tail for its empennage, conventional tricycle type landing
gear, a high-bypass turbofan propulsion system and two different types (drogue and
boom) for the refueling system. The transport fuel could store under-floor of the
fuselage. The conventional tricycle landing gear could be landed in very large crab
angle in a crosswind. The risk of landing is reduced by this type of landing gear. The
KC-X will only use two turbofan engines placed symmetrically on the wing. With this
configuration, less maintenance efforts will be required. The configuration sketch is
shown in figure 3.1 and figure 3.2.
Figure3. 1 – Configuration Sketch

9
Figure3. 2 – Configuration Sketch

10
4.0 Weight Sizing
Before estimate the weight, the linear relationship between empty and takeoff
weight is required. For a given value of takeoff weight, the allowable value for empty
weight can be found from Eq. (4.1). According to four similar design tanker aircrafts,
the design empty and takeoff weight relationship was found by AAA. The numerical
value for the quantity A is 2.1898, B is 0.6588. The result is shown is figure 4.1.
We = inv. log10{log10WTo−AB
} (4.1)
Figure4. 1 – Empty weight vs. takeoff weight relationship for tankers

11
4.1 Mission Fuel Weight
According to the mission profile, the fuel-fraction has 8 phases which includes:
warm-up, taxi, takeoff, climb, cruise, loiter, descent and landing. The fuel-fraction for
each phase is defined as the ratio of end weight to begin weight. Assume
fuel-fraction ratios for warm-up, taxi and takeoff are 0.99. Assume the climb rate is
1500 feet per minute, average climb speed is 275 knots and the fuel-fraction for
climb is 0.98. Assume the SFC for the KC-X is 0.5 and the lift to drag ratio is 14 during
cruise. Eq. (4.2) shows the fuel-fraction for cruise. Climb to 40,000 feet require 26.6
minutes and the climb range is 122 nautical miles. The cruise range is 1288 nautical
miles. The fuel-fraction for cruise is 0.907. Assume SFC is 0.6 during loiter and the lift
to drag ratio is 16. The fuel-fraction for loiter is 0.963. Assume the fuel-fraction for
descent and landing is 0.99. The overall mission fuel-fraction is 0.814, that means the
used fuel weight is 18.6% of the takeoff weight. Assume 5% reserve fuel; the total
fuel weight is 19.5% of the takeoff weight.
WiWi−1
= exp (− RCjV�L D� �
) (4.2)
WiWi−1
= exp (− ECjLD�
) (4.3)
Figure4. 2 – Mission profile

12
4.2 Weight Estimation
According to Roskam’s weight estimation method, the first step is to calculate the
tentative value for operating empty weight and the second is to calculate the
tentative value for empty weight. Eq. (4.4) and Eq. (4.5) are these two steps.
Compare the tentative value empty weight to numerical empty weight shown in
figure 4.1. The tolerance for the empty is 0.5% in the design process. The fuel weight
is 0.195% of the takeoff weight, mission payload is 15,000 lbs, 200 lbs for each crew
and assume 0.5% trapped fuel. The result is shown in figure 4.3, the takeoff weight is
330,000 lbs and the empty weight is 113,300 lbs.
WOEtent = WToguess − WF − WPL (4.4)
WEtent = WOEtent − Wtfo − Wcrew (4.5)
0
50000
100000
150000
200000
250000
300000
150000 200000 250000 300000 350000 400000 450000 500000 550000
Tentative empty weightNumerical empty weight
Empt
y w
eigh
t (lb
s)
Takeoff weight (lbs)
Weight Estimation between Tentative and Numerical Empty Weight
Figure4. 3 – Weight estimation between tentative and numerical empty weight

13
4.3 Sensitivity Studies
The sensitivity studies will show how aircraft takeoff weight varies with payload,
empty weight, range, endurance, lift to drag ratio and specific fuel consumption.
These study could assist aircraft adjust the takeoff weight if these parameters change.
Here define three values C, D and F for convenient calculation. Eq. (4.9) to Eq. (4.13)
are sensitivity equations for jet aircraft. Results are shown in table 4.1.
C = {1 − (1 + Mres)(1− Mff) − Mtfo} (4.6)
D = (WPL + Wcrew) (4.7)
F = −BWTo2 (1+Mres)Mff
CWTo(1−B)−D (4.8)
∂WTo∂WPL
= BWToD−C(1−B)WTo
(4.9)
∂WTo∂WE
= BWTo
invlog10{log10WTo−AB }
(4.10)
∂WTo∂R
= FCjV(L D� )
(4.11)
∂WTo∂E
= FCj(L D� )
(4.12)
∂WTo
∂(L D� )= − FRCj
V(L D� )2 (4.13)

14
Table4. 1 – Sensitivities to different parameters
Takeoff weight to payload weight 3.66
Takeoff weight to empty weight 1.92
Takeoff weight to range 77.45 lb/nm
Takeoff weight to lift-to-drag ratio -8299 lb
4.4 Trade studies
Figure 4.4 shows the trade studies for payload and range. The main payload for the
KC-X is fuel. It can be easily stored in the wing, so there is no upper limit for the
payload weight. The minimum range requirement is the distance between Okinawa
and South Korea which is 705 nautical miles. In this graph, the KC-X has the ability to
undertake the refueling mission and the range for eighteen military pallets payloads
also fits the cargo mission requirements.

15
0
50000
100000
150000
200000
0 500 1000 1500 2000 2500 3000 3500 4000
Payl
oad
(lbs)
Range (nautical miles)
Trade Study Payload VS Range Graph
Figure4. 4 – Payload vs. range graph

16
5.0 Performance Sizing
Airplanes are usually designed to meet performance objectives in stall speed, takeoff
field length, landing field length, cruise speed climb requirements. Wing area, takeoff
thrust, maximum takeoff lift and maximum landing lift coefficient were affected by
these performance. From these data, highest possible wing loading and lowest
possible thrust to weight could be found with the lowest weight and the lowest cost.
5.1 Zero Lift Drag Estimation
Before calculate the performance requirements, the zero lift drag coefficient needs
to be estimated. Accord to historical aircraft data, Roskam uses the log plot to find a
numerical relation between equivalent parasite area and wetted area with different
equivalent skin friction coefficient (Eq. 5.2). Figure 5.1 and 5.2 are the log plot from
Roskam’s. Assume the skin friction coefficient is 0.004, the value for a and b are
-2.3979 and 1. The value for c and d is 0.1628 and 0.7316 for military transports.
Combine Eq. (5.2) and Eq. (5.3) can get the equivalent parasite area from the takeoff
weight. The zero lift drag coefficient for the KC-X is 0.0001921 W/S.
CD0 = fS� (5.1)
log10f = a + blog10Swet (5.2)
log10Swet = c + dlog10WTo (5.3)
f = invlog10{a + b(c + dlog10WTo)} (5.4)

17
CD0 = invlog10{a+b(c+dlog10WTo)}WTo
× WToS
(5.5)
0
50
100
150
200
250
0 10000 20000 30000 40000 50000
Cf=0.004
Equi
cale
nt p
aras
ite a
rea
(ft2 )
Wetted area (ft2)
Equivalent Parasite Area VS Wetted Area
Figure5. 1 – Equivalent parasite area vs. wetted area
0
10000
20000
30000
40000
50000
0 1000000 2000000 3000000 4000000 5000000
Military transport
Wet
ted
area
(ft2 )
Takeoff weight (lbs)
Wetted Area VS Takeoff Weight
Figure5. 2 – Wetted area vs. takeoff weight

18
5.2 Takeoff Distance Requirement
The runway of Kadena Air Base in Okinawa is 12,140 feet long; the runway of
Andersn Air Base in Guam is 11,155 and 10,555 feet long. The design takeoff distance
for the KC-X is 10,000 feet. Eq. (5.6) shows the takeoff distance requirement for
military aircrafts. Figure 5.3 shows the result for manual takeoff distance
requirement calculations.
STOG =0.0447(WS )to
ρ[CLmax�0.75�5+λ4+λ��TW�to
−0.025�−0.72CD0] (5.6)
0.15
0.2
0.25
0.3
0.35
0.4
80 100 120 140 160 180 200
Takeoff requirement for CLmax=1.4
Thru
st to
Wei
ght R
atio
(lbs
/lbs)
Wing Loading (lbs/ft2)
Figure5. 3 – Takeoff distance requirement for CLmax=1.4
19
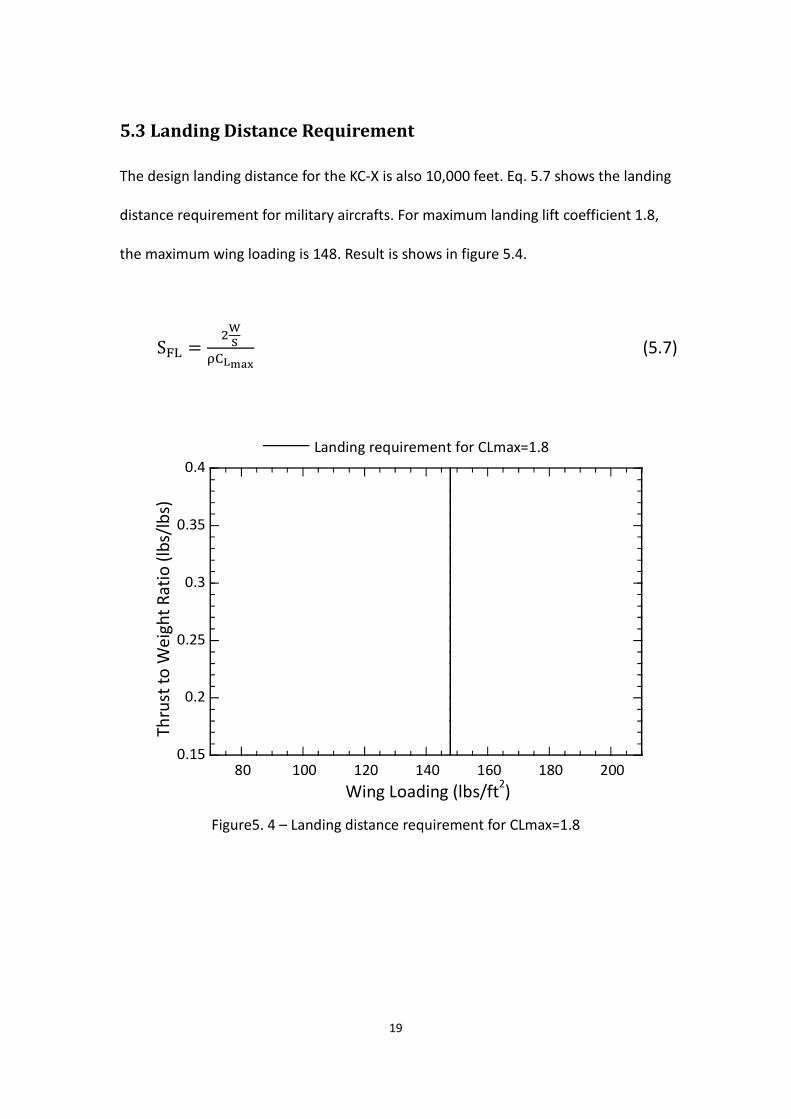
5.3 Landing Distance Requirement
The design landing distance for the KC-X is also 10,000 feet. Eq. 5.7 shows the landing
distance requirement for military aircrafts. For maximum landing lift coefficient 1.8,
the maximum wing loading is 148. Result is shows in figure 5.4.
SFL =2WS
ρCLmax (5.7)
0.15
0.2
0.25
0.3
0.35
0.4
80 100 120 140 160 180 200
Landing requirement for CLmax=1.8
Thru
st to
Wei
ght R
atio
(lbs
/lbs)
Wing Loading (lbs/ft2)
Figure5. 4 – Landing distance requirement for CLmax=1.8

20
5.4 One Engine Climb Requirement
Eq. (5.8) shows one engine failure climb requirement, N is the engine number and
CGR is the climb gradient. The climb rate of the KC-X is 1500 feet minute and the
average climb speed is 275 knots. The climb gradient is 0.053, the configuration is
gear up, flaps up and maximum continuous thrust on remain engines is 1.25 stall
speed. The result is shown is figure 5.5.
TW
= NCD0+
CL2
πAeCL
+ CGR (5.8)
0.15
0.2
0.25
0.3
0.35
0.4
80 100 120 140 160 180 200
Climb requirement
Thru
st to
Wei
ght R
atio
(lbs
/lbs)
Wing Loading (lbs/ft2)
Figure5. 5 – One engine failure climb requirement

21
5.5 Cruise Speed Requirement
Eq. (5.9) shows the cruise requirement for jet aircrafts. The cruise speed of the KC-X
is 0.83 and the aspect ratio use 10. Result is shown in figure 5.6.
TW
= CD0q SW
+ WqSπAe
(5.9)
0.15
0.2
0.25
0.3
0.35
0.4
80 100 120 140 160 180 200
Cruise requirement
Thru
st to
Wei
ght R
atio
(lbs
/lbs)
Wing Loading (lbs/ft2)
Figure5. 6 – Cruise speed requirement for aspect ratio 10

22
5.6 Matching for All Requirements
Combine figure 5.3 to figure 5.6, takeoff distance, landing distance, one engine
failure climb and cruise speed requirements are all shown in figure 5.7. The best
design point P is takeoff lift coefficient 1.4, the lowest thrust to weight ratio 0.23 and
the highest wing loading 120. Figure 5.8 shows the AAA results.
Landing requirement for CLmax=1.8
0.15
0.2
0.25
0.3
0.35
0.4
80 100 120 140 160 180 200
Takeoff requirement for CLmax=1.4
Cruise requirementClimb requirement
Thru
st to
Wei
ght R
atio
(lbs
/lbs)
Wing Loading (lbs/ft2) Figure5. 7 – Manual performance requirement results

23
Figure5. 8 – AAA performance requirement results
5.7 Thrust
The thrust could be calculated from the takeoff thrust to weight ratio. 0.23 is the
lowest thrust to weight ratio fit all performance requirements. The total thrust for

24
the KC-X is 75900 pounds, 37950 pounds for each engine. Model CF6-6 engine
(shown in fig 5.9) from GE Company has maximum power of 41500 lbs. It was also
select for the DC-10. SFC at maximum power is 0.35, the dry weight is 8200 pounds,
the length is 16 feet and maximum diameter is 8.75 feet.
Figure5. 9 – CF6-6 engine
Table5. 1 – Properties of CF6-6 engine
Max Diameter (inch) 105
Length (inch) 188
Dry Weight (lb) 8200
SFC 0.35
Max Power at sea level(lbf) 41500
Pressure Ratio 25-25.5
Bypass Ratio 5.76-5.92

25
6.0 Fuselage
According to different missions, the fuselage length should allow 150 passengers or
18x464L military cargo pallets. The total length of the fuselage is 150 feet, the
maximum diameter of the fuselage is 18.75 feet and th length of the fuselage cone is
65.625 feet. The definition of geometric fuselage parameters are shown in figure 6.1.
The thickness of the fuselage is 5.5 inches.
Figure6. 1 – General arrangement of the fuselage
6.1 Cabin
Figure 6.2 shows the top view of the cabin for cargo and medical evacuation mission.
For the medical evacuation mission, comfert is the the first requirement. The cabin
will have two level classes. The first class will contain enght wide and comfert seats
for officers and serious injuries. The first class have two rows, four seats per row.
Seats in the first class could adjust 45 degrees, requireed length is 50 inches. The
other cabin has 143 seats, 17 rows for minor injuries, seven seas per row, four rows
for medical staff, six seats per row. All seats could bend 30 degrees for rest and the
require length is 47 inches. For cargo mission, the length of the 464L military is 108

26
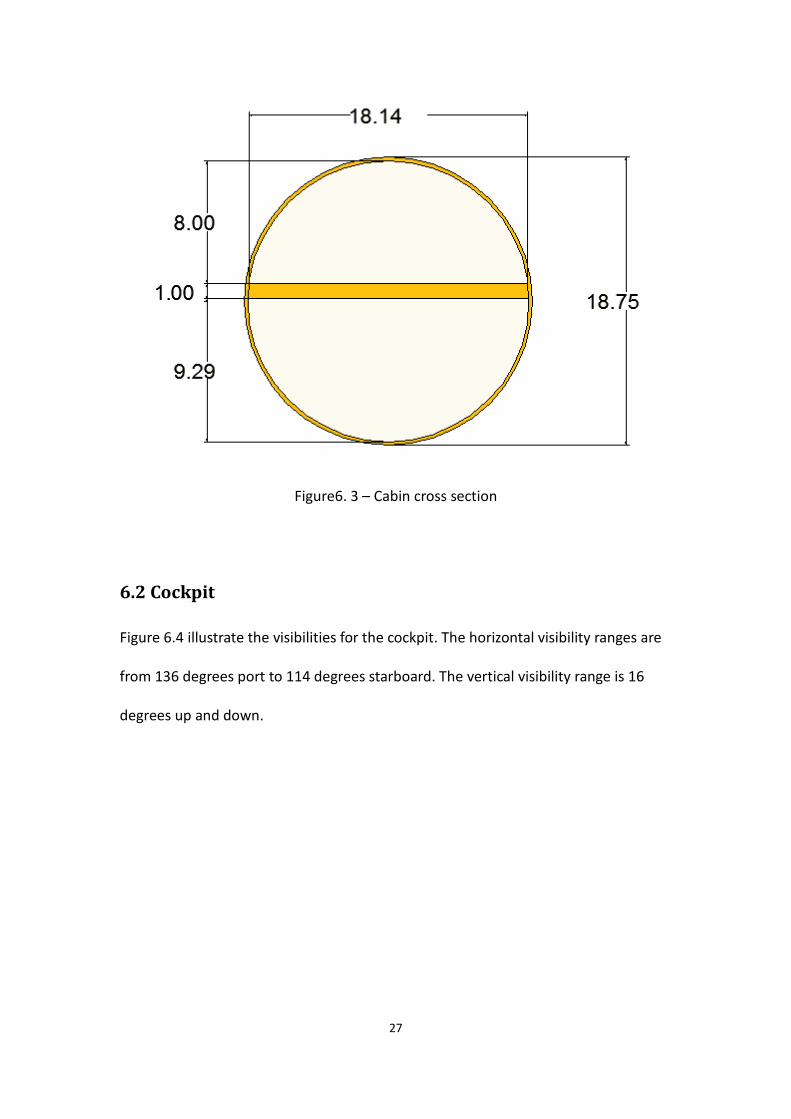
inches and 88 inches in width. 150 feet is an enough length for nine pallets and the
width could allow two pallets, 18 pallets is the total carrying number. Figure 6.3
shows the cabin cross section area. The first level is 8 feet high and 18.14 wide. The
thickness of the handling floor is 1 feet in order to handle heavy cargos in cargo
mission. The hight of the lower level is 9.3 feet for the wing and extra fuel tank
mounted in the fuselage.
Figure6. 2 – Cabin top view
27
Figure6. 3 – Cabin cross section
6.2 Cockpit
Figure 6.4 illustrate the visibilities for the cockpit. The horizontal visibility ranges are
from 136 degrees port to 114 degrees starboard. The vertical visibility range is 16
degrees up and down.

28
Figure6. 4 – Visibilities for the cockpit

29
7.0 Wing
From the performance requirements, the wing loading for thrust to weight ratio 0.23
is 120. The wing area calculated form that is 2750 ft2. The aspect ratio used for the
cruise requirement is 10. The KC-X will use this aspect ratio to calculate the span and
chord length. The tapper ratio selected for the KC-X is 0.35. The span length is 165.83
feet. The root chord length is 24.56 feet and the tip chord is 8.6 feet.
bw = �AR × Sw = √10 × 2750 = 165.83 ft
Cr =2b
(1 + λ)AR =2 × 165.83
(1 + 0.35) × 10 = 24.56 ft
Ct =2bλ
(1 + λ)AR =2 × 165.83 × 0.35
(1 + 0.35) × 10 = 8.6 ft
7.1 Thickness ratio and sweep angle
The thickness ratio will follow Roskam’s sweep angle relation figure. Eq. (7.1) shows
the relationship between Mach number, cruise lift coefficient, thickness ratio and
sweep angle. Thickness ratio cannot be less than 0.1 to allow enough room for the
wing structure and the fuel. It also should not be over 0.2 because the profile drag of
the wing is going to be too high. According to Roskam’s preliminary design part, Eq.
(7.2) provides the approximate cruise lift coefficient. Figure 7.1 shows the result for
thickness ratio and sweep angle relation. The Thickness ratio selected for the KC-X is
0.12 and the leading edge sweep angle is 50 degrees.

30
(7.1)
CLcr = WTO−0.4WFqS
= 330000−0.4×6444912×0.000583×803.4122×2750
= 0.59 (7.2)
0
0.04
0.08
0.12
0.16
0 20 40 60 80 100
Thic
knes
s rat
io
Leading edge sweep angle (degree)
Thickness Ratio and Leading Edge sweep Angle Relation
Figure7. 1 – Thickness ratio and leading edge sweep angle relation

31
7.2 Airfoil
Due to the thickness ratio is 12%, the KC-X will use thickness 12% airfoils for both
root and tip for easy calculations. The airfoil selected for the root is NACA 641-212
(fig. 7.2), the lift slop for this airfoil is 6.4744, zero lift angle is -2 degrees, stall angle is
15 degrees. NACA 641-412 (fig. 7.3) is the tip airfoil for the KC-X. The lift slope for the
NACA 641-412 airfoil is 6.171, zero lift angle is 1, stall angle is 15 degrees. The
incidence angle for the root is 10 degrees and the tip has a -2 degrees twist. The wing
has a washout design, the wing root stalls before the wing tip in order to provide the
KC-X with continued aileron control. The lifting line method is used to determine the
lift distribution of the wing. The zero angle of attack lift coefficient for an unsweep
wing is 0.8896. Figure 7.4 illustrate the zero angle of attack lift distribution for the
wing. For a 50 degrees sweep wing, the lift coefficient is 0.59 which is high enough to
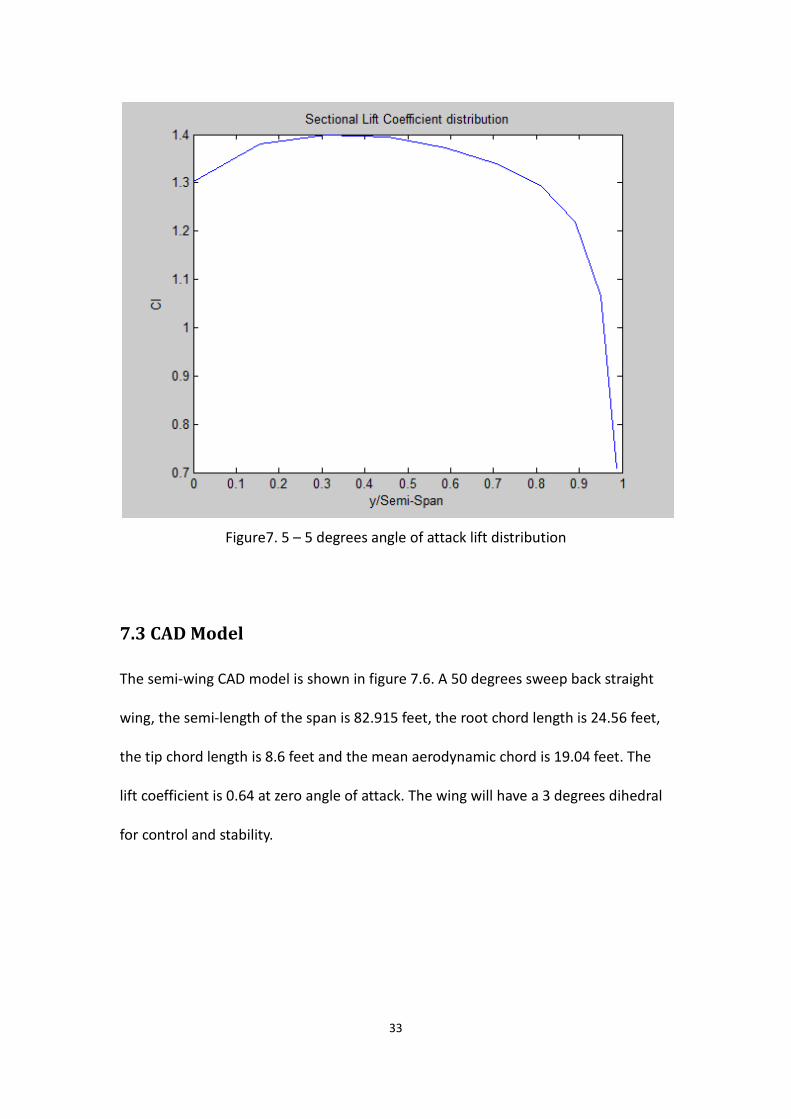
keep the KC-X fly level. The maximum lift coefficient is 0.9, figure 7.5 shows the lift
distribution for the maximum lift coefficient at 5 degrees angle of attack.
Figure7. 2 – NACA 641-212 airfoil

32
Figure7. 3 – NACA 641-412 airfoil
Figure7. 4 – Zero angle of attack lift distribution
33
Figure7. 5 – 5 degrees angle of attack lift distribution
7.3 CAD Model
The semi-wing CAD model is shown in figure 7.6. A 50 degrees sweep back straight
wing, the semi-length of the span is 82.915 feet, the root chord length is 24.56 feet,
the tip chord length is 8.6 feet and the mean aerodynamic chord is 19.04 feet. The
lift coefficient is 0.64 at zero angle of attack. The wing will have a 3 degrees dihedral
for control and stability.

34
Figure7. 6 – CAD model of the wing
7.4 Flaps
According to the takeoff and landing requirements, the takeoff lift coefficient is 1.4
and the landing coefficient is 1.8 for 10,000 feet runway takeoff and landing. Eq. (7.3)
to Eq. (7.5) determined required incremental section maximum lift coefficient with
flap down. The wing of the KC-X will include a double-slotted fowler flap on the
trailing edge. The flap start from 20% to 50% of the semi-span and the chord is 20%
of the airfoil. Eq. (7.6) presents the incremental section lift coefficient due to the
fowler flap. Compare results from Eq. (7.1) and Eq. (7.4), the flap deflection angle
during takeoff is 13 degrees and 24 degrees during landing. Figure 7.9 shows the CAD
model of the flaps.

35
∆Clmax = ∆CLmax(SSwf� )KΛ (7.3)
KΛ = (1 − 0.08cos2Λc4�
)cos3 4� Λc4�
(7.4)
SwfS� = (η0 − ηi)�2 − �1 −λ�(ηi + η0)�/(1 + λ) (7.5)
∆Cl = 2π(1 + cf c� )aδfδf (7.6)
Figure7. 7 – Definition of flapped wing area
Figure7. 8 – Section lift effectiveness parameter for fowler flap

36
Figure7. 9 – CAD model for flaps
7.5 Aileron
The aileron for thx KC-X will start from 55% to 90% of the semi-span; the chord is
20% of the airfoil. Total aileron area is 134.4 feet square. Compare to similar designs,
the aileron to wing area ratio is close. Table 7.1 shows the ratio for KC-767 and KC-10.
Figure7. 10 – CAD model of aileron

37
Table7. 1 – Similar aircraft aileron area
Wing Area Aileron Area Aileron to Wing ratio
KC-767 3,050 ft2 125.05 ft2 0.041
KC-10 3,958 ft2 186 ft2 0.047
KC-X 2,750 ft2 134.4 ft2 0.048
7.6 Fuel Volume
The KC-X will transport 150,000 lbs of JP-4. For the transport fuel mission, the KC-X
has to carry total 214450 lbs fuel. In the preliminary design, Torenbeek wing fuel
volume equation is used to estimate the wing fuel volume. Eq. (7.7) is the Torenbeek
wing fuel volume equation. The root and tip thickness are both 0.12. The KC-X could
carry total 2544.68 cubic feet (19035 gallons) of JP-4. Convert to weight; the total
weight is 124678.25 lbs. 89770 lbs fuel will be stored in the fuselage.
VWF = 0.54�S2b� � (t c� )r{(1 + λWτw
12� + λw2 τw)/(1 + λw)2 (7.7)
τw =(tc)t
(tc)w

38
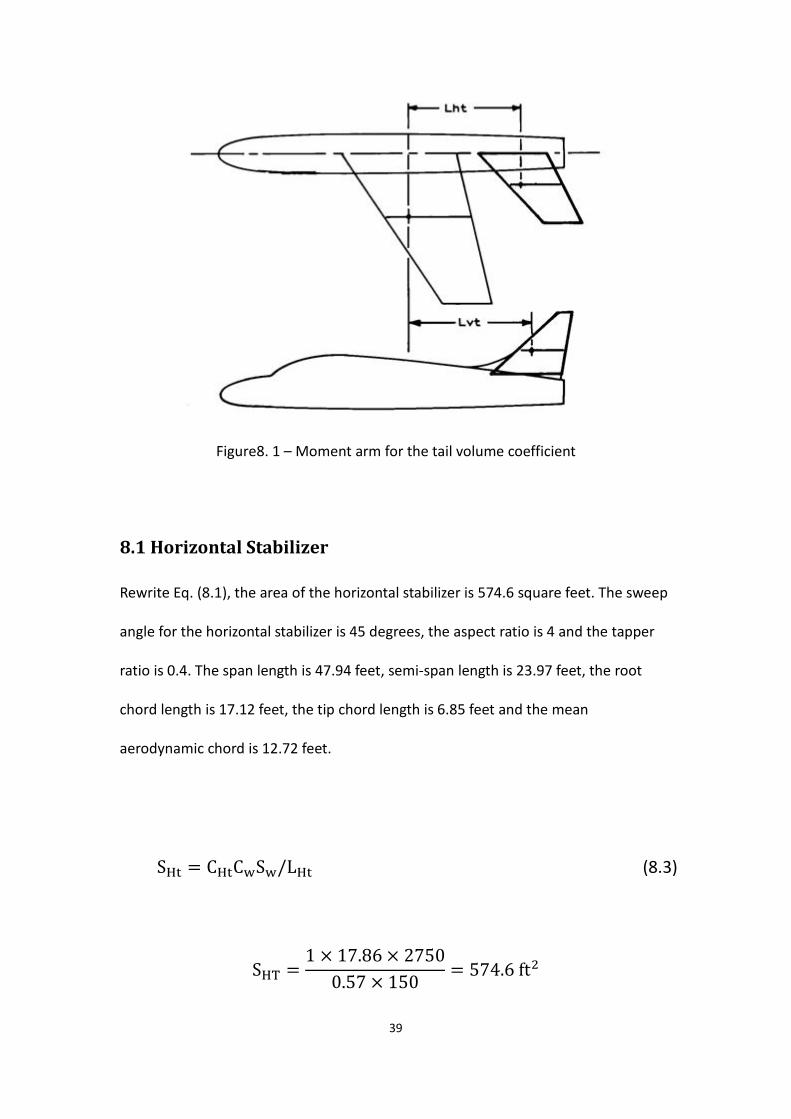
8.0 Empennage
The area of the empennage was determined using the tail volume coefficient method.
The recommended horizontal stabilizer volume coefficient for military cargo aircraft
is 1 and the vertical stabilizer volume coefficient is 0.08. The KC-X will use all moving
vertical stabilizer so the vertical volume coefficient could be reduced 15%. Eq. (8.1)
and Eq. (8.2) express the volume coefficient; the moment is an important factor for
the volume coefficient. The length of the moment arm is the distance from the wing
quarter mean chord to the horizontal stabilizer or vertical stabilizer quarter mean
chord. The moment arm for the horizontal stabilizer is 57% of the fuselage length and
50% for the vertical stabilizer.
CHT = LHTSHTCwSw
(8.1)
CVT = LVTSVTbwSw
(8.2)
39
Figure8. 1 – Moment arm for the tail volume coefficient
8.1 Horizontal Stabilizer
Rewrite Eq. (8.1), the area of the horizontal stabilizer is 574.6 square feet. The sweep
angle for the horizontal stabilizer is 45 degrees, the aspect ratio is 4 and the tapper
ratio is 0.4. The span length is 47.94 feet, semi-span length is 23.97 feet, the root
chord length is 17.12 feet, the tip chord length is 6.85 feet and the mean
aerodynamic chord is 12.72 feet.
SHt = CHtCwSw/LHt (8.3)
SHT =1 × 17.86 × 2750
0.57 × 150 = 574.6 ft2

40
bw = �AR × Sw = √4 × 574.6 = 47.94 ft
Cr =2b
(1 + λ)AR =2 × 47.94
(1 + 0.4) × 4 = 17.12 ft
Ct =2bλ
(1 + λ)AR =2 × 47.94 × 0.4
(1 + 0.4) × 4 = 6.85 ft
Figure8. 2 – CAD model for the horizontal stabilizer
8.2 Vertical Stabilizer
The area of the Vertical stabilizer is 413.47 square feet. The sweep angle for the
horizontal stabilizer is 45 degrees, the aspect ratio is 1.3 and the tapper ratio is 0.6.
The span length is 23.18 feet, the root chord length is 22.29 feet, the tip chord length
is 13.37 feet and the mean aerodynamic chord is 18.2 feet.
Svt = CvtbwSw/Lvt (8.4)

41
SVT =0.068 × 165.83 × 2750
0.5 × 150= 413.47 ft2
bw = �AR × Sw = √1.3 × 413.47 = 23.18 ft
Cr =2b
(1 + λ)AR =2 × 23.18
(1 + 0.6) × 1.3 = 22.29 ft
Ct =2bλ
(1 + λ)AR =2 × 23.18 × 0.6(1 + 0.6) × 1.3 = 13.37 ft
Figure8. 3 – CAD model for the vertical stabilizer
8.3 Elevator
The elevator for the KC-X will start from 20% to 95% semi-span of the horizontal
stabilizer; the chord is 35% of the airfoil. Total elevator area is 185.9 feet square.

42
Compare to similar designs, the aileron to wing area ratio is close. Table 8.1 shows
the ratio KC-767 and KC-10.
Figure8. 4 – CAD model of elevator
Table8. 1 – Similar aircraft elevator area
Wing Area Elevator Area Elevator to Wing ratio
KC-767 836 ft2 192.28 ft2 0.23
KC-10 1338 ft2 294.36 ft2 0.22
KC-X 574.6 ft2 140.7 ft2 0.245

43
9.0 Weight and Balance
The maximum takeoff weight of the KC-X is 330,000 pounds. Table 9.1 shows a
roughly estimated weight. All weight components are from GD weight method or
Torenbeek method from Roskam’s Class II weight estimation. Some of the
components were using USAF weight method. The distances where the moments
were computed were taken with respect to the front of the airplane, towards the
cockpit nose, and measured along an access parallel to the approximate center of
gravity distance of a particular component. The same procedure is carried out with
the useful load for each mission’s center of gravity. Table 9.1 shows the weight and
distance to the nose for each component. Figure 8.1 shows the C.G. diagram, point 1
is the empty C.G. location. Point 2 add 3 crews, at point 3 and 4 add transport fuel
and mission fuel. Point 5 finish refueling with half mission fuel then landing.
Table9. 1 – Component weight Name Weight Distance to nose Moment Wing 28,859 lb 68 ft 1962407 lb-ft
Horizontal Stabilizer 1,868.66 lb 154 ft 287773.6 lb-ft Vertical Stabilizer 2,236.2 lb 142 ft 317545.5 lb-ft
Fuselage 30,549 lb 70 ft 2138439 lb-ft Nacelle 3,202.4 lb 52 ft 166525.9 lb-ft
Main Gear 15,694 lb 70 ft 1098580 lb-ft Nose Gear 1,896 lb 15 ft 28440 lb-ft
Engine 16,350 lb 52 ft 850304 lb-ft Fuel System 1,055.3 lb 40 ft 42213.16 lb-ft
Flight Control 4,320 lb 10 ft 43200.63 lb-ft Avionic 2,311 lb 10 ft 23110 lb-ft
APU 2,640 lb 145 ft 382800 lb-ft Furnishing 184 lb 15 ft 2764.125 lb-ft
Electrical System 2,149.5 75 ft 161211.9 lb-ft Total 113,315.66 lb 66.23 ft 7504896.16 lb-ft

44
Figure9. 1 – C.G diagram for refueling mission
Figure9. 2 – Empty weight C.G location

45
10.0 Landing Gear
The KC-X uses the tricycle fuselage mounted gears. The main gear with two struts,
four wheels per strut and two wheels for the nose gear strut. According to different
center gravity locations, the gear would bear different loads. The maximum load for
the main gear wheel is 39,270 lb when the C.G. location is at 68.25 feet from nose
and the maximum load for the nose gear is 28,900 lb when the C.G. location is at
65.75 feet from the nose. Table 10.1 shows the wheel information; selected wheel
for the main gear is type VII with maximum load of 41,700 lb in 44 inches diameter
and 18 inches wide. The wheel for the nose is new design type with maximum load
of 29,300 lb in 37 inches diameter and 13 inches wide.
Pn = Wtolm(lm+ln)
(10.1)
Pm = Wtolnns(lm+ln)
(10.2)
Figure10. 1 – Static load geometric for tricycle gears

46
Table10. 1 – Selected wheel data
Gear Type DoxW Maximum Load
Nose Gear New Design Type 37”x13” 29300 lb
Main Gear Type VII 44”x18” 41700 lb

47
11.0 Stability and Control Analysis
In order to find appropriate horizontal stabilizer are and vertical stabilizer area,
longitudinal stability and directional stability will be analyzed via longitudinal X-plot
and directional X-plot in this chapter.
11.1 Static Longitudinal Stability
The static longitudinal stability will be based on Roskam’s method. The longitudinal
X-plot is used to define the ideal horizontal stabilizer area. The GD method from
Roskam is used for the center gravity graph shown in Eq. (11.1).
Wh = 0.0034{(WTOnult)0.813(Sh)0.584 �bhtrh�0.033
�Clh�0.28
}0.915 (11.1)
A relationship between horizontal stabilizer area and weight is determined from Eq.
(11.1). Using weights from chapter 9, the relationship between the center gravity
location and horizontal stabilizer area can be found. To calculate the aerodynamic
center location, Roskam use Eq. (11.2) and Eq. (11.3) to determine the horizontal
stabilizer area and aerodynamic center relationship.
XacA =Xacwf+
CLαh�1−∂εh∂α �(
ShS )Xach
CLαwfF
(11.2)
F = 1 +CLαh�1−
∂εh∂α �(
ShS )
CLαwf (11.3)

48
Eq. (11.4) to Eq. (11.8) can be used to solve the wing-fuselage coefficient, wing lift
curve slope, Mach constant and Mach variable for the wing-fuselage lift curve slope.
CLαwf = kwfCLαw (11.4)
kwf = 1 + 0.025 �dfb� − 0.25(df
b)2 (11.5)
CLαw = 2πA
2+[�A2B2
k2�+4]2
(11.6)
β = �(1 − M2) (11.7)
k = (Clα)M2πβ
(11.8)
To calculate the horizontal lift curve slope, replace Eq. (11.6) aspect ratio and airfoil
lift curve slop values for the horizontal stabilizer. Eq. (11.9) to Eq. (11.12) are the
Roskam’s method to solve the aspect ratio coefficient, the taper ratio coefficient and
the horizontal stabilizer coefficient for the downwash gradient at the horizontal
stabilizer.
∂εh∂α
=4.44(KAKλKh�cosΛ1 4�
)1.19
�(1−M2) (11.9)
KA = 1A− 1
1+A1.7 (11.10)
Kλ = (10−3λ)7
(11.11)
Kh =1−
hhb
�(2lhb )
3 (11.12)

49
Figure 11.1 shows the result combine Eq. (11.2) to Eq. (11.12). Assume a 10% static
of margin which is commonly used for aircrafts, the required horizontal stabilizer
area from figure 11.1 shows 570 ft2. The initial design horizontal stabilizer area is
574.6 ft2. These two values are very close. The horizontal stabilizer area will not
change.
66
66.5
67
67.5
68
400 450 500 550 600 650 700
XcgXacA
Dist
ance
Fro
m T
ip o
f Nos
e (f
t)
Horizontal Stabilizer Area (ft2)
Longitudinal Stability X-Plot
Figure11. 1 – Longitudinal stability X-Plot
11.2 Static Directional Stability
A relationship between the yaw side-slip moment coefficient and the vertical
stabilizer area from Roskam were shown in Eq. (11.13):
Cnβ = Cnβwf + CLαV �SvS� (Xv
b) (11.13)
Assume the wing yaw side-slip coefficient be zero at high angle of attack, the

50
fuselage yaw side-slip coefficient is defined in Eq. (11.14):
Cnβf = −57.3KNKRl(SfslfSb
) (11.14)
The value of KN is empirical factor determined from figure 11.3 and KRl is a factor
depends on Reynold’s number from figure 11.4. Figure 11.2 shows the directional
stability X-plot result from Eq. (11.13) and Eq. (11.14). When the yaw side-slip
moment coefficient is equal to 0.001, the recommended vertical stabilizer area is 321
ft2. The initial design vertical stabilizer area is 413.47 ft2. The appropriate vertical
stabilizer area from this chapter is 77% of the initial design. The smaller vertical
stabilizer area number from t his chapter will be used in order to reduce the tail
weight.
-0.008
-0.004
0
0.004
0.008
280 290 300 310 320 330 340 350
Yaw
Sid
e-sli
p M
omen
t Coe
ffici
ent
Vertical Stabilizer Area (ft2)
Directional Stability X-Plot
Figure11.2 – Directional stability X-Plot

51
Figure11. 3 – Factor accounting for wing-fuselage interference with directional stability

52
Figure11. 4 – Effect of fuselage Reynolds number on wing fuselage directional
stability

53
12.0 Drag Polar Estimation
In section 5.1, an assumption of drag polar is made for the military aircraft
performance requirement. In this chapter, the drag polar will be calculated based on
Roskam’s method then compare to the drag assumed in chapter 5.
12.1 Zero Lift Drag
To calculate the zero lift drag, the wetted area is required to be calculated. The
wetted area is split into different components include: wing, empennage, fuselage
and nacelles. Eq. (12.1) shows the total wetted area of the airplane is the sum of
wetted area from different components.
Swet,tot = Swet,w + Swet,e + Swet,f + Swet,n (12.1)
Eq. (12.2) to Eq. (12.6) is used to calculate the wetted area for different components.
Eq. (12.2) will be specific used for the wing, horizontal stabilizer and vertical
stabilizer.
Swet,w = 2Sexp �1 + 0.25 �tc�r
(1+τλ)(1+λ) � (12.2)
The fuselage wetted area can be calculated using Eq. (12.3)
Swet,f = πDflf �1 − 2λf� �
23� (1 + 1
λf2� ) (12.3)
The nacelle includes fan cowling, gas generator and the plug. Eq. (12.4) to Eq. (12.6)
shows the wetted area of these components.
Swet,fan = lnDn �2 + 0.35 l1ln� + 0.8 l1Dh1
lnDn� + 1.15�1 − l1
ln� �DefDn� � (12.4)

54
Swet,gas = πlgDg
⎣⎢⎢⎡1 − �1
3��1 −
DegDg� �
⎩⎨
⎧1 − 0.18�
Dglg� �
53
⎭⎬
⎫
⎦⎥⎥⎤ (12.5)
Swet,plug = 0.7πlpDp (12.6)
Table 12.1 express the wetted area of these components and the total wetted area is
21,657.7 ft2. Back to Eq. (12.2), the equivalent parasite area is 82.5 ft2. The zero-lift
drag coefficient can be determined using Eq. (5.1) with the value for the parasite
area and the wing area, the zero-lift drag coefficient becomes 0.03.
Table12. 1 – Wetted area for different components
Fuselage 7417.37 ft2 Fan Cowling 469.48 ft2
Wing 9502.9 ft2 Gas Generator 144.14 ft2
Horizontal Stabilizer 1839 ft2 Plug 43.96 ft2
Vertical Stabilizer 2219.11 ft2 Total 21657.72 ft2
12.2 Drag Polar
Using the value of zero-lift drag coefficient, the overall drag coefficient can be
calculated from Eq. (12.7):
CD = CD0 + CL2
πeAR (12.7)
The drag polar and lift to drag ratio at various lift coefficient are shown in figure 12.1
and figure 12.2:

55
0
0.7
1.4
2.1
2.8
3.5
0 0.05 0.1 0.15 0.2 0.25 0.3 0.35 0.4
Lift C
Oeffi
cien
t (C L
)
Drag Coefficient (CD)
Drag Coefficient vs. Lift Coefficient
Figure12. 1 – CD vs. CL
0
0.7
1.4
2.1
2.8
3.5
0 2 4 6 8 10 12 14 16
Left
Coef
ficne
nt (C
L)
Lift to Drag Ratio (L/D)
Lift to drag Ratio vs. Lift Coefficient
Figure12. 2 – L/D vs. CL

56
Using the cruising lift coefficient of 0.59 and the Oswald efficient factor of 0.85, the
total drag coefficient during cruise is 0.043. Assume the lift coefficient stays constant,
the lift to drag ratio can be calculated:
LD
=CLCD
=0.59
0.043= 13.72
In chapter 5, the preliminary assumptions of the cruising lift to drag ratio is 14 and
the calculated lift to drag ratio is 13.72. From the sensitivity analysis data in section
4.3:
∂WTo
∂(LD)
= −8299 lb
The decrease in lift to drag ratio from 14 to 13.72, the takeoff weight needs to be
increased by 2324 lbs. This weight will be used for more advanced structural
protections for the fuel tank.

57
13.0 V-N Diagram
The generation of lift during high-G maneuvers typically accounts for the greatest
aero load on the airplane. At high speeds the maximum load factor is limited to the
chosen value based upon the expected use of the airplane. The V-N diagram, of the
airplane describes these basic flight performance limits. The recommended
maximum load factors from Roskam for military transporter are positive two and
negative one. A V-N diagram for the KC-X is shown in the figure 13.1. Vs is the 1G stall
speed at which the KC-X is controllable. Va is the design maneuvering speed at
maximum load factor. Vc is the design cruise speed and Vd is the design diving speed.
VS = � 2WSρCNmax
= � 2×1200.00237×0.923×1.1
= 315.81 ft/s=187.27 kt
Va = VS × √2 = 446.62 ft/s=264.84 kt
VC =803.41 ft/s= 476.42 kt
Vd = 1.25Vc = 1004.26 ft/s=595.52 kt

58
Velocity (knot)
1
2
-1
VA
D
VSVC
A
E
FH
Load factorV-N Diagram
Figure13. 1 – V-N diagram for the KC-X

59
14.0 Conclusion
East Asia is the heart of the world high technology includes the place of origin of rare
earth metals and the key position of development and OEM. Once the war start, the
global economic will be inflict heavily and the great depression might come out again.
The KC-X is tailored for the East Asia deployment with high cargo capacity and low
noise. In the future, the KC-X could assist the movement of marine troop from
Okinawa to Guam and also protect the environment for these beautiful islands from
military competitions. The government could consider the KC-X, the new stratotanker
of environment protector to reduce the environment impacts.

60
15.0 Reference
1. Federal Business Opportunities (https://www.fbo.gov/)
2. K. K. Ishimitsu, “Aerodynamic design and analysis of winglets,” AIAA paper
76-940, Sep, 1976.
3. N. Gold, K.D. Visser, “Aerodynamic effects of local dihedral on a raked wingtip,”
AIAA Paper 2002-0831
4. J.F. Halpert, D.H. Prescott, T.R. Yechout, M. Arndt, “Aerodynamic optimization
and evaluation of KC-135R winglets, raked wingtips, and a wingspan extension”
AIAA Aerospace Science Meeting, Jan, 2010.
5. P. Gerontakos, T. Lee, “Effects of winglet dihedral on a tip vortex,” Journal of
Aircraft, Vol. 43, No. 1, Jan-Feb 2006.
6. J.W. Slooff, W.B. Wolf, “Aerodynamic and aero-acoustic effects of flap tip
fences,” AIAA paper 2002-0848
7. Home of the USAF KC-10A Extender (http://www.kc-10.net/)
8. Roskam, Jan. Airplane Design. Lawrence, Kan.: DARcorporation, 2006. Print.
9. Raymer, Daniel P. Aircraft Design: a Conceptual Approach. 2nd ed. Reston, VA:
American Institute of Aeronautics and Astronautics, 2006. Print.
10. GE aviation (http://www.geae.com/)
11. Lifting line theory matlab code
(http://www.ae.gatech.edu/people/lsankar/AE2020/prandtl.m)
12. I. H. Abbott, A. E. Von Doenhoff, “Theory of wing sections,” Dover publications,
INC.

61
Appendix A. Front, Side and Top Views of the KC-X

62