design of a web visualization concept for the puma
TRANSCRIPT

Michael Steinberger, BSc
Design of a Web Visualization Concept
for the
PUMA Automation System
to achieve the university degree of
MASTER'S THESIS
Master's degree programme: Electrical Engineering
submitted to
Graz University of Technology
Univ.-Prof. Dipl.-Inf. Univ. Dr.rer.nat. Marcel Carsten Baunach
Institute of Technical Informatics
Diplom-Ingenieur
Supervisor
Dr. Ludwig Bloder, AVL List GmbH
Graz, December 2016


AFFIDAVIT
I declare that I have authored this thesis independently, that I have not used otherthan the declared sources/resources, and that I have explicitly indicated all materialwhich has been quoted either literally or by content from the sources used.The text document uploaded to TUGRAZonline is identical to the present master’sthesis.
Date Signature


Acknowledgments
Firstly, I would like to thank my thesis advisor Univ.-Prof. Dipl.-Inf. Univ. Dr.rer.nat.Marcel Carsten Baunach of the Institute of Technical Informatics at Technical Universityof Graz, for his comprehensive support of my master’s thesis.
In addition, I would also like to thank Ludwig Bloder as my supervisor during my workat AVL List GmbH, especially, for his highly valuable feedback during the entire workon my thesis. I would also like to thank Herwig Schelch, Werner Fuchs and MatthieuClauet, who, among other things, made it possible for me to write my thesis at the AVLList GmbH.
Furthermore, I would like to thank the team at AVL List GmbH for accepting me verywell in their team and supporting me whenever I had problems. Especially, I want toexpress my special thanks to Harald Rosenberger for our great discussions. In addition, Iwould like to thank Clemens Meinhart and his team for their support when I had problemson the server-side. Last but not least, I would like to thank Wolfgang Neubauer, whogave me insights in the current visualization of the PUMA automation system.
Michael SteinbergerGraz, December 2016


Abstract
The automation system AVL PUMA Open 2� is a software suite for powertrain develop-ment. The software suite offers a set of tools for parameterization, monitoring and thecontrol of powertrain testbeds. As an interface between the automation system and thetestbed operator, the desktop application PUMA Operator Interface (POI) provides allfunctionality of the automation system via a Graphical User Interface.
In the course of this master’s thesis, the desktop application POI was extended by a webvisualization. The current HTML5 standard and a state-of-the-art JavaScript frameworkwas used for the visualization. A Single-Page Application (SPA) hosts the visualizationand is structured by controls, which are implemented following the Web Componentsstandard.
An infrastructure was established to give the testbed operator the possibility to customizethe visualization in a form that maps best to the current testbed setup. Thereby, theinfrastructure supports the assignment of data retrieved from the automation system toa control during the runtime of the SPA. Furthermore, simple presentation logic can beimplemented by the testbed operator for example to indicate when a measurement valueof the automation system reached a limit. In addition, a library was established thatprovides a set of Web Components to allow a reuse within multiple web applications.
This work presents a realistic solution and a feasibility study of several applications fora web visualization, which can serve as a basis for a further development towards aremote monitoring of the testbed status. Performance tests present the processor loadand memory usage of the web-based solution to ensure no performance impacts of theweb visualization on the automation system.


Kurzfassung
Das Automatisierungssystem AVL PUMA Open 2� ist ein Software-Paket fur die Ent-wicklung von Antriebsstrangen und umfasst Software-Werkzeuge fur die Parametrierung,Uberwachung und Steuerung von Prufstanden in der Automobilindustrie. Im Form eineDesktop-Applikation ermoglicht das PUMA Operator Interface (POI) durch eine grafischeBenutzeroberflache die einfache Uberwachung und Steuerung des Automatisierungs-systems.
Im Zuge dieser Diplomarbeit wurde die Desktop-Applikation POI durch eine Web-Visualisierung erweitert. Dabei wurde der aktuelle HTML5 Standard und ein JavaScriptFramework verwendet. Die Visualisierung ist in eine Single-Page Webanwendung (SPA)eingebettet und wird durch Controls strukturiert, welche den Web Components Standardimplementieren.
Eine Infrastruktur wurde umgesetzt um den Prufstandsingenieur eine Anpassung derVisualisierung an den aktuellen Aufbau des Prufstands zu ermoglichen. Dabei wurde dieMoglichkeit geschaffen einen Messwert des Automatisierungssystems durch ein Controlanzeigen zu lassen und wahrend der Laufzeit der SPA diese Zuweisung dynamisch zuverandern. Weiters kann einfache Prasentationslogik implementieren werden um zumBeispiel das Erreichen des Limits eine Messgroße darzustellen. Zusatzlich wurde dieBasis einer Control-Bibliothek fur die Wiederverwendung in weiteren Webanwendungengeschaffen.
Diese Arbeit prasentiert eine realistische Losung und eine Machbarkeitsstudie von mehrerenAnwendungsfallen fur eine Web-Visualisierung, welche als Basis fur zukunftige Ent-wicklungen in Richtung eine Fernwartung von Prufstanden dienen kann. Performance-Messungen stellen die Prozessorlast und den Speicherbedarf der Web-Visualisierung dar,um sicherzustellen dass die Web-Visualisierung keinen Einfluss auf das Automatisierungs-system hat.


Contents
List of Abbreviations iii
1 Introduction 11.1 The PUMA Automation System . . . . . . . . . . . . . . . . . . . . 11.2 Graphical User Interface of the PUMA Automation System . . . . . . . 31.3 Web Interface for PUMA Resources . . . . . . . . . . . . . . . . . . 51.4 Extending the Visualization of the PUMA Automation System . . . . . 6
2 Related Concepts for a Web Visualization 112.1 Single-Page Application Frameworks as a Basis for Web Development . . 112.2 Change Detection in Single-Page Applications . . . . . . . . . . . . . 272.3 Dependency Injection in Single-Page Application Frameworks . . . . . . 34
3 Infrastructure for the Web Visualization 393.1 Structure of a Web Window . . . . . . . . . . . . . . . . . . . . . . 393.2 Startup Process of a Web Window . . . . . . . . . . . . . . . . . . . 433.3 The Building Blocks of the Infrastructure . . . . . . . . . . . . . . . . 493.4 Data Source Assignment . . . . . . . . . . . . . . . . . . . . . . . . 553.5 Custom Presentation Logic . . . . . . . . . . . . . . . . . . . . . . . 61
4 Visualization Library for Web Applications 684.1 Structure of the Library . . . . . . . . . . . . . . . . . . . . . . . . 684.2 The Alphanumeric Control as a Model Example for a Control of the
Visualization Library . . . . . . . . . . . . . . . . . . . . . . . . . . 704.3 The Xt-Control as an Implementation of a Multi-Series Line Chart . . . 71
5 Performance Evaluation 735.1 Evaluation Setup . . . . . . . . . . . . . . . . . . . . . . . . . . . . 735.2 Alphanumeric Test Cases . . . . . . . . . . . . . . . . . . . . . . . . 755.3 Framework Evaluation . . . . . . . . . . . . . . . . . . . . . . . . . 845.4 Hardware Rendering . . . . . . . . . . . . . . . . . . . . . . . . . . 865.5 Xt-Control Test Cases . . . . . . . . . . . . . . . . . . . . . . . . . 87
i

Contents
5.6 Test Cases on a Mobile Device . . . . . . . . . . . . . . . . . . . . . 88
6 Conclusion 94
7 Future Prospects of the Web Visualization 97
Bibliography 99
ii

List of Abbreviations
ADE Advanced Design Editor
AJAX Asynchronous JavaScript and XML
API Application Programming Interface
ASAccessServer Automation System Access Server
AVL Anstalt fur Verbrennungskraftmaschinen List
Blob Binary Large Object
CAN Controller Area Network
CEF Chromium Embedded Framework
COM Component Object Model
CPU Central Processing Unit
CSS Cascading Style Sheets
DIP Dependency Inversion Principle
DOM Document Object Model
DSL Domain-Specific Language
ES6 ECMAScript 2015 Version 6
GPU Graphics Processing Unit
GUI Graphical User Interface
HTML Hypertext Markup Language
HTTP Hypertext Transfer Protocol
IE Internet Explorer
iii

List of Abbreviations
IoC Inversion of Control
IPC Inter-Process Communication
JSON JavaScript Object Notation
POI PUMA Operator Interface
LCIE Loosely-Coupled Internet Explorer
MFC Microsoft Foundation Class
MVC Model-View-Controller
MVP Model-View-Presenter
MVVM Model-View-ViewModel
MVW Model-View-Whatelse
OOP Object-Oriented Programming
RAM Random-Access Memory
REST Representational State Transfer
RIA Rich Internet Application
RxJS Reactive Extensions for JavaScript
SoC Separation of Concerns
SPA Single-Page Application
SVG Scalable Vector Graphics
UI User Interface
URI Uniform Resource Identifier
XML Extensible Markup Language
WPF Windows Presentation Foundation
iv

1 Introduction
1.1 The PUMA Automation System
Figure 1.1: Testbed Types used during the Vehicle Development Cycle described by the V-Model,based on Paulweber and Lebert (2014)
As presented in Figure 1.1, the development cycle in the automotive industry canbe described by the V-Model. In the beginning of the system design and simulationphase, the overall requirements of the vehicle are broken down into requirements of thecomponents of the vehicle, which form the basis of the subsequent design phase. Afterthe design process, all design decisions are evaluated in the system simulation phase bySoftware-in-the-Loop (SiL) or Model-in-the-Loop (MiL) systems. Through the increasedcomplexity of state-of-the-art vehicles caused by new powertrain concepts such as hybridpowertrains or e-mobility with reduced CO2 emissions, the influence of every designdecision on the overall system needs to be evaluated early in the development process.For this reason, every design phase has its counterpart in form of a testbed type in thesystem integration and validation process along the right arm of the V-model and thus,enables to test every component in parallel to the development of other components.
1

1 Introduction
Thereby, depending on the testbed type, the missing components of the system need tobe simulated, for example for a powertrain testbed the wheels, the chassis of the car andthe maneuvers, which would otherwise be carried out by the test driver. Because of theincreased system complexity trough the interaction between intelligent sub-systems suchas driver assistance systems,as stated in Paulweber and Lebert (2014), the test cyclesshould be based on real load profiles instead of synthetical load profiles commonly usedin SiL or MiL systems.
Figure 1.2: Overview of a Combustion Engine Testbed, based on Fang and Lahdelma (2016)
An exemplary setup of an engine testbed for the development of a combustion engineis shown in Figure 1.2. In such a setup, a dynamometer acts as a controllable load forthe engine under test. For driving a specific test cycle, the automation system, suchas the AVL PUMA Open 2�, sends Controller Area Network (CAN) messages, whichdefine the current torque and speed to the control cabinet. The control cabinet bringsthe dynamometer in the specified state and returns the current torque and speed valuesto close the control loop. During the execution of the test cycle, measure systems reportthe fuel consumption or intake air mass flow rate of the engine to the automation systemvia the CAN bus. In addition, control systems regulate important parameters such as thetemperature of the coolant.
The software suite AVL PUMA Open 2� offers tools for the parameterization, monitoringand the control of all testbed types as shown in Figure 1.1. By the use of parameter sets,
2

1 Introduction
the devices, for example the dynamometer, connected at the testbed can be configured.Parameter sets define a mapping between the measure or control values of the testbedand unique channels, which are known in the automation system, for example the actualrotational speed of the dynamometer is mapped to the channel act dyno speed, whichcan be accessed inside the automation system by its unique identifier. A graphical testrun editor facilitates the creation of test cycles and monitors the current status of thetestbed during the execution of a test run. In addition, the automation system allows themanual operation of the testbed (AVL List GmbH, 2016a; AVL List GmbH, 2016b).
1.2 Graphical User Interface of the PUMAAutomation System
Figure 1.3: Visualization of the Testbed Status within the PUMA Operator Interface
As an interface between the automation system and the testbed operator, the softwaresuite offers the PUMA Operator Interface (POI). The POI desktop application provides
3

1 Introduction
all functionality of the automation system via a Graphical User Interface (GUI). Anexemplary visualization of the POI is shown in Figure 1.3. The POI is structured intomultiple windows, which host controls visualizing the testbed status. A testbed operatorcan choose between a predefined set of windows to display the current status of thetestbed channels. During the execution of a test run, the operator can change the assignedchannel of a control through a browser dialog, which opens with a double-click on thecontrol. In addition, the testbed operator can bring the POI in a specific DESIGN mode.In this mode, the layout of the window can be changed, custom windows can be created,and controls out of a set can be added to the window. In this way, every testbed operatorcan define a custom visualization, which suits best the current test run and the realtestbed setup. In Figure 1.3, a predefined window is used to visualize channels describingthe testbed status such as the current torque and speed of the dynamometer.
Figure 1.4: Unit Conversion and Limit Monitoring with the Advanced Design Editor
Furthermore, the Advanced Design Editor (ADE) can be opened for every control in thewindow. Inside the ADE, every visual element or event of a control, for example the textfield or the click event of an alphanumeric control, is hereby accessible from a blockwith multiple in- and outputs (see Figure 1.4). To bind channel properties to the control,a data source block can be inserted and its properties can be routed in a flow-basedprogramming manner to the inputs of the control, for example the channel name tothe text field of an alphanumeric control. Figure 1.4 shows also the possibility to insertfurther functional blocks between channel properties and control inputs to implementcustom presentation logic, for example to monitor minimum and maximum values of achannel, that is limit monitoring.
4

1 Introduction
1.3 Web Interface for PUMA Resources
The ASAccessServer is implemented as a Representational State Transfer (REST) in-terface for a web-based access of PUMA resources. Fulfilling the requirements of theREST architectural style stated in Fielding (2000, Chapter 5), the Automation SystemAccess Server (ASAccessServer) acts stateless and returns the requested PUMA resourceindependently of preceding Hypertext Transfer Protocol (HTTP) requests.
In Figure 1.5, the data structure inside the PUMA automation system and the relationto the data sources provided by the ASAccessServer are presented. Hereby, the followingobjects are known inside the PUMA automation system:
� Channel: A channel reflects a measure or control value of the automation system,for example the current speed of the dynamometer.
� Quantity: A quantity maps to a channel of the automation system and extendsthe data provided from the channel with additional meta data.
� Activation Object: An activation object can be used to trigger events on theautomation system, for example to start the measurement of a specific channel.
Figure 1.5: Data Structure of the Automation System Access Server
The REST interface of the ASAccessServer abstracts both channel and quantity resourcesby the data source type Signal. In addition, the activation object can be accessed fromthe interface as a Function data source. For a more efficient retrieval of channel orquantity values with a higher update rate up to 10kHz, an additional data source, the
5

1 Introduction
XtSignal will be implemented. The XtSignal data source would return, in contrast to thesingle value of a Signal data source, a vector of values for each HTTP request.
Following the REST architectural pattern, each data source type, for example a Signaldata source, can be obtained as a server resource by using either a GET or POST HTTPverb with an Uniform Resource Identifier (URI) (Pautasso, Zimmermann, and Leymann,2008). The complete Application Programming Interface (API) is defined in a TypeScriptdefinition file for data format consistency between the ASAccessServer and any clientwhich draws the PUMA resources from this API (Microsoft, 2016b).
1.4 Extending the Visualization of the PUMAAutomation System
1.4.1 Motivation for a Web Visualization
This work presents a concept for a web visualization for the PUMA automation system.The following points outline the need of an extension of the current visualization with aweb visualization.
Remote monitoring: A common requirement of the visualization of the PUMAautomation system is to diagnose the actual state of the testbed from a remote location.The current visualization in the POI only supports to monitor the actual PUMA statefrom a remote location through a Virtual Network Computing (VNC) connection to thetestbed computer. The necessary VNC connection complicates, especially on a mobiledevice, a quick overview of the PUMA state or a parallel monitoring of several testbeds.In addition, a remote support in case of a software error can currently only achievedthrough the tedious analysis of a large number of log files transmitted in a single archivefile.
The introduction of a web visualization can simplify the remote monitoring of theactual state of the testbed. Through the established REST interface provided by theASAccessServer, the data from a testbed can be accessed easily from any remote locationand presented by the web visualization. In contrast to the current visualization, no extrasoftware, such as the PUMA Operator Interface, needs to be installed on the device, whichenables the remote monitoring. Furthermore, with a web visualization no restrictions existanymore in terms of installed operating system or hardware equipment of the device.
6

1 Introduction
In addition, the remote diagnosis can ease the support in case of a software error andthe parallel tracking of the state of several testbeds. Especially for large test fields, therequirement exists to monitor the health and current test duration of all testbeds of thetest field from a remote location or on a mobile device. In case of an error in one of thetestbeds, the testbed operator can be informed instantly through the web visualizationand hence, costly idle times of the testbed can be avoided. Furthermore, it is oftennecessary to monitor the current testbed status without disturbing the testbed engineer,who works on the testbed using the POI. Here, the web visualization can enable theparallel monitoring of the testbed state and it can provide a different representation ofthe testbed showing other control or measurement values as defined in the visualizationlayout of the POI.
State-of-the-art visualization: In addition to the requirement for remote monitor-ing, an increasing demand of the customer exists for a state-of-the-art visualization ofthe actual testbed state. The current visualization, that is the POI, was developed usingthe Microsoft Foundation Class (MFC) library, which has already experienced with theWindows Forms and Windows Presentation Foundation (WPF) libraries two successorsfor creating user interfaces for the Windows operating system using the .NET framework.In contrast to the MFC library, especially the latest WPF library allows an alignment ofthe User Interface (UI) to current styling standards, such as introduced with the Microsoftdesign language, and to a styling which requires more advanced criteria to meet thecorporate identity. The introduction of a web visualization can offer the possibility tostyle the visualization towards a state-of-the-art UI and a consistent user experience forall applications offered by the AVL List GmbH.
Extensibility: Notwithstanding the above, the integration of additional controls inthe POI is difficult and requires expert knowledge, which is currently only possessed bya single developer in the AVL List GmbH. Furthermore, software developers with therequired C++ background to extend the current visualization are increasingly difficult tofind. The introduction of a web visualization based on the latest HTML5 technology forcreating user interfaces can solve this problem. The development of a web visualization iswell documented in the web and developers are easier to find for JavaScript developmentas for more complex languages as C++. Furthermore, a large number of frameworksand libraries exist for creating web visualizations, which can be used to decrease thedevelopment effort and costs.
7

1 Introduction
1.4.2 Applications of the Web Visualization
Figure 1.6: Applications of the Web Visualization
For the above mentioned reasons, the POI visualization introduced in Section 1.2 shallbe extended by a web-based solution. This solution will cover two applications: (i) aninternal and (ii) an external client. For both clients, the technology to describe the view,that is the content of the web page, can be restricted to the current HTML5 standard.
The internal client shall act as an extension of the current visualization inside POI. Forthis purpose, a web browser will be hosted inside the POI desktop application to displaythe current status of the testbed using web technology. The existing REST interface ofthe ASAccessServer will give the internal client full access to all resources of the testbedsuch as the current channel values (see Figure 1.6). The external client will monitor thestatus of the testbed outside the POI. The scope of application shall include a simpletestbed status overview showing the state of the automation system and additionalinformation such as the currently loaded parameter sets. A possible case of applicationcould be to monitor from a remote location via a mobile device the current state of a testrun or the total time of the test run execution. The same technology shall be used as forthe internal client. For the external client, a restricted interface to the ASAccessServerwill be used (depicted as a dashed line in Figure 1.6).
8

1 Introduction
1.4.3 Requirements of the Web Visualization
Infrastructure for the Web Visualization
An infrastructure needs to be established to fulfill the requirements of the web visualization.The infrastructure should realize a seamless integration of a web visualization inside thePOI. For this reason, the web visualization shall be organized in independent windows,which hold all relevant information (for example the list of needed channels) and shall behosted by the ASAccessServer. The controls embedded inside a window shall be part of acommon library. The resources needed for the execution of the infrastructure (JavaScriptfiles, HTML files, etc.) shall be obtained from one common place to guarantee that theinfrastructure and common library can be updated without the adaption of an existingwindow.
Similar to the current visualization, the infrastructure for the web visualization needs tosupport the assignment of channels of the automation system to a control. During theruntime of the visualization, the infrastructure must allow to change the assigned channelof a control via a browser dialog and to persist this change across sessions. Through theexisting REST interface of the ASAccessServer, the actual state of the channels shall beperiodically retrieved. The infrastructure shall manage the efficient retrieval of neededchannels and avoid duplicate HTTP requests if the same channel is assigned to multiplecontrols. The retrieval of the ASAccessServer resources shall be encapsulated inside anseparate module in the infrastructure to hide the used transport protocol, that is HTTP,and to simplify a future replacement of the protocol, for example by the WebSocketprotocol (Fette and Melnikov, 2011).
A possibility to add presentation logic by the testbed operator, as currently implementedin the ADE, shall be evaluated. In contrast to the ADE, the presentation logic shall beimplemented with a code snippet written in a syntax similar to JavaScript. The codesnippet shall be executed without any involvement of the ASAccessServer. Furthermore,the infrastructure should support to insert existing windows inside a new one. The overallimpact of the web visualization on the automation system in terms of processor loadand memory usage shall be evaluated on a regular basis during the development of theinfrastructure.
Visualization Library for Web Applications
A concept for a visualization library for web applications, that is the internal and externalclient presented in Figure 1.6, shall be presented. A first foundation block of the library
9

1 Introduction
should consist of several controls, which can run independently or within the infrastructurefor the web visualization inside the POI.
Each control of the library must follow an interface to enable the assignment of multiplechannels to an input or output of the control, respectively. The concept of the libraryshould support to include third-party controls inside the library and to add a wrapperfor each control to unify the interface of all controls. The library should support alsointernationalization, that is to translate texts depending on the current environment.
10

2 Related Concepts for a WebVisualization
2.1 Single-Page Application Frameworks as aBasis for Web Development
2.1.1 Introduction to Web Application Models
In the classical web application model presented in Garrett (2005), the major part ofthe logic runs on the server. The web browser, that is the client, receives as a responseto each user action one complete Hypertext Markup Language (HTML) file describingthe current view and additional Cascading Style Sheets (CSS) files for the styling ofthe web application. A client that implements the classical web application model isdescribed in literature also as a thin client (Shklar and Rosen, 2009). As can be seen inFigure 2.1, any user interaction is first processed inside the server in an UI generationblock. Then, the necessary data to generate the view is obtained from services. Finally,the view described by a HTML file and the CSS file are sent as a response to the UI ofthe web browser. Thereby, a major drawback is that the user needs to wait after eachaction for a response of the server, which is potentially delayed by the network latencyand the processing of the user interaction in the UI generation block (Morales-Chaparroet al., 2007). Furthermore, for every received HTML file from the server the entire webpage must be reloaded and redrawn in the UI of the web browser and causes in this waya chopped user interaction.
For modern web applications, the Asynchronous JavaScript and XML (AJAX) webapplication model describes a method to utilize the JavaScript engine as a fundamentalelement of all modern web browsers, and to modify asynchronously only parts of theUI without an entire page reload (Flanagan, 2011). In this way, a more responsive webapplication also known as a Rich Internet Application (RIA) can be developed that mimicthe user experience known from desktop applications (Rossi et al., 2008, Chapter 2). The
11

2 Related Concepts for a Web Visualization
AJAX engine as a pendant to the UI generation block in the classical web applicationmodel is moved to the client and retrieves for each user action only parts of the viewdefinition in form of a XML file.
Figure 2.1: The Evolution of Web Application Models, adapted from Petitit and Tricot (2014)
A dominant type of web application that extend the AJAX web application model isa Single-Page Application (SPA). During the entire lifetime of a SPA, no page reloadis needed and all necessary resources are retrieved in a single page load (Mikowskiand Powell, 2013). The content of a SPA, that is the view and all application logic, isdescribed in one HTML file retrieved during the initial page load, whereby in state-of-the-art web applications techniques exist to accelerate the initial page loading, for exampleasynchronous or lazy script loading (Barker, 2012). Single-page applications are oftenimplemented by following a derivation of the architectural Model-View-Controller (MVC)pattern. All derivation of the MVC pattern are often summarized by the term Model-View-Whatelse (MVW) pattern (see also Section 2.1.2). As can be seen in Figure 2.1, in a SPAthe simple AJAX engine is replaced by a more complex MVW engine, which processesthe user actions and generates the view out of the data previously retrieved from server.Nowadays, the XML file format used in early implementations of the AJAX model, isreplaced by the JavaScript Object Notation (JSON) file format. Because of the factthat the JSON file format is based on the specification of the JavaScript programming
12

2 Related Concepts for a Web Visualization
language, JSON data can be easily converted to a JavaScript object and hence, simplifiesthe process to parse the received data in the MVW engine. In contrast to the classicalweb application model, in SPA applications the server is principally responsible to hostall relevant resources for the web application, such as JavaScript, HTML and CSS files,and to respond to data requests of the client.
2.1.2 Patterns in Single-Page Applications
For a modern SPA, the application logic, that is for example the processing of the useraction and the retrieval of data from the server, becomes increasingly complex and theasynchronous behavior inherited from the AJAX model makes the organization of thelogic difficult. For this reason, several patterns evolved for general-purpose applicationswere adapted to structure a web application in favor to make the application betterorganized and more maintenance-friendly.
The Model-View-Controller Pattern
The MVC architectural pattern was first used on server-side mentioned in Freeman(2014), however, can also be exploited to fulfill the Separation of Concerns (SoC) designprinciple in complex client-side web applications (Microsoft Patterns and Practices Team,2009, Chapter 2).
Figure 2.2: Components of the Model-View-Controller Pattern, adapted from Eckstein, Loy, andWood (1998) and Elliott (2014)
As presented in Figure 2.2, the MVC pattern, introduced in Krasner and Pope (1988), isseparated into three main building blocks to decouple the data model from the businessand presentation logic. The three components can be described as follows:
13

2 Related Concepts for a Web Visualization
� Model: All data which is retrieved from the server is bundled and managed by theModel component and encapsulates, thereby, how the data is retrieved from theserver (Osmani, 2012, Chapter 11). The Model component is often implementedby an object that reveals also available operations on the data specific to thecurrent domain of the application, denoted in Evans (2014) as Domain Model.
� View: The View component is the visual representation of the model and getsupdated whenever the state of the model changes. Hereby, the view can also imple-ment the Observer pattern to update itself when the model has changed (Gammaet al., 1995). Furthermore, simple presentation logic resides in the view, for exampleto change the color of an element in the view.
� Controller: The Controller processes all UI events triggered by the View component,for example the click event of a button defined in the view, and updates furthermorethe model. An important point is here that the Controller is independent of theused technology for the view presentation, for example in a SPA the click eventhandler is not allowed to access directly the Document Object Model (DOM).
The Model-View-Presenter and Model-View-ViewModel Pattern
As already mentioned in Section 2.1.1, several architectural patterns were derived fromthe MVC pattern and are summarized by the MV* or MVW pattern. The two mostwide-spread adaptations of the MVC pattern for web applications are the Model-View-Presenter (MVP) and the Model-View-ViewModel (MVVM) pattern.
In the MVP pattern (see Figure 2.3), the Controller component is replaced by a Presenter,which acts as a layer between the model and the view. In opposite to the MVC pattern,where the view is updated directly by the model, the Presenter component incorporatesthe entire logic to adapt the data of the model for the view and to handle all UI eventstriggered by the view. Through the simplicity of the View component, which provides aninterface to the Presenter, the view is also referred to as a Passive View (Fowler, 2002).By decoupling the view from the model and the relocation of the presentation logic fromthe view to the Presenter, MVP applications become better testable by unit-tests becausethe Presenter can be used as a complete mock of the UI (Osmani, 2012). Furthermore,the presentation logic inside the Presenter can be reused across applications independentof the application specific implementation of the view.
14

2 Related Concepts for a Web Visualization
Figure 2.3: Variations of the Model-View-Controller Pattern, adapted from Osmani (2012)
The separation between the view and model implemented in the MVP pattern comeswith an additional implementation overhead to mediate between the view and the modeland further, to update the Passive View through its interface. The MVVM patterncan be seen as a combination of the MVC and MVP pattern and tries to simplifythe development process by replacing the Controller or Presenter with the ViewModelcomponent. Thereby, the ViewModel acts as a subset of the Model component and addsadditional functionality to the view for manipulating the model. In contrast to the PassiveView of the MVP pattern, the MVVM view knows about the ViewModel and is activelybound to the ViewModel via two-way data binding implemented mostly by the Observerpattern. Through the two-way data binding the ViewModel is even easier to unit-testthan the event-driven implementation of the MVP Presenter.
As described in Boduch (2016), web applications based on the architectural MVW patterncan suffer from the following problems:
� Complexity: The SoC principle introduced by the MVW pattern can cause unnec-essary complexity and can lead to reduced productivity when several componentssuch as the model and the view needs to be modified when a simple feature isadded.
� Scalability: Web applications following the MVW pattern consist usually of multi-ple views each visualizing the data stored in models. Furthermore, the applicationstate can be distributed in several models, which are all modified by differentinstances, for example Controller components. In this way the application can
15

2 Related Concepts for a Web Visualization
easily grow as such that dependencies between the MVW building blocks canbecome hardly traceable and new features are difficult to implement.
� Cascading Updates: When a web application grows as highlighted in the abovementioned point Scalability, an user action in a view can update several models atthe same time and vice versa, the models can trigger the views to update. Thismulti-directional data flow can cause cascading updates through several modelsand Views and lead to an unpredictable data flow.
The Flux Pattern
The Flux architectural pattern tries to overcome the mentioned problems of the MVWpattern by introducing a Dispatcher component that manages the application statechanges in form of an Action entity and replaces in this way, the multi-directional with astrict uni-directional data flow (Gackenheimer, 2015, Chapter 5).
Figure 2.4: Components of the Flux Pattern, adapted from Facebook (2016a)
The following components shown in Figure 2.4 form the Flux pattern (Facebook,2016a):
Action – Representing a Model Change: Actions are the starting points of theFlux architectural pattern and describe a single functionality of the web application, forexample, to add an item to a list displayed by the view. In addition to the type of anAction described by a unique string, an Action holds the new data as payload. An Actioncan be either triggered by a server-side event, for example during the initialization of theweb application, or by an user action in the view.
16

2 Related Concepts for a Web Visualization
Dispatcher – Handling any Model Change: The Dispatcher acts as a centralhub in the application and thus, every change must go through the Dispatcher via anAction. Every Action is forwarded to a Store by the Dispatcher, for example the content ofthe new list item is forwarded to a ListStore holding the state all list items. Furthermore,the Dispatcher can manage dependencies between Stores, for example when additionalcontent such as an image from another Store must be added first to every list item. Inthis case, the Dispatcher first requests the image for example from a ImageStore holdingall images of the application and then forwards the appended content to the ListStore.
Store – Holding all models: The Store component is the single place where thecurrent state of the Flux application is persisted and can be compared to the model ofthe MVW pattern. Every Store registers a callback to the Dispatcher that is executedwhen an Action is dispatched to the Store.
View – Displays the Model: In the Flux pattern, the view is separated into twocomponents: (i) a simple View component that follows the Web Components standarddescribed in Overson and Strimpel (2015), and (ii) a Controller-View, which acts as aparent of several View components. The Controller-View listens similar to the Presenterin the MVP pattern, for updates in the relevant Store and forces any hierarchical nestedView component to update via a defined interface. As mentioned above, an user actionemitted in a View component is redirected first to its Controller-View parent and is thenforwarded as an Action to the Dispatcher. The View component can be seen as a PassiveView of the MVP pattern, which knows nothing about the Domain-Model retrieved fromthe Store component and can be reused across applications.
By the introduction of the uni-directional data flow and the management of all useractions by one instance the Dispatcher, the mentioned problem of cascading updates inthe MVW pattern can be solved by the Flux pattern. Furthermore, new features can beeasier implemented through an additional Store, Action, View component, whereby, onlythe Dispatcher component must be adapted when a component was added.
2.1.3 Features of Single-Page Application Frameworks
As stated in Fain, Rasputnis, and Tartakovsky (2014) and Kuuskeri (2011), especiallyfor large-scale web applications the general limitations of the JavaScript programminglanguage will quickly become obvious and hence, the use of a SPA framework can simplifythe development of a reliable and well-tested web application. Furthermore, the use of a
17
2 Related Concepts for a Web Visualization
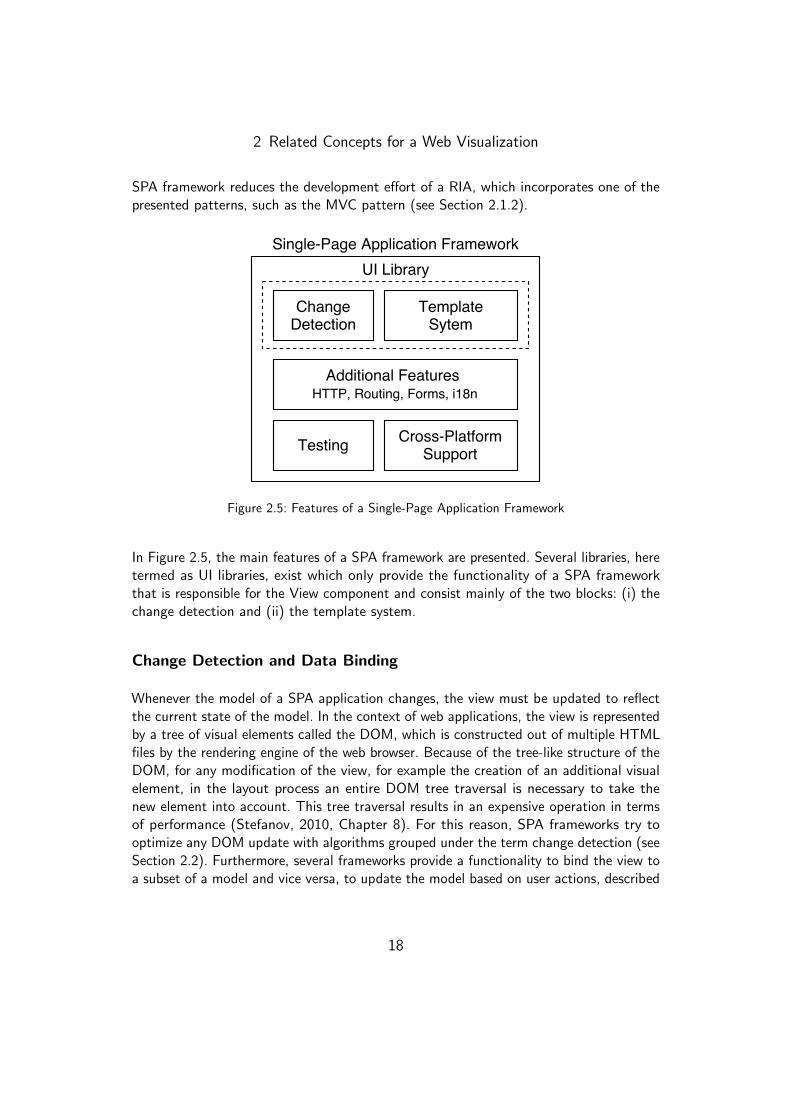
SPA framework reduces the development effort of a RIA, which incorporates one of thepresented patterns, such as the MVC pattern (see Section 2.1.2).
Figure 2.5: Features of a Single-Page Application Framework
In Figure 2.5, the main features of a SPA framework are presented. Several libraries, heretermed as UI libraries, exist which only provide the functionality of a SPA frameworkthat is responsible for the View component and consist mainly of the two blocks: (i) thechange detection and (ii) the template system.
Change Detection and Data Binding
Whenever the model of a SPA application changes, the view must be updated to reflectthe current state of the model. In the context of web applications, the view is representedby a tree of visual elements called the DOM, which is constructed out of multiple HTMLfiles by the rendering engine of the web browser. Because of the tree-like structure of theDOM, for any modification of the view, for example the creation of an additional visualelement, in the layout process an entire DOM tree traversal is necessary to take thenew element into account. This tree traversal results in an expensive operation in termsof performance (Stefanov, 2010, Chapter 8). For this reason, SPA frameworks try tooptimize any DOM update with algorithms grouped under the term change detection (seeSection 2.2). Furthermore, several frameworks provide a functionality to bind the view toa subset of a model and vice versa, to update the model based on user actions, described
18

2 Related Concepts for a Web Visualization
in Gechev (2016a) as Data Binding, and facilitate in this way the implementation of theMVVM pattern.
Template System and Reusable Components
As described in the above section, several SPA frameworks offer the functionality to letthe framework handle the update of the DOM when the model changes and to reactwhen the user interacts with view. This Data Binding functionality is often provided by aDomain-Specific Language (DSL) which exchanges or extends the HTML, that usuallydescribes the view (Gechev, 2016a). Hereby, the DSL utilizes a template engine, wherethe properties of the model can be accessed in the view definition by a specified syntax,for example by double curly braces (Mustach Team, 2016). In addition, the DSL providesspecial constructs defined as HTML attributes, to implement simple presentation logicinside the view definition, for example to hide a DOM element depending of the state ofa model property or to show multiple DOM elements sourced from a collection in themodel.
Furthermore, SPA frameworks give the possibility to structure the view of a web applicationinto reusable components and thus, help to improve the maintainability of every SPA.Moreover, the components often provide the possibility to define custom presentationlogic and fulfill parts of the Web Components standard. For an optimized user experience,for example to reduce the initial page load time, the used SPA framework exposes inmany cases the framework-specific life-cycle-hooks of the View component. Thereby, athird-party JavaScript library can be loaded asynchronously in the life-cycle-hook thatmaps to the initialization of the View component, which is the consumer of the library,to reduce the initial page load time.
Cross-Platform Support
In general a SPA is used across multiple platforms or devices, which leads to therequirement to adapt the view of the web application to the current available screensize and its functionality to the platform-specific operating system. Several solutionsexist in combination with a SPA framework to reuse the same code base across multipleplatforms, that is on desktop and mobile devices. In this context, the term Renderer isused to describe the part of the SPA framework which is responsible to draw the actualview, for example the DOMRenderer uses the DOM API to render the view of the SPA inthe web browser (Jbanov and Bosch, 2016; Hors et al., 2000). Through the encapsulation
19

2 Related Concepts for a Web Visualization
of the Renderer in a separate component, it is possible to exchange the Renderer by acustom Renderer specific to the current environment.
Figure 2.6: Possibilities to run a Web Application on a Mobile Device, adapted from Looper(2015)
In contrast to run a web application inside a web browser (see Figure 2.6), a SPA canbe wrapped in a native application by hosting it into a Web View, which is a nativecontrol that can load and visualize web content (Looper, 2015). For a performancecompared to native applications, SPA frameworks offer a bridge to access the native UIand hardware of the device. This bridge depicted in Figure 2.6 acts as a layer between theJavaScript engine, where the actual logic of SPA is interpreted, and the device-specificAPI. Furthermore, it offers a custom implementation of the Renderer to draw the viewof the SPA by native UI components. In this way, the web application appears in termsof performance and styling similar to a native application, whereby the same code baseis used as when the application is hosted in the web browser. Furthermore, the fullhardware can be accessed by the web application, such as the camera or the compass ofthe device.
Testing and Debugging
The JavaScript language is interpreted and compiled through Just-In-Time (JIT) compi-lation during runtime and hence, no possibility exists to detect potential errors before
20

2 Related Concepts for a Web Visualization
the deployment of the web application. Furthermore, a state-of-art web applicationincorporates a large fraction of open-source JavaScript packages, which can vary widelybetween their versions and can compromise the functionality of the web application. Forthis reasons, it is import that the functionality of a SPA is completely covered by testsand all tests are run on a regular basis, for example after new features were added orpackages were updated.
Many SPA frameworks support this established practice, known also as Test-DrivenDevelopment described in Fain, Rasputnis, and Tartakovsky (2014, Chapter 7), and offerframework-specific test utilities to facilitate the testing of the SPA. Every test setupusually consists of the following parts:
� Test Framework: With a test framework, tests can be written and combinedin a test suite. Following the Behaviour-Driven Development process definedin (Craven, 2016a) and (Craven, 2016b), the tests are written as user stories in abusiness-specific language.
� Test Utility: Especially for Unit-Testing, SPA frameworks usually offer helperfunctions packed in a test utility to initialize framework-specific components in atest environment outside of the web browser.
� Test Runner: A test runner allows to repeat a test suite defined in the testframework multiple times across several web browsers. Furthermore, it can beused to automate the test execution, for example whenever a file changes, and tovisualize the test results via the command line.
� Assertion Library: An assertion library enables the test framework to checkif the test result equals the specified value in the test. Thereby, the devel-oper can choose between several assertion syntaxes, such as value.should.be,expect(value).to.be, or similar as in the C language:assert(testValue == value).
� Mocking Framework: When testing a component independent of the web ap-plication, all possible dependencies of the component need to be brought into aspecific state. Furthermore, some dependencies might not be available in the testenvironment, such as the communication to the server through HTTP. For thisreasons, a mocking framework provides methods to replace specific functions or acomplete object, namely Stubs or Mocks, of the web application when testing thecomponent (Fowler, 2007). Furthermore, the execution of a specific function canbe observed by using a Spy, for example the applied arguments or the number ofcalls of the function.
� Web Browser Automation: A common requirement is to test a web applicationin parallel across multiple browsers. To ease the life of a developer and to haveconsistent test cases especially for Integration-Testing, a solution exists to control
21

2 Related Concepts for a Web Visualization
web browsers through an WebDriver API. Thereby, the WebDriver API abstractsthe diversity of the the built-in automation support of every web browser.
Additionally, most of the SPA frameworks come with a browser extension for the GoogleChrome and Firefox web browser to debug the running web application.
Additional Features
SPA frameworks usually include libraries, which cover frequently needed functionality forexample a wrapper of the XMLHTTPRequest object, which is supported in every webbrowser, for HTTP requests or for internationalization (i18n) to translate texts on theclient-side depending on the current environment. Furthermore, SPA frameworks supportthe navigation through the web application denoted as client-side routing to mimic thebehavior of multiple views known from the classical web application model.
2.1.4 Overview of Single-Page Application Frameworks andUser Interface Libraries
Backbone Framework
The Backbone framework was released 2010 and is one of the first JavaScript frameworksfor developing a SPA. Developed by Jeremy Ashkenas, the framework is preferredagainst other SPA frameworks because of its small file size, which enables a fast initialpage load time (Fender and Young, 2015). The Backbone framework provides severalframework-specific JavaScript objects that can be extended via the prototype-inheritancein JavaScript. The combination of the extended objects forms the SPA using the MVPpattern (see Figure 2.7 and Section 2.1.2). The following list gives an overview of allBackbone objects:
� Backbone.Model: The Backbone.Model object is used to store the state of theapplication and represents the Model component of the MVP pattern. Furthermore,data-related logic, such as data validation or conversion, can be implemented inthe Backbone.Model object.
� Backbone.Collection: The Backbone.Model object can be used to group severalBackbone.Models and to host logic, which can be applied on the collection ofmodels.
22

2 Related Concepts for a Web Visualization
� Backbone.View: The Backbone.View object simplifies the application devel-opment by splitting the DOM into multiple logical blocks (De, 2014). In theBackbone.View the major part of the application logic resides, such as the bind-ing between the Backbone.Model or Backbone.Collection and the DOM. TheBackbone.View can be seen as the Presenter component of the MVP pattern.
� Backbone.Router: The Backbone.Router enables client-side routing as knownfrom the classical web application model and maintains the application state whenthe URL changes in the web browser.
Figure 2.7: The MVP pattern with the Backbone and the MVVM pattern with the EmberFramework
As described in more detail in Section 2.2.1, the Backbone framework provides an eventsystem to notify the Backbone.View when the model stored in the Backbone.Model haschanged. The developer itself is responsible to implement how the view gets updatedwhen the model changes. The actual View component in the MVP pattern is left openby the Backbone framework, which means that the developer can choose how to renderthe current state of the Backbone.Model or Backbone.Collection object to the DOM,for example with a template engine or directly via the DOM API provided by every webbrowser.
23

2 Related Concepts for a Web Visualization
Ember Framework
The Ember Framework origins from SproutCore developed by Yehuda Katz and TomDale and was first released in 2011. The functionality is based upon the ConventionOver Configuration paradigm and utilizes the navigation functionality of the web browser,that is the URL (Kelonye, 2014). Similar as in the Backbone framework, Ember providesspecific JavaScript objects, which can be extended to form the SPA. The main buildingblocks of the Ember framework can be summarized as follows:
� Ember.Router: The Ember.Router objects can be used to map a specific URL toa route handler implemented in a Ember.Route object. Whenever the web browsernavigates to this URL, the configured route handler is called.
� Ember.Route: In the route handler implemented in a Ember.Route object, theViewModel of the MVVM pattern can be implemented. The main applicationlogic is implemented in the route handler. The data binding between models andthe view is configured in the route handler and facilitated by a template engine.Hereby, the Ember framework uses the template engine to update only parts ofthe DOM when the model defined in the route handler changes.
� Ember.Components: Ember.Components fulfill the Custom Elements sectionof the Web Components standard and thus, accomplish to reuse presentationlogic across Ember applications. Every Ember.Components consists of a customtemplate and presentation logic. Through the assignment of a custom tag, aEmber.Components can then be reused by its tag in multiple template files similaras every HTML tag defined by the W3C.
� DS.Model: All application data is stored in DS.Model objects from the Emberframework. After extending the DS.Model object, it can be accessed by everyEmber.Route object via an global store object of the Ember framework. Emberprovides basic functionality to retrieve data via HTTP from a server through anEmber.Adapter object using the adapter pattern and to cache the response ofprevious HTTP operations. The default HTTP protocol can be easily replaced viaa custom implementation of the Ember.Adapter.
As can be seen in Figure 2.7, the Ember framework enforces the MVVM pattern throughthe data binding between the Model component and the View component (see alsoSection 2.2.2). In contrast to the Backbone framework, were the developer can choosehow to update or describe the View component, Ember only supports the HTMLBarstemplate engine used for the data binding between ViewModel and View component.To manage dependencies in an Ember application, the framework includes a simpledependency injection container which enforces the Interface Injection pattern describedSection 2.3.2.
24

2 Related Concepts for a Web Visualization
React Library
The React library was initially developed by the Facebook Inc. to implement parts of thein-house web page, such as the newsfeed or advertisement and was released open-sourcein 2013 (Gackenheimer, 2015). In contrast to the Backbone or Ember framework, theReact library can only be seen as an UI library as presented in Section 2.5 and has a singlegoal to structure complex UIs in web applications by reusable components. AlthoughReact does not assume which architectural pattern the underlying SPA uses, it wasinitially designed to implement the View component in the Flux pattern. For this reason,most of the single-page applications based on the React library assemble also otherlibraries developed by the same company, for example the Flux library as a foundation toimplement the Flux pattern or the ReactTestUtils library for the efficient testing of ReactSPAs.
Appart from the various of libraries to add functionality of a React empowered application,the React library consists mainly of two parts:
� React.Component: Similar as the Ember.Component, the React library providesa possibility to reuse presentation logic and small parts of the view definitionacross the web application. Hereby, every React.Component has an own template,which defines a part of the view. Through custom properties, the state of theReact.Component can be set from outside similar as for every HTML tag. For thedefinition of the template, the React library extends the JavaScript language witha syntax based on XML and accomplishes, in this way, that the view part can bedefined directly in the same file as the JavaScript code for the presentation logic.
� ReactDOM: The ReactDOM is the React specific implementation of the VirtualDOM described in Section 2.2.4. Whenever the state of an implementation of aReact.Component changes, the Virtual DOM starts to render the actual state ofthe component to the DOM.
AngularJS and Angular 2 Framework
The AngularJS framework is developed by Google Inc. and is similar as Ember, a frameworkfor the development of single-page applications. Released in 2010, the AngularJS tries toease and accelerate the development of SPAs, which use one of the MVC-based patternssummarized by the MVW. The developers of AngularJS chose the approach to extend theHTML as the view definition of the SPA by framework-specific DSL denoted as directives,contrary to React where the JavaScript is extended by a XML-like syntax for the viewdefinition. The main building blocks of an AngularJS SPA can be listed as follows:
25

2 Related Concepts for a Web Visualization
� Directive: As stated above, an AngularJS Directive can be used to extend thefunctionality of HTML, for example to show or hide elements depending on a modelproperty, or to encapsulate presentation logic similar as in React.Components. Forthis reasons, AngularJS allows to define a directive with a unique tag and its ownHTML template file, that can be inserted in other templates across the application.
� Controller: The AngularJS controller origins from the Controller component inthe MVC pattern and can be used to implement business logic for the actual view.
� Service: In contrast to the controller, an AngularJS Service is a singleton classused to implement business logic independent of the actual view and maps to theModel component of the MVW pattern, more specifically to a Domain Model. Thelogic in the Service can be reused in several controllers and provides often datarelevant operations, for example data access from the server or data validation.
A major advantage that brings the AngularJS framework, is the possibility to bundleall relevant blocks, for example several Directives and Service implementations into onemodule. In this way, a well-designed and encapsulated AngularJS module can be reusedacross several SPA applications. In addition, the AngularJS offers a dependency injectioncontainer described in Section 2.3.3 to handle the initialization and injection of thesingleton Services. Furthermore, a test utility is provided by the AngularJS to facilitatethe testing of AngularJS specific components in a test environment. Similar as in theEmber framework, a router module enables to mimic the separation of the SPA intomultiple pages known from the classical web application model.
In 2016, with Angular 2 a second version of the AngularJS framework was released.Although Angular 2 is based on the same principles of its predecessor, the main APIof the building blocks changed without backwards-compatibility. Hence, any existingAngularJS code cannot be integrated in an Angular 2 and vice versa without majorchanges. Angular 2 was developed in TypeScript and suggests to align to its languagechoice for a full benefit of all features which comes with the TypeScript language, suchas static-typing or metadata reflection. In addition to an improved dependency injectionand change detection, Angular 2 merged the functionality of AngularJS directives andcontrollers in an Angular 2 Component. This Angular 2 Component follows the WebComponents standard and allows to encapsulate (i) the view definition, (ii) the stylingand (iii) the presentation logic of a subset of the DOM from the rest of the SPA.
26

2 Related Concepts for a Web Visualization
2.2 Change Detection in Single-Page Applications
As already mentioned in Section 2.1.3, the update of the view, that is the DOM, torepresent the actual state of the model is the most expensive operation in terms ofperformance for a SPA. For this reason, SPA frameworks implement algorithms tominimize the number of DOM operations or even, to let the developer specifically controlwhen the DOM gets updated. The algorithms to optimize the DOM manipulations,described in Parviainen (2015), have evolved over time and will be presented in thefollowing sections.
2.2.1 Manual Re-Rendering of the Document Object Model
The first frameworks for the development of SPA, for example the Backbone framework,introduced to move the model of the application from the server to the client and thus,simplified the implementation of the MVW pattern on the client-side for more responsiveweb applications (see Section 2.1.1). Hereby, framework-specific model objects can beused to track changes in the model by subscribing event-handlers to the change event ofthe model following the Publish-Subscriber pattern (Hohpe and Woolf, 2003, Chapter4). In the Backbone framework, this functionality is maintained in every model instancethrough a list of event-handlers subscribed on the change-event of the model. Wheneverthe model changes, this list is used to notify all event-handlers. Although the frameworknotifies every event-listener when the model has changed, the actual manipulation ofthe DOM, for example to find and update the DOM element which displays the modelvalue, needs to be implemented and thus can be highly optimized by the developer. Theoptimization done by the developer is depicted in Figure 2.8 with a dotted line.
Figure 2.8: Manual Re-rendering and Data Binding, adapted from Parviainen (2015)
27

2 Related Concepts for a Web Visualization
The manual re-rendering approach could be mapped to the MVP pattern described inSection 2.1.2: the Model component is provided by the framework itself, whereby, alllogic for the mapping between the model and the view needs to be implemented in thePresenter component by the developer. The view acts as a Passive View and is entirelycontrolled by the Presenter via its interface, that is the DOM API.
2.2.2 Data Binding between the Model and the View
As soon as features are added to a SPA and the number of elements in the view of theapplication increases, the logic for the binding between the model and the view in themanual re-rendering approach causes a growing complexity of the code base. In order toensure a clean and maintainable web application, successors of the first SPA frameworkstried to abstract the DOM manipulation by a data binding mechanism. This data bindingmechanism is achieved when the model is stored in framework-specific data objects, forexample in a DS.Model object in the Ember framework (see Section 2.1.4). Then, theframework itself manages the update of the DOM when a model property changes. Thespecification of the DOM element which needs to be updated, or, in other words, thebinding between the DOM element and the model is described in a markup file inspiredby HTML and enabled through template engines, such as Handlebars or HTMLBars. Thedotted line in Figure 2.8 is, when using for example the Ember framework, implementedentirely by the framework itself and thus web applications which use the data bindingmechanism follow the MVVM pattern (see Section 2.1.2).
As stated in Parviainen (2015), a drawback of this approach is, that in order to letthe framework handle the DOM update, framework-specific objects need to be used todescribe the models in the application. Hence, all external data received for examplefrom the server needs to be filled first in a framework-specific model object, that is theDS.Model object in the Ember framework, to enable the data binding.
2.2.3 Dirty Checking and JavaScript Zones
Similar as in the Data Binding approach, the AngularJS SPA framework tries to solve theincreased complexity of the manual re-rendering and forwards again the responsibility ofthe actual DOM manipulation to the SPA framework. In contrast to the Ember framework,where the view and the data binding is described in a custom markup language format,the AngularJS framework uses a HTML file extended by a framework-specific syntaxdenoted as template, to specify the view and its binding to the model. The DSL of every
28

2 Related Concepts for a Web Visualization
template is compiled by the AngularJS framework at startup to a template function,which can be used later to update the DOM when the model changes.
Another advantage of the AngularJS framework is, that every object can act as a modeland can be bound to the view. This fact is archived by creating a watcher function forevery model, which compares the current model with its previous state and updates theDOM element through the generated template function when a change was detected(see Figure 2.9). The process to compare the previous and new state of the modelimplemented in the watcher function is denoted also as Dirty Checking. Because of thefact that every JavaScript object can be used as a model, no Publish-Subscriber patterncan be implemented as in the Backbone framework. For this reason, the Dirty Checking ofall watcher functions, denoted as digest loop, must be started whenever a event happenswhich could alter the model state, for example a click-event in the DOM (Gechev, 2016a,Chapter 2).
Figure 2.9: Dirty Checking of the DOM, adapted from Parviainen (2015)
A drawback, which comes with the generic object that can be used for the Modelcomponent, is that it can be hard for the AngularJS framework to detect if an eventoutside of the framework, for example an HTTP response, could have modified a model.Although AngularJS provides wrappers, for example for the HTTP functionality to detectwhenever a response arrived, and a method to explicitly trigger the digest loop, it canbecome a tedious task for a complex web application to detect all possible cases where amodel could change.
For this reason, the evolution of the AngularJS framework Angular 2 reworked its changedetection system. As stated in Archibald (2015), every window of the web browser withthe same origin shares the event loop of the JavaScript engine. In this event loop, all
29

2 Related Concepts for a Web Visualization
asynchronous operations are, depending of its type or priority, queued either as tasks ormicrotasks and executed sequentially by the JavaScript engine. Through the sequentialprocessing in the event loop and the asynchronous behavior of the task, the executioncontext, such as the state of the variables where the task was initially triggered, is lostwhen the task is executed. The Zone.js library, described in Pisman (2016), adds thismissing execution context for asynchronous operations, such as HTTP requests, andallows to persist the context of the function in which the HTTP request was initiallytriggered inside a Zone object. The corresponding function which usually triggers theasynchronous operation is wrapped hereby by a custom Zone proxy, which holds areference to the Zone object and thus, the execution context of the function where theasynchronous operation was initiated. The Angular 2 framework uses the concept ofpersisting the execution context and provides an implementation of the Zone object. Thiscustom Angular 2 Zone is spawn over the whole web application and facilitates to detectwhenever a asynchronous operation was completed in the event loop of the window. Inthis way, the change detection system of Angular 2 can detect whenever an asynchronousoperation has completed and could have altered the model state.
2.2.4 Modeling the Document Object Model
Another approach to detect changes in the model and to optimize DOM operationsis to maintain an in-memory copy of the entire DOM denoted as Virtual DOM. TheVirtual DOM acts hereby as the View component as for example in the MVW pattern,however, can be used independently of the underlying pattern of the web application. Animplementation of a Virtual DOM is currently the main part of the React library and isoften used to realize the Flux pattern.
The main idea behind the in-memory representation of the DOM by a JavaScript datastructure is to reduce the number of DOM manipulations and merge several DOMaccesses in one operation, that is a patch. Whenever a model changes the complete viewis constructed again by a Virtual DOM. As shown in Figure 2.10, an algorithm computesthe difference of the new Virtual DOM at time T2 to the old representation of theDOM at time T1 and updates only the changed elements in the DOM in a single patch.The algorithm to compute the difference of the new Virtual DOM and the old VirtualDOM, denoted in React (2016) as Diffing Algorithm or more general as Reconcilation,has a complexity in order of O(n3) (Bille, 2005), where n stands for the number ofDOM elements. In a state-of-the-art web application a DOM tree can consist of upto 10,000 DOM elements which would take the Diffing Algorithm about 17 minuteswhen computing the difference of both Virtual DOM trees on a 1GHz processor. For this
30

2 Related Concepts for a Web Visualization
reason, several optimizations and assumptions were made in the Diffing Algorithm of theReact library to reduce at the end the complexity to an order of O(n).
Figure 2.10: Virtual DOM as a Model of the DOM, adapted from Parviainen (2015)
Restrict Diffing Algorithm to the same Tree Level
In a web application, it can rarely happen that a element of the Virtual DOM is movedduring the reconstruction of the Virtual DOM to a complete different tree level. Asmentioned in Chedeau (2013), the only possibility that an element is moved across the treeis a drag-and-drop action, which is an uncommon behavior in most web applications.
Figure 2.11: Comparing each Tree Level of the Virtual DOM, adapted from Chedeau (2013)
31

2 Related Concepts for a Web Visualization
Hence, the Diffing Algorithm can be restricted to compare only elements which are onthe same tree level counted in Figure 2.11 by the variable m. Through this assumption,when summing up the effort to compute the differences in every tree-level, that is O(m2),the complexity can be decreased to an order of O(n2).
Label Tree Elements with unique Identifiers
A problem arises when for example a new element is inserted in the middle of a list ofelements. As depicted in Figure 2.12, the Diffing Algorithm can not find out where toinsert the new element when it compares both Virtual DOM levels by each other. Tocircumvent this problem, the Virtual DOM implementation in the React library assigns akey property to every element in the Virtual DOM and makes in this way a list comparablebetween two Virtual DOM representations (Chedeau, 2014). Through this method, thecomplexity of the Diffing Algorithm could be reduced further to a linear dependency onthe number of elements in the tree (React, 2016).
Figure 2.12: Unique Identifiers for each DOM Element, adapted from Chedeau (2013)
As described in Section 2.1.4, a web application built with React is usually a compositionof multiple React components, which are again a conglomerate of DOM elements. TheReact Library further optimizes its Diffing algorithm with the assumption that whena React component has been replaced by another component the algorithm will notcompare both components and re-render the whole new React component with its subtreeof elements.
Selective Subtree Rendering
In the React library, every React component provides a method to the rest of theapplication to set the current state of the component, which will induce the React library
32

2 Related Concepts for a Web Visualization
to mark this component as dirty. At the end of the JavaScript event loop, describedin Daggett (2013, Chapter 5), the React library will apply the Diffing Algorithm on allcomponents that were previously set to dirty and reduces in this way, the number ofperformance costly DOM manipulations by merging all operations in a single patch. Whena component is set to dirty, React will perform its Diffing Algorithm on the componentand to its children forming a subtree. However, React introduced a possibility to controlif the whole subtree shall be compared to the previous version of the subtree with anothermethod in the React component. Inside this method, the new state of the componentset by the application is passed to the method and can be evaluated by a custom logic.Depending of the boolean result of this logic, the subtree will be compared by theDiffing Algorithm or not. Through this approach, the web application performance canbe optimized further by the developer, whereby it must be considered that the executionof the custom logic for the evaluation shall take less time as the update of the wholesubtree would have taken.
2.2.5 Immutable Objects for performant Change Detection
As mentioned in the above sections, the change detection system in a SPA frameworkoften includes the task to compare JavaScript objects and to detect in this way if themodel in the application has changed and hence, the view must be updated. Especially,when comparing deep object structures, for example in the Dirty Checking approach,the comparison between JavaScript objects can become a performance bottleneck inthe change detection system and can degrade the responsiveness of the overall webapplication.
The change detection system as the Dirty Checking in the AngularJS and Angular 2framework or the Diffing Algorithm in the React library can be improved when usingimmutable objects to hold the state of the application, for example in the model ina MVW pattern or in the Store component using the Flux pattern. In contrast to aregular JavaScript object, an immutable object cannot be changed after it is created andwhenever the object is mutated a new object needs to be initiated with a new referencepointing to the allocated memory. Because of this fact, for example the implementationof the logic if a subtree should be re-rendered described in Section 2.2.4 can be highlyoptimized when only the objects references need to be compared to detect if the datahas changed. Furthermore, the Dirty Checking approach in the Angular framework canbe improved by avoiding deep comparison between current and previous state of thecomponent by using immutable data structures.
33

2 Related Concepts for a Web Visualization
Although, it seems that using immutable data structure seem will bring a huge drawbackin terms of memory consumption, structural sharing allows to reuse parts of the memory,which can be implemented through vector trie or hash mapped tries (Bagwell, 2001). Asthe current JavaScript standard does not natively support immutable data structures,JavaScript libraries, such as Immutable.js, exist to use immutable objects to store theapplication state. The Immutable.js library originated from the React library and usesalready vector tries to make arrays and hash maps tries to make sets or maps morememory efficient (Facebook, 2016b).
2.3 Dependency Injection in Single-PageApplication Frameworks
2.3.1 The Dependency Inversion Principle
As stated in Jansen (2016), the growing complexity of web applications based onJavaScript will make it necessary to consider software architecture design patterns andprinciples that origins from Object-Oriented Programming (OOP) languages. Five well-known principles for OOP languages often abbreviated in the term SOLID and introducedby Martin (2000) can lead to a more maintainable and extendable application. Thestatement of each principle can be summarized as follows:
� Single Responsibility Principle: Every class is responsible of only a single func-tionality decoupled from other requirements of the application.
� Open Closed Principle: The functionality of every module can be easily extendedthrough additional features without any modification of the existing source code.
� Liskov Substitution Principle: A class derived from a base class can be re-placed by any other class derived from the same base class without impairing thefunctionality of a possible user of the base class.
� Interface Segregation Principle: Specific interfaces are preferred over one generalpurpose interface to avoid side effects between interface realizations.
� Dependency Inversion Principle (DIP): Modules, which hold the business logic,are decoupled from low level modules, which for example manage I/O operations.
Since JavaScript supports prototype-based inheritance and the latest JavaScript standardES6 even simplified the prototype syntax with the introduction of the class keywordknown from other OOP languages, all five principles can be applied when developingweb applications with JavaScript. The term module in the Open Closed Principle can be
34

2 Related Concepts for a Web Visualization
mapped to the latest specified JavaScript ES6 module, which is not yet supported nativelyby all modern web browsers, however, its functionality can be emulated when using oneof the JavaScript module formats currently in use, such as CommonJS (Rauschmayer,2016, Chapter 16). When using the TypeScript transpiler which adds static typing to theJavaScript language and compiles to ES5 JavaScript, similar interfaces can be declaredfor the Interface Segregation Principle as known from other OOP languages such asC#.
Figure 2.13: Dependency Inversion Principle, adapted from Martin (1997)
The major part of functionality of a state-of-the-art web application is provided by third-party libraries, which are often deployed via a remote repository and developed under anopen-source license. Although the open-source license model brings the advantage thatthe JavaScript libraries are maintained by a large distributed community, it comes withthe disadvantage that their functionality and exposed API can vary highly during thedevelopment time. Thus, the architecture of web applications needs to take the rapidchange of the third-party libraries into consideration to guarantee a stable functionalityof the web application.
Especially, the DIP is important to decouple the business logic of the web applicationfrom third-party libraries. As shown in Figure 2.13, the left structure shows the traditionaldesign approach without using the Dependency Inversion Principle, where each layer
35

2 Related Concepts for a Web Visualization
provides a set of functionality through a defined interface (Martin, 1997). A problem whenusing this structure arises when for example a class in the Utility Layer is modified, whichcauses that every dependent class in the Mechanism Layer must be adapted. Throughthe inversion of the dependencies by interfaces defined by the layer which actually usesthis interface (see right structure in Figure 2.13), a class in a lower level can be alteredwithout a change in the business logic in higher level module. Because of the fact, that athird-party library used here in the Utility Layer cannot be modified to implement theinterface dictated by the Mechanism Layer, Martin (1997) proposed a further abstraction.Through the introduction of an adapter described in Gamma et al. (1995, Chapter 4),the interface can be implemented by an intermediate layer between the third-party libraryand the Utility Layer and further decouples any changes in the third-party library fromthe web application.
2.3.2 Dependency Injection and Inversion of Control
In addition to the DIP, a web application can be further stabilized through DependencyInjection, which separates the initialization of dependencies from the actual usage of thedependencies. In this way, the class itself is no more responsible to initialize all its depen-dencies and informs instead a global authority about its needed dependencies (Martin,2008, Chapter 11). As stated in Fowler (2004), several methods exist how the globalauthority often denoted as dependency container injects the dependency into the targetclass. The most commonly used methods are summarized as follows:
� Constructor Injection: All dependencies described through interfaces are listedas parameters of the constructor in the target class, which can then be storedfor any later usage into class fields. In the dependency container, a configurationspecifies which implementation of the interface listed as dependency should beinjected into the constructor.
� Setter Injection: Instead of a constructor, the class exposes the dependency inform of a setter. This setter can be used by the dependency container to injectthe dependency into the class, similar as for the Constructor Injection.
� Interface Injection: The constructor and setter in the above injection methodsare further abstracted by a method defined in an interface for each dependency.When the class needs that dependency, it implements the corresponding interfacewith the specified method, which is then called by dependency container with thedependency as a parameter.
All three methods have in common that the class has forwarded the actual initialization ofthe dependencies to the dependency container. The principle to move the initialization of
36

2 Related Concepts for a Web Visualization
the dependency from the class to the dependency container is also denoted as Inversionof Control (IoC). Because of the fact that the dependency container or IoC containerhas the single task to initialize and inject all dependencies, the IoC principle can be seealso as an implementation of the Single Responsibility Principle (Schuchert, 2013).
For web applications based on JavaScript, libraries exists that provide an IoC containerand often SPA frameworks support dependency injection. When using the TypeScriptlanguage, decorators known from OOP languages can be used to add metadata to aJavaScript class and mark in this way dependencies of a class that need to be injectedby the dependency container. In future, the use of transpilers such as TypeScript canbecome no longer necessary when the Metdata Relection API, that include decoratorsand was proposed by the latest ES7 JavaScript standard, gets implemented by all webbrowser manufacturers. Furthermore, the first implementations of IoC containers suchas in the AngularJS framework, facilitates strings to identify each dependency in theconfiguration of the dependency container. Especially for large-scale applications, stringidentifiers can lead to naming conflicts between dependencies. For this reason, modernIoC containers, such as InservifyJS, support to identify each dependency by a Symbol,which is an unique and immutable data type introduced with the ES6 JavaScript standardand currently supported by all web browsers (Jansen, 2016; Knol, 2013).
2.3.3 Dependency Injection in the Angular 2 Framework
Figure 2.14: Dependency Injection in the Angular 2 Framework, adapted from Precht (2016)
As a main feature of the rapid developing of a robust SPA, the Angular 2 frameworkimproved the dependency injection functionality implemented already in its predecessorAngularJS. The dependency injection container uses hereby the Constructor Injectionmethod to inject dependencies in other Angular 2 Components or Services. Therefore,the following building blocks form the Angular 2 dependency injection:
� Injector: The injector is provided by the Angular 2 framework and exposes an APIto initialize and inject dependencies.
37

2 Related Concepts for a Web Visualization
� Provider: As presented in Figure 2.14, a provider is the mapping between theinjector and the actual object that is initialized by the injector and describeshow the dependency should be initialized and injected as an object to the targetclass. The provider uses hereby a certain token to identify each object when it isinitialized.
� Dependency: In the Angular 2 framework, a dependency is an Angular 2 Serviceholding the main business logic in the SPA.
As stated above, several configuration options exists in the provider for the dependencyinjection. When several Angular 2 Services exists in an application which implementthe same interface, through the provider it can be defined which Service is actuallyinitialized and injected (Precht, 2016). Furthermore, the Angular 2 IoC container isimplemented as a hierarchical dependency injection system, which means that everyAngular 2 Component modeling the view in form of a tree, has its own IoC. In thisway, a specific Angular 2 Service can be injected in the whole application or only in onespecific Angular 2 Component. In addition, it can be defined if the dependency shall becreated only once, described in the term singleton scope, or if for each target class a newinstance shall be created, denoted as transient scope. Similar as in the IoC containerof the InverisfyJS library, in the Angular 2 provider several Services which implementthe same interface can be mapped by a single provider, denoted as multi-provider. TheAngular 2 Component that needs the configured Service as a dependency choose itselfwhich implementation of the interface should be injected. This method is denoted alsoas contextual binding (Jansen, 2016).
A major advantage of the dependency injection in the Angular 2 framework is theincreased decoupling between the Services and Components and the simplified testing.Because the initialization of the dependency or more specifically the Angular 2 Serviceis moved to the injector, any Service can be replaced easily by a mock-service whentesting the functionality of another Component or Service without the need to adapt theComponent or Service under test.
38

3 Infrastructure for the WebVisualization
3.1 Structure of a Web Window
Figure 3.1: Structure of a Web Window
Similar to the visualization in the POI, the web visualization is structured into multiplewindows, whereby each window consists of several controls showing the current testbedstatus and contains all information needed for its visualization. As a consequence, thedeployment of a Web Window is simplified by one HTML file. To separate betweenthe information bundled inside the file, a Web Window is divided into four main blocksidentified by an explaining HTML tag, for example <data-sources> for the Data Sourcesblock (see Figure 3.1).
39
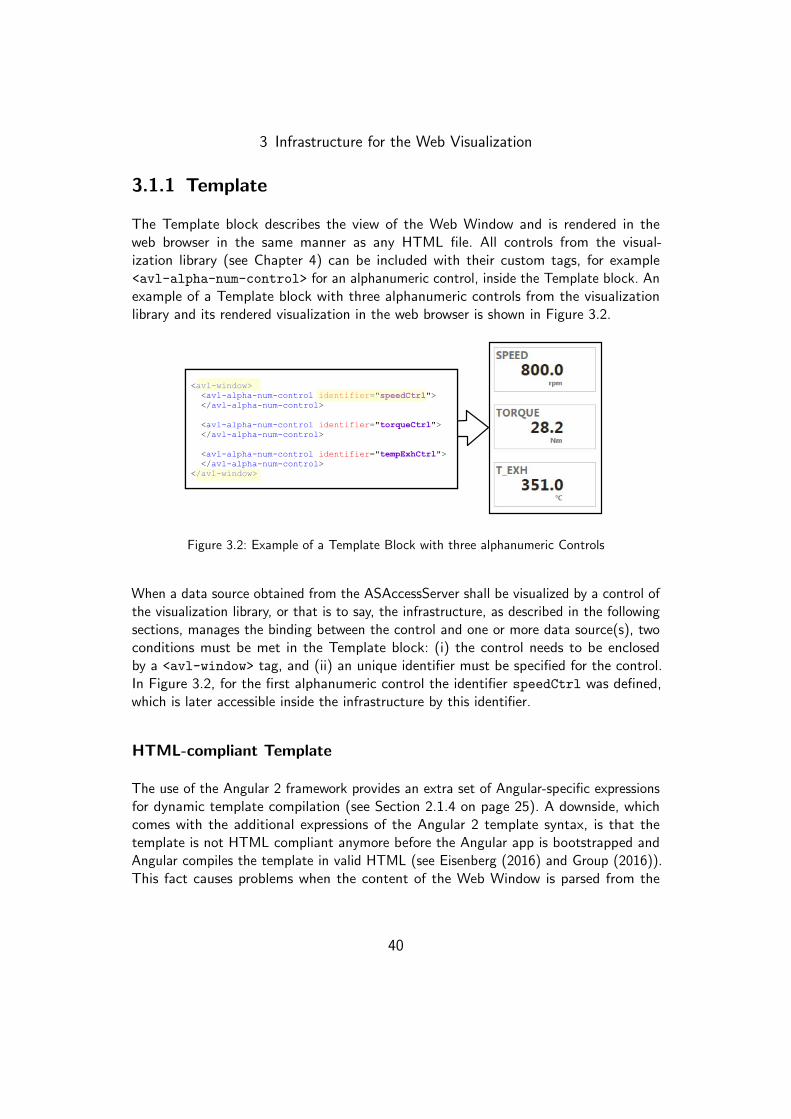
3 Infrastructure for the Web Visualization
3.1.1 Template
The Template block describes the view of the Web Window and is rendered in theweb browser in the same manner as any HTML file. All controls from the visual-ization library (see Chapter 4) can be included with their custom tags, for example<avl-alpha-num-control> for an alphanumeric control, inside the Template block. Anexample of a Template block with three alphanumeric controls from the visualizationlibrary and its rendered visualization in the web browser is shown in Figure 3.2.
Figure 3.2: Example of a Template Block with three alphanumeric Controls
When a data source obtained from the ASAccessServer shall be visualized by a control ofthe visualization library, or that is to say, the infrastructure, as described in the followingsections, manages the binding between the control and one or more data source(s), twoconditions must be met in the Template block: (i) the control needs to be enclosedby a <avl-window> tag, and (ii) an unique identifier must be specified for the control.In Figure 3.2, for the first alphanumeric control the identifier speedCtrl was defined,which is later accessible inside the infrastructure by this identifier.
HTML-compliant Template
The use of the Angular 2 framework provides an extra set of Angular-specific expressionsfor dynamic template compilation (see Section 2.1.4 on page 25). A downside, whichcomes with the additional expressions of the Angular 2 template syntax, is that thetemplate is not HTML compliant anymore before the Angular app is bootstrapped andAngular compiles the template in valid HTML (see Eisenberg (2016) and Group (2016)).This fact causes problems when the content of the Web Window is parsed from the
40

3 Infrastructure for the Web Visualization
Extensible Markup Language (XML)-Parser in the ASAccessServer for persisting anychanges of the Web Window content (see Section 3.4.2).
To benefit from the Angular 2 expression inside the template block and ensure thatthe Template block can be parsed from the XML-Parser, the following points must beobserved when defining the Template block:
� The entire content of the Web Window, must be enclosed by a root node, forexample a <div> element.
� Every HTML tag must be closed, either with an explicit closing tag, for example<div> and </div>, or with a self-closing tag, for example <input/>.
� Custom HTML tags must have and separate closing tag,for example <avl-alpha-num-control></avl-alpha-num-control>.
� The Angular property binding expression [propertyName] must be defined in thebind-syntax: bind-propertyName.
� The Angular event binding expression (eventName) must be defined in the on-syntax: on-eventName
� The hash symbol for an Angular template reference variable #variable must bereplaced by ref-: ref-variable.
� Every Angular template reference variable must be initialized with an empty value:ref-variable = ’’.
3.1.2 Custom Scripts
Inside the Custom Scripts block, presentation logic can be defined which is executed onthe client-side managed by the infrastructure. On top of the Custom Scripts block ina separate metadata section, all input data sources obtained from the ASAccessServerfor the execution and outputs created by the presentation logic can be defined. In asecond section, the actual logic, which should be executed, can be either included froman external JavaScript file or defined inside the enclosing tags of this section. For adetailed description of the Custom Script block and an example implementation seeSection 3.5.
3.1.3 Data Sources
In the Data Sources block, all data sources needed for the visualization of the WebWindow are listed. Similar to the ADE inside the POI in which each channel obtained
41

3 Infrastructure for the Web Visualization
from the PUMA automation system is represented by an individual block (see Figure 1.4on page 4), this list defines which data sources are requested initially by the infrastructurefrom the ASAccessServer.
Each entry in the list of data sources is characterized by the following three properties:
� Id: The identifier of the data source used to obtain the data source from the RESTinterface of the ASAccessServer, for example TORQUE for the actual torque of thedynamometer.
� Type: The type of data source defined by the interface description of the AS-AccessServer, for example Signal or Function (see also Section 1.3).
� Alias: An unique alias to identify the data source inside the Web Window.
Because of the fact, that the identifier of the data source obtained from the ASAccess-Server can adjust to the current environment in which the Web Window is used, forexample Istmoment for the German instead of TORQUE for the English environment, anunique Alias was introduced for each data source. In this way, only the Data Sourcesblock or more specifically the Ids in the Data Sources block, must be adapted to anydifferent namespace of the environment in which the Web Window could be used.
3.1.4 Control Bindings
In the Control Bindings block, the mapping between data sources listed in the Data Sourcesblock and the controls of the Template block is defined. As described in Section 3.1.1,to each control of the visualization library inside the Template block an unique identifiermust be assigned.
Figure 3.3: The Control Bindings Block defines the Mapping between Control Inputs and DataSource Properties
42

3 Infrastructure for the Web Visualization
In Figure 3.3 an exemplary Control Bindings block is depicted: the data source with thealias signalSpeed specified in the Data Sources block, is bound to the alphanumericcontrol with the identifier speedCtrl. Furthermore, a mapping between each property ofthe data source and an input of the control can be specified. In contrast to the ControlBindings block shown in Figure 3.3, more than one data source can be mapped to onecontrol.
3.1.5 Sub-Windows
Listing 3.1: The existing Web Window barchart and gauge are inserted into a new Web Window
1 <avl-window>
2 <avl-sub-window identifier="wnd1" path="barchart">
3 </avl-sub-window>
4 <avl-sub-window identifier="wnd2" path="gauge">
5 </avl-sub-window>
6 </avl-window>
In the POI the functionality exists to reuse multiple visualizations, in other words, thetestbed operator can insert any existing window inside a new one. In this way, for examplea tab control is currently implemented in the POI, whereby each tab hosts and displays aseparate window file. A similar concept can be used to insert an existing Web Window inthe actual Web Window file with the custom tag <avl-sub-window>. In Listing 3.1, anexample for inserting two sub-windows in a Web Window is presented. With the customHTML attributes, identifier and path, an unique identifier for the inserted windowand the file path to the Web Window, which exists relative to the wndfiles directory(see Section 3.2.1), need to be defined.
3.2 Startup Process of a Web Window
3.2.1 Deployment of a Web Window
For the web visualization, every Web Window file, as described in Section 3.1, andall relevant files for the visualization need to be hosted and served by a web serverto be later accessed from a web browser (Shklar and Rosen, 2009, Chapter 7). Toaccess the PUMA resources and the Web Window from the same server, the web serviceof the ASAccessServer is configured to host and serve the files to any internal client.For this reason, in the web service of the ASAccessServer virtual directories can be
43

3 Infrastructure for the Web Visualization
initialized, which act as an interface between a physical directory of the machine, wherethe ASAccessServer runs, and the REST interface. In this way, every HTTP GET requestaccessing the ASAccessServer with a specific URI path returns the corresponding file inthe configured physical directory (Templin, 2007).
To separate between the files needed for the visualization and the actual Web Windowfiles, the following two virtual directories are configured:
� wndweb: The wndweb virtual directory returns all files, for exampleJavaScript files or stylesheets, needed to enable the visualization of a Web Windowand is set to the common folder under the program data path of the ASAccessServerweb service, that is C:\ProgramData\AVL\ASWebService\wndweb\common.
� wndfiles: All Web Window files are hosted in the physical directory to which thewndfiles virtual directory points. This physical directory exists next to the commonfolder, that is C:\ProgramData\AVL\ASWebService\wndweb\wndfiles.
Through the configuration of both virtual directories, it was achieved that a Web Windowfile can be accessed by a simple HTTP GET method, for example the request withthe URI http://localhost:8890/wndfiles/demo.html returns the demo.html WebWindow file, when the ASAccessServer runs on the same machine and the port numberis set to 8890 (Eastlake and Panitz, 1999). Furthermore, any updates on the JavaScriptfiles for the visualization of the Web Window, for example if a control was added tothe visualization library, can be rolled out separately to the wndfiles folder withouttouching any of the Web Window files.
3.2.2 Retrieval of a Web Window
Because of the specific structure of a Web Window and the separation of the storage loca-tion of the Web Window files (wndfiles folder) and the files to enable the visualizationof the Web Window (common folder), an infrastructure was established for retrieving andfurther processing a Web Window until it is rendered in the web browser. The process ofthe retrieval of a Web Window, outlined in Figure 3.4, can be described in the followingsteps:
1. User enters URI for Web Window
When a user wants to display a Web Window in the web browser, the user enters in theaddress bar of the web browser the URI of the wndweb virtual directory and specifies with
44

3 Infrastructure for the Web Visualization
the query parameter of the URI the name of the Web Window, which should be opened.The URI http://localhost:8890/wndweb/?demo opens, for example, an existing WebWindow with the filename demo.html in the wndfiles virtual directory or program datafolder, respectively. As described in Berners-Lee, Fielding, and Masinter (2005, chapter3), the query parameter specified with the question mark at the beginning of the WebWindow name is stored by the web browser in the search property of the location objectlocation.search and is in this way persisted across the entire retrieval sequence of theWeb Window (Hickson et al., 2016).
2. Web Service returns the Index-File
In Step 1., no path argument was specified for the request to the wndweb virtual directory,hence, the web service of the ASAccessServer returns the configured default file, that isthe index.html file (Microsoft, 2016a). When the web browser receives the index.htmlfile, it parses through the content of the HTML file and requests every external file, forexample a JavaScript or a stylesheet file, from the same web service or more specificallyfrom the wndweb virtual directory (Flanagan, 2011, Section 13.3.4). In the index.html
file for the web visualization, the following external JavaScript files are referenced by a<script> tag, which are obtained from the wndweb virtual directory:
� polyfills.js: Includes all JavaScript code to implement features, which are notsupported in the web browser in which the Web Window is loaded. For example,additional code to support the custom decorators of the Angular 2 framework suchas the @Component decorator in web browsers, which does not support metadatareflection standardized in ES7 (see Section 2.1.4).
� vendor.js: Includes all vendor files from the Angular 2 framework and all depen-dencies, such as the RxJS library.
� libs.js: Includes all external JavaScript libraries loaded as global modules, such asthe charting library FusionCharts.js.
� avllib.js: Includes all files of the infrastructure for the web visualization and thevisualization library described in Section 4.
� main.js: The main entry point for the web visualization, which initializes theAVL Window Manager and bootstrapps the Angular 2 framework described inSection 2.1.4 and in the next point.
The listed JavaScript files are a product of the specific build process for the webvisualization by using the webpack module bundler.
45
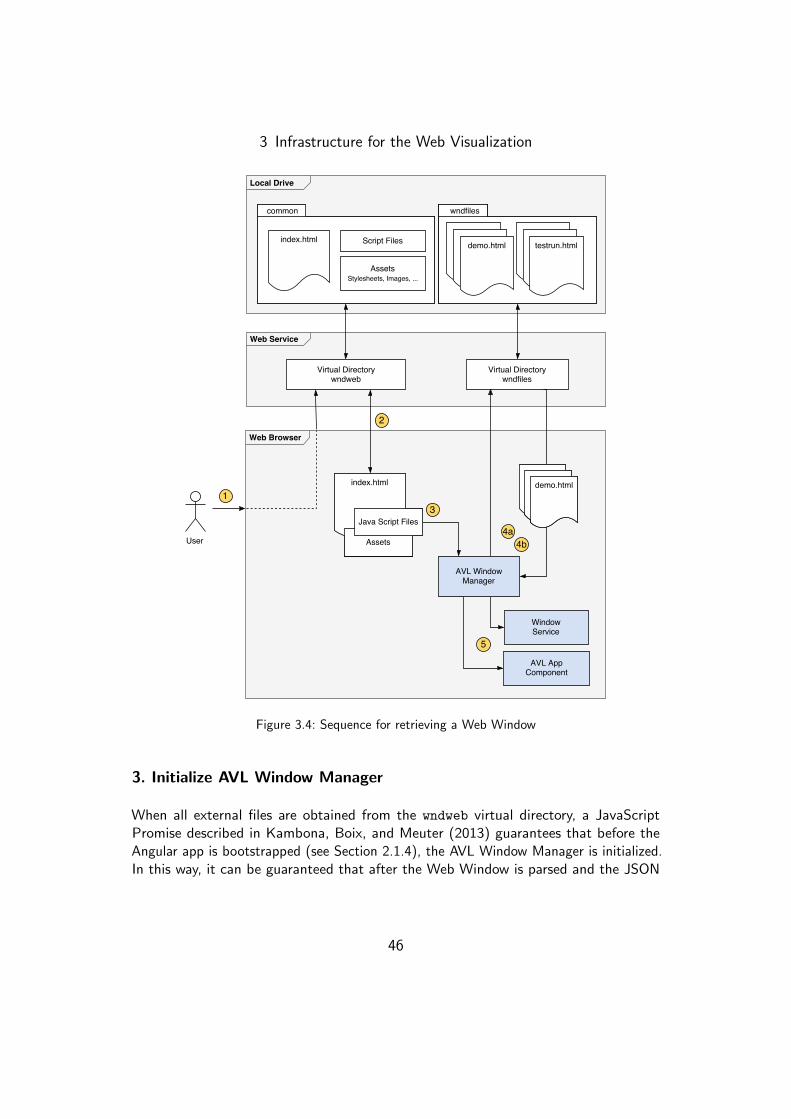
3 Infrastructure for the Web Visualization
Figure 3.4: Sequence for retrieving a Web Window
3. Initialize AVL Window Manager
When all external files are obtained from the wndweb virtual directory, a JavaScriptPromise described in Kambona, Boix, and Meuter (2013) guarantees that before theAngular app is bootstrapped (see Section 2.1.4), the AVL Window Manager is initialized.In this way, it can be guaranteed that after the Web Window is parsed and the JSON
46

3 Infrastructure for the Web Visualization
formatted content is extracted, the Angular root component (see Section 3.3.1) onlyobtains the pure HTML defined in the Template block.
4. Request Web Window(s)
4a. Fetch Root WindowOn initialization of the AVL Window Manager, the query parameter, for example demo, isread out of the location object and the Web Window file with the filename specified in thequery parameter, that is demo.html, is requested from the wndfiles virtual directoryof the ASAccessServer web service. The Web Window file opened by the user specifiedinitially with the query parameter is described here as the root window.
When the requested root window file is received from the web service, a separatecomponent the AVL Template Parser extracts the content of the Web Window. Thecontent describes all relevant information of a Web Window such as the Data Sourcesor Control Bindings block, except the Template which describes the view of the WebWindow. Furthermore, all external script files for the custom presentation logic describedin Section 3.5 are requested.
4b. Request any Sub-WindowsIn Section 3.1.5 the possibility was presented to insert an existing Web Window, that isa sub-window, in a new Web Window. Figure 3.5 shows how a sub-window is loaded andinserted in the Web Window when it was specified with the <avl-sub-window> tag, asdescribed in Section 3.1.5, inside the root window.
Firstly, all path attributes of the <avl-sub-window> tags in the root window Templateblock are collected. As specified in the path attribute of the sub-window, every WebWindow file is requested then from the ASAccessServer web service similar as the rootwindow file. For each received sub-window file, the content is extracted same as for theroot window file and any external script file for the custom presentation logic is requested.In a separate step, all identifiers specified in the Control Bindings block and all aliasesin the Data Sources block are prefixed with the identifier defined as a custom attributeof the corresponding sub-window. This step guarantees that when the content of thesub-window is merged later on with the content of the root window, the data bindingand the needed data sources for the inserted sub-window remain unique and no namingconflicts occur with the content of the root or other inserted sub-windows.
47

3 Infrastructure for the Web Visualization
Figure 3.5: Sequence Diagram for loading multiple Sub-Windows
Similar as for the content, all identifiers of the controls from the visualization library inthe Template block of the received sub-window file are prefixed with the identifier tomatch the previously renamed Control Binding entries. Then, the sub-window tag insidethe Template of the root window is replaced by the received and adapted Template blockof the sub-window.
5. Provide Content & Template of the Web Window
At this point, the content of all sub-windows defined in the root window is merged withthe content of the root window. The content and the Template are provided then tothe Window Service or the AVL App Component, respectively, both described in thefollowing sections.
48

3 Infrastructure for the Web Visualization
3.3 The Building Blocks of the Infrastructure
As described in Section 2.1.4, an Angular app can be modularized into separate buildingblocks called Angular modules. Apart from the AVL Window Manager and the AVLTemplate Parser, which are implemented as ES6 classes, the rest of the infrastructurefor the web visualization is bundled into the Angular module AVL Base Module (EcmaInternational, 2015, Section 14). Following the SoC principle stated in Microsoft Patternsand Practices Team (2009, Chapter 2), the AVL Base Module is split into three mainlayers each providing specific functionality to the infrastructure for the web visualization.Figure 3.6 on page 50 shows the class diagram of the infrastructure with the followingthree layers:
� Backend Access,� Data Source Registry, and� Control Registry layer.
The above mentioned three layers form the layered architecture of the infrastructure, aspresented in Microsoft Patterns and Practices Team (2009, Chapter 3), and guaranteea further important principle that a lower layer, for example the Backend Access layer,does not depend on any upper layer such as the Data Source Registry layer. In this way,the Backend Access layer could be reused in other applications or components. Everylayer consists of one or more Angular Service(s) as an implementation of the Singletonpattern (see Stefanov (2010, Chapter 6) and Section 2.1.4), which provide the specifiedfunctionality of the layer, and are described in the following sections.
3.3.1 AVL App Component
The AVL App Component is the root Angular Component and accesses the Templateblock from the AVL Window Manager after the Angular 2 framework is bootstrapped.All functionality which is neither part of the infrastructure nor of the visualization libraryand needs to be accessible by all loaded Web Windows needs to be implemented in theAVL App Component.
49

3 Infrastructure for the Web Visualization
Figure 3.6: Class Diagram of the Infrastructure Services
3.3.2 Window Service
The Window Service acts independent from the three layers mentioned above and as thekey link between the AVL Window Manager and the services responsible for the datasource handling, such as the Control Service, Data Service and Scripts Service. Therefore,the Window Service forwards the content of the Web Window, that is the content of theData Sources, Control Bindings and Custom Scripts block extracted by the AVL WindowManager, to the respective service. For example, the content of the Custom Scripts blockis passed on to the Scripts Service as described in more detail in Section 3.5.2.
Another important task of the Window Service is to serialize the content received fromthe AVL Window Manager in more efficient dictionary data types, for example the contentof the Data Sources block is sorted in a dictionary by the Alias property. Apart fromthe interface to the AVL Window Manager, the Window Service provides an interface topersist changes in the Control Bindings and Data Sources block by the ASAccessServer,for example when another data source as initially defined in the Web Window file shallbe displayed by a control (see also Section 3.4.2).
50

3 Infrastructure for the Web Visualization
3.3.3 Control Registry Layer
The Control Registry Layer is implemented by the Control Service as an Angular Serviceand is responsible to assign data sources as defined in the Control Bindings blockto each control. To bind the data sources to a specific control, the Control Serviceneeds a reference to every control inside the Web Window and realizes therefore theRegistry pattern described in Fowler (2002, Chapter 18). The data source specified inthe Control Bindings block are obtained hereby with the Alias from the Data Service.A main component that enables the assignment of data source properties to an inputor output of a control is the AVL Window Component, which is also a part of the AVLBase Module.
AVL Window Component
The AVL Window Component is an Angular Component and can be inserted into theTemplate block of a Web Window with the tag <avl-window> as shown in Figure 3.2or Listing 3.1. The property decorator @ContentChildren of the Angular frameworkis used, as described in Gechev (2016b), to get all controls of the visualization librarydefined as the content of the AVL Window Component and accessible from the DOM.Every control received from the property decorator is later registered to the ControlService to have a reference of every control and the inputs and outputs of the control.
3.3.4 Data Source Registry Layer
The Data Source Registry Layer is implemented by the Data Service as an Angular Serviceand is responsible to provide a common interface for all types of data sources. The DataService holds a list of all data sources needed in the infrastructure and is based on thecontent of the Data Sources block. In addition, the list of data sources maintains a list oflocal data sources, more specifically Script data sources, which are created by the custompresentation logic (see Section 3.5). The used term local denotes that the data source iscreated entirely inside the infrastructure without a request to the ASAccessServer.
For each entry in the list of data sources, the Data Service requests a data source from theBackend Access Layer by the Id of the data source, that is depending on the data sourcetype either from the Signal Service or Function Service. This data source is persistedthen for later accesses of the same data source in a dictionary accessible by the Alias ofthe data source. An example for an entry in the Data Sources block shown in Listing 3.2,
51

3 Infrastructure for the Web Visualization
a Signal data source with the Id act dyno speed is obtained from the Signal Serviceand is stored in the a dictionary accessible by the Alias signalSpeed. In this way, theData Service acts as a local cache of data sources and an abstraction layer for obtainingdata sources from the Backend Access layer and further from the ASAccessServer.
Listing 3.2: Example of a Data Source Definition
1 {2 "Alias" : "signalSpeed",
3 "Type" : "Signal",
4 "Id" : "act_dyno_speed"
5 }
3.3.5 Backend Access Layer
The Backend Access Layer provides an interface to PUMA resources retrieved from theASAccessServer to the rest of the infrastructure. For each data source type, for examplethe data source type Signal representing a PUMA resource channel or quantity (seeSection 1.3), a separate Angular Service is implemented. Thereby, the access of eachdata source can be separated from the rest of the infrastructure and future data sourcetypes, for example the data source type SignalXt, can be added in a modular way withouttouching the running code base. Additionally, the separation of the data source access tothe rest of the infrastructure hides implementation details, such as the used protocol orthe specific API of the ASAccessServer. For both implemented services of the BackendAccess Layer, the HTTP library of the Angular framework is used.
Signal Service
The access of a Signal data source from the ASAccessServer API is separated into twoHTTP requests, which return the actual value and the metadata of the Signal datasources. In this way, the API reflects the different rate of change of the metadata, forexample the name of a testbed channel, and the value, for example the actual rationalspeed of the dynamometer. The Signal Service merges the two separate requests andhence, data structures for the metadata and value of a Signal data source and simplifiesthereby the access of a Signal Data Source.
52

3 Infrastructure for the Web Visualization
The access of Signal data source inside the Signal Service can be described in three mainsteps:
1. request the metadata,2. request the actual value of the Signal data source, and finally,3. merging both the metadata and the value to provide the Signal data source to the
infrastructure.
1. Request MetadataTo retrieve the metadata of a Signal data source, the ASAccessServer offers two HTTPrequests: (i) to retrieve metadata of a single Signal data source and, (ii) to get themetadata of all Signal data sources with an id beginning with at least three specifiedcharacters. The Signal Service gives access to each of the requests to provide parts ofthe infrastructure, for example the Signal Browser (see Section 3.4.2), with the metadataof a Signal data source and caches the result of metadata queries of both requests.
When providing a Signal data source, that is the metadata and value of a Signal datasource, the Signal Service first reads out the cache filled by any previous metadata queriesof the infrastructure and returns the found metadata. When, for example at startup ofthe infrastructure, multiple metadata queries are initiated at once, it can happen that forthe same Signal data source id a request to the ASAccessServer was already triggered,however no response for this request has been received yet and hence, the correspondingmetadata could not be found in the cache. In order to avoid in this case, multiple requestsfor the same metadata, an additional cache filled with metadata Observables, whichrepresent an reference of the asynchronous result of an HTTP request.
2. Request ValueFor a more efficient access of the actual value of a Signal data source, the ASAccessServerprovides an HTTP POST request to retrieve an array of actual values from multiple Signaldata sources, whereby a list of Signal ids, for example act dyno speed for the actualspeed of the dynamometer, is supplied in the body of the request. When a new value ofa Signal data source is queried by the infrastructure, the id is added to a global list of allneeded Signal data sources in the Signal Service, which is used for each request.
Long polling, as described in Fain, Rasputnis, and Tartakovsky (2014, Chapter 8), is usedto update the Signal data source values on a regular basis. For this purpose, as shownin Figure 3.7, the interval operator of the Reactive Extensions for JavaScript (RxJS)library is used to create an Observable which periodically emits an ascending integer. TheswitchMap operator is chained to the interval operator to trigger on each emission ofan integer, an HTTP POST request with the currently needed Signal ids in the body ofthe request.
53

3 Infrastructure for the Web Visualization
Figure 3.7: Periodic Requests for the actual Value of all Signal Data Sources
In the event of a delay of a response, for example due to the network latency, whichexceeds the interval rate (UPDATE RATE), the switchMap stops the latest request andinitiates a new request. In this way, it can be guaranteed that always the actual valueof the Signal data source is forwarded to the infrastructure and no queuing of delayedSignal values occurs. By subscribing on the created Observable, the overall sequence isstarted, and on each received HTTP response, a Subject is used to forward the retrievedarray of Signal values with the operator next to the proceeding step.
Figure 3.8: Flattening the Array of Values to a Stream of Values
Because of the fact, that the HTTP request of the ASAccessServer returns for eachrequest an array of Signal values, the switchMap operator is used again to transform theretrieved array to a Observable stream of separate values. Hereby, the operator, as shownin Figure 3.8, is chained to the Subject used to retrieve the array, as described above.
54

3 Infrastructure for the Web Visualization
3. Merge Metadata & ValueWhen one of the requests or more specifically the Observable for the metadata and thevalue, emits an item the combineLatest operator is used to merge always the latestreceived metadata and value to a Signal data source. This Signal data source can beaccessed by a method in the Signal Service with a the Signal id.
Function Service
Similar as in the Signal Service, the ASAccessServer offers two HTTP requests of aFunction data source: (i) to retrieve the metadata of a Function data source, for examplethe needed input and output parameters of an activation object (see Section 1.3), and(ii) to trigger an Function data source with the provided input parameters, specifiedin the metadata of the Function data source. To retrieve the metadata of a Functiondata source, the same cache strategy is implemented as for the metadata in the SignalService.
3.4 Data Source Assignment
3.4.1 Initial Assignment of a Data Source
The sequence of the initial assignment of all data sources to the controls as specified inthe Control Bindings block is shown in Figure 3.9 and can be described as follows:
1. Set Content to Services
As described in the Section 3.3.2, the Window Service retrieves the list of data sourcesdefined in the Data Sources block of the Web Window and fills the list of data sourcesin the Data Services. Similarly, the content of the Control Bindings block is set to theControl Service.
The Data Service holds now a dictionary with all needed data sources of the infrastructure.The Control Service holds a mapping between the inputs and outputs of all controlsreferenced in the Template block and the data source properties listed in the Data Sourcesblock.
55

3 Infrastructure for the Web Visualization
2. Get Signal/Function Data Source
When a dictionary entry of the needed data source in the Data Service is created,depending on the data source type either from the Signal or the Function Service, a datasource Observable is requested, which is then persisted again in a separate dictionary foreach data source type. The Signal Service or Function Service makes an HTTP requestto the ASAccessServer, as described in Section 3.3.5, and returns an Observable.
The Data Service holds now a dictionary with Observables for the data sources definedin the Data Sources block of the Web Window.
Figure 3.9: Initial Assignment of a Data Source to a Control
3. Register Controls
Inside the ngAfterViewInit life-cycle hook of the AVL Window Component (see Sec-tion 3.3.3 and 2.1.4), all child controls of the AVL Window Component from the
56

3 Infrastructure for the Web Visualization
visualization library are registered to the Control Service.
When a control is registered to the Control Service, it searches in the dictionary, sortedby the identifier of the control and set by the Window Service in Step 1., for the ControlBinding of the registered control. All data sources specified in the found Control Bindingare then requested from the Data Service accessible by the Alias of the data source.
The Control Service knows now which Data Source property shall be bound to whichregistered control and holds an Observable of all referenced data sources.
4. Bind Data Source to Control
When the Data Service returns a data source Observable, the Control Service searches forthe reference of the control in the dictionary of controls in the Web Window filled by theAVL Window Component. Then, a dynamic subscriber is created, which sets whenevera data source item is emitted by the Observable of the data source the inputs of thecontrol to the actual property values of the data source item.
3.4.2 Dynamic Assignment of a Data Source
One requirement of the infrastructure was to allow to modify the visualization duringthe runtime, this means that the user can change the assigned data source to a controlduring the runtime. The term runtime states here that the Web Window file alreadyexists and is loaded in the web browser as described in Section 3.2. To give the user thepossibility, to change the assigned data source to a control different as defined initially inthe Control Bindings and Data Sources block of the Web Window, for each data sourcea Browser component exists. This Browser component can be added in a modular wayto every control of the visualization library defined in the Template block, enclosed bythe starting and closing tag of the corresponding control similar as for the AVL WindowComponent.
Signal Browser
Listing 3.3 shows how to add a Signal Browser component implemented as an AngularComponent (see Section 2.1.4) to an alphanumeric control, which is displayed, when thesnippet is added to Template block of the Web Window in the web browser, as presentedin Figure 3.10.
57

3 Infrastructure for the Web Visualization
Listing 3.3: Adding a Signal Browser to the Alphanumeric Control
1 <avl-alpha-num-control identifier="ctrlSpeed">
2 <avl-signal-browser identifier="ctrlSpeed">
3 </avl-signal-browser>
4 </avl-alpha-num-control>
Figure 3.10: Signal Browser to change the assigned Signal Data Source
The process to change the assigned Signal data source of a control can be split in threesteps, described as follows:
1. User opens the Signal Browser DialogWhen adding a Signal Browser to a control, an icon appears on the right side of thecontrol (see Figure 3.10), which opens a Signal Browser instance for this control. Whenthe Signal Browser was opened, as presented in the sequence diagram in Figure 3.11, theSignal Browser searches for previously cached metadata for Signal data sources in theSignal Service as described in Section 3.3.5. In addition, the metadata of all created localdata sources, that is Script data sources, for the custom presentation logic are obtainedfrom the Data Service. In this way, the user can also assign a locally defined data sourcein the Custom Scripts block to a control during runtime. The retrieved metadata is thendisplayed in a table inside the Signal Browser.
2. User searches for SignalsIn a separate text input control, which is part of the visualization library, the user can
58

3 Infrastructure for the Web Visualization
search for metadata of Signal data sources, which are currently not used within theinfrastructure and therefore are not cached by the Signal Service. When the user entersat least three characters, the corresponding request of the ASAccessServer is used in theSignal Service to get all metadata for Signal data sources with the beginning characters.Furthermore, the list of Script data sources are filtered by the entered characters andmerged with the retrieved metadata from the Signal Service. In Figure 3.10, the list inthe Signal Browser shows all Signal data sources beginning with ’act’, such as the actualvehicle speed or the actual throttle position, after the user entered the three characters.
Figure 3.11: Dynamic Assignment of a Data Source to a Control
59

3 Infrastructure for the Web Visualization
3. User submits a ChangeWhen the user selects a Signal or Script data source in the list of metadata and submitsthe selection with the Select button, the Signal Browser creates a new Signal data sourcein the Data Service. Hereby, the Data Service adds this Signal data source to the list ofdata sources and requests a new Observable for the Signal data source from the SignalService. Furthermore, the Signal Browser adapts the Control Binding of the controlaccording to the change in the bound data source, this means that the mapping betweendata source properties and control inputs remains unchanged and only the Alias field inthe Control Binding, as described in Section 3.1, is updated to the new Signal data source.When the Control Binding of the control is adapted inside the Control Service, the datasource is bound to the control inputs in the same way as described in Section 3.4.1.
Persisting the Changes of the Web Window
Figure 3.12: Persisting Changes of the Web Window
When the user changed for example the channel, which shall be displayed by an al-phanumeric control via the Signal Browser, a requirement of the infrastructure is topersist these changes. For this reason, the web service of the ASAccessServer providesan interface to write back the changes to the Web Window file. As mentioned in Sec-tion 3.3.2, the Window Service requests this interface in a public method to save theactual Control Bindings of the Control Service and list of data sources stored in the DataService (see Figure 3.12). When this method is called, the Window Service accesses the
60

3 Infrastructure for the Web Visualization
current version of all Control Bindings and the list of data sources, packs both in a validJSON format for an HTTP request, and triggers the corresponding POST request ofthe ASAccessServer with the name of the Web Window as an URI parameter. The webservice of the ASAccessServer parses then the Web Window file specified with the URIparameter, for example demo.html, for the Control Bindings and Data Sources blockspecified by their unique HTML tags, and writes the body of the corresponding requestinside both blocks.
To allow the user to save any changes the user has made, a Save Button was implementedas an Angular Component and can be inserted in every Web Window with the customtag <avl-save-button>. The Save Button triggers, when clicking on the used HTMLbutton control, the public method of the Window Service to persist the content of aWeb Window as describe above.
3.5 Custom Presentation Logic
3.5.1 Defining the Presentation Logic
Similar to the ADE mode in the POI, custom presentation logic can be defined inside aWeb Window. Therefore, in the Custom Scripts block (see Section 3.1.2) script snippets,which are stored in the same wndfiles folder as the Web Window files, can be includedand a mapping between inputs and outputs of the script snippet and data sources, knowninside the infrastructure, can be defined.
In Listing 3.4, a definition of custom presentation logic for a Web Window is shown,split into two sections: (i) the metadata for the presentation logic, and (ii) a referenceto an external script snippet file. To reuse script snippets in multiple Web Windows, ageneric namespace is used in every script snippet for the definition of inputs and outputs,for example Input1 to InputN for N inputs of the script snippet. For this reason, whenincluding the script snippet in a Custom Scripts block, a mapping must be definedbetween the generic input and output names of the script snippet and data sources ofthe infrastructure.
61

3 Infrastructure for the Web Visualization
Listing 3.4: Definition of a Presentation Logic inside a Web Window
1 <custom -script>
2 <meta -data>
3 {4 "InputMapping" : {5 "Input1" : "act_dyno_speed"
6 },7 "OutputDeclarations" : [
8 {9 "Id" : "scriptSpeedLimit",
10 "Description" : "Speed is above 1000 rpm",
11 ...
12 }13 ],
14 "OutputMapping" : {15 "Output1" : "scriptSpeedLimit"
16 }17 }18 </meta -data>
19 <code path="indicateLimit"/>
20 </custom -script >
This mapping must be defined on top of each custom scripts block in a separate metadatasection, which consists of the following three parts:
� InputMapping: Defines a mapping between inputs of the script snippet, forexample Input1, and a data source known inside the infrastructure. The datasource is defined hereby with the Id, for example act dyno speed for the actualspeed of the dynamometer (see Data Sources block in Section 3.1).
� OutputDeclarations: Lists all new data sources, which are created by the CustomScripts block, and adds metadata to the data sources, for example a description ofthe new data source, which can be later on displayed in the Signal Browser (seeSection 3.4.2).
� OutputMapping: Defines a mapping between outputs of the script snippet, forexample Output1, and a data source declared in the OutputDeclarations section.
The external script snippets can be included with the <code> tag, where the customattribute path defines which script snippet file shall be used. For example, the scriptsnippet presented in Listing 3.5 is included in the Custom Scripts block shown in
62

3 Infrastructure for the Web Visualization
Listing 3.4, which provides the basic functionality to monitor the maximum value of adata source, here the actual speed of the dynamometer.
Listing 3.5: Reusable Script-Snippet for a Custom Presentation Logic
1 var indicateLimit = (Input1.Value > 1000);
2 var Output1 = {
3 IsAboveLimit: indicateLimit
4 };
3.5.2 Running the Presentation Logic
Similar as described for inserting already existing Web Windows in a new Web Window(see Section 3.2.2), the AVL Template Parser requests all external script snippet filesand extracts the metadata section from each Custom Scripts block of the loaded WebWindow (see also Figure 3.5). When all external script snippets were received, the AVLTemplate Parser uses the InputMapping and OutputMapping of the metadata sectionto customize the imported script snippet for the current Web Window, which meansthat all generic variables inside the script snippet are replaced by the data source Iddefined in the InputMapping or OutputMapping, for example Input1 is replaced byact dyno speed.
In case that the Custom Scripts block was defined in a sub-window file, all variablesare prefixed in a separate step with the unique identifier of the sub-window similar asfor the Control Bindings and the Data Sources block as described in Section 3.2.2.For all proceeding steps, the content of the Custom Scripts block is bundled to aScriptDefinition object, which consists of all inputs (data source ids in the InputMapping),outputs (OutputDeclarations) and the actual code of the presentation logic.
For the execution of the code for the custom presentation logic, an additional AngularService, the Scripts Service is implemented. The Scripts Service retrieves in the sameway as the Data Service, the content of all Custom Scripts blocks of the Web Windowfrom the AVL Window Manager via the Window Service and manages the executionof the scripts in separate Web Worker threads. As reported in Flanagan (2011, Section13.3.3), the execution of JavaScript in the web browser is strictly single-threaded andevery JavaScript is run in the UI thread. The Web Worker feature as part of the HTML5standard, enables to swap computationally expensive logic into a separate Web Workercontext and background thread (Chromium Team, 2016). In this way, the UI threadcan remain responsive and will not be blocked by any long-running logic (Oakley andPulimood, 2012).
63

3 Infrastructure for the Web Visualization
For this purpose, for every ScriptDefinition obtained from the Window Service, thesubsequent steps are processed:
1. The code of the ScriptDefinition is parsed by the Acorn JavaScript parser1 for afirst rough validation of the imported script snippet.
2. The Binary Large Object (Blob) API is used to swap the execution of the evaluatedJavaScript code in a separate Web Worker thread (Ranganathan, Sicking, andKruisselbrink, 2016). With a message bus, that is the Channel Messaging APIdefined in Group (2016, Section 9.5), data is passed between the UI and the WebWorker thread.
Listing 3.6: Code which runs in a separate Worker Thread for the Presentation Logic
1 self.onmessage = function(e){
2 var act_dyno_speed = e.data [0];
3 // ******** START: User defined code ********//
4 var indicateLimit =
5 (act_dyno_speed.Value > 1000);
6 var scriptSpeedLimit = {
7 IsAboveLimit: indicateLimit
8 };
9 // ******** END: User defined code **********//
10 var scriptResult = {
11 scriptSpeedLimit: scriptSpeedLimit
12 };
13 postMessage(scriptResult);
14 }
3. The imported script snippet is surrounded by code to access the retrieved datafrom the message bus and to send the result data back to the UI thread. InListing 3.6, the acutal code, which runs inside on Web Worker is presented. InLine 2, the input parameter data of the onmessage event callback is accessed andstored in a local variable defined by the inputs of the ScriptDefinition. In addition,all script snippet outputs are merged into one result object, which is posted backto the UI thread with the postMessage() method (see Line 10-13).
4. Already created data sources with the same id as defined in the inputs of theScriptDefinition are searched in the Data Service. When no data source wasfound, a new data source with the specified id is created in the Data Service (seeSection 3.3.4).
1Acorn: Open source JavaScript parser: https://github.com/ternjs/acorn
64

3 Infrastructure for the Web Visualization
5. A new data source is created in the Data Service for each entry in the outputs ofScriptDefinition.
6. The combineLatest operator is applied to all data sources listed in the inputs ofthe ScriptDefinition, similar as for the metadata and the value of a Signal datasource described in Section 3.3.5. In the subscriber, which is chained to the resultof the merged input data sources, the current input data is posted to the WebWorker thread with the postMessage() function.
7. To receive the result object from the Web Worker thread, an Observable iscreated from the onmessage event of the Web Worker thread with the fromEvent
operator. The previously merged result object received from the Web Workerthread is separated again and forwarded to the created Script data source in theData Service via a Subject (see also next operator in Section 3.3.5)
3.5.3 Editing the Presentation Logic
To allow the user to change the custom presentation logic defined inside the Web Windowor in an external script snippet file, the Script Editor component is implemented usingthe Angular @Component decorator (see Section 2.1.4). Similar as the Signal Browser,described in Section 3.4.2, the Script Editor consists of an button and a modal dialog,which opens when the user clicks on the corresponding button. When the Script Editoropens, all ScriptDefinition entries of the current Web Window are obtained from the ScriptService and the metadata of all data source ids listed in the inputs of the ScriptDefinitionare acquired from the Signal Service.
The modal dialog of the Script Editor, shown in Figure 3.13, is divided into the followingparts:
1. Outputs
A list box is filled with all ScriptDefinition objects received from the Scripts Service andshows for each ScriptDefinition the name of all defined data sources in the outputs ofthe ScriptDefinition. The name was hereby initially defined in the OutputDeclarations inthe metadata section of the Custom Scripts block (see Section 3.5.1).
65

3 Infrastructure for the Web Visualization
2. Inputs
The names of all inputs of the ScriptDefinition object, which is selected in the Outputslist box, are listed here. The name of the data source is hereby obtained, as describedabove, from the Signal Service, when the Script Editor opens.
Figure 3.13: Scripts Editor for the Custom Presentation Logic
3. Code
The CodeMirror2 text editor is hosted in the Script Editor to show the JavaScript code,which was requested from the external script snippet file, with syntax highlighting andto allow to adapt the presentation logic. Before the script snippet is loaded inside theCodeMirror text editor, all data source ids are replaced by the name of the data sourcesobtained from the Signal Service and from the OutputDeclarations similar as for theOutputs and Inputs section. When comparing, the code displayed by the CodeMirror
2CodeMirror: JavaScript text editor https://codemirror.net/
66

3 Infrastructure for the Web Visualization
text editor in Figure 3.13 and the original script snipped file shown in Listing 3.5 onpage 63, it can be seen that all data source ids, such as act dyno speed, are replacedby their names, that is SPEED. In this way, the user always sees the names of the usedPUMA resources of the current environment, for example TORQUE for the English andIstmoment for the German environment.
4. Update Code
When the user submits any changes in the code editor with the Evaluate button, thepreviously data source names are translated again to their ids and stored back to theScripts Service, where the corresponding web worker is updated with the modified code(see Section 3.5.2).
67

4 Visualization Library for WebApplications
4.1 Structure of the Library
Similar as the infrastructure for the web visualization described in Chapter 3, thevisualization library is bundled in a single Angular 2 module. In this way, it is guaranteedthat the visualization library can be reused in multiple applications by simply insertingthe module into an Angular 2 application. An important point here is that the Angular 2module of visualization library is independent of any other Angular 2 module such as themodule for the infrastructure.
Figure 4.1: Library Stack of the AVL HTML5 Visualization Library
68

4 Visualization Library for Web Applications
The layered structure of the visualization library is presented in Figure 4.1 and can besummarized as follows:
� AVL HTML5 Applications: As already mentioned, the visualization library itselfis independent of any other Angular 2 modules and thus can be used by anyother web application which is based on the Angular 2 framework, for example theweb visualization in the POI. The corporate-wide use of the same library for webapplications ensure the same functionality of controls across all web applications.Furthermore, it decreases the development time of a new web application.
� AVL HTML5 Control & Forms: The visualization library provides currently twobasic blocks: controls and forms, both implemented as Angular 2 components.Whereby, controls only incorporate the View definition, styling and control-specificlogic, forms include further logic to access any necessary data from a server. Allcontrols and forms of the visualization library provide a common interface in formof an Angular 2 component to other web applications. In this way, any changes inthe third-party libraries are decoupled from the business logic in the web application(see Section 2.3.2). In addition, to the style definition of each control, severalcommon style definitions are deployed by the library using Sass-Styles, whichextend the CSS syntax towards a better management of multiple stylesheet files.These common style definitions allow a consistent corporate styling across all webapplications, which uses the visualization library.
� Third-Party HTML5 Controls: Third-party libraries mainly based on JavaScriptand the jQuery DOM manipulation library are used in the visualization library withan Angular 2 component wrapper, for example the multi-series line chart of theFusionCharts library is wrapped by a XtControl Angular 2 component.
� Third-Party HTML5 Frameworks & Libraries: At the bottom of the librarystack, all frameworks and libraries are listed which enable the overall web application,for example Angular 2 for the SPA development, RxJS for the asynchronous HTTPfunctionality and MaterializeCSS for a responsive design of the web application.Every web application which consumes the visualization library needs to align withthe used technology stack listed here to ensure the best overall performance ofthe application.
69

4 Visualization Library for Web Applications
4.2 The Alphanumeric Control as a ModelExample for a Control of the VisualizationLibrary
The alphanumeric control is used here as a model example of a control of the visualizationlibrary. Every control of the visualization library implemented as an Angular 2 componentconsists of three files, following the Angular 2 style guide (Angular Team, 2016) (seealso Figure 4.2):
Figure 4.2: Library Stack of the AVL HTML5 Visualization Library
� Template: The template is a HTML file extended by Angular 2 keywords anddescribes the view of the control, that is the composition of elements representedlater in the DOM.
� Style Definition: In a Sass-Style, all relevant style definitions of the visualizationlibrary are referenced and additional control-specific style rules are added.
� Angular 2 Component Definition: The Angular 2 component definition consistsof a TypeScript file, which references the template and the style definition file.Furthermore, control-specific logic such as presentation logic can be added in thecomponent definition. Every control of the visualization implements the AvlControlinterface, which enables the use of every control in applications such as for theextended POI visualization described in Chapter 3. As an example of an Angular 2component definition, the definition for the alphanumeric control is shown inListing 4.1.
70

4 Visualization Library for Web Applications
Listing 4.1: Angular 2 Component Definition of the Alphanumeric Control
1 @Component ({
2 selector: 'avl -alpha -num -control ',
3 templateUrl: './ avl_alpha_num_control.html ',
4 styleUrls: [
5 './ avl_common_styles.scss ',
6 './ avl_alpha_num_control.scss '
7 ]
8 })
9 export class AvlAlphaNumControl implements AvlControl
10 {
11 @Input () identifier: string;
12 @Input () name: string = 'Name ';
13 @Input () value: number = 0;
14 @Input () unit: string = 'Unit ';
1516 ...
17 }
4.3 The Xt-Control as an Implementation of aMulti-Series Line Chart
In addition to the alphanumeric control, a xt-control was implemented to show theevolution of data sources in form of a multi-series line chart retrieved, for example, from theASAccessServer API. Currently, two technologies exist in a state-of-the-art web browserto implement such as multi-series line chart: (i) the Scalable Vector Graphics (SVG)and (ii) the Canvas technology. To examine the advantages and disadvantages of bothtechnologies, two xt-controls were implemented each using one of the listed technologies.Similar as for the alphanumeric control, both implementations of the xt-control areimplemented as an Angular 2 Component and provide the same interface in form of acomponent definition to the web application. As can be seen in Listing 4.2, currently,both xt-controls only support to draw the evolution of two data sources provided by thetwo input parameters value1 and value2. Similar as for the alphanumeric control, theunit of the data source and a descriptive name of the data source can be displayed bythe xt-control.
71

4 Visualization Library for Web Applications
As already mentioned, the xt-controls use the SVG and the Canvas technology. Therefore,the third-party library CanvasJS 1 for the Canvas technology and the FusionCharts 2
library for the SVG technology were wrapped by the corresponding Angular 2 Component.To indicate when the wrapped multi-series chart needs to be updated, a timeStamp inputparameter was introduced. Whenever this input parameter changes, the current datasource values given by the other input parameters are forwarded to the correspondingAPI call of the wrapped library.
Listing 4.2: Angular 2 Component Definition of the Xt-Control
1 @Component ({
2 selector: 'avl -xt -control ',
3 template: './ avl_xt_control.html ',
4 styleUrls: [
5 './ avl_common_styles.scss ',
6 './ avl_xt_control.scss '
7 ]
8 })
9 export class AvlXtControl implements AvlControl {
10 @Input () identifier: string;
11 @Input () timeStamp: number = 0;
12 @Input () name1: string = 'Name 1';
13 @Input () value1: number = 0;
14 @Input () unit1: string = 'Unit 1';
1516 @Input () name2: string = 'Name 2';
17 @Input () value2: number = 0;
18 @Input () unit2: string = 'Unit 2';
1920 ...
21 }
In addition to the described alphanumeric and xt-control, the visualization library currentlyconsists of two standalone forms, which can be used independently of other Angular 2modules for the visualization, as described in Chapter 3, to display the current state ofthe automation system and act thereby as implementation of an external client presentedin Section 1.4.
1CanvasJS: HTML5 JavaScript charting library http://canvasjs.com2FusionCharts: JavaScript charts for web and mobile http://fusioncharts.com
72

5 Performance Evaluation
5.1 Evaluation Setup
For the evaluation of the performance impact of the web visualization on the automationsystem, several measurements were run on a Dell Latitude E6530 laptop with an i7-3740QM processor, which has four physical cores running at 2.70GHz. Enabled by theIntel®Hyper-Threading Technology described in Intel (2016), the execution resourcesof one physical core can be shared within two independent processors each holding anarchitectural state and denoted as logical processors (Marr et al., 2002).
The PUMA Open�2 (Release 3) automation system is installed on the same laptop,which requires the installation of the INtime for Windows real-time operating system.The INtime operating system is configured through the installation of the automationsystem to occupy one logical core of the processor. Hence, only seven of the eight logicalcores of the i7 processor were available for the performance evaluation.
All measurements were evaluated on the following web browsers, based on the three mostused web browsers for the Windows operating system during 2015 and 2016 (StatCounter,2016):
� Google Chrome v50,� Mozilla Firefox 45.0.2,� Internet Explorer (IE) 11.
With the Windows Performance Monitoring Tool, which is integrated into the Windowsoperating system, the processor load and the memory usage of the relevant processes ofthe above listed web browsers were recorded over a time span of ten minutes for eachmeasurement (Microsoft, 2016c). The processor load of the specific browser processwas hereby measured by the % Processor Time performance counter of the WindowPerformance Monitoring Tool, which is the percentage of time one logical processor wasbusy servicing the measured process (Microsoft TechNet, 2016).
73

5 Performance Evaluation
The memory usage is described by the Private Working Set performance counter ofthe process and stands for the total physical memory, that is the Random-AccessMemory (RAM), used by the process (Russinovich, Solomon, and Ionescu, 2012, Chapter10). The time between two consecutive sampled values were set to the smallest availabletimespan of one second. For all evaluated web browsers, the hardware acceleration wasenabled by default, this means that the Graphics Processing Unit (GPU) can be utilizedby the web browser to accelerate the compositing and rasterization of the Web Window(see Section 5.4). The term compositing describes here the process to calculate theactual size and position of all elements described by the DOM.
As described in Reis and Gribble (2009) and The Chromium Projects (2016b), the GoogleChrome web browser based on the open-source Chromium web browser, spawns a separateprocess for the UI frame of the web browser (browser process), for example the navigationbar, and for each browser tab a separate process to render the content of the tab itself(render process). In addition, a process is started by the Google Chrome web browserfor the GPU accelerated rendering (GPU process, see Wiltziusa, Kokkevis, and ChromeGraphics team (2014)). A similar process model, denoted as Loosely-Coupled InternetExplorer (LCIE) in Zeigler (2008) and Crowley (2010, Chapter 1), is implemented forthe IE, in which the browser window in this context named as the UI frame resides inone common process (browser process) and each tab runs in a separate process (renderprocess). In the version of the Firefox browser used for the performance measurements,the same process is used for the actual browser UI and the content of the tabs (MozillaDeveloper Network, 2016). Future versions of the Firefox browsers will align with theprocess model of the IE and the Google Chrome browsers known under the FirefoxElectrolysis architecture (Dotzler and Lassey, 2016).
In order to collect the full activity of all web browsers, the performance counters of thefollowing processes were recorded by the Windows Performance Monitoring Tool:
� Google Chrome: chrome.exe (browser process), chrome.exe (render process),chrome.exe (GPU process),
� Mozilla Firefox: firefox.exe (browser process),� IE11: iexplore.exe (browser process), iexplore.exe (render process).
In addition to the three listed browsers, the IE was integrated into the POI using theWeb Browser Control provided through a Component Object Model (COM) interface(Shdocvw.dll) described in Crowley (2010, Chapter 11), Microsoft Software DeveloperNetwork (2016b) and Microsoft Software Developer Network (2016a). Similar as for thestandalone web browsers, the processor load and memory usage of the relevant processwere recorded (iexplorerhost.exe), here abbreviated as Hosted IE. When using the WebBrowser Control the following registry keys must be set to guarantee that the current
74

5 Performance Evaluation
version of the Internet Explorer is used and the hardware rendering is enabled (MicrosoftSoftware Developer Network, 2012; Microsoft Software Developer Network, 2014).
� FEATURE BROWSER EMULATION: 0x11000 for IE11,� FEATURE GPU RENDERING: 1 to enable hardware rendering.
For a fair comparison between all web browsers and the hosted IE, the processor loadand memory usage of all processes of the corresponding web browser are summed up. Inaddition, similar test cases as described in the next sections are setup with the nativevisualization for the current visualization in the POI (see Section 1.2). Hereby, theprocessor load and private working set of the relevant process (poi.exe) was recordedusing the same settings of the Windows Performance Monitoring Tool. For all test casesfor the POI, the values are simulated with the Multi-Function-Generator (MFG) parameterblock of the PUMA automation system. The reserve channels RESCHA40-RESCHA48are set to generated sawtooth signal of 50Hz frequency to guarantee that every 10Hz alldisplayed values change.
The test setup can be summarized as follows:
� Hardware: Dell Latitude E6530 laptop (i7-3740QM processor, 2.7GHz),� Metrics: Processor Load [%], Private Working Set [MB],� Test duration: 10 minutes, 1 sample per second,� Browsers: Google Chrome, Mozilla Firefox, IE11, Hosted IE11,� Current Visualization: Comparison with the POI.
5.2 Alphanumeric Test Cases
For a first benchmark, the processor load and memory usage for a Web Window with 20alphanumeric controls of the visualization library were measured. The PUMA Open� 2provides 9 reserve channels (RESCHA40-RESCHA48), which are not mapped by defaultto a real measurement value and can be set through an user configuration to a generatedsignal within the automation system, for example to a signal with a sine or rectanglewaveform. These 9 channels are visualized by the 20 alphanumeric controls in the firstbenchmark, whereby the channels are displayed in order: 7 control pairs show RESCHA42-RESCHA48 and two triplets show RESCHA40 and RESCHA41.
As presented in Figure 5.1, the infrastructure with the layered architecture describedin Chapter 3 was used and the update rate for the long polling in the Backend Access
75

5 Performance Evaluation
layer (described in Section 3.3.5) was set to 100ms (10Hz). First performance measure-ments with the real ASAccessServer API implementation have shown that it can not beguaranteed that on each HTTP request, triggered by the client in the Backend Accesslayer, the ASAccessServer responds within the time interval. In order to avoid randommeasurement errors caused by these delays and to test only the client-side performance ofthe web visualization, the ASAccessServer API was mocked by a Node.js® test server 1,which generates random values for the 9 Signal data sources on each HTTP request (seeSection 1.3). In this way, it can be guaranteed that for each request a new value is re-turned and no delays occur caused by the internal implementation of the ASAccessServer.For a comparison between the web visualization and the current visualization in thePOI, the processor load and memory usage of the POI process was recorded. Hereby,the POI showed similar as in the test case for the web visualization a window with 20alphanumeric controls showing the values of the reserve channels as described above.
The alphanumeric base setup can be summarized as follows:
� Web Window: 20 alphanumeric controls,� Data Source: 9 Signal data sources, random values on each request,
10Hz polling rate,� Server: Node.js® test server.
Figure 5.1: Base Setup for the Evaluation of the Web Visualization
As can be seen in Table 5.1 on page 77 for the base setup with 20 alphanumeric controlsshowing 9 Signal data sources with an update rate of 10Hz, the hosted Internet Explorer
1Node.js® JavaScript runtime engine: https://nodejs.org
76

5 Performance Evaluation
performs best in terms of processor load (5.57% of one logical core) and memory usage(53.19MB RAM usage). This fact can be traced back that for the hosted Internet Explorer,that is the COM Web Browser Control, only the main functionality without the UserInterface, for example the address bar, is used.
When comparing the figures of the current visualization (POI column) with the figuresof the web visualization expressed by all other columns, the major drawback in terms ofprocessor load of the web visualization is outlined. Hereby, the rendering technology inevery web browser cannot compete with the rendering through the Windows API usedby the current visualization in the POI.
5.2.1 Increasing the Update Rate
To evaluate the impact of the update rate on the processor load and memory usage ofthe web visualization, the update rate was increased starting with 3Hz up to the rate ofthe base test setup of 10Hz. When comparing the evolution of the processor load of thefour web browsers in Figure 5.2, it can be seen again that the hosted IE outperforms forall update rates and shows a trend with a lower ascent towards higher update rates thanthe other web browser. Furthermore, the update rate of the visualization in the POI wassimilarly adapted in the poi.ini configuration file. Thereby, the processor load caused bythe POI process remained stable over all test cases.
Table 5.1: Processor Load [%] as a Function of the Update Rate
Update Rate [Hz] POI Chrome IE Firefox Hosted IE3 0.02 4.88 5.52 4.74 2.055 0.12 7.91 9.46 10.41 4.758 0.02 13.01 15.64 14.78 5.8910 0.01 16.45 19.23 18.14 5.57
The overall measurement results including the memory usage are summarized in Table 5.1and Table 5.2. The memory usage of all web browsers and the POI process remain herebyalmost constant and has only small fluctuations between the measurements. Similar asfor the processor load, the hosted IE performs best and needs about the half of the RAMas the standalone IE. Especially, the lower memory usage can be explained as follows:The hosted IE only spawns a single process representing the content of the web page(render process), instead of several processes as for example the Google Chrome webbrowser does.
77

5 Performance Evaluation
Table 5.2: Private Working Set [MB] as a Function of the Update Rate
Update Rate [Hz] POI Chrome IE Firefox Hosted IE3 43.68 211.87 109.95 224.39 45.805 43.57 213.23 127.89 197.21 51.748 43.94 210.14 118.94 198.39 51.9010 43.63 209.94 134.22 200.64 53.19
5.2.2 Increasing the Number of Controls
In addition to the update rate, the number of alphanumeric controls visualized by oneWeb Window was increased and again the processor load and memory usage werecollected. Figure 5.3 presents the linear rise of the processor load for all web browserswhen increasing the number of controls inside one Web Window.
Similar to the measurement with the increasing update rate, the hosted IE utilizes theleast processor time of all web browsers for the 20 controls and 40 controls test case. Afurther increase of the number of alphanumeric controls shows that the Firefox has abouthalf of the processor load as the Internet Explorer (see also Table 5.3). Especially, thedifference in the processor utilization of the web browsers when increasing the number ofwindows can be explained by the differences in the implementation details of the renderingengine of each web browser, that is Gecko for the Firefox, Blink as a fork from WebKitfor the Google Chrome and Trident for the IE and hosted IE web browser (Crowley, 2010;The Chromium Projects, 2016a).
Table 5.3: Processor Load [%] as a Function of the Number of Controls
Controls POI Chrome IE Firefox Hosted IE20 0.01 16.45 19.23 18.14 5.5740 0.04 24.55 35.41 23.60 20.3680 1.35 35.88 64.53 33.49 50.64100 3.92 47.66 81.47 38.96 64.07
When comparing the figures of the private working set used by the web browsers inTable 5.4, the memory usage fluctuates slightly between the measurements and thehosted IE needs again less RAM because of its simple process model.
78

5 Performance Evaluation
05
10
15
20
25
02
46
810
12
Processor Load [%]
Upd
ate
Rate
[H
z]
Ch
rom
eIE
Firefo
xH
oste
d I
EP
OI
Figure 5.2: Processor Load as a Function of the Update Rate
79

5 Performance Evaluation
0
20
40
60
80
100
020
40
60
80
100
120
Processor Load [%]
Num
ber
of C
ontr
ols
[1]
Chro
me
IEF
irefo
xH
oste
d IE
PO
I
Figure 5.3: Processor Load as a Function of the Number of Controls
80

5 Performance Evaluation
Table 5.4: Private Working Set [MB] as a Function of the Number of Controls
Controls POI Chrome IE Firefox Hosted IE20 43.63 209.94 134.22 200.64 53.1940 52.28 226.33 109.80 189.79 65.7080 52.35 238.66 120.32 211.51 78.65100 51.41 248.65 76.33 249.58 65.27
5.2.3 Root-Cause Analysis
For a more detailed evaluation of the performance impact, a root-cause analysis wasconducted in which parts of the infrastructure were either bypassed or modified towardsa deeper understanding of the presented figures in Section 5.2.1 and Section 5.2.2. In afirst step, the same base setup as described above was used, however, both the DataService and Control Service were bypassed (see Figure 5.4). In this way, the impact ofthe dynamical binding of data sources to controls, described in Section 3.4.2, can beevaluated.
Figure 5.4: Bypassing the Control Service and Data Service
As a second test case, again the same setup was used, however, the Node.js® test serverwas omitted and the same 9 Signal data sources were generated on the client-side insidethe Signal Service of the infrastructure (see Figure 5.5). In this way, the performanceimpact of the long polling in the Signal Service (see Section 3.3.5) can be evaluated.
81

5 Performance Evaluation
Figure 5.5: Random Data generated inside the Signal Service
Finally, the same base setup was used, however, instead of random values the Node.js®
test server responded to each request with a constant value. Through this test case, itcan be seen which part of the processor load is caused by the re-rendering of the DOMwith the changed Signal data source values.
The three test cases can be summarized as follows:
� Dynamic Binding: Base test setup,� Static Binding: Bypassed Control Service and Data Service,� No Long Polling: Random values are generated inside Signal Service (no client-
server interaction),� Constant Data: Server responses with constant values.
All three test cases were conducted with 20 (base setup) and 100 alphanumeric controlsinside a Web Window. For both test cases, the figures from the IE and the hosted IEdeviate from the figures of the Chrome and the Firefox web browser. This fact can beexplained through some functionality standardized in ECMAScript 2015 Version 6 (ES6)that is in contrast to the Chrome and Firefox web browser not implemented by the IE andhence, in the hosted IE, and must be provided by less performant polyfill implementationsin JavaScript. For example the ES6 Map collection used often in the Data Service orControl Service to hold all data sources or a reference to all controls needs to be providedby a JavaScript Object implementation.
When taking the difference between the figures of the Dynamic Binding and StaticBinding test case in Figure 5.6 and Figure 5.7, it can be concluded that about 5-8% ofthe processor load is caused by the dynamic assignment of data sources to control inputsimplemented in the Control Service and the Data Service (Chrome: 5% for 20 and 6.7%for 100 controls, Firefox: 8.43% for 20 and 8.3% for 100 controls).
82

5 Performance Evaluation
16.4
5 19.2
3
18
.14
5.5
7
11
.45
17.8
4
9.7
1
3.5
5
12
.08
17
.79
8.9
2
4.0
5
9.4
4
4.7
2
10
.16
1.2
5
Chrome IE Firefox Hosted IE
Pro
cessor
Load [
%]
Dynamic Binding Static Binding No Long Polling Constant Data
Figure 5.6: Root-Cause Analysis for 20 Controls
47.6
6
81.4
7
38.9
6
63.0
7
40.9
6
79.2
1
30.6
6
72.5
8
39.7
4
83.7
9
26.5
8
66.2
3
5.9
9 13.1
2
7.3
3
1.1
9
Chrome IE Firefox Hosted IE
Pro
cessor
Load [
%]
Dynamic Binding Static Binding No Long Polling Constant Data
Figure 5.7: Root-Cause Analysis for 100 Controls
Almost the same portion of the processor load can be assigned to the long polling in theSignal Service, when setting the figures for the Dynamic Binding and for the No LongPolling test case to each other in relation (Chrome: 4.37% for 20 and 7.92% for 100controls, Firefox: 9.22% for 20 and 12.38% for 100 controls).
Due to the change detection system of the Angular framework (see Section 2.1.4and 2.2.3), for the Constant Data test case the received data from the server is comparedwith the previous data stored into the Angular Component tree and hence, the DOM is
83

5 Performance Evaluation
not updated. This causes the minor fraction of the processor load presented in Figure 5.6and Figure 5.7 when only constant data is sent by the server and outlines, when thefigures are compared with a test case in which the data source values changes periodically,the part of the web visualization which causes the most processor load, the re-renderingof the DOM with new data source values.
5.3 Framework Evaluation
Further measurements were conducted to evaluate the impact of the used frameworkon the processor load of the automation system. For this reason, the infrastructure, aspresented in Chapter 3 was re-implemented using the React JavaScript library developedby the Facebook team (see Section 2.1.4). The alphanumeric control of the visualizationlibrary (see Chapter 4) was re-implemented by a React Component and all AngularServices such as the Data Service or Control Service were implemented by ES6 classes touse the services in combination with the React library.
In addition, a basic example was implemented in JavaScript without any external libraryor framework based on the native web browser API and shall outline the processor loadof the three basic operations without a framework or library:
� HTTP: Trigger the HTTP request and process the response of the server.� Control search: Find the DOM element of the control in the DOM tree.� Control update: Update the part of the DOM to visualize the new content by
the found control.
The alphanumeric control was constructed in memory by the DOM API defined in Hors etal. (2000), for example document.createElement(), when the page was initially loadedand was reused to fill the DOM with 20 controls or 100 controls. To identify later eachcontrol inside the DOM, an unique identifier was assigned as a HTML attribute to thecontrol when it is created. For a basic HTTP functionality, the XMLHttpRequest objectwas used available in all web browser, that is to retrieve the same 9 Signal data sourcesvia the ASAccessServer API with an update rate of 10Hz as in the base setup described inSection 5.1. On each received response from the Node.js® test server, the DOM elementrepresenting a control was found in the DOM by the document.getElementById()
method. The received value was then updated to the control or DOM element, respectively,setting the value to its element.textContent property.
In Figure 5.8 and Figure 5.9 the measurement results of the base setup are presented,where it can be seen that no major difference especially for the Chrome web browser
84

5 Performance Evaluation
between the Angular framework and React library in terms of processor load exists. Whencomparing the figures from the Angular framework or the React library with the pureJavaScript implementation, the figures confirm the conclusion drawn from measurementsin Section 5.2.3, that most of the processor load is caused by the rendering of theDOM.
16.4
5 19.2
3
18
.14
5.5
7
16.8
4
20.8
3
21.2
1
6.0
3
12.2
2
9.1
5 11
.27
0.0
4
Chrome IE Firefox Hosted IE
Pro
cessor
Load [
%]
Angular React JS
Figure 5.8: Comparison between Frameworks with 20 Controls
47.6
6
81.4
7
38.9
6
63.0
7
40.5
3
89.1
6
53.7
8
69.1
1
27.2
0
26.4
2
24.9
4
14.9
9
Chrome IE Firefox Hosted IE
Pro
cessor
Load [
%]
Angular React JS
Figure 5.9: Comparison between Frameworks with 100 Controls
85

5 Performance Evaluation
5.4 Hardware Rendering
For an evaluation of the influence of the hardware rendering, that is the compositing andrasterization supported by the GPU described in Garsiel and Irish (2011), on the processorload, the hardware rendering was turned off for all web browsers and the same base testwas run for 20 and 100 alphanumeric controls (see Section 5.1). In the Firefox, Chromeand IE web browser, an explicit setting exists to turn off the hardware rendering and touse software rendering instead. For the hosted IE, the relevant registry key described inSection 5.1 must be set to zero.
16.4
5
19.2
3
18.1
4
5.5
713.3
8 24.1
1
16.2
4
4.3
7
47.6
6
81.4
7
38.9
6
63.0
7
40.5
8
88.0
1
34.9
1
67.5
4
Chrome IE Firefox Hosted IE
Pro
cesso
r L
oa
d [
%]
Hardware Rendering 20 Controls No Hardware Rendering 20 Controls
Hardware Rendering 100 Controls No Hardware Rendering 100 Controls
Figure 5.10: Influence of Hardware Rendering on the Processor Load
As can be seen in Figure 5.10, for the Chrome and the Firefox web browser the hardwarerendering brings no benefits in terms of processor load, quite the contrary, the processoris used from two up to seven percent less when the software rendering is used insteadof the hardware rendering. This can be explained as follows: For each new Signal datasource value only the DOM text element of the alphanumeric control needs to be updatedand hence, the process of compositing and rasterization offloaded to the GPU can notbe fully utilized. In this way, especially for the Chrome web browser, it needs moreprocessor load to keep the separate GPU process alive and enable the Inter-ProcessCommunication (IPC) between the GPU process and the render process than to rasterizethe updated bitmap entirely in the Central Processing Unit (CPU) (The ChromiumProjects, 2016c; Wiltziusa, Kokkevis, and Chrome Graphics team, 2014).
86
5 Performance Evaluation
The Internet Explorer, particularly, can exploit the support of the hardware and usesabout five percent less of the processor when the hardware rendering is turned on, whichcan be a result of the better integration of the platform specific Microsoft WindowsDirectX graphics API used to facilitate the graphic card (Internet Explorer Team Blog,2010).
5.5 Xt-Control Test Cases
To evaluate the performance impact of a xt-control from the visualization library (seeChapter 4.3), a test setup was run similar to the alphanumeric test cases described inSection 5.1. Therefore, the Node.js® test server is again polled by the Signal Service inthe Backend Access layer with an update rate of 10Hz.
In the visualization library described in Chapter 4.3, two xt-controls were implementedusing the SVG and the HTML5 Canvas drawing technology. Both xt-controls visualizesthe evolution of two Signal data sources obtained from the Node.js® test server via theControl Service and Signal Service. Therefore, the data source values are first stored in aring buffer with a fixed size of 100 samples inside both xt-controls. Then, the control isupdated with the content of the ring buffer. Furthermore, the hardware rendering wasdisabled similar as in Section 5.4 to present the impact of the hardware acceleration onthe processor load for both xt-controls.
Similar as for the alphanumeric test cases, in the POI desktop application a windowwas created showing a multi-series line chart with the same two channels as in the webvisualization. The number of displayed values were set again to 100 samples and theupdate rate of the POI was configured to 10Hz. The POI process showing the multi-seriesline graphic caused a processor load of 0.01% and needed 55.90MB RAM.
In Figure 5.11 the processor load of the xt-control using SVG for drawing the two Signaldata sources is compared against the xt-control using a HTML5 Canvas element. Thext-control using the SVG technology adds an additional SVG element for every update ofa Signal data sources, for example a circle for a data point, and hence, a DOM elementneeds to be created and added to the existing DOM elements for each request, that isevery 100ms. In addition, all existing SVG DOM elements must be updated to visualizein combination with the new DOM element the evolution of the Signal data source.
87

5 Performance Evaluation
104.5
8
109.6
7
110.0
2
108.2
9
104.3
8
113.4
4
106.4
4
109.8
4
17.3
9 28.9
0
34.8
8
12.8
5
15.0
3
39.5
0
19.1
6
13.1
7
Chrome IE Firefox Hosted IE
Pro
cessor
Load [
%]
SVG - Hardware Rendering SVG - No Hardware Rendering
Canvas - Hardware Rendering Canvas - No Hardware Rendering
Figure 5.11: Difference between SVG and Canvas Technology
In contrast to that, the Canvas xt-control exists only of one HTML Canvas elementproviding a raster graphics image to which the evolution of the Signal data source isdrawn pixel wise. The impact of the computational expensive DOM operations for theSVG xt-control in relation to the simple Canvas painting, can be seen in Figure 5.11,where the SVG xt-control needs up to six times more processor time than the Canvasxt-control. Additionally, similar as in the test case described in Section 5.4, the hardwarerendering could not improve the processor load. Again, only the Internet Explorer canexploit the hardware rendering and hence, the processor was utilized about 5-10% lesswhen the hardware acceleration was turned on.
5.6 Test Cases on a Mobile Device
In addition to the test cases described above, similar test cases were run on a mobiledevice to evaluate the performance impact of the web visualization when it is usedfor remote monitoring of the actual testbed state. For this reason, the base test casewith 20 alphanumeric controls described in Section 5.2 was run on a Huawei Honor 5Xsmartphone with a Qualcomm Snapdragon 616 processor with 1.6GHz (8 cores) and
88

5 Performance Evaluation
2GB RAM. The latest Android 6.0 Marshmallow operating system was installed on theused smartphone and all test runs were performed with the Google Chrome for Androidv54 and the Mozilla Firefox for Android 50 web browser. The Android Debug Bridge(ADB) tool was used to record the total processor load and the memory usage of allrelevant processes of the web browser with a sampling interval of one second. Same asfor the test setup on the desktop computer, the performance figures of all processes ofeach web browser were summarized and averaged over a time period of 10 minutes. Onthe Android operating system, the resident set size (RSS) stands for the RAM used byeach process and was here used to outline the actual memory usage of the Chrome andFirefox web browser.
The test setup can be summarized as follows:
� Hardware: Huawei Honor 5X Smartphone (Qualcomm Snapdragon 616 processor,1.6GHz),
� Metrics: Processor Load [%], Resident Set Size [MB],� Test duration: 10 minutes, 1 sample per second,� Browsers: Google Chrome for Android, Mozilla Firefox for Android.
5.6.1 Alphanumeric Test Cases
In addition to the base test case, the number of controls per web window and the updaterate was increased. In Table 5.5 and Figure 5.13, the evolution of the processor load whenincreasing the update rate is shown. Hereby, similar as in the test cases performed on adesktop computer the processor load increases linearly with the processor load. Becauseof the fact that on a mobile phone only one browser tab can be simultaneously active,a maximum processor load of all test cases of about 12% is acceptable for the remotemonitoring. As already seen in the previous test cases, the memory usage expressed bythe RSS figures fluctuates slightly between the test cases and does not indicate the actualworking load of the test case.
Table 5.5: Processor Load and Resident Set Size as a Function of the Update Rate
Update RateProcessor Load [%] RSS [MB]Chrome Firefox Chrome Firefox
3 2.17 3.16 330.75 297.105 4.02 6.85 340.23 265.448 5.45 9.89 412.25 283.5610 9.56 11.81 394.34 280.21
89

5 Performance Evaluation
As can be seen in Table 5.6 and Figure 5.14, the processor load of both web browsersincreases linearly until the test case with 40 controls for the Firefox and with 80 controlsfor the Chrome web browser. When increasing the number of control per web windowfurther, the processor load saturates at about 15%. This can be explained as follows:When the number of controls exceeds a certain limit, the JavaScript engine cannot updateall controls during the 100ms time span until the next request is triggered. Therefore, notevery control is updated during the time span given by the 10Hz update rate. Because ofthe fact, that the most expensive operation in terms of performance is the re-renderingof the DOM or here, the DOM elements showing the actual value of the data source,the processor load increases not further when additional controls are added.
Table 5.6: Processor Load and Resident Size as a Function of the Number of Controls
ControlsProcessor Load [%] RSS [MB]Chrome Firefox Chrome Firefox
20 9.56 11.81 394.34 280.2140 11.46 14.96 527.63 293.2580 15.00 15.29 659.02 267.66100 15.17 15.10 714.13 299.02
5.6.2 Xt-Control Test Cases
In addition to the alphanumeric test cases, the same test cases using the multi-series linecharts of the visualization library are performed on a smartphone. Therefore, the twoimplementation of the multi-series line chart were configured to show the evolution oftwo data sources obtained from the test server with an update rate of 10Hz.
Although Figure 5.12 shows no major difference in terms of performance between thetwo implementations using the SVG and Canvas technology, the same problem exists asin the alphanumeric test cases for the xt-control using the SVG technology. Similar as forthe test cases with more than 40 alphanumeric controls, the JavaScript engine cannotupdate the position of all 100 displayed data points of the SVG xt-control during the100ms time frame. This causes a sluggish visualization of the data source evolution inthe xt-control using the SVG technology. In contrast to that, the simple pixel drawing ofthe xt-control using the Canvas technology updates every 100ms and shows a continuousrepresentation of the data source evolution.
90

5 Performance Evaluation
12.6
1
13.8
115.5
2
12.3
2
Chrome Firefox
Pro
cessor
Load [
%]
SVG Canvas
Figure 5.12: Difference between SVG and Canvas Technology on a Mobile Device
Both test cases using the Chrome and the Firefox web browser show with an maximumprocessor load of about 15% that the xt-control using the Canvas technology can beused on a mobile phone for remote monitoring of the current testbed state.
91

5 Performance Evaluation
02468
10
12
14
02
46
810
12
Processor Load [%]
Upd
ate
Rate
[H
z]
Ch
rom
eF
ire
fox
Figure 5.13: Processor Load as a Function of the Update Rate
92

5 Performance Evaluation
02468
10
12
14
16
18
020
40
60
80
100
120
Processor Load [%]
Nu
mb
er
of C
on
tro
ls [1
]
Ch
rom
eF
ire
fox
Figure 5.14: Processor Load as a Function of the Number of Controls
93

6 Conclusion
In the course of this work, a state-of-the-art SPA framework was used to extend the UIof the POI with a web visualization. An infrastructure was established that enables tostructure the web visualization similar as in the POI in separate windows each stored in asingle file and denoted here as a Web Window. The concept of independent Web Windowsenabled the reuse of existing visualizations across multiple testbeds. Furthermore, throughthe implemented infrastructure the testbed operator can adapt the visualization describedby a Web Window to the current testbed setup and test run. In this sense, the testbedoperator can assign different data sources retrieved from the automation system to acontrol inside the Web Window.
In addition, a solution was realized to run simple presentation logic inside the infrastructurefor example for limit monitoring or unit conversion. To avoid a blocking of the single-threaded JavaScript execution, all presentation logic was swapped out in a separateWeb Worker thread. In addition, predefined presentation logic stored in JavaScript filescan be included, which allows a reuse of logic such as unit conversion across severalWeb Windows. Modal dialogs were implemented to change the assigned data sourceto a control and to view or edit the custom presentation logic during the runtime ofthe SPA. In addition, all changes done by the testbed operator can be stored back intothe corresponding Web Window by a dedicated API of the automation system server.A functionality was implemented to insert existing Web Windows inside a new WebWindow to realize for example a tab control where each tab shows one Web Window.An important point to note is that every Web Window is independent of the enablinginfrastructure and thus, gives the possibility to extend the functionality or replace theenabling technology for example the used SPA framework without an adaption of theWeb Windows designed by the testbed operator.
As a basis for the web visualization, a concept for a visualization library was establishedfor web applications based on the Angular 2 SPA framework. A layered architecture wasproposed to enable the inclusion of third-party controls inside the visualization library.The Dependency Inversion Principle described in Section 2.3.1 was facilitated to decouplechanges of the third-party controls from the web application, which acts as the consumerof the library. The current state of the visualization library includes nine controls, such as
94

6 Conclusion
an alphanumeric, a bar chart, a custom button, a gauge, a custom text input, a warningindicator, for example for limit monitoring, and two xt-controls, for multi-line charts usingthe SVG or the HTML5 Canvas technology. In addition, two forms were implemented toshow either the current testbed status or a rendered picture of a POI window withoutthe need of an additional infrastructure.
For an impact analysis of the web visualization on the testbed, several test cases wererun and the processor load and the private working set was measured. For the basetest case with a 10Hz update rate and 20 alphanumeric controls showing 9 channels ofthe testbed, the Firefox, Chrome, and Internet Explorer (IE) needed between 15-20%processor load of one logical core. The Web Browser Control denoted here as hosted IE,which provides a COM interface for parts of the Internet Explorer, consumed about 6%processing time of one logical core (see also Section 5.2). Further test cases showed alinear dependency of the processor load on the update rate and the number of controlsper Web Window. For all test cases, the private working set remained almost stable atabout 200MB for the Firefox and Chrome web browser and at about 60-120MB for theIE and the hosted IE. The stable amount of the private working set could be traced backthat every web browser allocates at startup a dedicated amount of memory independentof its actual workload. When comparing the figures of the web visualization with thenative visualization of the POI (see Table 5.1 and Table 5.3 on page 77 and 78), the webbrowsers showing the web visualization cause up to 100% more processor load as thenative visualization. In terms of memory usage, the native visualization showed similarfigures as for the hosted IE (see Table 5.2 and Table 5.4).
Additionally, a comparison between an implementation of the infrastructure using An-gular 2 and React showed no major performance difference of the change detectionsystem explained in Section 2.2 for all test cases. A root-cause analysis revealed thatbetween 5-8% of the processor load is caused by the dynamic assignment of data sourcesimplemented in the infrastructure and almost the same amount is needed for the longpolling of the automation system server. Through a comparison of a test case withretrieved constant data, it could be concluded that the major part of the processor loadis caused by the re-rendering of the DOM. Furthermore, the impact analysis highlightedthat the support of the GPU for the rendering of the DOM cannot improve the processorload. Contrarily, the separate thread spawn for the hardware rendering caused an increaseof the total processor load. The implementation of the multi-line chart using the SVGand Canvas technology demonstrated the major advantage of the later technology interms of processor load (see Section 5.5).
As an overall conclusion of the performance measurements, the increase of the processorload when using the web visualization instead of the native visualization needs to be
95

6 Conclusion
taken into consideration. Although a reduced processor load of the web visualization canbe expected when using a more realistic update rate of about 5Hz, the same performancefigures cannot be expected as for the native visualization in the POI. Therefore, in afirst phase the web visualization can only, as originally planned, act as an extension ofthe current visualization. Hereby, the web visualization could provide, for example, astate-of-the-art representation of parts of the overall visualization of the automationsystem. Furthermore, it must be taken into consideration that the technology enablingthe web visualization was initially designed for a simple exchange of information in formof hypertext documents and not for real-time monitoring applications. For this reason, thesame concepts as currently implemented in the native visualization cannot be integratedto the web visualization without considering the resulting performance impact basedon the measurements presented in this work. To prevent any performance impact onthe automation system, the infrastructure could limit the number of controls per WebWindow and the number of Web Windows, which can be opened in parallel.
Finally, the current proposed infrastructure in combination with the visualization librarysimplifies the monitoring of the testbed status from a remote location and eases in thisway the support in case of an error of the automation system. Furthermore, the buildsetup established for the infrastructure and gathered knowhow can be reused for futureprojects and thus, accelerates the development of a web application across the AVL ListGmbH.
96

7 Future Prospects of the WebVisualization
The current solution implemented in this master’s thesis is proposed to work as anextension of the visualization of the POI. Thus, the controls, forms and modal dialogsof the visualization library and infrastructure are implemented for the use on a desktopcomputer and thus, are not optimized for smaller screen sizes. Future developmentsshould address this issue to have a better visual experience on mobile devices. In additionto the necessary adaptations of the modal dialogs for smaller screen sizes, a hybrid webapplication could be implemented mentioned in Section 2.1.3 and could benefit in thisway from the same JavaScript code base as for the web visualization in the POI. Such ahybrid web application could track the status of several testbeds in a test field and couldallow to notify the testbed engineer immediately if an error has occurred. In this way,costly idle time of testbeds could be avoided.
Currently, a predefined set of Web Windows exists and the testbed operator can eitheradapt the visualization during the runtime or edit the Web Window file in a text editor.For a more user-friendly approach to create custom visualizations, a designer could beimplemented which provides an UI to create a Web Window. The designer could includea tool bar, which lists all controls of the visualization library, and a region where controlsout of the tool bar can be placed. Furthermore, the designer could support the assignmentof real data sources retrieved from a testbed to the controls and the generation of a WebWindow file out of the design process.
In addition, the current implementation lacks the integration of a test framework describedin Section 2.1.3 and the complete coverage of the functionality by system and unit tests.Future works could add a test framework to the infrastructure and the visualizationlibrary and implement system and unit tests towards a test-driven development.
Through the established retrieval of JavaScript third-party modules via the node packagemanager 1 and the inherited dependency management, it is difficult to trace back the
1Node Package Manager: https://npmjs.com
97
7 Future Prospects of the Web Visualization
exact version of all modules at a specific point of time. This fact could lead to problemswhen it is necessary to restore a specific state of the code base to fix errors in a deployedversion of for example the visualization library. More advanced mechanisms of dependencymanagement introduced by the yarn package manager 2 could solve this problem.
Although the Web Browser control denoted in this work as hosted IE performed well inperformance tests, the underlying Internet Explorer does not support important parts ofthe new HTML5 features and web standards, such as the Web Components standard.Furthermore, the development of the Internet Explorer is discontinued and securityupdates will not be deployed in near future by Microsoft. For this reasons, the hosted IEshould be replaced by a state-of-the-art web browser that can be embedded in desktopapplications, such as the Chromium Embedded Framework (CEF), in favor of a bettersupport of all web standards inside the POI. In addition to the better support of webstandards, the use of the CEF could help to improve the processor load and memory usageof the web visualization. Because of the fact that the latest version of the Chromium webbrowser integrated in the CEF supports the SharedWorker standard, parts of the enablinginfrastructure, such as the long polling of the ASAccessServer in the BackendAccesslayer, could be moved to one shared thread. These parts could then be shared across allopen Web Windows and hence, the overall processor load of the web visualization couldbe decreased.
Furthermore, the Chromium web browser wrapped by the CEF could be configured ina way that similar as the hosted IE only one process is started instead of the threeprocesses (see Section 5.1). This configuration would decrease the memory usage of theChromium web browser to the same amount as for hosted IE or the native visualization inthe POI. Another optimization in terms of processor load could be achieved through thereplacement of the long polling in the BackendAccess layer by the WebSocket protocol.Hereby, the ASAccessServer could notify any client, that is the web visualization, when avalue of a PUMA resource has changed, and hence, the processor load caused by thelong polling in any client could be avoided.
Currently, Signal data sources provided by the ASAccessServer, as depicted in Figure 1.5on page 5 can be obtained from any client which is in the same network. Each activationobject needs to be explicitly configured if it should be provided through the Functioninterface of the ASAccessServer. Future developments could implement authenticationand authorization methods to enable the access of PUMA resources also from devices,which are not in the same network as the PUMA testbed.
2Yarn: Reliable and secure package manager https://yarnpkg.com/
98

Bibliography
Angular Team (2016). One Framework. - Angular 2. url: https://angular.io/(visited on 11/18/2016).
Archibald, Jake (2015). Tasks, microtasks, queues and schedules. url: https:
//jakearchibald.com/2015/tasks-microtasks-queues-and-schedules/.AVL List GmbH (2016a). Product Brochure Puma Open 2. url: https://avl.
com/documents/10138/2095827/Product+brochure+Puma+Open+2 (visited on11/18/2016).
— (2016b). Solutions Catalogue 2016. url: https://avl.com/html/static/emag/Solutionskatalog2016_EN/index.html (visited on 11/18/2016).
Bagwell, Phil (2001). “Ideal Hash Trees.” In: 1195.Barker, Tom (2012). “Web Performance Optimizations.” In: Pro JavaScript Perfor-
mance. Springer, pp. 109–137. isbn: 978-1-4302-4749-4.Berners-Lee, Tim, Roy Thomas Fielding, and Larry Masinter (2005). Uniform
Resource Identifier (URI): Generic Syntax. IETF RFC 3986. url: https:
//tools.ietf.org/html/rfc3986 (visited on 11/18/2016).Bille, Philip (2005). “A survey on tree edit distance and related problems.” In:
Theoretical Computer Science 337, pp. 217–239.Boduch, Adam (2016). Flux Architecture. Packt Publishing. isbn: 978-1-78646-
581-8.Chedeau, Christopher (2013). React’s Diff Algorithm. url: http://calendar.
perfplanet.com/2013/diff/ (visited on 11/18/2016).— (2014). React Architecture. url: http://blog.vjeux.com/2014/javascript/
react-architecture-oscon.html (visited on 11/18/2016).Chromium Team (2016). Blink Workers - Current architecture, implementation
and future project ideas for Blink Workers. url: https://docs.google.
com/document/d/1i3IA3TG00rpQ7MKlpNFYUF6EfLcV01_Cv3IYG_DjF7M/edit#
heading=h.7smox3ra3f6n (visited on 11/18/2016).
99

Bibliography
Craven, Adam (2016a). Fundamentals of Enterprise-Scale Behaviour-Driven Devel-opment (BDD). url: http://methodsandtools.com/archive/entreprisebdd.php (visited on 11/18/2016).
— (2016b). The Behaviour Specification Handbook. url: https://devzone.channeladam.com/library/bdd-behaviour-specification-handbook/ (visitedon 11/18/2016).
Crowley, Matthew (2010). Pro Internet Explorer 8 Development. Apress. 446 pp.isbn: 978-1-4302-2853-0.
Daggett, Mark E. (2013). Expert JavaScript. 1st. Apress. isbn: 978-1-4302-6097-4.De, Swarnendu (2014). Backbone.js Patterns and Best Practices. Packt Publishing.
isbn: 978-1-78328-357-6.Dotzler, Asa and Brad Lassey (2016). Mozilla Blog - What’s Next for Multi-process
Firefox. url: https://blog.mozilla.org/futurereleases/2016/08/02/
whats-next-for-multi-process-firefox/ (visited on 11/18/2016).Eastlake, D. and A. Panitz (1999). Reserved Top Level DNS Names. url: https:
//tools.ietf.org/pdf/rfc2606.pdf (visited on 11/18/2016).Eckstein, Robert, Marc Loy, and Dave Wood (1998). Java Swing. O’Reilly. isbn:
978-1-56592-455-0.Ecma International (2015). ECMAScript® 2015 Language Specification. Standard
ECMA-262 6th Edition. url: http://ecma-international.org/ecma-262/6.0/ (visited on 11/18/2016).
Eisenberg, Rob (2016). On Angular 2 and HTML Spec Compliance. url: http://eisenbergeffect.bluespire.com/on-angular-2-and-html/ (visited on11/18/2016).
Elliott, Eric (2014). Programming JavaScript Applications: Robust Web Architecturewith Node, HTML5, and Modern JS Libraries. 1st. O’Reilly. isbn: 978-1-4919-5029-6.
Evans, Eric (2014). Domain-Driven Design Reference: Definitions and PatternSummaries. Dog Ear Publishing, LLC. isbn: 978-1-4575-0119-7.
Facebook (2016a). Flux Online Documentation. url: https://facebook.github.io/flux (visited on 11/18/2016).
— (2016b). Immutable.js - Immutable collections for JavaScript. url: https:
//facebook.github.io/immutable-js/ (visited on 11/18/2016).Fain, Yakov, Victor Rasputnis, and Anatole Tartakovsky (2014). Enterprise Web
Development. O’Reilly. 609 pp. isbn: 978-1-4493-5681-1.
100

Bibliography
Fang, Tingting and Risto Lahdelma (2016). “Optimization of combined heat andpower production with heat storage based on sliding time window method.” In:Applied Energy 162, pp. 723–732. doi: 10.1016/j.apenergy.2015.10.135.
Fender, Joe and Carwin Young (2015). Front-End Fundamentals.Fette, I. and A. Melnikov (2011). The WebSocket Protocol. url: https://tools.
ietf.org/pdf/rfc6455.pdf (visited on 11/18/2016).Fielding, Roy Thomas (2000). “Architectural Styles and the Design of Network-
based Software Architectures.” PhD thesis.Flanagan, David (2011). JavaScript: The Definitive Guide. O’Reilly. XVI pp. isbn:
978-0-596-80552-4.Fowler, Martin (2002). Patterns of Enterprise Application Architecture. Addison
Wesley. isbn: 978-0-321-12742-6.— (2004). Inversion of Control Containers and the Dependency Injection pattern.
url: http://martinfowler.com/articles/injection.html%5C#ServiceLocatorVsDependencyInjection (visited on 11/18/2016).
— (2007). Mocks Aren’t Stubs. url: http://martinfowler.com/articles/
mocksArentStubs.html (visited on 11/18/2016).Freeman, Adam (2014). Pro AngularJS. 1st. Apress. isbn: 978-1-4302-6448-4.Gackenheimer, Cory (2015). Introduction to React. Apress. isbn: 978-1-4842-1245-
5.Gamma, Erich et al. (1995). Design Patterns: Elements of Reusable Object-oriented
Software. Addison-Wesley Longman Publishing Co., Inc. isbn: 978-0-201-63361-0.
Garrett, Jesse James (2005). Ajax: A New Approach to Web Applications. url:http://adaptivepath.org/ideas/ajax-new-approach-web-applications/
(visited on 11/18/2016).Garsiel, Tali and Paul Irish (2011). How Browsers Work: Behind the scenes of modern
web browsers. url: https://html5rocks.com/en/tutorials/internals/
howbrowserswork (visited on 11/18/2016).Gechev, Minko (2016a). Switching to Angular 2. Packt Publishing. isbn: 978-1-
78588-620-1.— (2016b). ViewChildren and ContentChildren in Angular 2. url: http://
blog.mgechev.com/2016/01/23/angular2-viewchildren-contentchildren-
difference-viewproviders/ (visited on 11/18/2016).Group, Web Hypertext Application Technology Working (2016). HTML Living
Standard. url: https://html.spec.whatwg.org/ (visited on 11/18/2016).
101

Bibliography
Hickson, Ian et al. (2016). HTML5, A vocabulary and associated APIs for HTMLand XHTML, W3C Recommendation 28 October 2014. url: https://w3.
org/TR/html5/ (visited on 11/18/2016).Hohpe, Gregor and Bobby Woolf (2003). Enterprise Integration Patterns: Designing,
Building, and Deploying Messaging Solutions. Addison-Wesley Professional.isbn: 978-0-321-20068-6.
Hors, Arnaud Le et al. (2000). W3C Document Object Model Core. url: https://w3.org/TR/2000/REC- DOM- Level- 2- Core- 20001113/core.html#ID-
2141741547 (visited on 11/18/2016).Intel (2016). 7th Generation Intel® Processors i7 Datasheet Volume 1 of 2. url:
http://intel.com/content/www/us/en/processors/core/7th-gen-core-
family-mobile-u-y-processor-lines-datasheet-vol-1.html (visited on11/18/2016).
Internet Explorer Team Blog (2010). The Architecture of Full Hardware Accelerationof All Web Page Content. url: https://blogs.msdn.microsoft.com/ie/2010/09/10/the-architecture-of-full-hardware-acceleration-of-all-
web-page-content/ (visited on 11/18/2016).Jansen, Remo H. (2016). The current state of dependency inversion in JavaScript.
url: http://blog.wolksoftware.com/the-current-state-of-dependency-inversion-in-javascript (visited on 11/18/2016).
Jbanov, Yegor and Tobias Bosch (2016). Design Document: Angular 2 RenderingArchitecture. url: https://docs.google.com/document/d/1M9FmT05Q6qpsjgvH1XvCm840yn2eWEg0PMskSQz7k4E/edit (visited on 11/18/2016).
Kambona, Kennedy, Elisa Gonzalez Boix, and Wolfgang De Meuter (2013). “AnEvaluation of Reactive Programming and Promises for Structuring CollaborativeWeb Applications.” In: Proceedings of the 7th Workshop on Dynamic Languagesand Applications. DYLA ’13. ACM, 3:1–3:9. isbn: 978-1-4503-2041-2. doi:10.1145/2489798.2489802. url: http://doi.acm.org/10.1145/2489798.2489802.
Kelonye, Mitchel (2014). Mastering Ember.js. Packt Publishing. isbn: 978-1-78398-198-4.
Knol, Alex (2013). Dependency Injection with AngularJS. Packt Publishing. isbn:978-1-78216-656-6.
Krasner, Glenn E and Stephen T Pope (1988). “A description of the model-view-controller user interface paradigm in the smalltalk-80 system.” In: Journal ofobject oriented programming 1.3, pp. 26–49.
102

Bibliography
Kuuskeri, Janne (2011). “Experiences on a Design Approach for Interactive WebApplications.” In: WebApps. Ed. by Armando Fox. USENIX Association.
Looper, Jen (2015). What is a WebView? url: http://developer.telerik.com/featured/what-is-a-webview/ (visited on 11/18/2016).
Marr, Deborah T. et al. (2002). “Hyper-Threading Technology Architecture andMicroarchitecture.” In: Intel Technology Journal 6.1, pp. 4–15. issn: 1535-766X. url: http://developer.intel.com/technology/itj/2002/volume
06issue01/vol6iss1_hyper_threading_technology.pdf.Martin, Robert C. (1997). “The Dependency Inversion Principle.” In: Object Mentor,
pp. 1–12.— (2000). “Design principles and design patterns.” In: Object Mentor, pp. 1–34.— (2008). Clean Code: A Handbook of Agile Software Craftsmanship. 1st ed.
Prentice Hall PTR. isbn: 978-0-13-235088-4.Microsoft (2016a). Default Document Documentation for IIS7. url: https://
iis.net/configreference/system.webserver/defaultdocument (visited on11/18/2016).
— (2016b). TypeScript Language. url: https://typescriptlang.org/ (visitedon 11/18/2016).
— (2016c). Windows Performance Monitor Webpage. url: https://techne
t.microsoft.com/en-us/library/cc749249(v=ws.11).aspx (visited on11/18/2016).
Microsoft Patterns and Practices Team (2009). Microsoft® Application Archi-tecture Guide (Patterns & Practices). Vol. 2nd Edition. url: https://msdn.microsoft.com/en-us/library/ff650706.aspx.
Microsoft Software Developer Network (2012). Internet Feature Controls - BrowserEmulation. url: https://msdn.microsoft.com/library/ee330730(v=vs.
85).aspx#browser_emulation (visited on 11/18/2016).— (2014). Internet Feature Controls - GPU Rendering. url: https://msdn.
microsoft.com/library/ee330730(v=vs.85).aspx#browser_emulation
(visited on 11/18/2016).— (2016a). Component Object Model Documentation. url: https://msdn.
microsoft.com/de-de/library/aa286559.aspx (visited on 11/18/2016).— (2016b). WebBrowser Control Reference. url: https://msdn.microsoft.
com/en-us/library/aa752040(v=vs.85).aspx (visited on 11/18/2016).Microsoft TechNet (2016). Windows Performance Monitoring Tool - Processor
Counters. url: https://technet.microsoft.com/en-us/library/cc938593.aspx (visited on 11/18/2016).
103

Bibliography
Mikowski, Michael and Josh Powell (2013). Single Page Web Applications:JavaScript end-to-end. 1st ed. Manning Publications. isbn: 978-1-61729-075-6.
Morales-Chaparro, R. et al. (2007). “MVC web design patterns and rich internetapplications.” In: Proceedings of the Jornadas de Ingenieria del Software y Bases de Datos.
Mozilla Developer Network (2016). Multiprocess Firefox. url: https://deve
loper.mozilla.org/en- US/Firefox/Multiprocess_Firefox (visited on11/18/2016).
Mustach Team (2016). Mustache: Logic-less Template Engine. url: https://
mustache.github.io/ (visited on 11/18/2016).Oakley, Glen and M. Pulimood (2012). “Optimized Performance of Web Applica-
tions.” In: The Elucidator, Vol. 1, No. 1, Article 1.Osmani, Addy (2012). Learning JavaScript Design Patterns. O’Reilly. 251 pp. isbn:
1449331815.Overson, Jarrod and Jason Strimpel (2015). Developing Web Components. O’Reilly.
250 pp. isbn: 978-1-4919-4902-3.Parviainen, Tero (2015). Change And Its Detection In JavaScript Frameworks. url:
https://teropa.info/blog/2015/03/02/change-and-its-detection-in-
javascript-frameworks.html (visited on 11/18/2016).Paulweber, Michael and Klaus Lebert (2014). Mess- und Prufstandstechnik. Springer
Vieweg. isbn: 978-3-658-04452-7. doi: 10.1007/978-3-658-04453-4.Pautasso, Cesare, Olaf Zimmermann, and Frank Leymann (2008). “Restful Web
Services vs. ”Big”’ Web Services: Making the Right Architectural Decision.” In:Proceedings of the 17th International Conference on World Wide Web. WWW’08. ACM, pp. 805–814. isbn: 978-1-60558-085-2. doi: 10.1145/1367497.
1367606.Petitit, Francois and Mickael Tricot (2014). The new Web application architectures
and their impacts for enterprises. url: http://blog.octo.com/en/new-web-application-architectures-and-impacts-for-enterprises-1/ (visited on11/18/2016).
Pisman, Kwinten (2016). How the hell does zone.js really work? url: http:
//blog.kwintenp.com/how-the-hell-do-zones-really-work/ (visited on11/18/2016).
Precht, Pascal (2016). Dependency Injection in Angular 2. url: http://blog.
thoughtram.io/angular/2015/05/18/dependency-injection-in-angular-
2.html (visited on 11/18/2016).
104

Bibliography
Ranganathan, Arun, Jonas Sicking, and Marijn Kruisselbrink (2016). W3C File API.url: https://w3c.github.io/FileAPI (visited on 11/18/2016).
Rauschmayer, Axel (2016). Exploring ES6 - Upgrade to the next version ofJavaScript. url: http://exploringjs.com/es6/index.html#toc_ch_
modules.React (2016). Reconciliation in the React Library. url: https://facebook.github.
io/react/docs/reconciliation.html (visited on 11/18/2016).Reis, Charles and Steven D. Gribble (2009). “Isolating Web Programs in Modern
Browser Architectures.” In: Proceedings of the 4th ACM European Conferenceon Computer Systems. EuroSys ’09. ACM, pp. 219–232. isbn: 978-1-60558-482-9. doi: 10.1145/1519065.1519090.
Rossi, Gusatvo et al. (2008). Web engineering: modelling and implementing webapplications. Vol. 12. Springer-Verlag New York Inc.
Russinovich, Mark E., David A. Solomon, and Alex Ionescu (2012). WindowsInternals. Microsoft Press,U.S. 672 pp. isbn: 978-0-7356-6587-3.
Schuchert, Brett L. (2013). DIP in the Wild. url: http://martinfowler.com/articles/dipInTheWild.html (visited on 11/18/2016).
Shklar, Leon and Rich Rosen (2009). Web Application Architecture. Wiley John +Sons. 440 pp. isbn: 978-0-470-51860-1.
StatCounter (2016). StatCounter Global Stats Web Browser Usage 2015-2016. url:http://gs.statcounter.com/#all-browser-ww-yearly-2015-2016-bar
(visited on 11/18/2016).Stefanov, Stoyan (2010). JavaScript Patterns. O’Reilly. 232 pp. isbn: 978-0-596-
80675-0.Templin, Reagan (2007). Understanding Sites, Applications, and Virtual Directories
on IIS 7. url: https://iis.net/learn/get- started/planning- your-
iis- architecture/understanding- sites- applications- and- virtual-
directories-on-iis (visited on 11/18/2016).The Chromium Projects (2016a). Blink: The Rendering Engine of Chromium. url:
https://chromium.org/blink (visited on 11/18/2016).— (2016b). Design Document: Chromium Multi-process Architecture. url: https:
//chromium.org/developers/design-documents/multi-process-architec
ture (visited on 11/18/2016).— (2016c). Design Document: Chromium Multi-process Architecture. url: https:
//chromium.org/developers/design-documents/multi-process-architec
ture (visited on 11/18/2016).
105

Bibliography
Wiltziusa, Tom, Vangelis Kokkevis, and the Chrome Graphics team (2014). DesignDocument: GPU Accelerated Compositing in Chrome. url: https://chromium.org/developers/design-documents/gpu-accelerated-compositing-in-
chrome (visited on 11/18/2016).Zeigler, Andy (2008). Internet Explorer Team Blog - IE8 and Loosely-Coupled IE
(LCIE). url: https://blogs.msdn.microsoft.com/ie/2008/03/11/ie8-
and-loosely-coupled-ie-lcie/ (visited on 11/18/2016).
106