design of an aircraft rolling bearings platform and its
TRANSCRIPT

714 Technical Gazette 25, 3(2018), 714-719
ISSN 1330-3651 (Print), ISSN 1848-6339 (Online) https://doi.org/10.17559/TV-20151209020051 Original scientific paper
Design of an Aircraft Rolling Bearings Platform and its Thermal Performance Evaluation
Zhihe DUAN, Tonghai WU, Yuelei ZHANG, Shuaiwei GUO, Z LI
Abstract: The thermal instability is one crucial factor leading to low bearing operation performance. This paper presents a novel experiment device for thermal performance investigation of an aircraft rolling bearings. A bidirectional fixing structure was designed to balance the spindle thermal deformation. The hydraulic loading was used and the oil injection manner was adopted in the new device. Experimental test was conducted using the new device and experimental results were compared with the calculation based on the temperature and thermal nodes theory. The comparison demonstrates that the temperature distribution trends between the theoretical and experimental results remained the same; specifically, the error between the theoretical and experimental results was 1.0 % under the condition of 200kg load and 2250 rpm driving speed. Consequently, the analysis result shows that the new device is feasible and reliable to provide precise thermal characteristics for the aircraft rolling bearings. Keywords: aircraft roller bearing; thermal performance; temperature nodes system; experimental device 1 INTRODUCTION
As a key component in aircraft, vessel, and wind
driven generator, the rolling element bearings are widely used and the reliability of the bearings directly affects the machine’s running condition and service performance [1]. Due to harsh operating condition (e.g. high temperature, high speed, and overload), the bearing failures frequently happened. According to statistics, the flight accidents and incidents caused by the main bearing failure account for 19% of the all mechanical system failures in the aircrafts [2, 3]. The thermal instability is a crucial factor leading to low bearing operation performance [4, 5]. Therefore it is urgent to investigate the dynamic characteristic of the aircraft rolling bearings.
Heat generation and transfer are two mostly concerned aspects in bearing’s thermal characteristics. The conventional lubrication theory generally assumes that the oil film is adiabatic or isothermal. This assumption limits the investigation of the bearing failure mechanism. In order to solve the thermal effect problem, the thermal distribution of the rolling bearing should be investigated [6]. Jacobsen observed the thermal instability of the oil film in bearing experiment for the first time. Barwell and Milne [7] explained the bearing failure mechanism based on the thermal instability of oil film. They found that the increase of the friction force will cause the rise of the lubricant temperature, leading to reduction of the oil viscosity and film rupture. Bell and Dyson [8] observed that the surface temperature of the friction parts rose up to 60.°C in a short time, which indicated the instability phenomenon of the lubricant film. Wang et al. [9] observed the bearing instability speed and found that the bearing temperature increased rapidly once the speed of the bearing exceeded the instability speed. Tong [10] investigated the shaft deformation taking the bearing temperature into account. Although there are numerous publications addressing the bearing thermal instability, the understanding of thermal characteristics is still insufficient due to a lack of systematic results.
In order to solve the aforementioned issues, a test platform was designed to investigate the thermal performance of the aircraft rolling bearings under different working conditions in this work. The thermal
nodes theoretical calculation and experimental tests were conducted to verify the efficacy of the new platform. The analysis result shows that this newly designed platform can be used to explore the thermal characteristics of the aircraft rolling bearings.
2 PERFORMANCE CHARACTERISTIC TEST PLATFORM
DESIGN The structure of the test platform is designed for
fulfilling the investigation requirements of the thermal characteristics of the bearings [11, 12]. Fig. 1 shows the schematic diagram of the test platform. The test platform consists of one shaft driving line, one loading system, one lubrication system, one signal acquisition system and one supporting base.
Figure 1 The schematic diagram of thermal characteristics of the bearing test
platform 2.1 Design of the Supporting Structure
The maximum operating temperature of the bearing test is around 80 °C, and the expansion calculation of the shaft system is required due to the shaft length change [13]. The thermal expansion can be expressed by Eq. (1)
,L T Lα∆ = ∆ (1)
where, ΔL is the shaft length change; ΔT is the change of the working temperature; α is the linear thermal

Zhihe DUAN et al.: Design of an Aircraft Rolling Bearings Platform and its Thermal Performance Evaluation
Tehnički vjesnik 25, 3(2018), 714-719 715
expansion coefficient of the shaft system; L is the shaft length.
In this paper, ΔT = 60 °C, α = 12×106 °C‒1, L = 800 mm, and ΔL = 0.576 mm.
If both ends of the shaft are fixed, the thermal expansion of the shaft can be adjusted by tuning the axial clearance between the outer cover and the end cover. Generally, the axial clearance is between 0.25 mm to 0.4 mm [14, 15]. When the shaft temperature is high, it is not able to satisfy the requirements of the shaft elongation range. Therefore, the test platform adopts bidirectional fix at one end and swimming bearing supporting at the other end. 2.2 Design of the Loading System
In this test platform, the radial loading force
generated by a hydraulic system is applied on the rolling bearings. As shown in Fig. 2, a V groove frame in the bottom of the bearing is used to guarantee the load stability. In order to ensure the alignment of the loading force to the bearing centre, a guide rail is processed on the V groove to control the movement of the bearing only along with the vertical direction.
Figure 2 Three-dimensional figure of loading system
2.3 Design of the Lubrication System
Considering the functions of lubrication and heating,
oil injection lubrication supply scheme is adopted for the test platform. In addition, the nozzle can provide lubricating oil to the radial clearance between cages of the bearings.
In order to inject the oil into the bearing inner cavity, it needs to overcome the resistance caused by the rotation ring, retainer and rolling body with the eddy current. Consequently, it should provide sufficient oil pressure. With the increase of the rotational speed, the oil supply pressure should be increased. The DN value (DN value refers to the inner diameter of the bearing and bearing speed) of the test bearing is 1.0×10⁶Error! Bookmark not
defined.mm·rpm, the minimum oil supply pressure is about 0.25 MPa, and the corresponding oil injection speed is about 18 m/s. 2.4 Design of the Signal Acquisition System
Conventional temperature sensors cannot directly measure temperature of the inner ring. When using the non-contact temperature sensor to measure the temperature of the inner ring, the measurement will be affected by the influence of the lubricating oil temperature and the bearing vibration. In order to solve this issue, the
magneto-electric temperature sensor is used in the test platform to collect the temperature data.
Four K-type thermocouple temperature sensors are adopted in the temperature measurement system with the circumferential distribution to measure the bearing outer ring. The sensors are numbered from 1 to 4, as shown in Fig. 3. The three-dimensional model of the test platform is shown in Fig.4. The National Instrument data logger (NI PCI-6010) is adopted to store the data into a computer.
Figure 3 Temperature sensors’ distribution
Figure 4 Three-dimensional model of the test platform
3 VERIFICATION OF THE TEST PLATFORM
Both numerical simulation and experiment test were
conducted to verify the thermal characteristics of the aircraft rolling bearings in this work.
3.1 Analysis of the Bearing Temperature Nodes
Temperature node system method of rolling bearing has been widely studied. Harris was the first one applying this method to low speed roller bearings and high speed ball bearings [16]. Satisfactory agreement was achieved between calculation and test results.
In this paper, the simplified model of the roller bearing is established according to Harris model [16]. There is a higher precision when more temperature nodes are set in the model. Although this model can effectively estimate the bearing temperature, it cannot obtain accurate result. The temperature node system is established in the simulation (see Fig. 5). The assumptions are adopted in the model: (1) same temperature distribution in the inner ring raceway and the outer ring; (2) same temperature distribution in the oil; (3) same temperature distribution in the bearing outer shaft end; (4) the bearing wall is isothermal.

Zhihe DUAN et al.: Design of an Aircraft Rolling Bearings Platform and its Thermal Performance Evaluation
716 Technical Gazette 25, 3(2018), 714-719
In Fig. 5, symbol A is the air temperature; symbol 1 is the oil temperature; symbol 2 is a shaft temperature; symbol 3 is the axle journal temperature; symbol 4 is the inner ring with roller contact site temperature; symbol 5 is the outer ring and rolling element contact site temperature; symbol 6 is the outer part in contact with the bearing temperature.
Figure 5 test bearing temperature nodes system
3.1.1 Calculation of the Power Consumption
Calculate the power loss of the bearing according to
Eq. (2).
41.047 10 ,H Mn−= × (2)
where, H is the heating rate; M is the torque; n is the rotating speed.
,l v fM M M M= + + (3) where, Ml is the friction torque caused by the load; Mv is the friction torque caused by the load of the roller and the side member; Mf is the friction torque caused by lubrication.
1 ,l mM f F dβ= (4)
1 ,y
s
s
Ff z
C
=
(5)
where, f1 is the correlation coefficient with bearing structure; Fs is the equivalent static load; Cs is the basic static load; dm is the bearing pitch circle diameter.
The empirical equation for the friction produced by lubricant is
( )2
7 330 010 ,v mM f v n d−= (6)
where, f0 is the coefficient associated with the bearing type; v0 is the lubricating oil viscosity; n is the rotation speed.
3.1.2 The Node Equations There are three basic types of heat transfer in
different temperature media, including the heat transfer, heat convection and heat radiation. The heat convection on the solid surface can be generally described by Eq. (7):
( )1 2 ,v vH h S T T= − (7)
where, hv is the surface heat transfer coefficient; S is the heat conduction area of the heat flow direction.
The transfer coefficient on the air bearing surface can be expressed as
( )0.2552.3 10 ,vh t tα−= × − (8)
The heat conduction is a linear function of the
temperature difference of the solid, which can be expressed as
( )1 2 ,ckSH T Td
= − (9)
where, d is the distance between two points, k is the thermal conductivity. The heat convection can be written as
( ) ,r rH h T Tα= − (10)
where, Tα is the surface temperature and hr is the nominal thermal radiation coefficient. According to the temperature node system, the node equations can be established as
( ) ( ) ( )
( ) ( )
( ) ( ) ( )
( ) ( )
( ) ( )
( ) ( ) ( )
3 1 1 3 1 4 1 2 4 1 5 1 3 5 1
33 2 2
3
2 41 3 1 2 2 3 4 3
2 4
31 4 1 4 3 4 4
3
61 5 1 5 6 5 5
6
0.2556 6 5 6 6 6
5
0
0
0
0
0
0
v v v
AA
v
v
v
A v A A
h S T T h S T T h S T TkS kSAT T T T
kS kSh S T T T T T T
kSh S T T T T H
kSh S T T T T H
kSh S T T T T h T Tα γ
ξ ξ
ξ ξ
ξ
ξ
ξ
− − −
−
−
−
− −
− + − + − =
− + − =
− + − + − =
− + − + =
− + − + =
− + − + − =
(11)
3.2 Tests on the Bearing Thermal Characteristics
On the basis of the completion of the test platform,
test program has been designed to investigate the influence of different factors on the thermal characteristics of the bearings and to verify the validity of the theoretical calculation using experimental data. It is therefore expected to provide an important test platform for the theoretical analysis of aircraft rolling bearings on the heat transfer characteristics.

Zhihe DUAN et al.: Design of an Aircraft Rolling Bearings Platform and its Thermal Performance Evaluation
Tehnički vjesnik 25, 3(2018), 714-719 717
3.2.1 Design of the Tests
In order to obtain the relationship between the test conditions and test results, it is necessary to find out the influencing factors and to determine the optimal combination of the parameters and the fluctuation range of the test results [17]. Therefore, in the orthogonal test, the load, speed, time three factors and two levels of each factor were designed [18]. The test scheme is shown in Table 1.
Table 1 L4(23) testing scheme table
Level Factors
A: load (kg)
B: time (minute)
C: speed (rpm)
1 100 15 1650 2 100 30 2250 3 200 15 2250 4 200 30 1650
3.2.2 The Node Equations
The E224HT bearing is used in the experiment. The
width of the E224HT bearing is 40 mm and the inner ring diameter is 143.5 mm. The operating ambient temperature is 20 °C. By putting these parameters into Eqs. (10)-(15) we can obtain the node equations as follows:
( ) ( ) ( )( ) ( )( ) ( ) ( )( ) ( )( ) ( )( ) ( )( )
3 1 4 1 5 1
3 2 2
1 2 2 3 4 3
1 4 3 4 4
1 5 6 5 55
6 5 60.255
6
32.45 39.79 118.52 0
63.081 28.387 0
32.45 63.081 70.544 0
39.797 70.544 0
118.52 1326.9 0
2.3 10 1326.9
2.3 10 0
A
A
A
T T T T T T
T T T T
T T T T T T
T T T T H
T T T T H
T T T T
T T
− + − + − =
− + − =
− + − + − =
− + − + =
− + − + =
× − + − +
+ × − =
(12)
where, H is obtained according to different operating conditions. Tab. 2 shows the analysis results.
Table 2 Temperature node system analysis results
T / °C 100 kg 1650 rpm
100 kg 2250 rpm
200 kg 1650 rpm
200 kg 2250 rpm
T1 36.46 47.39 37.19 48.39 T2 29.23 35.35 29.64 35.92 T3 33.38 42.27 33.98 43.08 T4 35.68 46.69 36.37 47.04 T5 37.57 49.23 38.34 50.29 T6 37.56 49.23 38.34 50.29
In Tab. 2, when the load is 100kg, the maximum
change of the temperature is 11.67 °C; when the load is 200 kg, the maximum change of the temperature is 11.95 °C. When the speed is 1650 rpm, the maximum change of the temperature is 0.78 °C; when the speed is 2250 rpm, the maximum change of the temperature is 1.08 °C. From these results, it can be seen that the speed is a more influential factor than the load.
It can be also noted that in Tab. 2 the temperature of nodes 5 was equal to node 6. This is because the nodes 5 and 6 were located inside and outside the outer wall, where the wall thickness is thin and the heat conduction coefficient of the bearing steel is large. The temperature
value of the nodes was T5=T6 > T1 > T4 > T3 > T2. T1 (the lubricating oil temperature) is the third largest value, which is consistent with the actual situation in the rolling bearings.
Figure 6 Thermostat
3.2.3 Test Results
The temperature sensors must be calibrated before the tests. The calibration was done in the thermostat (see Fig. 6). The data logger (NI PCI-6010) was used to obtain the real-time voltage data. The calibration results of temperature sensors are listed in Tab. 3.
As can be seen in Tab. 3 the value of voltage 1 is approximately equal to that of voltage 2 and the value of voltage 3 is approximately equal to that of voltage 4. Then, the polynomial fitting process is employed in the calibration.
Table 3 The calibration result of temperature sensors (Unit: V) Setting value / °C Voltage 1 Voltage 2 Voltage 3 Voltage 4
30.3 1.643 1.643 1.638 1.635 40.8 2.105 2.113 2.12 2.115 50.5 2.618 2.623 2.625 2.623 60 3.11 3.115 3.125 3.12 70 3.633 3.628 3.673 3.65 78 4.045 4.045 4.103 4.095
The calibration equations are shown in Eqs. (23) and
(24):
21,2 0.536 22.72 5.282,T x x= − + − (23)
23,4 0.714 23.34 5.788.T x x= − + − (24)
where, T1,2 is the calibration equation for voltage 1 and voltage 2; T3,4 is the calibration equation for voltage 3 and voltage 4. When the set value is 30.3 °C, T1,2 = 30.6 °C and T3,4 = 30.48 °C. The calibration error is below 1.0%. When the set value is 50.5 °C, T1,2 = 50.56 °C and T3,4 = 50.54 °C. The calibration error is below 0.1%. Consequently, the error of the calibration equations is acceptable. Hence, the experiment tests can be carried out based on the calibration equations. Fig. 6 depicts the test results. Since the initial temperature of the four tests is not
Zhihe DUAN et al.: Design of an Aircraft Rolling Bearings Platform and its Thermal Performance Evaluation
718 Technical Gazette 25, 3(2018), 714-719
the same and the stable maximum temperature has a relationship with the operating conditions, we use the temperature changing rate as the index instead of the maximum temperature in the experiments.
(a)
(b)
(c)
(d)
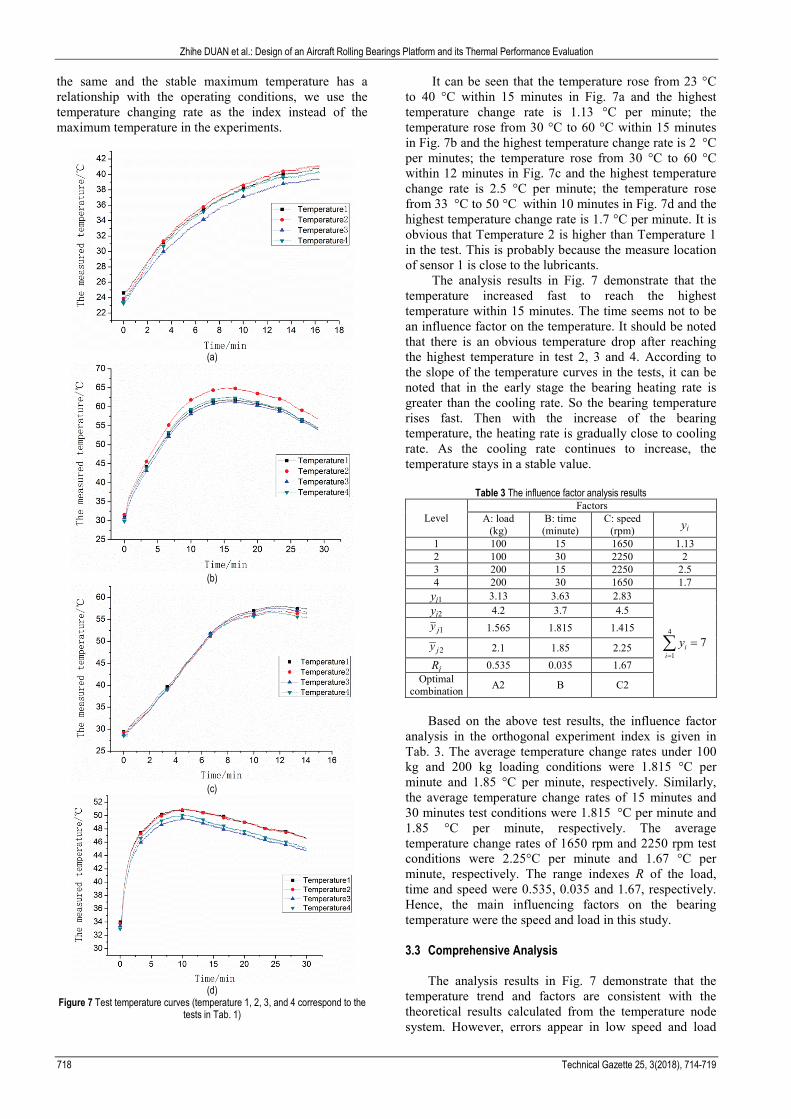
Figure 7 Test temperature curves (temperature 1, 2, 3, and 4 correspond to the tests in Tab. 1)
It can be seen that the temperature rose from 23 °C to 40 °C within 15 minutes in Fig. 7a and the highest temperature change rate is 1.13 °C per minute; the temperature rose from 30 °C to 60 °C within 15 minutes in Fig. 7b and the highest temperature change rate is 2 °C per minutes; the temperature rose from 30 °C to 60 °C within 12 minutes in Fig. 7c and the highest temperature change rate is 2.5 °C per minute; the temperature rose from 33 °C to 50 °C within 10 minutes in Fig. 7d and the highest temperature change rate is 1.7 °C per minute. It is obvious that Temperature 2 is higher than Temperature 1 in the test. This is probably because the measure location of sensor 1 is close to the lubricants.
The analysis results in Fig. 7 demonstrate that the temperature increased fast to reach the highest temperature within 15 minutes. The time seems not to be an influence factor on the temperature. It should be noted that there is an obvious temperature drop after reaching the highest temperature in test 2, 3 and 4. According to the slope of the temperature curves in the tests, it can be noted that in the early stage the bearing heating rate is greater than the cooling rate. So the bearing temperature rises fast. Then with the increase of the bearing temperature, the heating rate is gradually close to cooling rate. As the cooling rate continues to increase, the temperature stays in a stable value.
Table 3 The influence factor analysis results
Level Factors
A: load (kg)
B: time (minute)
C: speed (rpm) yi
1 100 15 1650 1.13 2 100 30 2250 2 3 200 15 2250 2.5 4 200 30 1650 1.7
yj1 3.13 3.63 2.83
4
17i
iy
=
=∑
yj2 4.2 3.7 4.5
1jy 1.565 1.815 1.415
2jy 2.1 1.85 2.25
Rj 0.535 0.035 1.67 Optimal
combination A2 B C2
Based on the above test results, the influence factor
analysis in the orthogonal experiment index is given in Tab. 3. The average temperature change rates under 100 kg and 200 kg loading conditions were 1.815 °C per minute and 1.85 °C per minute, respectively. Similarly, the average temperature change rates of 15 minutes and 30 minutes test conditions were 1.815 °C per minute and 1.85 °C per minute, respectively. The average temperature change rates of 1650 rpm and 2250 rpm test conditions were 2.25°C per minute and 1.67 °C per minute, respectively. The range indexes R of the load, time and speed were 0.535, 0.035 and 1.67, respectively. Hence, the main influencing factors on the bearing temperature were the speed and load in this study. 3.3 Comprehensive Analysis
The analysis results in Fig. 7 demonstrate that the temperature trend and factors are consistent with the theoretical results calculated from the temperature node system. However, errors appear in low speed and load

Zhihe DUAN et al.: Design of an Aircraft Rolling Bearings Platform and its Thermal Performance Evaluation
Tehnički vjesnik 25, 3(2018), 714-719 719
operating conditions between the theoretical and experimental results. This is because the assumption adopted by the temperature node system ignores a small amount of higher order power, whose magnitude may be different with the value of H in the theoretical calculation. In the condition under 200 kg load and 2250 rpm speed, the error is only 1.0%, namely, the theoretical calculation result is 51 °C and the experimental result is 50.29 °C. Therefore, the effectiveness and feasibility of the thermal characteristics of the test platform has been verified from the theoretical and experimental results.
4 CONCLUSIONS
A new test platform was designed to investigate the thermal characteristics of the aircraft rolling bearings in this work. The design process includes the bearing support structure, the loading module, the lubrication module, and the sensor module. The thermal nodes theoretical calculation and experimental tests were completed to verify the effectiveness of the new platform. The comparison demonstrates that: (a) the thermal characteristics of the aircraft rolling bearings obtained by the new platform were in agreement with the theoretical calculation and (b) in the condition of 200 kg load and 2250 rpm driving speed, the comparison error is 1.4%, which demonstrated high effectiveness of the new designed test platform and (c) the new platform is available to research the thermal characteristics of aircraft roller bearings.
ACKNOWLEDGEMENTS
The research work was supported by the Natural Science Foundation of China (NSFC) under the grant no. 51275381, the Science and Technology Planning Project of Shaanxi Province, China under the grant no. 2012GY2-37 and the Science Foundation of Jiangsu Province China under the grant no. BK20140200.
5 REFERENCES
[1] Li, Z., Yan, X., Wang, X., & Peng, Z. (2016). Detection of gear cracks in a complex gearbox of wind turbines using supervised bounded component analysis of vibration signals collected from multi-channel sensors. Journal of Sound and Vibration, 371, 406-433. https://doi.org/10.1016/j.jsv.2016.02.021
[2] Jiang, Y., Hua, Z., & Li, Z. (2015). A new compound faults detection method for rolling bearings based on empirical wavelet transform and chaotic oscillator. Chaos, Solitons and Fractals, 89. https:// doi.org/10.1016/j.chaos.2015.09.007
[3] Li, Z., Jiang, Y., Wang, X., & Peng, Z. (2016). Multi-mode separation and nonlinear feature extraction of hybrid gear failures in coal cutters using adaptive nonstationary vibration analysis. Nonlinear Dynamics, 84(1), 295-310. https://doi.org/10.1007/s11071-015-2505-3
[4] Jiang, Y., Zhu, H., Li, Z., & Peng, Z. (2016). The nonlinear dynamics response of cracked gear system in a coal cutter taking environmental multi-frequency excitation forces into consideration. Nonlinear Dynamics, 84(1), 203-222. https://doi.org/10.1007/s11071-015-2409-2
[5] Li, Z. & Peng, Z. (2015). A new nonlinear blind source separation method with chaos indicators for decoupling
diagnosis of hybrid failures: A marine propulsion gearbox case with a large speed variation. Chaos, Solitons and Fractals, 89, 27-39. https:// doi.org/10.1016/j.chaos.2015.09.023
[6] Radil, K., Dellacorte, C., & Zeszotek, M. (2007). Thermal Management Techniques for Oil-Free Turbomachinery Systems. Tribology Transactions, 50(3), 319-327. https://doi.org/10.1080/10402000701413497
[7] Barwell, F. T. & Milne, A. A. (1952). Criteria governing scuffing failure. J. of Inst. Petroleum, 38, 624-632.
[8] Bell, J. C., Dyson, A., & Hadley, J. W. (1975). The effects of rolling and sliding speeds on the scuffing of lubricated steel discs. ASLE Transaction, 18(1), 62-73. https://doi.org/10.1080/05698197508982748
[9] Yu, B., Wang, Z., Jiang, L., Wang, F., Zhu, J. (2001). Monitoring Method for Oil Film Temperatures of Thrust Bearings Based on Inverse Heat Conduction Problem Analysis. Journal of Xi’an Jiaotong University, 35(3), 225-228.
[10] Tong, B., Gui, C., & Sun, J. (2007). Hydrodynamic lubrication analysis of engine main bearing including thermal deformation. Chinese Journal of Mechanical Engineering, 43(6), 180-185. https://doi.org/10.3901/JME.2007.06.180
[11] Pu, L. & Ji, M. (2001). Mechanical Design. Higher Education Press, Beijing.
[12] Cheng, D. (2010). Mechanical Drawing Precision Design. Chemical Industry Press, Beijing.
[13] Chen, X. & Yang, P. (2007). Fundamentals of Mechanical Design. Science Press, Beijing.
[14] Cheng, D. (2010). Common Mechanical Engineering Materials. Chemical Industry Press, Beijing.
[15] Cheng, D. (2010). Bearings. Chemical Industry Press, Beijing.
[16] Harris, T. (2001). Rolling bearing analysis. Wiley, New York.
[17] Ren, L. (2009). Experimental Design and Optimization. Science Press, Beijing.
[18] He, Y. (2013). Experimental Design and Analysis. Chemical Industry Press, Beijing.
Contact information:
Zhihe DUAN, PhD, Mechanical Engineering Key Laboratory of Education Ministry for Modern Design and Rotor-Bearing System, School of Mechanical Engineering, Xi’an Jiaotong University No. 28, Xianning West Road, Xi'an, Shaanxi, 710049, P. R. China E-mail: [email protected]
Tonghai WU, Prof., Mechanical Engineering Corresponding author Key Laboratory of Education Ministry for Modern Design and Rotor-Bearing System, School of Mechanical Engineering, Xi’an Jiaotong University No. 28, Xianning West Road, Xi'an, Shaanxi, 710049, P. R. China
Zhang YUELEI, PhD, Mechanical Engineering 1. Key Laboratory of Education Ministry for Modern Design and Rotor-Bearing System, School of Mechanical Engineering, Xi’an Jiaotong University 2.94270 Unit of People's Liberation Army No. 28, Xianning West Road, Xi'an, Shaanxi, 710049, P. R. China
Shuaiwei GUO, Mechanical Engineering Key Laboratory of Education Ministry for Modern Design and Rotor-Bearing System, School of Mechanical Engineering, Xi’an Jiaotong University No. 28, Xianning West Road, Xi'an, Shaanxi, 710049, P. R. China
Z LI, PhD, Mechanical Engineering School of Mechatronics Engineering, China University of Mining & Technology No. 1, University Road, Xuzhou 221110, P. R. China